WA PY 2010 State Data Book
65
WASHINGTON STATE ANNUAL REPORT on the Workforce Investment Act Title l-B Program Year 2010 Submitted b Workforce Training and Education Coordinating Board, Washington State Emploment Securit Department and the Workforce Development Councils September 2011
-
Upload
acousticfreeze -
Category
Documents
-
view
221 -
download
5
description
cantwell.senate.gov
Transcript of WA PY 2010 State Data Book

WASHINGTON STATEANNUAL REPORT on the Workforce Investment Act Title l-B
Program Year 2010
Submitted by� Workforce Training and Education Coordinating Board, Washington State Employ�ment Security� Department and the Workforce Development Councils
September 2011


Contents
Section One • Workforce Investment Act in Washington StateIntroduction 5What is the Workforce Investment Act? 5Overview of Washington’s Workforce Development System 5 State and local roles 6
Section Two • What is working wellProgram Year 2010 State and Workforce Development Council Highlights 11 Workforce development areas 11 State Highlights 12 Retooling Washington’s Workforce 12 ARRA Governor’s 10 percent discretionary funds 13 Engrossed Second Substitute Senate Bill 5809 14 Waivers Granted 14 WorkSource System Policy Implementation 14 Risk-based monitoring 15 Rapid Response 15 SKIES 16 Go2WorkSource.com 17 Career Bridge.wa.gov and the Eligible Training Provider List 17 Employer Connections 18 Coordinating Workforce and Economic Development around Strategic Industry Cluster 18 Governor’s 10 percent Aerospace Initiative 18Technical Assistance 19Wagner-Peyser/Labor Exchange Activities 20 Employment services 20 Job skill development 21 Veteran Services 21 Statewide business services 21WDC Highlights 22-33
Section Three • WIA Title l-B Results Analysis 35 Cost Effectiveness 36 Evaluation activities, including net impact and cost-benefit 37 Results for WIA Adults 38 Results for WIA Dislocated Workers 39 Results for WIA Youth 40 Net Imapct Analysis 41 Tables (Narrative) 42 Tables (Narrative) 44-63
‘


WIA IN WASHINGTON STATE < 5
A N N U A L R E P O R T D Workforce Investment Act / Title I-B
Introduction Last year, more than 364,000 Washington residents received help getting a job at one of the 65 WorkSource Centers and affiliate sites located throughout the state. They came with a range of backgrounds and experiences...low-income youth and adults struggling to support themselves, workers displaced by a changing economy and veterans returning home from war. Many of them lost their jobs because of the longest economic decline since the Great Depression. Most needed help with connecting to Unemployment Insurance Benefits and assistance determining next career steps. Others needed more intensive services to help them overcome barriers to meaningful employment. One of the primary funding sources for these more intensive services is the federal Workforce Investment Act (WIA) Title I-B program, which has funded activities in Washington since July 1, 2000. This report provides an in depth look at the impact those funds have made in Washington in Program Year 2010 (July 1, 2010 to June 30, 2011).
What is the Workforce Investment Act?The Workforce Investment Act of 1998 establishes the structure and relationship between national, state and local workforce investment activities. The purpose of WIA Title I-B is “to provide workforce investment activities, through statewide and local workforce investment systems, that increase the employment, retention, and earnings of participants, and increase occupational skill attainment by participants, and, as a result, improve the quality of the workforce, reduce welfare dependency, and enhance the productivity and competitiveness of the Nation.”
In Program Year 2010, the U.S. Department of Labor allocated a total of $58,839,131 in WIA Title I-B funds to Washington state for employment and training services designed to benefit employers, dislocated workers, disadvantaged adults, and low income youth.
Overview of Washington’s Workforce Development SystemPut simply, Washington’s workforce development system is an integrated network of services, programs and investments with a shared goal of improving the skills of the state workforce. This network strives to create the workforce needed by business and industry. It further helps potential job candidates, particularly low-income youth and adults and displaced workers, overcome obstacles to successful employment. These services are delivered through the WorkSource Centers, the state’s one-stop delivery system. Primary funding for WorkSource Center operations and many of the core and intensive services provided at WorkSource are underwritten by the Workforce Investment Act Title 1-B and Wagner-Peyser Act.
At a WorkSource center, an individual can open a claim for unemployment insurance, find job openings, receive other job search assistance, and attend workshops that can improve employability. Qualified individuals can find assistance with specific training in high demand occupations and employers can get help with their workforce
Section One
Workforce Investment Act (WIA) in Washington State

6 > Section One - WORKFORCE INVESTMENT ACT IN WASHINGTON STATE
Workforce Investment Act / Title I-B A A N N U A L R E P O R T
eqwertyuiop[]\`1234567890-=asdfghjkl;'!@#$%^&*()_+zxcvbnm,./ASDFGHJKL:"ZXCVBNM<>?
needs including job listing, recruitment, screening and training for employees. Other services available through these centers include: veteran services, WorkFirst, Trade Act programs, access training programs, offender employment assistance, disability services, and farm worker assistance, among others.
State and local rolesThe core operational role of the Employment Security Department (ESD) within the WorkSource system is to fill employer job openings with well qualified job seekers and to mitigate the negative consequences of unemployment. The core administrative role of ESD is to serve as the state’s WIA Title I-B grant recipient. These WIA responsibilities include stewardship of the funds, oversight and monitoring activities, issuing statewide policy management of grants and contracts, and allocation of the WIA Title I-B funds to the local area Workforce Development Councils for the delivery of services within an integrated service delivery system.
The Workforce Training and Education Coordinating Board (Workforce Board) serves as the state’s Workforce Investment Board and manages the performance accountability for WIA. The core business of the Workforce Board is to coordinate policy and planning for the workforce development system, to evaluate results, and to facilitate demonstration projects testing new innovation and ideas.
Workforce Development Councils are the local conveners and managers of WorkSource through which WIA programs are accessed. They are the strategic visionaries for local implementation of WIA funds. There are 12 Workforce Development Councils (WDCs) in Washington. Workforce Development Councils are private industry led and locally focused. Members of the councils are appointed by Chief Local Elected Officials (CLEOs) and the councils are certified by the Governor. The CLEOs are the local area WIA Title I-B grant recipients. The CLEOs direct their WDC’s staff to administer the funds and manage the area’s WorkSource centers to most effectively respond to the local economy and needs of local citizens. Workforce Development Councils convene regional partners and stakeholders to assess skill gaps, identify emerging and future employment possibilities and to collaborate with economic development and other partners to develop the region’s workforce development plan. WDCs are the system’s portal into the business community and are responsible for facilitating multiple interagency projects and programs.
WIA Title I-B Youth Program
Participation: More than 4,000 young people were served by the Workforce Investment Act Youth Program between July 1, 2010 and June 30, 2011.
Whoisserved: Youth must be 14 through 21 years old, low income, and meet other criteria described in the Workforce Investment Act (WIA) such as a need for additional assistance to complete an educational program or to secure and hold employment. To be low income, one must be a welfare or food stamp recipient, homeless, a foster child, or have a family income below 70 percent of the lower living standard income level—$10,722 per individual, or $29,759 for a family of four.
Programdescription: The program prepares low-income youth ages 14 to 21 for success in school and the world of work. Eligible youth may receive counseling, tutoring, job training, mentoring, or work experience. Other service options include summer employment, study skills training, or instruction in obtaining a GED or equivalent.

WIA IN WASHINGTON STATE < 7
A N N U A L R E P O R T D Workforce Investment Act / Title I-B
WIA Title I-B Adult Program
Participation:Nearly 5,800 participants were served by the Workforce Investment Act, Adult Program between July 1, 2010 and June 30, 2011.
Whoisserved: Specific eligibility guidelines are described in the Workforce Investment Act (WIA). Core services are available to all adults with no eligibility requirements. Intensive training services are authorized for unemployed individuals unable to find jobs through core services alone. In some cases, these services are available to employed workers who need more help to reach self-sufficiency.
Programdescription: The program prepares individuals 18 years and older for participation in the labor force by providing core services and access to job training and other services. Services are coordinated through the state’s one-stop career center system, WorkSource. Core services include skill assessment, labor market information, consumer reports on training programs, and job search and placement assistance. Second and third tier “intensive” services are available for eligible adults unable to obtain jobs through core services. This sequence of services is individualized and may include more intensive assessments, individual counseling, employment planning, and prevocational and vocational training. Priority is given to veterans, welfare and low-income, WIA-eligible clients.
WIA Title I-B Dislocated Worker Program
Participation: Nearly 8,200 participants were served by the Workforce Investment Act, Dislocated Worker Program between July 1, 2010 and June 30, 2011.
Whoisserved: Specific eligibility guidelines are described in the Workforce Investment Act (WIA). Dislocated workers are people who lost jobs due to plant closures, company downsizing, or some other significant change in market conditions. In most cases, eligible workers are unlikely to return to their occupations because those jobs are no longer economically viable, and they must be eligible for (or have exhausted) unemployment compensation. Other conditions can lead to eligibility for services, such as being self-employed but not working as a result of general economic conditions, or being a displaced homemaker.
Programdescription: The program tailors employment and training services to meet dislocated workers’ needs; establishes early intervention for workers and firms facing substantial layoffs; and fosters labor, management, and community partnerships with government to address worker dislocation. Dislocated workers are also eligible for “core services” including skill assessment, labor market information, training program consumer reports, and job search and placement assistance. Second and third tier services are available for eligible dislocated workers unable to get jobs through core services. Services are individualized and may include more intensive assessments, counseling, and pre-vocational and vocational training.
New Dollars for 2009-2010
The American Recovery and Reinvestment Act (ARRA) of 2009 provided the first real infusion of additional funding into the Workforce Investment Act program in many years. This one-time only enhancement to WIA programmatic funding sought to jumpstart a floundering economy and provides new opportunities for training when demand during the recession was at its height. For more information on ARRA funds expended in PY 10, see the chart on page 10.
.

8 > Section One - WORKFORCE INVESTMENT ACT IN WASHINGTON STATE
Workforce Investment Act / Title I-B A A N N U A L R E P O R T
eqwertyuiop[]\`1234567890-=asdfghjkl;'!@#$%^&*()_+zxcvbnm,./ASDFGHJKL:"ZXCVBNM<>?
Figure 1 w Percentage change in employment, 2001 - 2011, USA and Washington State, Seasonally adjusted
Economic challenges, the overall impact on Washington
The recent recession lasted from December 2007 until June 2009, meaning that more than two years have passed since the recession officially ended. However, in Washington State, employment didn’t begin to fall consistently until February 2008 and it continued to do so until February 2010. During this period, Washington lost 206,000 jobs, a loss of 6.2 percent. This was only slightly better than the 6.3 percent decline that occurred at the national level. Since February 2010, the state has added 59,200 jobs, recouping more than one quarter of the employment losses. June 2011 marks the tenth consecutive month that Washington has added jobs.
Washington U.S.
2001 2002 2003 2004 2005 2006 2007 2008 2009 2010 2011
1.15
1.10
1.05
1.00
0.95
0.90

WIA IN WASHINGTON STATE < 9
A N N U A L R E P O R T D Workforce Investment Act / Title I-B
During the recent recession, Washington’s unemployment rate was high, but not quite to the levels reached in the early 1980s. From December 2009 to February 2010, the state jobless rate peaked at 10.0 percent, whereas the nation peaked at 10.1 percent in October 2009. From those peaks, both the state and nation saw falling unemployment rates until the first quarter of 2011. Throughout the second and third quarters of this year, both unemployment rates have trended up slightly to converge at 9.2 percent in June 2011.
Source: Bureau of Labor Statistics Washington U.S.
Figure 2 w Historical Unemployment Rates 1976-2011, USA and Washington State, Seasonally adjusted
1976 1980 1985 1990 1995 2000 2005 2011
14.0
12.0
10.0
8.0
6.0
4.0
2..0
0.0
10 > Section One - WORKFORCE INVESTMENT ACT IN WASHINGTON STATE
Workforce Investment Act / Title I-B A A N N U A L R E P O R T
eqwertyuiop[]\`1234567890-=asdfghjkl;'!@#$%^&*()_+zxcvbnm,./ASDFGHJKL:"ZXCVBNM<>?
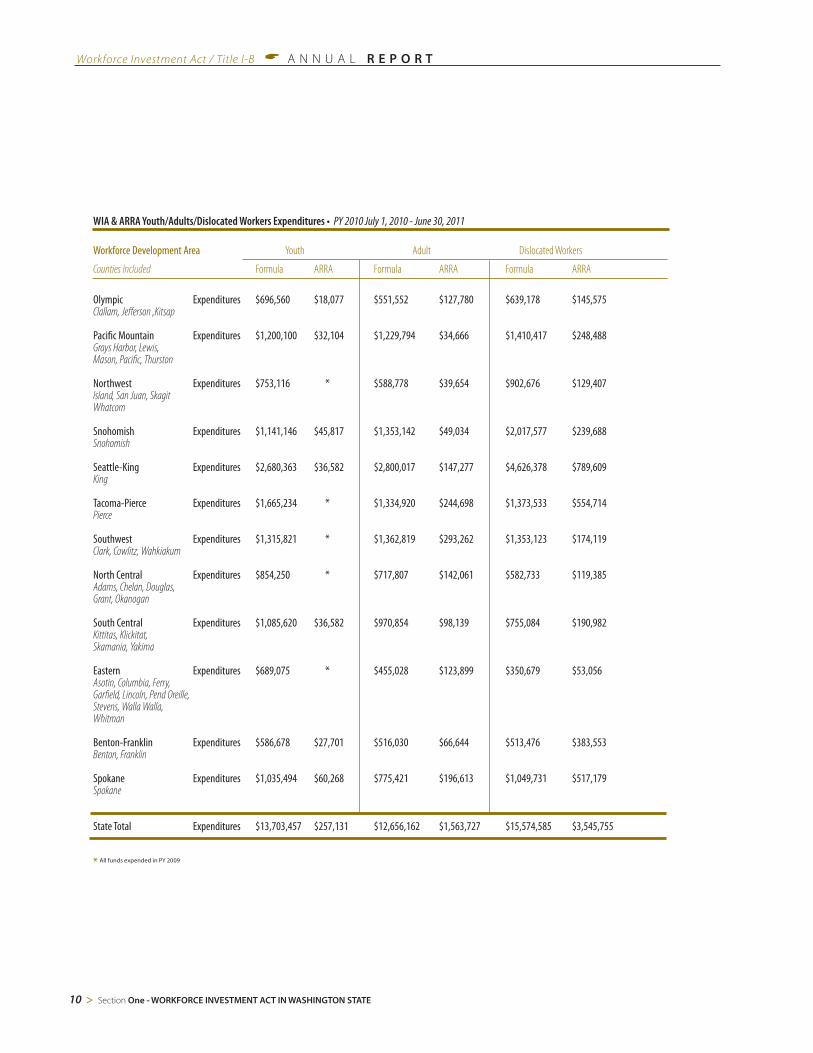
WIA & ARRA Youth/Adults/Dislocated Workers Expenditures • PY 2010 July 1, 2010 - June 30, 2011
Workforce Development Area Youth Adult DislocatedWorkers
Counties Included Formula ARRA Formula ARRA Formula ARRA
Olympic Expenditures $696,560 $18,077 $551,552 $127,780 $639,178 $145,575 Clallam, Jefferson ,Kitsap
Pacific Mountain Expenditures $1,200,100 $32,104 $1,229,794 $34,666 $1,410,417 $248,488 Grays Harbor, Lewis,Mason, Pacific, Thurston
Northwest Expenditures $753,116 * $588,778 $39,654 $902,676 $129,407 Island, San Juan, Skagit Whatcom
Snohomish Expenditures $1,141,146 $45,817 $1,353,142 $49,034 $2,017,577 $239,688 Snohomish Seattle-King Expenditures $2,680,363 $36,582 $2,800,017 $147,277 $4,626,378 $789,609 King Tacoma-Pierce Expenditures $1,665,234 * $1,334,920 $244,698 $1,373,533 $554,714 Pierce
Southwest Expenditures $1,315,821 * $1,362,819 $293,262 $1,353,123 $174,119 Clark, Cowlitz, Wahkiakum North Central Expenditures $854,250 * $717,807 $142,061 $582,733 $119,385 Adams, Chelan, Douglas, Grant, Okanogan
South Central Expenditures $1,085,620 $36,582 $970,854 $98,139 $755,084 $190,982 Kittitas, Klickitat, Skamania, Yakima
Eastern Expenditures $689,075 * $455,028 $123,899 $350,679 $53,056 Asotin, Columbia, Ferry, Garfield, Lincoln, Pend Oreille, Stevens, Walla Walla, Whitman
Benton-Franklin Expenditures $586,678 $27,701 $516,030 $66,644 $513,476 $383,553 Benton, Franklin
Spokane Expenditures $1,035,494 $60,268 $775,421 $196,613 $1,049,731 $517,179 Spokane
State Total Expenditures $13,703,457 $257,131 $12,656,162 $1,563,727 $15,574,585 $3,545,755 * All funds expended in PY 2009

WIA IN WASHINGTON STATE < 11
A N N U A L R E P O R T D Workforce Investment Act / Title I-B
eqwertyuiop[]\`1234567890-=asdfghjkl;'!@#$%^&*()_+zxcvbnm,./ASDFGHJKL:"ZXCVBNM<>?!@#$%^&&*ZXCVBNM<>?
Olympic Consortium
Northwest Washington
Benton-Franklin
PacificMountain
Eastern WashingtonPartnership
Snohomish County
Seattle-King CountyNorth Central
Spokane Area
SouthwestWashington
Tacoma-Pierce County
South Central
WHAT IS WORKING WELL
Program Year 2010 State and Workforce Development Council HighlightsIntroduction
Washington’s workforce development system goals:
u. Youth: Ensure all youth receive the education, training and support they need for success in postsecondary education and/or work. v. Adults: Provide Washington adults (including those with barriers to education and employment) with access to lifelong education, training, and employment services. w. Industry: Meet the workforce needs of industry by preparing students, current workers, and dislocated workers with the skills employers need. Workforce Investment Act Title I-B Youth, Adult, and Dislocated Worker Programs contribute toward meeting our workforce development system goals.
This section includes highlights of state-level leadership activities and services in Program Year 2010 (July 1, 2010 through June 30, 2011). This section also includes activity summaries by the 12 Workforce Development Councils.
WORKFORCE DEVELOPMENT AREAS
What is working well
Section Two

Workforce Investment Act / Title I-B A A N N U A L R E P O R T
eqwertyuiop[]\`1234567890-=asdfghjkl;'!@#$%^&*()_+zxcvbnm,./ASDFGHJKL:"ZXCVBNM<>?
12 > Section Two - WHAT IS WORKING WELL
State Highlights
Retooling Washington’s Workforce
Responding to the severe recession, Washington’s workforce system partners came together in a series of intense meetings in the last half of 2010 to identify ways to make a difference (within 12 to 18 months) in the economic well-being of employers and unemployed workers. Driven by the immediacy of over 300,000 unemployed Washington workers and a slow recovery, hundreds of local and state workforce professionals and businesses participated in a series of meetings hosted and largely underwritten by WDCs.
These meetings included representatives from key state agencies involved in education, workforce training and economic development and as well as board chairs and staff from workforce development councils and economic development councils, chambers of commerce, labor organizations, community colleges, local governments and non-profit organizations. The stakeholder process also used an online questionnaire and a virtual forum with business leaders. The result was consensus support for pursuing three fast-track strategies:
u Improve outreach to unemployment insurance exhaustees. (There were 53,649 individuals in April through June 2011 who exhausted their UI benefits).
v Increase on-the-job training and direct-connect training (training that is directly connected to a job).
w Coordinate employer outreach and improve job referrals and skill matching between employers and job seekers.
The Workforce Board was responsible for initiating and leading this Retooling Washington’s Workforce effort and a state steering committee staffed by the Board oversees the entire project.
For each strategy, a workgroup was formed with state and local representation across a broad range of agencies and organizations. Workgroups are providing planning and research support as well as tracking performance to measure results. Each workgroup regularly reports state and local progress to a state steering committee and the Workforce Board. Throughout the Retooling Washington’s Workforce initiative, WDCs are serving in a critical role as the conveners of regional implementation teams. The extensive regional work in implementing the initiative is featured in the WDC Highlights section of this report on pages 22-33.
More on the Retooling Washington’s Workforce projects –
A Coordinated outreach to Unemployment Insurance (UI) exhaustees—This Retooling project focuses on how to communicate information and streamline employment and training assistance to those who are exhausting their UI benefits. This project created a detailed demographic analysis of who is losing benefits, conducted a market analysis of workers’ skills and work history and developed a toolkit of services to help those with dwindling resources find housing, food assistance, and other services, while continuing to look for work. Results through June 30, 2011: Over 260,000 claimants received a resource guide in the mail and approximately 90 percent of those surveyed found the guide helpful. Over 44,000 UI exhaustees received a telephone message via the state auto-dialer that encouraged them to access WorkSource services. Training for frontline staff in WorkSource offices has increased to include de-escalating angry customers as well as a partnership between ESD and the Division of Vocational

WIA IN WASHINGTON STATE < 13
A N N U A L R E P O R T D Workforce Investment Act / Title I-B
Rehabilitation to offer free Motivational Interviewing training to approximately 240 frontline staff and partners across the state. To help local, state and federal decision makers have a better understanding of the size and makeup of the UI exhaustees in our state’s population, ESD now publishes exhaustee benefit information by county, legislative and congressional district in addition to demographic data that includes age, education, gender, occupation, industry, veteran’s status and disability status.
A On-the-Job and Direct Connect Training—This Retooling project is improving and expanding On-the-Job Training (OJT) and Direct Connect Training options that increase business output and job creation through subsidized training. Workgroup members shared information on OJT best practices and how to connect OJT to credit in postsecondary training. Governor Gregoire directed $1.5 million in WIA Statewide Activities funds to expand OJT opportunities. A $1.9 million DOL National Emergency Grant made more OJTs available in seven regions of the state. The workgroup promoted the maximum use of Microsoft’s online e-learning courses free to WorkSource customers. As of June 2011, over 10,000 individuals started one or more courses. Each course contains individual topics which on their own may meet that person’s unique needs or interests. Over 3,700 people completed 75 percent of a course or more.
A Coordinated employer outreach combined with improved job referral/skills matching — This Retooling project seeks to foster greater information sharing about employer outreach in an effort to improve efficiency and service delivery to employers through local partnerships between multiple government programs. Workgroup members collected baseline data on business outreach integration and plan to disseminate information on best practices in business outreach. Local teams are assessing the needs for improving business outreach and defining the roles, responsibilities, and primary deliverables of each partner providing business outreach and job referral services. The local teams are also identifying how business outreach staff will share relevant and appropriate information obtained from employers with other programs. ESD is expanding its business services training to staff of partner programs to improve the matching of job seekers with employers by identifying, recommending procedures and training to better identify job openings, understand employer skill needs, and match employer skill needs with jobseeker skills.
WDC Directors, WDC Chairs and other state and local workforce development partners will join the Workforce Board at a Retooling Washington’s Workforce forum on October 6, 2011. The purposes of the forum are to story-board project progress, examine the learning from the initiative and agree on “next steps.” More information on the Retooling effort can be found at: www.wtb.wa.gov/retoolingwashington.asp
ARRA Governor’s 10 percent discretionary funds
The Governor designated $5.53 million in ARRA-related WIA 10 percent funds as an incentive to encourage WDCs to invest their WIA and ARRA formula funds or other funds to build training capacity at the state’s public community and technical colleges. The funds were available in a 1:1 match; that is, for every WIA or ARRA formula dollar invested, WDCs received a dollar in ARRA Governor’s 10 percent funds. The funds purchased class-size training cohorts in programs of study specifically related to alternative energy, energy efficiency, aerospace, and health care. WDCs could also use the funds to support the participant's training goals, such as case management and support services. The incentive funds were available through June 30, 2011, when ARRA

Workforce Investment Act / Title I-B A A N N U A L R E P O R T
eqwertyuiop[]\`1234567890-=asdfghjkl;'!@#$%^&*()_+zxcvbnm,./ASDFGHJKL:"ZXCVBNM<>?
14 > Section Two - WHAT IS WORKING WELL
expired. Over the course of the grant, WDCs invested $5.53 million in WIA and ARRA funds to purchase more than 50 class-size training cohorts serving nearly 1,000 students.
Engrossed Second Substitute Senate Bill 5809
Passed by the Washington State Legislature and signed into law by the Governor on May 19, 2009, E2SSB 5809 provided ESD with $7 million in state funds. The funds were used to incent WDCs to expand occupational training capacity for WIA-eligible dislocated workers and low-income adults in high-demand programs of study at public community and technical colleges. WDCs earned a 75 percent incentive on every dollar of WIA or ARRA formula funds used to purchase class-size training cohorts at those colleges. They also received a 25 percent incentive on every dollar of WIA or ARRA formula funds used to provide training assistance through Individual Training Accounts in high demand programs of study. The priority sectors were healthcare, aerospace, forest products, and energy efficiency. The program allowed earned incentive funds to be used to purchase more high demand occupational training (either as a class-size cohorts or Individual Training Accounts) as well as wrap-around support services necessary to help participants succeed in their training. The incentive funds had to be earned and obligated by June 30, 2011. By that date, WDCs had invested more than $7.54 million in WIA and ARRA funds to purchase more than 100 class-size training cohorts serving more than 1,500 students. Having earned virtually all of the $7 million in available incentives, WDCs spent $5.99 million to assist more than 1,000 participants through the allowable activities outlined above.
Waivers Granted
Washington has been granted three WIA waivers for this program year:
u The competitive procurement requirement has been amended to allow use of seven of the ten youth program elements. This streamlines the program procurement procedures for service providers.
v The prohibition against youth access to individual training accounts has been modified to allow older and out-of –school youth participants access to an account. As a result an additional avenue for accessing training services is offered to those who qualify.
w The 17 WIA mandated program performance measures are modified and reported using the federal common measures. This allows the state to report outcomes against one set of federal measures instead of two.
WorkSource System Policy Implementation
Building on the WorkSource Initiative Framework, seven WorkSource system policies went into effect on July 1, 2010, complementing three existing WorkSource system policies.
The overall intent of the WorkSource system policies is to encourage WorkSource system partners to achieve the following outcomes in the one-stop environment:

WIA IN WASHINGTON STATE < 15
A N N U A L R E P O R T D Workforce Investment Act / Title I-B
A shared ownership amongst partners of WIA Adult and Dislocated Worker, labor-exchange, Trade Adjustment Assistance (TAA) and ESD employment-program customers when it is efficient to do so and results in improved services to job seekers.
A one-stop staff members working mutually to serve customers and achieve shared performance standards with the goal of getting customers connected with as many services as they need for success in as seamless a manner as possible.
A a functionally integrated one-stop environment in which WIA, TAA, ESD labor-exchange and other employment-services staff work together, regardless of the program, to address customers needs with as many services as possible.
Between July 1, 2010 and June 30, 2011, local areas developed policies, agreements, plans and procedures to achieve these objectives. ESD is using its risk-based monitoring model to identify potential risks related to the policies and evaluate whether we are achieving the above outcomes in the one-stop environment. As of July 1, 2011, ESD is using this approach in partnership with local areas to identify barriers to implementation, opportunities for policy improvements, implementation gaps and opportunities for technical assistance.
Risk-based monitoring
In November 2010, the state adopted a risk-based monitoring model to monitor and provide valuable information for WIA programs. Unlike compliance monitoring, risk-based monitoring incorporates risks and seeks to identify potential compliance issues before they occur rather than after a problem emerges. By focusing on risks and evaluating the processes management has in place to manage the more significant risks the monitors are able to provide assurance on how well management’s processes are able to manage the more significant risks. Another advantage of the risk-based monitoring model is that it helps to increase program efficiency and effectiveness. The model works to identify both risks that are not properly controlled and risks that are over-controlled and consuming unnecessary resources. With this new approach, monitoring is able to recommend opportunities to streamline processes resulting in savings to the state and local areas and improved program outcomes.
Rapid Response
The state Dislocated Worker Unit (DWU), in coordination with each of the state’s 12 local WDCs, continues to deliver an effective rapid response system for workers facing layoff or plant closures. In keeping with past successful practices, once a layoff notice is received by the state DWU, the state contacts the impacted local area(s) to ensure rapid response services are provided. As in the past, the Washington State Labor Council (WSLC) continues to play a key role in coordinating initial rapid response activities, ensuring that worker needs are addressed and that the appropriate support systems are in place for impacted workers.
During Program Year 2010, the state DWU, WSLC and the local rapid response teams responded to 31 Worker Adjustment and Retraining Notification (WARN) Act notices impacting 3,527 workers. The state DWU, along

Workforce Investment Act / Title I-B A A N N U A L R E P O R T
eqwertyuiop[]\`1234567890-=asdfghjkl;'!@#$%^&*()_+zxcvbnm,./ASDFGHJKL:"ZXCVBNM<>?
16 > Section Two - WHAT IS WORKING WELL
with the WSLC and the local rapid response teams, also initiated rapid response services for nearly 1,560 workers as a result of the filing of 45 Trade Adjustment Assistance (TAA) petitions.
Rapid response teams worked with various employers (large and small) and their employee representatives to provide informational layoff sessions. More than 240 of these layoff sessions were conducted across the state. Additionally, in coordination with the Washington State Department of Personnel (DOP), 34 layoff sessions held across the state served approximately 650 state employees who were facing layoffs.
Eight transition or labor management committees were formed to help dislocated workers transition to new employment in the shortest time possible. In addition, two peer workers reached out to fellow impacted workers to encourage and support the workers' participation in available employment and training programs.
One of the largest layoffs this year is occurring at the U.S. Department of Energy’s Hanford nuclear waste cleanup site located in southeastern Washington. In January, 2011 CH2M Hill and Mission Support Alliance announced that 1,650 to 1,985 employees at Hanford would be laid off by the end of September 2011. Employees for both companies, as well as from other sub-contractors are impacted. ESD, in cooperation with the Benton-Franklin Workforce Development Council and WorkSource Columbia Basin, have been assessing the situation and planning rapid response activities, which will include requesting funding through a National Emergency Grant (NEG). Local and state labor representatives as well as human resource management from the impacted companies have been involved with the planning. Rapid Response activities were on-going and continued through September.
The state DWU continues to initiate rapid response services for workers certified for Trade Act assistance. The state’s overall approach is to continue to integrate services to trade-certified dislocated workers within the rapid response delivery system. A Trade Act coordination team meets twice monthly to discuss Trade Act and related rapid response activity. Integrated Trade Act staff training is held for internal and partner staff and is conducted on a quarterly basis.
This year, in an effort to enhance technical assistance to the Trade Adjustment Assistance program, ESD partnered with the Washington State Labor Council, AFL-CIO WIA Labor Liaisons on a grant received through the U.S. Department of Labor. Through the grant, 19 TAA Partnership meetings have been held statewide to foster cross-departmental discussions with WorkSource, WDCs, community and technical colleges, and other community partners. Additionally, grant funds were used to establish a website and for outreach to help workers and employers access potential services.
SKIES
The Services, Knowledge and Information Exchange System (SKIES) is the primary web-based case management and reporting system for WorkSource. SKIES provides secure data sharing between partners so they can provide seamless services to customers, and it aids in referral of customers between programs or different locations. Individuals who need assistance finding employment or training can access any WorkSource office across the state and receive higher level service because their records (name, address, work history, services previously received, etc.) are readily available to all staff.
The job–matching technology in SKIES also directly benefits Washington employers. When employers hire through WorkSource, staff use SKIES to screen workers for the right skills and experience. SKIES is also linked to

WIA IN WASHINGTON STATE < 17
A N N U A L R E P O R T D Workforce Investment Act / Title I-B
Go2WorkSource.com, which allows business to recruit workers online, and can connect them to their laid-off workers when business picks back up.
From July 1, 2010 through June 30, 2011, the following improvements were made to ensure that SKIES continues to add value for job seekers and employers:
A Enhanced features of identifying, scheduling and providing the ability to record information on serving UI customers claiming Extended Benefits.
A Ramping up the SKIES Technology Upgrade Project, which will change SKIES technology from an Oracle platform to a platform that will provide more efficient and effective maintenance, sustainable technology, cost effective infrastructure and a more responsive application to growing business needs.
Go2WorkSource.com
Whether from home, work or at a WorkSource center, the state’s Internet based self-service job match system, Go2WorkSource.com, provides self-service access to WorkSource services that help businesses thrive and job seekers achieve successful careers. Every month, the Go2WorkSource web site is visited more than a million times by job seekers who conduct 1.6 million job searches and employers who conduct approximately 10,000 resume searches. More than 120,000 job applications are sent to employers each month by job seekers using the site. There are, on an average, about 20,000 job listings and more than 115,000 resumes available for search on the site.
Go2WorkSource.com features a “Resume Builder” tool that automatically creates a resume by presenting job seekers with a list of questions. It provides an internet-based translation service that allows employers and job seekers to translate documents such as resumes or job listings into six languages, including Chinese and Spanish. Customers are able to conduct automatic searches for job openings and applicants have the results sent to them by e-mail.
Go2WorkSource.com also features a “Career Events” section with an extensive calendar of job fairs and information about job search workshops and career services provided at local WorkSource centers. The “Career Links” section provides access to wage and occupation information to help job seekers make informed decisions on wage and employment trends, occupational requirements, and labor market conditions.
Career Bridge.wa.gov and the Eligible Training Provider List
The Workforce Board manages the state’s Eligible Training Provider (ETP) List and annually reviews the minimum performance standards used to evaluate each training program and determine eligibility from one year to the next. Current minimum standards set by the Workforce Board in November of 2010 are:
A Completion rate—20 percent.
A Employment—50 percent.
A Earnings—$3,643 per calendar quarter, or $9.85 per hour.
ETP-eligible programs are listed on the Workforce Board’s CareerBridge.wa.gov website, which launched in 2009. This website provides detailed information on more than 5,000 Washington education and training programs, including apprenticeships. This includes both ETP-eligible and non-ETP eligible programs.

Workforce Investment Act / Title I-B A A N N U A L R E P O R T
eqwertyuiop[]\`1234567890-=asdfghjkl;'!@#$%^&*()_+zxcvbnm,./ASDFGHJKL:"ZXCVBNM<>?
18 > Section Two - WHAT IS WORKING WELL
Career Bridge clearly displays the employment and earnings outcomes of graduates of each training program, where data is available. It also displays the industries where program graduates found jobs and provides a demographic snapshot of program participants—including age, ethnicity and education level. This statewide educational “consumer reports” is one reason the site won a National Innovation Award from the Council of State Governments in 2010.
Career Bridge also provides occupation-specific wage and demand information directly from the state’s labor market information website so users can explore careers and occupations before seeking training that meets their needs.
The site averages over 13,600 visits per month and is expected to grow further after new features and navigation pathways are added to the site in early 2012.
Employer ConnectionsCoordinating Workforce and Economic Development around Strategic Industry Clusters
In 2009, state Substitute House Bill 1323, requested by the Workforce Board, defined and established industry clusters as a central organizing framework to coordinate planning and service delivery among workforce and economic entities. Cluster strategy is a particular type of economic strategy that focuses on growing concentrations of interconnected businesses within regional areas. Using detailed industry data, the Workforce Board identified and ranked industry clusters in each area of the state according to how strategic they are in providing family-wage jobs. At the regional level, WDCs and Associate Development Organizations (local economic development partners) used state and local economic data and on-the-ground information to develop their own lists of strategic clusters. The Workforce Board and the WDCs then worked to reconcile their lists so they were more closely aligned. Five state agencies also worked together to report to the Legislature on state and regional progress in improving the coordination between workforce and economic development. See, http://go.usa.gov/ZdC.
In a continuing effort to highlight the critical partnership and success that occurs when workforce and economic development align, the Washington Economic Development Association (WEDA) devoted its Spring/Summer Conference to innovative and successful approaches to workforce development. In that two day session WDCs from around the Northwest offered a variety of “how to” projects that were presented for discussion as possible best practices. Those presentations were filmed and presented as a collaborative model for the nation. When complete, that collective will be available at www.wedaonline.org
Governor’s WIA 10 Percent Aerospace Initiative
In May of 2009, Governor Gregoire established the Washington Council on Aerospace to examine the state’s aerospace industry and recommend targeted actions and policies to reestablish Washington’s sustainable, competitive edge in the industry.
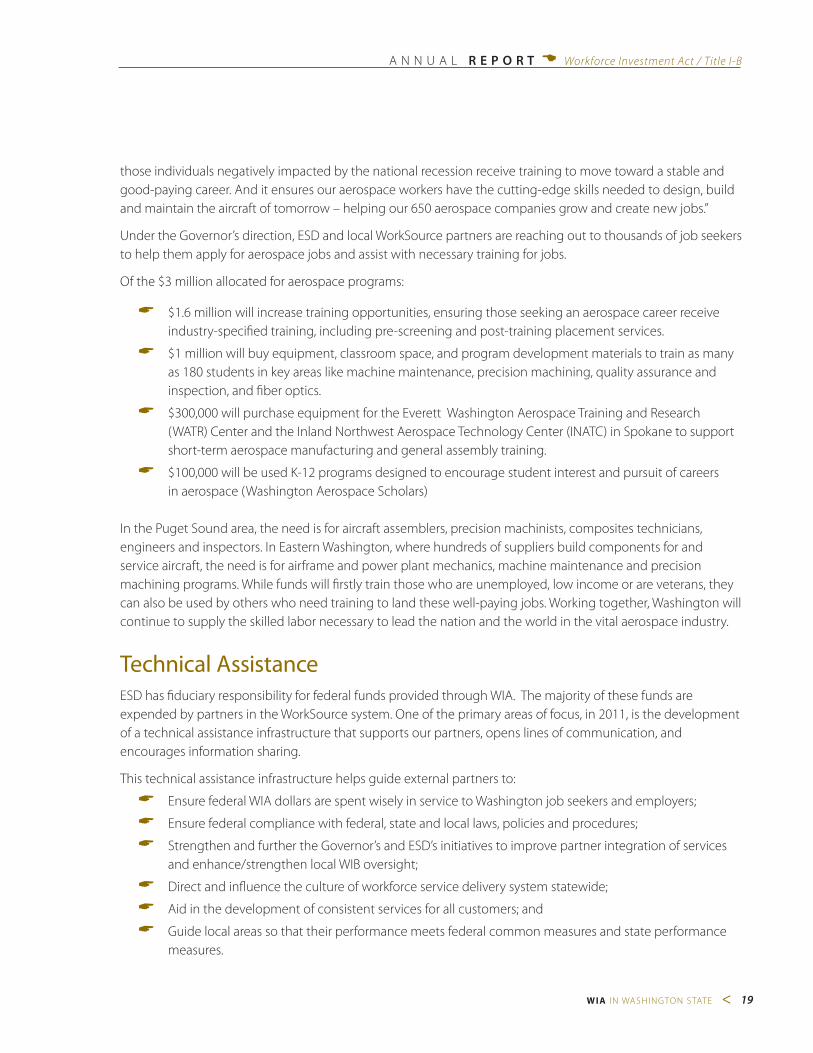
For 2011, the Governor is investing $3 million in WIA funds to help individuals to develop skills needed by aerospace employers so that the industry can thrive and expand. “I want to make sure that Washington jobs are filled by Washington workers,” Gregoire said. “This investment is a double win for Washington State. It helps
WIA IN WASHINGTON STATE < 19
A N N U A L R E P O R T D Workforce Investment Act / Title I-B
those individuals negatively impacted by the national recession receive training to move toward a stable and good-paying career. And it ensures our aerospace workers have the cutting-edge skills needed to design, build and maintain the aircraft of tomorrow – helping our 650 aerospace companies grow and create new jobs.”
Under the Governor’s direction, ESD and local WorkSource partners are reaching out to thousands of job seekers to help them apply for aerospace jobs and assist with necessary training for jobs.
Of the $3 million allocated for aerospace programs:
A $1.6 million will increase training opportunities, ensuring those seeking an aerospace career receive industry-specified training, including pre-screening and post-training placement services.
A $1 million will buy equipment, classroom space, and program development materials to train as many as 180 students in key areas like machine maintenance, precision machining, quality assurance and inspection, and fiber optics.
A $300,000 will purchase equipment for the Everett Washington Aerospace Training and Research (WATR) Center and the Inland Northwest Aerospace Technology Center (INATC) in Spokane to support short-term aerospace manufacturing and general assembly training.
A $100,000 will be used K-12 programs designed to encourage student interest and pursuit of careers in aerospace (Washington Aerospace Scholars)
In the Puget Sound area, the need is for aircraft assemblers, precision machinists, composites technicians, engineers and inspectors. In Eastern Washington, where hundreds of suppliers build components for and service aircraft, the need is for airframe and power plant mechanics, machine maintenance and precision machining programs. While funds will firstly train those who are unemployed, low income or are veterans, they can also be used by others who need training to land these well-paying jobs. Working together, Washington will continue to supply the skilled labor necessary to lead the nation and the world in the vital aerospace industry.
Technical AssistanceESD has fiduciary responsibility for federal funds provided through WIA. The majority of these funds are expended by partners in the WorkSource system. One of the primary areas of focus, in 2011, is the development of a technical assistance infrastructure that supports our partners, opens lines of communication, and encourages information sharing.
This technical assistance infrastructure helps guide external partners to:
A Ensure federal WIA dollars are spent wisely in service to Washington job seekers and employers;
A Ensure federal compliance with federal, state and local laws, policies and procedures;
A Strengthen and further the Governor’s and ESD’s initiatives to improve partner integration of services and enhance/strengthen local WIB oversight;
A Direct and influence the culture of workforce service delivery system statewide;
A Aid in the development of consistent services for all customers; and
A Guide local areas so that their performance meets federal common measures and state performance measures.

Workforce Investment Act / Title I-B A A N N U A L R E P O R T
eqwertyuiop[]\`1234567890-=asdfghjkl;'!@#$%^&*()_+zxcvbnm,./ASDFGHJKL:"ZXCVBNM<>?
20 > Section Two - WHAT IS WORKING WELL
Outreach. To these ends, ESD undertook a Listening Tour that included area visits across the state. The intent of these visits was to better understand each area’s unique characteristics and resource needs while also gathering best practices. During this difficult economy, it is critical to have lines of communication open so that ESD is able to advocate on behalf of the system and leverage resources strategically.
Resources & Tools. ESD is using feedback from these area visits to build tools and resources for the local areas—in the form of templates, best practices, or other materials that best meet state-wide needs. To begin, ESD teams made follow-up visits to assist with systems performance and contracts management questions. Additionally, ESD purchased software and webcams to facilitate virtual meetings and encourage continued information sharing. WDCs are connecting across the state to share ideas and discuss shared challenges. ESD will also be facilitating virtual forums around a range of topics, including upcoming layoffs and strategic approaches to working with partners.
To develop better systems of communication, ESD is reorganizing its WorkSource website to continue to respond to system needs. This website will provide useful information for WDCs in the areas of federal regulations, systems performance, contracts management, monitoring, state policy, and technical assistance resources. In addition, ESD now publishes a monthly technical assistance bulletin and monitoring newsletter that links to its expanding website and alerts areas to new information and resources. ESD has also established points of contact for field inquiries while implementing streamlined templates for formal written communication.
Data Dashboard. ESD worked with stakeholders to develop a System Performance Dashboard. This dashboard includes visual representations of data tailored for each area throughout the state. It is designed to promote focused discussions and support critical decision-making around resource allocation and strategic planning. ESD gathered feedback on customer service goals and local performance strategies to create a comprehensive final product. The overall goal of this new System Performance Dashboard is to provide meaningful data to system leaders. Once services are better defined and multiple conflicting management indicators are eliminated, the system will spend less time discussing what numbers might mean and increased time using information to develop better customer service strategies.
ESD believes that every consumer of this information, from DOL and the Governor to WDC board members and contractors, will benefit. The system will be encouraged to speak the same performance language. Together, these common conversations will lead toward improved service delivery for all WorkSource customers. The final Dashboard, reflective of the feedback from the system, launched in September 2011.
Wagner-Peyser/Labor Exchange ActivitiesEmployment Services
In 2010, Washington WorkSource Labor Exchange staff and partner programs served 364,096 job seekers -- down 6 percent from 2009, reflecting a slight improvement in the labor market as more workers returned to work and fewer job seekers were requesting services. Washington continued to post private sector job gains mainly in education and health services, retail trade, and professional and business services.

WIA IN WASHINGTON STATE < 21
A N N U A L R E P O R T D Workforce Investment Act / Title I-B
Job skill developmentIt was recognized that some, and possibly many, job seekers could benefit from emerging online, informal skill development options. WorkSource has utilized two e-learning programs to assist customers with job skill development. More than 14,000 customers have used KeyTrain to increase their reading, applied mathematics and locating information skills. More than 12,000 customers have taken advantage of free Office Suite and IT professional online courses to increase their software skills on Microsoft products.
Veteran ServicesVeteran Services provided job search assistance to the general veteran job seeker with focused support provided to the recently exited veteran; disconnected veteran residing in rural areas; and on the long-term unemployed veteran. Linkages were made between Unemployment Insurance claims identified veterans who had recently exited military service and the long-term unemployed veteran. Partnerships with Veteran Support Organizations allowed a combined outreach effort into 22 rural counties identify veterans who had become disconnected with employment services and the one-stop career centers.
Statewide Business ServicesIn PY 2010, ESD continued to provide enhanced business services with a business services manager and team in each workforce development area. The focus of these teams is to connect with employers to increase job orders that match the skills of the job seekers who come to WorkSource for assistance.
With ARRA as seed funding, ESD strategically invested to create a new Business Services Unit. Besides a dedicated manager and program coordinator, twelve business services managers were hired and assigned to each workforce development area to improve coordinated outreach to employers and increase job listings benefitting job seekers. Partnering with Workforce Development Councils and regional stakeholders, the Business Services Unit began building stronger relationships with local businesses, industry sectors and industry clusters across the state despite challenging economic conditions. In PY 2010, job orders increased 28 percent, job openings 23 percent and new employers 13 percent. The Business Services team:
A Assisted more than 8,100 businesses to post staff-assisted job orders through WorkSource.
A Recruited and screened applicants for nearly 6,000 jobs per month for employers.
A Promoted employer self-assisted job posting, tax credits and other services. Each month approximately 17,200 job openings are posted by employers on the self-service electronic labor exchange, Go2WorkSource.com.
An equally important indicator of performance to be tracked in PY 2011 is the correspondence between job openings and the job seeker skills inventory, which will be measured as the fill rate.

Workforce Investment Act / Title I-B A A N N U A L R E P O R T
eqwertyuiop[]\`1234567890-=asdfghjkl;'!@#$%^&*()_+zxcvbnm,./ASDFGHJKL:"ZXCVBNM<>?
22 > Section Two - WHAT IS WORKING WELL
BusinessServicesServicetobusinessremainsvitaltoworkforcedevelopmentoperationsasfewerandfewerjobseekersarefindingemployment.TheOlympicConsortiumhastwoBusinessServicesteams.OnecoverstheprincipallyruralareaofClallamandJeffersoncountiesandtheotherteamworkswithemployersinthelargelyurbanKitsapCounty.Theseoutreachandserviceeffortsresultedina215percentincreaseinplacementsintojobslistedthroughtheWorkSourcesystem.Servicesinclude:jobrecruitmenteventsattheWorkSourceoffices,KeyTrainassessments,qualityjoborderswithreferralsthroughspeciallytrainedemploymentservicesstaff.TheKeyTrainassessmentisapopularmeanscheckingthejobskillsofapplicantsbeforereferringthemtoanemployer.Byusingthisassessmenttool,thecompaniesseeareductioninthenumberofapplicationstheyreviewbeforetheyhire.Inaddition,severalcompanieshavedecidedtousetheassessmentsystemtogreatlyreducetheirworkloadofjobapplicationsandresumes.
SoundEnergyEfficiencyDevelopment(SEED)TheOlympicConsortiumisworkingwithseveralpartnersthroughtheSoundEnergyEfficiencyDevelopment(SEED)project.TheU.S.DepartmentofLaborawardedagranttotheNorthwestEnergyEfficiencyCouncil(NEEC)totrainworkersforgreenenergyefficiencyjobs.ThisisbeingdoneincooperationwithSeattle-KingCountyWorkforceDevelopmentCouncil,PierceCountyWorkforceDevelopmentCouncil,SnohomishCountyWorkforceDevelopmentCouncil,theMartinLutherKingJr.LaborCouncil,andtheAFL/CIO.
IntheOlympicConsortiummorethan110peoplearetrainedasbuildingenergyauditors,weatherizationtechnicians,sustainablebuildingadvisors,or‘green’constructionworkers.Manyofthetraineesareveterans,unemploymentinsurancerecipientsorunemploymentinsuranceexhaustees.Allsuccessfulclassgraduatesreceiveindustryrecognizedcertification.
OLYMPIC WorkforceDevelopmentCouncil
Serving Clallam, Kitsap, and Jefferson counties
LocalCompanySuccess:ProfileCompositesOnceagainaverysuccessfulpartnershipbroughtaGovernor’sWIAgrantawardtotheOWDC.ThepartnershipincludedtheOWDC,theKitsapEconomicDevelopmentAlliance,OlympicCollege,EmploymentSecurity,Veteran’sServices,DepartmentofDefense,KitsapCounty,KitsapCommunityResourcesandotherStateandlocalcommunitybasedorganizations.ProfileCompositesisanewcompanythatwillbemovingintotheKitsaparea.OntheJobTrainingpositionsinconjunctionwithcustomizedclassroomtrainingwillpreparenewworkersforjobsinthecompositesfield.
Thecompanymanufacturescompositeheathrelatedproductssuchaswheelchairsandwalkingsticks.Theirdesiredworkforcewillbeveterans,peoplewithdisabilitiesandtheunemployedthathaveskillsthatcanbeusedinthemanufacturingsector.Withthisinmind,trainingthroughOlympicCollegeisamajorpartofthegrant.Inaddition,thegrantwillalsohaveOntheJobTrainingforthenewemployeetohelpintrainingandincreasingtheskillsthatthejobrequires.Itplanstoopenforoperationinthefallof2011.
OpportunitiesInternshipProgramTheConsortiumcontinuedtopartnerthisyearwiththeOlympicEducationalServiceDistrict114(OESD114)toadministertheOlympicOpportunityInternshipProgram,focusedonprovidinginternshipsinhighdemandoccupations.TheOWDCtargetedindustriesintheregionthatprovideawageofatleast$30,000includinghealthcare;marineshiprepair,boatbuildingandadvancedmanufacturing;andgreenoccupations.TheOESD114providescoordinationtodeveloppaidandunpaidinternshipsandpre-apprenticeshipsofatleast90hoursinlengthforatleast75low-incomestudentsinKitsap,JeffersonandClallamCounties.

WIA IN WASHINGTON STATE < 23
A N N U A L R E P O R T D Workforce Investment Act / Title I-B
PACIFICMOUNTAIN WorkforceDevelopmentCouncil
Serving Grays Harbor, Lewis, Mason, Pacific, and Thurston counties
PacificMountain‘sworkforcesystemcontinuestoevolveintoacross-regional,demanddrivensystem.Buildingonstrategicalliancesandinnovativeworkforcesolutions,PacificMountainhascreatedapipelineofskilledandtalentedworkerswhoarepreparedtomeettheneedsoflocalemployers.In2010,asignificantamountoffocuswasontwokeyindustrysectors-EnergyandManufacturing-andthedevelopmentofpartnerships.
ComputerizedManufacturingTheComputerizedManufacturingprogramwasthedesignofabusinessledprojectbasedonunmetneedsoflocalmanufacturingcompanies.Classroomsactedasworkshopswithstateoftheartmanufacturingmachinesandcomputeraidedsoftwareallowingstudentstolearnandpracticetheskillsusedinthemanufacturingindustry.GraduatingstudentsenteredtheirmanufacturingcareerasComputerNumericalControlTechnicianswiththefoundationalskillsrequiredtoadvancetoCAD/CAMComputerProgrammers.
AppliedScienceinEnergyTechnologyPowerWorkingwithGraysHarborCollegeandtheCenterofExcellenceforEnergyTechnologyatCentraliaCollege,aoneyearcoursewasdesignedfordislocatedworkerstoupskillinademandoccupation.Attheendoftheoneyearcourse,studentsearnedaCertificateinEnergyTechnology.Thisprogramofferedpositivecareerchangingopportunitiesthatalloweddislocatedworkerstoenterintoahighwagedemandoccupation.
CustomizedIncumbentWorkerTrainingPacificMountain’smulti-regionalpartnershipwiththeNorthwestandOlympicWDC’scontributedsignificantlytotheexpansionofourincumbentworkertraining.Thelong-termpartnershipallowedforsharedresourcesandcreatedtheopportunityforemployerstotrainmorethan250incumbentworkers.Employersseizedtheopportunitytocreateworkingenvironmentsthatfocusedontheknowledgeofproducts,costsandoutcomes.Customizedtrainingreflectedthespecificsofthemanufacturer’sequipmentandconfigurationdesignedfortheirindividualproprietaryprocesses.Employerswereabletocreatecustommulti-disciplinarytrainingapproachesfocusedonthecultureandvaluesoftheircompanywhilebuildingamomentumforincreasedlearningfromtheiremployees.
NationalEmergencyGrantPacificMountainWorkforceincollaborationwithWorkforceCentralreceiveda$4.8millionDepartmentofLabor,NationalEmergencyGranttoassistmilitaryspousesandciviliandefenseworkersimpactedbythe2005BaseRealignmentandClosure(BRAC)closingmilitarybasesnationwideandlocallyimpactingMcChordandFortLewisbasesbymergingthetwo.ThisgrantwillcreatetheorganizationalinfrastructureandtrainingcapacityinbothPierceandThurstoncountiestoformaJointBaseReemploymentCenter.Morethan825individualswillreceivedirectservicesoverthelifeofthegrantwiththeemphasisonthespousesofmilitarypersonnel.
.
Workforce Investment Act / Title I-B A A N N U A L R E P O R T
eqwertyuiop[]\`1234567890-=asdfghjkl;'!@#$%^&*()_+zxcvbnm,./ASDFGHJKL:"ZXCVBNM<>?
24 > Section Two - WHAT IS WORKING WELL
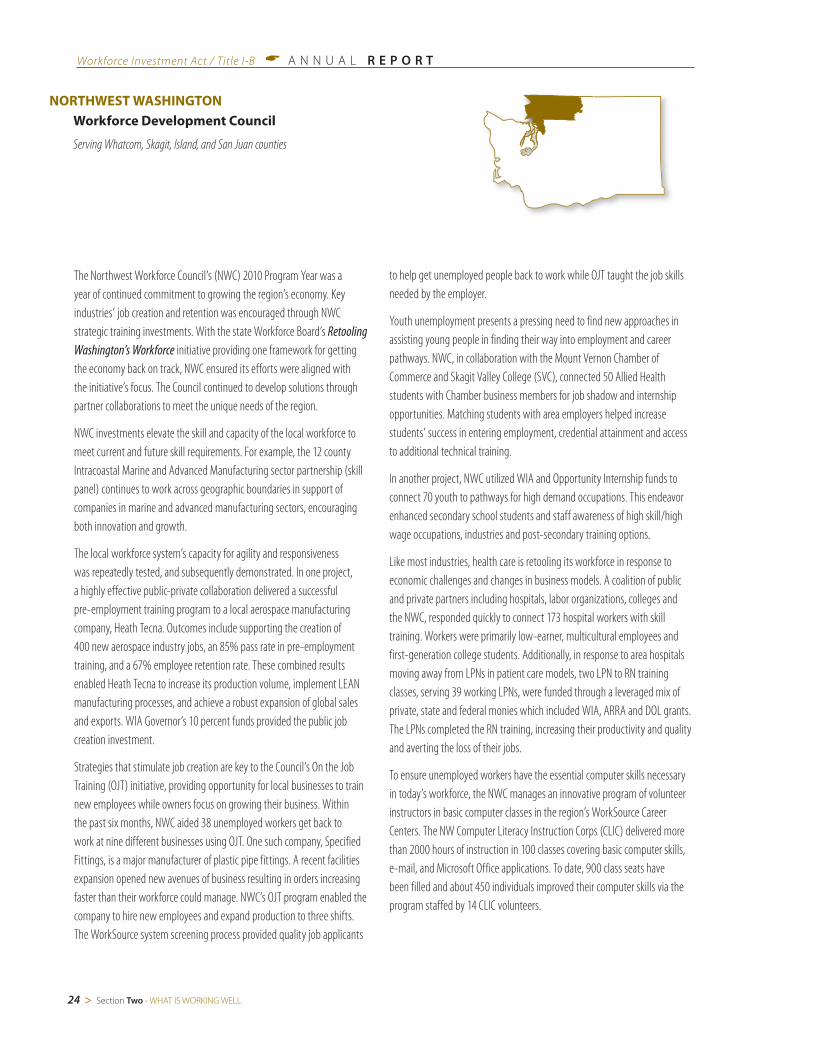
NORTHWESTWASHINGTON WorkforceDevelopmentCouncil
Serving Whatcom, Skagit, Island, and San Juan counties
TheNorthwestWorkforceCouncil’s(NWC)2010ProgramYearwasayearofcontinuedcommitmenttogrowingtheregion’seconomy.Keyindustries’jobcreationandretentionwasencouragedthroughNWCstrategictraininginvestments.WiththestateWorkforceBoard’sRetooling Washington’s Workforceinitiativeprovidingoneframeworkforgettingtheeconomybackontrack,NWCensureditseffortswerealignedwiththeinitiative’sfocus.TheCouncilcontinuedtodevelopsolutionsthroughpartnercollaborationstomeettheuniqueneedsoftheregion.
NWCinvestmentselevatetheskillandcapacityofthelocalworkforcetomeetcurrentandfutureskillrequirements.Forexample,the12countyIntracoastalMarineandAdvancedManufacturingsectorpartnership(skillpanel)continuestoworkacrossgeographicboundariesinsupportofcompaniesinmarineandadvancedmanufacturingsectors,encouragingbothinnovationandgrowth.
Thelocalworkforcesystem’scapacityforagilityandresponsivenesswasrepeatedlytested,andsubsequentlydemonstrated.Inoneproject,ahighlyeffectivepublic-privatecollaborationdeliveredasuccessfulpre-employmenttrainingprogramtoalocalaerospacemanufacturingcompany,HeathTecna.Outcomesincludesupportingthecreationof400newaerospaceindustryjobs,an85%passrateinpre-employmenttraining,anda67%employeeretentionrate.ThesecombinedresultsenabledHeathTecnatoincreaseitsproductionvolume,implementLEANmanufacturingprocesses,andachievearobustexpansionofglobalsalesandexports.WIAGovernor’s10percentfundsprovidedthepublicjobcreationinvestment.
StrategiesthatstimulatejobcreationarekeytotheCouncil’sOntheJobTraining(OJT)initiative,providingopportunityforlocalbusinessestotrainnewemployeeswhileownersfocusongrowingtheirbusiness.Withinthepastsixmonths,NWCaided38unemployedworkersgetbacktoworkatninedifferentbusinessesusingOJT.Onesuchcompany,SpecifiedFittings,isamajormanufacturerofplasticpipefittings.Arecentfacilitiesexpansionopenednewavenuesofbusinessresultinginordersincreasingfasterthantheirworkforcecouldmanage.NWC’sOJTprogramenabledthecompanytohirenewemployeesandexpandproductiontothreeshifts.TheWorkSourcesystemscreeningprocessprovidedqualityjobapplicants
tohelpgetunemployedpeoplebacktoworkwhileOJTtaughtthejobskillsneededbytheemployer.
Youthunemploymentpresentsapressingneedtofindnewapproachesinassistingyoungpeopleinfindingtheirwayintoemploymentandcareerpathways.NWC,incollaborationwiththeMountVernonChamberofCommerceandSkagitValleyCollege(SVC),connected50AlliedHealthstudentswithChamberbusinessmembersforjobshadowandinternshipopportunities.Matchingstudentswithareaemployershelpedincreasestudents’successinenteringemployment,credentialattainmentandaccesstoadditionaltechnicaltraining.
Inanotherproject,NWCutilizedWIAandOpportunityInternshipfundstoconnect70youthtopathwaysforhighdemandoccupations.Thisendeavorenhancedsecondaryschoolstudentsandstaffawarenessofhighskill/highwageoccupations,industriesandpost-secondarytrainingoptions.
Likemostindustries,healthcareisretoolingitsworkforceinresponsetoeconomicchallengesandchangesinbusinessmodels.Acoalitionofpublicandprivatepartnersincludinghospitals,labororganizations,collegesandtheNWC,respondedquicklytoconnect173hospitalworkerswithskilltraining.Workerswereprimarilylow-earner,multiculturalemployeesandfirst-generationcollegestudents.Additionally,inresponsetoareahospitalsmovingawayfromLPNsinpatientcaremodels,twoLPNtoRNtrainingclasses,serving39workingLPNs,werefundedthroughaleveragedmixofprivate,stateandfederalmonieswhichincludedWIA,ARRAandDOLgrants.TheLPNscompletedtheRNtraining,increasingtheirproductivityandqualityandavertingthelossoftheirjobs.
Toensureunemployedworkershavetheessentialcomputerskillsnecessaryintoday’sworkforce,theNWCmanagesaninnovativeprogramofvolunteerinstructorsinbasiccomputerclassesintheregion’sWorkSourceCareerCenters.TheNWComputerLiteracyInstructionCorps(CLIC)deliveredmorethan2000hoursofinstructionin100classescoveringbasiccomputerskills,e-mail,andMicrosoftOfficeapplications.Todate,900classseatshavebeenfilledandabout450individualsimprovedtheircomputerskillsviatheprogramstaffedby14CLICvolunteers.
WIA IN WASHINGTON STATE < 25
A N N U A L R E P O R T D Workforce Investment Act / Title I-B
SNOHOMISHCOUNTY WorkforceDevelopmentCouncil Serving Snohomish County
ProjectRISEReconnectingIndividualstoSustainableEmployment(ProjectRISE)providedamixofgroupworkshopsandindividual,personalizedemployment-counselingsessionsforWorkSourceclientsnearingorexhaustingtheirUIbenefits.EnrolledintheWIAAdultandDislocatedWorkerprograms,RISEparticipantswereprovidedwith:
• Atwo-dayintensivejobsearchworkshop,
• TheinternationallyrecognizedSuperHostfront-linecustomer servicetraining,
• TheRISEJobClub,asemi-monthlygroupfeaturingarangeof guestspeakers,
• One-on-onesessionswithanEmploymentSpecialist,and
• ABusinessServicesstaffmembertocreateconnectionstothe localjobmarket.
FromJune2010toJune2011,RISEserved39Adultsand139DislocatedWorkers.AsofJune2011,11Adultsand25DislocatedWorkersfoundemploymentandexitedtheprogram.Whileoutcomesareearly,manyenrolledintheprogramhavefoundtransitionalemployment,andtheyallincreasedtheirskillsanddevelopedanewnetworkingcommunity.
Cohort-basedCoursesWithARRAfunds,WDCSCtrained220studentsinthefollowingcohort-basedin-demandprogramsandcertifications:AerospaceCore,AppliedTechnology,BasicElectronics,EKGMonitorTech,IndustrialDesign/Manufacturing,ISOQualityManagement,LeanSixSigmaBlackBelt,NursingAssistant,NursingAssistantESL,ResidentialEnergyAudit,RestorativeAide,SafetyInspection,SolidWorks,andSQLServer2008.
Additionally,inpartnershipwithHousingHopeandEverettCommunityCollege(EvCC),WDCSCinvestedinthePropertyWorksprogram.PropertyWorksprovides20-hourperweekinternshipsinpropertymanagement(foratotalof400hours)with19collegecreditsatEvCC,culminatinginaCertificateinPropertyManagement.Apilotprogramin2010resultedin22graduates,withtenparticipantssecuringemploymentpriortotheendoftheprogram!Currently,32studentsareenrolledinthesecondprogramcohort.
WhilepurchasingcohortsisnotpossiblewithWIAformulagrantfunds,WDCSCisbundlingITAstoprovidecohort-likeopportunities.Infact,WDCSCispleasedtohave$600,000inGovernor’s10percentfundstotrain12peopleinEdmondsCommunityCollege’sElectricalAssemblyprogram,24peopleinEvCC’sBasicElectronicsprogram,andanadditional140participantsattheWashingtonAerospaceTraining&ResearchCenter(WATR)inAssemblyMechanicCertification.Itistrainingslikethese—thatleveragefundsfromfederal,state,andlocalsources—thatprovidethehigh-quality,highlyskilledemployeesthatourlocalbusinessesrequiretostaycompetitive.
AtWATR,classesaretaughtinahybridformatbothonlineandintheclassroom,andoncejobcandidatesarecertificatedinbothcoursesofstudy,TheBoeingCompanyguaranteesthemaninterview.TwohundredfiftyparticipantshavecompletedWATRtraining,213havereceivedjoboffers,and173arenowworking.Anadditional25graduatesareactiveintheBoeinghiringprocess.
PassporttoAerospaceEmploymentInAprilof2011,Boeingwashiring100employeesaweek.WorkSourceSnohomishCountysawanopportunitytoconnectjobcandidatestothisin-demandbusiness.
Further,WorkSourcestaffnoticedthatjobcandidateswerestrugglingtocompletetheBoeingonlineapplicationprocess.Toprovideassistance,WorkSourceinvitedBoeingHRprofessionalstoprovideworkshopsandtrainstafftohostfutureworkshops.
Theresponseto“PassporttoAerospaceEmployment”wasunparalleled.Withstandingroomonly,jobcandidateslearnedhowtocompletetheonlineapplicationprocess,togetnoticedbyBoeingrecruiters,andtoaceapanelinterview.
Seeingsuchanoverwhelmingneed,WorkSourceSnohomishCountyrapidlyregroupedtohost30PassporttoAerospaceEmploymentworkshopsduringthemonthsofApriltoJuly2011.
FromApriltoJuly2011,2,400uniquecustomerswereservedbythePassporttoAerospaceEmploymentprogram,including180veterans,and1,568peoplereceivingunemploymentinsurance.

Workforce Investment Act / Title I-B A A N N U A L R E P O R T
eqwertyuiop[]\`1234567890-=asdfghjkl;'!@#$%^&*()_+zxcvbnm,./ASDFGHJKL:"ZXCVBNM<>?
26 > Section Two - WHAT IS WORKING WELL
SEATTLE-KINGCOUNTY WorkforceDevelopmentCouncil Serving King County
ServingCustomers:AQuickSnapshotThiswasabusyyearastheWDCsoughttorespondtothesevereeconomicdownturnanditsjobcasualties.Nearly120,000citizensvisitedKingCountyWorkSourcecenters.TheWDC’sgreenjobstrainingserved1,000customersandanadditional3,000wereservedwithWIAandARRAtrainingdollars.Morethan900youthparticipatedinWIAsponsoredprogramsandotherprogramsaimedatservingthosecurrentlyunderserved(olderworkers,homeless,limitedEnglish)reachedmorethan700.
RetoolingWashington’sWorkforceSuccessesAnewpilotin2010calledBack2WorkNowreachedoutto200jobseekerswhowereabouttoexhausttheirunemploymentbenefits—especiallythosewhohadnotyetengagedwithWorkSource—andconnectedthemwithintensivejob-placementservices.Thissuccessfulpilotfeaturedanintensivejob-clubstructurewithsixmodulesavailableatmultiplelocationsandaLinkedIngroupthatconnectscustomerstoawidernetworkofbothjobseekersandemployers.Acriticalpiecewasthegroupofengagedemployerswhoofferedtheparticipantsmockinterviewsandadvice—aswellasjobs.
ThroughaWDCpartnershipwithBurlingtonNorthernSantaFeRailway,upto80currentlyunemployedpeoplewillbetrainedandplacedinnewjobsatBNSF—helpingthemstartoncareersintransportationandlogisticsandhelpingthestatestaycompetitive.RailstoCareerswillidentify,screenandreferqualifiedlong-termUIcandidatesforconsiderationforthespecifichiringneedsofBNSF.Successfulhiresintheoccupationsofconducting,mechanical,trucking,weldingandlaborer/maintenancewiththengothrough10weeksofon-the-jobtraining.
OtherAchievementsandHighlights
MapYourCareerwebsite:In2010,theWDClaunchedMapYourCareer.org,anewwebsiteshowcasingourcareermapsinsevenkeylocal
industries:healthcare,manufacturing,construction,lifesciences,informationtechnology,green,andmaritime.Twoofthese,greenandmaritime,haveenrichedcontentincludingin-depthanalysisofoccupationsandskillsrequired.ThemaritimesectionmeetstheneedexpressedbytheWDC’sMaritimeSectorPanelofemployers,laborunionsandtrainingprovidersforclearandaccessibleinformationforjobseekersandyouthwhoareconsideringacareerinmaritime.
WorkplaceLiteracy:103low-skilledandlimited-English-speakingworkerslearnedEnglish,computerandotherbasicskillsattheirworkplacesthrougha15-monthGovernor’s10percentgrant.LakeWashingtonTechnicalCollegeprovidedbasicandlanguageskillstotheworkersatsixcompaniesrangingfrommanufacturerstofastfoodtoEvergreenHospital.Employerscontributed$96,224asamatchforthe$120,000grant.Alloftheworkersretainedtheirjobs,with78percentgettingawageincrease.Inadditiontotheimpactthattheseclasseshadintheworkplace,theprogramhadmanypersonalimpactsaswell.74percentofparticipantsacquirednewcomputerskillsandallcanbetteruseEnglishintheirdailylives.FourparticipantspassedtheUScitizenshiptestandtenparticipantsregisteredtogotocollege.
BuildingFutures:TheWDC’s$4millionBuildingFuturesgrant,whichendedinMarch2011,showedthetremendousvalueofcross-systemcollaborationinvolvingthecourts.Overtwoyears,462youngoffendersgainededucation,jobtrainingandplacement.Theprojectreplicatedandsustainedtheaward-winingone-stopyouthprogramYouthSource(winnerofDOL’s2008RecognitionofExcellenceaward)intwoadditionallocationsinKingCounty,andincludedaJuvenileJusticeLiaisontoconnectcourt-involvedyouthwithprogramcasemanagers.Also,thankstoalargenetworkofemployerpartners,youthwereplacedininternshipsandotherworkexperiencesthatgavethemhands-onexperience,careerexplorationandmentoringfromadultrolemodels.Theseyoungpeoplehadtheincrediblylowrateof11percentrecidivism—greatlyexceedingtheproject’sgoalofreducingrecidivismto35percent.Onlynineindividualsreoffendedaftersixmonths.Almosthalfofparticipantsachievedaneducationalmilestoneintheprogram,including118whoearnedahigh-schooldiplomaorGED,and108earnedacertificateinsomekindofjobtraining.

WIA IN WASHINGTON STATE < 27
A N N U A L R E P O R T D Workforce Investment Act / Title I-B
TACOMA-PIERCECOUNTY WorkforceDevelopmentCouncil
Serving Pierce County
PublicandPrivatePartnershipsandMaximizingServicetoBusinessIn2010WorkForceCentralpartneredwith40employerstoinvest$450Ktomitigatelayoffs,spurcompanygrowth,andcreatejobsintheregion.Thisprogramtrained665workersinindustriessuchashealthcare,manufacturing,warehouse,transportation,aerospaceandengineering.Thirty-threeofthe40businessesweresmallemployers,trainedtheiremployeesinareasincludingHealthInformatics,ProjectManagement,Leadership,LeanManufacturingandInformationTechnology.
Lastyear,theWorkForceCentralBusinessConnectionworkedwith369employers,matchingapplicantstotheirjobopenings,providingscreeningassistance,conductingpre-employmenttestingandassessments,anddevelopingtrainingstrategiesfornewandincumbentworkers.Throughouttheyear,21individualemployerhiringeventsresultedinover200individualsbecomingemployed.Over12,000applicantswerescreenedfor837jobopenings,306ofthosepositionshavebeenfilled.ThroughcoordinationwiththeTacoma-PierceCountyEconomicDevelopmentBoard(EDB)20newemployerswereservedequaling120newjobsforthePierceCountyRegion.
InDecemberof2010,theWorkSourcePartnershipdevelopedaHiringAcademydesignedtoquicklyandefficientlytrainindividualsinEmployerExpectations,ResumeDevelopment,SkillsArticulation,andOn-lineApplications.IndividualsthatgraduatefromtheHiringAcademyearna“V.I.P”passwhichgrantsthemexclusiveaccesstoajobfairthefollowingweek.Todate,36participantshaveobtainedemployment.
DevelopingaQualifiedPipelineInanticipationofthedemandforskilledmanufacturingandaerospaceworkers,WorkforceCentralcollaboratedwithPierceCountyemployerstodevelopacustomizedtrainingprogramthatpreparesworkersforcareersinthemanufacturingindustry.ThePierce County Manufacturing Academyisapartnershipofbusiness,apprenticeship,andcommunityandtechnicalcollegesthatcertifiesgraduateswitha“GeneralManufacturing”education.DuringtheAcademy,thestudentsareexposedtovariousworkenvironmentsandcareerladdersthroughcompanytoursandvisitsfromemployers.Afternineweeksofrigorousmanufacturingtraining-including
blueprintreading,mathformanufacturing,welding,basicelectrical,OSHAandLeanmanufacturing-thegraduatesfilloutapplicationsandtakeatestwiththeiremployersofchoice.
FifteenstudentswillgraduateinAugust2011;fouralreadyhavejobofferswaitingforthem.
Morethan1,100studentsandeducatorsfrom32schoolsand20districtsattendedConstructionCareerDay.Eighty-sevenexhibitorswerefeatured,presentingonvariousoccupationsandcareerpathswithintheconstructionindustry.Over800studentsandteachersfrom19PierceCountyhighschoolsregisteredforHealthCareerDay2010.Ninetycareerworkshopsessionsfrom34presentersfeaturinghealthprofessionalsfromavastrangeofhealthcarefieldssharedtheirexpertiseandpresentedfirst-handexperience.Studentshadtheopportunitytovisit30exhibitorsintheExhibitors’Hallandlearnmoreabouttheircareerchoices-majorhealtheducationprovidersattended,includingcommunityandtechnicalcollegesanduniversities.
HealthcareWorkforceStrategiesIn2011,WorkForceCentralpartneredwithtwoofthearea’slargestmedicalclinicstodevelopanemploymentandtrainingprogramtoaddresstheworkforceshortageinhealthcare.Seventy-twoincumbentworkersand10newworkersreceivedcertificationandcollegecreditsinLeadershipSkills,PersonalAccountability,CustomerService,Teamwork,TimeManagementandMSOfficeApplications.Someoftheincumbentworkershavealreadyreceivedapromotion,andallofthe10potentialworkersarebeinginterviewedforvariousjobopeningsattheclinics.
JobsandHomesBuildingChangesandtheWashingtonFamiliesFundformedanewpartnershipwithWorkForceCentraltoprovideemploymentservicesforfamilieswhohaverecentlyexperiencedhomelessness.Gettingonapathtoemploymentiscriticaltopreventingfamiliesfromslippingbackintohomelessness–thisprogramisuniqueinthatitaddressesboththeneedforahome,andtheneedforajobtoprovideforthehome.WorkForceCentralpartnersincludePierceCountyHousingAuthorityandLakewoodAreaShelter,YWCA,ExodusHousingandCatholicCommunityServicesPhoenixHouse.

Workforce Investment Act / Title I-B A A N N U A L R E P O R T
eqwertyuiop[]\`1234567890-=asdfghjkl;'!@#$%^&*()_+zxcvbnm,./ASDFGHJKL:"ZXCVBNM<>?
28 > Section Two - WHAT IS WORKING WELL
SOUTHWESTWASHINGTON WorkforceDevelopmentCouncil
Serving Clark, Cowlitz and Wahkiakum counties
TrainingInnovationSouthwestWashingtonhasdevelopedconnectionsbetweentwosuccessfultrainingprograms,theIndividualizedCertificateProgram(ICP)atLowerColumbiaCollege(LCC),andOn-the-JobTraining(OJT)offeredbyWorkSource,thatservestobothup-skilljobseekersandprovideemployerswithaqualifiedworkforce.ICPisacustomizedtrainingprogramdesignedtomeetlocalemployerdemand.ThecurriculumforeachICPcertificateiscreatedinconjunctionwithspecificemployerneedsandemphasizeswork-basedlearning.OJTtrainingallowstheemployerstotrainon-the-jobtothespecificsskillsandabilitiesnecessaryfortheworkforce.
ThisprojecthashelpedstrengthentherelationshipbetweenthecommunitycollegeandWorkSource,enablingacontinuedopenandinnovativediscussionspartnershipbetweentheorganizations.Thepartnershipledtoanincreasedunderstandingofhoweachorganizationisassessingappropriatecandidatesforservicesandtraining,aswellasenhancedcoordinationinbusinessoutreachactivitiesamongWorkSourceBusinessServicesandLCCemployeroutreachstaff.
STEMPromotionSupportingscience,technology,engineering,andmath(STEM)professionscontinuestobeanemphasisforSouthwestWashington.TheSTEMinitiative,fundedbyaDepartmentofLaborgrant,coordinateseffortstoexpandthegatewaystoSTEM-relatedcareers,enhancethecapacitytoproducemoreworkerswithSTEMskills,andsupportinnovationandeconomicgrowth.SWWDCutilizedtheOpportunityInternshipProgramtoleverageSTEMfunding,providinglow-incomehighschoolstudentswithpaid90hourinternshipsinaSTEMfield,alongwithaSTEMmentor.Morethan75studentshaveparticipatedintheinternships,withanadditional50plannedinthecomingyear.
YouthSkillsSWWDCpartneredwithClarkCollegeandESD112toprovidetrainingforlow-income,out-of-schoolyouthinaconcentratedWeldingProgramatClarkCollege.ParticipantstookpartinafiveweekweldingprogramthatbeganwithanintroductiontoweldingprinciplesandledtoAmericanWeldingSociety(AWS)certification.Thetrainingprimarilyfocusedonwirecorewelding,whichisinhighdemandintheweldingindustry,aswellasvertical(3G)andoverhead(4G)weldingpositions,qualifyingstudentstoweldfivecertifiablepositions.Withtheseindustry-recognizedcertificationsinhandparticipantshadmarketableskillsandwereontheroadtoemployment.Aftertrainingcompletion,80percentofthestudentswentontofull-timeemploymentorpost-secondaryeducation.
EntrepreneurshipEventsSWWDCpartneredwiththeColumbiaRiverEconomicDevelopmentCouncil(CREDC),localSWWAbusinesses,andtheOregonEntrepreneursNetwork(OEN)toassistentrepreneurshipeffortsinSouthwestWAthroughthecreationofPubTalk.PubTalkregularlybringstogetherentrepreneurs,investors,serviceprovidersandmembersofthecommunityinterestedinfosteringbusinessinnovationandgrowth.Themodelleveragesthenetworkandexpertiseofourresidentstosupportinnovationandentrepreneurshipinourregion.
SWWDCrecognizedtheimportancetoentrepreneursofaccesstocapital,businessprofessionals,andanetworkofotherentrepreneursandbusinessleaders;especiallyinthecurrenteconomicclimate,aswellastheneedtosupportself-employmentopportunitieswhentraditionalemploymentopportunitiesarechanging.
WIA IN WASHINGTON STATE < 29
A N N U A L R E P O R T D Workforce Investment Act / Title I-B
NORTHCENTRAL WorkforceDevelopmentCouncil
Serving Chelan, Okanogan, Grant, Douglas, and Adams counties
HandsonLearning,HandsDownSuccessOn-the-JobTrainingisavaluedtoolintheNorthCentralWDA.OJTaffordsbusinessesthatareshortonresourcesorwithoutastructuredplanthefinancialandtechnicalassistancetotrainnewhirestherightway.OJTisatoptrainingmethodandRetoolingbolsteredthatcommitment.OJThelpsbusinesseshiresoonerandhelpsworkerslearntheskillsemployerswant.
AsWorkforceInvestmentformulagrantsdeclined70percentoverthepasteightyears,sohavethenumberofbusinessesandworkersbenefitingfromstructuredwork-basedlearning.ButtheRecoveryAct,Governordiscretionarygrants,andSB5809increasedOJTenrollments280percentcomparedtothreeyearsago.Infiscalyear2010,138OJTcontractswerewrittenutilizing10fundingsources.Thisdiversityinfundingallowedfortrainingavarietyofworkers(longtermUIrecipients/exhaustees,dislocatedworkers,lowskilledadultsandolderyouth)andtargetedgrowingindustriessuchaschemicalmanufacturing.
ExpandedOJThasalsostrengthenedthelocalworkforcesystem.SinceitiscombinedwithcoordinatedoutreachandtargetedatUIexhaustees,partnersaremoreknowledgeableaboutOJTandhowtheycanparticipateinthedevelopmentandreferralprocess.WiththeOJTresurgence,momentumisgainedwithemployers.Heightenedawarenessoftheseresources,especiallyinasufferingeconomy,hasincreasedconsumptionandimprovedservicedeliveryeffectiveness.
WorkforceinvestmentstaffledtheOJTinitiative,butWorkSourcepartnerswereessentialtoenhancingitssuccess.IBBusinessservicesstaffconvenedpartnersandsharedinformationaboutOJTandtheinitiative,specificallywithregardstotheNEGandARRA5%project.
ChambersofCommerce,radiostationsandtradeassociationsgotthewordouttoemployers.Thesestrengthenedpartnershipswillcontinueaslongasthereisworktobedoneandfundingtogetitdone.
BetterTogetherNorthCentral’sprimaryindustriesareagriculture,foodprocessing,manufacturingandpowergeneration.lumberandwoodproductsslumpedin2009withtheclosingoftheregionslastsawmill.Twenty-fiveyearsago,theregionhadsixmillsemploying1,000workers.ThelendingbusthasalsocrippledtheConstructionindustryasthemedianhomepricedropped21percentsince2008.FortunatelyPugetSoundersstillseekrecreationandleisureinNorthCentral’seasternCascadeslopesboostingtheaccommodationsandtradeindustries.
BetweenJulyandDecember,2008,unemploymentjumpedfrom5to10percentwhereitpersists.Demandonworkforceagenciesdoubled.Workshopsthattypicallyhad15participantsnowhad25to30.Collegeclassesfilledup.
Inresponse,WorkSourcepartnersrampedupbusinessoutreachactivitiesreaching300morecompaniesthantwoyearsago.Businessoutreachleadstoemploymentopportunities,andemploymentopportunitiesleadtotrainingopportunities.Inthepast,WorkforceInvestmentandWagner-Peyseroutreacheffortsweretypicallyperformedindependently.Therewasnointenttoworkseparatelybuttherewasnoseriousplantoworkcollaboratively.
CoordinatedbusinessoutreachbecameintentionalastheWorkSourceBusinessTeamswererevveduptoassistcompaniesrecruitcandidates,includingtheColumbiaBasinJobsConsortium.Theimpactisamoreaccuratematchingofskillsandjobrequirements.
NowtheWorkSourceBusinessTeamsmeetweeklytoshareinformationandresources.Partnerscommunicatedailybyphone,emailorinpersonandhavedoubledthenumberofemployertourstoexpandstaffknowledgeandunderstandingofcompanyjobrequirements.
BusinessTeamleadershipupdatestheoutreachstrategyquarterlytargetingandcontactingfirmstodiscoveremploymentrelatedbusinessproblemsandpresentsolutionswhichmayincludetrainingservices,providingqualifiedcandidates,financialresourcesandtechnicalassistance.
Workforce Investment Act / Title I-B A A N N U A L R E P O R T
eqwertyuiop[]\`1234567890-=asdfghjkl;'!@#$%^&*()_+zxcvbnm,./ASDFGHJKL:"ZXCVBNM<>?
30 > Section Two - WHAT IS WORKING WELL
SOUTH-CENTRAL WorkforceDevelopmentCouncil
Serving Yakima, Kittitas, Skamania and Klickitat counties
SouthCentralWDC–YVCCJointPlacementProjectAuniquepartnershipbetweentheSouthCentralWorkforceCouncilandYakimaValleyCommunityCollege(YVCC)thattargetslowincomeadultsenrolledintheIntegratedBasicSkillsTraining(IBEST)programscontinuestoprovidereturnsforathirdconsecutiveyear.Theprojectwhichstartedinthespringof2009hasservedmorethan110IBESTstudentsenrolledinAlliedHealth,BusinessTechnologyandEarlyChildhoodEducationprograms.
PeopleforPeople,SouthCentral’sWIAI-Badultprovider,playsakeyrolebyprovidingservicestostudentsduringthelastquarteroftheirrespectiveprogramswithanemphasisonobtainingtrainingrelatedemployment.Trainedcasemanagementstaffplaysacentralroleworkingwithstudentsindividuallytoassesstheirskillsandabilities,barrierstoemploymentandidentifyanyadditionaltrainingandeducationalneedsthatmaystandintheirwaytoemployment.Oncetheassessmentiscomplete,aplanofactioninputinplacethatcanincludeseminarsonappropriateworkbehaviors;financialliteracy,resumewriting,andinterviewingtechniques;andmayincludejobshadowormentoringexperienceforthoseneedingtodeveloprealexperienceintheworkplace.Projectactivitiesareroundedoffwithemployerpresentationsandround-tablediscussionstoallowstudentstheopportunitytohearfirsthandwhatexpectationsemployershaveintheworkplace.
Projectstaffareco-locatedatthecollegescampusinYakimaandGrandview;andarecrosstrainedinmultipleprograms’eligibilityrequirements(PublicAssistance,CommerceWorkFirstPrograms,ClinicalPlacementProject,PublicHousing,BasicFood,OpportunitiesPilotProject,WIA,FinancialAidandvariousotherfundingstreams)inanefforttoleverageresourcesinthelocalarea.ThestaffarealsomembersoftheSouthCentral’sBusinessServicesTeamwhichgivesthemdirectaccesstoemploymentopportunitiesinthelocaljobmarket.Thepartnershiphasbeenhighlysuccessfulwithatotalof86percentofparticipatingstudentsenteringunsubsidizedemploymentorcontinuingapostsecondaryeducationprogramintheirchosencareerpathway.Ofthosestudentsserved60percentwereonpublicassistanceandwageatplacementrangedfrom$9.00to$12.00anhour.
UsingOn-theJobTrainingasaRetoolingStrategyConsistentwiththeStateofWashingtonWorkforceBoard’slead,theSouthCentralWorkforceCouncil(WDAIX)hasaggressivelyembracedtheRetoolingefforttoaddresstheneedsofthehighnumbersofunemployedandlong-termunemployed.TheRetoolinginitiativeistheadoptionofabroadsetofstrategiestohelplocaljoblessresidentsmovetounsubsidizedemployment,eitherdirectlyorthroughawidearrayoftrainingprograms.ThemostpotenttoolinSouthCentral’sarsenalistheuseofOn-the-JobTrainingprograms--thetraditional“learnwhileyouwork”trainingactivitywithacommitmentfromemployerstohirewhentheprogramhasbeencompletedsuccessfully.
FundingfortheactivityhascomefromalocalpriorityshiftofformulafundscombinedwiththeStatesNationalEmergencyGrantwhichwasinitiatedinearly20ll.LatestreportsrevealthattheprogramisbuildingmomentumwithSouthCentralnowat67percentofitsgoalfortheyear.On-the-JobTrainingplacementscrossvariedindustriessuchasautomotiverepair,healthcare,marineservices,heatingandairconditioningandspanarangeofoccupationssuchasprojectmanagers/managerial,electriciansandhealthcaretechnicians,accounting,automotivemechanicsandothertypesofindustryrepairtechnicians.
WiththenewemphasisonOJT,theSouthCentralWorkforceCouncil’sprovidershaveadoptednewstrategiestorollouttheprogramsthroughitslocalWorkSourceBusinessServicesTeam.Theseactivitiesincludepersonalcontactswithbusiness,grouppresentationstoemployerorganizationssuchasChambersofCommerceandworkingdirectlywithlocaleconomicdevelopmentorganizationstotargetnewandexpandingbusinesses.Theeffortsareworking,asmanybusinessesaretakingadvantageofthetraditional“learnwhileyouwork”modelthateasesthecostandburdenoftrainingwithwagereimbursementstotheemployer.CurrentlyOn-the-JobTrainingwagesaverage$12.42anhourwithcurrentcompletersearning$12.80atcompletion.

WIA IN WASHINGTON STATE < 31
A N N U A L R E P O R T D Workforce Investment Act / Title I-B
EASTERNWASHINGONPARTNERSHIP WorkforceDevelopmentCouncil
Serving Asotin, Columbia, Ferry, Garfield, Lincoln, Pend Oreille, Stevens, Walla Walla and Whitman counties
ThelaggingeconomycontinuestoprovidechallengestoruraleasternWashington.
InresponsetoRetooling Washington’s Workforce,astate-wideefforttoincreaseemploymentopportunities,theEasternWashingtonPartnership(EWP)WorkforceDevelopmentCouncil(WDC)hasdevelopedstrategiestoaddressRetooling’sthreepriorities.
Coordinated Outreach to Long-term unemployment recipients and exhaustees:Withmanufacturing,constructionandforestproductsindustriescomprisingasignificantshareofthelocaleconomy,theareaexperiencedasignificantlossofjobssince2008.WorkSourceofficesincreasedoutreacheffortsbyidentifyingandpersonallycontactingclaimantswhohadexhaustedorwereatriskofexhaustingbenefits.Sixty-fivepercentofthosecontactedtookadvantageofWorkSourceservicesbyattendingworkshops,engaginginskilldevelopmentactivities,becominginformedofnewtrainingopportunities,accessingjobreferralassistance,orlinkingtoothercommunityresources.WorkSourceWallaWallaorganizedhumanservicesproviderforumstoalertcommunitypartnersoftheincreasingnumbersofpeoplethatwouldpossiblyseekservices.
On the Job Training:OJThasbeenatraditionaltrainingstrategyinEastern’sruralcommunities,whereformaleducationalopportunitiesareminimal.TheWDCpartneredinastatewideNationalEmergencyGrant,andalsoreceivedfundingfromtheGovernor’sWIAdiscretionaryfund,toexpandOJTforlong-termunemployedindividuals.IncreasedfundingmadeitpossibleforWorkSourcestafftointensifyeffortstoreachemployersandpotentialtraineesinformingthemofOJTasatrainingoption.ServiceproviderscollaboratedwitheconomicdevelopmentagenciestobroadenthemarketingofOJT.OJTplacementscontinuetoincrease.
Business Services: TheBusinessServicesTeam(BST),whichincludesstafffromallprograms,metweekly.OJTgrantfundsenabledtheBSTtoincreaseoutreachtoemployers,promotingallWorkSourceprograms.Servicesforemployersincludejoborderlistings,recruitmentandscreeningofapplicants,skillassessments,provisionofofficeinterviewspace,taxcreditinformationandincumbentworkertraining.TheBSTlisted1,800joborders.Improvedclientassessmentmadeforanincreasedpercentageofgoodjobmatches.
Youthactivitieswerediminishedduetoreducedfunding;howeverWorkExperienceandSummerEmploymentprogramscontinuetobeofgreatvaluetotheyouthwhoparticipateandtotheruralcommunitieswheretheylive.Theneedforyouthprogramsisgreat,andprovidershavenotbeenabletomeetthedemand.TheOpportunityInternshipprogramplacedhighschoolstudentswithemployers,andserviceprovidersassistedstudentsinapplyingforfinancialaidandcollegeadmissionearlyintheyear.
TheIncumbentworkerprogramhasbeenwelcomedbytheemployercommunityinallninecounties.Contractswereawardedtomultiplebusinessesfortraininginawidevarietyofoccupationssothatcurrentemployeeswereabletoupgradeskillsandearncertifications.
Anotherimportantactivityfortheadultpopulationisoccupationalskillstraining,particularlyintheentrylevelhealthoccupationsandnursing.BlueMountainActionCouncilandRuralResourcespartnerwithWallaWallaCommunityCollege(WWCC)toprovideassistancetostudentswhoareonthenursingtrack.
TheWDChelpedtofundTheWindEnergyTechnologycourseatWWCCduringtheyear.StudentscanearneitheracertificateoratwoyearAAASdegree,preparingthemforsuccessfulplacementinthewindenergyindustry.ThisisagrowthindustryinsoutheasternWashington.
TheIntegratedBasicEducationandSkillsTraining(IBEST)andanewoffering,Skill-Up,arecollegeprogramsthataredesignedtoassistparticipantswhowishtolearnjobskillswhiletheyareearningaGEDorbecomingproficientinEnglish.WIAserviceprovidershelpwithtrainingfundsandcounseling.

Workforce Investment Act / Title I-B A A N N U A L R E P O R T
eqwertyuiop[]\`1234567890-=asdfghjkl;'!@#$%^&*()_+zxcvbnm,./ASDFGHJKL:"ZXCVBNM<>?
32 > Section Two - WHAT IS WORKING WELL
BENTON-FRANKLIN WorkforceDevelopmentCouncil
Serving Benton and Franklin counties
UniversalAccessServicesMorethan500jobseekerscomingthroughthedoorsatWorkSourceColumbiaBasin(WSCB)daily,theworkofthefront-endstaffremainsacentralcomponentofWSCB’sservicedeliverystrategy.Thequalityofthisinitialinteraction,i.e.,needstriage,isnotonlycrucialforsettingtheinitialtoneforstaff-to-jobseekerinteractions,butformaximizingtheuseofstafftime,whilemeetingtheneedsofthejobseeker.
InadditiontohavingaworkingknowledgeofallprogramsofferedbyWSCB,includingbasiceligibilityrequirements,allGuestResourceSpecialistsarerequiredtostayabreastofthebroadmenuofsupportservicesavailablethroughoutthecommunity
BusinessServicesEssentialtocarryingoutthemissionandvisionoftheOneStopsystemishavingstrongandeffectivelinkswiththelocalbusinesscommunity.Approximately19,283customerswereservedthispastyearandapproximately66percentjobseekerswenttoworkasaresultofourdedicatedstaff.Toservetheneedsofemployersthatweredownsizingorinsomecases,expandingtheirbusinesses,WSCBsponsored54hiringeventsandhosted5jobfairs.Bytheendoftheyear,623employershadpostedmorethan3,450joborders.
Our“BusinessintheMorning”events,whichfocusonreal-worldissuesfacingbusinesses,continuedtobewellattended.
ServiceIntegrationRecognizingthefrustrationthatisinherentinattemptingtoaccessservicesthroughamazeofstove-pipedserviceproviders,WSCB’sservicedeliverysystemstripsawayallorganizationalidentifiers.Specifically,intheeyesofthejobseeker,allstaffisWorkSourcestaff;allstaffisresponsibleforfacilitatingaccesstoservices.Partner/organizationalintegrationisdeployedusingfunctionalteamsassignedtospecificareasofresponsibility.However,thesefunctionalteamsworkacrossorganizationallinestomeetjobseekerneeds.
ServicestoPersonswithDisabilitiesWSCBcontinuedtoelevateitsservicestopersonswithdisabilities.Anextensiveassortmentofsomeofthelatestassistivetechnologies,includinglargeralternativekeyboards,electronicpointingdevices,alongwithahostofdevicestoaidthevisuallyimpairedandpersonswithdexteritychallengesareavailabletoassistpersonswithdisabilities.WorkingincollaborationwiththeSoutheasternWashingtonCenterfortheDeafandHardofHearing,WSCBremainsaserviceleaderinprovidingjobsearchassistancetotheDeafandHardofHearingcommunity.WSCBisuniqueinthatithasfront-endstafffluentinAmericanSignLanguage.
WIAAdult/DislocatedWorkerActivitiesThetrainingofprogramparticipantsforindemand,highwageoccupationscontinuedtobeaprogramemphasis.Inspiteofdecliningresources,336individualsreceivedWIAserviceswithanaverageunsubsidizedplacementwageofmorethan$14perhour,thisinthetightestjobmarketinmorethan30years.
InpreparationforlayoffsthatwillbetriggeredbytheexpirationofAmericanRecoveryandReinvestmentActfundingatHanford,partnershipswiththerelevantpartieswereestablished,asRapidResponsewillbeakeyprogramcomponentintheupcomingyear.
YouthActivitiesWecontinuedtoemphasizetrainingandeducationaspartofouryouthservicedeliverymodel,with67youthearningadiplomaorcredentialattainment.Onehundredseventyyoungerandolderyouthreceivedservices.
Becauseonlinetoolsareusedheavilybyyoungerjobseekerstoestablishprofessionalnetworks,programparticipantswerecoachedontheresponsibleuseofsocialmedianlikeFacebook.The7thAnnualSummerYouthVocationalChallengewasagreatsuccess,culminatinginaCareerFairofferingparticipantstheopportunitytoapplytheskillsobtainedduringtheevent.

WIA IN WASHINGTON STATE < 33
A N N U A L R E P O R T D Workforce Investment Act / Title I-B
SPOKANEAREA WorkforceDevelopmentCouncil
Serving Spokane County
RetoolingWashington’sWorkforceInthepast12months,theSpokaneAreaWorkforceDevelopmentCouncil(SAWDC)hashelpedtomeetthechallengesoftoday’seconomyandhelpworkersandbusinessestolaythefoundationforeconomicrecoverybyaddressingthethreecriticalelementsoftheRetoolingWashington’sWorkforceinitiative-connectwithemployerstolearntheirneedsandtranslatethatbacktotheworkforcesystemforaction;linktrainingtojobsinourstate;andlearnwhoUIclaimantsandexhausteesareinordertoservethemeffectively.
Stakeholdersfromacrosstheregionworkedtogethertocoordinateeffortsanddevelopandimplementastrategyatthelocallevel.TheseeffortsarealignedwiththeSAWDC’stargetedsectorsforworkforcedevelopment,takingadvantageofsynergiestoleverageresourcesandsupportourarea’seconomicdevelopment.
BusinessOutreachTocreatemoreconnectivitytoareabusinesses,theSAWDCredesignedtheBusinessSolutionsTeam(BST).ThisnewmodelincludeshavingallWorkSourcestaffconductoutreachactivitiesthroughacoordinatedsystemledbydesignatedindustryspecialists,calledMarketManagers.Eachmarketmanagerisresponsibleforcreatingamarketingstrategyfortheirindustry,includinghowtheentireWorkSourceSystemoperatesinsupportofthosebusinesses.Thissystemwillfacilitateamorestreamlinedandconsistentapproachaswellasincreasedbusinesscontacts.
Focusonqualityandimprovementincludingidentifyingvalue-addedandnon-value-addedprocesssteps.TheWorkSourceCenterhaslearnedtoapplyLeancontinuousimprovementprinciplestotheprocessesutilizedwhileworkingwithregionalbusinesses.BasicLeantraininghasbeenprovidedtotheBusinessServicesTeam,andperformanceexpectationshavebeenredesignedtosupporttheLean-principlesmodel.IncludedinthisredesignaredailyVisualManagementmeetings,whereperformanceisdiscusseddailytoaidinreachingindividualandteamgoals.
Improvingperformancemeasurestomatchthevalue-addedworkemployersexpectoftheworkforcesystem.Thishasengenderedmovingtomeasureswhichtracknewemployerengagement,numbersofOJTscompleted,qualityofbusinessassessments,andmarketshare.Thesenewmeasureswillassurethatthefocusisuponservicesemployersareseekingwhilealsomeasuringtheimpacttheworkforcesystemhasuponourcommunity.
Otheractivitiesinthenewyearwillfocusuponfurtheranalysisofindustry
sectorsandsubsectorsintheeconomywhereactivityisoccurringanddevelopinformationtouseinbothcreatingresponsiveeducationprogrammingaswellasguidingindividualsintocareerswheregrowthispredicted.
OJTTheSAWDClaunchedtwonewOJTprogramsfundedbyaNationalEmergencyGrantandaGovernor’s10percentDiscretionaryGrant.ActivitiesunderthesegrantsincludedcreatinganOJTworkshopforemployers.Employers,especiallysmalltomedium-sizedbusinesses,werehavingadifficulttimescreeningapplicantsforOJTs.Theywereprimarilyaskingskill-basedquestions,whiletheintentoftheOJTistoprovideskill-basedtrainingtoqualityemployees.InthelasteightmonthsanOJTSpecialistpositionwascreatedtoassistemployerswithunderstandinghowtoscreenapplicantsforquality–ratherthanspecificskills.Wenowofferworkshopsaswellasone-on-oneassistancesessionstotrainhiringmanagers/businessownersonhowtointerviewforfitratherthanspecificskills.Employershavereportedthis“new”wayoflookingathiringisveryeffective.Aworkshopisalsounderwaytoassistemployersindevelopingmorecomprehensiveandeffectivetrainingplanswhichreflectthefullrequirementstomeettheirworkforceskilldeficiencies.Itisanticipatedthattheimplementationofthisprogramandprocesswillhavetheeffectofimprovingboththequalityandeffectivenessofthetrainingofferedbyparticipatingemployers.
OutreachtoUIExhausteesAstrategywascreatedforservinglong-termUIclaimantswhichincludedoutreach,reengagement,assessment,andtraining.Recognizingthemanydiverseneedsofthispopulation,WorkSourceSpokanecreatedavarietyofstrategiestoreengagelong-termclaimants,includingspecializedworkshops,OJTopportunities,andvocationaleducationoptions.Additionally,twostaffmembershavebeendedicatedasLong-TermClaimantSpecialists,providingservicestothoselikelytobecomelong-termclaimants,aswellasthosewhohavealreadyexhaustedtheirbenefits,withspecificservicestoincludelong-termengagement(casemanagement).
Aswemoveintothenextyear,theCouncilwillcontinuetocoordinate,leverageresources,andintegratethedeliveryofservicesatthestateandlocallevels,ensuretheboardhastheinformationitneedstomakegooddecisionsfortheworkforcesystem,andprovidethecommunitywithinformationandresourcesthateffectivelymeettheworkforceneedsofjobseekersandbusinesses.

Workforce Investment Act / Title I-B A A N N U A L R E P O R T
34 > Section Three - WIA TITLE 1-B RESULTS

This section includes the following information about Washington Title I-B programs:
A Adjustments made to WIA performance measures in response to changes in economic conditions and participant characteristics.
A Narrative discussion of the costs of workforce investment activities relative to the effect of activities on the performance of participants.
A State evaluations of workforce investment activities, including net-impact research and the biennial Workforce Training Results.
A A table section that includes negotiated performance levels and actual performance on measures of program performance.
Analysis
WIA Title I-B performance measures focus on the results for the approximately five percent of WorkSource customers who are registered for intensive services or training services funded under Title 1-B. Separate Title 1-B programs are operated for disadvantaged adults, dislocated workers, and disadvantaged youth. Each population has its own set of measures covering employment rates, retention in employment, earnings, and credential attainment. Participant satisfaction and employer satisfaction are measured by telephone survey.
Federal and state performance measures have precise definitions. Employment and earnings measures are based on wage records collected by state Unemployment Insurance (UI) systems for employer payroll taxes and determinations of UI eligibility. Washington’s federal and state measures use UI wage records from the state’s Employment Security Department. In addition, Washington participates in the Wage Record Interchange System (WRIS), which provides UI wage records from 49 other states and the District of Columbia. Federal payroll records are also accessed
Some measures include information on enrollment in further education or training following program exit. This information is gathered by matches using enrollment data supplied by the state’s two and four-year colleges, private career schools, apprenticeship programs, organizations seeking eligibility as WIA training providers, and the National Student Clearinghouse. Some of the information needed for credential attainment measures is also obtained from degree and completion information from these sources.
States are statutorily required to measure 20 federal performance measures, unless a state has a waiver to report only the nine common measures. Washington has such a waiver and is required to report only the common measures. Performance achievements on these nine measures are used to determine awards of federal incentive funds. Performance targets are based on baselines derived from performance in prior years.
The Workforce Investment Act provides that states may negotiate revisions of targets based on changes in participant demographics or economic conditions. Washington requested and received adjustments to its adult and dislocated worker performance targets for PY 2010 based on regression analyses showing the relationship between economic and demographic conditions and performance. Washington’s request for a Common
WIA IN WASHINGTON STATE < 35
A N N U A L R E P O R T D Workforce Investment Act / Title I-B Section Three
WIA Title l-B Results
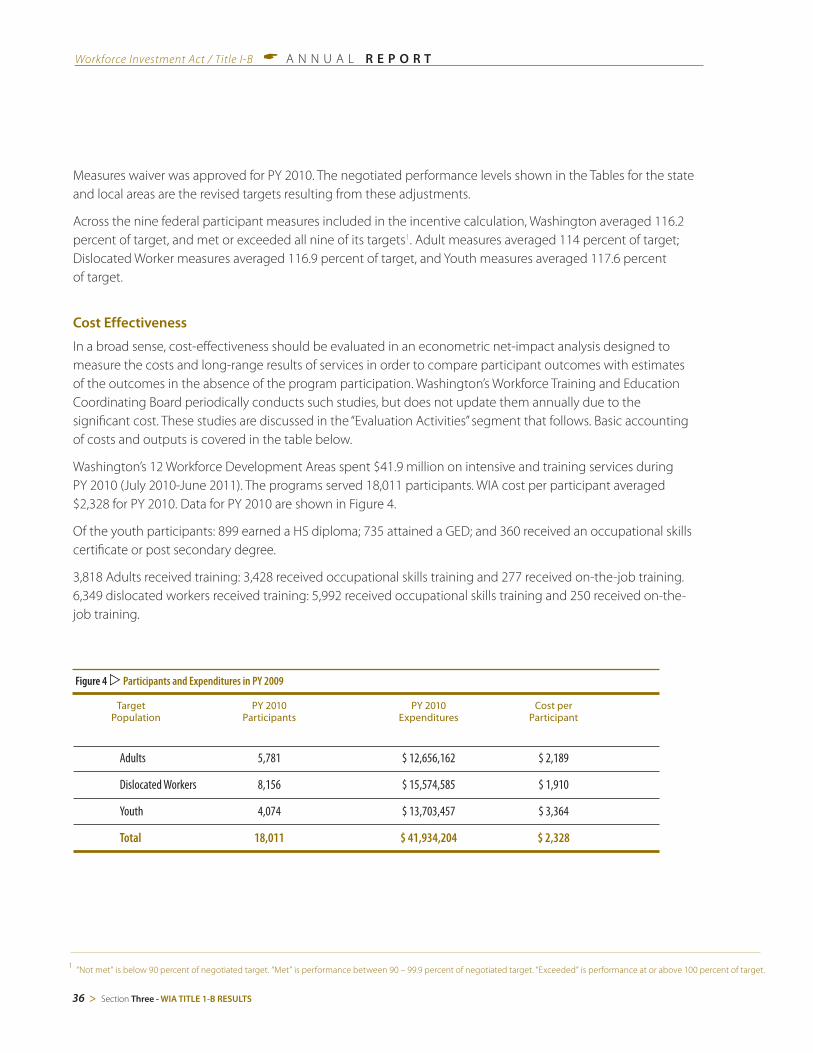
Target PY 2010 PY 2010 Cost per Population Participants Expenditures Participant
Adults 5,781 $ 12,656,162 $ 2,189
Dislocated Workers 8,156 $ 15,574,585 $ 1,910
Youth 4,074 $ 13,703,457 $ 3,364
Total 18,011 $ 41,934,204 $ 2,328
Figure 4 w Participants and Expenditures in PY 2009
Measures waiver was approved for PY 2010. The negotiated performance levels shown in the Tables for the state and local areas are the revised targets resulting from these adjustments.
Across the nine federal participant measures included in the incentive calculation, Washington averaged 116.2 percent of target, and met or exceeded all nine of its targets1. Adult measures averaged 114 percent of target; Dislocated Worker measures averaged 116.9 percent of target, and Youth measures averaged 117.6 percent of target.
Cost Effectiveness
In a broad sense, cost-effectiveness should be evaluated in an econometric net-impact analysis designed to measure the costs and long-range results of services in order to compare participant outcomes with estimates of the outcomes in the absence of the program participation. Washington’s Workforce Training and Education Coordinating Board periodically conducts such studies, but does not update them annually due to the significant cost. These studies are discussed in the “Evaluation Activities” segment that follows. Basic accounting of costs and outputs is covered in the table below.
Washington’s 12 Workforce Development Areas spent $41.9 million on intensive and training services during PY 2010 (July 2010-June 2011). The programs served 18,011 participants. WIA cost per participant averaged $2,328 for PY 2010. Data for PY 2010 are shown in Figure 4.
Of the youth participants: 899 earned a HS diploma; 735 attained a GED; and 360 received an occupational skills certificate or post secondary degree.
3,818 Adults received training: 3,428 received occupational skills training and 277 received on-the-job training.6,349 dislocated workers received training: 5,992 received occupational skills training and 250 received on-the-job training.
1 “Not met” is below 90 percent of negotiated target. “Met” is performance between 90 – 99.9 percent of negotiated target. “Exceeded” is performance at or above 100 percent of target.
Workforce Investment Act / Title I-B A A N N U A L R E P O R T
36 > Section Three - WIA TITLE 1-B RESULTS

Evaluation activites, including net impact and cost-benefit
The state legislation that established Washington’s Workforce Training and Education Coordinating Board called for the implementation of a comprehensive research program. This program continues under WIA, and will be used to measure the results of federal and state workforce investment activities. The research effort contains four elements:
A High Skills High Wages: Washington’s Strategic Plan for Workforce Development, which incorporates research results from a variety of sources.
A Workforce Training Results: An Evaluation of Washington State’s Workforce Development System, a biennial study of the outcomes of workforce development programs.
A Workforce Training Supply, Demand and Gaps, a biennial analysis of the supply of and demand for skilled workers in Washington.
A A net impact study, conducted every four years, with results folded into Workforce Training Results reports.
Publications resulting from the most recent round of research can be found at www.wtb.wa.gov/Pubs_Publications.asp
Workforce Training Results reports on programs from three groups:
A Programs for adults including community and technical college Job Preparatory Training, private career schools, apprenticeship, a state funded Worker Retraining program at community and technical colleges, and Workforce Investment Act dislocated workers services.
A Programs serving adults with barriers to employment including Adult Basic Education, Workforce Investment Act adult services, Division of Vocational Rehabilitation, Department of Services for the Blind and WorkFirst.
A Programs serving youth, including secondary career and technical education and Workforce Investment Act youth services.
The report describes the demographics of each population, services received, competencies gained, participant satisfaction, and the satisfaction of employers who have hired participants. Employment results are measured using both surveys and Employment Security Department wage records.
An updated version of Workforce Training Results is being prepared and some of the results of that study appear in this document. It is the fourth Workforce Training Results report to cover Workforce Investment Act populations. These reports can be downloaded at www.wtb.wa.gov/Pubs_Publications.asp as they become available while copies of older reports can be found at www.wtb.wa.gov/Pubs_PublicationsArchives.asp.
The data in this report on the exiting cohorts of 2007-08 show their outcomes as affected by the economic climate in 2008-09, when most of the measurement occurred. This was during the onset of the recession and appears largely as decreased employment rates. Wages and hours for those employed had not yet begun to decline markedly. The results for the 2008-09 cohort are being prepared and are expected to show a more marked effect from declining labor markets.
WIA IN WASHINGTON STATE < 37
A N N U A L R E P O R T D Workforce Investment Act / Title I-B
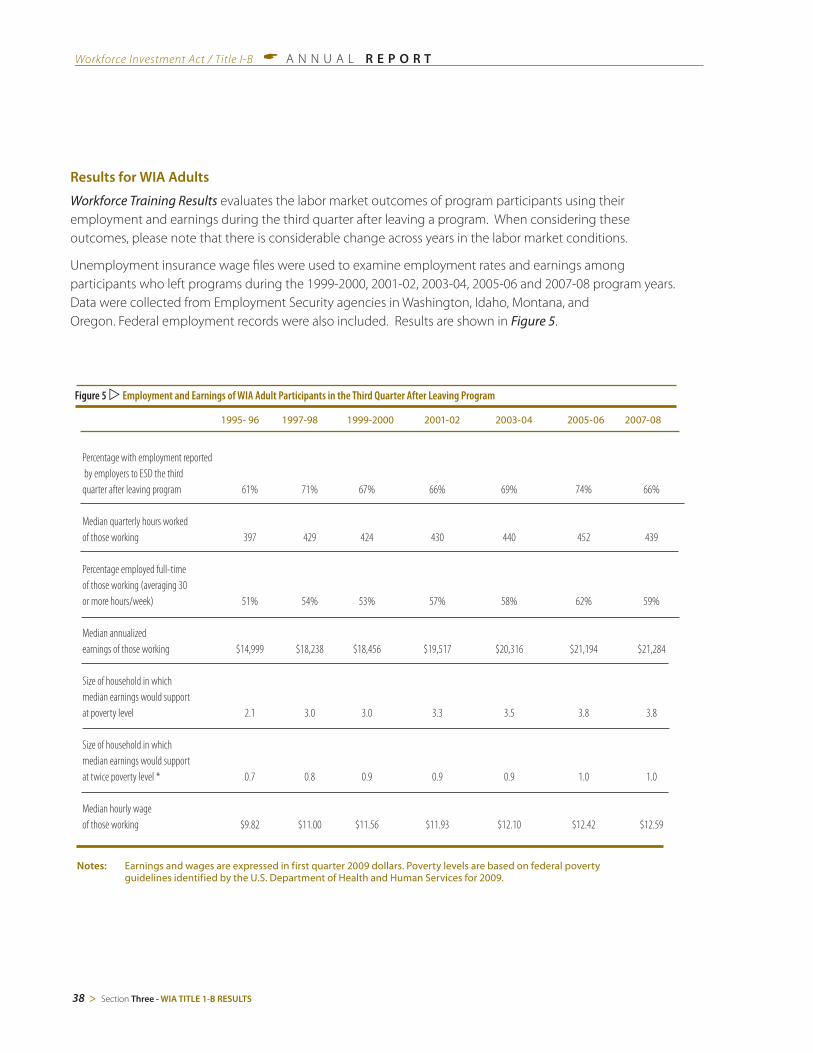
1995- 96 1997-98 1999-2000 2001-02 2003-04 2005-06 2007-08
Figure 5 wEmployment and Earnings of WIA Adult Participants in the Third Quarter After Leaving Program
PercentagewithemploymentreportedbyemployerstoESDthethirdquarterafterleavingprogram 61% 71% 67% 66% 69% 74% 66%
Medianquarterlyhoursworkedofthoseworking 397 429 424 430 440 452 439Percentageemployedfull-timeofthoseworking(averaging30ormorehours/week) 51% 54% 53% 57% 58% 62% 59%
Medianannualizedearningsofthoseworking $14,999 $18,238 $18,456 $19,517 $20,316 $21,194 $21,284
Sizeofhouseholdinwhichmedianearningswouldsupportatpovertylevel 2.1 3.0 3.0 3.3 3.5 3.8 3.8
Sizeofhouseholdinwhichmedianearningswouldsupportattwicepovertylevel* 0.7 0.8 0.9 0.9 0.9 1.0 1.0
Medianhourlywageofthoseworking $9.82 $11.00 $11.56 $11.93 $12.10 $12.42 $12.59
Notes: Earnings and wages are expressed in first quarter 2009 dollars. Poverty levels are based on federal poverty guidelines identified by the U.S. Department of Health and Human Services for 2009.
Results for WIA Adults
Workforce Training Results evaluates the labor market outcomes of program participants using their employment and earnings during the third quarter after leaving a program. When considering these outcomes, please note that there is considerable change across years in the labor market conditions.
Unemployment insurance wage files were used to examine employment rates and earnings among participants who left programs during the 1999-2000, 2001-02, 2003-04, 2005-06 and 2007-08 program years.Data were collected from Employment Security agencies in Washington, Idaho, Montana, and Oregon. Federal employment records were also included. Results are shown in Figure 5.
Workforce Investment Act / Title I-B A A N N U A L R E P O R T
38 > Section Three - WIA TITLE 1-B RESULTS

1997- 98* 1999-2000* 2001-02 2003-04 2005-06 2007-08
Figure 6 wEmployment and Earnings of WIA Dislocated Worker Program Participants in the Third Quarter After Leaving Program
PercentagewithemploymentreportedbyemployerstoESDthethirdquarterafterleavingprogram 74% 75% 74% 76% 78% 77%
Medianquarterlyhoursworkedofthoseworking 484 495 494 486 491 484 Percentageemployedfull-timeofthoseworking(averaging30ormorehours/week) 67% 70% 74% 73% 75% 73%
Medianannualizedearningsofthoseworking $28,269 $28,624 $30,302 $30,918 $31,143 $30,537
Sizeofhouseholdinwhichmedianearningswouldsupportatpovertylevel 5.7 5.8 6.2 6.4 6.4 6.3
Sizeofhouseholdinwhichmedianearningswouldsupportattwicepovertylevel 1.9 1.9 2.2 2.2 2.3 2.2
Medianhourlywageofthoseworking $15.11 $15.31 $15.95 $16.41 $16.77 $16.21
Notes: Earnings and wages are expressed in first quarter 2009 dollars. Poverty levels are based on federal poverty guidelines identified by the U.S. Department of Health and Human Services for 2009.
* Figures for 1997 through 2000 are for JTPA III Dislocated Worker Program.
Results for WIA Dislocated Workers
The outcomes of Dislocated Workers, shown in Figure 6, can vary with economic conditions and the characteristics of participants. Change can occur quickly from year to year as industrial conditions change and different groups of employees face layoffs.
WIA IN WASHINGTON STATE < 39
A N N U A L R E P O R T D Workforce Investment Act / Title I-B

Results for WIA Youth
Figure 7 displays results for the WIA Youth programs. The WIA figures include both older and younger youth. Labor market results are presented for participants who were not in secondary education at exit.
2001-02 2003-04 2005-06 2007-08
Figure 7 w Employment and Earnings of WIA Youth Participants in the Third Quarter After Leaving Program
PercentagewithemploymentreportedbyemployerstoESDthethirdquarterafterleavingprogram 47% 52% 52% 56% 59% 62% 49% 50%
Medianquarterlyhoursworkedofthoseworking 234 253 250 281 252 281 270 270 Percentageemployedfull-timeofthoseworking(averaging30ormorehours/week) 27% 29% 29% 32% 31% 35% 28% 28%
Medianannualizedearningsofthoseworking $8,699 $9,464 $9,433 $10,821 $9,648 $10,933 $10,097 $10,224
Sizeofhouseholdinwhichmedianearningswouldsupportatpovertylevel 0.8 0.9 0.9 1.0 0.9 1.0 0.9 0.9
Sizeofhouseholdinwhichmedianearningswouldsupportattwicepovertylevel* 0.4 0.4 0.4 0.5 0.4 0.5 0.5 0.5
Medianhourlywageofthoseworking $8.75 $8.83 $8.78 $8.95 $8.90 $9.06 $9.56 $9.59
Notes: Earnings and wages are expressed in first quarter 2009 dollars. Poverty levels are based on federal poverty guidelines identified by the U.S. Department of Health and Human Services for 2009..
All Not in high school All Not in high school All Not in high school All Not in high school
Workforce Investment Act / Title I-B A A N N U A L R E P O R T
40 > Section Three - WIA TITLE 1-B RESULTS
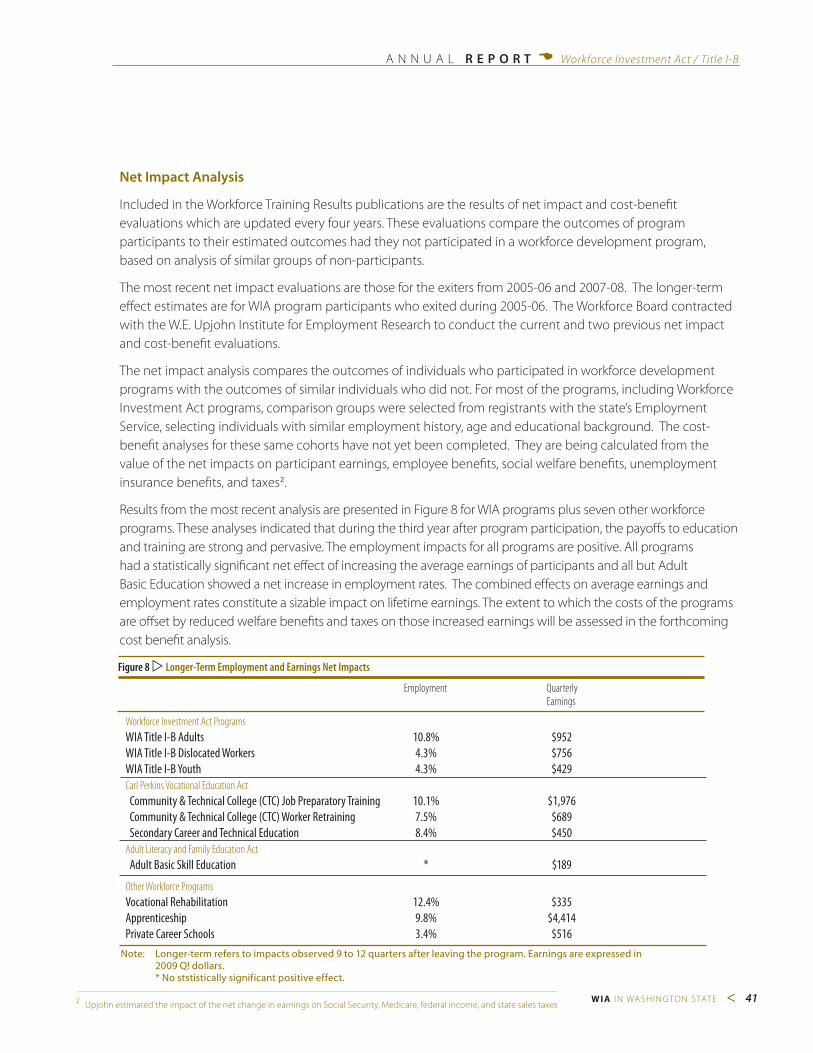
Figure 8 w Longer-Term Employment and Earnings Net Impacts
Employment Quarterly Earnings
WorkforceInvestmentActPrograms WIA Title I-B Adults 10.8% $952 WIA Title I-B Dislocated Workers 4.3% $756 WIA Title I-B Youth 4.3% $429 CarlPerkinsVocationalEducationAct Community & Technical College (CTC) Job Preparatory Training 10.1% $1,976 Community & Technical College (CTC) Worker Retraining 7.5% $689 Secondary Career and Technical Education 8.4% $450 AdultLiteracyandFamilyEducationAct Adult Basic Skill Education * $189
OtherWorkforceProgramsVocational Rehabilitation 12.4% $335 Apprenticeship 9.8% $4,414Private Career Schools 3.4% $516
Note: Longer-term refers to impacts observed 9 to 12 quarters after leaving the program. Earnings are expressed in 2009 Q! dollars. * No ststistically significant positive effect.
Net Impact Analysis
Included in the Workforce Training Results publications are the results of net impact and cost-benefit evaluations which are updated every four years. These evaluations compare the outcomes of program participants to their estimated outcomes had they not participated in a workforce development program, based on analysis of similar groups of non-participants.
The most recent net impact evaluations are those for the exiters from 2005-06 and 2007-08. The longer-term effect estimates are for WIA program participants who exited during 2005-06. The Workforce Board contracted with the W.E. Upjohn Institute for Employment Research to conduct the current and two previous net impact and cost-benefit evaluations.
The net impact analysis compares the outcomes of individuals who participated in workforce development programs with the outcomes of similar individuals who did not. For most of the programs, including Workforce Investment Act programs, comparison groups were selected from registrants with the state’s Employment Service, selecting individuals with similar employment history, age and educational background. The cost-benefit analyses for these same cohorts have not yet been completed. They are being calculated from the value of the net impacts on participant earnings, employee benefits, social welfare benefits, unemployment insurance benefits, and taxes2.
Results from the most recent analysis are presented in Figure 8 for WIA programs plus seven other workforce programs. These analyses indicated that during the third year after program participation, the payoffs to education and training are strong and pervasive. The employment impacts for all programs are positive. All programs had a statistically significant net effect of increasing the average earnings of participants and all but Adult Basic Education showed a net increase in employment rates. The combined effects on average earnings and employment rates constitute a sizable impact on lifetime earnings. The extent to which the costs of the programs are offset by reduced welfare benefits and taxes on those increased earnings will be assessed in the forthcoming cost benefit analysis.
2 Upjohn estimated the impact of the net change in earnings on Social Security, Medicare, federal income, and state sales taxes
All Not in high school All Not in high school All Not in high school All Not in high school
WIA IN WASHINGTON STATE < 41
A N N U A L R E P O R T D Workforce Investment Act / Title I-B
Tables
The following data tables make up the final portion of Washington’s Title I-B Annual Report. A few notes may help with interpretation. Table cells that are shaded are no longer reportable for waiver states. Federal deadlines and the need for prompt reporting mean that the year-long periods used for some measures are not the same year-long periods used for others. Finally, since these are outcome measures, they concentrate on participants who have left WIA programs and do not include those who are still participating at the end of the 12-month performance period.
Washington reports nine federal common measures: Adults – Entered Employment Rate, Employment Reten-tion Rate, and Average Earnings; Dislocated Workers – Entered Employment Rate, Employment Retention Rate, Average Earnings; Youth – Placement Rate, Attainment of Certificate Rate, and Literacy/Numeracy Gains Rate.Federal entered employment rates are calculated for participants who exited between October 2009 and September 2010. Federal retention rates and average earnings measures are calculated for participants who exited between April 2009 and March 2010.
Federal youth placement rate and attainment of degree/certificate rate measures are calculated for participants who exited between October 2009 and September 2010. Youth literacy and numeracy gains measure is a real-time measure and reflects functional gains in education during the period July 2010 to June 2011. Participant counts shown in Table M are based on a year that runs from July 2010 through June 2011.
The numerators and denominators shown to the right of each performance measure show the number of participants or dollars involved in the calculation of each measure. Denominators shown for a given population also change from measure to measure. Some of this occurs because of the different time periods covered by the measures. However, most measures also exclude at least some participants by design. Using adult program measures as an example, federal entered employment rates do not include participants who were employed at registration. Federal retention and earnings measures do not include participants unless they were employed during the quarter after exit.
Under the Common Measures waiver, Washington no longer conducts the standardized federal Customer Satisfaction survey. The most recent results for a similar survey with smaller samples show participant satisfaction at 74.4 percent in a sample of 620, and Employer Satisfaction at 68.3 percent in a sample of 982, for the year May 2010 through April 2011.
Washington has 13 additional measures of performance. Statewide performance on these measures is shown in a set of tables located between Tables M and N. Results for the first three are measured for WIA participants who exited between April 2009 and March 2010. Two of the measures – employment rates and median annualized earnings – are based on results in the third quarter after exit.
Credential rates are also measured. State credential rates are based on the percent of participants who receive credentials within three quarters after exit regardless of whether they received training. This provides incentives for program operators to increase the supply of occupational training in order to increase the percent of participants who obtain credentials. The state has also established participant satisfaction measures for each of the WIA programs. However, the current fiscal situation has delayed the updating of this measure, which is now underway.
Workforce Investment Act / Title I-B A A N N U A L R E P O R T
42 > Section Three - WIA TITLE 1-B RESULTS

The 13th additional state measure, employer satisfaction, is measured only once every two years. It is based on a biennial employer survey that measures employers’ workforce training needs and practices. Employers are asked if they hired new employees in the last 12 months who had recently completed a WorkSource or Workforce Investment Act training program. If employers answer yes, they are asked to report their satisfaction with the skills of their new employees on 12 dimensions, including basic skills like reading, writing, and math, occupation-specific skills, and skills like problem solving. Satisfaction on these measures is averaged across the dimensions. This measure is calculated at the state level only and is not calculated separately for workforce areas or for adults, youth, or dislocated workers. There are no new results since those reported last year from the 2010 employer survey.
Table O, attached to this report, has 12 sub-tables, one for each of Washington’s 12 local workforce investment areas. An additional Table O is supplied to describe results for participants in dislocated worker services funded by Washington’s statewide funds who did not receive services funded by any of the local programs. Participants who were co-enrolled in local programs are shown in the appropriate workforce investment area.
The U.S. Department of Labor collects tabular data through a web-based application. This allows the Department to compile and display results promptly. Washington submits its results electronically in cooperation with this effort.
The federal definitions for counting targets as not met, met, or exceeded are as follows:
A Standards that are "not met" are those where performance is below 90 percent of the negotiated performance level.
A Standards that are "exceeded" are those where performance is at or above 100 percent of the negotiated performance level.
A Standards that are "met" are those where performance ranges from 90 to 99.99 percent of the levels. For both state and federal measures, Table O shows regression-adjusted local targets, which were raised or lowered relative to prior years based on the estimated impact of changes in both the economic conditions and the demographic characteristics of exiting participants in each local area.
At the state level, performance exceeded negotiated federal targets in all nine measures.
Of the 108 Federal measures at the local level (nine measures for 12 local areas), 93 exceeded targets, eight met targets, and seven did not meet targets. Performance was strongest in Dislocated Worker programs, where only one target was not exceeded. The targets that were not met were scattered, and not concentrated in particular Adult and Youth program measures.
In accordance with federal regulations, the state conducted a data and reporting validation annual review with all 12 Workforce Development Areas during November, December 2010 and January 2011. A sample of 1,387 WIA records was reviewed: 320 Adult, 319 Dislocated Worker, 505 Youth and 243 National Emergency Grant. Data validation for Trade Adjustment Assistance was waived by DOL because the reporting software is in the process of being updated. Preparation for Data Validation for PY 2010 will begin in fall 2011.
WIA IN WASHINGTON STATE < 43
A N N U A L R E P O R T D Workforce Investment Act / Title I-B

Workforce Investment Act / Title I-B s A N N U A L R E P O R T
44 > Section Three - WIA TITLE 1-B RESULTS
Table B • Adult Program Results
Negotiated Actual Numerator PerformanceLevel PerformanceLevel Denominator
Entered Employment Rate 76.1% 2,004 2,635 Employment Retention Rate 84.3% 1,754 2,080
Average Earnings $12,918 $22,476,992 1,740 Employment and Credential Rate
Customer Negotiated Actual #of #of #of Response Satisfaction Performance Performance Completed Customers Customers Rate Level Level Surveys Eligiblefor Includedin theSurvey theSample AmericanCustomer SatisfactionIndex
Participants
Employers
numeratordenominator
numeratordenominator
numeratordenominator
numeratordenominator
Table A • Workforce Investment Act Customer Satisfaction Results
Table C • Outcomes for Adult Special Populations
Reported PublicAssistance Veterans Individualswith Older Information RecipientsReceiving Disabilities Individuals IntensiveorTraining Services Entered 897 172 110 135Employment Rate 73.9% 1,214 71.7% 240 63.2% 174 66.8% 202 Employment 645 161 93 115Retention Rate 79.9% 807 81.3% 198 75.6% 123 82.1% 140 Average Earnings $7,205,665 $2,422,432 $1,084,295 $1,405,091 $11,294 638 $15,629 155 $11,786 92 $12,434 113 Employment and Credential Rate
Shading within Tables A through O indicates Washington has a waiver to only report common measures and therefore entries are not required in these portions of the tables.

WIA IN WASHINGTON STATE < 45
A N N U A L R E P O R T s Workforce Investment Act / Title I-B
numeratordenominator
numeratordenominator
numeratordenominator
numeratordenominator
numeratordenominator
numeratordenominator
Table D • Other Outcome Information for the Adult Program
Table F • Outcomes for Dislocated Worker Special Populations
Reported Veterans Individualswith Older Displaced Information Disabilities Individuals Homemakers
Entered 334 116 402 66 Employment Rate 80.5% 415 78.4% 148 73.9% 544 76.7% 86 Employment 270 88 296 60Retention Rate 86.0% 314 86.3% 102 86.8% 341 84.5% 71 Average $5,187,107 $1,517,986 $5,189,214 $829,331Earnings $19,574 265 $17,448 87 $18,018 288 $14,056 59
Employment and Credential Rate
Table E • Dislocated Worker Program Results
Negotiated Actual Numerator PerformanceLevel PerformanceLevel Denominator Entered Employment Rate 73.6% 82.2% 2,722 3,311
Employment Retention Rate 83.9% 88.7% 2,094 2,360 Average Earnings $14,043 $18,725 $38,759,976 2,070
Employment and Credential Rate
Reported IndividualsWhoReceived IndividualsWhoReceived Information TrainingServices OnlyCoreand IntensiveServices
Entered Employment Rate 78.5% 1,080 73.3% 924 1,375 1,260 Employment Retention Rate 88.0% 920 80.6% 834 1,045 1,035 Average Earnings $14,159 $12,870,589 $11,560 $9,606,403 909 831

Workforce Investment Act / Title I-B s A N N U A L R E P O R T
46 > Section Three - WIA TITLE 1-B RESULTS
numeratordenominator
numeratordenominator
Table G • Other Outcome Information for the Dislocated Worker Program
Reported IndividualsWhoReceived IndividualsWhoReceived Information TrainingServices OnlyCoreandIntensiveServices
Entered Employment Rate 83.0% 1,885 80.5% 837 2,271 1,040 Employment Retention Rate 89.4% 1,253 87.7% 841 1,401 959 Average Earnings $18,389 $22,691,862 $19,220 $16,068,114 1,234 836
Table H1 • Youth (14-21) Program Results
Negotiated Actual Numerator PerformanceLevel PerformanceLevel Denominator Placement in Employment 53.9% 66.1% 1,302or Education 1,971 Attainment of Degree or Certificate 75.3% 76.6% 1,319 1,723
Literacy and Numeracy Gains 44.0% 56.6% 425 751
Table H2 • Older Youth (19-21) Program Results
Negotiated Actual Numerator PerformanceLevel PerformanceLevel Denominator Entered Employment Rate
Employment Retention Rate
Six Months Earnings Increase Credential Rate

WIA IN WASHINGTON STATE < 47
A N N U A L R E P O R T s Workforce Investment Act / Title I-B
numeratordenominator
numeratordenominator
numeratordenominator
numeratordenominator
numeratordenominator
numeratordenominator
numeratordenominator
Table I • Outcomes for Older Youth Special Populations
Reported PublicAssistance Veterans* Individualswith Out-of-School Information Recipients Disabilities Youth Entered Employment Rate Employment Retention Rate Six Months Earnings Increase Credential Rate
Table J • Younger Youth (14-18) Program Results
Negotiated Actual Numerator PerformanceLevel PerformanceLevel Denominator Skill Attainment Rate
Youth Diploma or Equivalent Rate
Retention Rate
Table K • Outcomes for Younger Youth Special Populations
Reported PublicAssistance Individualswith Out-of-School Information Recipients Disabilities Youth Skill Attainment Rate Youth Diploma or Equivalent Retention Rate

Workforce Investment Act / Title I-B s A N N U A L R E P O R T
48 > Section Three - WIA TITLE 1-B RESULTS
12MonthEmployment
RetentionRate
12MonthEarningsIncrease
(Adults&OlderYouth)or12MonthEarnings
Replacement(DislocatedWorkers)
PlacementsinNontraditionalEmployment
WagesatEntryintoEmploymentfor
thosewhoEnteredUnsubsidizedEmployment
EntryintoUnsubsidized
EmploymentRelatedtotheTraining
ReceivedofthosewhoCompleted
TrainingServices
TotalParticipantsServed TotalExiters
Table L • Other Reported Information
Table M * Participation Levels
Total Adult Customers 229,886 195,316 Total Adult (Self-Service Only) 216,178 188,441
WIA Adults 221,958 191,759
WIA Dislocated Workers 8,198 3,719
Total Youth (14-21) 4,074 2,031
Younger Youth (14-18) 2,985 1,406
Older Youth (19-21) 1,089 625
Out-of-School Youth 2,047 1,126
In-School Youth 2,027 905
Adults 83.8% 1,654 $4,071 $7,978,821 1.4% 28 $5,996 $11,938,890 65.0% 702 1,974 1,960 2,004 1,991 1,080
Dislocated 88.0% 1,930 90.2% $35,250,171 1.9% 51 $9,158 $24,709,079 66.3% 1,249Workers 2,192 $39,066,808 2,722 2,698 1,885 Older Youth
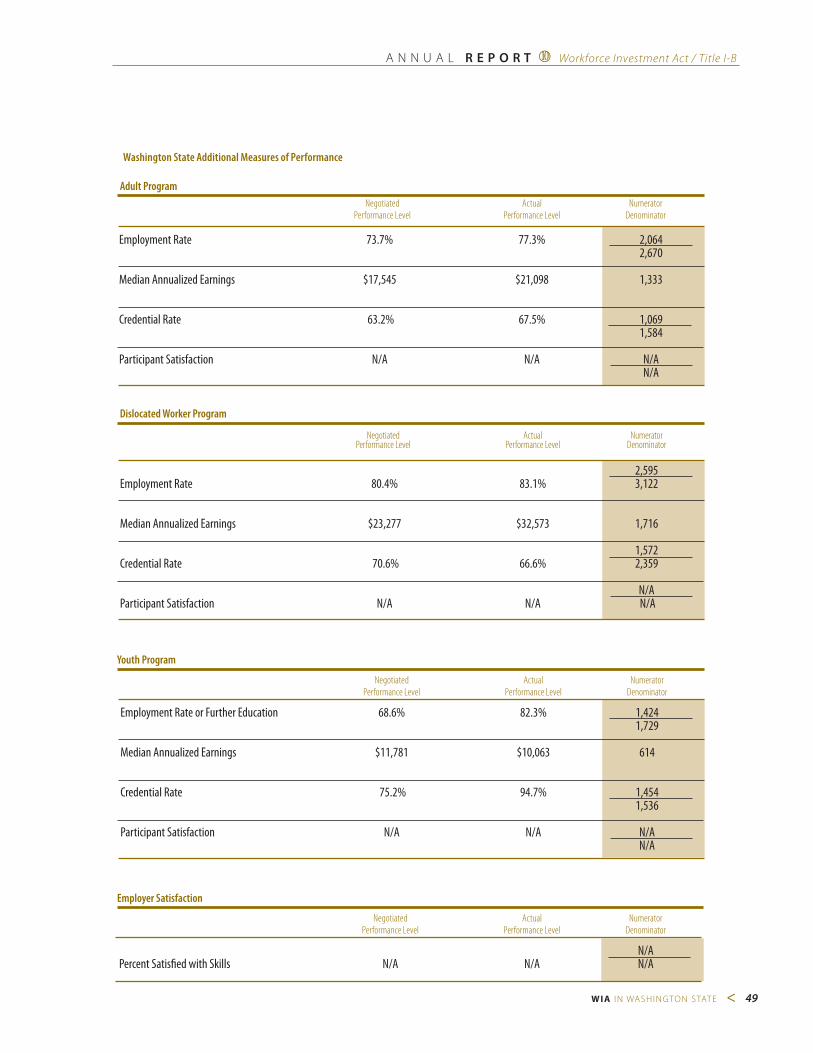
WIA IN WASHINGTON STATE < 49
A N N U A L R E P O R T s Workforce Investment Act / Title I-B
Washington State Additional Measures of Performance
Adult Program
Dislocated Worker Program
Youth Program
Employer Satisfaction
Negotiated Actual Numerator PerformanceLevel PerformanceLevel Denominator 2,595Employment Rate 80.4% 83.1% 3,122
Median Annualized Earnings $23,277 $32,573 1,716 1,572Credential Rate 70.6% 66.6% 2,359 N/AParticipant Satisfaction N/A N/A N/A
Negotiated Actual Numerator PerformanceLevel PerformanceLevel Denominator Employment Rate or Further Education 68.6% 82.3% 1,424 1,729 Median Annualized Earnings $11,781 $10,063 614 Credential Rate 75.2% 94.7% 1,454 1,536 Participant Satisfaction N/A N/A N/A N/A
Negotiated Actual Numerator PerformanceLevel PerformanceLevel Denominator N/APercent Satisfied with Skills N/A N/A N/A
Negotiated Actual Numerator PerformanceLevel PerformanceLevel Denominator Employment Rate 73.7% 77.3% 2,064 2,670 Median Annualized Earnings $17,545 $21,098 1,333 Credential Rate 63.2% 67.5% 1,069 1,584 Participant Satisfaction N/A N/A N/A N/A
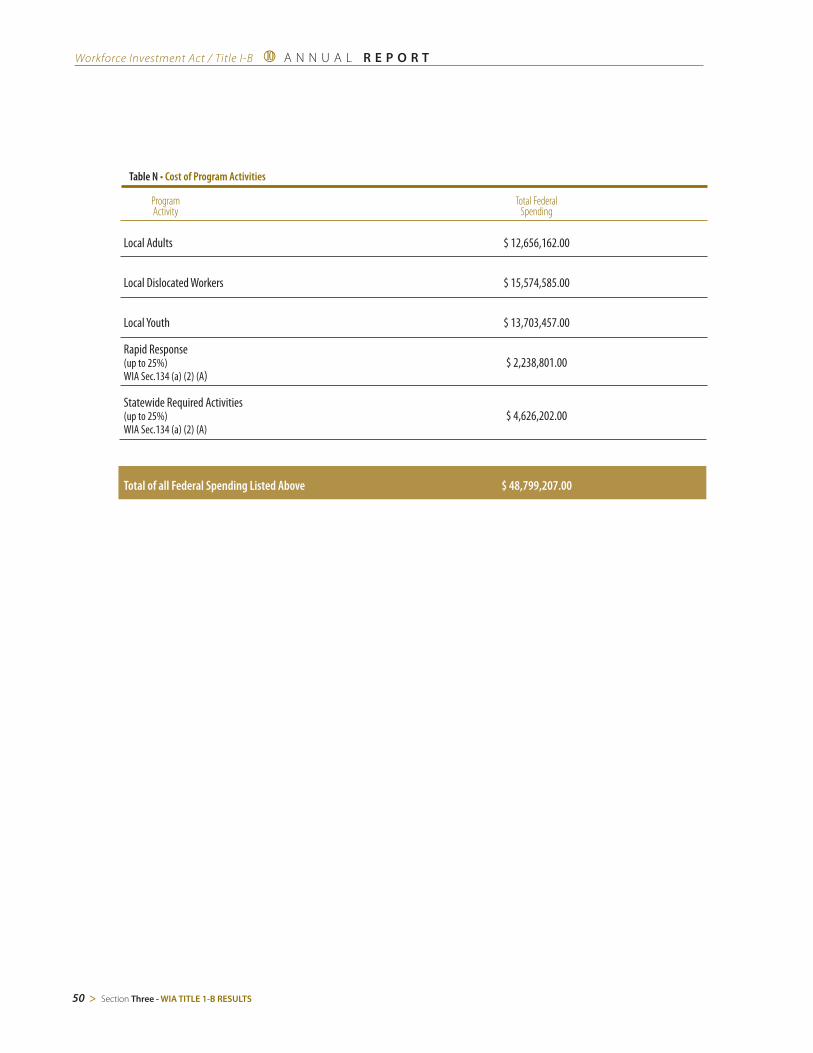
Workforce Investment Act / Title I-B s A N N U A L R E P O R T
50 > Section Three - WIA TITLE 1-B RESULTS
Program TotalFederal Activity Spending Local Adults $ 12,656,162.00 Local Dislocated Workers $ 15,574,585.00 Local Youth $ 13,703,457.00 Rapid Response (up to 25%) $ 2,238,801.00WIA Sec.134 (a) (2) (A)
Statewide Required Activities (up to 25%) $ 4,626,202.00WIA Sec.134 (a) (2) (A)
Total of all Federal Spending Listed Above $ 48,799,207.00
Table N • Cost of Program Activities

WIA IN WASHINGTON STATE < 51
A N N U A L R E P O R T s Workforce Investment Act / Title I-B
Table O • Local PerformanceLocalAreaName TotalParticipantsServed
Adults 1,104 Dislocated Workers 944 Older Youth 112 Younger Youth 307 Adults 857 Dislocated Workers 637 Older Youth 49 Younger Youth 127 Negotiated Actual PerformanceLevel PerformanceLevel
Customer Satisfaction Program Participants Employers
Entered Employment Rates Adults 67.9% 67.3% Dislocated Workers 70.3% 77.3% Older Youth
Retention Rates Adults 75.5% 79.4% Dislocated Workers 82.1% 85.5% Older Youth Younger Youth
Average Earnings(Adult/DW) Adults $6,336 $12,600Six Months Earnings Increase Dislocated Workers $8,730 $16,385(OlderYouth) Older Youth
Credential/Diploma Rates Adults Dislocated Workers Older Youth Younger Youth
Skill Attainment Rate Younger Youth Youth Placement Rate Youth (ages 14-21) 42.6% 80.6%Attainment Of Certificate Youth (ages 14-21) 80.6% 90.0%Literacy/Numeracy Gains Youth (ages 14-21) 59.2% 66.7%
ETAAssigned#53005
(Includes One Chart for Each Local Area in the State)
Southwest
Total Exiters
Other State Indicators of Performance
Customer Satisfaction Adults N/A N/A Dislocated Workers N/A N/A Youth N/A N/A
Employment in Q3 Adults 69.8% 68.3% Dislocated Workers 81.6% 77.5% Youth 56.2% 91.3%
Median Annualized Earnings Adults $14,316 $18,214 Dislocated Workers $18,689 $29,145 Youth $7,333 $10,571
Credential Rate Adults 62.9% 56.0% Dislocated Workers 73.3% 69.1% Youth 76.9% 95.6%

Workforce Investment Act / Title I-B s A N N U A L R E P O R T
52 > Section Three - WIA TITLE 1-B RESULTS
Table O – Local PerformanceLocalAreaName TotalParticipantsServed
Adults 318 Dislocated Workers 442 Older Youth 54 Younger Youth 104 Adults 204 Dislocated Workers 258 Older Youth 30 Younger Youth 55 Negotiated Actual PerformanceLevel PerformanceLevel
Customer Satisfaction Program Participants Employers
Entered Employment Rates Adults 77.5% 80.5% Dislocated Workers 77.4% 83.9% Older Youth
Retention Rates Adults 82.0% 86.8% Dislocated Workers 84.2% 85.0% Older Youth Younger Youth
Average Earnings(Adult/DW) Adults $9,721 $14,012Six Months Earnings Increase Dislocated Workers $14,926 $19,724(OlderYouth) Older Youth
Credential/Diploma Rates Adults Dislocated Workers Older Youth Younger Youth
Skill Attainment Rate Younger Youth Youth Placement Rate Youth (ages 14-21) 58.8% 75.4%Attainment Of Certificate Youth (ages 14-21) 66.5% 86.0%Literacy/Numeracy Gains Youth (ages 14-21) 34.6% 59.1%
ETAAssigned#53010
(Includes One Chart for Each Local Area in the State)
Olympic Consortium
TotalExiters
Other State Indicators of Performance
Customer Satisfaction Adults N/A N/A Dislocated Workers N/A N/A Youth N/A N/A
Employment in Q3 Adults 74.9% 81.5% Dislocated Workers 81.9% 77.2% Youth 68.8% 87.7%
Median Annualized Earnings Adults $20,914 $22,690 Dislocated Workers $22,286 $31,047 Youth $12,501 $10,281Credential Rate Adults 64.3% 68.1% Dislocated Workers 71.1% 65.4% Youth 75.9% 100.0%

WIA IN WASHINGTON STATE < 53
A N N U A L R E P O R T s Workforce Investment Act / Title I-B
Table O • Local PerformanceLocalAreaName TotalParticipantsServed
Adults 602 Dislocated Workers 1168 Older Youth 103 Younger Youth 206 Adults 388 Dislocated Workers 312 Older Youth 38 Younger Youth 99 Negotiated Actual PerformanceLevel PerformanceLevel
Customer Satisfaction Program Participants Employers
Entered Employment Rates Adults 75.4% 84.2% Dislocated Workers 72.2% 83.3% Older Youth
Retention Rates Adults 81.3% 87.5% Dislocated Workers 81.9% 90.1% Older Youth Younger Youth
Average Earnings(Adult/DW) Adults $9,735 $12,572Six Months Earnings Increase Dislocated Workers $13,165 $18,037(OlderYouth) Older Youth
Credential/Diploma Rates Adults Dislocated Workers Older Youth Younger Youth
Skill Attainment Rate Younger Youth Youth Placement Rate Youth (ages 14-21) 51.5% 84.7%Attainment Of Certificate Youth (ages 14-21) 72.1% 74.5%Literacy/Numeracy Gains Youth (ages 14-21) 49.3% 70.3%
ETAAssigned#53015
(Includes One Chart for Each Local Area in the State)
Pacific Mountain
TotalExiters
Other State Indicators of Performance
Customer Satisfaction Adults N/A N/A Dislocated Workers N/A N/A Youth N/A N/A
Employment in Q3 Adults 71.7% 80.3% Dislocated Workers 81.1% 88.1% Youth 64.1% 92.6%
Median Annualized Earnings Adults $17,330 $20,851 Dislocated Workers $26,409 $32,783 Youth $10,782 $15,541
Credential Rate Adults 62.6% 58.0% Dislocated Workers 70.5% 62.4% Youth 73.3% 95.8%

Workforce Investment Act / Title I-B s A N N U A L R E P O R T
54 > Section Three - WIA TITLE 1-B RESULTS
Table O – Local PerformanceLocalAreaName TotalParticipantsServed
Adults 245 Dislocated Workers 370 Older Youth 61 Younger Youth 165 Adults 140 Dislocated Workers 196 Older Youth 28 Younger Youth 69 Negotiated Actual PerformanceLevel PerformanceLevel
Customer Satisfaction Program Participants Employers
Entered Employment Rates Adults 73.7% 82.2% Dislocated Workers 72.0% 85.6% Older Youth
Retention Rates Adults 83.7% 87.0% Dislocated Workers 84.2% 88.4% Older Youth Younger Youth
Average Earnings(Adult/DW) Adults $10,267 $15,386Six Months Earnings Increase Dislocated Workers $16,298 $17,968(OlderYouth) Older Youth
Credential/Diploma Rates Adults Dislocated Workers Older Youth Younger Youth
Skill Attainment Rate Younger Youth Youth Placement Rate Youth (ages 14-21) 55.0% 82.3%Attainment Of Certificate Youth (ages 14-21) 75.6% 77.0%Literacy/Numeracy Gains Youth (ages 14-21) 33.4% 54.5%
ETAAssigned#53020
(Includes One Chart for Each Local Area in the State)
Northwest
TotalExiters
Other State Indicators of Performance
Customer Satisfaction Adults N/A N/A Dislocated Workers N/A N/A Youth N/A N/A
Employment in Q3 Adults 75.4% 83.3% Dislocated Workers 80.7% 85.0% Youth 81.8% 95.4%
Median Annualized Earnings Adults $20,807 $25,757 Dislocated Workers $25,926 $32,012 Youth $13,695 $11,238
Credential Rate Adults 67.2% 83.8% Dislocated Workers 71.2% 61.5% Youth 74.5% 94.6%

WIA IN WASHINGTON STATE < 55
A N N U A L R E P O R T s Workforce Investment Act / Title I-B
Table O – Local PerformanceLocalAreaName TotalParticipantsServed
Adults 974 Dislocated Workers 1,786 Older Youth 195 Younger Youth 567 Adults 517 Dislocated Workers 796 Older Youth 76 Younger Youth 228 Negotiated Actual PerformanceLevel PerformanceLevel
Customer Satisfaction Program Participants Employers
Entered Employment Rates Adults 71.4% 77.2% Dislocated Workers 67.6% 81.1% Older Youth
Retention Rates Adults 81.9% 88.1% Dislocated Workers 83.7% 90.1% Older Youth Younger Youth
Average Earnings(Adult/DW) Adults $10,744 $14,068Six Months Earnings Increase Dislocated Workers $16,234 $24,219(OlderYouth) Older Youth
Credential/Diploma Rates Adults Dislocated Workers Older Youth Younger Youth
Skill Attainment Rate Younger Youth Youth Placement Rate Youth (ages 14-21) 55.0% 76.1% Attainment Of Certificate Youth (ages 14-21) 75.8% 80.4%Literacy/Numeracy Gains Youth (ages 14-21) 40.2% 39.3%
ETAAssigned#53025
(Includes One Chart for Each Local Area in the State)
Seattle-King County
TotalExiters
Other State Indicators of Performance
Customer Satisfaction Adults N/A N/A Dislocated Workers N/A N/A Youth N/A N/A
Employment in Q3 Adults 70.7% 84.2% Dislocated Workers 78.4% 85.3% Youth 72.5% 84.7%
Median Annualized Earnings Adults $20,112 $24,975 Dislocated Workers $26,632 $40,754 Youth $10,051 $9,835
Credential Rate Adults 58.9% 67.4% Dislocated Workers 68.2% 64.8% Youth 69.7% 94.8%

Workforce Investment Act / Title I-B s A N N U A L R E P O R T
56 > Section Three - WIA TITLE 1-B RESULTS
Table O • Local PerformanceLocalAreaName TotalParticipantsServed
Adults 609 Dislocated Workers 997 Older Youth 17 Younger Youth 411 Adults 153 Dislocated Workers 355 Older Youth 40 Younger Youth 157 Negotiated Actual PerformanceLevel PerformanceLevel
Customer Satisfaction Program Participants Employers
Entered Employment Rates Adults 70.7% 74.4% Dislocated Workers 71.1% 89.6% Older Youth
Retention Rates Adults 80.9% 88.5% Dislocated Workers 83.5% 93.2% Older Youth Younger Youth
Average Earnings(Adult/DW) Adults $9,616 $14,024Six Months Earnings Increase Dislocated Workers $15,913 $19,864(OlderYouth) Older Youth
Credential/Diploma Rates Adults Dislocated Workers Older Youth Younger Youth
Skill Attainment Rate Younger Youth Youth Placement Rate Youth (ages 14-21) 47.1% 44.3%Attainment Of Certificate Youth (ages 14-21) 77.7% 59.6%Literacy/Numeracy Gains Youth (ages 14-21) 47.6% 71.1%
ETAAssigned#53030
(Includes One Chart for Each Local Area in the State)
Snohomish
TotalExiters
Other State Indicators of Performance
Customer Satisfaction Adults N/A N/A Dislocated Workers N/A N/A Youth N/A N/A
Employment in Q3 Adults 70.0% 71.4% Dislocated Workers 78.6% 88.7% Youth 61.6% 63.6%
Median Annualized Earnings Adults $17,142 $24,634 Dislocated Workers $21,912 $38,068 Youth $7,845 $9,298
Credential Rate Adults 63.9% 21.4% Dislocated Workers 74.2% 20.8% Youth 77.3% 96.9%

WIA IN WASHINGTON STATE < 57
A N N U A L R E P O R T s Workforce Investment Act / Title I-B
Table O – Local PerformanceLocalAreaName TotalParticipantsServed
Adults 513 Dislocated Workers 570 Older Youth 140 Younger Youth 200 Adults 245 Dislocated Workers 285 Older Youth 107 Younger Youth 127 NegotiatedActual PerformanceLevelPerformanceLevel
Customer Satisfaction Program Participants Employers
Entered Employment Rates Adults 77.8% 81.4% Dislocated Workers 73.5% 85.5% Older Youth
Retention Rates Adults 81.6% 82.0% Dislocated Workers 84.1% 87.9% Older Youth Younger Youth
Average Earnings(Adult/DW) Adults $8,943 $11,546Six Months Earnings Increase Dislocated Workers $10,916 $16,820(OlderYouth) Older Youth
Credential/Diploma Rates Adults Dislocated Workers Older Youth Younger Youth
Skill Attainment Rate Younger Youth Youth Placement Rate Youth (ages 14-21) 59.1% 65.2%Attainment Of Certificate Youth (ages 14-21) 73.5% 75.4%Literacy/Numeracy Gains Youth (ages 14-21) 37.6% 71.1%
ETAAssigned#53035
(Includes One Chart for Each Local Area in the State)
Spokane
TotalExiters
Other State Indicators of Performance
Customer Satisfaction Adults N/A N/A Dislocated Workers N/A N/A Youth N/A N/A
Employment in Q3 Adults 72.9% 78.9% Dislocated Workers 80.3% 83.4% Youth 69.4% 75.9%
Median Annualized Earnings Adults $16,324 $18,540 Dislocated Workers $21,005 $30,760 Youth $13,760 $11,321
Credential Rate Adults 63.6% 67.4% Dislocated Workers 71.1% 65.4% Youth 78.2% 86.8%

Workforce Investment Act / Title I-B s A N N U A L R E P O R T
58 > Section Three - WIA TITLE 1-B RESULTS
Table O • Local PerformanceLocalAreaName TotalParticipantsServed
Adults 355 Dislocated Workers 527 Older Youth 133 Younger Youth 222 Adults 158 Dislocated Workers 211 Older Youth 79 Younger Youth 127 Negotiated Actual PerformanceLevel PerformanceLevel
Customer Satisfaction Program Participants Employers
Entered Employment Rates Adults 73.2% 84.0% Dislocated Workers 74.4% 87.1% Older Youth
Retention Rates Adults 80.9% 84.5% Dislocated Workers 84.1% 90.5% Older Youth Younger Youth
Average Earnings(Adult/DW) Adults $9,461 $12,819Six Months Earnings Increase Dislocated Workers $13,763 $17,674(OlderYouth) Older Youth
Credential/Diploma Rates Adults Dislocated Workers Older Youth Younger Youth
Skill Attainment Rate Younger Youth Youth Placement Rate Youth (ages 14-21) 55.9% 60.4%Attainment Of Certificate Youth (ages 14-21) 75.5% 69.3%Literacy/Numeracy Gains Youth (ages 14-21) 43.8% 38.9%
ETAAssigned#53040
(Includes One Chart for Each Local Area in the State)
Pierce
TotalExiters
Other State Indicators of Performance
Customer Satisfaction Adults N/A N/A Dislocated Workers N/A N/A Youth N/A N/A
Employment in Q3 Adults 75.8% 81.9% Dislocated Workers 81.7% 88.1% Youth 68.9% 83.5%
Median Annualized Earnings Adults $18,735 $19,349 Dislocated Workers $20,305 $32,743 Youth $12,515 $7,503
Credential Rate Adults 58.3% 84.4% Dislocated Workers 75.7% 83.2% Youth 73.7% 99.2%

WIA IN WASHINGTON STATE < 59
A N N U A L R E P O R T s Workforce Investment Act / Title I-B
Table O•Local PerformanceLocalAreaName TotalParticipantsServed
Adults 375 Dislocated Workers 363 Older Youth 73 Younger Youth 244 Adults 228 Dislocated Workers 182 Older Youth 52 Younger Youth 129 Negotiated Actual PerformanceLevel PerformanceLevel
Customer Satisfaction Program Participants Employers
Entered Employment Rates Adults 78.6% 68.8% Dislocated Workers 76.9% 83.9% Older Youth
Retention Rates Adults 85.8% 87.8% Dislocated Workers 83.5% 91.8% Older Youth Younger Youth
Average Earnings(Adult/DW) Adults $9,976 $12,184Six Months Earnings Increase Dislocated Workers $12,502 $15,778(OlderYouth) Older Youth
Credential/Diploma Rates Adults Dislocated Workers Older Youth Younger Youth
Skill Attainment Rate Younger Youth Youth Placement Rate Youth (ages 14-21) 53.2% 52.1% Attainment Of Certificate Youth (ages 14-21) 73.6% 83.1%Literacy/Numeracy Gains Youth (ages 14-21) 46.1% 59.1%
ETAAssigned#53045
(Includes One Chart for Each Local Area in the State)
North Central
TotalExiters
Other State Indicators of Performance
Customer Satisfaction Adults N/A N/A Dislocated Workers N/A N/A Youth N/A N/A
Employment in Q3 Adults 76.6% 78.7% Dislocated Workers 83.7% 82.4% Youth 50.9% 71.5%
Median Annualized Earnings Adults $17,441 $19,954 Dislocated Workers $20,210 $27,164 Youth $12,400 $6,021
Credential Rate Adults 62.8% 75.9% Dislocated Workers 70.5% 76.2% Youth 72.5% 96.7%

Workforce Investment Act / Title I-B s A N N U A L R E P O R T
60 > Section Three - WIA TITLE 1-B RESULTS
Table O • Local PerformanceLocalAreaName TotalParticipantsServed
Adults 232 Dislocated Workers 617 Older Youth 55 Younger Youth 187 Adults 147 Dislocated Workers 236 Older Youth 32 Younger Youth 81 Negotiated Actual PerformanceLevel PerformanceLevel
Customer Satisfaction Program Participants Employers
Entered Employment Rates Adults 82.9% 86.4% Dislocated Workers 76.2% 78.7% Older Youth
Retention Rates Adults 82.6% 92.0% Dislocated Workers 85.8% 88.6% Older Youth Younger Youth
Average Earnings(Adult/DW) Adults $8,973 $10,546Six Months Earnings Increase Dislocated Workers $13,044 $14,616(OlderYouth) Older Youth
Credential/Diploma Rates Adults Dislocated Workers Older Youth Younger Youth
Skill Attainment Rate Younger Youth Youth Placement Rate Youth (ages 14-21) 52.0% 63.4%Attainment Of Certificate Youth (ages 14-21) 72.6% 85.0%Literacy/Numeracy Gains Youth (ages 14-21) 51.8% 63.8%
ETAAssigned#53050
(Includes One Chart for Each Local Area in the State)
South Central
TotalExiters
Other State Indicators of Performance
Customer Satisfaction Adults N/A N/A Dislocated Workers N/A N/A Youth N/A N/A
Employment in Q3 Adults 73.0% 83.2% Dislocated Workers 82.0% 78.2% Youth 71.5% 89.3%
Median Annualized Earnings Adults $14,398 $19,937 Dislocated Workers $24,964 $24,963 Youth $13,303 $12,236
Credential Rate Adults 64.1% 67.0% Dislocated Workers 65.5% 68.8% Youth 78.9% 93.8%
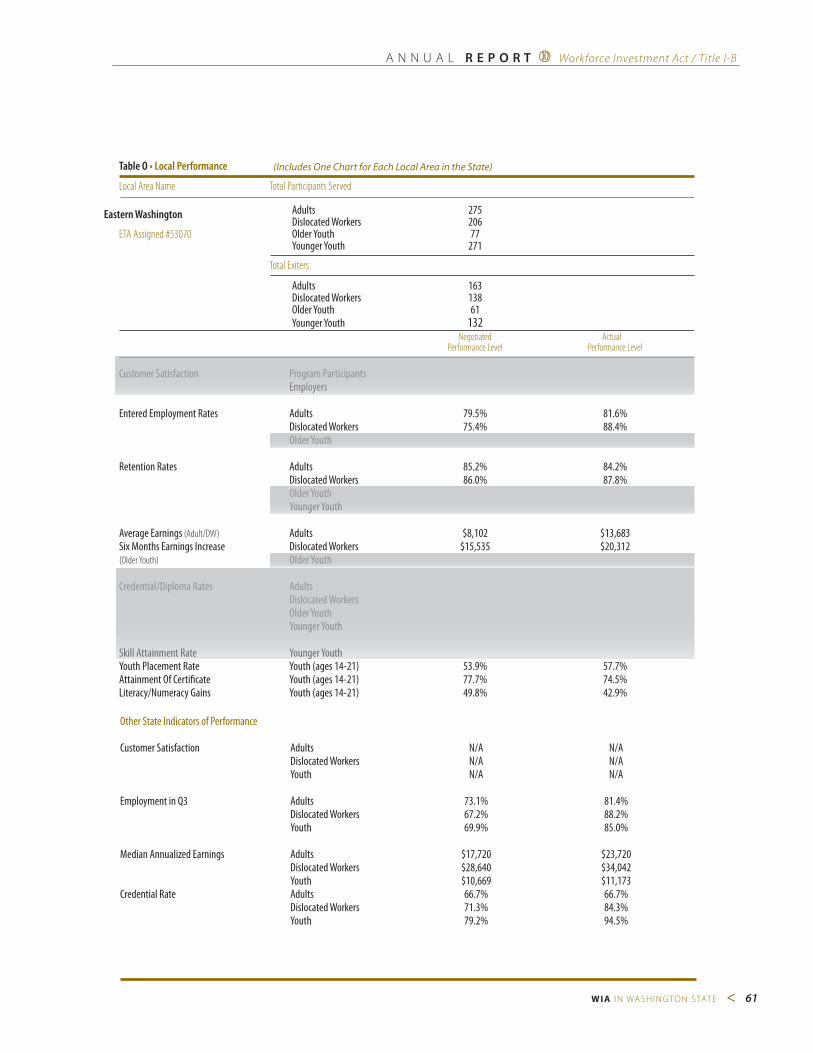
WIA IN WASHINGTON STATE < 61
A N N U A L R E P O R T s Workforce Investment Act / Title I-B
Table O • Local PerformanceLocalAreaName TotalParticipantsServed
Adults 275 Dislocated Workers 206 Older Youth 77 Younger Youth 271 Adults 163 Dislocated Workers 138 Older Youth 61 Younger Youth 132 NegotiatedActual PerformanceLevel PerformanceLevel
Customer Satisfaction Program Participants Employers
Entered Employment Rates Adults 79.5% 81.6% Dislocated Workers 75.4% 88.4% Older Youth
Retention Rates Adults 85.2% 84.2% Dislocated Workers 86.0% 87.8% Older Youth Younger Youth
Average Earnings(Adult/DW) Adults $8,102 $13,683Six Months Earnings Increase Dislocated Workers $15,535 $20,312(OlderYouth) Older Youth
Credential/Diploma Rates Adults Dislocated Workers Older Youth Younger Youth
Skill Attainment Rate Younger Youth Youth Placement Rate Youth (ages 14-21) 53.9% 57.7%Attainment Of Certificate Youth (ages 14-21) 77.7% 74.5%Literacy/Numeracy Gains Youth (ages 14-21) 49.8% 42.9%
ETAAssigned#53070
(Includes One Chart for Each Local Area in the State)
Eastern Washington
TotalExiters
Other State Indicators of Performance
Customer Satisfaction Adults N/A N/A Dislocated Workers N/A N/A Youth N/A N/A
Employment in Q3 Adults 73.1% 81.4% Dislocated Workers 67.2% 88.2% Youth 69.9% 85.0%
Median Annualized Earnings Adults $17,720 $23,720 Dislocated Workers $28,640 $34,042 Youth $10,669 $11,173Credential Rate Adults 66.7% 66.7% Dislocated Workers 71.3% 84.3% Youth 79.2% 94.5%
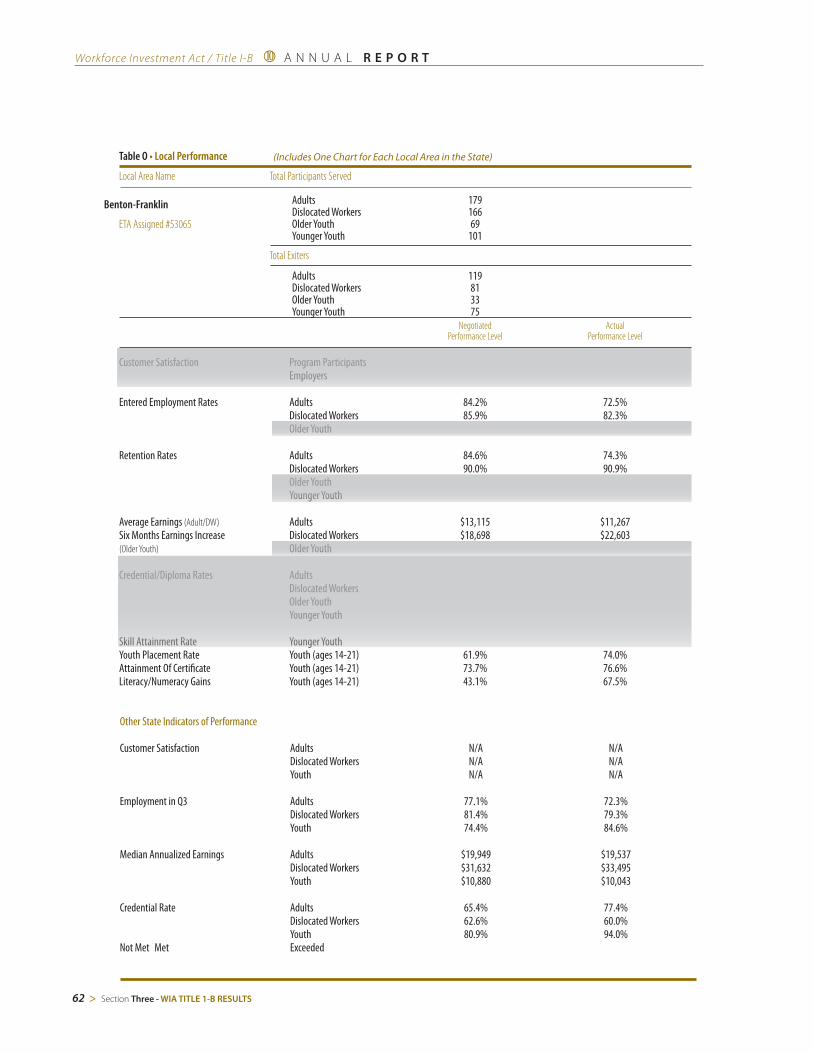
Workforce Investment Act / Title I-B s A N N U A L R E P O R T
62 > Section Three - WIA TITLE 1-B RESULTS
Table O • Local PerformanceLocalAreaName TotalParticipantsServed
Adults 179 Dislocated Workers 166 Older Youth 69 Younger Youth 101 Adults 119 Dislocated Workers 81 Older Youth 33 Younger Youth 75 Negotiated Actual PerformanceLevel PerformanceLevel
Customer Satisfaction Program Participants Employers
Entered Employment Rates Adults 84.2% 72.5% Dislocated Workers 85.9% 82.3% Older Youth
Retention Rates Adults 84.6% 74.3% Dislocated Workers 90.0% 90.9% Older Youth Younger Youth
Average Earnings(Adult/DW) Adults $13,115 $11,267Six Months Earnings Increase Dislocated Workers $18,698 $22,603(OlderYouth) Older Youth
Credential/Diploma Rates Adults Dislocated Workers Older Youth Younger Youth
Skill Attainment Rate Younger Youth Youth Placement Rate Youth (ages 14-21) 61.9% 74.0%Attainment Of Certificate Youth (ages 14-21) 73.7% 76.6%Literacy/Numeracy Gains Youth (ages 14-21) 43.1% 67.5%
ETAAssigned#53065
(Includes One Chart for Each Local Area in the State)
Benton-Franklin
TotalExiters
Other State Indicators of Performance
Customer Satisfaction Adults N/A N/A Dislocated Workers N/A N/A Youth N/A N/A
Employment in Q3 Adults 77.1% 72.3% Dislocated Workers 81.4% 79.3% Youth 74.4% 84.6%
Median Annualized Earnings Adults $19,949 $19,537 Dislocated Workers $31,632 $33,495 Youth $10,880 $10,043
Credential Rate Adults 65.4% 77.4% Dislocated Workers 62.6% 60.0% Youth 80.9% 94.0%Not Met Met Exceeded

WIA IN WASHINGTON STATE < 63
A N N U A L R E P O R T s Workforce Investment Act / Title I-B
Table O • Local PerformanceLocalAreaName TotalParticipantsServed
Adults Dislocated Workers 128 Older Youth Younger Youth Adults Dislocated Workers 101 Older Youth Younger Youth Negotiated Actual PerformanceLevel PerformanceLevel
Customer Satisfaction Program Participants Employers
Entered Employment Rates Adults Dislocated Workers N/A 89.7% Older Youth
Retention Rates Adults Dislocated Workers N/A 83.3% Older Youth Younger Youth
Average Earnings(Adult/DW) Adults Six Months Earnings Increase Dislocated Workers N/A $16,419(OlderYouth) Older Youth
Credential/Diploma Rates Adults Dislocated Workers N/A 69.2% Older Youth Younger Youth
Skill Attainment Rate Younger Youth Youth Placement Rate Youth (ages 14-21) Attainment Of Certificate Youth (ages 14-21) Literacy/Numeracy Gains Youth (ages 14-21)
ETAAssigned#53888 Statewide Programs
TotalExiters
Other State Indicators of Performance
Customer Satisfaction Adults N/A N/A Dislocated Workers N/A N/A Youth N/A N/A
Employment in Q3 Adults N/A N/A Dislocated Workers N/A N/A Youth N/A N/A
Median Annualized Earnings Adults N/A N/A Dislocated Workers N/A N/A Youth N/A N/A
Credential Rate Adults N/A N/A Dislocated Workers N/A N/A Youth N/A N/A