W WWW and Financial Plan - Washington, D.C.
276
Submitted to the Council of the District of Columbia by Muriel Bowser, Mayor Government of the District of Columbia March 24, 2016 GOVERNMENT OF THE DISTRICT OF COLUMBIA MURIEL BOWSER, MAYOR FY 2017 Proposed Budget and Financial Plan VOLUME 1 EXECUTIVE SUMMARY A Fair Shot
Transcript of W WWW and Financial Plan - Washington, D.C.

WWWW
Office of the Chief Financial Officer | Office of Budget and Planning1350 Pennsylvania Avenue, Suite 229, Washington, DC 20004 | 202.727.6234 | fax 202.727.1400www.cfo.dc.gov | www.dc.gov
Submitted to the Council of the District of Columbiaby Muriel Bowser, Mayor
Government of the District of Columbia
March 24, 2016
GOVERNMENT OF THE DISTRICT OF COLUMBIA
GOVERNMENT OF THE DISTRICT OF COLUMBIA
MURIEL BOWSER, MAYOR
FY 2017 Proposed Budget and Financial Plan
VOLUME 1 EXECUTIVE SUMMARY
FY 2017 Proposed Budget and Financial Plan
VO
LUM
E 1 – EX
EC
UT
IVE SU
MM
AR
Y
A Fair Shot
165073_FY17 Budget Cover_Vol1.indd All Pages 3/15/16 10:53 AM

Government of the District of Columbia
FY 2017 Proposed Budget and Financial Plan
A Fair Shot
Volume 1 Executive Summary
Submitted to the
Council of the District of Columbia
byMuriel Bowser, Mayor
March 24, 2016


The Government Finance Officers Association of the United States and Canada (GFOA) presented a Distinguished
Budget Presentation Award to District of Columbia Government, District of Columbia, for its annual budget for the
fiscal year beginning October 1, 2015. In order to receive this award, a governmental unit must publish a budget
document that meets program criteria as a policy document, as an operations guide, as a financial plan, and as a
communications device. This award is the sixteenth in the history of the District of Columbia.
This award is valid for a period of one year only. We believe our current budget continues to conform to
program requirements, and we are submitting it to GFOA to determine its eligibility for another award.


Government of the District of Columbia
Muriel Bowser, Mayor
Rashad M. YoungCity Administrator
Members of the Council
Phil MendelsonChairman
Vincent Orange ...........................................................At-LargeAnita Bonds...................................................................At-LargeDavid Grosso ................................................................At-LargeElissa Silverman...........................................................At-LargeBrianne Nadeau .............................................................Ward 1Jack Evans ......................................................................Ward 2Mary M. Cheh ................................................................Ward 3Brandon Todd .................................................................Ward 4Kenyan R. McDuffie .....................................................Ward 5Charles Allen....................................................................Ward 6Yvette M. Alexander.......................................................Ward 7LaRuby May....................................................................Ward 8
Jennifer BudoffBudget Director
Jeffrey S. DeWittChief Financial Officer
Kevin DonahueDeputy City Administrator
and Deputy Mayor for Public Safety and Justice
Brenda DonaldDeputy Mayor for Health and
Human Services
Jennifer C. NilesDeputy Mayor for Education
Brian KennerDeputy Mayor for Planning and
Economic Development
Courtney SnowdenDeputy Mayor for Greater Economic Opportunity
John FalcicchioChief of Staff


Delicia V. MooreHuman Support Services
George DinesGovernment Services
Mohamed MohamedGovernment Operations
Cyril Byron, Jr.Economic Development and Regulation
Angelique Hayes RicePublic Safety and Justice
Deloras ShepherdEducation
Jeffrey Barnette
Deputy Chief Financial Officer
Office of Finance and Treasury
Fitzroy Lee
Deputy Chief Financial Officer
Office of Revenue Analysis
Stephen Cordi
Deputy Chief Financial Officer
Office of Tax and Revenue
Bill Slack
Deputy Chief Financial Officer
Office of Financial Operations and Systems
Associate Chief Financial Officers
Angell JacobsDeputy Chief Financial Officer and Chief of Staff
Office of the CIORichard Weil, Acting Chief Information Officer
Sandra M. Pinder, DirectorNarayan Ayyagari, IT Manager
Patricia Gracyalny
Assistant General Counsel
David Tseng
General Counsel
Office of the Chief Financial Officer


Office of Budget and Planning
Gordon McDonaldDeputy Chief Financial Officer
Lakeia Williams, Executive Assistant
James SpauldingAssociate Deputy Chief Financial Officer
Budget AdministrationEric Cannady, Director
Sunday Okparaocha, Deputy Director
Stacy-Ann White, Deputy Director
Renee Waddy, Executive Assistant
Team Leader
Randall Myers
Budget Administration Analysts
Alex Akporji
Joshua Agbebakun
Ernest Chukwuma
Rasheed Dawodu
Michelle Duong
Lee Hayward
Cynthia Holman
Benjamin Iyun
Melissa Lavasani
Robin Moore
SebleWengel Mulaw
Oluwatosin Onifade
William Powell
Charles Pryor
Naila Tengra
Linda W. Williams
Financial Planning and AnalysisLeticia Stephenson, Director
Tayloria Stroman, Budget Controller
Financial Systems and Cost Analysts
Robert Johnson
Darryl Miller
Carlotta Osorio
Duane Smith
Sue Taing
Capital Improvements Program
David Clark, Director
Sherrie Greenfield, Capital Budget Controller
CIP Analysts
Omar Herzi
Bharat Kothari
Alex Tessema
Operations Margaret Myers, Office and Production Manager
Sharon Nelson, Staff Assistant
Haroun Dumbuya, Intern
Office of the Chief Financial Officer


Office of Budget and Finance
Matthew BrownDirector
Justin ConstantinoDeputy Director and
General Counsel
Chris Murray Senior Budget Analyst
Tim HattonBudget Analyst
Tynekia GarrettCapital City Fellow
John McGaw Director
Capital Improvements Program
Deborah KellyBudget Analyst
Anthony GamblinBudget Analyst
Office of the City Administrator


District of Columbia
Organization Chart


• Alcoholic Beverage Regulation Administration • Board of Ethics and Government Accountability• Contract Appeals Board• Criminal Justice Coordinating Council• DC Housing Authority• DC Public Library• DC Retirement Board • DC Water (Water and Sewer Authority)• Health Benefit Exchange Authority• Housing Finance Agency• New Columbia Statehood Commission• Not-for-Profit Hospital Corporation• Office of Administrative Hearings• Office of Employee Appeals• Office of the People’s Counsel• Office of the Statehood Delegation• Office of the Tenant Advocate• Office of Zoning• Public Charter School Board• Public Employee Relations Board• Real Property Tax Appeals Commission• State Board of Education• University of the District of Columbia
(including UDC Community College)• Washington Convention and Sports Authority
INDEPENDENT AGENCIES
• Metropolitan Washington Council of Governments • National Capital Planning Commission • Washington Metropolitan Area Transit Authority• Washington Metropolitan Area Transit Commission• Washington Metropolitan Airports Authority
CHARTER INDEPENDENT AGENCIES
MAYOR
City Administrator
Advisory Neighborhood Commissions
DC Auditor
Commission on Judicial Disabilities and Tenure
Joint Committee onJudicial Administration
Council of theDistrict of Columbia
Judicial Nomination Commission
DC Court of Appeals
Sentencing and Criminal Code Revision Commission
GOVERNMENT OF THE DISTRICT OF COLUMBIA
Mayor’s Office of Legal Counsel
Office of the GeneralCounsel:
Office of Partnerships and Grants
Office of Communications:Mayor’s Correspondence
Unit
Office of Talent and Appointments
Office of Scheduling and Advance
Office of CommunityAffairs:
Clean City OfficeOffice of Community
Relations and ServicesYouth Advisory Council
ServeDCOffice of African Affairs
Office of Asian andPacific Islander AffairsOffice of LGBT AffairsOffice of Latino Affairs
Office of Religious AffairsOffice of Veteran Affairs
Office of ReturningCitizens Affairs
Office on Women’sPolicy and Initiatives
Deputy Mayor forEducation
Deputy Mayor forPlanning and Economic
Development
Deputy City Administrator/ Deputy Mayor for Public Safety
and Justice
Deputy Mayor forHealth and Human
Services
Department of Housing and Community Development
Department of Consumer and Regulatory Affairs
Department of Transportation
Office of Planning
Department of the Environment
Department of Insurance,Securities, and Banking
Office of Film, Television, and Entertainment
Commission on theArts and Humanities
Taxicab Commission
Department of HumanResources
Department of Public Works
Department of General Services
Office of the ChiefTechnology Officer
Office of Contracting andProcurement
Department of Motor Vehicles
Office of Risk Management
Office of Human Rights
Metropolitan PoliceDepartment
Fire and Emergency Medical Services
Department
Homeland Security and Emergency Management
Agency
Department of Corrections
Department of Forensic Sciences
Office of Unified Communications
Office of the Chief Medical Examiner
Justice Grants Administration:
Office of Victim Services
Corrections Information Council
Department of Health
Department of Human Services
Child and Family Services Agency
Department of DisabilityServices
Department of Behavioral Health
Department of YouthRehabilitation Services
Department of Health Care Finance
Office on Aging
Office of Disability Rights
Deputy Mayor for Greater Economic Opportunity
Office of Policy andLegislative Affairs
Office of Federal and Regional Affairs
Office of the Secretary
EOM/Office of theChief of Staff
Office of Budget and Finance
New Columbia Statehood Commission*
Office of the Statehood Delegation
Office of theAttorney General
Office of theInspector General
DC Superior Court
Public CharterSchool Board
Public Charter SchoolsUniversity of the District of Columbia (including UDC
Community College)
Office of theChief Financial Officer
Office of Budget and Planning
Office of Tax and RevenueOffice of Finance and
Treasury
Office of Revenue AnalysisOffice of Financial
Operations and SystemsLottery and Charitable Games Control Board
DC Public Schools
Office of the State Superintendent of
Education
Department of Parks and Recreation
• Board of Elections (including the Office of Campaign Finance)
• Public Service Commission• Zoning Commission
REGIONAL BODIES
EOM/Office of theSenior Advisor
RESIDENTS
EXECUTIVE BRANCH
JUDICIAL BRANCH
LEGISLATIVE BRANCH
NOTE: Agencies enclosed within dashed boxes are independent agencies.* The New Columbia
Statehood Commission is co-chaired by the Mayor and the
Council Chairman.
Department of Small and Local Business Development
Department of Employment Services
Office of African-American Affairs
Commission on Fathers, Men, and Boys


Transmittal Letters


Table of Contents


Government of the District of Columbia
FY 2017 Proposed Budget and
Financial Plan
Table of Contents
Volume 1 - Executive Summary
How to Read the FY 2017 Proposed Budget and Financial Plan
1. Introduction ...........................................................................................................................1-1
2. Financial Plan ........................................................................................................................2-1
3. Revenue.................................................................................................................................3-1
4. Operating Expenditures.........................................................................................................4-1
5. FY 2017 - FY 2022 Capital Improvements Plan...................................................................5-1
Appendices
A. D. C. Comprehensive Financial Management Policy.........................................................................A-1
B. Basis of Budgeting and Accounting .....................................................................................................B-1
C. Fund Structure and Relationship to Budget Structure.........................................................................C-1
D. Current Services Funding Level (CSFL) Development .....................................................................D-1
E. Agency Performance Plans....................................................................................................................E-1
F. FY 2017 Proposed - General Fund........................................................................................................F-1
G. FY 2017 Proposed - Gross Funds.........................................................................................................G-1
H. FY 2017 Proposed - FTEs - General Fund ..........................................................................................H-1
I. FY 2017 Proposed - FTEs - Gross Funds..............................................................................................I-1
J. Glossary of Budget Terms ......................................................................................................................J-1
The FY 2017 Budget Act (available online)

Volume 2 - Agency Budget Chapters - Part I
(Governmental Direction and Support, Economic Development and Regulation,
and Public Safety and Justice)
A. Governmental Direction and Support
1. Council of the District of Columbia (AB0)........................................................................................................................A-1
2. Office of the District of Columbia Auditor (AC0)............................................................................................................A-9
3. Advisory Neighborhood Commissions (DX0)...............................................................................................................A-15
4. Uniform Law Commission (AL0)....................................................................................................................................A-21
5. Office of the Mayor (AA0).................................................................................................................................................A-25
6. Mayor’s Office of Legal Counsel (AH0).........................................................................................................................A-33
7. Office of the Senior Advisor (AI0)....................................................................................................................................A-39
8. Office of the Secretary (BA0)............................................................................................................................................A-43
9. Office of the City Administrator (AE0)............................................................................................................................A-49
10. Deputy Mayor for Greater Economic Opportunity (EM0)...........................................................................................A-55
11. D.C. Office of Risk Management (RK0).........................................................................................................................A-61
12. D.C. Department of Human Resources (BE0)................................................................................................................A-67
13. Office of Disability Rights (JR0).......................................................................................................................................A-75
14. Captive Insurance Agency (RJ0).......................................................................................................................................A-81
15. Office of Finance and Resource Management (AS0)....................................................................................................A-85
16. Office of Contracting and Procurement (PO0)................................................................................................................A-91
17. Office of the Chief Technology Officer (TO0)................................................................................................................A-99
18. Department of General Services (AM0)........................................................................................................................A-109
19. Contract Appeals Board (AF0)........................................................................................................................................A-117
20. Board of Elections (DL0).................................................................................................................................................A-123
21. Office of Campaign Finance (CJ0).................................................................................................................................A-129
22. Public Employee Relations Board (CG0)......................................................................................................................A-135
23. Office of Employee Appeals (CH0) ...............................................................................................................................A-141
24. Metropolitan Washington Council of Governments (EA0)........................................................................................A-147
25. Office of the Attorney General for the District of Columbia (CB0) ..........................................................................A-153
26. D.C. Board of Ethics and Government Accountability (AG0)...................................................................................A-167
27. Statehood Initiatives (AR0)..............................................................................................................................................A-173
28. Office of the Inspector General (AD0) ..........................................................................................................................A-179
29. Office of the Chief Financial Officer (AT0)...................................................................................................................A-185
B. Economic Development and Regulation
1. Office of the Deputy Mayor for Planning and Economic Development (EB0) ...............................................B-1
2. Office of Planning (BD0) ......................................................................................................................................B-9
3. Office of Small and Local Business Development (EN0)................................................................................B-17
4. Office of Motion Picture and Television Development (TK0) ........................................................................B-25
5. Office of Cable Television,Film, Music, and Entertainment (CI0)..................................................................B-29
6. Office of Zoning (BJ0) ........................................................................................................................................B-37
7. Department of Housing and Community Development (DB0).......................................................................B-43
8. Department of Employment Services (CF0) .....................................................................................................B-55

9. Real Property Tax Appeals Commission (DA0) ...............................................................................................B-65
10. Department of Consumer and Regulatory Affairs (CR0).................................................................................B-71
11. Office of the Tenant Advocate (CQ0).................................................................................................................B-79
12. D.C. Commission on the Arts and Humanities (BX0)......................................................................................B-85
13. Alcoholic Beverage Regulation Administration (LQ0)....................................................................................B-91
14. Public Service Commission (DH0)....................................................................................................................B-97
15. Office of the People's Counsel (DJ0) ...............................................................................................................B-103
16. Department of Insurance, Securities, and Banking (SR0)..............................................................................B-109
17. Office of Cable Television, Film, Music, and Entertainment (CT0) ..............................................................B-117
18. Housing Authority Subsidy (HY0)...................................................................................................................B-121
19. Housing Production Trust Fund Subsidy (HP0)..............................................................................................B-125
20. Business Improvement Districts Transfer (ID0) .............................................................................................B-131
C. Public Safety and Justice
1. Metropolitan Police Department (FA0)...............................................................................................................C-1
2. Fire and Emergency Medical Services Department (FB0)..............................................................................C-13
3. Police Officers’ and Fire Fighters’ Retirement System (FD0).........................................................................C-23
4. Department of Corrections (FL0) ......................................................................................................................C-29
5. District of Columbia National Guard (FK0) .....................................................................................................C-37
6. Homeland Security and Emergency Management Agency (BN0).................................................................C-45
7. Commission on Judicial Disabilities and Tenure (DQ0)..................................................................................C-53
8. Judicial Nomination Commission (DV0) .........................................................................................................C-57
9. Office of Police Complaints (FH0)....................................................................................................................C-61
10. District of Columbia Sentencing and Criminal
Code Revision Commission (FZ0)....................................................................................................................C-67
11. Office of the Chief Medical Examiner (FX0)...................................................................................................C-73
12. Office of Administrative Hearings (FS0) ..........................................................................................................C-79
13. Criminal Justice Coordinating Council (FJ0)....................................................................................................C-85
14. Office of Unified Communications (UC0) .......................................................................................................C-91
15. Homeland Security Grants (FT0).......................................................................................................................C-99
16. Department of Forensic Sciences (FR0) .........................................................................................................C-105
17. Corrections Information Council (FI0)............................................................................................................C-113
18. Office of Victim Services and Justice Grants (FO0) ......................................................................................C-119
19. Office of the Deputy Mayor for Public Safety and Justice (FQ0).................................................................C-125

Volume 3 - Agency Budget Chapters - Part IIPublic Education System
1. District of Columbia Public Schools (GA0) ...............................................................................................................D-1 Agency Budget Guide...........................................................................................................................................D-3
Our Goals ..............................................................................................................................................................D-5
WTU Member Salary Components .....................................................................................................................D-6
For Every Dollar DCPS Spends...........................................................................................................................D-7
Summary of Grants and Payments.......................................................................................................................D-8
Agency Budget Chapter......................................................................................................................................D-13
Appendices Appendix A - School Profiles.....................................................................................................................A-1 Appendix B - School-Wide (Budget).........................................................................................................B-1 Appendix C - Central Office and School Support (Budget) ...................................................................C-1
2. Teachers’ Retirement System (GX0).........................................................................................................................D-27
3. Office of the State Superintendent of Education (GD0) ..........................................................................................D-31
4. District of Columbia Public Charter Schools (GC0) ...............................................................................................D-45
5. University of the District of Columbia Subsidy Account (GG0) ............................................................................D-53
6. District of Columbia Public Library (CE0)...............................................................................................................D-57
7. District of Columbia Public Charter School Board (GB0)......................................................................................D-65
8. Non-Public Tuition (GN0)..........................................................................................................................................D-69
9 Special Education Transportation (GO0) ..................................................................................................................D-73
10. D.C. State Board of Education (GE0) .......................................................................................................................D-81
11. Office of the Deputy Mayor for Education (GW0)..................................................................................................D-87
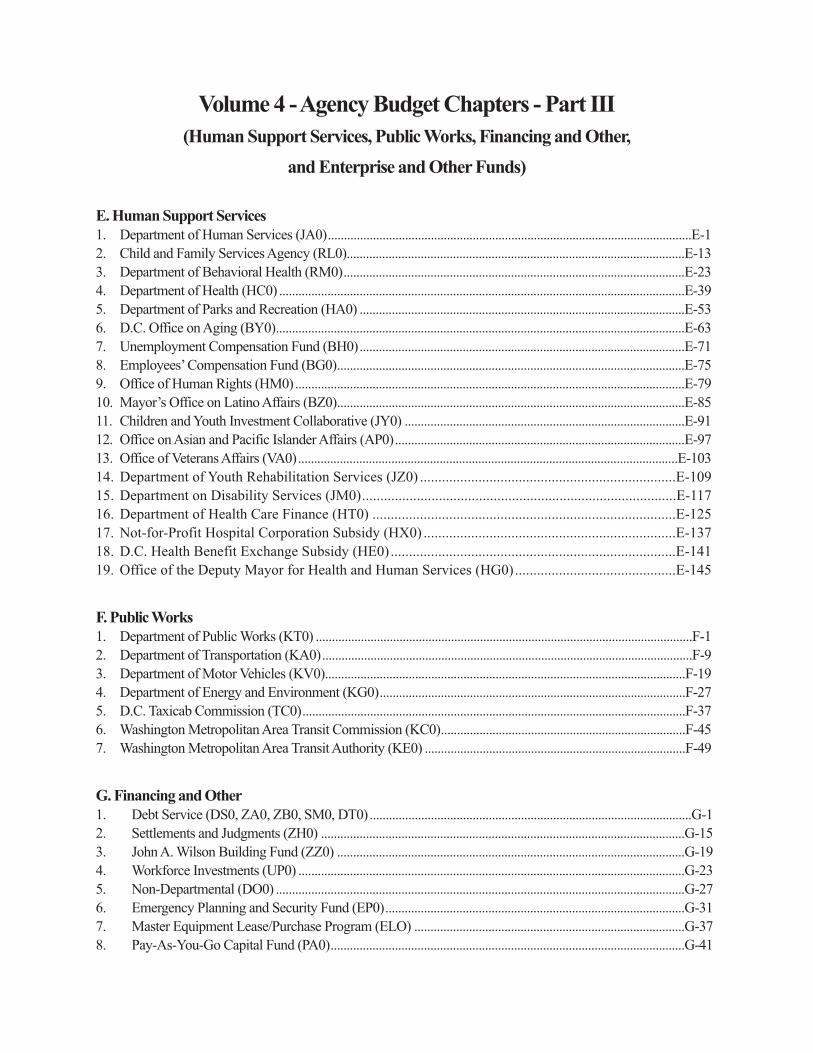
Volume 4 - Agency Budget Chapters - Part III
(Human Support Services, Public Works, Financing and Other,
and Enterprise and Other Funds)
E. Human Support Services
1. Department of Human Services (JA0).................................................................................................................E-1
2. Child and Family Services Agency (RL0).........................................................................................................E-13
3. Department of Behavioral Health (RM0)..........................................................................................................E-23
4. Department of Health (HC0) ..............................................................................................................................E-39
5. Department of Parks and Recreation (HA0) .....................................................................................................E-53
6. D.C. Office on Aging (BY0)...............................................................................................................................E-63
7. Unemployment Compensation Fund (BH0).....................................................................................................E-71
8. Employees’ Compensation Fund (BG0)............................................................................................................E-75
9. Office of Human Rights (HM0).........................................................................................................................E-79
10. Mayor’s Office on Latino Affairs (BZ0)............................................................................................................E-85
11. Children and Youth Investment Collaborative (JY0) .......................................................................................E-91
12. Office on Asian and Pacific Islander Affairs (AP0)..........................................................................................E-97
13. Office of Veterans Affairs (VA0)......................................................................................................................E-103
14. Department of Youth Rehabilitation Services (JZ0) ......................................................................E-109
15. Department on Disability Services (JM0)......................................................................................E-117
16. Department of Health Care Finance (HT0) ...................................................................................E-125
17. Not-for-Profit Hospital Corporation Subsidy (HX0) .....................................................................E-137
18. D.C. Health Benefit Exchange Subsidy (HE0)..............................................................................E-141
19. Office of the Deputy Mayor for Health and Human Services (HG0)............................................E-145
F. Public Works
1. Department of Public Works (KT0) .....................................................................................................................F-1
2. Department of Transportation (KA0)...................................................................................................................F-9
3. Department of Motor Vehicles (KV0)................................................................................................................F-19
4. Department of Energy and Environment (KG0)...............................................................................................F-27
5. D.C. Taxicab Commission (TC0).......................................................................................................................F-37
6. Washington Metropolitan Area Transit Commission (KC0)............................................................................F-45
7. Washington Metropolitan Area Transit Authority (KE0) .................................................................................F-49
G. Financing and Other
1. Debt Service (DS0, ZA0, ZB0, SM0, DT0)....................................................................................................G-1
2. Settlements and Judgments (ZH0) .................................................................................................................G-15
3. John A. Wilson Building Fund (ZZ0) ............................................................................................................G-19
4. Workforce Investments (UP0) ........................................................................................................................G-23
5. Non-Departmental (DO0) ...............................................................................................................................G-27
6. Emergency Planning and Security Fund (EP0).............................................................................................G-31
7. Master Equipment Lease/Purchase Program (ELO) ....................................................................................G-37
8. Pay-As-You-Go Capital Fund (PA0)..............................................................................................................G-41

9. District Retiree Health Contribution (RH0)...................................................................................................G-47
10. Highway Transportation Fund-Transfers (KZ0) ...........................................................................................G-53
11. Convention Center Transfer-Dedicated Taxes (EZ0)....................................................................................G-57
H. Enterprise and Other Funds
1. District of Columbia Water and Sewer Authority (LA0).................................................................................H-1
2. Washington Aqueduct (LB0) .............................................................................................................................H-7
3. D.C. Lottery and Charitable Games Control Board (DC0)...........................................................................H-11
4. District of Columbia Retirement Board (DY0)..............................................................................................H-17
5. Washington Convention and Sports Authority (ES0)....................................................................................H-23
6. Housing Finance Agency (HF0)......................................................................................................................H-29
7. University of the District of Columbia (GF0) ................................................................................................H-35
8. D.C. Public Library Agency Trust Fund (UW0)............................................................................................H-43
9. Unemployment Insurance Trust Fund (UI0) ..................................................................................................H-47
10. Housing Production Trust Fund (UZ0)...........................................................................................................H-51
11. Tax Increment Financing (TIF) Program (TX0) ............................................................................................H-55
12. Ballpark Revenue Fund (BK0)........................................................................................................................H-59
13. Repayment of PILOT Financing (TY0) .........................................................................................................H-63
14. Not-For-Profit Hospital Corporation (HW0).................................................................................H-67
15. Health Benefit Exchange Authority (HI0).....................................................................................H-71
Volumes Bound SeparatelyVolume 2 - FY 2017 Proposed Budget and Financial Plan - Agency Budget Chapters - Part IVolume 3 - FY 2017 Proposed Budget and Financial Plan - Agency Budget Chapters - Part IIVolume 4 - FY 2017 Proposed Budget and Financial Plan - Agency Budget Chapters - Part IIIVolume 5 - FY 2017 Proposed Budget and Financial Plan - FY 2017 - FY 2022 Capital Improvements Plan (Including Highway Trust Fund)Web Only: Volume 6 - FY 2017 Proposed Budget and Financial Plan - Operating Appendices

How to Read the FY 2017 Proposed
Budget and FinancialPlan


How to Read the FY 2017 Proposed Budget and Financial Plan
i
How to Read the FY 2017 ProposedBudget and Financial Plan
The District of Columbia’s FY 2017 Proposed Budget and FinancialPlan is a communication tool that presents and explains policy priorities, agency operations, including programmatic/organizational structures, and performance measures in the context of the FinancialPlan, which shows the District’s sources of revenue and plannedexpenditures. The Budget and Financial Plan includes forecasts of economic and financial conditions, current and planned long-termdebt financing, policy decisions, and other important financial information for the District’s government, all of which are essential elements for accurate financial reporting and sound management ofpublic resources.This chapter, How to Read the Budget and Financial Plan, is a guide for understanding the sections of this budget volume that define the budget priorities for the District. These sections are consistent with the NationalAdvisory Council on State and Local Budgeting’s recommended budget practices, which call for a presentation ofinformation to provide readers with a guide to government programs and organizational structure. Additionally,these sections are consistent with the standards of the Government Finance Officers Association for theDistinguished Budget Presentation Award.
The FY 2017 Proposed Budget and Financial Plan is presented in six volumes summarized as follows:
Executive Summary (Volume 1) - provides a high-level summary of the budget and financial information, including sections describing new initiatives within the District's proposed budget, the transmittal letters from theMayor and the Chief Financial Officer, the District’s five-year financial plan, detailed information on the District’sprojected revenues and expenditures, and summary information about the Capital Improvements Plan. In addition, this volume includes information about the District's budgetary and financial management policies, aglossary of budget terms, a description of agency performance plans, budget summary tables by agency and fundtype, and the Budget Act legislation that serves as the basis for the District’s federal appropriations act.
Agency Budget Chapters (Volumes 2, 3, and 4) - describes, by appropriation title, the operating budgets for eachof the District's agencies. Appropriation titles categorize the general areas of services provided by the District on

How to Read the FY 2017 Proposed Budget and Financial Plan
ii
behalf of its citizens and are listed in the table of contents. Examples are Governmental Direction and Support,Public Safety and Justice, and Financing and Other.
Capital Improvements Plan (Including Highway Trust Fund) (Volume 5) - describes the District’s proposed six-year Capital Improvements Plan for all of the District's agencies. The Highway Trust Fund describes the District’sproposed FY 2017 to FY 2022 planned transportation projects including federal highway grants.
Operating Appendices (Volume 6) - includes detailed supporting tables displaying the proposed expenditures andfull-time equivalents in the operating budgets that are described in Volumes 2, 3, and 4. Please note: This volumeis available exclusively on the Government of the District of Columbia website at http://cfo.dc.gov/.
Detailed information on the chapter contents of each volume include:
Volume 1: Executive Summary
Includes the following sections:
Introduction: FY 2017 Proposed Budget and Financial PlanThis chapter is a narrative and graphic summary of the proposed budget and financial plan. It describes the over-all proposed budget, including the sources and uses of public funds, and compares the prior year's approved bud-get to the current one. The chapter also explains the budget development process and budget formulation calen-dar for FY 2017.
Financial Plan The Financial Plan summarizes planned revenues and expenditures from FY 2017 through FY 2022. This chap-ter includes financing sources, uses, and the assumptions used to derive the District’s short-term and long-term eco-nomic outlook.
RevenueThis chapter shows current revenue projections for each revenue type as certified by the Office of the ChiefFinancial Officer. It also details the District’s revenue sources, provides an overview of the District’s and regionaleconomy and economic trends, and describes the revenue outlook for FY 2017 through FY 2020.
Operating Expenditures This chapter describes the District's recent Local funds expenditures. It includes analysis of expenditures betweenFY 2012 and FY 2015, both by agency and by expense category, e.g. personnel, supplies, and fixed costs.
Capital Improvements Plan (CIP)This chapter describes the overall CIP, including the sources and uses of Capital funds.

How to Read the FY 2017 Proposed Budget and Financial Plan
iii
AppendicesThe last section of the Executive Summary includes explanations of items specific to the District's budget:
• The D.C. Comprehensive Financial Management Policy provides a framework for fiscal decision-making bythe District to ensure that financial resources are available to meet the present and future needs of District citizens;
• The Basis of Budgeting and Accounting section describes the basis of budgeting and accounting, enabling thereaders to understand the presentation methods of the District's finances;
• The Fund Structure and relationship to other the Budget section relates the District’s fund structure to its bud-get presentation;
• The Current Services Funding Level (CSFL) Development section describes how the CSFL was developed forthe Local funds budget;
• The Agency Performance Plans section describes how the Office of the City Administrator evaluates government agencies, services, and operations; contains details on major plan revisions or changes in the assessment process; and directs readers to the agency plans, including performance measures, on the District’swebsite;
• The Summary Tables detail the District's proposed operating budget by agency and fund type for both budgeted dollars and positions;
• The Glossary of Budget Terms section describes unique budgeting, accounting, and District terms that maynot be known by the general reader; and
• The Budget Act is the legislation that the District uses to enact the District's budget via local law, and serves asthe basis for the District’s federal appropriations act to be enacted into law by the United States Congress andthe President through the federal appropriations process.
Volumes 2, 3, and 4: Agency Budget Chapters - Part I, II, and III
These volumes include agency chapters that describe available resources, their uses, and the achieved and anticipated outcomes as a result of these expenditures. New for this year, the Agency Performance Plan Objectivesand Measures tables for certain agencies will now appear on the Internet at http://cfo.dc.gov/. Chapters in thesevolumes are grouped by appropriation title and each chapter contains the following sections, as applicable:
Header Information: • Agency name and budget code; • Website address and telephone; and• FY 2017 proposed operating budget table.
Introduction: • Agency Mission; and • Summary of Services.
Financial and Program Information: • Proposed Funding and Full-Time Equivalents by Source table; • Proposed Expenditure by Comptroller Source Group table;• Division/Program descriptions;• Proposed Expenditure by Division/Program table;• FY 2017 Proposed Budget Changes; and • FY 2016 Approved Budget to FY 2017 Proposed Budget reconciliation table.

How to Read the FY 2017 Proposed Budget and Financial Plan
iv
FY 2017 Proposed Budget ChangesThe FY 2017 Proposed Budget Changes section within each agency chapter provides a comprehensive explanation of theFY 2016 Approved Budget to FY 2017 Proposed Budget, by Revenue Type table that appears in nearly every chapter.Please see the Current Services Funding Level (CSFL) Development appendix in this volume for more information aboutthe CSFL methodology, which is only applied to agencies with Local funds. This section includes major changeswithin the agency budget by program, fund, and full-time equivalents, from the initial request through thepolicy decisions made by the Mayor. The FY 2017 Proposed Budget Changes section uses the followingterms to describe budgetary or programmatic changes:
Actions with an impact on services: • Enhance: More funding to improve the quality or quantity of an existing service (e.g., Funding to
support the new DMV service center in Georgetown).• Reduce: Reduction, but not elimination of an existing service (e.g. Close a service center and provide
services at other locations; Realign staffing in the Fleet Management division).• Eliminate: Total elimination of an existing service, with no anticipation of the service being provided
by another entity (e.g. Eliminate unfunded vacant FTEs for staffing realignment).
Actions with no service impact:
• Increase: Additional funds necessary to continue service at current levels (e.g., Fund recurring operating cost of Automated Traffic Enforcement).
• Decrease: Reduction in cost without a service impact (e.g., Align energy budget with revised DGS estimate).
• Transfer-In: Shift of an existing program, operation, or personnel from another District agency (e.g.,Transfer the Central Cell Block Security activity from MPD to DOC).
• Transfer-Out: Shift of an existing program, operation, or personnel to another District agency (e.g.,Transfer APRA division from DOH to establish DBH).
• Shift: Shift an existing program or operation from one Fund type to another (e.g., Shift from SpecialPurpose Revenue to Local funds to support telecommunications for the D.C. Lottery).
• Technical Adjustment: An increase or decrease to the budget that is required because of a legislative mandateor to correct an error or omission.
• No Change: The agency has no changes in funding and/or budget structures from the FY 2016approved budget to the FY 2017 proposed budget.
An example of an agency narrative is at the end of this chapter to help the reader navigate the Agency BudgetChapter volume. The example shows an agency with a performance plan. Call-out boxes highlight the features discussed above.
Agency Performance PlansThe Office of the City Administrator (OCA) is building a robust performance management program across theDistrict. This process includes making several updates to the format and submission process for annual agency per-formance plans.
Under the new process, agencies had the opportunity to update major components of their performance plan forFY 2017 including: objectives, key performance indicators and workload measures. Ultimately, the revised perfor-mance plans will be able to communicate more effectively the important work each agency plans to do over thecoming year and how each agency will work to improve its performance. First drafts of the high level componentsof each agency’s performance plan (objectives, key performance indicators, and operations) are published with thebudget volumes and other budget materials at www.cfo.dc.gov.
How to Read the FY 2017 Proposed Budget and Financial Plan
v
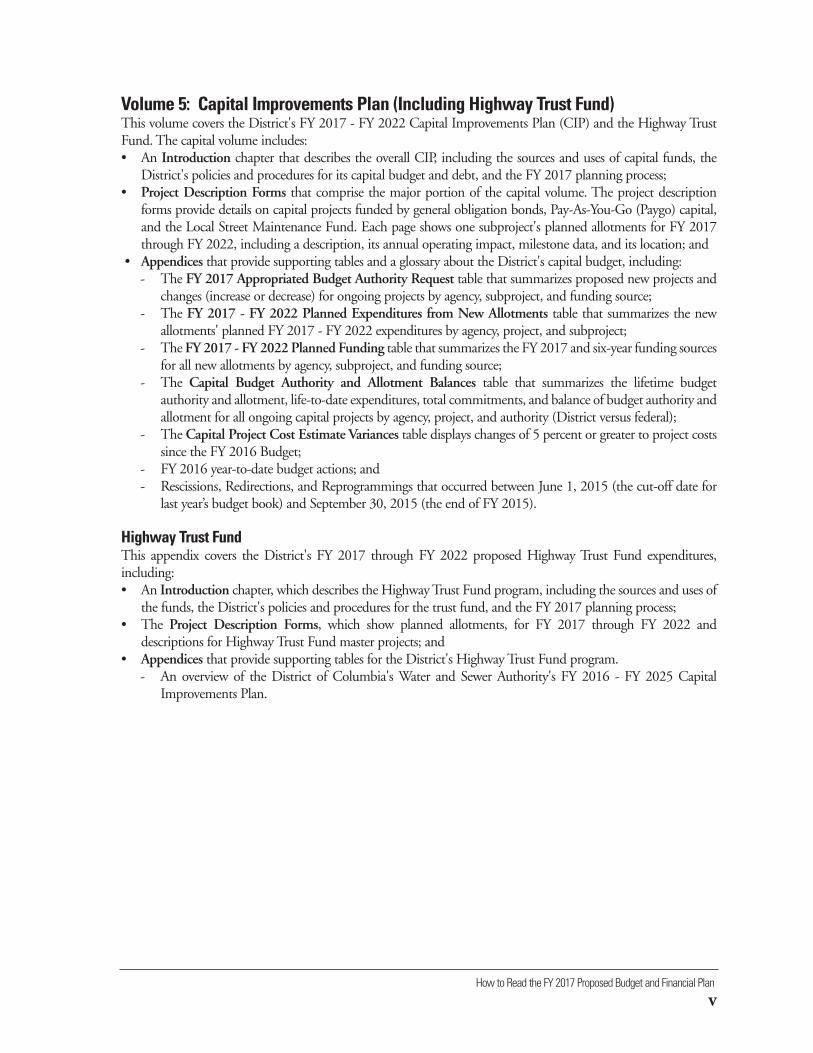
Volume 5: Capital Improvements Plan (Including Highway Trust Fund)This volume covers the District's FY 2017 - FY 2022 Capital Improvements Plan (CIP) and the Highway TrustFund. The capital volume includes:• An Introduction chapter that describes the overall CIP, including the sources and uses of capital funds, the
District's policies and procedures for its capital budget and debt, and the FY 2017 planning process;• Project Description Forms that comprise the major portion of the capital volume. The project description
forms provide details on capital projects funded by general obligation bonds, Pay-As-You-Go (Paygo) capital,and the Local Street Maintenance Fund. Each page shows one subproject's planned allotments for FY 2017through FY 2022, including a description, its annual operating impact, milestone data, and its location; and
• Appendices that provide supporting tables and a glossary about the District's capital budget, including:- The FY 2017 Appropriated Budget Authority Request table that summarizes proposed new projects and
changes (increase or decrease) for ongoing projects by agency, subproject, and funding source;- The FY 2017 - FY 2022 Planned Expenditures from New Allotments table that summarizes the new
allotments' planned FY 2017 - FY 2022 expenditures by agency, project, and subproject;- The FY 2017 - FY 2022 Planned Funding table that summarizes the FY 2017 and six-year funding sources
for all new allotments by agency, subproject, and funding source;- The Capital Budget Authority and Allotment Balances table that summarizes the lifetime budget
authority and allotment, life-to-date expenditures, total commitments, and balance of budget authority andallotment for all ongoing capital projects by agency, project, and authority (District versus federal);
- The Capital Project Cost Estimate Variances table displays changes of 5 percent or greater to project costssince the FY 2016 Budget;
- FY 2016 year-to-date budget actions; and - Rescissions, Redirections, and Reprogrammings that occurred between June 1, 2015 (the cut-off date for
last year’s budget book) and September 30, 2015 (the end of FY 2015).
Highway Trust Fund This appendix covers the District's FY 2017 through FY 2022 proposed Highway Trust Fund expenditures, including:• An Introduction chapter, which describes the Highway Trust Fund program, including the sources and uses of
the funds, the District's policies and procedures for the trust fund, and the FY 2017 planning process;• The Project Description Forms, which show planned allotments, for FY 2017 through FY 2022 and
descriptions for Highway Trust Fund master projects; and• Appendices that provide supporting tables for the District's Highway Trust Fund program.
- An overview of the District of Columbia's Water and Sewer Authority's FY 2016 - FY 2025 CapitalImprovements Plan.
How to Read the FY 2017 Proposed Budget and Financial Plan
vi
Volume 6: Operating Appendices
This volume provides supporting tables to each agency's proposed operating budget. The tables generally includeFY 2015 actual expenditures, the FY 2016 approved budget, the FY 2017 proposed budget, and the change fromFY 2016 to FY 2017 (unless noted).
The following tables are provided:
Schedule 30-PBB - dollars summarized by program, activity, and governmental fund (governmental fund breakout is for FY 2016 only and includes general fund detail);
Schedule 40-PBB - dollars summarized by program, comptroller source group, and governmental fund;
Schedule 40G-PBB - dollars summarized by program, comptroller source group, and appropriated fund withinthe General Fund;
Schedule 41 - dollars and FTEs summarized by comptroller source group and governmental fund;
Schedule 41G - dollars and FTEs summarized by comptroller source group and appropriated fund within theGeneral Fund; and
Schedule 80 - dollars and FTEs summarized by appropriated fund, with specific revenue source (for the FY 2017Proposed Budget only).

How to Read the FY 2017 Proposed Budget and Financial Plan
vii
Agency budgetcode
This shows the agency’s FY 2015 actual expenditures, FY2016 approved budget, the FY 2017 proposed budget, andthe percent variance from FY 2017 to FY 2016. This includesthe agency’s operating budget and FTEs.
A Summary of Services is a concise explanation of theagency’s key functions.
This section describes theagency’s mission and purpose.
Agency name, website address and telephonenumber (if applicable)

How to Read the FY 2017 Proposed Budget and Financial Plan
viii
This table also shows the agency's total operating budget from each fundingsource (Local, Dedicated Taxes, Special Purpose Revenue, Federal Payments,Federal Grants, Medicaid, Private Grants, or Intra-District sources).
This table presents the agency's total operatingbudget and Full-Time Equivalent (FTE) positions,comparing the FY 2015 actual, FY 2016 approved,FY 2017 proposed budgets and the dollar and FTEchanges.
This table lists the agency's total operating expendituresfor FY 2014 and FY 2015, the FY 2016 approved budget, andthe FY 2017 proposed budget at the Comptroller SourceGroup level.

How to Read the FY 2017 Proposed Budget and Financial Plan
ix
This indicates the specific programs (or divisions)and activities within an agency. It containsdetailed descriptions of their purpose and howthey contribute to the lives of District residentsand visitors.
This table provides an overall budgetedfunding level and number of approved FTEsfor the FY 2015 actuals, the FY 2016approved budget and the FY 2017 proposedbudget for specific programs (or divisions)and activities.

How to Read the FY 2017 Proposed Budget and Financial Plan
x
The FY 2017 Proposed Budget Changes section pro-vides a comprehensive explanation of Table 5; itincludes major internal changes within the budgetincluding Current Services Funding Level (CSFL)changes, changes to the initial adjusted budget, andpolicy initiatives.
CSFL assumptions are presented separately withinthe budget. For more detail on the CSFL, please seethe appendix in this volume.
This section describes the changesmade to an agency during the overallbudget formulation process by fund andby program (or divisions).
How to Read the FY 2017 Proposed Budget and Financial Plan
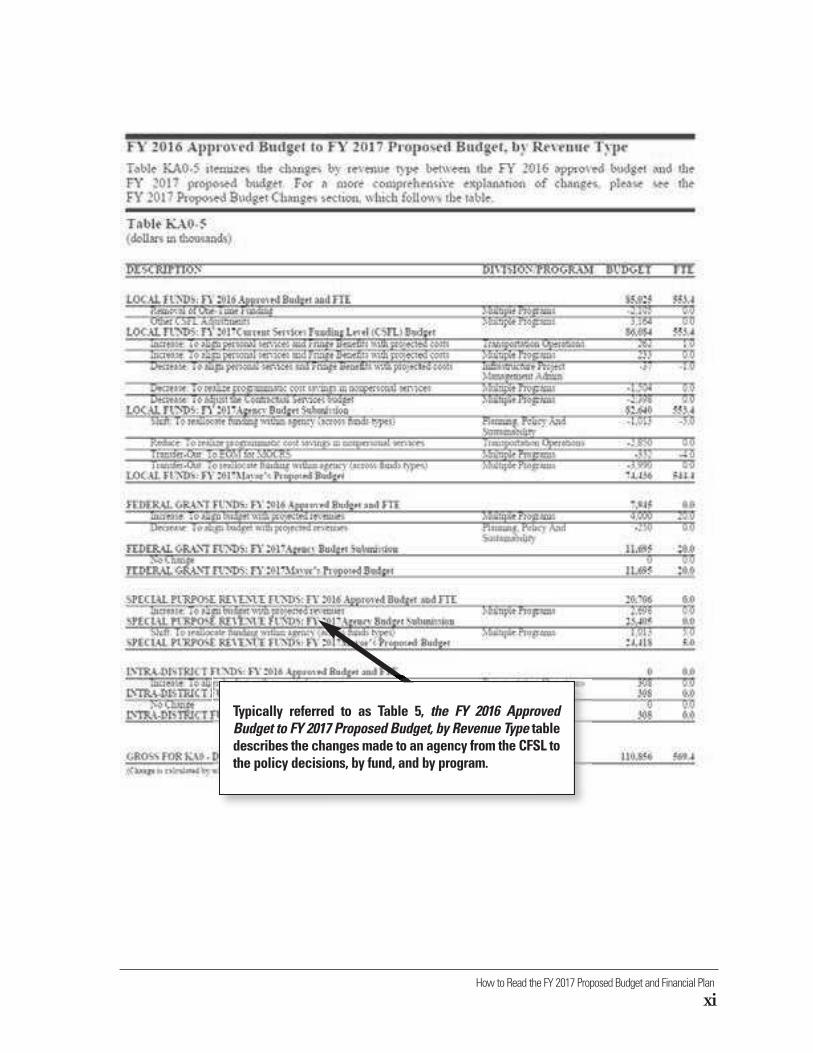
xi
Typically referred to as Table 5, the FY 2016 ApprovedBudget to FY 2017 Proposed Budget, by Revenue Type tabledescribes the changes made to an agency from the CFSL tothe policy decisions, by fund, and by program.


FY 2017 Proposed Budget and Financial Plan Introduction
1-1
The challenge for the District is to navigate this jurisdictional complexity while facing increasing service
needs. Totaling $13.4 billion, the gross budget in the FY 2017 Proposed Budget and Financial Plan is $346
million, or 2.7 percent, more than the FY 2016 Approved Budget of $13.0 billion, including Enterprise Fund
agencies but excluding intra-District funding. The gross budget excluding Enterprise Fund agencies is $11.6
billion. Figure 1-1 shows the major source of gross funds for FY 2017. Figure 1-2 does the same for Local
funds revenue.
The proposed budget funds services as diverse as street cleaning, affordable multi-family housing
development, voter registration, business inspection, fire-fighting, police patrol, running a lottery, managing a
vast multimodal transit system, providing health services and improving access to them, educating children
and adults, promoting economic development, encouraging people to move into the District, and protecting
at-risk youth and adults.
The District's proposed budget is similar to any other budget, in that it identifies resources (revenues) and
uses (expenditures) to accomplish the specific purposes developed by citywide strategic planning and
departmental business planning. In addition to these basic elements, the proposed budget includes a financial
forecast for policy priorities and detailed cost information for agency programs and activities.
District of Columbia Fiscal Year 2017 Budget Policy and Priorities Focus The Fiscal Year 2017 Proposed Budget and Financial Plan marks the District of Columbia’s 21st consecutive
balanced budget - one that makes investments in affordable housing, homeless services, public education, and
infrastructure and preserves the District’s 12-percent debt cap. Investments in these priority areas will help
ensure the District remains a great place to live, work, and play.
Continued Investment in Public EducationPublic education (K-12) remains a top priority for the District in FY 2017. The budget supports additional
educational investments, which are reflected in $75 million of increased funding for the District of Columbia
Public Schools (DCPS) and the District of Columbia Public Charter Schools (DCPCS) to cover projected
increases in student enrollment and a 2 percent base adjustment to the Uniform Per Student Funding Formula.
It will also continue investments to address at-risk students by ensuring that at-risk dollars follow the students
who need them. The proposed budget also includes a critical investment of $5.2 million in the University of
the District of Columbia and the Community College of the District of Columbia to address school staff and
programming needs.
Introduction to the FY 2017Proposed Budget and FinancialPlan
The District of Columbia government is unique and extremelycomplex. As one entity, the District government provides servicestypically delivered elsewhere by states, counties, cities, and specialtaxing districts.
1

Introduction FY 2017 Proposed Budget and Financial Plan
1-2
In order to advance the education services the District currently provides, the proposed budget includes
$8.6 million of enhancements in our State Education office. These include $1.6 million for the early literacy
program, $3.6 million to meet new Federal Child Care Development Fund requirements and improve the
quality of child care slots in District centers, $1.1 million for data system improvements, and $2.3 million to
maintain the level of funding provided in prior years for infant and toddler services. Lastly, the proposed
budget continues funding for the Community Schools program and fully funds the Books from Birth program,
which will provide a book per month to every District child from birth until his or her fifth birthday.
Additional Investments in Affordable HousingThe FY 2017 proposed budget continues to make significant investments in affordable housing. This is
reflected in $100 million of funding for the Housing Production Trust Fund. This critical investment will
increase the number of grants and loans that will be used to preserve and build housing in the District of
Columbia.
Continuing Strategic Path to End HomelessnessThe Interagency Council on Homelessness’ Homeward DC 5-year strategic plan provides for supports across
the homeless services continuum of care to get individuals and families off the street and connected to the
appropriate resources. The FY 2017 proposed budget makes $13.1 million of investments towards achieving
these goals. For singles, $4.8 million will be used to provide 300 slots of permanent supportive housing with
$1.2 million for 100 slots of targeted affordable housing. For families, $1 million will provide 390 slots for
prevention, with $1.8 million for 284 slots of rapid re-housing, and $1.9 million for 100 slots of targeted
affordable housing. For youth, $0.7 million will provide 165 slots for prevention, with $0.8 million for 27 crisis
beds, and $0.8 million for 12 transitional living spaces.
Investment in InfrastructureThe Capital Improvements Plan (CIP) makes the following investments in the District’s infrastructure:
Metrorail, Metrobus, and Integrated Premium Transit System. The continued growth and vitality of the city
and region greatly relies on a safe, efficient, and reliable Metro system to transport residents and visitors alike.
The CIP includes $831 million for safety improvements, improving the effectiveness of the current rail and
bus networks, increasing system capacity, and rebuilding the Metro system. An integrated streetcar and bus
transit system will add capacity to the District’s transportation system, provide links to activity centers that
complement Metrorail service, and offer a potentially cleaner and more sustainable transportation alternative.
The CIP provides $575.7 million for the Circulator and streetcars, giving priority to the H Street – Benning
Metro Station streetcar segment.
Public Schools Modernization and University Facilities. The District is currently undertaking a
comprehensive schools modernization initiative that began in 2008. So far, almost $4 billion has been invested.
This CIP commits to an additional investment of $1.3 billion over the next six years for modernization of
elementary, middle, and high school facilities. In addition, the University of the District of Columbia is making
campus improvements that will enhance the collegiate experience for its students, faculty, staff, and guests.
The CIP provides $55 million for University improvements.
21st Century Public Libraries. Continuing efforts to fully modernize the Martin Luther King Jr. Memorial
Central Library, the CIP includes $179 million that will be used to renovate and reconfigure this historic
landmark, resulting in a world-class facility offering residents and visitors a vibrant center of activity for
reading, learning, and community discussion. In addition, libraries in District neighborhoods will receive $68.4
million to renovate and modernize existing facilities, update I.T. systems including public access computers,
and construct new state-of-the-art facilities.

FY 2017 Proposed Budget and Financial Plan Introduction
1-3
United Medical Center. The District places a high priority on providing public health services to all District
residents. Since taking control of the operations of the Not-for-Profit Hospital Corporation, commonly referred
to as United Medical Center (UMC), in 2010, the District has invested millions of dollars in the District’s only
acute care hospital on the city’s East End. The CIP includes $98.7 million for additional improvements to
attract an operating partner, rebrand UMC, encourage more residents to utilize the facility’s services, and
improve patient services.
Transitional Housing. The CIP provides $20 million of funding that will be used for emergency housing
options for people who experience homelessness in the District and permanent supportive housing for families
and individuals experiencing chronic homelessness. In addition, the District anticipates receiving a $9 million
federal payment to support the replacement of the Federal City Shelter.
Details on Key Budget Areas:The proposed budget also includes a number of changes to align the budget with the District’s priorities,
improve services and accountability, and meet agency strategic business goals. They include the following:
■ D.C. Access System - The Department of Human Services’ (DHS) FY 2017 proposed budget provides
additional funding for the DC Access System that will help improve and streamline the eligibility system
– and the process for applying for and renewing – TANF, SNAP, Medicaid, and other federal benefits.
■ Alternatives to Court Experience (ACE) - Funding in the budget also supports the Alternatives to Court
Experience Diversion program (ACE). ACE helps youth avoid formal arrest and potential prosecution for
misdemeanor crimes by diverting them to various services such as community-based intervention, family
therapy, and anger management.
■ D.C. Housing Authority - The Housing Authority Subsidy in the FY 2017 budget proposes additional
support for short-term housing and critical maintenance and repair needs for low-income families and
individuals. This budget will invest $1 million for the rehab 22 short-term housing units that are currently
offline, increasing the current stock of housing units available in the District. In addition, the District has
budgeted $15 million for essential and preventative maintenance and repairs needs, ensuring families and
individuals have access to safe and harmless housing.
■ Third-Party Ambulance Initiative - The proposed FY 2017 budget reflects an increase of $12 million
for the third-party providers to the Fire and Emergency Medical Services (FEMS) budget. The use of a
third party provider is essential to advancing critical phases of EMS reform including improvements in unit
availability and addressing preventive maintenance. The third-party provider initiative assists EMS with
transporting low acuity basic life support (BLS) patients to ensure better quality medical service to the
residents of the District.
■ Correctional Treatment Facility (CTF) Transition - The Department of Corrections (DOC) will assume
operation of the Correctional Treatment Facility. The FY 2017 budget reflects an increase of $5.9 million
to the DOC to assume operation of the CTF. When oversight returns to the District in FY 2017, DOC will
fully use the available program space to significantly expand the level of pre-release programs and services
made available to the male and female inmate population. This transition will result in lower cost per
inmate to District taxpayers and overall savings of approximately $9 million in future years.
■ Additional 911 Call-takers for the Office of Unified Communications - The proposed budget also
includes an increase of $2.5 million to the Office of Unified Communications for additional call takers for
911 operation. The additional positions will enable the agency to meet the increasing demand for 911
service calls and also improve the quality of customer service to the residents of the District.
■ Safer Stronger DC Initiatives - The FY 2017 budget continues to fund the Mayor’s Safer Stronger DC
Initiatives which includes: $2.8 million for the Metropolitan Police Department Civilianization initiative,
$8 million for the Department of Forensic Sciences’ DNA Crime Lab, and $1 million for the Office of the
Chief Medical Examiner.
Introduction FY 2017 Proposed Budget and Financial Plan
1-4
■ D.C. Public Schools - For FY 2017, in the District’s Uniform Per Student Funding Formula (UPSFF),
which forms the basis for funding the public school system, the foundation level per student will be
increased to $9,682, an increase of 2 percent. Appropriations for the UPSFF are funded with 100 percent
Local dollars. Please refer to the agency budget chapters for the District of Columbia Public Schools
(DCPS) and the District of Columbia Public Charter Schools (DCPCS), to review the current allocation
for the UPSFF. DCPS student enrollment is projected to increase to 50,016 students.
■ D.C. Public Charter Schools - The District of Columbia Public Charter Schools (DCPCS) operates as the
central agency, independent of the District’s school system, which disburses the UPSFF from District of
Columbia Local funds to charter schools, each of which operates as an autonomous school district. Both
the Residential and Non-Residential Facilities Allotments will remain at the same levels as in FY 2016:
Residential $8,395 per student, and Non-Residential $3,124 per student. DCPCS student enrollment is
projected to increase to 40,953 students.
■ Special Education Transportation - In FY 2017, the Special Education Transportation’s (SET) proposed
budget reflects the agency’s primary goal of improving the quality of student transportation for the
District’s eligible students. To further improve these capacities, SET proposes $9 million of increased
funding for investigations of complaints, analysis of arrival times, terminal operations, and fleet
management.
■ Department of Public Works (DPW) - The FY 2017 proposed budget includes an enhancement to fund
25 additional FTEs through DPW’s Learn, Earn, Achieve and Prosper (L.E.A.P.) program to support
workers training in both fleet maintenance and sanitation services — all 25 L.E.A.P. employees are District
residents, making this program a cornerstone of Mayor Bowser’s Pathways to the Middle Class initiative.
■ District Department of Transportation (DDOT) - The FY 2017 proposed local funds budget includes
$1.5 million in funding for an additional 20 Traffic Control Operators that aligns with and supports Mayor
Bowser’s “Vision Zero” program to eliminate traffic-related deaths by 2024.
■ Washington Metropolitan Area Transit Authority (WMATA) - WMATA receives approximately 37.0
percent of its annual subsidy from the District of Columbia. In FY 2017, WMATA’s proposed budget
includes funding to support the annual subsidy payment, the DC Circulator bus, reduced fares at select
stations, and the Kids-Ride-Free initiative. The District’s annual subsidy payment has remained virtually
flat from FY 2016, and with no increase in fares for customers.
■ D.C. Taxicab Commission (DCTC) - The FY 2017 proposed Local funds budget reflects the
commission’s goal to support the modernization of the District’s taxicab industry and set a standard for
other jurisdictions to follow. In view of this, DCTC increased funding by $2.8 million to provide paratransit
benefits through its “TransportDC” program. TranportDC provides the same service as Metro’s
“MetroAccess” program, but it does so at half the cost. Special Purpose Revenue funds include increased
funding for the Driver Training program, and also leveraged funding provided by the United States
Department Justice for fingerprinting and background checks for drivers.
■ Office of Contracting and Procurement (OCP) - The FY 2017 budget proposal includes increased
funding and 20.0 FTEs to support the Procurement Practices Reform Act (PPRA), which was instituted
and subjected to the Delegated Procurement Authority (DPA) operating structure.
FY 2017 Proposed Budget and Financial Plan Introduction
1-5
Where the Money Comes FromMoney for providing District services comes from a variety of sources. The District's General Fund consists
of Local Tax and Nontax Revenue, Dedicated Taxes, and Special Purpose Revenue funds. Federal Grants,
Federal Medicaid, and Federal Payments constitute the District's federal resources. Private resources and
Enterprise and Other funds make up the balance of the District's gross funds (Figure 1-1).
Local tax revenue accounts for most of the money supporting services and includes such common sources
as income, property, and sales taxes (Figure 1-2). Detailed revenue information, including FY 2017 to FY 2020
revenue estimates, projection assumptions, and the estimated revenue impact of proposed policy changes, are
provided in the Revenue chapter of this budget book.
How the Money is AllocatedTo facilitate policy decisions concerning expenditures and to provide summary information for reporting
expenditures, the District's budget is developed, presented, and executed along several dimensions. These
include fund types, appropriation titles, agencies, programs, and expense categories. As with revenues,
expenditures can be grouped by the source of funds. The total of these funds is referred to as “gross funds.”
Totaling $13.4 billion, the expenditure budget (including Enterprise and Other funds but excluding
Intra-District funds) in the FY 2017 Proposed Budget and Financial Plan is $346 million, or 2.7 percent, more
than the FY 2016 approved budget of $13.0 billion, as shown in Table 1-1.
For purposes of appropriating the District's proposed budget, agency budgets are grouped by appropriation
title or function, such as public safety and justice or public education. Table 1-1 shows the FY 2017 proposed
gross funds expenditure budget by appropriation title and the change from FY 2016. Figure 1-3 shows the
percentage distribution of FY 2017 gross funds expenditure budget by appropriation title. The largest
appropriation titles, Public Education System and Human Support Services, represent 52.1 percent of the
District’s proposed budget – meaning more than one-half of every dollar generated is directed to these two
areas.
The FY 2017 proposed Local funds budget operating margin is zero dollars, after allowing for equivalent
deposits to the Cash Flow Reserve and to the Fiscal Stabilization Reserve as proposed in Chapter 2, the
Financial Plan. As shown in Table 1-2a, the proposed Local funds budget (excluding Dedicated Taxes and
Enterprise and Other funds) for FY 2017 is $7.3 billion, which is $222 million, or 3.1 percent, more than the
FY 2016 approved budget of $7.1 billion. The table also displays expenditure budgets by appropriation title
and their change from FY 2016. The proposed Dedicated Tax budget for FY 2017 is $306 million, which is
$14.7 million, or 4.6 percent, less than the FY 2016 approved budget of $320 million. Table 1-2b shows the
FY 2017 proposed Dedicated Taxes funds expenditures budget by appropriation title and their change from
FY 2016. Within the appropriation titles are the agencies that operate the programs, activities, and services
provided to District citizens and businesses. For example, the Public Works appropriation title includes the
Department of Public Works, the Department of Transportation, and the Department of Motor Vehicles. The
FY 2017 proposed Local funds budget includes approximately 100 agencies receiving Local funds in seven
appropriation titles.
To provide context as to the types of expenses for a particular program, information is presented by expense
category. These same categories are used by all District agencies, and all agency chapters detail specific agency
costs by expense category.
A large expense category is personal services, totaling $2.6 billion and representing 35.9 percent of the
FY 2017 Local funds proposed budget, excluding Dedicated Taxes. This funding will support 28,398 Local
full-time equivalent (FTE) positions, an increase of 699 FTEs, or 2.5 percent, over FY 2016 (see Table 1-4).
Including all fringe benefits, but excluding extra compensation such as overtime and shift differential, the
average Local FTE for FY 2017 will cost $87,380. The District's FY 2017 gross funds proposed budget,
including Intra-District funds, includes 35,157 FTEs, an increase of 999 FTEs, or 2.9 percent, over FY 2016.
Major gross funds FTE changes by agency and appropriation title are detailed in Table 1-5.

Introduction FY 2017 Proposed Budget and Financial Plan
1-6
Organization of the FY 2017 Proposed Budget and Financial Plan The FY 2017 Proposed Budget and Financial Plan is composed of the following volumes:
■ Volume 1 - Executive Summary;
■ Volumes 2, 3, and 4 - Agency Budget Chapters - provides summary information of each District agency’s
proposed budget;
■ Volume 5 - FY 2017 - FY 2022 Capital Improvements Plan (Including Highway Trust Fund); and
■ Volume 6 - Operating Appendices - provides detailed information about operating funds by agency (available
on-line only).
Additional details about the organization of the District’s FY 2017 Proposed Budget and Financial Plan
may be found in the How to Read the Budget and Financial Plan chapter.
The FY 2017 Budget Calendar The FY 2017 Proposed Budget and Financial Plan is the culmination of a year-long process. Some of the
critical steps in the budget formulation process and their general schedule are described in Table 1-6.
The District’s Budget Process: A Brief Overview The District of Columbia Home Rule Act, approved December 24, 1973 (Public Law 93-198; D.C. Official
Code § 1-201.01 et seq.), prescribes the procedure for the approval of the annual budget for the District of
Columbia government. Under Section 424(d)(5)(A) (D.C. Official Code § 1-204.24d(5)(A)), the Chief
Financial Officer prepares and submits to the Mayor and the Council annual estimates of all revenues of the
District of Columbia (without regard to the source of such revenues), including proposed revenues. These
revenue estimates are binding on the Mayor and the Council for purposes of the annual budget to be submitted
to Congress, except that the Mayor and the Council may base the budget on estimates of revenues that are
lower than those prepared by the Chief Financial Officer. Under Section 442(a) (D.C. Official Code §
1-204.42(a)), the Mayor prepares and submits a proposed annual budget to the Council. In preparing the
annual budget, the Mayor may use a budget prepared by the Chief Financial Officer for this purpose under
section 424(d)(2) (D.C. Official Code § 1-204.24d(2)). The Mayor may also prepare and submit supplemental
or deficiency budget recommendations to the Council from time to time, pursuant to Section 442(c) (D.C.
Official Code § 1-204.24(c)). A statement of justifications must be included.
Under Section 603(c) (D.C. Official Code § 1-206.03(c)), the Mayor is required to submit a balanced
budget and identify any tax increases that shall be required in order to balance the budget. The Council is
required to adopt such tax increases to the extent the budget is approved. The annual budget submitted shall
include, among other items, a multi-year plan for all agencies of the District government (as required under
Section 443 (D.C. Official Code § 1-204.43)) and multi-year capital improvements plan for all agencies of the
District government (as required under Section 444 (D.C. Official Code § 1-204.44)).
The Council must hold a public hearing on the budget submission and adopt a budget by act pursuant to
the time period required by Section 446 (D.C. Official Code § 1-204.46). The act is styled as the Budget
Request Act (of the year of adoption) and requires only one reading.
However, unlike other acts submitted to the Mayor for signature, the Mayor may exercise a line-item veto
under Section 404(f) (D.C. Official Code § 1-204.04(f)). If an item or provision is disapproved, the Mayor
must attach to the act a statement of the item or provision which is disapproved and, within the 10-day period
for approval or disapproval, return a copy of the act and statement with his objections to the Council.
The Council has 30 calendar days to reenact a disapproved item or provision by a two-thirds vote of the
members of the Council present and voting. If an item or provision is reenacted, the Chairman submits it to
the President for transmission to Congress. If a disapproved item or provision is not returned to the Council in
a timely manner, the Mayor shall be deemed to have approved the item or provision and the Chairman will
submit it to the President for transmission to Congress.
Unlike other legislation, the Budget Request Act does not become effective after a period of congressional

FY 2017 Proposed Budget and Financial Plan Introduction
1-7
review; it never becomes District of Columbia local law. Instead, the President transmits the Budget Request
Act to the House and Senate. Ultimately, Congress appropriates all funds for the District by an act. This act
may, but is not required to, include some or all of the provisions of the Budget Request Act as transmitted by
the District.
The Mayor may prepare a proposed supplemental or deficiency budget plan under Home Rule Act Section
442(c) (D.C. Official Code § 1-204.42(c)), which authorizes the Mayor to submit budget recommendations
that are, in his or her judgment, necessary on account of a law passed after budget transmission or otherwise
justified as in the public interest. The Mayor may submit a budget recommendation to the Council,
accompanied by a statement of justification. Alternatively, Section 442(d) of the Home Rule Act (D.C. Official
Code § 1-204.42(d)) authorizes the Council to request, by resolution, that the Mayor prepare and submit a
budget recommendation to the Council.
The District of Columbia may obligate and expend an increase in the amount of funds authorized under
Adjustments to Appropriations (D.C. Official Code § 47-369.01 et seq.) only where the Chief Financial Officer
certifies (1) the increase in revenue; and (2) that the use of the amounts is not anticipated to have a negative
impact on the long-term financial, fiscal, or economic health of the District. These funds may be increased (1)
by an aggregate amount of no more than 25 percent, in the case of amounts proposed to be allocated as
“Other-Type Funds” in the annual Budget Request Act submitted to Congress; and (2) by an aggregate amount
of no more than 6 percent, in the case of any other amounts proposed to be allocated in the Budget Request
Act. The amounts shall be obligated and expended in accordance with laws enacted by the Council in support
of each such obligation and expenditure, consistent with the requirements of this subchapter. The amounts may
not be used to fund any agencies of the District government operating under court-ordered receivership. The
amounts may not be obligated or expended unless the Mayor has notified the Committees on Appropriations
of the House of Representatives and the Senate not fewer than 30 days in advance of the obligation or
expenditure.
On March 18, 2016, the Superior Court of the District of Columbia issued an order that upholds the budget
process enacted in the Local Budget Autonomy Act of 2012, by which the District would submit its budget to
Congress similar to other local District laws, subject to a 30-day review by Congress, rather than as a unique
law, requiring an Act of Congress. The Mayor, the Council, and the Chief Financial Officer will work together
to modify the budget process as necessary.

Introduction FY 2017 Proposed Budget and Financial Plan
1-8
Figure 1-1
Where the Money Comes From - Sources of Gross Funds for FY 2017 ($13.4 Billion, Excluding Intra-District Funds)
Dedicated Taxes
$0.3B
2.3%
Federal Grants and
Medicaid
$3.3B
24.5%
Private Grants and
Private Donations
$0.0B*
0.0%
Special Purpose Revenue
$0.6B
4.5%
Federal Payments
$0.1B
1.0%
Local
$7.3B
54.4%
Enterprise Funds
$1.8B
13.3%
*The amount from Private Grants and Donations is $1.3 million.

FY 2017 Proposed Budget and Financial Plan Introduction
1-9
Property Tax
$2.5B
34.5%
Fund Balance
$0.0B*
0.6%
Lottery
$0.1B
0.8%
Non-Tax Revenue
$0.4B
5.8%
Gross Receipts Tax
$0.3B
3.4%
Proposal, Transfers
and Other
$0.1B
1.6%
Other Taxes
$0.3B
4.7%
Income Tax
$2.4B
32.2% Sales Tax
$1.2B
16.4%
Figure 1-2
Where the Money Comes From - Sources of Local Funds for FY 2017 ($7.3 Billion, Excluding Dedicated Taxes)
*The amount from this source is $44.1 million

Introduction FY 2017 Proposed Budget and Financial Plan
1-10
Figure 1-3
Where the Money Goes -Gross Funds Expenditure Budget, by Appropriation Title for FY 2017(Excluding Intra-District Funds) ($13.4 Billion)
Public Safety and
Justice
$1.3B
10.2%
Public Education
System
$2.4B
17.7%
Human Support Services
$4.6B
34.4%
Public Works
$0.8B
5.8%
Financing and
Other
$1.1B
8.2%
Enterprise Funds
$1.8B
13.3%
Governmental Direction
and Support
$0.8B
6.2%
Economic Development
and Regulation
$0.6B
4.2%

FY 2017 Proposed Budget and Financial Plan Introduction
1-11
Table 1-1
Gross Funds Expenditure Budget, by Appropriation Title (Excluding Intra-District Funds)(Dollars in Thousands)
FY 2016 Approved FY 2017 Proposed Change % Change
Budget Budget from FY 2016 from FY 2016
Governmental Direction and Support 786,463 828,937 42,475 5.4%
Economic Development and Regulation 540,755 567,480 26,725 4.9%
Public Safety and Justice 1,308,589 1,357,956 49,367 3.8%
Public Education System 2,233,291 2,371,251 137,960 6.2%
Human Support Services 4,502,393 4,603,249 100,857 2.2%
Public Works 770,416 779,824 9,407 1.2%
Financing and Other 1,088,835 1,091,201 2,366 0.2%
Subtotal, General Operating Funds 11,230,742 11,599,899 369,157 3.3%
Enterprise and Other Funds 1,808,855 1,785,972 -22,883 -1.3%
Total District of Columbia 13,039,598 13,385,871 346,274 2.7%
Note: Details may not sum to totals because of rounding.
Table 1-2a
Local Funds Expenditure Budget, by Appropriation Title(Excluding Dedicated Taxes and Enterprise and Other Funds)
(Dollars in Thousands)FY 2016 Approved FY 2017 Proposed Change % Change
Budget Budget from FY 2016 from FY 2016
Governmental Direction and Support 687,151 728,310 41,159 6.0%
Economic Development and Regulation 258,154 266,913 8,759 3.4%
Public Safety and Justice 1,101,509 1,149,736 48,228 4.4%
Public Education System 1,887,478 1,986,876 99,398 5.3%
Human Support Services 1,778,468 1,814,796 36,327 2.0%
Public Works 514,566 510,423 -4,143 -0.8%
Financing and Other 835,635 828,305 -7,330 -0.9%
Total 7,062,962 7,285,360 222,398 3.1%
Note: Details may not sum to totals because of rounding.
Table 1-2b
Dedicated Taxes Expenditure Budget, by Appropriation Title(Excluding Enterprise and Other Funds)
(Dollars in Thousands)FY 2016 Approved FY 2017 Proposed Change % Change
Budget Budget from FY 2016 from FY 2016
Economic Development and Regulation 1,170 1,170 0 0.0%
Public Education System 4,306 4,282 -23 -0.5%
Human Support Services 100,959 81,907 -19,052 -18.9%
Public Works 66,664 66,670 6 0.0%
Financing and Other 147,275 151,689 4,414 3.0%
Total 320,374 305,718 -14,656 -4.6%
Note: Details may not sum to totals because of rounding.

Introduction FY 2017 Proposed Budget and Financial Plan
1-12
Table 1-3a
Local Funds Proposed Expenditure Budget, by Category(Excluding Dedicated Taxes and Enterprise and Other Funds)
(Dollars in Thousands)FY 2016 FY 2017 Change % Change
Approved Proposed from from
Budget Budget FY 2016 FY 2016
Regular Pay - Continuing Full Time 1,839,283 1,905,572 66,289 3.6%
Regular Pay - Other 128,925 164,893 35,969 27.9%
Additional Gross Pay 80,611 77,101 -3,510 -4.4%
Fringe Benefits - Current Personnel 379,945 410,990 31,045 8.2%
Overtime Pay 53,766 54,022 255 0.5%
Subtotal, Personal Services 2,482,530 2,612,577 130,047 5.2%
Supplies and Materials 49,933 47,437 -2,496 -5.0%
Energy, Communication and Building Rentals 105,354 108,515 3,162 3.0%
Telephone, Telegraph, Telegram, Etc. 28,222 29,728 1,506 5.3%
Rentals - Land and Structures 142,942 150,802 7,860 5.5%
Janitorial Services 124 150 26 20.8%
Security Services 28,106 29,163 1,057 3.8%
Occupancy Fixed Costs 80,989 76,710 -4,279 -5.3%
Other Services and Charges 204,511 196,962 -7,549 -3.7%
Contractual Services - Other 368,289 401,893 33,604 9.1%
Subsidies and Transfers 2,872,794 2,931,073 58,279 2.0%
Equipment & Equipment Rental 35,103 28,126 -6,977 -19.9%
Debt Service 664,065 672,223 8,158 1.2%
Subtotal, Nonpersonal Services 4,580,432 4,672,783 92,351 2.0%
Total 7,062,962 7,285,360 222,398 3.1%
Note: Details may not sum to totals because of rounding.
Table 1-3b
Dedicated Taxes Proposed Expenditure Budget, by Category (Excluding Enterprise and Other Funds)
(Dollars in Thousands)FY 2016 FY 2017 Change % Change
Approved Proposed from from
Budget Budget FY 2016 FY 2016
Regular Pay - Continuing Full Time 1,316 1,755 439 33.4%
Regular Pay - Other 109 75 -34 -30.9%
Fringe Benefits - Current Personnel 305 375 70 23.1%
Subtotal, Personal Services 1,730 2,206 476 27.5%
Supplies and Materials 5 30 25 500.0%
Telephone, Telegraph, Telegram, Etc. 0 2 2 N/A
Other Services and Charges 2 25 23 1,170.8%
Contractual Services - Other 3,135 3,097 -38 -1.2%
Subsidies and Transfers 307,670 292,508 -15,162 -4.9%
Equipment and Equipment Rental 0 15 15 N/A
Debt Service 7,832 7,835 3 0.0%
Subtotal, Nonpersonal Services 318,644 303,512 -15,132 -4.7%
Total 320,374 305,718 -14,656 -4.6%
Note: Details may not sum to totals because of rounding.

FY 2017 Proposed Budget and Financial Plan Introduction
1-13
Table 1-4
Local Funds Proposed FTEs, by Appropriation Title (Includes Dedicated Taxes and Excludes Enterprise Funds)
(Dollars in Thousands)FY 2016 FY 2017 Change % Change
Approved Proposed from from
Budget Budget FY 2016 FY 2016
Governmental Direction and Support 3,100 3,168 69 2.2%
Economic Development and Regulation 630 641 11 1.7%
Public Safety and Justice 8,283 8,643 360 4.4%
Public Education System 9,475 9,502 27 0.3%
Human Support Services 4,030 4,255 225 5.6%
Public Works 2,141 2,148 7 0.3%
Financing and Other 40 40 0 0.0%
Subtotal, General Operating Local Fund 27,699 28,398 699 2.5%
Public Education System 11 16 5 47.1%
Human Support Services 6 6 -1 -9.1%
Subtotal, General Operating Dedicated Taxes 17 22 5 27.0%
Total, General Operating Local and Dedicated Tax Funds 27,716 28,420 704 2.5%
Note: Details may not sum to totals because of rounding.

Introduction FY 2017 Proposed Budget and Financial Plan
1-14
Table 1-5
Major Gross Funds FTE Changes (Including Enterprise and Other Funds and Intra-District Funds)
FY 2016 FY 2017
Approved Proposed Increase
Agency Name FTEs FTEs (Decrease) Explanation of Major FTE Changes
From multiple agencies for MOCRS, MORCA, and
Office of the Mayor 73 87 14 Mayor’s Office of Clean City
Deputy Mayor for Greater Economic
Opportunity 5 18 13 For Business and Workforce Development Program
D.C. Office of Risk Management 25 36 11 To align personal services with projected costs
D.C. Department of Human Resources 117 134 17 To align personal services with projected costs
14 from DBH and DDS pursuant to the Delegated
Procurement Authority,
Office of Contracting and Procurement 191 218 27 13 to align personal services with projected costs
Office of the Chief Financial Officer 970 982 12 To align personal services with projected costs
Other Agencies 2,212 2,225 12 Net Changes
Governmental Direction and Support 3,593 3,700 107
Department of Employment Services 587 611 24 To align personal services with projected costs
Department of Consumer and
Regulatory Affairs 356 395 39 To align personal services with the Mayor's initiatives
Commission on the Arts and Humanities 19 28 9 To align personal services with the Mayor's initiatives
Other Agencies 797 795 (2) Net Changes
Economic Development and Regulation 1,759 1,829 70
Metropolitan Police Department 4,620 4,663 43 To support the Safer Stronger Initiative
Fire and Emergency Medical Services
Department 2,068 2,104 36 To align budget with projected grant awards
To support the proposed transition for the Correction
Department of Corrections 932 1,162 230 Treatment Facility Takeover
Homeland Security and Emergency
Management Agency 92 105 13 To align budget with projected grant awards
Office of the Chief Medical Examiner 73 86 13 To align personal services with projected costs and to
support the Safer Stronger Initiative
Office of Unified Communications 311 342 32 To align personal services with projected costs
Department of Forensic Sciences 136 195 59 To support the Safer Stronger Initiative
Other Agencies 291 295 4 Net Changes
Public Safety and Justice 8,522 8,952 430
District of Columbia Public Schools 8,115 8,186 71 To align personal services with projected costs
Office of the State Superintendent 370 403 33 To support the Longitudinal Data Systems initiative and
of Education other Mayor's initiatives
District of Columbia Public Library 598 551 (47) To align personal services with projected costs
Other Agencies 1,450 1,450 0 Net Changes
Public Education System 10,533 10,590 57
(Continued on next page)
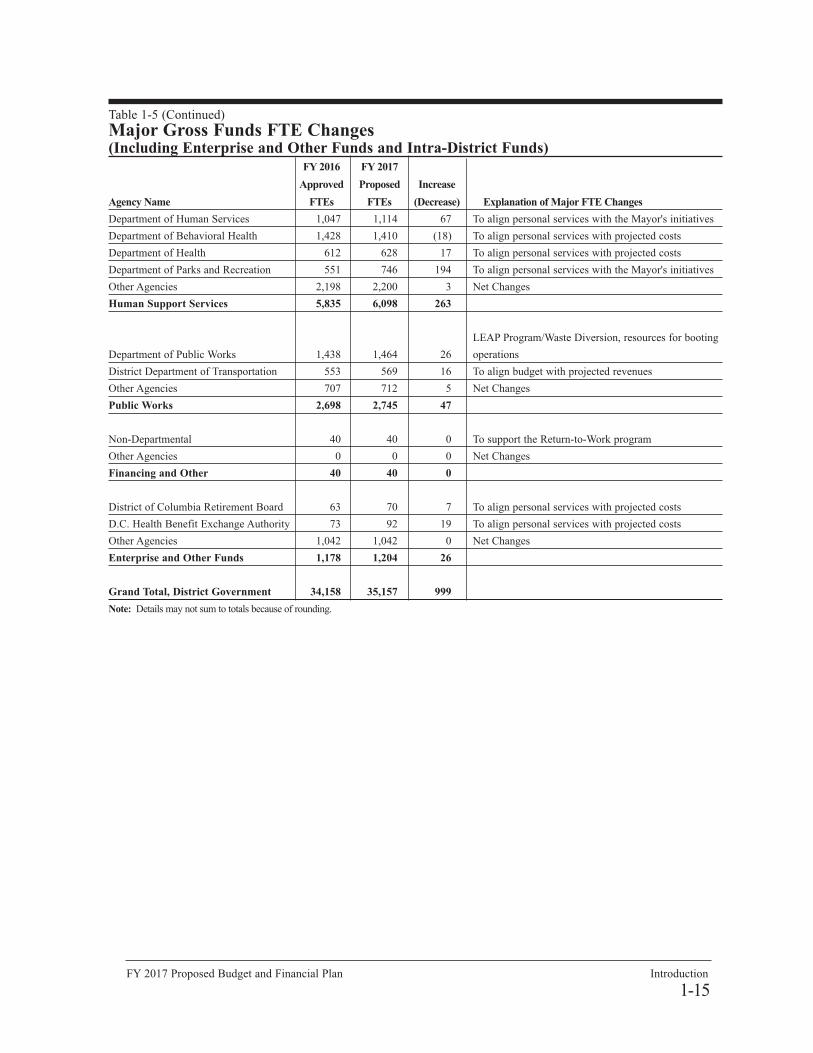
FY 2017 Proposed Budget and Financial Plan Introduction
1-15
Table 1-5 (Continued)
Major Gross Funds FTE Changes (Including Enterprise and Other Funds and Intra-District Funds)
FY 2016 FY 2017
Approved Proposed Increase
Agency Name FTEs FTEs (Decrease) Explanation of Major FTE Changes
Department of Human Services 1,047 1,114 67 To align personal services with the Mayor's initiatives
Department of Behavioral Health 1,428 1,410 (18) To align personal services with projected costs
Department of Health 612 628 17 To align personal services with projected costs
Department of Parks and Recreation 551 746 194 To align personal services with the Mayor's initiatives
Other Agencies 2,198 2,200 3 Net Changes
Human Support Services 5,835 6,098 263
LEAP Program/Waste Diversion, resources for booting
Department of Public Works 1,438 1,464 26 operations
District Department of Transportation 553 569 16 To align budget with projected revenues
Other Agencies 707 712 5 Net Changes
Public Works 2,698 2,745 47
Non-Departmental 40 40 0 To support the Return-to-Work program
Other Agencies 0 0 0 Net Changes
Financing and Other 40 40 0
District of Columbia Retirement Board 63 70 7 To align personal services with projected costs
D.C. Health Benefit Exchange Authority 73 92 19 To align personal services with projected costs
Other Agencies 1,042 1,042 0 Net Changes
Enterprise and Other Funds 1,178 1,204 26
Grand Total, District Government 34,158 35,157 999
Note: Details may not sum to totals because of rounding.

Introduction FY 2017 Proposed Budget and Financial Plan
1-16
Table 1-6
How and When the FY 2017 Operating Budget was Prepared
Budget GuidanceJuly 2015 – September 2015 The FY 2017 budget process began with the development of the Current Services Funding Level (CSFL)
budget. The CSFL is a Local funds ONLY representation of the true cost of operating District agencies, before
consideration of policy decisions. The CSFL reflects changes from the FY 2016 approved budget across
multiple programs and estimates how much it would cost an agency to continue its current programs and
operations into the following fiscal year. The CSFL served as the starting point for all District agencies’ Local
funds Maximum Allowable Request Ceiling (MARC).
Agency Budget Request Development October 2015 – December 2015 Taking into consideration the Office of the City Administrator’s (OCA) citywide strategic plan, and following
the budget guidance from the OCA’s Office of Budget and Finance (OBF) and the Office of Budget and
Planning (OBP), agencies began formulating their FY 2017 budget requests. Agencies submitted their FY
2017 proposed budget to OBP by December 31, 2015.
Budget Analysis October 2015 – December 2015 OBP reviewed agency budgets during the various development stages for adherence to established guidelines,
identified opportunities for efficiencies, and incorporated revised economic data into the formulation process.
Budget Presentation January 2016 – March 2016 OBP collaborated with OBF to conduct a thorough and sound analysis of the budget as it was developed and
revised during the Budget Review Team meetings where policy priorities were determined, and the Mayor’s
FY 2017 proposed budget was finalized for submission to the Council on March 24, 2016.
Note: On March 18, 2016, the Superior Court of the District of Columbia issued an order that upholds the
budget process enacted in the Local Budget Autonomy Act of 2012, by which the District would submit its
budget to Congress similar to other local District laws, subject to a 30-day review by Congress, rather than as
a unique law, requiring an Act of Congress. The Mayor, the Council, and the Chief Financial Officer will work
together to modify the budget process as necessary.

FY 2017 Proposed Budget and Financial Plan Financial Plan
2-1
The District uses the multi-year financial plan as a working tool throughout the fiscal year to monitor the
impact of legislative proposals, programmatic initiatives, and economic changes on the District's near-term
fiscal outlook. This financial plan focuses on the FY 2017 Proposed Budget and its impact on FY 2018 through
FY 2020. It has four sections:
■ Revenues;
■ Expenditures;
■ Composition of Cash Reserves; and
■ Composition of Fund Balance.
The numbering scheme noted below refers to the line numbers on Tables 2-1, 2-2, 2-3, and 2-4. The
amounts in the FY 2015 Actual column are as published in the District’s Comprehensive Annual Financial
Report (CAFR) for FY 2015.
2
Financial Plan
The Financial Plan projects the District’s results of operations forthree fiscal years beyond the proposed FY 2017 operating budgetsof the General Fund (comprised of Local funds, Dedicated Taxes,and Special Purpose Revenue funds) and the Federal and PrivateResources Fund (comprised of Federal Grants, Federal Payments,Federal Medicaid Payments, and Private Grants and Donations).The actual results for the prior fiscal year and the approved andrevised budgets for the current fiscal year are also included as context for FY 2017 through FY 2020 of the financial plan.

Financial Plan FY 2017 Proposed Budget and Financial Plan
2-2
Revenues
2. Taxes. This category includes property, sales, income, and other taxes, which are projected by theOffice of Revenue Analysis. See the Revenue chapter for details.
3. Dedicated Taxes. This includes tax revenues that are dedicated by law to a particular agency for aparticular purpose. The dedicated portion of tax revenues is transferred out of the Local fund and is not available for general budgeting. See the Revenue chapter for details. In Table 2-3, these 12 dedicated taxesare shown as follows:
3a. Deed Recordation and Deed Transfer Taxes for HPTF debt service. The Housing ProductionTrust Fund (HPTF) Second Amendment Act of 2002 requires that 15 percent of the District's DeedRecordation and Transfer Tax Revenue be transferred to the HPTF annually. The HPTF provides funds forthe acquisition, construction, and rehabilitation of affordable multifamily housing projects. These revenuesare recorded directly in the Special Revenue fund outside of the General Fund. The Deed Recordation andTransfer Tax Revenue reflected in this line funds debt service on Revenue Bonds for New Communities projects, which is paid through the General Fund from the 15 percent portion of the Deed Taxes.
3b. Healthcare Provider Tax transfer to Nursing Facility Quality of Care Fund. The HealthcareProvider Tax is an assessment per licensed bed that is paid by each nursing facility in the District. Revenuesfrom the assessments are dedicated to the Nursing Facility Quality of Care Fund. The legislation waspassed in 2004.
3c. General Sales Taxes, Insurance Premiums, and Carefirst Contribution transfers to Healthy
D.C. Fund. The “Fiscal Year 2007 Budget Support Act of 2006”, Section 15b, established the HealthyD.C. Fund and Program. This act states that all tax revenue derived from hospital and medical services cor-porations, except for taxes upon real estate and fees and charges provided for by insurance laws of theDistrict, shall be deposited into the fund and used to finance health care and medical services for qualifying individuals in the District of Columbia. Approximately 40 percent is used to fund the indigentpopulation covered by the Alliance program. This fund is administered by the Department of Health CareFinance.
3d. ICF-IDD Assessment transfer to Stevie Sellows Fund. Each institution providing care to the developmentally disabled in the District of Columbia pays an assessment of 5.5 percent of gross revenuein quarterly installments. All assessments shall be transferred to the Stevie Sellows Quality ImprovementFund. The fund was established to fund quality of care improvements in a qualified ICF-IDD (IntermediateCare Facility for Persons with Intellectual or Developmental Disabilities).
3e. Inpatient Hospital Bed Tax and Provider Fee transfer to Hospital Fund. The hospital bed tax isa $3,788 per licensed bed assessment on hospitals operating in the District. Revenues from the assessmentare dedicated to the Hospital Fund, a non-lapsing fund that is used to fund District state Medicaid services.The bed tax and provider fee sunset after September 30, 2014. The Medicaid Hospital Inpatient RateSupplemental Act of 2015 authorized the District to tax hospitals’ net inpatient revenue for one year beginning October 1, 2015. The Medicaid Hospital Outpatient Supplemental Payment Act of 2015 authorized the District to tax hospitals’ outpatient gross patient revenue for one year beginning October 1, 2015. Both taxes will be transferred to the Hospital Provider Fee Fund.
3f. General Sales Taxes transfer to Washington Metropolitan Area Transit Authority (WMATA) –
Parking Taxes. Beginning in FY 2012, all parking sales tax revenue is used to help meet the District’sfunding responsibility for WMATA.
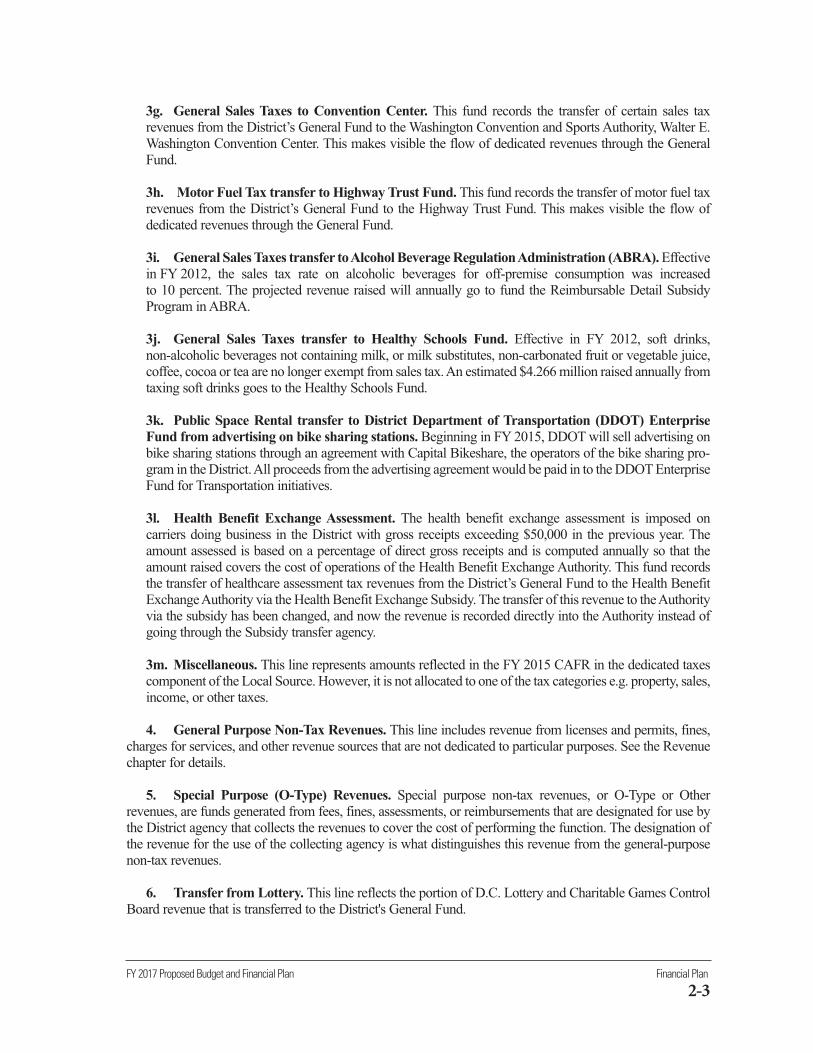
FY 2017 Proposed Budget and Financial Plan Financial Plan
2-3
3g. General Sales Taxes to Convention Center. This fund records the transfer of certain sales tax revenues from the District’s General Fund to the Washington Convention and Sports Authority, Walter E.Washington Convention Center. This makes visible the flow of dedicated revenues through the GeneralFund.
3h. Motor Fuel Tax transfer to Highway Trust Fund. This fund records the transfer of motor fuel taxrevenues from the District’s General Fund to the Highway Trust Fund. This makes visible the flow of dedicated revenues through the General Fund.
3i. General Sales Taxes transfer to Alcohol Beverage Regulation Administration (ABRA). Effectivein FY 2012, the sales tax rate on alcoholic beverages for off-premise consumption was increasedto 10 percent. The projected revenue raised will annually go to fund the Reimbursable Detail SubsidyProgram in ABRA.
3j. General Sales Taxes transfer to Healthy Schools Fund. Effective in FY 2012, soft drinks, non-alcoholic beverages not containing milk, or milk substitutes, non-carbonated fruit or vegetable juice, coffee, cocoa or tea are no longer exempt from sales tax. An estimated $4.266 million raised annually fromtaxing soft drinks goes to the Healthy Schools Fund.
3k. Public Space Rental transfer to District Department of Transportation (DDOT) Enterprise
Fund from advertising on bike sharing stations. Beginning in FY 2015, DDOT will sell advertising onbike sharing stations through an agreement with Capital Bikeshare, the operators of the bike sharing pro-gram in the District. All proceeds from the advertising agreement would be paid in to the DDOT EnterpriseFund for Transportation initiatives.
3l. Health Benefit Exchange Assessment. The health benefit exchange assessment is imposed on carriers doing business in the District with gross receipts exceeding $50,000 in the previous year. Theamount assessed is based on a percentage of direct gross receipts and is computed annually so that theamount raised covers the cost of operations of the Health Benefit Exchange Authority. This fund recordsthe transfer of healthcare assessment tax revenues from the District’s General Fund to the Health BenefitExchange Authority via the Health Benefit Exchange Subsidy. The transfer of this revenue to the Authorityvia the subsidy has been changed, and now the revenue is recorded directly into the Authority instead ofgoing through the Subsidy transfer agency.
3m. Miscellaneous. This line represents amounts reflected in the FY 2015 CAFR in the dedicated taxescomponent of the Local Source. However, it is not allocated to one of the tax categories e.g. property, sales,income, or other taxes.
4. General Purpose Non-Tax Revenues. This line includes revenue from licenses and permits, fines,charges for services, and other revenue sources that are not dedicated to particular purposes. See the Revenuechapter for details.
5. Special Purpose (O-Type) Revenues. Special purpose non-tax revenues, or O-Type or Other revenues, are funds generated from fees, fines, assessments, or reimbursements that are designated for use bythe District agency that collects the revenues to cover the cost of performing the function. The designation ofthe revenue for the use of the collecting agency is what distinguishes this revenue from the general-purposenon-tax revenues.
6. Transfer from Lottery. This line reflects the portion of D.C. Lottery and Charitable Games ControlBoard revenue that is transferred to the District's General Fund.

Financial Plan FY 2017 Proposed Budget and Financial Plan
2-4
7. Subtotal, Revenues. This line reflects the sum of lines 1 through 6.
8. Bond Proceeds for Issuance Costs. This is the portion of the bond proceeds that will be used to cover
the cost of issuing General Obligation (or Income Tax Revenue) bonds. The related expenditure is on line 25.
9. Fund Balance Use from FY 2015. This reflects the reservation of fund balance in FY 2015 that is
budgeted for use in future years.
10. Fund Balance Use from FY 2016. This reflects the reservation of fund balance in FY 2016 that is
budgeted for use in future years.
10a. Certified Resources not used. In Table 2-4, this line shows the total amount of certified resources
not used by agencies in their particular funds and returned to their relevant fund balances.
11. Interfund Transfers from Special Purpose Revenue (SPR) and other funds. This line shows the
movement of funds from the fund balance between SPR, Dedicated Tax, and Local Funds within the General
Fund as itemized below.
11a. Interfund Transfers from SPR and other – FY 2015. This line shows the movement of funds from
SPR and other funds from FY 2015.
11b. Interfund Transfers from SPR and other – FY 2016. This line shows the movement of funds from
SPR and other funds from FY 2016.
12. Central Services Cost Allocation from Federal Funds. This line reflects the movement of Indirect
Cost Recovery (IDCR) funds from Federal Grant Funds, designated by the grantor, into Local funds, to cover
administrative costs.
13. Transfer from Enterprise and Other Funds. In Table 2-1, this line shows transfer of funds from
Enterprise and other Special Revenue Funds as itemized below and in Tables 2-2 and 2-4.
13a. Transfer from TIF/PILOT/Other. In Tables 2-2 and 2-4, the amounts include transfers into the
General Fund from the Tax Increment Financing (TIF), the Payment in Lieu of Taxes (PILOT), and other
outside [Enterprise] funds.
13b. Transfer from Capital Fund Paygo. In Table 2-2, the amount shown is transferred into the General
Fund from the Capital Improvements Fund. No bond proceeds are transferred; only capital funds that were
originally Pay-as-you-go (Paygo) funds can be transferred.
14. Revenue Proposals. This line reflects proposed revenue changes that are detailed in the Revenue
chapter of this volume.
15. Total General Fund Resources. This line shows the sum of the individual revenue and fund balance
items presented in lines 7 through 14 above.
16. Line intentionally left blank.
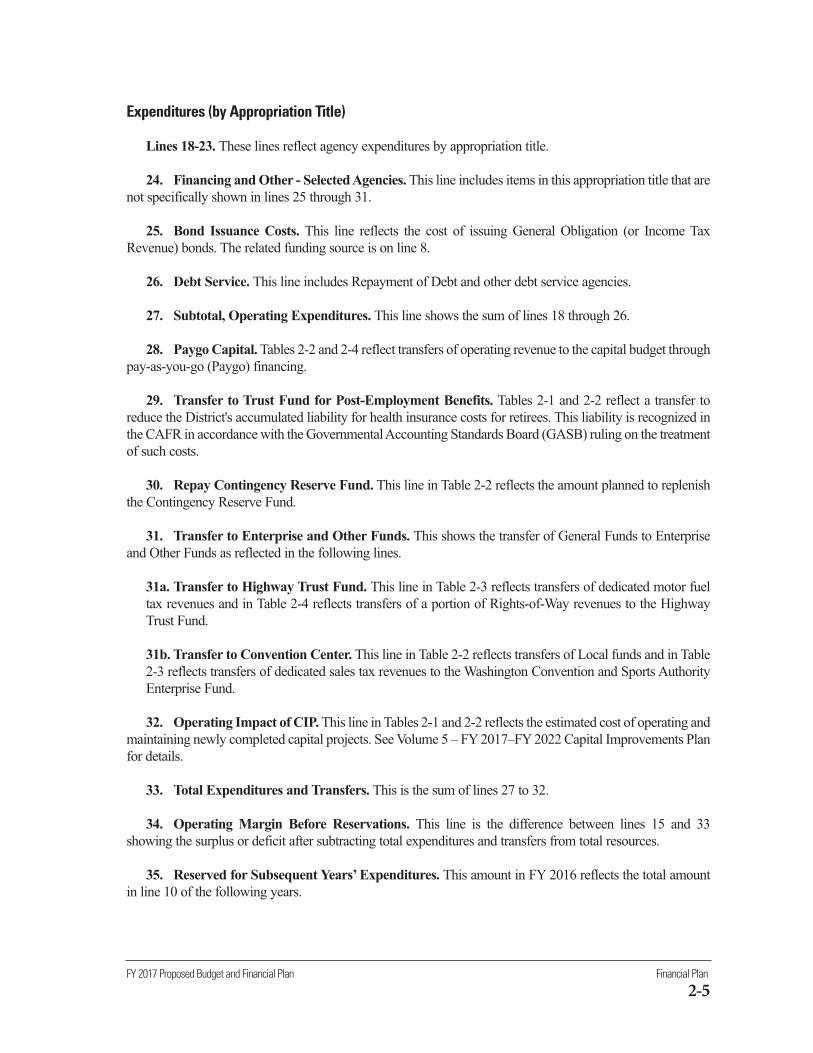
FY 2017 Proposed Budget and Financial Plan Financial Plan
2-5
Expenditures (by Appropriation Title)
Lines 18-23. These lines reflect agency expenditures by appropriation title.
24. Financing and Other - Selected Agencies. This line includes items in this appropriation title that are
not specifically shown in lines 25 through 31.
25. Bond Issuance Costs. This line reflects the cost of issuing General Obligation (or Income Tax
Revenue) bonds. The related funding source is on line 8.
26. Debt Service. This line includes Repayment of Debt and other debt service agencies.
27. Subtotal, Operating Expenditures. This line shows the sum of lines 18 through 26.
28. Paygo Capital. Tables 2-2 and 2-4 reflect transfers of operating revenue to the capital budget through
pay-as-you-go (Paygo) financing.
29. Transfer to Trust Fund for Post-Employment Benefits. Tables 2-1 and 2-2 reflect a transfer to
reduce the District's accumulated liability for health insurance costs for retirees. This liability is recognized in
the CAFR in accordance with the Governmental Accounting Standards Board (GASB) ruling on the treatment
of such costs.
30. Repay Contingency Reserve Fund. This line in Table 2-2 reflects the amount planned to replenish
the Contingency Reserve Fund.
31. Transfer to Enterprise and Other Funds. This shows the transfer of General Funds to Enterprise
and Other Funds as reflected in the following lines.
31a. Transfer to Highway Trust Fund. This line in Table 2-3 reflects transfers of dedicated motor fuel
tax revenues and in Table 2-4 reflects transfers of a portion of Rights-of-Way revenues to the Highway
Trust Fund.
31b. Transfer to Convention Center. This line in Table 2-2 reflects transfers of Local funds and in Table
2-3 reflects transfers of dedicated sales tax revenues to the Washington Convention and Sports Authority
Enterprise Fund.
32. Operating Impact of CIP. This line in Tables 2-1 and 2-2 reflects the estimated cost of operating and
maintaining newly completed capital projects. See Volume 5 – FY 2017–FY 2022 Capital Improvements Plan
for details.
33. Total Expenditures and Transfers. This is the sum of lines 27 to 32.
34. Operating Margin Before Reservations. This line is the difference between lines 15 and 33
showing the surplus or deficit after subtracting total expenditures and transfers from total resources.
35. Reserved for Subsequent Years’ Expenditures. This amount in FY 2016 reflects the total amount
in line 10 of the following years.

36. Operating Margin After Reservations. This is the difference between Total General Fund
Resources (line 15) and the total of Expenditures and Transfers (line 33) and Reserved for Subsequent Years’
Expenditures (line 35).
37. Line intentionally left blank.
38. Beginning General Fund Balance. Shows the accumulated fund balance at the beginning of the
fiscal year, which is identical to the end-of-year fund balance for the previous fiscal year.
39. Operating Margin Before Reservations. This is the same as line 34.
40. Projected GAAP Adjustments (Net). GAAP adjustments are year-end adjustments necessary to
properly report the ending fund balance on an accounting basis by converting budgeted activity to resources
earned and used.
41. Fund Balance Use. The amount of prior-year fund balance that is used in the current year must be
subtracted when calculating the current year-end fund balance. The amount is the total of lines 9, 10, and 11.
42. Ending General Fund Balance. This line shows the sum of the beginning fund balance, the
operating margin before reservations, and GAAP and other adjustments (lines 38 through 41).
43. Line intentionally left blank.
Composition of Cash Reserves
45. Emergency Cash Reserve Balance (2 percent). The District was required to establish an
Emergency Reserve by the end of FY 2004, equal to 4 percent of the District's Local expenditures. The
requirement was satisfied in FY 2002. In FY 2005, the requirement was changed to 2 percent, and the base for
the calculation was also changed.
46. Contingency Cash Reserve Balance (4 percent). The District was required to establish a
Contingency Reserve by the end of FY 2007, equal to 3 percent of the District's Local expenditures. The
requirement was satisfied in FY 2002. In FY 2005, the requirement was changed to 4 percent, and the base for
the calculation was also changed.
47. Cash Flow Reserve (8.33 percent). The cash flow reserve may be used by the District’s CFO as
needed to manage the District’s cash flow. When a portion of the reserve is used to meet cash flow needs, this
reserve must be replenished in the same fiscal year the amounts were used. At full funding, the cash flow
reserve must equal 8.33 percent of the General Fund operating budget for each fiscal year. This Account was
established by section 47-392.02(j-1) of the District of Columbia Official Code. The Fiscal Year 2011 Budget
Request Act of 2010 authorizes 50 percent of the undesignated end-of-year fund balance to be deposited in
this account. Of the four reserves, the Cash Flow Reserve is the only one that does not reach its full targeted
level during the financial plan period.
Financial Plan FY 2017 Proposed Budget and Financial Plan
2-6

FY 2017 Proposed Budget and Financial Plan Financial Plan
2-7
48. Fiscal Stabilization Reserve (2.34 percent). The fiscal stabilization reserve may be used by the
Mayor for the same purposes for which the contingency reserve was established. However, this reserve may
not be used for cash flow management purposes. At full funding, the fiscal stabilization reserve must equal
2.34 percent of the District’s General Fund operating expenditures for each fiscal year. This Account was
established by section 47-392.02(j-1) of the District of Columbia Official Code. The Fiscal Year 2011 Budget
Request Act of 2010 authorizes 50 percent of the undesignated end-of-year fund balance to be deposited in
this account.
49. Total Cash Reserves. This is the sum of lines 45 - 48.

Financial Plan FY 2017 Proposed Budget and Financial Plan
2-8
Table 2-1 FY 2017 - FY 2020 Proposed Budget and Financial Plan: GENERAL FUND($ thousands)
FY 2015 FY 2016 FY 2016 FY 2017 FY 2018 FY 2019 FY 2020Actual Approved Revised Proposed Projected Projected Projected
1 Revenues
2 Taxes 6,432,194 6,429,677 6,420,938 6,647,921 6,889,583 7,122,357 7,365,755
3 Dedicated Taxes 285,287 304,467 301,718 290,924 291,243 295,551 299,344
4 General Purpose Non-Tax Revenues 414,910 383,988 422,082 422,779 407,561 407,902 395,360
5 Special Purpose (O-type) Revenues 524,826 533,496 516,692 546,907 538,742 547,337 550,570
6 Transfer from Lottery 55,586 62,500 55,000 55,500 56,000 56,500 57,000
7 Subtotal, General Fund Revenues 7,712,803 7,714,128 7,716,431 7,964,031 8,183,129 8,429,647 8,668,029
8 Bond Proceeds for Issuance Costs 4,894 6,000 6,000 6,000 6,000 6,000 6,000
9 Fund Balance Use from FY 2015 60,410 161,393 449,866 33,996 0 0 0
10 Fund Balance Use from FY 2016 0 0 0 62,052 13,796 1,234 54,075
11 Interfund Transfers from SPR and Other Funds 0 49,925 49,925 85,157 1,389 0 0
12 Central Services Cost Allocation from Federal Funds 1,466 2,363 2,363 2,363 2,363 2,363 2,363
13 Transfer from Enterprise and Other Funds 57,583 24,122 16,121 12,799 13,112 14,203 15,419
14 Revenue Proposals 0 22,669 3,721 26,696 9,496 9,489 9,481
15 Total General Fund Resources 7,837,156 7,980,600 8,244,428 8,193,095 8,229,285 8,462,936 8,755,368
16
17 Expenditures (by Appropriation Title)
18 Governmental Direction and Support 674,876 756,796 815,154 798,711 811,393 827,380 842,608
19 Economic Development and Regulation 320,080 440,037 487,555 474,240 390,137 400,574 406,760
20 Public Safety and Justice 1,045,398 1,158,185 1,234,823 1,198,402 1,191,437 1,215,344 1,239,760
21 Public Education System 1,853,130 1,908,452 1,919,592 2,007,639 2,036,190 2,075,773 2,116,082
22 Human Support Services 1,857,486 1,913,747 1,904,389 1,933,035 1,950,453 1,994,257 2,031,921
23 Public Works 653,046 735,893 746,754 740,192 745,551 762,423 779,754
24 Financing and Other - Selected Agencies 42,658 65,139 76,644 49,333 65,022 55,356 56,395
25 Bond Issuance Costs (ZB0) 5,638 6,000 6,000 6,000 6,000 6,000 6,000
26 Debt Service (DS0, CP0, SM0, DT0, ELO) 631,874 671,011 650,878 679,378 752,360 832,064 930,951
27 Subtotal, Operating Expenditures 7,084,185 7,655,260 7,841,788 7,886,929 7,948,544 8,169,172 8,410,231
28 Paygo Capital (PA0) 136,245 72,466 83,110 125,294 89,089 92,977 139,914
29 Transfer to Trust Fund for Post-Employment Benefits (RH0) 91,400 95,400 29,000 31,000 33,200 35,600 38,200
30 Repay Contingency Reserve Fund (SV0) 0 0 59,202 0 0 0 0
31 Transfer to Enterprise and Other Funds 160,659 147,558 147,808 147,040 150,157 154,653 158,607
32 Operating Impact of CIP 0 0 0 0 7,795 10,034 7,558
33 Total Expenditures and Transfers 7,472,488 7,970,683 8,160,908 8,190,263 8,228,785 8,462,435 8,754,510
34 Operating Margin Before Reservations 364,667 9,917 83,519 2,831 500 500 858
35 Reserved for Subsequent Years' Expenditures 0 0 72,021 0 0 0 0
36 Operating Margin After Reservations 364,667 9,917 11,498 2,831 500 500 858
37
(Continued on next page)
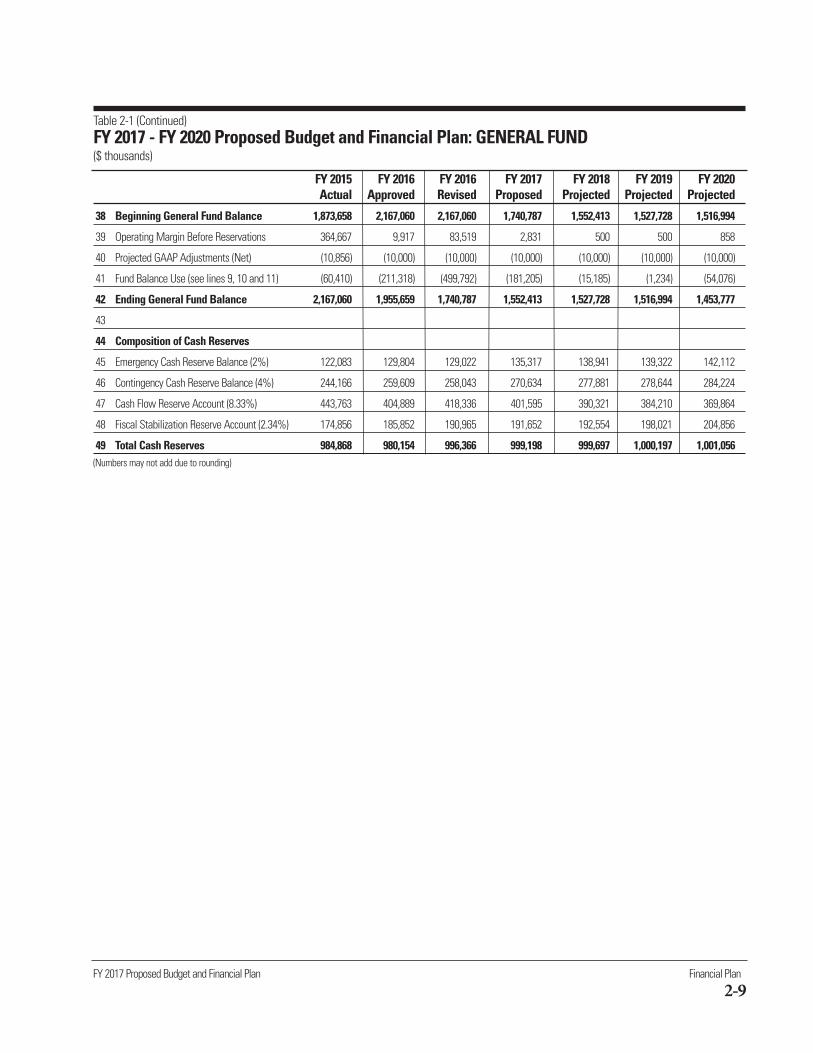
FY 2017 Proposed Budget and Financial Plan Financial Plan
2-9
FY 2015 FY 2016 FY 2016 FY 2017 FY 2018 FY 2019 FY 2020 Actual Approved Revised Proposed Projected Projected Projected
38 Beginning General Fund Balance 1,873,658 2,167,060 2,167,060 1,740,787 1,552,413 1,527,728 1,516,994
39 Operating Margin Before Reservations 364,667 9,917 83,519 2,831 500 500 858
40 Projected GAAP Adjustments (Net) (10,856) (10,000) (10,000) (10,000) (10,000) (10,000) (10,000)
41 Fund Balance Use (see lines 9, 10 and 11) (60,410) (211,318) (499,792) (181,205) (15,185) (1,234) (54,076)
42 Ending General Fund Balance 2,167,060 1,955,659 1,740,787 1,552,413 1,527,728 1,516,994 1,453,777
43
44 Composition of Cash Reserves
45 Emergency Cash Reserve Balance (2%) 122,083 129,804 129,022 135,317 138,941 139,322 142,112
46 Contingency Cash Reserve Balance (4%) 244,166 259,609 258,043 270,634 277,881 278,644 284,224
47 Cash Flow Reserve Account (8.33%) 443,763 404,889 418,336 401,595 390,321 384,210 369,864
48 Fiscal Stabilization Reserve Account (2.34%) 174,856 185,852 190,965 191,652 192,554 198,021 204,856
49 Total Cash Reserves 984,868 980,154 996,366 999,198 999,697 1,000,197 1,001,056(Numbers may not add due to rounding)
Table 2-1 (Continued)FY 2017 - FY 2020 Proposed Budget and Financial Plan: GENERAL FUND($ thousands)
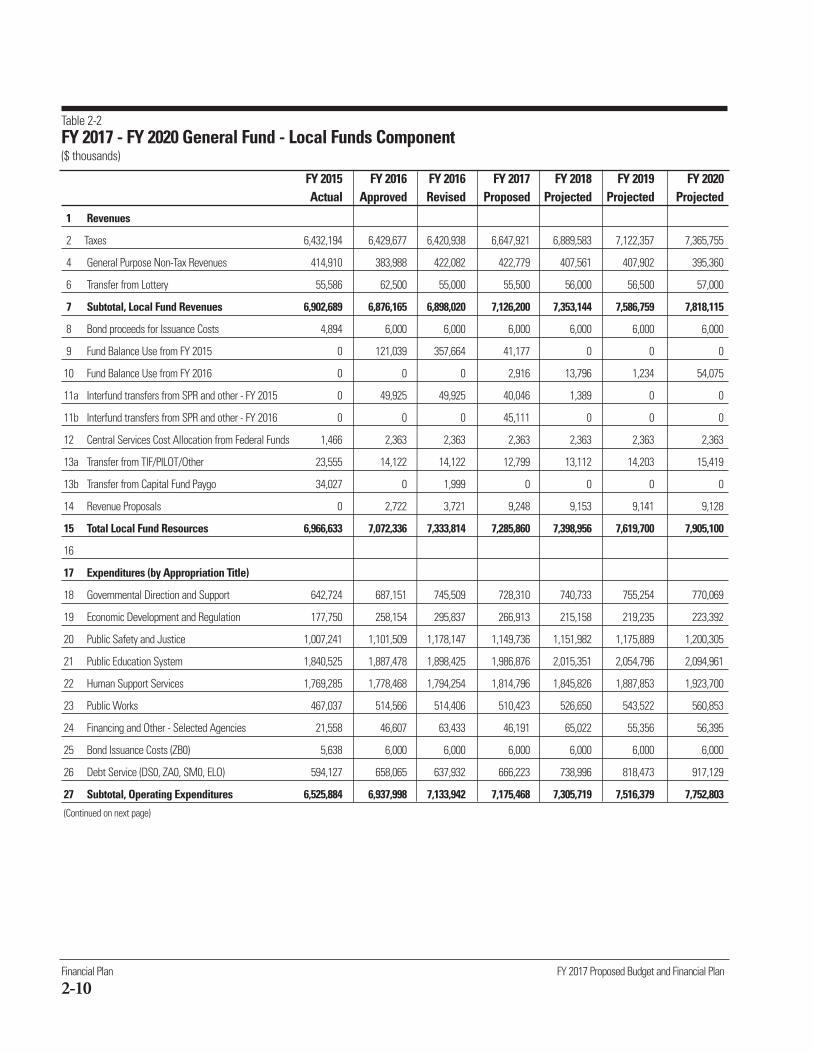
Financial Plan FY 2017 Proposed Budget and Financial Plan
2-10
Table 2-2 FY 2017 - FY 2020 General Fund - Local Funds Component($ thousands)
FY 2015 FY 2016 FY 2016 FY 2017 FY 2018 FY 2019 FY 2020Actual Approved Revised Proposed Projected Projected Projected
1 Revenues
2 Taxes 6,432,194 6,429,677 6,420,938 6,647,921 6,889,583 7,122,357 7,365,755
4 General Purpose Non-Tax Revenues 414,910 383,988 422,082 422,779 407,561 407,902 395,360
6 Transfer from Lottery 55,586 62,500 55,000 55,500 56,000 56,500 57,000
7 Subtotal, Local Fund Revenues 6,902,689 6,876,165 6,898,020 7,126,200 7,353,144 7,586,759 7,818,115
8 Bond proceeds for Issuance Costs 4,894 6,000 6,000 6,000 6,000 6,000 6,000
9 Fund Balance Use from FY 2015 0 121,039 357,664 41,177 0 0 0
10 Fund Balance Use from FY 2016 0 0 0 2,916 13,796 1,234 54,075
11a Interfund transfers from SPR and other - FY 2015 0 49,925 49,925 40,046 1,389 0 0
11b Interfund transfers from SPR and other - FY 2016 0 0 0 45,111 0 0 0
12 Central Services Cost Allocation from Federal Funds 1,466 2,363 2,363 2,363 2,363 2,363 2,363
13a Transfer from TIF/PILOT/Other 23,555 14,122 14,122 12,799 13,112 14,203 15,419
13b Transfer from Capital Fund Paygo 34,027 0 1,999 0 0 0 0
14 Revenue Proposals 0 2,722 3,721 9,248 9,153 9,141 9,128
15 Total Local Fund Resources 6,966,633 7,072,336 7,333,814 7,285,860 7,398,956 7,619,700 7,905,100
16
17 Expenditures (by Appropriation Title)
18 Governmental Direction and Support 642,724 687,151 745,509 728,310 740,733 755,254 770,069
19 Economic Development and Regulation 177,750 258,154 295,837 266,913 215,158 219,235 223,392
20 Public Safety and Justice 1,007,241 1,101,509 1,178,147 1,149,736 1,151,982 1,175,889 1,200,305
21 Public Education System 1,840,525 1,887,478 1,898,425 1,986,876 2,015,351 2,054,796 2,094,961
22 Human Support Services 1,769,285 1,778,468 1,794,254 1,814,796 1,845,826 1,887,853 1,923,700
23 Public Works 467,037 514,566 514,406 510,423 526,650 543,522 560,853
24 Financing and Other - Selected Agencies 21,558 46,607 63,433 46,191 65,022 55,356 56,395
25 Bond Issuance Costs (ZB0) 5,638 6,000 6,000 6,000 6,000 6,000 6,000
26 Debt Service (DS0, ZA0, SM0, ELO) 594,127 658,065 637,932 666,223 738,996 818,473 917,129
27 Subtotal, Operating Expenditures 6,525,884 6,937,998 7,133,942 7,175,468 7,305,719 7,516,379 7,752,803
(Continued on next page)

FY 2017 Proposed Budget and Financial Plan Financial Plan
2-11
The following table details the sources of fund balance from FY 2015 that are used in FY 2016 and FY 2017, asshown in line 9 of the Local funds financial plan (table 2-2). These amounts come from the FY 2015Comprehensive Annual Financial Report (CAFR). Some are displayed as specific lines in CAFR table N60a (Note 11), while others are within broader categories displayed in that table.
Table 2-2 (continued)FY 2017 - FY 2020 General Fund - Local Funds Component ($ thousands)
FY 2015 FY 2016 FY 2016 FY 2017 FY 2018 FY 2019 FY 2020 Actual Approved Revised Proposed Projected Projected Projected
28 Paygo Capital (PA0) 98,238 21,449 30,784 75,705 48,500 53,888 102,325 29 Transfer to Trust Fund for Post-Employment
Benefits (RH0) 91,400 95,400 29,000 31,000 33,200 35,600 38,200
30 Repay Contingency Reserve Fund (SV0) 0 0 59,202 0 0 0 0
31b Transfer to Convention Center (EZ0) 4,000 8,115 8,365 3,186 3,242 3,299 3,356
32 Operating Impact of CIP 0 0 0 0 7,795 10,034 7,558
33 Total Local Fund Expenditures and Transfers 6,719,522 7,062,962 7,261,292 7,285,360 7,398,457 7,619,200 7,904,242
34 Operating Margin Before Reservations 247,110 9,373 72,521 500 500 500 858
35 Reserved for Subsequent Years' Expenditures 0 0 72,021 0 0 0 0
36 Operating Margin After Reservations 247,110 9,373 500 500 500 500 858
(Numbers may not add due to rounding)
Table 2-2aDetails on Fund Balance Use from FY 2015 (line 9 of Local funds component)($ thousands)
FY 2016 FY 2016 FY 2017
Fund Balance Use from FY 2015 Approved Revised Proposed
FY 2016 Budget 67,660 67,660
FY 2015/16 Supplemental Budget 28,288 28,288
Section 101 (Firefighters' settlement) 47,000
Section 101 (Department of Corrections) 16,650
Set aside in FY 2015 fund balance for FY 2016 use 21,000
Commodity Cost Reserve (FY 2014 value, reserved for budget use in FY 2015 CAFR) 25,091 25,091
Commodity Cost Reserve (FY 2015 value) 19,477
Local carryover (multiple agencies) 56,442
Contingency Reserve (multiple agencies) 95,533
WMATA operations fund 21,700
Total 121,039 357,664 41,177
(Numbers may not add due to rounding)

Financial Plan FY 2017 Proposed Budget and Financial Plan
2-12
FY 2015 FY 2016 FY 2016 FY 2017 FY 2018 FY 2019 FY 2020Actual Approved Revised Proposed Projected Projected Projected
1 Revenues3a Deed Recordation and Deed Transfer to HPTF
for debt service 7,829 7,832 7,832 7,835 7,832 7,839 7,839
3b Healthcare Provider Tax transfer to Nursing Facility
Quality of Care Fund 12,854 15,117 14,591 14,883 15,181 15,485 15,794
3c General Sales Taxes, Insurance Premiums, and Carefirst
Contribution transfers to Healthy DC Fund 44,805 34,342 45,642 46,727 48,080 49,025 49,988
3d ICF-IDD Assessment transfer to Stevie Sellows Fund 5,032 5,519 5,478 5,519 5,629 5,742 5,866
3e Inpatient Hospital Bed Tax and Provider Fee transfer
to Hospital Fund 0 0 17,100 0 0 0 0
3f General Sales Taxes transfer to WMATA - Parking Taxes 67,446 66,664 66,664 66,670 66,670 66,670 66,670
3g General Sales Taxes transfer to Convention Center 116,448 116,939 113,971 119,100 117,909 121,093 123,733
3h Motor Fuel Tax transfer to Highway Trust Fund 25,256 22,504 25,004 24,754 24,506 24,261 24,018
3i General Sales Taxes transfer to ABRA 1,170 1,170 1,170 1,170 1,170 1,170 1,170
3j General Sales Taxes transfer to Healthy Schools Fund 4,266 4,266 4,266 4,266 4,266 4,266 4,266
3k Public Space Rental transfer to DDOT Enterprise
Fund from advertising on bike sharing stations 0 500 0 0 0 0 0
3l Health Benefit Exchange Assessment 0 29,614 0 0 0 0 0
3m Miscellaneous 181 0 0 0 0 0 0
7 Subtotal, Dedicated Taxes 285,287 304,467 301,718 290,924 291,243 295,551 299,344
9 Fund Balance Use from FY 2015 0 40 40 0 0 0 0
10 Fund Balance Use from FY 2016 0 0 0 16 0 0 0
14 Revenue Proposals 0 16,410 0 17,109 0 0 0
15 Total Dedicated Taxes 285,287 320,917 301,758 308,050 291,243 295,551 299,344
16
(Continued on next page)
Table 2-3 FY 2017 - FY 2020 General Fund - Dedicated Taxes Component($ thousands)

FY 2017 Proposed Budget and Financial Plan Financial Plan
2-13
FY 2015 FY 2016 FY 2016 FY 2017 FY 2018 FY 2019 FY 2020 Actual Approved Revised Proposed Projected Projected Projected
17 Expenditures (by Appropriation Title)
18 Governmental Direction and Support 0 0 0 0 0 0 0
19 Economic Development and Regulation 925 1,170 1,170 1,170 1,170 1,170 1,170
20 Public Safety and Justice 0 0 0 0 0 0 0
21 Public Education System 4,848 4,306 4,306 4,282 4,266 4,266 4,266
22 Human Support Services 62,779 100,959 71,345 81,907 68,890 70,252 71,648
23 Public Works 71,648 66,664 66,664 66,670 66,670 66,670 66,670
24 Financing and Other - Selected Agencies 0 0 0 0 0 0 0
26 Debt Service (DT0) 7,829 7,832 7,832 7,835 7,832 7,839 7,839
27 Subtotal, Operating Expenditures 148,029 180,931 151,317 161,865 148,828 150,197 151,593
31a Transfer to Highway Trust Fund (KZ0) 25,256 22,504 22,504 24,754 24,506 24,261 24,018
31b Transfer to Convention Center (EZ0) 116,448 116,939 116,939 119,100 117,909 121,093 123,733
33 Total Dedicated Taxes Expenditures and Transfers 289,733 320,374 290,760 305,718 291,243 295,551 299,344
34 Operating Margin (4,446) 543 10,998 2,331 0 0 0
(Numbers may not add due to rounding)
Table 2-3 (Continued)FY 2017 - FY 2020 General Fund - Dedicated Taxes Component($ thousands)

FY 2015 FY 2016 FY 2016 FY 2017 FY 2018 FY 2019 FY 2020 Actual Approved Revised Proposed Projected Projected Projected
1 Revenues
5 Special Purpose (O-type) Revenues 524,826 533,496 516,692 546,907 538,742 547,337 550,570
7 Subtotal, Special Purpose Revenue Funds 524,826 533,496 516,692 546,907 538,742 547,337 550,570
9 Fund Balance Use from FY 2015 60,410 49,996 94,313 0 0 0 0
10 Fund Balance Use from FY 2016 0 0 0 59,120 0 0 0
10a Certified Resources not used 0 (9,682) (2,151) (7,181) 0 0 0
13a Transfer from TIF/PILOT/Other 0 10,000 0 0 0 0 0
14 Revenue Proposals 0 3,537 0 339 343 348 353
15 Total Special Purpose Revenue Funds 585,236 587,347 608,855 599,185 539,085 547,685 550,923
16
17 Expenditures (by Appropriation Title)
18 Governmental Direction and Support 32,152 69,645 69,645 70,402 70,660 72,125 72,539
19 Economic Development and Regulation 141,405 180,713 190,549 206,157 173,809 180,168 182,199
20 Public Safety and Justice 38,157 56,676 56,676 48,666 39,455 39,455 39,455
21 Public Education System 7,755 16,669 16,862 16,480 16,573 16,711 16,854
22 Human Support Services 25,422 34,319 38,789 36,332 35,737 36,152 36,573
23 Public Works 114,361 154,662 165,684 163,099 152,231 152,231 152,231
24 Financing and Other - Selected Agencies 21,100 18,532 13,211 3,142 0 0 0
25 Debt Service (DS0) 29,918 5,114 5,114 5,319 5,531 5,753 5,983
27 Subtotal, Operating Expenditures 410,270 536,331 556,529 549,596 493,996 502,596 505,835
28 Paygo Capital (PA0) 38,007 51,017 52,326 49,589 40,589 39,089 37,589
31a Transfer to Highway Trust Fund (KZ0) 14,954 0 0 0 4,500 6,000 7,500
33 Total Special Purpose Revenue Expenditures
and Transfers 463,230 587,347 608,855 599,185 539,085 547,685 550,923
34 Operating Margin 122,005 0 0 0 0 0 0 (Numbers may not add due to rounding)
Table 2-4 FY 2017 - FY 2020 General Fund - Special Purpose Revenue Component ($ thousands)
Financial Plan FY 2017 Proposed Budget and Financial Plan
2-14

FY 2017 Proposed Budget and Financial Plan Financial Plan
2-15
Federal and Private Resources Fund
■ Federal Grants are grants the District receives from federal agencies, including block grants, formula
grants, certain entitlements, and competitive grants.
■ Federal Payments are direct appropriations from the Congress to the District, usually to a particular
District agency for a particular purpose.
■ Federal Medicaid Payments are the federal share of the District's Medicaid costs. Generally, the
federal government pays 70 percent of the cost of Medicaid while the District pays 30 percent, although
the proportions differ in certain circumstances.
■ Private Grants are grants the District receives from non-Federal sources. This category includes private
donations.
Table 2-5 displays a summary financial plan for the Federal and Private Resources Fund. The line items are as fol-lows:F1. Federal Grants. Federal grant awards received by District agencies.
F2. Federal Payments. Funding contributed by the federal government for specific projects. These funds
are restricted in use by the federal government.
F3. Private Grants. Revenues received from private grants.
F4. Subtotal, Federal and Private Resources. This line is the sum of lines F1 through F3.
F5. Fund Balance Use. In Table 2-5, this line shows $8.7 million of fund balance use in FY 2015 as
certified in the District’s Comprehensive Annual Financial Report (CAFR), Exhibit 2-d.
F6. Transfer to General Fund. This line represents funds used to pay for indirect costs, as shown on line
12 in Tables 2-1 and 2-2.
F7. Total Federal and Private Resources. This is the sum of lines F4 through F6.
F8. Line intentionally left blank.
F9-F16. Expenditures by Appropriation Title. These items reflect agency expenditures by appropriation
title.
F17. Debt Service. This line includes Repayment of Debt and other debt service agencies.
F18. Total Federal and Private Expenditures.
F19. Operating Margin. This is the difference between Total Federal and Private Resources (line F7) and
Total Federal and Private Expenditures (line F18).

FY 2015 FY 2016 FY 2016 FY 2017 FY 2018 FY 2019 FY 2020Revenues Actual Approved Revised Proposed Projected Projected Projected
F1 Federal Grants 2,723,610 3,160,022 3,270,304 3,278,748 3,337,157 3,396,615 3,457,141
F2 Federal Payments 66,850 100,900 108,177 131,930 134,323 136,760 139,241
F3 Private Grants 2,141 1,501 4,144 1,321 1,347 1,373 1,399
F4 Subtotal, Federal & Private Resources 2,792,601 3,262,422 3,382,626 3,411,999 3,472,826 3,534,747 3,597,782
F5 Fund Balance Use 8,716 0 0 0 0 0 0
F6 Transfer to General Fund (1,466) (2,363) (2,363) (2,363) (2,363) (2,363) (2,363)
F7 Total Federal & Private Resources 2,799,851 3,260,059 3,380,263 3,409,636 3,470,463 3,532,384 3,595,419
F8
F9 Expenditures (by Appropriation Title)
F10 Governmental Direction and Support 25,042 29,667 35,120 30,226 30,823 31,433 32,054
F11 Economic Development and Regulation 66,572 100,718 100,013 93,240 94,979 96,751 98,557
F12 Public Safety and Justice 91,721 150,405 154,667 159,554 162,442 165,383 168,377
F13 Public Education System 276,284 324,839 352,670 363,612 370,163 376,833 383,623
F14 Human Support Services 2,259,452 2,588,645 2,668,217 2,670,214 2,717,588 2,765,806 2,814,885
F15 Public Works 25,899 34,524 38,214 39,632 40,381 41,145 41,924
F16 Financing and Other - Selected Agencies 19,009 13,000 13,000 34,895 35,506 36,127 36,759
F17 Debt Service (DS0) 18,440 18,262 18,361 18,262 18,582 18,907 19,238
F18 Total Federal & Private Expenditures 2,782,418 3,260,059 3,380,263 3,409,636 3,470,463 3,532,384 3,595,419
F19 Operating Margin 17,433 0 0 0 0 0 0 (Numbers may not add due to rounding)
Table 2-5FY 2017 - FY 2020 Federal and Private Resources Financial Plan($ thousands)
Financial Plan FY 2017 Proposed Budget and Financial Plan
2-16
FY 2017 Proposed Budget and Financial Plan Financial Plan
2-17
General Fund A fund is a fiscal and accounting entity with a self-balancing set of accounts that the District uses to keep track ofspecific sources of funding and spending for a particular purpose. An appropriated fund is a collection of appropriated revenues and expenditures set up by congressional authority. The General Fund, referenced above,is the principal operating fund of the District, which is used to account for all financial resources except thoserequired to be accounted for in another fund. The General Fund consists of three appropriated funds, Local,Dedicated Taxes, and Special Purpose Revenue (O-type or other) funds.
The Local fund is funded by tax and non-tax revenues that are not earmarked for a particular purpose and areallocated to fund District programs during the annual budget process. The Dedicated Tax fund is funded by taxrevenues dedicated by law to a particular agency for a particular purpose. The Special Purpose Revenue fund is usedto account for proceeds for specific revenue sources (other than expendable trusts, special assessments, or major capital projects) that are legally restricted to expenditures for specified purposes.
An intra-District Fund is an accounting mechanism set up to track payments for services provided by oneDistrict agency to another District agency, similar to an internal service fund. Intra-District budgets represent agreements between two agencies whereby one agency purchases services from the other. The buying agency spendsits own budget (Local, Special Purpose Revenue, Federal, or Private). The selling agency receives this expenditureas intra-District revenue, establishes intra-District budget authority, and spends against that authority to providethe service.


FY 2017 Proposed Budget and Financial Plan Revenue
3-1
This chapter presents the revenue outlook for the District of Columbia’s General Fund for FY 2016 to FY 2020. Thechapter is divided into five broad sections:
• Economic Outlook: Underlying condition of the District’s economy with analysis of key variables
that drive the revenue estimate.
• Baseline Revenues: Local, dedicated and special purpose revenues before proposals that affect
revenues.
• Policy Proposals: Summary of all proposals that have not been incorporated in the baseline
revenues.
• Detailed Tables: Additional tables showing dedicated taxes, non-tax revenue, special purpose
revenue and current tax rates.
• Tax Expenditures: Estimates of the revenue foregone due to tax expenditures.
Revenue is derived from both tax and non-tax sources. Non-tax sources consist of fees, fines,
assessments, and reimbursements, while tax sources are levies on broad measures of citizens’ ability to
pay (e.g., income, consumption, wealth). Some tax revenues are dedicated to special uses and are not
available for general budgeting; these are called dedicated taxes. Similarly, some non-tax sources are
dedicated to the agency that collects the revenues and are known as special purpose revenues.
3
Revenue
TOTAL GENERAL FUND REVENUE - FISCAL YEAR 2017
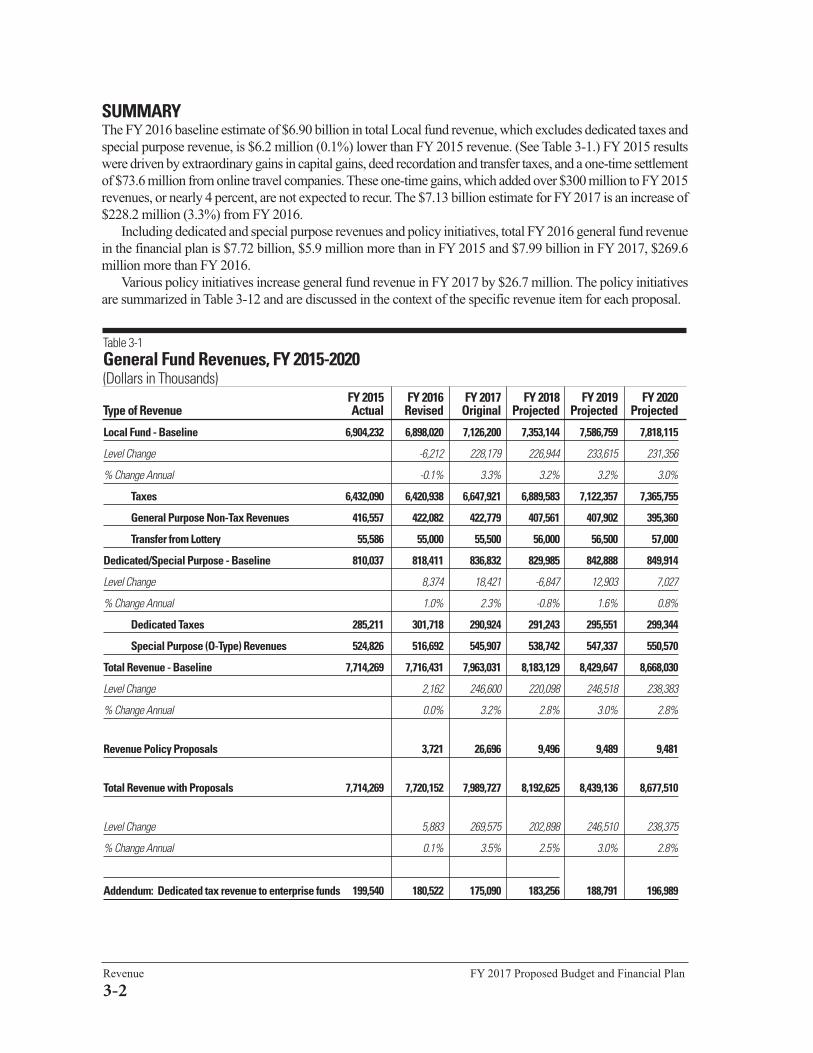
Table 3-1General Fund Revenues, FY 2015-2020(Dollars in Thousands)
FY 2015 FY 2016 FY 2017 FY 2018 FY 2019 FY 2020Type of Revenue Actual Revised Original Projected Projected Projected
Local Fund - Baseline 6,904,232 6,898,020 7,126,200 7,353,144 7,586,759 7,818,115
Level Change -6,212 228,179 226,944 233,615 231,356
% Change Annual -0.1% 3.3% 3.2% 3.2% 3.0%
Taxes 6,432,090 6,420,938 6,647,921 6,889,583 7,122,357 7,365,755
General Purpose Non-Tax Revenues 416,557 422,082 422,779 407,561 407,902 395,360
Transfer from Lottery 55,586 55,000 55,500 56,000 56,500 57,000
Dedicated/Special Purpose - Baseline 810,037 818,411 836,832 829,985 842,888 849,914
Level Change 8,374 18,421 -6,847 12,903 7,027
% Change Annual 1.0% 2.3% -0.8% 1.6% 0.8%
Dedicated Taxes 285,211 301,718 290,924 291,243 295,551 299,344
Special Purpose (O-Type) Revenues 524,826 516,692 545,907 538,742 547,337 550,570
Total Revenue - Baseline 7,714,269 7,716,431 7,963,031 8,183,129 8,429,647 8,668,030
Level Change 2,162 246,600 220,098 246,518 238,383
% Change Annual 0.0% 3.2% 2.8% 3.0% 2.8%
Revenue Policy Proposals 3,721 26,696 9,496 9,489 9,481
Total Revenue with Proposals 7,714,269 7,720,152 7,989,727 8,192,625 8,439,136 8,677,510
Level Change 5,883 269,575 202,898 246,510 238,375
% Change Annual 0.1% 3.5% 2.5% 3.0% 2.8%
Addendum: Dedicated tax revenue to enterprise funds 199,540 180,522 175,090 183,256 188,791 196,989
Revenue FY 2017 Proposed Budget and Financial Plan
3-2
SUMMARYThe FY 2016 baseline estimate of $6.90 billion in total Local fund revenue, which excludes dedicated taxes and
special purpose revenue, is $6.2 million (0.1%) lower than FY 2015 revenue. (See Table 3-1.) FY 2015 results
were driven by extraordinary gains in capital gains, deed recordation and transfer taxes, and a one-time settlement
of $73.6 million from online travel companies. These one-time gains, which added over $300 million to FY 2015
revenues, or nearly 4 percent, are not expected to recur. The $7.13 billion estimate for FY 2017 is an increase of
$228.2 million (3.3%) from FY 2016.
Including dedicated and special purpose revenues and policy initiatives, total FY 2016 general fund revenue
in the financial plan is $7.72 billion, $5.9 million more than in FY 2015 and $7.99 billion in FY 2017, $269.6
million more than FY 2016.
Various policy initiatives increase general fund revenue in FY 2017 by $26.7 million. The policy initiatives
are summarized in Table 3-12 and are discussed in the context of the specific revenue item for each proposal.

FY 2017 Proposed Budget and Financial Plan Revenue
3-3
THE ECONOMIC OUTLOOKAgainst a background of continued moderate growth in the national economy, our current economic forecast for
D.C. assumes that the District’s economy will also continue to grow much as it has over the past two years,
adding both jobs and people over the period of the financial plan. Measures to restrain federal spending are
expected, however, to be in effect over the period of the financial plan.
Over the past year, employment located in D.C. has increased, and commercial office vacancy rates and
rents have stabilized. Employment growth forecast for FY 2016 and beyond is almost all in D.C.’s private sector.
Population growth has been a major factor in increasing the District’s income and sales tax bases, and is also
a major driving force behind rising home values. In the last five years (2010 to 2015) the District’s population
has grown by 67,102 (11.1%), an increase that has averaged more than 1,000 net new residents per month over
this period. Natural increase (births minus deaths) accounted for about 35 percent of the population growth from
2014 to 2015.
Federal SpendingApproximately 25 percent of employed D.C. residents work for the federal government. Federal civilian
employment accounts for about 26 percent of all jobs located in the District of Columbia and 32 percent of the
wages and salaries that are generated in the city. Federal contracting also accounts for additional jobs and income.
Because the federal government is such a dominant presence in the District’s economy, trends in federal spending
have a major impact on the District of Columbia’s economy and revenues.
Current federal budget and fiscal policies allow for some additional spending growth for FY 2016 and
FY 2017. According to the Congressional Budget Office, however, federal domestic discretionary outlays in
FY 2018 are expected to be less than 0.5 percent more than in FY 2016. It is assumed in this budget that no
additional restraints on federal spending will be enacted in the next several years.
National EconomyThe national economy continues at a pace of moderate growth with low inflation. Real GDP grew at an annual
rate of 2.6 percent in FY 2015, jobs are increasing, and the unemployment rate is falling. The outlook for
FY 2016 and FY 2017, however, is for somewhat slower growth in the national economy and continued
uncertainty in financial markets.
• The U.S. economy added 2.9 million jobs (2.1%) from December 2014 to December 2015.
• The U.S. unemployment rate (seasonally adjusted) was 5.0 percent in December 2015, down from 5.6 percent
a year earlier.
• U.S. Personal Income in the December 2015 quarter was 4.6 percent above a year ago.
• The S&P 500 stock market index became quite volatile in early 2016. The average for January 2016 was 5.2
percent below the level of three months earlier, and 5.4 percent below a year ago.
• Employment in the Washington metropolitan area has increased significantly during the past year. In the
three-month period ending December, wage and salary jobs in the region grew by 67,100 (2.1%) compared
to a year earlier. The District of Columbia accounted for about 15 percent of the increase in area employment.
• The D.C. metropolitan area unemployment rate was 3.8 percent in December (not seasonally adjusted),
down from 4.4 percent a year earlier.
• In January 2016, the consensus forecast of 50 economists contributing to the Blue Chip Economic Indicators
is that national real GDP growth in FY 2016 and FY 2017 would be below that of FY 2015. Growth is
expected to slow to 2.3 percent in FY 2016 before returning to a 2.5 percent rate in FY 2017. Nominal growth
is expected to be 3.9 percent in FY 2016 (up from 3.6 percent in FY 2015), and 4.6 percent in FY 2017.

The District of Columbia Economy Recent trends in the D.C. economy include continued moderate growth in jobs and income, increased population
and housing units, modest increase in the number of home sales, and higher single family home prices.
• In the three months ending December 2015, there were 9,667 (1.3%) more wage and salary jobs located in
the District than a year earlier. Federal government jobs in December were up by 833 from a year earlier,
and private sector jobs increased by 9,633 (1.8%).
• District resident employment in the three months ending December 2015 increased by 10,132 (2.9%)
compared to a year earlier.
• The December unemployment rate fell to 6.6 percent (seasonally adjusted), a decrease from 7.7 percent a
year ago.
• Wages earned in the District of Columbia grew 5.1 percent in FY 2015, compared to the prior year.
• D.C. Personal Income was 4.2 percent higher.
• Home sales in FY 2015 were higher than in 2014. Single family sales for the three-month period ending
December 2015 were up 4.3 percent from a year ago, with a 10.1 percent increase in the average selling price.
Condominium sales, however, were down 1.6 percent, and the average price was 5.7 percent lower. The
value of all home sales settled contracts for the three-month period ending December 2015 was 6.0 percent
more than a year ago.
• According to CoStar, leased commercial office space in December 2015 was up 0.4 percent from a year
ago, while the vacancy rate rose over the past year from 9.9 percent in the fourth quarter of 2014 to 10.1
percent in the third quarter of 2015. Average rents were 1.5 percent higher in the December quarter than a
year earlier.
• Hotel room-days sold for the three months ending December 2015 were 0.2 percent above the prior year, and
hotel room revenues were up 1.2 percent.
Economic Forecast for D.C. The economic forecasting services IHS Global Insight and Moody’s Analytics (formerly Economy.com) both
expect that job growth in the District of Columbia will be slower in FY 2016 and FY 2017 than it was in FY 2015.
They also agree that (1) the federal sector will play a smaller role in the economy, with employment flat or
slowly shrinking over the next few years, (2) professional and business services will be the largest sources of
job growth, (3) employment growth in the education and health sector will be much slower in the years ahead,
(4) the stock market will grow slowly over the next several years, and (5) the annual increase in the District’s
population will begin to slow down.
Advisory GroupsIn January and early February 2016 we sought advice from three advisory groups that meet at least once a year
to provide insights into current developments and expectations for the next several years. The Business Advisory
Group discussed leading business sectors in the District and the connections between D.C.’s economy and the
larger regional and national economies. The Real Estate Advisory Group discussed both commercial and
residential real estate markets. The Revenue Advisory Group discussed economic trends, federal fiscal policy
and revenue trends with representatives from the Congressional Budget Office, officials from surrounding states
and local jurisdictions and others familiar with national trends and revenue estimation issues. The information
received at these meetings is a critical factor impacting our revenue estimates.
Highlights from the discussions include:
• Changes occurring in the District’s economy favor the city continuing to be a place that attracts both residents
and businesses.
• The federal sector remains the major underpinning of the District’s economy, but will no longer be a source
of support for significant growth.
• A challenge for the District of Columbia is to continue to attract and retain professional and similar
Revenue FY 2017 Proposed Budget and Financial Plan
3-4

higher-wage employment; accomplishing this depends not on federal government spending but on competing
successfully in regional, national and even global markets.
• Overall demand for office space will remain fairly low by historical standards due to federal lease cutbacks,
limited growth in office-using jobs and tenants seeking fewer square feet per employee. However, the office
market has stabilized in terms of vacancy and rental rates, and new supply and demand are fairly balanced.
• Premier real estate in the District of Columbia remains attractive to foreign investors, some of the new
purchasers will be more inclined to hold their investments for longer periods of time than has often been true
in the past.
• Population will continue to grow. New apartment construction is keeping up with demand, but condominium
supply will be constrained for several years.
• The District is continuing to attract a growing variety of retail businesses.
• An expected rise in interest rates over the next couple of years may slow down the volume (if not the prices)
of housing sales. Market conditions favor a continuing rise in the demand for housing.
Economic Assumptions for the Revenue EstimateThe economic assumptions for the FY 2017 Budget and Financial Plan (See Table 3-2.) take into consideration
expectations of moderate growth in the national economy, continued federal spending constraints, employment
and income gains over the past year, forecasts from IHS Global Insight and Moody’s Analytics, and comments
from the Advisory Groups. Highlights include:
• D.C.’s Gross Domestic Product. Growth rates in D.C. Gross Domestic Product (GDP-DC), a measure of
economic activity in D.C., in FY 2016 and FY 2017, respectively, are projected to be 3.7 percent and 4.7
percent. Real GDP-DC, adjusted for inflation, is expected to grow 2.0 percent in FY 2016 and 2.6 percent
in FY 2017.
• D.C.’s Personal Income. The growth rate in Personal Income, which is mostly wages, salaries, and benefits,
but which also includes investment income and transfer payments, is expected to be 4.0 percent in FY 2016,
and 4.2 percent in FY 2017. Increases in the number of persons and households residing in D.C. contribute
to the District’s higher Personal Income levels.
• Jobs located in D.C. The number of jobs in the District in FY 2016 is expected to show a net increase of
9,600 (1.3%) and 6,400 (0.8%) in FY 2017.
• Resident employment. In FY 2016, the D.C. labor force is expected to increase by 5,900 (1.5%) and rise
by 5,100 (1.3%) in FY 2017. Resident employment is expected to rise by 8,900 (2.5%) in FY 2016. For
FY 2017, it is forecast to rise by 5,200 (1.4%) as the unemployment rate falls to 6.4 percent in that year.
• Home sales and prices. The number of housing sales (the combined total of single family and condominium
units) is projected to rise by 2.0 percent in FY 2016, with prices increasing by 4.5 percent. Sales then increase
by 0.2 percent in FY 2017, with a 4.7 percent rise in average prices.
• Inflation. The Financial Plan assumes that the D.C. Consumer Price Index will rise 1.1 percent in FY 2016
and 2.3 percent in FY 2017. The rate in FY 2015 was 0.3 percent.
• Households and population. The Financial Plan assumes estimated households in FY 2016 of 299,300 up
4,500 (1.5%) from FY 2015, and 303,200 in FY 2017 (an increase of 3,900 or 1.3%). Population rises by
11,100 in FY 2016 to 681,700; in FY 2017 it reaches 691,600.
Looking further ahead to FY 2018 through FY 2019, the expectation for the Budget and Financial Plan is
that this will be a period of continued moderate economic growth, both nationally and in the District of Columbia,
with the District’s economy continuing to be affected by restraints in federal expenditures. Growth in nominal
GDP-DC is expected to average about 4.2 percent per year during the FY 2018 through FY 2020 period, and
Personal Income will increase at about 4.5 percent per year; close to 5,000 additional jobs will be added each
year. Inflation is expected to rise to 2.5 percent per year by FY 2020, and interest rates also rise (to a 4.1 percent
rate for 10-year Treasury securities in FY 2020). The stock market is expected to grow at a steady, moderate pace
FY 2017 Proposed Budget and Financial Plan Revenue
3-5

(a gain of about 14.5 percent over the 3-year period). In the years 2008 through 2020, 8,252 new housing starts
are anticipated, and an additional 8,600 households are expected. During this period, the number of housing
sales is expected to remain steady, while average prices rise each year at a rate about 0.5 percent above the rate
of growth in Personal Income.
RisksThere are a number of risks to this forecast, on both the up side and the down side.
On the down side, events in the national or international arenas that could affect revenues include a slowingdown—or reversal—of national economic growth (the current expansion will be a fairly long seven-year duration byJune 2016). Also, additional drops in the stock market beyond what occurred early in 2016, other financial marketproblems, and national security concerns would also adversely affect District revenues. The District always remainsvulnerable to things like disruptions to oil supplies or impacts arising from uncertainties in the Middle East, theEurozone, or elsewhere. Expected efforts by the Federal Reserve to continue raising interest rates in the coming yearor two introduce an element of uncertainty in financial markets that could affect real estate and other elements ofD.C.’s tax base. It should be noted that two important revenue sources, deed transfer taxes and personal income taxeson capital gains realizations, respond quickly to changing market dynamics and can therefore be quite volatile.
As noted earlier, a major downside risk is that the District may be more adversely affected by cutbacks in federalspending and the federal presence in the District than what has already been incorporated in this estimate. On theother hand, agreements in Congress to raise spending levels above those currently authorized could have a positiveimpact on the District’s economy.
Continued population growth of the magnitude included in this forecast assumes that net in-migration continuesto be the largest driver of that growth. This expectation will not be met if the District becomes less able to attract newresidents and retain existing ones.
On the up side, risks that could result in revenues that are higher than forecast include:• Higher personal income growth than our baseline consensus forecast due to stronger overall economic growth
or stronger capital gains realizations.
• Higher assessed property values due to new construction coming on the assessment rolls and/or lower
capitalization rates.
• Growing interest on the part of individuals and employers in locating in D.C. could result in an economy
stronger than assumed in this revenue forecast.
Revenue FY 2017 Proposed Budget and Financial Plan
3-6
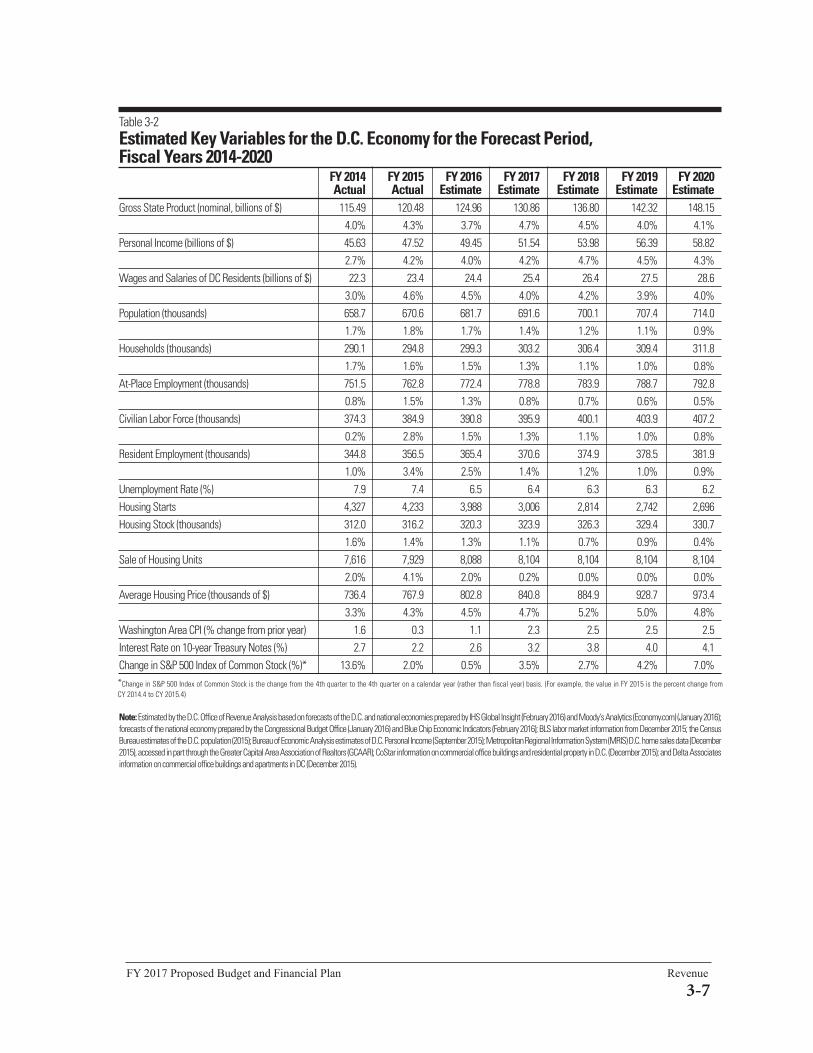
FY 2017 Proposed Budget and Financial Plan Revenue
3-7
Table 3-2Estimated Key Variables for the D.C. Economy for the Forecast Period, Fiscal Years 2014-2020
FY 2014 FY 2015 FY 2016 FY 2017 FY 2018 FY 2019 FY 2020Actual Actual Estimate Estimate Estimate Estimate Estimate
Gross State Product (nominal, billions of $) 115.49 120.48 124.96 130.86 136.80 142.32 148.154.0% 4.3% 3.7% 4.7% 4.5% 4.0% 4.1%
Personal Income (billions of $) 45.63 47.52 49.45 51.54 53.98 56.39 58.822.7% 4.2% 4.0% 4.2% 4.7% 4.5% 4.3%
Wages and Salaries of DC Residents (billions of $) 22.3 23.4 24.4 25.4 26.4 27.5 28.63.0% 4.6% 4.5% 4.0% 4.2% 3.9% 4.0%
Population (thousands) 658.7 670.6 681.7 691.6 700.1 707.4 714.01.7% 1.8% 1.7% 1.4% 1.2% 1.1% 0.9%
Households (thousands) 290.1 294.8 299.3 303.2 306.4 309.4 311.81.7% 1.6% 1.5% 1.3% 1.1% 1.0% 0.8%
At-Place Employment (thousands) 751.5 762.8 772.4 778.8 783.9 788.7 792.80.8% 1.5% 1.3% 0.8% 0.7% 0.6% 0.5%
Civilian Labor Force (thousands) 374.3 384.9 390.8 395.9 400.1 403.9 407.20.2% 2.8% 1.5% 1.3% 1.1% 1.0% 0.8%
Resident Employment (thousands) 344.8 356.5 365.4 370.6 374.9 378.5 381.91.0% 3.4% 2.5% 1.4% 1.2% 1.0% 0.9%
Unemployment Rate (%) 7.9 7.4 6.5 6.4 6.3 6.3 6.2Housing Starts 4,327 4,233 3,988 3,006 2,814 2,742 2,696Housing Stock (thousands) 312.0 316.2 320.3 323.9 326.3 329.4 330.7
1.6% 1.4% 1.3% 1.1% 0.7% 0.9% 0.4%Sale of Housing Units 7,616 7,929 8,088 8,104 8,104 8,104 8,104
2.0% 4.1% 2.0% 0.2% 0.0% 0.0% 0.0%Average Housing Price (thousands of $) 736.4 767.9 802.8 840.8 884.9 928.7 973.4
3.3% 4.3% 4.5% 4.7% 5.2% 5.0% 4.8%Washington Area CPI (% change from prior year) 1.6 0.3 1.1 2.3 2.5 2.5 2.5Interest Rate on 10-year Treasury Notes (%) 2.7 2.2 2.6 3.2 3.8 4.0 4.1Change in S&P 500 Index of Common Stock (%)* 13.6% 2.0% 0.5% 3.5% 2.7% 4.2% 7.0%
Note:Estimated by the D.C. Office of Revenue Analysis based on forecasts of the D.C. and national economies prepared by IHS Global Insight (February 2016) and Moody's Analytics (Economy.com) (January 2016);forecasts of the national economy prepared by the Congressional Budget Office (January 2016) and Blue Chip Economic Indicators (February 2016); BLS labor market information from December 2015; the CensusBureau estimates of the D.C. population (2015); Bureau of Economic Analysis estimates of D.C. Personal Income (September 2015); Metropolitan Regional Information System (MRIS) D.C. home sales data (December2015), accessed in part through the Greater Capital Area Association of Realtors (GCAAR); CoStar information on commercial office buildings and residential property in D.C. (December 2015); and Delta Associatesinformation on commercial office buildings and apartments in DC (December 2015).
*Change in S&P 500 Index of Common Stock is the change from the 4th quarter to the 4th quarter on a calendar year (rather than fiscal year) basis. (For example, the value in FY 2015 is the percent change from CY 2014.4 to CY 2015.4)

Revenue FY 2017 Proposed Budget and Financial Plan
3-8
GENERAL FUND REVENUE The General fund, used to finance government operations, is composed of three funds: Local, Dedicated, and
Special Purpose. Table 3-3 reports estimated Local fund revenue by major revenue source for the period FY 2016
to FY 2020, along with actual FY 2015 revenues. Tables 3-13 and 3-14, at the end of this chapter, provide
information on year-to-year percentage and absolute changes for the major revenue sources.
The Local fund includes both tax revenue and non-tax revenue. The following section highlights the
components and discusses the transfers from the Local fund to Dedicated funds. Special Purpose funds are
discussed at the end.
Table 3-3General Fund, Local Revenue by Source, Fiscal Years 2015-2020(Dollars in Thousands)
FY 2015 FY 2016 FY 2017 FY 2018 FY 2019 FY 2020Revenue Source Actual Estimate Estimate Projected Projected ProjectedReal Property 2,194,500 2,357,202 2,456,722 2,532,880 2,610,285 2,693,814
Transfer to TIF/Pilot (40,180) (46,394) (39,619) (40,966) (42,359) (43,926)
Real Property (net) 2,154,320 2,310,808 2,417,103 2,491,914 2,567,926 2,649,888
Personal Property 57,225 58,370 60,529 62,345 64,527 66,269
Public Space Rental 36,122 37,242 38,247 39,471 40,734 41,997
Total Property (net) 2,247,667 2,406,419 2,515,879 2,593,731 2,673,188 2,758,154
General Sales 1,315,295 1,290,847 1,344,385 1,399,256 1,450,895 1,504,626
Transfer to Convention Center Fund (116,448) (113,971) (119,100) (117,909) (121,093) (123,733)
Transfer to TIF (37,554) (29,603) (28,095) (30,734) (31,895) (33,075)
Transfer to Ballpark Revenue Fund (14,904) (17,900) (18,509) (19,212) (19,788) (20,382)
Transfer to Healthy DC and Health Care Expansion Fund (106) (250) (427) (854) (854) (854)
Transfer to WMATA Subsidy (parking tax) (67,446) (66,664) (66,670) (66,670) (66,670) (66,670)
Transfer to Healthy Schools Fund (4,265) (4,266) (4,266) (4,266) (4,266) (4,266)
Transfer to ABRA Program (1,170) (1,170) (1,170) (1,170) (1,170) (1,170)
General Sales (net) 1,073,402 1,057,023 1,106,148 1,158,441 1,205,160 1,254,476
Alcohol 6,244 6,369 6,618 6,903 7,180 7,451
Cigarette 31,492 30,623 29,398 28,310 27,461 26,637
Motor Vehicle 46,607 47,725 49,589 51,724 53,799 55,832
Motor Fuel Tax 25,256 25,004 24,754 24,506 24,261 24,018
Transfer to Highway Trust Fund (25,256) (25,004) (24,754) (24,506) (24,261) (24,018)
Total Sales (net) 1,157,744 1,141,740 1,191,753 1,245,378 1,293,599 1,344,396
Individual Income 1,868,037 1,856,982 1,930,426 2,010,439 2,093,150 2,167,639
Corporate Franchise 308,027 287,766 284,516 295,427 302,298 317,278
Unincorporated Business Franchise 139,778 133,159 133,135 138,085 141,199 146,553
Total Income 2,315,843 2,277,908 2,348,077 2,443,951 2,536,648 2,631,471 (Continued on next page)

FY 2017 Proposed Budget and Financial Plan Revenue
3-9
Table 3-3 (continued)General Fund, Local Revenue by Source, Fiscal Years 2015-2020(Dollars in Thousands)
FY 2015 FY 2016 FY 2017 FY 2018 FY 2019 FY 2020Revenue Source Actual Estimate Estimate Projected Projected Projected
Public Utility 145,852 146,582 147,315 148,051 148,791 149,535
Transfer to Ballpark Revenue Fund (8,681) (8,768) (8,856) (8,944) (9,034) (11,016)
Public Utility (net) 137,171 137,814 138,459 139,107 139,758 138,519
Toll Telecommunications 56,205 58,003 60,033 61,774 63,875 66,046
Transfer to Ballpark Revenue Fund (2,681) (2,232) (2,311) (2,387) (2,467) (2,550)
Toll Telecommunications (net) 53,524 55,771 57,723 59,388 61,408 63,497
Insurance Premiums 104,507 102,642 97,918 100,862 102,805 104,787
Transfer to Healthy DC and Health Care Expansion Fund (44,805) (45,392) (46,300) (47,226) (48,171) (49,134)
Insurance Premiums (net) 59,702 57,250 51,618 53,636 54,635 55,653
Healthcare Provider Tax 12,854 14,591 14,883 15,181 15,485 15,794
Transfer to Nursing Facility Quality of Care Fund (12,854) (14,591) (14,883) (15,181) (15,485) (15,794)
Ballpark Fee 34,942 31,800 32,754 33,737 34,749 35,791
Transfer to Ballpark Revenue Fund (34,942) (31,800) (32,754) (33,737) (34,749) (35,791)
Hospital Bed Tax and Hospital Provider Fee - 17,100 - - - -
Transfer to Hospital Fund and Hospital Provider Fee Fund - (17,100) - - -
ICF-IDD Assessment 5,032 5,478 5,519 5,629 5,742 5,866
Transfer to Stevie Sellows Quality Improvement Fund (5,032) (5,478) (5,519) (5,629) (5,742) (5,866)
Total Gross Receipts (net) 250,397 250,835 247,800 252,131 255,800 257,669
Estate 48,274 34,521 29,519 30,919 32,262 33,286
Deed Recordation 257,865 200,687 205,303 211,667 215,901 222,594
Transfer to HPTF/Bond Repayment/West End (38,680) (30,103) (30,795) (32,441) (33,013) (34,017)
Deed Recordation (net) 219,185 170,584 174,508 179,226 182,888 188,577
Deed Transfer 198,315 143,697 146,571 151,115 155,497 160,473
Transfer to HPTF/Bond Repayment/West End (29,747) (21,555) (21,986) (22,667) (23,325) (24,071)
Deed Transfer (net) 168,568 122,143 124,585 128,448 132,173 136,402
Economic Interests 24,412 16,789 15,800 15,800 15,800 15,800
Total Other Taxes (net) 460,439 344,037 344,412 354,393 363,123 374,064
TOTAL TAXES NET OF DEDICATED TAXES 6,432,090 6,420,938 6,647,921 6,889,583 7,122,357 7,365,755
Licenses and Permits 88,788 85,960 90,074 83,360 89,235 85,111
Fines and Forfeits 117,199 151,536 146,045 139,636 132,180 125,762
Charges for Services 94,399 78,365 80,512 78,661 80,811 78,811
Miscellaneous 116,171 106,221 106,148 105,904 105,676 105,676
TOTAL NON-TAX 416,557 422,082 422,779 407,561 407,902 395,360
Lottery 55,586 55,000 55,500 56,000 56,500 57,000
TOTAL LOCAL FUND REVENUE NET OF DEDICATED TAXES 6,904,232 6,898,020 7,126,200 7,353,144 7,586,759 7,818,115

Revenue FY 2017 Proposed Budget and Financial Plan
3-10
Real Property Tax In FY 2015, $2.194 billion was collected before dedicated distributions; an 8.9 percent increase from FY 2014.
The increase in collections was driven primarily by a 9.1 percent increase in the growth rate of commercial
property (Class 2) collections compared to 2014 collections. Residential property (Class 1) tax collections in
FY 2014 increased by 6.8 percent. Commercial property tax collections have an out-sized impact on total real
property tax collections because the residential tax rate is $0.85 per $100 of assessment value while the major
commercial tax rate of $1.85 per $100 of assessment value is more than double the residential rate. The total
assessment value of all commercial properties in the District is about the same as the total assessment value of
all residential properties. Consequently, Class 1 tax collections account for approximately 32 percent of total real
property tax collections, and Class 2 collections account for approximately 66 percent of total real property tax
collections.
Residential Property. D.C.’s residential market continued to show solid improvement with average residential
prices increasing by 4.3 percent in 2015 and a record number of sales above the $1 million threshold. This strong
pace of appreciation is expected to continue throughout the forecast period with home prices rising by nearly 4.5
percent on average. As a result, Class 1 property tax revenue growth is expected to average around 4.5 percent
annually from 2016 to 2020.
Commercial Property. Sales in commercial property markets soared in 2015 with deed recordation and transfer
taxes reaching new highs that exceeded the 2007 pre-recession peak. The record sales in 2015 are reflected in
strong projected increases in Class 2 property taxes in 2017 of nearly 4.5 percent. This strength is not expected
to recur throughout the forecast period. Already, uncertainty in capital markets and increasing credit spreads
have dampened sales volume and continued price appreciation in 2016, which will be reflected in 2018
assessments. As a result, the forecast for 2018 through 2020 is more moderate with Class 2 property growth
averaging just 3 percent.
Taking these factors into consideration, overall real property tax collections are expected to average 3.1
percent from FY 2017 – FY 2020.
Property Taxes
Table 3-4Property Tax Revenue, Fiscal Years 2015-2020(Dollars in Thousands)
FY 2015 FY 2016 FY 2017 FY 2018 FY 2019 FY 2020Revenue Source Actual Estimate Estimate Projected Projected Projected
Real Property 2,194,500 2,357,202 2,456,722 2,532,880 2,610,285 2,693,814
Transfer to TIF/Pilot (40,180) (46,394) (39,619) (40,966) (42,359) (43,926)
Real Property (net) 2,154,320 2,310,808 2,417,103 2,491,914 2,567,926 2,649,888
Personal Property 57,225 58,370 60,529 62,345 64,527 66,269
Public Space Rental 36,122 37,242 38,247 39,471 40,734 41,997
Total Property Taxes (net) 2,247,667 2,406,419 2,515,879 2,593,731 2,673,188 2,758,154
Policy Proposals - - (237) (248) (260) (273)

FY 2017 Proposed Budget and Financial Plan Revenue
3-11
General Obligation Bonds. In addition to providing revenue for government services, real property taxes support
the District’s general obligation bonds used for capital investment. For FY 2016, the percentage of real property
tax collections dedicated to the repayment of principal and interest on the District’s General Obligation Bonds
is 15.5 percent.
Transfer to Tax Increment Financing (TIF) Fund. In FY 2016, a net amount of $46.4 million of real property
tax collections will be dedicated to the repayment of Tax Increment Financing and PILOT bonds. This amount
will be $39.6 million in FY 2017 and increase to an estimated $43.9 million in FY 2020, due to continuing
development progress at previously authorized TIF projects, expected increased assessments for existing TIF
properties, and TIF transfers that may be required for potential new debt issuances.
Personal Property Tax In FY 2015, gross total personal property tax collections totaled $57.2 million. Based on national and regional
economic indicators, which suggest a gradual increase in the level of business activity and a subsequent increase
in the total level of new business investment, gross collections are expected to grow by approximately 3.0 percent
on average annually throughout the forecast period reaching $66.2 million in FY 2020.
Public Space Rental In FY 2015 revenue from public space rentals amounted to $36.1 million. Collections are expected to increase
by 3.1 percent annually to $42.0 million in FY 2020 in line with overall growth in local economic indicators.
Property Tax Policy Proposals:• Supermarket Tax Credit

General Sales and Use Taxes In FY 2015, revenue from gross sales and use taxes was $1.32 billion, compared to FY 2014 gross sales and use
tax revenue of $1.17 billion, an increase of $143.2 million or 12.2 percent. The revenue includes a one-time
revenue source of $73.6 million from settlement proceeds following a court decision regarding sales taxes
collected by online travel companies. If the one-time funds are deducted, the revenue of $1.24 billion results in
a growth rate of 5.9 percent. As a result of improving economic conditions, revenues grew more vigorously
over the FY 2014 to FY 2015 period than over the FY 2013 to FY 2014 period when growth was 3 percent.
The $1.29 billion revenue forecast from gross sales and use taxes in FY 2016 anticipates a slight moderation
in the growth rate to 4 percent (excluding the one-time revenue source of FY 2015). The growth rate in FY 2017
is forecast to be slightly higher at 4.1 percent. Growth rates, excluding policy proposals, from FY 2018 to
FY 2020 are estimated to be between 4.1 percent and 3.7 percent annually, which is in line with forecasted
growth in personal income.
Revenue FY 2017 Proposed Budget and Financial Plan
3-12
Table 3-5General Sales and Use Tax Revenue, Fiscal Years 2015-2020(Dollars in Thousands)
FY 2015 FY 2016 FY 2017 FY 2018 FY 2019 FY 2020Revenue Source Actual Estimate Estimate Projected Projected ProjectedGeneral Sales 1,315,295 1,290,847 1,344,385 1,399,256 1,450,895 1,504,626
Transfer to Convention Center Fund (116,448) (113,971) (119,100) (117,909) (121,093) (123,733)Transfer to TIF (37,554) (29,603) (28,095) (30,734) (31,895) (33,075)Transfer to Ballpark Revenue Fund (14,904) (17,900) (18,509) (19,212) (19,788) (20,382)Transfer to Healthy DC and Health Care Expansion Fund (106) (250) (427) (854) (854) (854)Transfer to WMATA Subsidy (parking tax) (67,446) (66,664) (66,670) (66,670) (66,670) (66,670)Transfer to Healthy Schools Fund (4,265) (4,266) (4,266) (4,266) (4,266) (4,266)Transfer to ABRA Program (1,170) (1,170) (1,170) (1,170) (1,170) (1,170)
General Sales Taxes (net) 1,073,402 1,057,023 1,106,148 1,158,441 1,205,160 1,254,476
Policy Proposals - - 584 500 500 500
Table 3-6Estimated Sales Tax Base, Collections and Transfers by Sales Tax Type, FY 2015(Dollars in Millions)
MedicalRetail Marijuana Liquor Restaurants Hotel Parking Transfers Total
Base 8,368.8 1.8 580.6 3,789.1 1,765.3 374.7 Rate 5.75% 6.0% 10.0% 10.0% 14.5% 18.0%General Sales Tax Collections (gross) 481.2 0.1 58.1 378.9 256.0 67.4 1.241.7 **
Transfer to Convention Center Fund 37.9 78.6 116.4Transfer to TIF 37.6 37.6Transfer to WMATA Subsidy (parking tax) 67.4 67.4Transfer to Ballpark Revenue Fund 14.9 14.9Transfer to Healthy DC Fund 0.1 0.1Transfer to Healthy Schools Fund 4.3 4.3Transfer to ABRA Program 1.2 1.2
General Sales Taxes to Local Fund 481.2 0.0 58.1 341.0 177.4 67.4 (125.4) 999.8 **Note: **Does not include legal settlement of $73.6 million included in gross sales tax in CAFR.

FY 2017 Proposed Budget and Financial Plan Revenue
3-13
Total transfers from sales and use tax revenue are estimated to be $233.8 million in FY 2016. In FY 2017,
the amount of transfers from sales and use taxes is estimated to be $238.2 million, 17.7 percent of sales tax
revenue. The sum of transfers is projected to be $250 million or 16.6 percent of gross sales tax revenue in FY
2020.
Transfer to Convention Center Fund: The formula financing the Convention Center Fund includes only taxes
directly linked to the hospitality sector. The hotel tax rate is 14.5 percent. Of this tax, 4.45 percent is dedicated
to the Convention Center Fund and 10.05 percent goes to the District’s General Fund. The 10 percent sales tax
rate applied mainly to restaurants and bars is also the tax rate applied to rental cars, prepaid telephone cards, tickets
for events and merchandise sold at both the Baseball Stadium and the Verizon Center. Except for sales at the
Baseball Stadium and the Verizon Center, the 10 percent rate includes 9 percent for the General Fund and 1
percent dedicated to the Convention Center Fund. There is also a 10 percent sales tax rate on alcoholic beverages
not sold for immediate consumption. Revenue from this category at 10 percent does not go to the Convention
Center Fund.
Transfer to Tax Increment Financing. The District utilizes an economic development tool called Tax Increment
Financing (TIF) to assist in financing economic development projects. TIF allows the incremental future revenue
stream from a development project to be pledged to pay back bonds issued to help finance the development. In
March 2008, in order to service a loan to renovate the Verizon Center at Gallery Place, merchandise and tickets
for events at the Verizon Center became subject to a tax of 10 percent (compared to the prior rate of 5.75 percent).
The revenue collected from the increased rate at that time (10 percent less 5.75 percent or 4.25 percent) goes to
a separate fund and is used to make principal and interest payments on the loan.
In FY 2015, there were eight projects included in the TIF program: Gallery Place, The Mandarin Oriental
Hotel, Verizon Center, City Market at O Street, Fort Lincoln Retail, Special Retail and Great Streets, Convention
Center Hotel, and the Waterfront Park Maintenance Fund. There are nine projects anticipated in FY 2016 and
beyond. The projects are: Gallery Place, The Mandarin Oriental Hotel, Verizon Center, Fort Lincoln Retail, City
Market at O Street, Special Retail and Great Streets (includes six projects), Convention Center Hotel, Waterfront
Park Maintenance Fund, and Skyland. The TIF program previously included the SW Waterfront/The Wharf
project, which has been re-categorized to the PILOT program. In order to provide additional security to selected
TIF projects, the District created the Downtown TIF Area. Incremental revenue from the Downtown TIF Area
is only used in the event project increment is not sufficient to cover debt service. Only those revenues required
to address projected TIF project shortfalls are included in the TIF budget.
Transfer to Ballpark Fund. Stadium related sales tax streams are dedicated to the Ballpark Fund to pay the debt
service on the baseball stadium revenue bonds. These revenue streams include taxes on tickets sold, taxes on
parking at the stadium, taxes on merchandise sold at the stadium and taxes on food and beverages sold in the
stadium.
Transfer to Healthy D.C.. Effective in FY 2012, any revenues from the sales tax on medical marijuana are
transferred to the Healthy D.C. and Health Care Expansion Fund. The transfer amount is estimated to be $427,000
in FY 2017.
Transfer to WMATA. Beginning in FY 2012 all parking sales tax revenue is used to help meet the District’s
funding responsibility for the Washington Metropolitan Area Transit Authority (WMATA). Effective FY 2012,
the sales tax rate on parking was raised from 12 percent to 18 percent.
Transfer to Healthy Schools. Effective in FY 2012, soft-drinks (non-alcoholic beverages not containing milk,
or milk substitutes, non-carbonated fruit or vegetable juice, coffee, cocoa or tea) are no longer exempt from
sales tax. $4.266 million raised annually from taxing soft drinks goes to the Healthy Schools Fund.
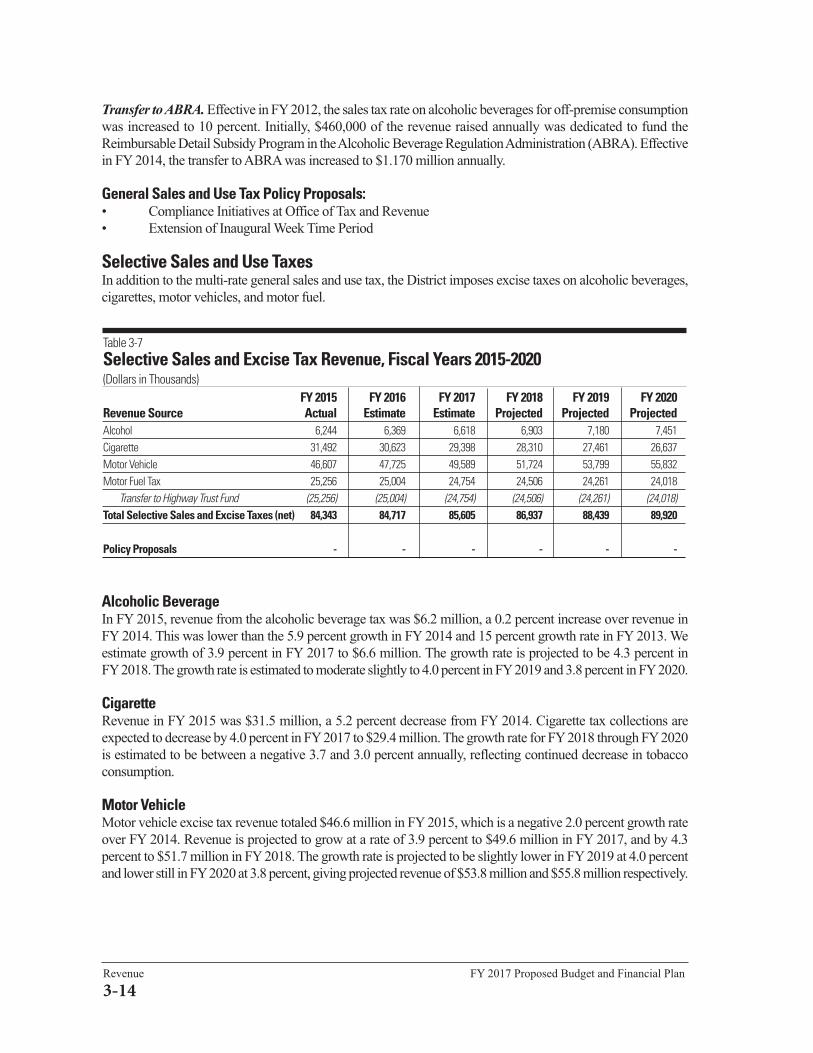
Revenue FY 2017 Proposed Budget and Financial Plan
3-14
Transfer to ABRA. Effective in FY 2012, the sales tax rate on alcoholic beverages for off-premise consumption
was increased to 10 percent. Initially, $460,000 of the revenue raised annually was dedicated to fund the
Reimbursable Detail Subsidy Program in the Alcoholic Beverage Regulation Administration (ABRA). Effective
in FY 2014, the transfer to ABRA was increased to $1.170 million annually.
General Sales and Use Tax Policy Proposals:• Compliance Initiatives at Office of Tax and Revenue
• Extension of Inaugural Week Time Period
Selective Sales and Use TaxesIn addition to the multi-rate general sales and use tax, the District imposes excise taxes on alcoholic beverages,
cigarettes, motor vehicles, and motor fuel.
Alcoholic BeverageIn FY 2015, revenue from the alcoholic beverage tax was $6.2 million, a 0.2 percent increase over revenue in
FY 2014. This was lower than the 5.9 percent growth in FY 2014 and 15 percent growth rate in FY 2013. We
estimate growth of 3.9 percent in FY 2017 to $6.6 million. The growth rate is projected to be 4.3 percent in
FY 2018. The growth rate is estimated to moderate slightly to 4.0 percent in FY 2019 and 3.8 percent in FY 2020.
Cigarette Revenue in FY 2015 was $31.5 million, a 5.2 percent decrease from FY 2014. Cigarette tax collections are
expected to decrease by 4.0 percent in FY 2017 to $29.4 million. The growth rate for FY 2018 through FY 2020
is estimated to be between a negative 3.7 and 3.0 percent annually, reflecting continued decrease in tobacco
consumption.
Motor Vehicle Motor vehicle excise tax revenue totaled $46.6 million in FY 2015, which is a negative 2.0 percent growth rate
over FY 2014. Revenue is projected to grow at a rate of 3.9 percent to $49.6 million in FY 2017, and by 4.3
percent to $51.7 million in FY 2018. The growth rate is projected to be slightly lower in FY 2019 at 4.0 percent
and lower still in FY 2020 at 3.8 percent, giving projected revenue of $53.8 million and $55.8 million respectively.
Table 3-7Selective Sales and Excise Tax Revenue, Fiscal Years 2015-2020(Dollars in Thousands)
FY 2015 FY 2016 FY 2017 FY 2018 FY 2019 FY 2020Revenue Source Actual Estimate Estimate Projected Projected ProjectedAlcohol 6,244 6,369 6,618 6,903 7,180 7,451 Cigarette 31,492 30,623 29,398 28,310 27,461 26,637 Motor Vehicle 46,607 47,725 49,589 51,724 53,799 55,832 Motor Fuel Tax 25,256 25,004 24,754 24,506 24,261 24,018
Transfer to Highway Trust Fund (25,256) (25,004) (24,754) (24,506) (24,261) (24,018)Total Selective Sales and Excise Taxes (net) 84,343 84,717 85,605 86,937 88,439 89,920
Policy Proposals - - - - - -

FY 2017 Proposed Budget and Financial Plan Revenue
3-15
Individual Income TaxIn FY 2015, individual income tax revenue was $1,868.0 million, an increase of 11.2 percent from FY 2014. This
double-digit rate of growth was driven in large part by a 50 percent increase in revenue from the volatile
non-withholding component of the individual income tax related to capital gains and the stock market. The other
component of income tax revenue, withholding, is closely associated with the wages and salaries of D.C. residents
and accounts for two thirds of all income tax revenue. Withholding grew by a slower rate of 5.5 percent (as
compared to 5.9 percent in FY 2014).
The large increase in capital gains is not expected to recur in FY 2016 given the current volatility of the
financial markets as well as global economic uncertainty. Tax proposals, which reduced tax rates, will also cause
withholding growth to be lower in FY 2016, resulting in overall individual income taxes to decline in the current
fiscal year. These are discussed in further detail below. For the out years from FY 2017 to FY 2020, growth in
revenue resumes at an average rate of 3.9 percent reflective of anticipated growth in the withholding component,
as well as the expectation that the stock market’s performance will not deteriorate and/or improve leading to a
favorable performance in the non-withholding component.
There were a number of policy proposals that were enacted in Tax Year 2016 that will impact individual
income tax revenues in FY 2016. There is a reduction in the tax rate for the middle income tax bracket ($40,000
- $60,000) to 6.5 percent. In addition, a new income bracket was established whereby taxable income between
$350,000 and $1 million is taxed at 8.75 percent, while income greater than $1 million will continue to be taxed
at 8.95 percent.
Business Franchise Business income tax revenue rebounded by 7.8 percent in FY 2015 after declining by 8.3 percent in the previous
fiscal year. Tax proposals enacted in FY 2015 and further tax proposals that will become effective in 2017, which
reduce the business franchise tax rate from 9.975 percent to 9.0 percent, result in declining growth of 6.0 percent
Motor Fuel Collections for the motor vehicle fuel tax in FY 2015 were $25.3 million. In spite of increases in the local
population, continuing increases in fuel efficiencies are expected to result in fuel tax revenues declining about
1.0 percent a year – from a projected FY 2016 level of $25.0 million to $24.0 million in FY 2020.
Transfer to Highway Trust Fund: Motor fuel excise tax revenues are dedicated to the Highway Trust Fund
(HTF). The HTF uses both local-source and federal matching funds to construct, repair and manage eligible
District roads and bridges. Approximately 400 of the 1,020 miles (39 percent) of streets and highways and 229
bridges in the District are eligible.
Table 3-8Income Tax Revenue, Fiscal Years 2015-2020(Dollars in Thousands)
FY 2015 FY 2016 FY 2017 FY 2018 FY 2019 FY 2020Revenue Source Actual Estimate Estimate Projected Projected ProjectedIndividual Income 1,868,037 1,856,982 1,930,426 2,010,439 2,093,150 2,167,639 Corporate Franchise 308,027 287,766 284,516 295,427 302,298 317,278 Unincorporated Business Franchise 139,778 133,159 133,135 138,085 141,199 146,553 Total Income Taxes 2,315,843 2,277,908 2,348,077 2,443,951 2,536,648 2,631,471
Policy Proposals - 3,721 8,943 8,943 8,943 8,943
Income Tax

in FY 2016 followed by declining growth of 0.8 percent in FY 2017. Thereafter, growth in this revenue source
resumes at an average rate of 3.6 percent from FY 2018 to FY 2020.
Income Tax Policy Proposals:• Compliance Initiatives at Office of Tax and Revenue
• Delay FAS 109 Deductions by Five Years
Revenue FY 2017 Proposed Budget and Financial Plan
3-16
Gross ReceiptsTaxes in this category include: a tax on the gross receipts of public utilities and toll telecommunications companies
operating in the District (the rate is 10 percent for residential use and 11 percent for nonresidential use where 1.0
percent of the 11 percent is dedicated to financing the baseball stadium), a tax of 2.0 percent on the gross receipts
of insurance companies, various health care related taxes that are dedicated to specific purposes, and a gross
receipts tax on companies for baseball stadium funding.
Table 3-9Gross Receipts Tax Revenue, Fiscal Years 2015-2020(Dollars in Thousands)
FY 2015 FY 2016 FY 2017 FY 2018 FY 2019 FY 2020Revenue Source Actual Estimate Estimate Projected Projected ProjectedPublic Utility 145,852 146,582 147,315 148,051 148,791 149,535
Transfer to Ballpark Revenue Fund (8,681) (8,768) (8,856) (8,944) (9,034) (11,016)
Public Utility (net) 137,171 137,814 138,459 139,107 139,758 138,519
Toll Telecommunications 56,205 58,003 60,033 61,774 63,875 66,046
Transfer to Ballpark Revenue Fund (2,681) (2,232) (2,311) (2,387) (2,467) (2,550)
Toll Telecommunications (net) 53,524 55,771 57,723 59,388 61,408 63,497
Insurance Premiums 104,507 102,642 97,918 100,862 102,805 104,787
Transfer to Healthy DC and Health Care Expansion Fund (44,805) (45,392) (46,300) (47,226) (48,171) (49,134)
Insurance Premiums (net) 59,702 57,250 51,618 53,636 54,635 55,653
Healthcare Provider Tax 12,854 14,591 14,883 15,181 15,485 15,794
Transfer to Nursing Facility Quality of Care Fund (12,854) (14,591) (14,883) (15,181) (15,485) (15,794)
Ballpark Fee 34,942 31,800 32,754 33,737 34,749 35,791
Transfer to Ballpark Revenue Fund (34,942) (31,800) (32,754) (33,737) (34,749) (35,791)
Hospital Bed Tax and Hospital Provider Fee - 17,100 - - - -
Transfer to Hospital Fund and Hospital Provider Fee Fund - (17,100) - - -
ICF-IDD Assessment 5,032 5,478 5,519 5,629 5,742 5,866
Transfer to Stevie Sellows Quality Improvement Fund (5,032) (5,478) (5,519) (5,629) (5,742) (5,866)
Total Gross Receipts Taxes (net) 250,397 250,835 247,800 252,131 255,800 257,669
Policy Proposals - - (42) (42) (42) (42)

Public Utility TaxThis tax is directly related to energy use, so tax revenue collections are closely linked to weather extremes and
fuel cost. (See tax rates in Table 3-18 at the end of the chapter.) Gross revenue from the Public Utility Tax (before
the transfer to the Ballpark Fund) is estimated to be $146.6 million in FY 2016 and $147.3 million in FY 2017.
It is expected to grow at an average rate of 0.5 percent for FY 2018 through FY 2020.
Transfer to Ballpark Fund: There is a surcharge on nonresidential rates that finances the baseball stadium. In
FY 2015, $8.7 million was collected and transferred. In FY 2016 and FY 2017, $8.8 million and $8.9 million,
respectively, are expected to be transferred to the Ballpark Fund.
Toll Telecommunication Tax The gross revenue from the Toll Telecommunications Tax (before the 1 percent transfer of the gross receipts of
non-residential customers for baseball stadium funding) is estimated to be approximately $58.0 million in
FY 2016 and $60.0 million in FY 2017. It is forecast to have an average growth of 3.2 percent for the period
FY 2018 to FY 2020.
Transfer to Ballpark Fund. There is a surcharge on nonresidential rates that finances the baseball stadium. In
FY 2015, $2.7 million was collected and transferred. The transfer is expected to decline in FY 2016 to $2.2
million before rebounding by 3.5 percent in FY 2017. In FY 2018 the transfer is estimated to be approximately
$2.4 million, $2.5 million in FY 2019 and in FY 2020 it is expected to be around $2.6 million.
Insurance Premiums Tax In FY 2015, revenue collected from the Insurance Premiums Tax, before the transfer to the Healthy D.C. and HealthCare Expansion Fund was $104.5 million; net revenue (after the transfer) was $59.7 million. Revenue (after transferto the Healthy D.C. Fund) from Insurance Premiums Tax collections is estimated to be $57.3 million in FY 2016and $51.6 million in FY 2017 before an anticipated increase to $53.6 million in FY 2018 followed by estimatedrevenue of $54.6 million in FY 2019 and $55.7 million in FY 2020.
Transfer to Healthy D.C. Fund: Of the insurance premiums taxes generated by policies with health maintenanceorganizations (HMO), 75 percent is distributed to the Healthy D.C. Fund for the purpose of providing affordablehealth insurance to eligible individuals.
Healthcare Provider Tax (Transferred to Nursing Facility Quality of Care Fund)The Healthcare Provider Tax is an assessment per licensed bed that is paid by each nursing facility in the District.
Revenues from the assessments are dedicated to the Nursing Facility Quality of Care Fund, which is used to fund
quality of care initiatives. In FY 2015 the revenue from the Healthcare Provider Tax was $12.9 million. Revenue
for FY 2017 is estimated to be $14.9 million. It is projected to grow slightly in FY 2018 through FY 2020 from
$15.2 million to $15.8 million.
Ballpark Fee (Transferred to Ballpark Fund)The Ballpark Fee is a gross receipts fee that is a multi-tiered fee levied on businesses within the District with over
$5 million in gross receipts. The fees are due in a single payment on June 15th annually. Revenue from the
Ballpark Fee was $34.9 million in FY 2015. Revenue is estimated to increase from $32.8 million in FY 2017 to
$35.8 million in FY 2020.
The Inpatient Hospital Bed Tax (Transferred to Hospital Fund)The Medicaid Hospital Inpatient Rate Supplement Act of 2015 authorized the District to tax hospitals’ net
inpatient revenue for one year beginning October 1, 2015 at a rate of 0.52 percent. The tax sunsets after
FY 2016.
FY 2017 Proposed Budget and Financial Plan Revenue
3-17

Revenue FY 2017 Proposed Budget and Financial Plan
3-18
Medicaid Hospital Outpatient Tax (Transferred to Hospital Provider Fee Fund)The Medicaid Hospital Outpatient Supplemental Payment Act of 2015 authorized the District to tax hospitals’
outpatient gross patient revenue for one year beginning October 1, 2015 at a rate of 0.16 percent. The tax sunsets
after FY 2016.
ICF-IDD Assessment (Transferred to Stevie Sellows Fund)Each institution providing care to the developmentally disabled in the District of Columbia pays an assessment
of 5.5 percent of gross revenue in quarterly installments. These assessments are transferred to the Stevie Sellows
Quality Improvement Fund. The fund was established to fund quality of care improvements in a qualified
ICF-IDD (Intermediate Care Facility for Persons with Intellectual or Developmental Disabilities). The assessment
generated $5.0 million in FY 2015. For FY 2017 through FY 2020 revenue is expected to increase slightly in
each year, starting at $5.5 million and growing to $5.9 million.
Gross Receipts Taxes Policy Proposals:• Tax Medicaid Hospital Outpatient Revenue and Transfer All Revenue to the Hospital Provider Fee Fund
• Tax Medicaid Hospital Inpatient Revenue and Transfer All Revenue to the Hospital Fund
• Insurance Premiums Exemption

FY 2017 Proposed Budget and Financial Plan Revenue
3-19
Estate Tax The District’s estate tax is decoupled from the federal tax. Unlike the federal government, which exempts estates
valued at less than $5.25 million, estates in the District valued at more than $1 million are subject to tax. Starting
in 2017 this threshold will be raised to $2 million. As a result, this inherently unpredictable tax is forecast to
decline from $34.5 million in FY 2016 to $29.5 million in FY 2017. Thereafter growth resumes by about 4.1
percent annually to $33.3 million in FY 2020.
Deed and Economic Interest Taxes In FY 2015, deed recordation and transfer taxes, including economic interest, totaled $480.6 million eclipsingthe prior record set in 2007. This exceptional result was driven in large part by the unprecedented volume of salesof trophy commercial properties valued more than $200 million. This pace is not expected to recur throughoutthe forecast period as year to date revenues have already declined more than 25 percent. We anticipate thisrevenue source to be more in line with long term non-recessionary trends at $361.2 million in 2016 and $367.7million in 2017 and then growing to $398.9 million by 2020.
Transfer to Housing Production Trust Fund (HPTF) /West End Library: The “Housing Production TrustFund Second Amendment Act of 2002” requires that 15 percent of the District’s deed recordation and transfertax revenue be transferred to the Housing Production Trust Fund annually. A small portion is dedicated to theWest End Library Fund. The total transferred amount is $51.7 million in FY 2016 growing to $58.1 million in2020.
Table 3-10Other Tax Revenue, Fiscal Years 2015-2020(Dollars in Thousands)
FY 2015 FY 2016 FY 2017 FY 2018 FY 2019 FY 2020Revenue Source Actual Estimate Estimate Projected Projected ProjectedEstate 48,274 34,521 29,519 30,919 32,262 33,286
Deed Recordation 257,865 200,687 205,303 211,667 215,901 222,594
Transfer to HPTF (38,680) (30,103) (30,795) (32,441) (33,013) (34,017)
Deed Recordation (net) 219,185 170,584 174,508 179,226 182,888 188,577
Deed Transfer 198,315 143,697 146,571 151,115 155,497 160,473
Transfer to HPTF (29,747) (21,555) (21,986) (22,667) (23,325) (24,071)
Deed Transfer (net) 168,568 122,143 124,585 128,448 132,173 136,402
Economic Interests 24,412 16,789 15,800 15,800 15,800 15,800
Total Other Taxes (net) 460,439 344,037 344,412 354,393 363,123 374,064
Policy Proposals - - - - - -
Other Taxes

Revenue FY 2017 Proposed Budget and Financial Plan
3-20
Nontax Revenue and Lottery
Table 3-11General Purpose Non-Tax Revenue and Lottery Transfer, Fiscal Years 2015-2020(Dollars in Thousands)
FY 2015 FY 2016 FY 2017 FY 2018 FY 2019 FY 2020Revenue Source Actual Estimate Estimate Projected Projected ProjectedLicenses and Permits 88,788 85,960 90,074 83,360 89,235 85,111 Fines and Forfeits 117,199 151,536 146,045 139,636 132,180 125,762 Charges for Services 94,399 78,365 80,512 78,661 80,811 78,811 Miscellaneous 116,171 106,221 106,148 105,904 105,676 105,676 TOTAL NON-TAX 416,557 422,082 422,779 407,561 407,902 395,360 Lottery 55,586 55,000 55,500 56,000 56,500 57,000 Policy Proposals - - - - - - Note: Table 3-15 (presented later in this chapter) provides a detailed listing of non-tax revenue by source.
Local non-tax revenue consists of Licenses and Permits, Fines and Forfeitures, Charges for Services, and
Miscellaneous categories, which include payments in lieu of taxes (PILOTS), revenues from long-outstanding
traffic fines collected through the Central Collection Unit (CCU), proceeds from unclaimed properties, and other
revenue sources.
Total non-tax revenue for FY 2015 was down 0.6 percent from FY 2014 (down to $416.6 million from
$419.2 million, a difference of $2.7 million). This decrease is mainly due to lower than anticipated revenue
collections from traffic fines.
Total non-tax revenue for FY 2016 is projected to increase by 1.3 percent from FY 2015 (revised up to
$422.1 million in FY 2016 from $416.6 million in FY 2015) mainly due to a projected increase in traffic fine
collections. Revenue from licenses and permits, and charges for services is slightly revised down from the
FY 2015 level, by 3.2 percent and 17 percent respectively, due to the effect of bi-annual revenue streams such
as corporation recordation and insurance license fees. Miscellaneous revenue is projected to be down by 8.6
percent. This is due to the impact of one time settlement revenue that inflated FY 2015 Miscellaneous revenue
numbers. This revenue category is also impacted by various year-end accounting entries and adjustments in the
form of prior year cost recoveries which are very volatile.
Transfers from the District’s Lottery and Charitable Games Control Board (DCLB) are expected to remain
at $55 million in FY 2016 increasing to $55.5 million (up by 0.9%) in FY 2017 as sales pick up due to increases
in instant lottery ticket supplies.
Presently, there are more than 150 general-purpose, non-tax revenue sources that provide operating support
to District government agencies and programs. These revenue sources are listed in Table 3-15. A September
2015 D.C. Office of Revenue Analysis report (District of Columbia Non-Tax Revenue Report) provides detailed
background information and relevant data about these general-purpose, non-tax revenues. The report is available
under “Studies” in the “Reports” section of the Office of the Chief Financial Officer web site:
http://cfo.dc.gov/sites/default/files/dc/sites/ocfo/publication/attachments/Non-Tax%20Revenue%20Report%
20_September%202015.pdf .

FY 2017 Proposed Budget and Financial Plan Revenue
3-21
Special Purpose Non-Tax Revenue Special purpose non-tax revenues, often times referred to as O-Type or Other revenues, are funds generatedfrom fees, fines, assessments, or reimbursements that are dedicated to the District agency that collects therevenues to cover the cost of performing the function. The “dedication” of the revenue to the collecting agencyis what distinguishes this revenue from the general-purpose non-tax revenues. The legislation that creates the fee,fine or assessment must stipulate its purpose-designation and must also state whether any unspent funds are toretain designation at the conclusion of the fiscal year or revert to general-purpose funds. Unspent revenue incertain funds cannot revert to general purpose funds. Dedicated revenues limit the use of the District's GeneralFund revenue by earmarking a portion of the revenue for special purposes. Prior to FY 2002 dedicated non-taxrevenues were not considered local revenues and as such were reported differently in the Comprehensive AnnualFinancial Report (CAFR) and reported with the District's federal and private grants in the Financial Plan.
In FY 2017 the District is anticipating approximately $545.9 million in revenue and use of fund balance of
$59.1 million for a total of $605.0 million to cover the cost of performing the functions associated with these
resources. The use of fund balance is a one-time revenue source and as such is not projected for FY 2018 –
FY 2020. Table 3-17 (at the end of this chapter) shows the current law or baseline dedicated non-tax revenue by
agency and fund. Proposed policy initiatives that would change the D.C. Official Code or the D.C. Municipal
Regulations may, if enacted, provide additional revenue to specific Special Purpose Revenue funds in addition
to the current law projected revenues shown in this table. Table 3-12 shows proposed policy initiatives affecting
Special Purpose Revenue funds and their estimated revenue impact.
Special Purpose Non-Tax Policy Proposals: • Department on Disability Services Housing Support• Department of Parks and Recreation Fee Increases
POLICY PROPOSALSFollowing are changes that are included in the FY 2017 Budget Support Act of 2016 (BSA) along with other
changes that affect revenue since the most recent revenue estimate. Full information on all of the proposals
included in the BSA can be found in the OCFO fiscal impact statement.
Property Tax Changes:
• BSA Subtitle (VII)(D), Supermarket Tax Incentives Clarification Act of 2016. Expands the eligibility
area for the existing Supermarket tax credit which provides real and personal property tax exemptions to
supermarkets in qualifying areas.
Sales and Use Tax Changes:
• Clean Hands Administrative Initiative. The Office of Tax and Revenue (OTR) Clean Hands Administrative
Initiative includes in the Clean Hands certification system a check for missing sales tax returns. To obtain
certification, taxpayers would be required to file the missing returns and pay what they owe, so that their
overall tax liability is under $100.
• BSA Subtitle (II)(B), Inaugural Celebration Amendment Act of 2016. Designates January 14 through
January 22 as the 2017 Inaugural Week period, which will now cover nine days as opposed to seven. During
the Inaugural Week period, a licensee may sell or serve alcoholic beverages until 4 a.m. and operate 24 hours
a day provided the licensee meets certain requirements.
Individual Income Tax Changes:
• Clean Hands Administrative Initiative. The Office of Tax and Revenue (OTR) Clean Hands Administrative
Initiative includes in the Clean Hands certification system a check for missing withholding tax returns. To
obtain certification, taxpayers would be required to file the missing returns and pay what they owe, so that
their overall tax liability is under $100.

Corporate Income Tax Changes:
• BSA Subtitle (VII)(C), Combined Reporting Amendment Act of 2016. Delays five years, from January
1, 2016 to January 1, 2021, the effective date after which combined reporting filers can claim their reported
FAS 109 deductions.
Gross Receipts Tax Changes:
• BSA Subtitle (I)(F), District of Columbia Captive Insurance Agency Budget Technical Amendment Act
of 2016. Exempts from taxation insurance products, such as property and personal property insurance,
purchased by the District government. To claim the exemption, the District’s broker must submit a statement
identifying the portion of an insurance coverage allocated to the District government.
Dedicated Tax Revenue Changes:
• BSA Subtitle (V)(H), Medicaid Hospital Outpatient Supplemental Payment Act of 2016.Authorizes the
District to tax hospitals’ outpatient gross patient revenue for one year beginning October 1, 2016. This tax
revenue is transferred to the Hospital Provider Fee Fund.
• BSA Subtitle (V)(I), Medicaid Hospital Inpatient Rate Supplement Act of 2016.Authorizes the District
to tax hospitals’ inpatient net patient revenue for one year beginning October 1, 2016. This tax revenue is
transferred to the Hospital Fund.
Special Purpose Fund Non-Tax Revenue Changes:
• BSA Subtitle (V)(C), Contribution to Cost of Supports Fund Act of 2016. Establishes a new special
purpose fund to hold contributions the Department on Disability Services (DDS) shall collect from persons
with intellectual and developmental disabilities who are Medicaid-eligible but not eligible for the maximum
Supplement Security Income or Social Security Disability Insurance payments, or are not Medicaid-eligible
but otherwise have been found eligible to receive services from the Developmental Disabilities
Administration.
• Department of Parks and Recreation Fee Increases. The Department of Parks and Recreation has issued
rulemaking to update permit fees and fee-based-use permits for events such as lessons offered by third parties
for which participants pay a fee.
ADDITIONAL INFORMATION ON D.C. REVENUESThe following tables provide additional detail on District taxes. Additional information on District of
Columbia taxes and its economy is available on the OCFO website under “Reports and Publications”
(http://cfo.dc.gov/page/reports-and-publications). These include:
• Tax Facts
• District of Columbia Data Book: Revenue and Economy.
• Economic Indicators and Review of District of Columbia Economic and Revenue Trends.
• Special Reports on non-tax revenue, tax expenditures, and special purpose funds.
Revenue FY 2017 Proposed Budget and Financial Plan
3-22

FY 2017 Proposed Budget and Financial Plan Revenue
3-23
Table 3-12 Policy Proposals Impacting General Fund Revenues, Fiscal Years 2016-2020(Dollars in Thousands)
Revenue Source FY 2016 FY 2017 FY 2018 FY 2019 FY 2020Local Fund Revenue (February 2016 Estimates) 6,898,020 7,126,200 7,353,144 7,586,759 7,818,115 plus Local Fund Policy Proposals 3,721 9,248 9,153 9,141 9,128
PROPERTY TAX 0 (237) (248) (260) (273)Supermarket Tax Credit 0 (237) (248) (260) (273)
SALES / USE TAXES 0 584 500 500 500 Compliance Initiatives at OTR 0 500 500 500 500 Extension of Inaugural Week Time Period 0 84 0 0 0
EXCISE TAXES 0 0 0 0 0 None 0 0 0 0 0
INCOME TAXESIndividual Income Tax 0 1,500 1,500 1,500 1,500 Compliance Initiatives at OTR 0 1,500 1,500 1,500 1,500
Business Income Taxes 3,721 7,443 7,443 7,443 7,443 Delay FAS 109 Deductions by Five Years 3,721 7,443 7,443 7,443 7,443
GROSS RECEIPTS 0 (42) (42) (42) (42)Insurance Premiums Exemption 0 (42) (42) (42) (42)
DEED RECORDATION AND TRANSFER/ECONOMIC INTEREST TAXES 0 0 0 0 0 None 0 0 0 0 0
NONTAX 0 0 0 0 0 None 0 0 0 0 0
Local Fund Revenue with Policy Proposals 6,901,741 7,135,448 7,362,297 7,595,900 7,827,243
Dedicated Revenue 301,718 290,924 291,243 295,551 299,344 plus Dedicated Revenue Policy Proposals 0 17,109 0 0 0 Hospital Fund - Medicaid Hospital Inpatient Fee 0 10,400 0 0 0 Hospital Provider Fee Fund - Medicaid Hospital Outpatient Fee 0 6,709 0 0 0
Dedicated Revenue With Policy Proposals 301,718 308,033 291,243 295,551 299,344
Special Purpose (O-Type) Revenue 516,692 545,907 538,742 547,337 550,570 plus Special Purpose Policy Proposals 0 339 343 348 353 DPR Fee Increases 0 139 143 148 153 DDS Housing Support 0 200 200 200 200
Special Purpose Revenue with Policy Proposals 516,692 546,246 539,085 547,685 550,923
All Proposals 3,721 26,696 9,496 9,489 9,481
General Fund Revenue with Policy Proposals 7,720,152 7,989,727 8,192,625 8,439,136 8,677,510

Revenue FY 2017 Proposed Budget and Financial Plan
3-24
Table 3-13Percentage Changes from Prior Fiscal Year in General Fund,Local Revenue by Source, Fiscal Years 2015-2020
FY 2015 FY 2016 FY 2017 FY 2018 FY 2019 FY 2020Revenue Source Actual Estimate Estimate Projected Projected Projected
Real Property 8.9% 7.4% 4.2% 3.1% 3.1% 3.2%
Transfer to TIF/Pilot 33.3% 15.5% -14.6% 3.4% 3.4% 3.7%Real Property (net) 8.5% 7.3% 4.6% 3.1% 3.1% 3.2%
Personal Property 3.3% 2.0% 3.7% 3.0% 3.5% 2.7%
Public Space Rental 7.2% 3.1% 2.7% 3.2% 3.2% 3.1%
Total Property (net) 8.3% 7.1% 4.5% 3.1% 3.1% 3.2%
General Sales 12.2% -1.9% 4.1% 4.1% 3.7% 3.7%
Transfer to Convention Center Fund 10.4% -2.1% 4.5% -1.0% 2.7% 2.2%Transfer to TIF 76.8% -21.2% -5.1% 9.4% 3.8% 3.7%Transfer to Ballpark Revenue Fund -8.7% 20.1% 3.4% 3.8% 3.0% 3.0%Transfer to Healthy DC and Health Care Expansion Fund 0.0% 135.8% 70.8% 100.0% 0.0% 0.0%Transfer to WMATA Subsidy (parking tax) 3.2% -1.2% 0.0% 0.0% 0.0% 0.0%Transfer to Healthy Schools Fund 0.0% 0.0% 0.0% 0.0% 0.0% 0.0%Transfer to ABRA Program 0.0% 0.0% 0.0% 0.0% 0.0% 0.0%
General Sales (net) 12.0% -1.5% 4.6% 4.7% 4.0% 4.1%
Alcohol 0.2% 2.0% 3.9% 4.3% 4.0% 3.8%
Cigarette -5.2% -2.8% -4.0% -3.7% -3.0% -3.0%
Motor Vehicle -2.0% 2.4% 3.9% 4.3% 4.0% 3.8%
Motor Fuel Tax 10.0% -1.0% -1.0% -1.0% -1.0% -1.0%
Transfer to Highway Trust Fund 10.0% -1.0% -1.0% -1.0% -1.0% -1.0%Total Sales (net) 10.8% -1.4% 4.4% 4.5% 3.9% 3.9%
Individual Income 11.2% -0.6% 4.0% 4.1% 4.1% 3.6%
Corporate Franchise 9.9% -6.6% -1.1% 3.8% 2.3% 5.0%
Unincorporated Business Franchise 3.2% -4.7% 0.0% 3.7% 2.3% 3.8%
Total Income 10.6% -1.6% 3.1% 4.1% 3.8% 3.7%
Public Utility 0.1% 0.5% 0.5% 0.5% 0.5% 0.5%
Transfer to Ballpark Revenue Fund 0.9% 1.0% 1.0% 1.0% 1.0% 21.9%Public Utility (net) 0.1% 0.5% 0.5% 0.5% 0.5% -0.9%
Toll Telecommunications 7.0% 3.2% 3.5% 2.9% 3.4% 3.4%
Transfer to Ballpark Revenue Fund 23.4% -16.7% 3.5% 3.3% 3.4% 3.4%Toll Telecommunications (net) 6.3% 4.2% 3.5% 2.9% 3.4% 3.4%
Insurance Premiums 7.5% -1.8% -4.6% 3.0% 1.9% 1.9%
Transfer to Healthy DC and Health Care Expansion Fund 29.1% 1.3% 2.0% 2.0% 2.0% 2.0%
Insurance Premiums (net) -4.5% -4.1% -9.8% 3.9% 1.9% 1.9%
Healthcare Provider Tax -6.7% 13.5% 2.0% 2.0% 2.0% 2.0%
Transfer to Nursing Facility Quality of Care Fund -6.7% 13.5% 2.0% 2.0% 2.0% 2.0%Ballpark Fee 2.4% -9.0% 3.0% 3.0% 3.0% 3.0%
Transfer to Ballpark Revenue Fund 2.4% -9.0% 3.0% 3.0% 3.0% 3.0%Hospital Bed Tax and Hospital Provider Fee -100.0% - - - - -
Transfer to Hospital Fund and Hospital Provider Fee Fund -100.0% - - - - -(Continued on next page)

FY 2017 Proposed Budget and Financial Plan Revenue
3-25
Table 3-13 (continued)Percentage Changes from Prior Fiscal Year in General Fund,Local Revenue by Source, Fiscal Years 2015-2020
FY 2015 FY 2016 FY 2017 FY 2018 FY 2019 FY 2020Revenue Source Actual Estimate Estimate Projected Projected Projected
ICF-IDD Assessment 1.9% 8.9% 0.8% 2.0% 2.0% 2.2%
Transfer to Stevie Sellows Quality Improvement Fund 1.9% 8.9% 0.8% 2.0% 2.0% 2.2%Care First Contribution -100.0% - - - - -
Transfer to Healthy DC and Health Care Expansion Fund -100.0% - - - - -Total Gross Receipts (net) 0.2% 0.2% -1.2% 1.7% 1.5% 0.7%
Estate 50.3% -28.5% -14.5% 4.7% 4.3% 3.2%
Deed Recordation 23.9% -22.2% 2.3% 3.1% 2.0% 3.1%
Transfer to HPTF/Bond Repayment/West End 23.9% -22.2% 2.3% 5.3% 1.8% 3.0%Deed Recordation (net) 23.9% -22.2% 2.3% 2.7% 2.0% 3.1%
Deed Transfer 30.6% -27.5% 2.0% 3.1% 2.9% 3.2%
Transfer to HPTF/Bond Repayment/West End 30.6% -27.5% 2.0% 3.1% 2.9% 3.2%Deed Transfer (net) 30.6% -27.5% 2.0% 3.1% 2.9% 3.2%
Co-op Recordation -100.0% - - - - -
Economic Interests -6.0% -31.2% -5.9% 0.0% 0.0% 0.0%
Total Other Taxes (net) 24.7% -25.3% 0.1% 2.9% 2.5% 3.0%
TOTAL TAXES NET OF DEDICATED TAXES 10.3% -0.2% 3.5% 3.6% 3.4% 3.4%
Licenses and Permits 12.1% -3.2% 4.8% -7.5% 7.0% -4.6%
Fines and Forfeits -14.3% 29.3% -3.6% -4.4% -5.3% -4.9%
Charges for Services 21.0% -17.0% 2.7% -2.3% 2.7% -2.5%
Miscellaneous -7.2% -8.6% -0.1% -0.2% -0.2% 0.0%
TOTAL NON-TAX -0.6% 1.3% 0.2% -3.6% 0.1% -3.1%
Lottery 1.1% -1.1% 0.9% 0.9% 0.9% 0.9%
TOTAL LOCAL FUND REVENUE NET OF DEDICATED TAXES 9.5% -0.1% 3.3% 3.2% 3.2% 3.0%

Revenue FY 2017 Proposed Budget and Financial Plan
3-26
Table 3-14 Changes from Prior Fiscal Year in General Fund, Local Revenue by Source, Fiscal Years 2015-2020(Dollars in Thousands)
FY 2015 FY 2016 FY 2017 FY 2018 FY 2019 FY 2020Revenue Source Actual Estimate Estimate Projected Projected ProjectedReal Property 178,939 162,702 99,520 76,158 77,405 83,529
Transfer to TIF/Pilot 10,045 6,214 (6,775) 1,347 1,393 1,567
Real Property (net) 168,894 156,488 106,295 74,811 76,012 81,962
Personal Property 1,812 1,145 2,160 1,816 2,182 1,742
Public Space Rental 2,425 1,120 1,006 1,224 1,263 1,263
Total Property (net) 173,131 158,753 109,460 77,851 79,457 84,967
General Sales 143,236 (24,448) 53,538 54,871 51,639 53,731
Transfer to Convention Center Fund 10,997 (2,477) 5,129 (1,191) 3,184 2,640 Transfer to TIF 16,315 (7,951) (1,508) 2,639 1,161 1,180 Transfer to Ballpark Revenue Fund (1,415) 2,996 609 703 576 594 Transfer to Healthy DC and Health Care Expansion Fund - 144 177 427 - - Transfer to WMATA Subsidy (parking tax) 2,096 (782) 6 - - - Transfer to Healthy Schools Fund (1) 1 - - - - Transfer to ABRA Program - - - - - -
General Sales (net) 115,244 (16,378) 49,125 52,293 46,719 49,317
Alcohol 10 125 249 285 277 271
Cigarette (1,713) (869) (1,225) (1,088) (849) (824)
Motor Vehicle (971) 1,119 1,864 2,135 2,074 2,034
Motor Fuel Tax 2,295 (253) (250) (248) (245) (243)
Transfer to Highway Trust Fund 2,295 (253) (250) (248) (245) (243)
Total Sales (net) 112,569 (16,004) 50,013 53,624 48,221 50,798
Individual Income 188,864 (11,055) 73,444 80,013 82,711 74,489
Corporate Franchise 27,841 (20,261) (3,250) 10,911 6,872 14,980
Unincorporated Business Franchise 4,383 (6,619) (24) 4,950 3,114 5,354
Total Income 221,089 (37,935) 70,169 95,874 92,697 94,823
Public Utility 179 729 733 737 740 744
Transfer to Ballpark Revenue Fund 78 87 88 89 89 1,982 Public Utility (net) 101 642 645 648 651 (1,238)
Toll Telecommunications 3,685 1,799 2,030 1,741 2,100 2,172
Transfer to Ballpark Revenue Fund 508 (448) 78 76 80 83
Toll Telecommunications (net) 3,177 2,247 1,952 1,665 2,020 2,089
Insurance Premiums 7,315 (1,865) (4,724) 2,944 1,943 1,982
Transfer to Healthy DC and Health Care Expansion Fund 10,110 587 908 926 945 963 Insurance Premiums (net) (2,795) (2,452) (5,632) 2,018 998 1,018
Healthcare Provider Tax (920) 1,737 292 298 304 310
Transfer to Nursing Facility Quality of Care Fund (920) 1,737 292 298 304 310 Ballpark Fee 809 (3,142) 954 983 1,012 1,042
Transfer to Ballpark Revenue Fund 809 (3,142) 954 983 1,012 1,042 Hospital Bed Tax and Hospital Provider Fee (31,935) 17,100 (17,100) - - -
Transfer to Hospital Fund and Hospital Provider Fee Fund (31,935) 17,100 (17,100) - - - (Continued on next page)

FY 2017 Proposed Budget and Financial Plan Revenue
3-27
Table 3-14 (cont)Changes from Prior Fiscal Year in General Fund, Local Revenue by Source, Fiscal Years 2015-2020(Dollars in Thousands)
FY 2015 FY 2016 FY 2017 FY 2018 FY 2019 FY 2020Revenue Source Actual Estimate Estimate Projected Projected ProjectedICF-IDD Assessment 94 446 41 110 113 124
Transfer to Stevie Sellows Quality Improvement Fund 94 446 41 110 113 124 Care First Contribution (5,000) - - - - -
Transfer to Healthy DC and Health Care Expansion Fund (5,000) - - - - - Total Gross Receipts (net) 483 438 (3,035) 4,331 3,670 1,869
Estate 16,151 (13,753) (5,002) 1,401 1,343 1,023
Deed Recordation 49,685 (57,178) 4,616 6,364 4,233 6,693
Transfer to HPTF/Bond Repayment/West End 7,453 (8,577) 692 1,646 572 1,004 Deed Recordation (net) 42,232 (48,601) 3,923 4,719 3,661 5,689
Deed Transfer 46,435 (54,618) 2,874 4,544 4,382 4,976
Transfer to HPTF/Bond Repayment/West End 6,965 (8,193) 431 682 657 746 Deed Transfer (net) 39,470 (46,425) 2,443 3,862 3,725 4,230
Co-op Recordation (5,201) - - - - -
Economic Interests (1,558) (7,623) (989) - - -
Total Other Taxes (net) 91,094 (116,402) 375 9,981 8,729 10,942
TOTAL TAXES NET OF DEDICATED TAXES 598,366 (11,151) 226,982 241,662 232,774 243,398
Licenses and Permits 9,578 (2,828) 4,114 (6,714) 5,875 (4,124)
Fines and Forfeits (19,595) 34,337 (5,491) (6,409) (7,456) (6,418)
Charges for Services 16,415 (16,034) 2,147 (1,851) 2,150 (2,000)
Miscellaneous (9,049) (9,950) (73) (244) (228) -
TOTAL NON-TAX (2,651) 5,525 697 (15,218) 341 (12,542)
Lottery 619 (586) 500 500 500 500
TOTAL LOCAL FUND REVENUE NET OF DEDICATED TAXES 596,333 (6,212) 228,179 226,944 233,615 231,356

Revenue FY 2017 Proposed Budget and Financial Plan
3-28
Table 3-15General Purpose Non-Tax Revenue by Source, Fiscal Years 2015-2020(Dollars in Thousands)Comp.Object FY 2015 FY 2016 FY 2017 FY 2018 FY 2019 FY 2020Code Agency Object Title Actual Projected Projected Projected Projected Projected
BUSINESS LICENSES AND PERMITS
2004 Public Service Commission Gas License 4 4 4 5 5 5
2003 Public Service Commission Electric License 11 11 11 12 12 12
3001 Depart of Insurance, Securities and Banking Insurance Licenses 14,802 12,900 16,653 13,800 18,360 14,800
3010 D.C. Taxicab Commission Busines License 85 - - - - -
3012 Dept. of Consumer and Regulatory Affairs Building Structures and Equipment 29,250 31,674 31,510 27,898 29,041 28,381
3013 Dept. of Consumer and Regulatory Affairs Certificate of Occupancy Fee 398 400 400 400 400 364
3014 Dept. of Consumer and Regulatory Affairs Refrigeration and Plumbing Permit 5,969 4,500 4,000 4,000 4,000 4,000
3015 Dept. of Consumer and Regulatory Affairs Electrical Permit 2,829 2,600 2,600 2,600 2,600 2,600
3025 Dept. of Consumer and Regulatory Affairs Capacity Placard Permit 1 1 1 1 1 1
3026 Dept. of Consumer and Regulatory Affairs Demolition Permit 378 360 360 360 360 360
3028 Dept. of Consumer and Regulatory Affairs Fence Permit 18 18 18 18 18 18
3029 Dept. of Consumer and Regulatory Affairs Foundation Permit 38 30 30 30 30 30
3030 Dept. of Consumer and Regulatory Affairs Garage Permit 3 3 5 4 3 3
3031 Dept. of Consumer and Regulatory Affairs Miscellaneous Permit 139 95 95 95 95 95
3034 Dept. of Consumer and Regulatory Affairs Raze Permit 287 310 310 310 310 310
3035 Dept. of Consumer and Regulatory Affairs Retaining Wall Permit 125 95 95 95 95 95
3036 Dept. of Consumer and Regulatory Affairs Shed Permit 2 2 2 2 2 2
3037 Dept. of Consumer and Regulatory Affairs Sheeting and Shoring Permit 82 55 55 55 55 55
3038 Dept. of Consumer and Regulatory Affairs Sign Permit 72 70 70 70 70 70
3039 Dept. of Consumer and Regulatory Affairs Special Sign Permit 30 25 25 25 25 25
3040 Dept. of Consumer and Regulatory Affairs Swimming Pool Permit 12 10 10 10 10 10
3041 Dept. of Consumer and Regulatory Affairs Tenant Layout Permit 15 15 15 15 15 15
3042 Dept. of Consumer and Regulatory Affairs Postcard Permit 205 140 140 140 140 140
3044 Dept. of Consumer and Regulatory Affairs Public Space Sidewalk Cafe Permit 82 80 80 80 80 80
9201 Department of Behavioral Health Other License Fees 8 8 7 7 8 8
Total Business License and Permits 54,845 53,406 56,496 50,032 55,735 51,479
NONBUSINESS LICENSES AND PERMITS
3101 Department of Motor Vehicles Drivers License-First Time/Renewals 3,754 3,648 4,335 4,335 4,335 4,335
3105 Department of Motor Vehicles Cancel Road Test Fee 41 35 35 35 35 35
3106 Department of Motor Vehicles Change of Address Fee 2 2 2 2 2 2
3107 Department of Motor Vehicles Drivers License-Knowledge Test 442 315 315 315 315 315
3108 Department of Motor Vehicles Drivers License-Road Test 125 105 105 105 105 105
3120 Metropolitan Police Department Boat Registration 171 165 165 165 165 165
3141 Department of Motor Vehicles Reciprocity Permit-Military/Congressional 617 565 565 565 565 565
3144 Department of Motor Vehicles Digital Certificate Fee 3 3 3 3 3 3
3145 Department of Motor Vehicles Personalized Tags - RSC 9100 93 81 81 81 81 81
3147 Department of Motor Vehicles Dctc Issuances - RSC 9100 686 712 712 712 712 712
3148 Department of Motor Vehicles Temporary Dealer Tags 12 7 7 7 7 7
3149 Department of Motor Vehicles Transfer of Tags - RSC 9100 49 40 40 40 40 40
3151 Department of Motor Vehicles Motor Vehicle Registration 27,994 26,874 27,211 26,961 27,133 27,265
3153 Department of Motor Vehicles Record Searches - RSC 9100 (4) 0 0 0 0 0
3160 Department of Motor Vehicles Associated Fee for One (1) Year 7 1 1 1 1 1
3161 Department of Motor Vehicles Associated Fee for Thirty (30) Days 1 1 1 1 1 1
Total Nonbusiness License and Permits 33,943 32,554 33,578 33,328 33,500 33,632 (Continued on next page)

FY 2017 Proposed Budget and Financial Plan Revenue
3-29
Table 3-15 (Continued)General Purpose Non-Tax Revenue by Source, Fiscal Years 2015-2020(Dollars in Thousands)Comp.Object FY 2015 FY 2016 FY 2017 FY 2018 FY 2019 FY 2020Code Agency Object Title Actual Projected Projected Projected Projected Projected
FINES AND FORFEITURES
5001 Metropolitan Police Department Red Light Revenue and Others (3,015) 11,312 10,364 9,946 9,548 9,172
5012 Metropolitan Police Department Photo Radar O/T Reimbursements 53,233 71,621 69,472 65,999 62,699 59,564
5060 Metropolitan Police Department Fines and Forfeitures - Other 18 15 15 15 15 15
5010 Department of Motor Vehicles Traffic Fines - RSC 1501 64,940 66,799 64,405 61,887 58,129 55,222
5020 Department of Public Works Sale of Abandoned Property 28 28 28 28 28 28
5030 Department of Public Works Booting Fees - RSC1504 90 65 65 65 65 65
5040 Department of Public Works Towing Fees - RSC 1505 196 160 160 160 160 160
5050 Department of Public Works Impoundment Fees - Rsc 1506 337 246 246 246 246 246
3304 Department of Transportation Adjudication Hearing-Traffic Control 123 120 120 120 120 120
5000 Taxi Cab Commission Hackers Fines 84 80 80 80 80 80
5060 Alcoholic Beverage Regulation Admin. Fines and Forfeitures - Other 602 527 527 527 527 527
5060 Depart of Insurance, Securities and Banking Fines 563 563 563 563 563 563
Total Fines and Forfeitures 117,199 151,536 146,045 139,636 132,180 125,762
MISCELLANEOUS
5700 Office of the Chief Financial Officer Disposition of Unclaimed Property 1,971
5701 Office of the Chief Financial Officer Unclaimed Property National Audit 01 19,507 27,000 27,000 27,000 27,000 27,000
6111 Office of the Chief Financial Officer Other Revenue-CCU Collection 3,014 22,878 22,282 21,703 21,142 20,810
5600 Office of the Chief Financial Officer and Others Interest Income (566) 130 130 130 130 130
2538 DC Public Library Library Book Fines 185 178 183 188 193 198
2002 Dept. of Housing and Comm. Development Appr HPAP Repay 650 650 650 650 650 650
3317 Department of Transportation Child Safety Seat Program 9 12 12 12 12 12
6111 Department of Transportation Other Revenue 14 18 18 18 18 18
3318 Department of Transportation Citizen Light and Traffic Control Project 23 44 44 44 44 44
6105 Department of Transportation Other Revenue - Freedom of Information 5 5 5 5 5 5
6107 Department of Public Works Other Revenue - Fleet Auto Auction 988 1,282 1,282 1,282 1,282 1,282
6106 Depart of Insurance, Securities and Banking Service Fees 1 1 1 1 1 1
6106 Department of Corrections Other Revenues 115 100 100 100 100 100
6106 Dept. of Consumer and Regulatory Affairs Other Revenue 233 233 233 233 233 233
6107 Dept. of Consumer and Regulatory Affairs Civil Infraction Fees 1,007 1000 1000 1000 1000 1000
6103 Office of Finance and Resource Mgmt. Reimbursements 9 1 1 1 1 1
6106 Fire and Emergency Medical Services Other Revenues 429 428 428 428 428 428
6111 Fire and Emergency Medical Services Other Revenues-Other 42 1 1 1 1 1
6106 Metropolitan Police Department Other Revenues 167 50 50 50 50 50
6100 Metropolitan Police Department Surplus Vehicle Revenue 942 942 942 942 942 942
6101 Metropolitan Police Department Subrogation Revenue 189 190 190 190 190 190
5700 Metropolitan Police Department Sale of Unclaimed Property 13 13 13 13 13 13
6106 Office of Administrative Hearings Other Revenues 22 0 0 0 0 0
6106 Office of the Attorney General Other/ Revenue 24,781 1 1 1 1 1
6106 Office of the Chief Medical Examiner Other Revenues 246 246 246 246 246 246
6111 Office of the Chief Technology Officer Other Revenue-Other 1 1 1 1 1 1
6106 Office of Zoning Other Revenues 776 1,200 1,200 1,200 1,200 1,200
(Continued on next page)

Revenue FY 2017 Proposed Budget and Financial Plan
3-30
Table 3-15 (Continued)General Purpose Non-Tax Revenue by Source, Fiscal Years 2015-2020(Dollars in Thousands)Comp.Object FY 2015 FY 2016 FY 2017 FY 2018 FY 2019 FY 2020Code Agency Object Title Actual Projected Projected Projected Projected Projected
MISCELLANEOUS (Continued)
6109 Public Service Commission Cocot Registration 25 15 15 15 15 15
6111 Department of General Services Other Revenue - Other 578 578 578 578 578 578
6106 Deputy Mayor for Public Safety and Justice Other Revenue - Other 15 25 25 25 25 25
6111 Deputy Mayor for Planning and Econ Dev Other Revenue - Other 0 0 0 0 0 0
6111 District Department of the Environment Other Revenue 1,390 1,400 1,400 1,400 1,400 1,400
6112 District Department of the Environment DDOE Freedom of Information 4 6 6 6 6 6
6111 District of Columbia Public Schools Other Revenue - Other 14,333 - - - - -
6111 Office of Campaign Finance Other Revenue - Other 2 5 5 5 5 5
6111 Office of Contracting and Procurement Other Revenue - Other 2,149 2,248 2,348 2,348 2,348 2,348
6111 Office of Risk Management Other Revenue - Other 83 18 18 18 18 18
6106 Office of the Chief Financial Officer Other Revenues 520 2000 2000 2000 2000 2000
6111 Office of the Chief Financial Officer Other Revenue - Other 26,518 27,334 27,334 27,334 27,334 27,334
611/6016 Various Agency One-Time Revenue Other Revenue - Other 444 344 449 460 462 457
5300 Office of the Chief Financial Officer Pay-In-Lieu-Tax Private 15,337 15,644 15,957 16,276 16,602 16,934
Total Miscellaneous 116,171 106,221 106,148 105,904 105,676 105,676
CHARGES FOR SERVICES
3200 Public Service Commission TELECO Registration 3 2 2 2 2 2
3201 Dept. of Consumer and Regulatory Affairs Home Occupation License 92 90 90 90 90 90
3202 Dept. of Consumer and Regulatory Affairs Boiler Inspection Permit 135 115 115 115 115 115
3203 Dept. of Consumer and Regulatory Affairs Welding Certificate 19 7 7 7 7 7
3204 Dept. of Consumer and Regulatory Affairs Elevator Inspection License 646 600 600 600 600 600
3206 Dept. of Consumer and Regulatory Affairs Commission Certificate 2 6 6 6 6 6
3206 Metropolitan Police Department Fingerprints, Photos 481 450 450 450 450 450
3207 Department of Corrections Other Service Charges 9 25 25 25 25 25
3207 Department of Motor Vehicles Reinstatement/ Insurance Lapse Fees 1,364 1,216 1,216 1,216 1,216 1,216
3208 Department of Motor Vehicles Reproduction of Reports 3,352 2,500 2,500 2,500 2,500 2,500
3208 Dept. of Consumer and Regulatory Affairs Reproduction of Reports 49 55 55 55 55 55
3208 Metropolitan Police Department Reproduction of Reports 72 68 68 68 68 68
3209 Fire and Emergency Medical Services Emergency Ambulance 29,886 25,000 25,000 25,000 25,000 25,000
3210 Metropolitan Police Department Transcription of Records 248 240 240 240 240 240
3211 Metropolitan Police Department Firearm User Fee 96 100 100 100 100 100
3215 Department of Motor Vehicles Motor Vehicle Titles - Rsc 1259 2,286 2,280 2,280 2,280 2,280 2,280
3219 Dept. of Consumer and Regulatory Affairs Wharves and Markets 432 400 400 400 400 400
3220 Dept. of Consumer and Regulatory Affairs Surveyor Fees 407 400 400 400 400 400
3221 Department of Motor Vehicles Recordation Fee - Rsc 1275 694 707 707 707 707 707
3221 Office of the Chief Financial Officer Deed Recordation Fee 6,039 6,600 6,600 6,600 6,600 6,600
3222 Dept. of Consumer and Regulatory Affairs Corporate Recordation Fee 15,171 13,000 15,000 13,000 15,000 13,000
3223 Department of General Services Parking Permits and Fees 2,128 2,100 2,100 2,100 2,100 2,100
3223 Department of Motor Vehicles Residential Parking Permits and Fees 4,886 4,470 4,470 4,470 4,470 4,470
3228 Dept. of Consumer and Regulatory Affairs Condo/Coop Registration Fee 1 1 1 1 1 1
(Continued on next page)

FY 2017 Proposed Budget and Financial Plan Revenue
3-31
Table 3-15 (Continued)General Purpose Non-Tax Revenue by Source, Fiscal Years 2015-2020(Dollars in Thousands)Comp.Object FY 2015 FY 2016 FY 2017 FY 2018 FY 2019 FY 2020Code Agency Object Title Actual Projected Projected Projected Projected Projected
CHARGES FOR SERVICES (Continued)
3234 Department of Motor Vehicles Other Charges for Services 111 100 100 100 100 100
3234 DC Public Library Other Charges for Services - Other 4 3 3 3 3 3
3234 Dept. of Consumer and Regulatory Affairs Other Charges for Services - Other 70 60 60 60 60 60
3234 Office of the Tenant Advocate Other Charges for Services - Other 2,322 2,200 2,200 2,200 2,200 2,200
3236 Dept. of Consumer and Regulatory Affairs Re-Inspection Fees 5 2 2 2 2 2
3237 Department of Motor Vehicles Business - Insurance Lapse Fee - 1 1 1 1 1
3240 Dept. of Consumer and Regulatory Affairs Suppression Systems for Hoods and Ducts 12 10 10 10 10 10
3241 Dept. of Consumer and Regulatory Affairs Modification and Variance Requests 66 60 60 60 60 60
3242 Dept. of Consumer and Regulatory Affairs Designation of a New Address 13 10 10 10 10 10
3246 Dept. of Consumer and Regulatory Affairs Building Plats(Up To 3 Usual Shaped Lots 208 175 175 175 175 175
3249 Dept. of Consumer and Regulatory Affairs Street and Alley Closing or Revisions 64 50 50 50 50 50
3250 Dept. of Consumer and Regulatory Affairs Subdiv of Land Plats (> 3 Usual Lots) 166 150 150 150 150 150
3251 Dept. of Consumer and Regulatory Affairs Private Surveyor Plan-Filing Wall Exam 27 25 25 25 25 25
3251 Office of the Chief Financial Officer Tax Certificates 100 105 105 105 105 105
3251 Office of the Chief Financial Officer Right-Of-Way Revenue 7,648 - - - - -
3254 Dept. of Consumer and Regulatory Affairs Optional Expedited Building Plats 19 18 18 18 18 18
3255 Dept. of Consumer and Regulatory Affairs Optional Electronic Building Plats 4 5 5 5 5 5
3258 Dept. of Consumer and Regulatory Affairs Certificate of Inclusionary Zoning 16 10 10 10 10 10
3259 Dept. of Consumer and Regulatory Affairs EISF Review Fees 317 217 217 217 217 217
9001 DC Public Library Washington Photo Repo 1 1 1 1 1 1
9012 DC Public Library Bookstore - On Line Sales 16 21 21 21 21 21
3320 Department of General Services Rentals - Other 14,711 14,710 14,857 15,006 15,156 15,156
Total Charges for Services 94,399 78,365 80,512 78,661 80,811 78,811

Page intentionally left blank

Table 3-16: Dedicated Tax Fund Revenue
Table 3-16, which follows, reports the certified revenues and fund balance use for the District’s Dedicated Tax funds.The revenues reported in this table are those Office of Revenue Analysis (ORA) projections based on current law. Theydo not include any policy proposals affecting revenues or fund balances included in this FY 2017 Proposed Budgetand Financial Plan. Any such policy changes are reported earlier in this chapter in Table 3-12 (Policy ProposalsImpacting General Fund Revenues).
The first column in Table 3-16 reports each fund’s available fund balance at the end of FY 2015. Certain funds,by legislation, can retain and carry over to succeeding fiscal years revenue received during the fiscal year that exceedsthe fund’s expenditures. This retained fund balance is an available resource for those funds in future fiscal years. Inthe case of other funds, the legislation that created the fund did not specify that the fund could retain its revenue.Therefore, at the end of the fiscal year, that excess revenue is transferred to the Local fund. The amounts shown inthe “FY 2015 End of Year Fund Balance” column were calculated by the Office of Financial Operations and Systems(OFOS) during the preparation of the District’s Fiscal Year 2015 Comprehensive Annual Financial Report (CAFR).
The next three columns show, for FY 2016, projected revenue under current law and fund balance use by fund.The “Certified Resources” column is the total of the “Certified Revenues” and the “Certified Fund Balance UseColumns.”
The next three columns of the table report, for FY 2017, projected revenue under current law, projected fundbalance use by fund, and total certified resources.
The final three columns report the amount of projected revenue under current law for FY 2018, FY 2019, andFY 2020. Fund balance use is not projected over this three-year period due to the uncertainty of the amount ofavailable fund balances that far into the future.
For each fund, the table reports the tax revenue source(s) from which the dedication is made.
The Dedicated Tax funds in Table 3-16 are divided into two sections. Those Dedicated Tax funds that are partof General Fund revenue are reported in the first section of the table. These funds are categorized in the District’saccounting system within Appropriated Fund 0110 (Dedicated Taxes). The second section of the table includes threeDedicated Tax funds that are categorized within Appropriated Fund 0610 (Enterprise and Other Funds – DedicatedTax).
A December 2015 D.C. Office of Revenue Analysis report (District of Columbia Dedicated Taxes Report)describes in some detail the Dedicated Tax funds listed in Table 3-16. It is available under “Studies” in the “Reports”section of the Office of the Chief Financial Officer web site:
http://cfo.dc.gov/sites/default/files/dc/sites/ocfo/publication/attachments/2015%20Dedicated%20Taxes%20Report.pdf.
FY 2017 Proposed Budget and Financial Plan Revenue
3-33

RevenueFY 2017 Proposed Budget and Financial Plan
3-34 Table 3-16Dedicated Tax Revenue Funds by Source of Revenue, Fiscal Years 2016-2020
FY 2015End of FY 2016 FY 2016 FY 2016 FY 2017 FY 2017 FY 2017 FY 2018 FY 2019 FY 2020
Year Fund Certified Certified Fund Certified Certified Certified Fund Certified Certified Certified CertifiedBalance Revenues Balance Use Resources Revenues Balance Use Resources Revenues Revenues Revenues
TOTAL DEDICATED TAX REVENUE 482,240,653 12,789,704 495,030,357 466,014,115 18,171,302 484,185,417 474,499,329 484,341,681 496,333,006
Convention Center Fund (EZ0 0110) 0 113,971,000 0 113,971,000 119,100,000 0 119,100,000 117,909,000 121,093,000 123,733,000 Sales Tax 113,971,000 119,100,000 117,909,000 121,093,000 123,733,000
Healthy Schools Fund (GD0 0111) 3,752,019 4,266,000 39,560 4,305,560 4,266,000 16,274 4,282,274 4,266,000 4,266,000 4,266,000 Sales Tax 4,266,000 4,266,000 4,266,000 4,266,000 4,266,000
Repayment of Revenue Bonds (DT0 0110) 0 7,832,389 0 7,832,389 7,835,339 0 7,835,339 7,832,389 7,838,539 7,839,039 Deed Recordation Tax 4,564,263 4,571,576 4,610,763 4,593,278 4,590,639 Deed Transfer Tax 3,268,126 3,263,763 3,221,626 3,245,261 3,248,400
Nursing Facility Quality of Care Fund (HT0 0110) 900,000 14,591,000 0 14,591,000 14,883,000 0 14,883,000 15,181,000 15,485,000 15,794,000 Healthcare Provider Tax 14,591,000 14,883,000 15,181,000 15,485,000 15,794,000
Healthy DC Fund (HT0 0111) 11,508,762 45,642,000 0 45,642,000 46,727,000 0 46,727,000 48,080,000 49,025,000 49,988,000 Sales Tax 250,000 427,000 854,000 854,000 854,000 Insurance Premiums Tax 45,392,000 46,300,000 47,226,000 48,171,000 49,134,000
Stevie Sellows Quality Improvement Fund (HT0 0112) 165,573 5,478,000 0 5,478,000 5,519,000 0 5,519,000 5,629,000 5,742,000 5,866,000 ICF-IDD Assessment 5,478,000 5,519,000 5,629,000 5,742,000 5,866,000
WMATA (KE0 0110) 6,209,591 66,664,000 0 66,664,000 66,670,000 0 66,670,000 66,670,000 66,670,000 66,670,000 Sales Tax (parking) 66,664,000 66,670,000 66,670,000 66,670,000 66,670,000
Highway Trust Fund (KZ0 0110) 0 25,004,000 0 25,004,000 24,754,000 0 24,754,000 24,506,000 24,261,000 24,018,000 Motor Fuel Tax 25,004,000 24,754,000 24,506,000 24,261,000 24,018,000
(Continued on next page)

FY
20
17
Pro
po
sed B
ud
get an
d F
inan
cial Plan
Rev
enue
3-35
Table 3-16 (Continued)Dedicated Tax Revenue Funds by Source of Revenue, Fiscal Years 2016-2020
FY 2015End of FY 2016 FY 2016 FY 2016 FY 2017 FY 2017 FY 2017 FY 2018 FY 2019 FY 2020
Year Fund Certified Certified Fund Certified Certified Certified Fund Certified Certified Certified CertifiedBalance Revenues Balance Use Resources Revenues Balance Use Resources Revenues Revenues Revenues
ABRA (LQ0 0110) 881,555 1,170,000 0 1,170,000 1,170,000 0 1,170,000 1,170,000 1,170,000 1,170,000 Sales Tax 1,170,000 1,170,000 1,170,000 1,170,000 1,170,000
Medicaid Hospital Inpatient Fee (HT0 0114) 0 10,400,000 0 10,400,000 0 0 0 0 0 0 Hospital Fund 10,400,000 - - - -
Medicaid Hospital Outpatient Fee (HT0 0115) 0 6,700,000 0 6,700,000 0 0 0 0 0 0 Hospital Provider Fee Fund 6,700,000 - - - -
Sub Total - GENERAL FUND 23,417,501 301,718,389 39,560 301,757,949 290,924,339 16,274 290,940,613 291,243,389 295,550,539 299,344,039
Ballpark Fund (BK0 0610) 0 60,700,000 0 60,700,000 62,430,000 0 62,430,000 64,280,000 66,038,000 69,739,000 Sales Tax 17,900,000 18,509,000 19,212,000 19,788,000 20,382,000 Public Utility Tax 8,768,000 8,856,000 8,944,000 9,034,000 11,016,000 Toll Telecommunications Tax 2,232,000 2,311,000 2,387,000 2,467,000 2,550,000 Ballpark Fee 31,800,000 32,754,000 33,737,000 34,749,000 35,791,000
Housing Production Trust Fund (UZ0 0610) 185,496,000 43,825,264 0 43,825,264 44,945,776 0 44,945,776 47,275,940 48,499,142 50,248,967 Deed Recordation Tax 25,538,824 26,223,882 27,830,354 28,419,842 29,426,419 Deed Transfer Tax 18,286,439 18,721,894 19,445,586 20,079,300 20,822,547
Tax Increment Financing/PILOT (TX0/TY0 0610) 185,177,000 75,997,000 12,750,144 88,747,144 67,714,000 18,155,028 85,869,028 71,700,000 74,254,000 77,001,000 Real Property Tax 46,394,000 39,619,000 40,966,000 42,359,000 43,926,000 Sales Tax 29,603,000 28,095,000 30,734,000 31,895,000 33,075,000
Sub Total - ENTERPRISE FUND 370,673,000 180,522,264 12,750,144 193,272,408 175,089,776 18,155,028 193,244,804 183,255,940 188,791,142 196,988,967

Revenue FY 2017 Proposed Budget and Financial Plan
3-36
Table 3-17: Special Purpose (O-type) Revenue Funds
Table 3-17, which follows, reports the certified revenues and fund balance use for the District’s Special Purpose(O-type) Revenue funds. The revenues reported in this table are District agency projections based on currentlaw. They do not include any policy proposals affecting revenues or fund balances included in this FY 2017Proposed Budget and Financial Plan. Any such policy changes are reported earlier in this chapter in Table 3-12(Policy Proposals Impacting General Fund Revenues).
The first column in Table 3-17 reports each fund’s available fund balance at the end of FY 2015. Certainfunds, by legislation, can retain and carry over to succeeding fiscal years revenue received during the fiscal yearthat exceeds the fund’s expenditures. This retained fund balance is an available resource for those funds infuture fiscal years. In the case of other funds, the legislation that created the fund did not specify that the fundcould retain its revenue. Therefore, at the end of the fiscal year, that excess revenue is transferred to the Localfund. The amounts shown in the “FY 2015 End of Year Fund Balance” column were calculated by the Officeof Financial Operations and Systems (OFOS) during the preparation of the District’s Fiscal Year 2015Comprehensive Annual Financial Report (CAFR).
The next three columns show, for FY 2016, projected revenue under current law and fund balance use byfund. The “Certified Resources” column is the total of the “Certified Revenues” and the “Certified FundBalance Use Columns.” The total certified resources column does not account for any legislated revenue transfersfrom the fund.
The next three columns of the table report, for FY 2017, projected revenue under current law, projectedfund balance use by fund, and total certified resources.
The final three columns report the amount of projected revenue under current law for FY 2018, FY 2019,and FY 2020. Fund balance use is not projected over this three-year period due to the uncertainty of the amountof available fund balances that far into the future.
A February 2015 D.C. Office of Revenue Analysis report (District of Columbia Special Purpose RevenueFunds Report) describes in some detail the Special Purpose Revenue funds listed in Table 3-17. It is availableunder “Studies” in the “Reports” section of the Office of the Chief Financial Officer web site:http://cfo.dc.gov/sites/default/files/dc/sites/ocfo/publication/attachments/Special-Purpose%20Report%202015. pdf.

FY
20
17
Pro
po
sed B
ud
get an
d F
inan
cial Plan
Rev
enue
3-37
Table 3-17Special Purpose (O-type) Fund Revenue, by Fund, Fiscal Years 2016-2020
FY 2015
End of FY 2016 FY 2016 FY 2016 FY 2017 FY 2017 FY 2017 FY 2018 FY 2019 FY 2020
Year Fund Certified Certified Fund Certified Certified Certified Fund Certified Certified Certified Certified
Balance Revenues Balance Use Resources Revenues Balance Use Resources Revenues Revenues RevenuesA. Governmental Direction and Support
Office of the City Administrator (AE0) 0 337,565 0 337,565 337,565 0 337,565 330,000 330,000 330,0000602 Independent Agencies 0 337,565 0 337,565 337,565 0 337,565 330,000 330,000 330,000
Board of Ethics and Government Accountability (AG0) 223,315 150,000 0 150,000 150,000 0 150,000 150,000 150,000 150,0000601 Board of Ethics and Accountability Fund (Fines) 78,690 60,000 0 60,000 60,000 0 60,000 60,000 60,000 60,0000602 Lobbying Registration Fee Fund 144,625 90,000 0 90,000 90,000 0 90,000 90,000 90,000 90,000
Department of General Services (AM0) 471,172 6,199,839 124,000 6,323,839 7,476,144 85,000 7,561,144 7,476,144 7,476,144 7,476,1441150 Utility Payments for Non-DC Agencies 0 2,861,425 0 2,861,425 3,565,744 0 3,565,744 3,565,744 3,565,744 3,565,7441440 RFK and DC Armory Maintenance Fund 0 2,428,659 0 2,428,659 3,000,000 0 3,000,000 3,000,000 3,000,000 3,000,0001460 Eastern Market Enterprise Fund 471,172 839,355 124,000 963,355 840,000 85,000 925,000 840,000 840,000 840,0001500 Facilities Service Request Fund 0 70,400 0 70,400 70,400 0 70,400 70,400 70,400 70,400
Office of Finance and Resource Management (AS0) 0 301,142 0 301,142 407,440 0 407,440 447,679 493,486 542,8341150 Utilities Payment for Non-DC Agencies 0 301,142 0 301,142 407,440 0 407,440 447,679 493,486 542,834
Office of the Chief Financial Officer (AT0) 24,320,874 44,306,223 500,000 44,806,223 43,365,020 500,000 43,865,020 43,366,417 43,675,517 43,925,5170602 Payroll Service Fees 0 380,267 0 380,267 380,267 0 380,267 380,300 390,000 390,0000603 Service Contracts 0 1,525,100 0 1,525,100 1,525,100 0 1,525,100 1,525,300 1,525,500 1,525,5000605 Dishonored Check Fees 0 125,000 0 125,000 125,000 0 125,000 125,000 125,000 125,0000606 Recorder of Deeds Surcharge 4,160,728 2,000,000 500,000 2,500,000 2,000,000 500,000 2,500,000 2,000,000 2,000,000 2,000,0000608 Drug Pre Trust 0 10,000 0 10,000 10,000 0 10,000 10,000 10,000 10,0000610 Bank Fees 0 5,000,000 0 5,000,000 5,000,000 0 5,000,000 5,000,000 5,250,000 5,500,0000611 Tax Collection Fees 0 13,684,036 0 13,684,036 13,684,036 0 13,684,036 13,685,000 13,685,000 13,685,0000613 Unclaimed Property Contingency Fund 0 3,750,600 0 3,750,600 3,750,600 0 3,750,600 3,750,800 3,800,000 3,800,0000614 Defined Contribution Plan Administration 0 750,000 0 750,000 750,000 0 750,000 750,000 750,000 750,0000619 DC Lottery Reimbursement 0 1,765,000 0 1,765,000 1,765,000 0 1,765,000 1,765,000 1,765,000 1,765,0000626 Tobacco Fund Reimbursement 0 285,000 0 285,000 285,000 0 285,000 285,000 285,000 285,0006115 OFT Central Collections Unit (CCU) O Type 20,160,146 15,031,220 0 15,031,220 14,090,017 0 14,090,017 14,090,017 14,090,017 14,090,017
Office of the Secretary (BA0) 0 1,500,000 0 1,500,000 1,000,000 0 1,000,000 1,000,000 1,000,000 1,000,0001243 Distribution Fees 0 1,500,000 0 1,500,000 1,000,000 0 1,000,000 1,000,000 1,000,000 1,000,000(Continued on next page)
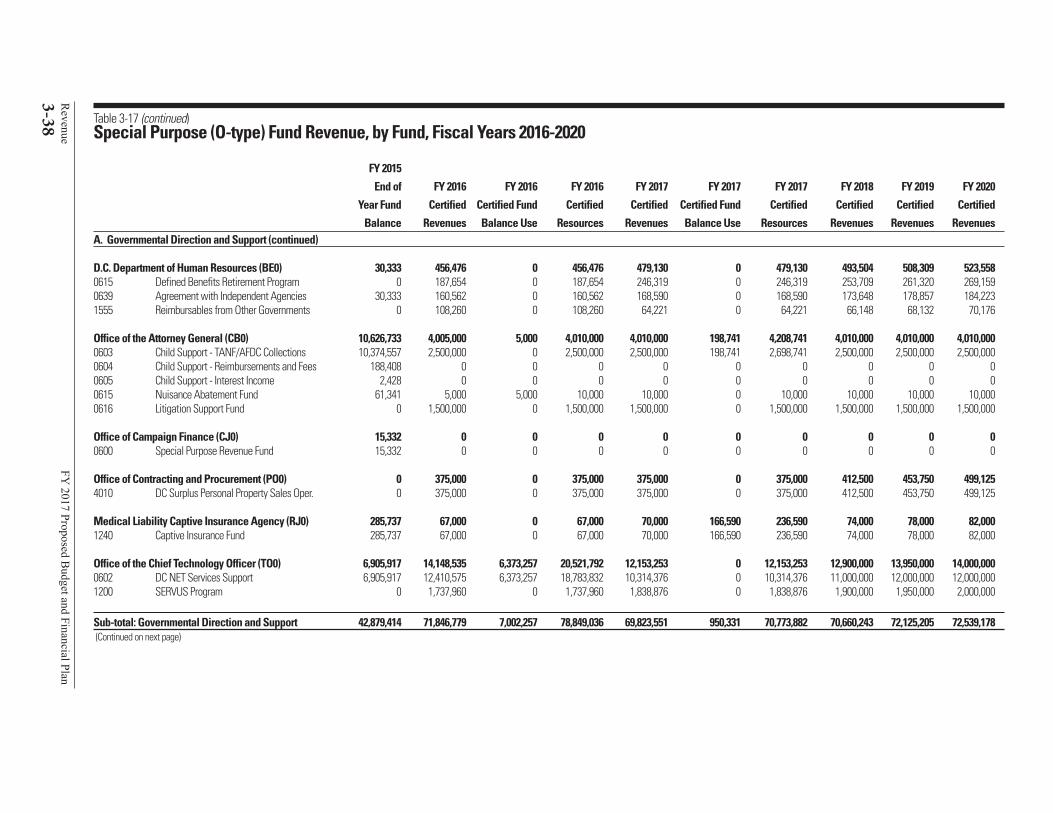
Rev
enu
eF
Y 2
01
7 P
rop
osed
Bu
dg
et and
Fin
ancial P
lan
3-38 Table 3-17 (continued)Special Purpose (O-type) Fund Revenue, by Fund, Fiscal Years 2016-2020
FY 2015
End of FY 2016 FY 2016 FY 2016 FY 2017 FY 2017 FY 2017 FY 2018 FY 2019 FY 2020
Year Fund Certified Certified Fund Certified Certified Certified Fund Certified Certified Certified Certified
Balance Revenues Balance Use Resources Revenues Balance Use Resources Revenues Revenues RevenuesA. Governmental Direction and Support (continued)
D.C. Department of Human Resources (BE0) 30,333 456,476 0 456,476 479,130 0 479,130 493,504 508,309 523,5580615 Defined Benefits Retirement Program 0 187,654 0 187,654 246,319 0 246,319 253,709 261,320 269,1590639 Agreement with Independent Agencies 30,333 160,562 0 160,562 168,590 0 168,590 173,648 178,857 184,2231555 Reimbursables from Other Governments 0 108,260 0 108,260 64,221 0 64,221 66,148 68,132 70,176
Office of the Attorney General (CB0) 10,626,733 4,005,000 5,000 4,010,000 4,010,000 198,741 4,208,741 4,010,000 4,010,000 4,010,0000603 Child Support - TANF/AFDC Collections 10,374,557 2,500,000 0 2,500,000 2,500,000 198,741 2,698,741 2,500,000 2,500,000 2,500,0000604 Child Support - Reimbursements and Fees 188,408 0 0 0 0 0 0 0 0 00605 Child Support - Interest Income 2,428 0 0 0 0 0 0 0 0 00615 Nuisance Abatement Fund 61,341 5,000 5,000 10,000 10,000 0 10,000 10,000 10,000 10,0000616 Litigation Support Fund 0 1,500,000 0 1,500,000 1,500,000 0 1,500,000 1,500,000 1,500,000 1,500,000
Office of Campaign Finance (CJ0) 15,332 0 0 0 0 0 0 0 0 00600 Special Purpose Revenue Fund 15,332 0 0 0 0 0 0 0 0 0
Office of Contracting and Procurement (PO0) 0 375,000 0 375,000 375,000 0 375,000 412,500 453,750 499,1254010 DC Surplus Personal Property Sales Oper. 0 375,000 0 375,000 375,000 0 375,000 412,500 453,750 499,125
Medical Liability Captive Insurance Agency (RJ0) 285,737 67,000 0 67,000 70,000 166,590 236,590 74,000 78,000 82,0001240 Captive Insurance Fund 285,737 67,000 0 67,000 70,000 166,590 236,590 74,000 78,000 82,000
Office of the Chief Technology Officer (TO0) 6,905,917 14,148,535 6,373,257 20,521,792 12,153,253 0 12,153,253 12,900,000 13,950,000 14,000,0000602 DC NET Services Support 6,905,917 12,410,575 6,373,257 18,783,832 10,314,376 0 10,314,376 11,000,000 12,000,000 12,000,0001200 SERVUS Program 0 1,737,960 0 1,737,960 1,838,876 0 1,838,876 1,900,000 1,950,000 2,000,000
Sub-total: Governmental Direction and Support 42,879,414 71,846,779 7,002,257 78,849,036 69,823,551 950,331 70,773,882 70,660,243 72,125,205 72,539,178(Continued on next page)

FY
20
17
Pro
po
sed B
ud
get an
d F
inan
cial Plan
Rev
enue
3-39
Table 3-17 (continued)Special Purpose (O-type) Fund Revenue, by Fund, Fiscal Years 2016-2020
FY 2015
End of FY 2016 FY 2016 FY 2016 FY 2017 FY 2017 FY 2017 FY 2018 FY 2019 FY 2020
Year Fund Certified Certified Fund Certified Certified Certified Fund Certified Certified Certified Certified
Balance Revenues Balance Use Resources Revenues Balance Use Resources Revenues Revenues Revenues
B. Economic Development and RegulationOffice of Planning (BD0) 243,939 55,000 45,000 100,000 100,000 75,000 175,000 100,000 100,000 100,0002001 Historic Landmark and Historic District Filing Fees 243,939 55,000 45,000 100,000 100,000 75,000 175,000 100,000 100,000 100,000
Commission on the Arts and Humanities (BX0) 439,621 0 239,621 239,621 0 200,000 200,000 75,000 75,000 7,5000600 Special Purpose Revenue 439,621 0 239,621 239,621 0 200,000 200,000 75,000 75,000 7,500
Department of Employment Services (CF0) 39,296,870 27,413,684 12,017,813 39,431,497 27,550,793 18,154,335 45,705,128 27,390,000 30,234,500 32,386,2250600 Special Purpose Revenue Fund 21,735 0 0 0 0 0 0 0 0 00610 Workers' Compensation Special Fund 4,654,761 4,500,000 0 4,500,000 4,500,000 0 4,500,000 4,500,000 4,500,000 4,500,0000611 Workers' Compensation Administration Fund 13,627,550 9,913,684 6,234,351 16,148,035 10,020,000 7,846,089 17,866,089 10,000,000 13,000,000 15,000,0000612 UI Interest/Penalties 2,569,102 2,500,000 0 2,500,000 2,625,000 0 2,625,000 2,890,000 3,034,500 3,186,2250624 UI Administrative Assessment 18,423,721 10,500,000 5,783,462 16,283,462 10,405,793 10,308,245 20,714,039 10,000,000 9,700,000 9,700,000
Office of Cable TV, Film, Music, and Entertainment (CI0) 10,536,314 10,196,225 10,166,316 20,362,541 10,434,496 0 10,434,496 12,895,000 12,895,000 12,895,0000600 Special Purpose Revenue 10,536,314 10,101,225 10,166,316 20,267,541 10,339,496 0 10,339,496 12,800,000 12,800,000 12,800,0000610 Production Support 0 95,000 0 95,000 95,000 0 95,000 95,000 95,000 95,000
Dept. of Consumer and Regulatory Affairs (CR0) 23,605,111 26,489,785 5,471,506 31,961,291 28,854,644 7,324,567 36,179,211 27,180,000 28,885,000 27,180,0006006 Nuisance Abatement 3,529,127 5,000,000 735,585 5,735,585 4,700,000 2,748,680 7,448,680 5,000,000 4,800,000 5,000,0006008 Real Estate Guarantee and Education Fund 3,930,626 841,826 0 841,826 1,860,000 0 1,860,000 700,000 1,900,000 700,0006009 Real Estate Appraisal Fee 0 217,826 0 217,826 107,000 0 107,000 230,000 110,000 230,0006010 OPLA - Special Account 2,249,060 4,500,000 0 4,500,000 3,122,420 2,288,396 5,410,816 4,500,000 3,000,000 4,500,0006012 Boxing Commission Revolving Account 0 180,133 0 180,133 95,000 0 95,000 100,000 100,000 100,0006013 Basic Business License Fund 5,908,926 11,000,000 3,950,000 14,950,000 12,500,000 1,690,594 14,190,594 11,000,000 12,500,000 11,000,0006020 Board of Engineers Fund 907,194 750,000 35,921 785,921 170,224 174,070 344,294 750,000 175,000 750,0006030 Green Building Fund 2,862,677 1,500,000 750,000 2,250,000 1,800,000 422,827 2,222,827 1,500,000 1,800,000 1,500,0006040 Corporate Recordation Fund 2,232,879 2,500,000 0 2,500,000 3,000,000 0 3,000,000 2,500,000 3,000,000 2,500,0006045 Vending Regulations Fund 1,984,622 0 0 0 1,500,000 0 1,500,000 900,000 1,500,000 900,000(Continued on next page)

Rev
enu
eF
Y 2
01
7 P
rop
osed
Bu
dg
et and
Fin
ancial P
lan
3-40 Table 3-17 (continued)Special Purpose (O-type) Fund Revenue, by Fund, Fiscal Years 2016-2020
FY 2015
End of FY 2016 FY 2016 FY 2016 FY 2017 FY 2017 FY 2017 FY 2018 FY 2019 FY 2020
Year Fund Certified Certified Fund Certified Certified Certified Fund Certified Certified Certified Certified
Balance Revenues Balance Use Resources Revenues Balance Use Resources Revenues Revenues Revenues
B. Economic Development and Regulation (continued)
Dept. of Housing and Community Development (DB0) 576,512 3,561,870 576,512 4,138,382 3,790,306 0 3,790,306 3,931,141 4,033,065 3,954,8550602 Home Purchase Assistance Program Repayment 32,301 1,515,431 32,301 1,547,732 1,631,007 0 1,631,007 1,901,073 1,996,204 1,921,1860610 DHCD Unified Fund 544,211 2,046,439 544,211 2,590,650 2,159,299 0 2,159,299 2,030,068 2,036,861 2,033,669
Public Service Commission (DH0) 1,759,896 12,709,019 1,721,659 14,430,678 13,295,718 20,000 13,315,718 13,295,718 13,295,718 13,295,7180631 Operating - Utility Assessment 1,701,659 12,709,019 1,701,659 14,410,678 13,295,718 0 13,295,718 13,295,718 13,295,718 13,295,7180661 Allocation from PJM Settlement Fund 58,236 0 20,000 20,000 0 20,000 20,000 0 0 0
Office of the People's Counsel (DJ0) 3,064,199 7,648,091 3,064,199 10,712,290 7,436,354 0 7,436,354 7,436,354 7,436,354 7,436,3540631 Advocate for Consumers 3,064,199 7,648,091 3,064,199 10,712,290 7,436,354 0 7,436,354 7,436,354 7,436,354 7,436,354
Office of the Deputy Mayor for Econ. Develop. (EB0) 15,272,686 8,921,092 5,915,633 14,836,725 19,974,938 1,000,000 20,974,938 15,000,000 15,000,000 15,000,0000419 H Street NE Retail Priority Area Grant Fund 88,911 0 0 0 8,250,000 0 8,250,000 0 0 00609 Industrial Revenue Bond Program 2,561,445 600,000 900,000 1,500,000 1,241,898 0 1,241,898 1,500,000 1,500,000 1,500,0000630 Fund from NEDCO and EDFC 562,550 0 0 0 0 0 0 0 0 00632 AWC & NCRC Development (ED Special Account) 12,059,780 8,321,092 5,015,633 13,336,725 10,483,040 1,000,000 11,483,040 13,500,000 13,500,000 13,500,000
Business Improvements Districts Transfer (ID0) 0 35,000,000 0 35,000,000 37,000,000 0 37,000,000 38,000,000 39,000,000 40,000,0002003 Business Improvement Districts (BIDS) 0 35,000,000 0 35,000,000 37,000,000 0 37,000,000 38,000,000 39,000,000 40,000,000
Alcoholic Beverage Regulation Administration (LQ0) 5,122,432 4,000,000 2,971,975 6,971,975 4,952,000 2,146,024 7,098,024 4,900,000 4,900,000 4,900,0006017 ABC - Import and Class License Fees 5,122,432 4,000,000 2,971,975 6,971,975 4,952,000 2,146,024 7,098,024 4,900,000 4,900,000 4,900,000
Dept. of Insurance, Securities, and Banking (SR0) 13,396,620 20,584,145 5,026,320 25,610,465 22,917,822 3,361,327 26,279,149 23,605,356 24,313,517 25,042,9222100 HMO Assessment 198,920 813,346 198,927 1,012,273 1,115,793 0 1,115,793 1,149,266 1,183,744 1,219,2572200 Insurance Assessment 1,382,355 5,696,571 1,382,355 7,078,926 7,821,013 0 7,821,013 8,055,643 8,297,313 8,546,2322350 Securities and Banking Fund 0 11,403,859 0 11,403,859 11,572,252 0 11,572,252 11,919,420 12,277,002 12,645,3122800 Captive Insurance 0 2,670,369 0 2,670,369 2,408,764 0 2,408,764 2,481,027 2,555,458 2,632,1212910 Foreclosure Mediation Fund 105,550 0 0 0 0 0 0 0 0 02911 Foreclosure Mediation Fund (Temporary) 3,146,865 0 1,445,038 1,445,038 0 1,361,327 1,361,327 0 0 02950 Capital Access Fund 4,257,553 0 0 0 0 0 0 0 0 02951 Loan Participation Fund 4,305,378 0 2,000,000 2,000,000 0 2,000,000 2,000,000 0 0 0Sub-total: Economic Development and Regulation 113,314,201 156,578,912 47,216,555 203,795,466 176,307,071 32,281,253 208,588,323 173,808,569 180,168,154 182,198,574(Continued on next page)

FY
20
17
Pro
po
sed B
ud
get an
d F
inan
cial Plan
Rev
enue
3-41
Table 3-17 (continued)Special Purpose (O-type) Fund Revenue, by Fund, Fiscal Years 2016-2020
FY 2015
End of FY 2016 FY 2016 FY 2016 FY 2017 FY 2017 FY 2017 FY 2018 FY 2019 FY 2020
Year Fund Certified Certified Fund Certified Certified Certified Fund Certified Certified Certified Certified
Balance Revenues Balance Use Resources Revenues Balance Use Resources Revenues Revenues Revenues
C. Public Safety and Justice
Metropolitan Police Department (FA0) 2,015,782 7,770,000 1,000,000 8,770,000 7,833,978 330,000 8,163,978 8,070,000 8,070,000 8,070,0001555 Reimbursable from Other Governments 0 2,100,000 0 2,100,000 1,863,978 0 1,863,978 2,100,000 2,100,000 2,100,0001614 Miscellaneous 0 5,000,000 0 5,000,000 5,300,000 0 5,300,000 5,300,000 5,300,000 5,300,0007278 Asset Forfeiture 2,015,782 670,000 1,000,000 1,670,000 670,000 330,000 1,000,000 670,000 670,000 670,000
Fire and Emergency Medical Services Dept. (FB0) 0 1,025,000 0 1,025,000 1,025,000 0 1,025,000 1,025,000 1,025,000 1,025,0001200 Automated Ext Defib Reg Fee Fund 0 2,500 0 2,500 2,500 0 2,500 2,500 2,500 2,5001613 Other Revenue (CPR Training) 0 22,500 0 22,500 22,500 0 22,500 22,500 22,500 22,5006100 Special Events 0 1,000,000 0 1,000,000 1,000,000 0 1,000,000 1,000,000 1,000,000 1,000,000
Department of Corrections (FL0) 3,704,569 18,911,970 1,551,228 20,463,198 18,373,594 1,794,379 20,167,973 18,310,000 18,310,000 18,310,0000600 Corrections Trustee Reimbursement 2,679,711 17,598,319 1,401,681 19,000,000 17,056,436 1,278,030 18,334,466 17,000,000 17,000,000 17,000,0000601 Concession Income 0 1,100,000 0 1,100,000 1,100,000 0 1,100,000 1,100,000 1,100,000 1,100,0000602 Welfare Account 761,940 30,000 33,198 63,198 33,507 400,000 433,507 30,000 30,000 30,0000605 Correction Reimbursement - Juveniles 262,919 183,651 116,349 300,000 183,651 116,349 300,000 180,000 180,000 180,000
Office of Justice Grants Administration (FO0) 5,579,025 1,000,000 1,034,475 2,034,475 500,000 1,297,516 1,797,516 500,000 500,000 500,0000620 Crime Victims Assistance Fund 4,554,502 1,000,000 351,476 1,351,476 500,000 955,993 1,455,993 500,000 500,000 500,0000621 Dom. Violence Shelter and Transition Housing Fund 1,024,523 0 682,999 682,999 0 341,523 341,523 0 0 0
Office of Unified Communications (UC0) 11,869,442 11,550,000 6,000,000 17,550,000 11,550,000 6,417,028 17,967,028 11,550,000 11,550,000 11,550,0001630 911 and 311 Assessments 9,334,925 11,000,000 6,000,000 17,000,000 11,000,000 3,332,828 14,332,828 11,000,000 11,000,000 11,000,0001631 Prepaid Wireless 911 Charges 2,534,518 550,000 0 550,000 550,000 3,084,200 3,634,200 550,000 550,000 550,000
Sub-total: Public Safety and Justice 23,168,819 40,256,970 9,585,703 49,842,673 39,282,572 9,838,923 49,121,495 39,455,000 39,455,000 39,455,000
Continued on next page)

Rev
enu
eF
Y 2
01
7 P
rop
osed
Bu
dg
et and
Fin
ancial P
lan
3-42 Table 3-17 (continued)Special Purpose (O-type) Fund Revenue, by Fund, Fiscal Years 2016-2020
FY 2015
End of FY 2016 FY 2016 FY 2016 FY 2017 FY 2017 FY 2017 FY 2018 FY 2019 FY 2020
Year Fund Certified Certified Fund Certified Certified Certified Fund Certified Certified Certified Certified
Balance Revenues Balance Use Resources Revenues Balance Use Resources Revenues Revenues RevenuesD. Public Education System
District of Columbia Public Library (CE0) 1,681,046 477,000 103,000 580,000 1,183,000 127,000 1,310,000 1,190,000 1,190,000 1,190,0000104 Gifts-Donations 5,863 0 0 0 0 0 0 0 0 00140 Restricted Gifts and Donations 7,318 0 0 0 0 0 0 0 0 01608 Georgetown Peabody 1,107,442 0 0 0 0 0 0 0 0 01608 Miscellaneous 1,790 0 0 0 0 0 0 0 0 06108 Copies and Printing 348,474 140,000 0 140,000 140,000 20,000 160,000 140,000 140,000 140,0006150 SLD E-Rate Reimbursement 210,160 297,000 103,000 400,000 993,000 107,000 1,100,000 1,000,000 1,000,000 1,000,0006160 Revenue Generating Activities 0 40,000 0 40,000 50,000 0 50,000 50,000 50,000 50,000
District of Columbia Public Schools (GA0) 403,260 6,053,624 0 6,053,624 6,186,259 0 6,186,259 6,321,883 6,460,493 6,603,4140602 ROTC 311,837 851,980 0 851,980 877,447 0 877,447 903,770 930,884 958,8100607 Custodial 0 401,049 0 401,049 409,070 0 409,070 417,251 425,596 434,1080609 Security 0 596,597 0 596,597 608,529 0 608,529 620,699 633,113 645,7760611 Cafeteria 0 644,303 0 644,303 656,693 0 656,693 669,084 681,474 695,1040613 Vending Machine Sales 0 30,546 0 30,546 33,295 0 33,295 36,292 39,558 43,1180621 Parking Fees 0 149,369 0 149,369 153,850 0 153,850 158,465 163,219 168,1160633 DHHS Afterschool Program - Copayment 0 249,421 0 249,421 254,409 0 254,409 259,497 264,687 269,9810634 E-Rate Education Fund 91,423 3,130,359 0 3,130,359 3,192,966 0 3,192,966 3,256,825 3,321,962 3,388,401
Public Charter School Board (GB0) 0 8,000,000 0 8,000,000 8,013,987 0 8,013,987 8,013,987 8,013,987 8,013,9876632 Administrative Fees 0 8,000,000 0 8,000,000 8,013,987 0 8,013,987 8,013,987 8,013,987 8,013,987
Office of the State Superintendent of Education (GD0) 4,070,723 1,047,018 111,252 1,158,270 1,047,018 0 1,047,018 1,047,000 1,047,000 1,047,0000603 State Superintendent of Education Fees 0 152,000 0 152,000 152,000 0 152,000 152,000 152,000 152,0000610 Charter School Credit Enhancement Fund 3,308,794 0 0 0 0 0 0 0 0 00618 Student Residency Verification Fund 567,800 520,000 0 520,000 520,000 0 520,000 520,000 520,000 520,0000619 State Athletic Acts Program and Office Fund 194,128 100,000 111,252 211,252 100,000 0 100,000 100,000 100,000 100,0006007 Site Evaluation 0 275,018 0 275,018 275,018 0 275,018 275,000 275,000 275,000
Sub-total: Public Education System 6,155,028 15,577,642 214,252 15,791,894 16,430,264 127,000 16,557,264 16,572,870 16,711,480 16,854,401(Continued on next page)

FY
20
17
Pro
po
sed B
ud
get an
d F
inan
cial Plan
Rev
enue
3-43
Table 3-17 (continued)Special Purpose (O-type) Fund Revenue, by Fund, Fiscal Years 2016-2020
FY 2015
End of FY 2016 FY 2016 FY 2016 FY 2017 FY 2017 FY 2017 FY 2018 FY 2019 FY 2020
Year Fund Certified Certified Fund Certified Certified Certified Fund Certified Certified Certified Certified
Balance Revenues Balance Use Resources Revenues Balance Use Resources Revenues Revenues RevenuesE. Human Support Services
Department of Parks and Recreation (HA0) 1,675,415 2,200,000 717,811 2,917,811 2,600,000 0 2,600,000 2,700,000 2,800,000 2,900,0000602 Enterprise Fund Account 1,675,415 2,200,000 717,811 2,917,811 2,600,000 0 2,600,000 2,700,000 2,800,000 2,900,000
Department of Health (HC0) 11,181,016 11,439,744 3,165,053 14,604,797 14,227,167 1,399,082 15,626,249 14,511,710 14,801,944 15,097,9830605 SHPDA Fees 569,632 518,008 340,000 858,008 528,369 0 528,369 538,936 549,715 560,7090632 Pharmacy Protection 4,383,885 1,802,465 800,000 2,602,465 2,598,669 999,082 3,597,751 2,650,642 2,703,655 2,757,7280633 Radiation Protection 0 118,605 0 118,605 589,603 0 589,603 601,395 613,423 625,6910641 Other Medical Licenses and Fees 0 224,617 0 224,617 494,773 0 494,773 504,668 514,762 525,0570643 Board of Medicine 4,958,015 8,160,525 1,800,000 9,960,525 9,333,626 400,000 9,733,626 9,520,299 9,710,705 9,904,9190644 Spay and Neutering Fund 20,028 0 0 0 0 0 0 0 0 00655 SHPDA Admission Fee 135,053 525,312 135,053 660,365 535,798 0 535,798 546,514 557,444 568,5930656 EMS Fees 0 59,000 0 59,000 60,180 0 60,180 61,384 62,611 63,8640661 ICF/MR Fees and Fines 244,086 31,212 90,000 121,212 86,149 0 86,149 87,872 89,629 91,4220662 Civic Monetary Penalties 720,184 0 0 0 0 0 0 0 0 00673 DOH - Regulatory Enforcement Fund 150,132 0 0 0 0 0 0 0 0 0
Department of Health Care Finance (HT0) 695,389 2,489,429 0 2,489,429 3,548,921 0 3,548,921 3,548,921 3,548,921 3,548,9210631 Medicaid Collections - 3rd Party Liability 314,173 1,683,943 0 1,683,943 2,500,000 0 2,500,000 2,500,000 2,500,000 2,500,0000632 Bill of Rights - Grievance and Appeals 381,074 749,305 0 749,305 992,740 0 992,740 992,740 992,740 992,7400633 Medicaid Recovery Audit Contractor 142 0 0 0 0 0 0 0 0 00634 Assessment Fund 0 56,181 0 56,181 56,181 0 56,181 56,181 56,181 56,181
Department of Human Services (JA0) 2,555,814 3,200,000 0 3,200,000 1,975,000 0 1,975,000 1,975,000 1,975,000 1,975,0000603 SSI Payback 2,555,814 1,000,000 0 1,000,000 1,000,000 0 1,000,000 1,000,000 1,000,000 1,000,0000613 Food Stamps Collection - Fraud 0 200,000 0 200,000 200,000 0 200,000 200,000 200,000 200,0000629 Agreement with Independent Agencies 0 2,000,000 0 2,000,000 775,000 0 775,000 775,000 775,000 775,000
Department on Disability Services (JM0) 1,545,515 7,363,257 0 7,363,257 7,163,257 0 7,163,257 7,163,257 7,163,257 7,163,2570610 Vocational Rehab. Service Reimbursement 0 350,000 0 350,000 350,000 0 350,000 350,000 350,000 350,0000611 Cost of Care - Non-Medicaid Clients 1,545,515 5,413,257 0 5,413,257 5,413,257 0 5,413,257 5,413,257 5,413,257 5,413,2570616 Randolph Shepherd Unassigned Facilities 0 1,600,000 0 1,600,000 1,400,000 0 1,400,000 1,400,000 1,400,000 1,400,000
Child and Family Services Agency (RL0) 0 1,200,000 0 1,200,000 1,200,000 0 1,200,000 1,200,000 1,200,000 1,200,0000601 H.U.M.N. - Human Res. - ES 0 1,200,000 0 1,200,000 1,200,000 0 1,200,000 1,200,000 1,200,000 1,200,000(Continued on next page)

Rev
enu
eF
Y 2
01
7 P
rop
osed
Bu
dg
et and
Fin
ancial P
lan
3-44 Table 3-17 (continued)Special Purpose (O-type) Fund Revenue, by Fund, Fiscal Years 2016-2020
FY 2015
End of FY 2016 FY 2016 FY 2016 FY 2017 FY 2017 FY 2017 FY 2018 FY 2019 FY 2020
Year Fund Certified Certified Fund Certified Certified Certified Fund Certified Certified Certified Certified
Balance Revenues Balance Use Resources Revenues Balance Use Resources Revenues Revenues RevenuesE. Human Support Services (continued)
Department of Behavioral Health (RM0) 0 4,250,548 0 4,250,548 4,269,856 0 4,269,856 4,290,000 4,310,000 4,330,000
0610 DMH Federal Beneficiary Reimbursement 0 3,790,548 0 3,790,548 3,809,856 0 3,809,856 3,830,000 3,850,000 3,870,000
0640 DMH Medicare and 3rd Party Reimbursement 0 300,000 0 300,000 300,000 0 300,000 300,000 300,000 300,000
0641 DMH Enterprise Fund 0 160,000 0 160,000 160,000 0 160,000 160,000 160,000 160,000
Office of Veterans Affairs (VA0) 13,130 3,200 1,800 5,000 5,000 0 5,000 5,000 5,000 5,000
0600 Office of Veterans Affairs Fund 13,130 3,200 1,800 5,000 5,000 0 5,000 5,000 5,000 5,000
Sub-total: Human Support Services 17,666,278 32,146,178 3,884,664 36,030,842 34,989,201 1,399,082 36,388,283 35,393,888 35,804,122 36,220,161
F. Public Works
Department of Transportation (KA0) 13,991,156 20,707,000 9,066,668 29,773,668 22,699,610 1,718,000 24,417,610 20,949,870 20,949,870 20,949,870
6000 General "O" Type Revenue Sources 0 200,000 0 200,000 200,000 0 200,000 200,000 200,000 200,000
6140 Tree Fund (est. DC Act 14-614) 829,732 850,000 0 850,000 850,000 0 850,000 381,260 381,260 381,260
6425 Federal Transit Authority Grant Match 0 0 0 0 0 0 0 0 0 0
6555 Mall Tunnel Lighting 0 260,000 0 260,000 260,000 0 260,000 320,000 320,000 320,000
6901 DDOT Enterprise Fund - Non Tax Revenues 9,066,668 5,533,000 9,066,668 14,599,668 3,360,292 0 3,360,292 3,360,292 3,360,292 3,360,292
6903 Bicycle Sharing Fund 1,875,419 8,239,000 0 8,239,000 9,038,000 1,718,000 10,756,000 7,697,000 7,697,000 7,697,000
6905 Parking Meter Pay by Phone Transaction Fee 0 3,234,000 0 3,234,000 3,491,318 0 3,491,318 3,491,318 3,491,318 3,491,318
6909 Transportation Infrastructure Mitigation 2,219,337 1,891,000 0 1,891,000 5,000,000 0 5,000,000 5,000,000 5,000,000 5,000,000
6910 Vision Zero Pedestrian and Bicycle Safety 0 500,000 0 500,000 500,000 0 500,000 500,000 500,000 500,000
Washington Metropolitan Area Transit Authority (KE0) 610,350 46,863,000 0 46,863,000 53,600,000 0 53,600,000 53,600,000 53,600,000 53,600,000
0601 Parking Meter WMATA 610,350 42,963,000 0 42,963,000 49,700,000 0 49,700,000 49,700,000 49,700,000 49,700,000
6030 DC Circulator Bus System 0 3,900,000 0 3,900,000 3,900,000 0 3,900,000 3,900,000 3,900,000 3,900,000(Continued on next page)

FY
20
17
Pro
po
sed B
ud
get an
d F
inan
cial Plan
Rev
enue
3-45
Table 3-17 (continued)Special Purpose (O-type) Fund Revenue, by Fund, Fiscal Years 2016-2020
FY 2015
End of FY 2016 FY 2016 FY 2016 FY 2017 FY 2017 FY 2017 FY 2018 FY 2019 FY 2020
Year Fund Certified Certified Fund Certified Certified Certified Fund Certified Certified Certified Certified
Balance Revenues Balance Use Resources Revenues Balance Use Resources Revenues Revenues Revenues
F. Public Works (continued)
District Dept. of Energy and the Environment (KG0) 53,196,118 53,024,203 15,083,314 68,107,517 53,189,193 12,124,854 65,314,047 53,067,525 53,067,525 53,067,5250602 Air Quality Construction Permits 86,125 116,000 51,518 167,518 116,000 34,548 150,548 116,000 116,000 116,0000603 Fishing License 259,190 94,000 165,528 259,528 94,000 106,770 200,770 94,000 94,000 94,0000609 LUST Trust Fund 340,030 0 68,500 68,500 0 29,000 29,000 0 0 00634 Soil Erosion/Sediment Control 1,102,176 1,486,686 892,857 2,379,543 1,487,954 212,736 1,700,690 1,487,954 1,487,954 1,487,9540645 Pesticide Product Registration 1,513,609 1,900,000 280,000 2,180,000 1,900,000 471,191 2,371,191 1,900,000 1,900,000 1,900,0000646 Storm Water Fees 0 1,352,000 0 1,352,000 1,352,000 332,027 1,684,027 1,352,000 1,352,000 1,352,0000654 Storm Water Permit Review 23,961,615 13,500,000 6,425,269 19,925,269 13,500,000 5,916,661 19,416,661 13,500,000 13,500,000 13,500,0000655 Storm Water In Lieu Fee 21,998 850,000 0 850,000 850,000 0 850,000 850,000 850,000 850,0000662 Renewable Energy Development Fund 6,307,941 8,000,000 0 8,000,000 8,000,000 0 8,000,000 8,000,000 8,000,000 8,000,0000663 Clean Land Fund/Brownfield Revitalization 5,623,168 100,000 1,942,039 2,042,039 100,000 1,746,115 1,846,115 100,000 100,000 100,0000667 Wetlands Fund 1,899,901 23,945 977,751 1,001,696 23,945 853,538 877,483 0 0 00670 Anacostia River Clean Up Fund 3,784,410 2,100,000 960,449 3,060,449 2,100,000 767,392 2,867,392 2,100,000 2,100,000 2,100,0000680 Payments from Independent Agencies 0 0 0 0 99,796 0 99,796 0 0 06201 Economy II 0 26,000 0 26,000 26,000 0 26,000 26,000 26,000 26,0006202 Residential Aid Discount (RAD) 2 115,313 0 115,313 115,325 0 115,325 115,000 115,000 115,0006203 Residential Essential Services (RES) 2 115,313 0 115,313 115,325 0 115,325 115,000 115,000 115,0006204 WASA Utility Discount Program 2 115,464 0 115,464 115,480 0 115,480 115,000 115,000 115,0006400 DC Municipal Aggregation Program 192,507 145,674 192,507 338,181 99,249 0 99,249 100,000 100,000 100,0006500 Benchmarking Enforcement Fund 0 0 0 0 107,548 0 107,548 110,000 110,000 110,0006700 Sustainable Energy Trust Fund 7,685,960 20,500,000 3,110,704 23,610,704 20,500,000 1,626,551 22,126,551 20,500,000 20,500,000 20,500,0006800 Energy Assistance Trust Fund 414,705 2,286,571 13,429 2,300,000 2,286,571 28,325 2,314,896 2,286,571 2,286,571 2,286,5716900 Special Energy Assessment Fund 2,778 197,237 2,763 200,000 200,000 0 200,000 200,000 200,000 200,000
Department of Public Works (KT0) 4,254,405 6,915,000 760,000 7,675,000 7,560,692 35,000 7,595,692 7,440,000 7,440,000 7,440,0006000 General "O" Type Revenue Sources 0 275,000 0 275,000 500,000 0 500,000 500,000 500,000 500,0006010 Super Can Program 200,000 115,000 160,000 275,000 115,000 35,000 150,000 115,000 115,000 115,0006072 District Recycle Program 0 325,000 0 325,000 325,000 0 325,000 325,000 325,000 325,0006082 Solid Waste Disposal Fee Fund 4,054,405 4,600,000 600,000 5,200,000 4,734,692 0 4,734,692 4,700,000 4,700,000 4,700,0006591 Clean City Fund 0 1,600,000 0 1,600,000 1,886,000 0 1,886,000 1,800,000 1,800,000 1,800,000(Continued on next page)

Rev
enu
eF
Y 2
01
7 P
rop
osed
Bu
dg
et and
Fin
ancial P
lan
3-46 Table 3-17 (continued)Special Purpose (O-type) Fund Revenue, by Fund, Fiscal Years 2016-2020
FY 2015
End of FY 2016 FY 2016 FY 2016 FY 2017 FY 2017 FY 2017 FY 2018 FY 2019 FY 2020
Year Fund Certified Certified Fund Certified Certified Certified Fund Certified Certified Certified Certified
Balance Revenues Balance Use Resources Revenues Balance Use Resources Revenues Revenues Revenues
F. Public Works (continued)
Department of Motor Vehicles (KV0) 645,481 9,275,000 0 9,275,000 9,275,000 645,481 9,920,481 9,275,000 9,275,000 9,275,0006000 General "O" Type Revenue Sources 0 3,525,000 0 3,525,000 3,525,000 0 3,525,000 3,525,000 3,525,000 3,525,0006100 Fee - Out-of-State Vehicle Registration 0 250,000 0 250,000 250,000 0 250,000 250,000 250,000 250,0006258 Motor Vehicle Inspection Station 645,481 5,500,000 0 5,500,000 5,500,000 645,481 6,145,481 5,500,000 5,500,000 5,500,000
D.C. Taxicab Commission (TC0) 2,060,972 7,299,000 1,500,000 8,799,000 7,842,448 0 7,842,448 7,899,000 7,899,000 7,899,0002100 Justice Department Fingerprints 0 99,000 0 99,000 99,000 0 99,000 99,000 99,000 99,0002200 Taxicab Assessment Act 58,226 0 0 0 0 0 0 0 0 02400 Public Vehicles for Hire Consumer Service 2,002,745 7,200,000 1,500,000 8,700,000 7,743,448 0 7,743,448 7,800,000 7,800,000 7,800,000Sub-total: Public Works 74,758,481 144,083,203 26,409,982 170,493,185 154,166,943 14,523,335 168,690,278 152,231,395 152,231,395 152,231,395
G. Financing and OtherDS0 6462 Public Space Rental Fees for Debt Service 0 5,114,000 0 5,114,000 5,319,000 0 5,319,000 5,531,000 5,753,000 5,983,000PA0 0654 Storm Water Permit Review - Paygo 0 4,500,000 0 4,500,000 4,500,000 0 4,500,000 0 0 0PA0 0670 Anacostia River Clean Up Fund 0 1,500,000 0 1,500,000 0 0 0 0 0 0PA0 6330 Local Transportation Revenue (ROW) - Paygo 0 45,088,729 0 45,088,729 45,088,729 0 45,088,729 40,588,729 39,088,729 37,588,729KZ0 6330 Transfer Dedicated Capital Revenues (ROW) 28,458 0 0 0 0 0 0 4,500,000 6,000,000 7,500,000Sub-total: Financing and Other 28,458 56,202,729 0 56,202,729 54,907,729 0 54,907,729 50,619,729 50,841,729 51,071,729
District-Wide Total 277,970,679 516,692,413 94,313,413 611,005,826 545,907,331 59,119,924 605,027,254 538,741,694 547,337,086 550,570,437
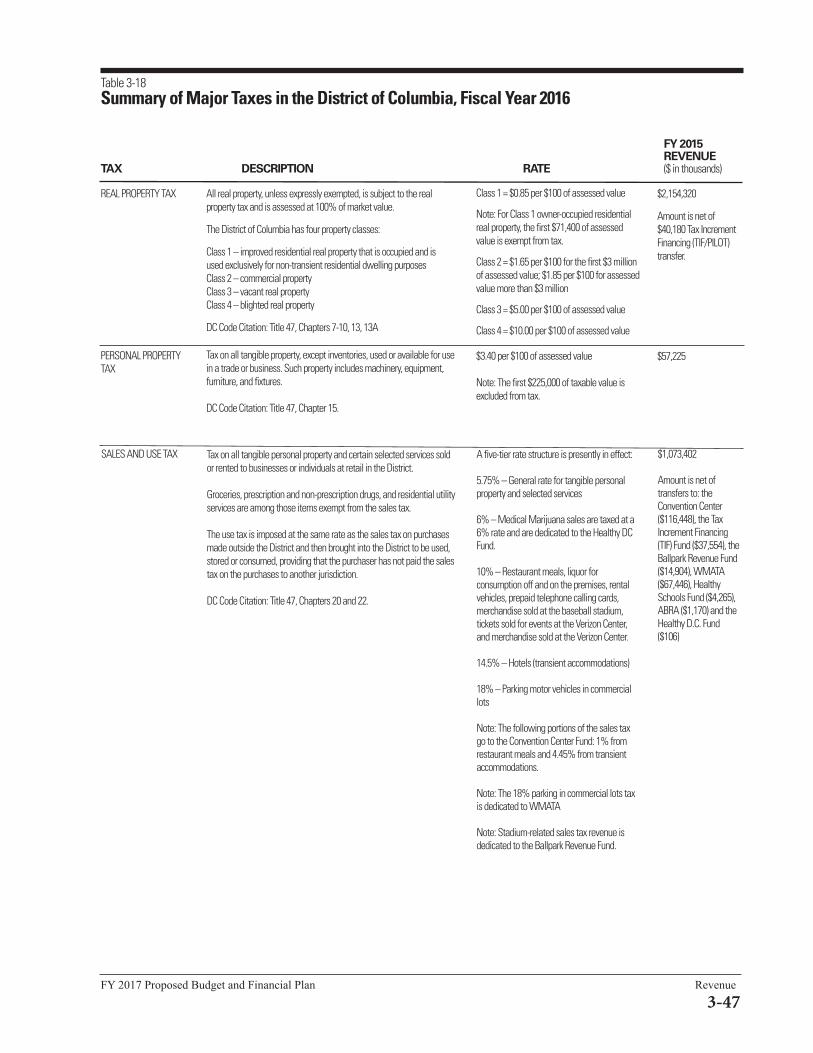
FY 2017 Proposed Budget and Financial Plan Revenue
3-47
FY 2015REVENUE
TAX DESCRIPTION RATE ($ in thousands)
REAL PROPERTY TAX All real property, unless expressly exempted, is subject to the realproperty tax and is assessed at 100% of market value.
The District of Columbia has four property classes:
Class 1 – improved residential real property that is occupied and is used exclusively for non-transient residential dwelling purposesClass 2 – commercial propertyClass 3 – vacant real propertyClass 4 – blighted real property
DC Code Citation: Title 47, Chapters 7-10, 13, 13A
Class 1 = $0.85 per $100 of assessed value
Note: For Class 1 owner-occupied residentialreal property, the first $71,400 of assessedvalue is exempt from tax.
Class 2 = $1.65 per $100 for the first $3 millionof assessed value; $1.85 per $100 for assessedvalue more than $3 million
Class 3 = $5.00 per $100 of assessed value
Class 4 = $10.00 per $100 of assessed value
$2,154,320
Amount is net of$40,180 Tax IncrementFinancing (TIF/PILOT)transfer.
PERSONAL PROPERTYTAX
Tax on all tangible property, except inventories, used or available for usein a trade or business. Such property includes machinery, equipment, furniture, and fixtures.
DC Code Citation: Title 47, Chapter 15.
$3.40 per $100 of assessed value
Note: The first $225,000 of taxable value is excluded from tax.
$57,225
SALES AND USE TAX Tax on all tangible personal property and certain selected services soldor rented to businesses or individuals at retail in the District.
Groceries, prescription and non-prescription drugs, and residential utilityservices are among those items exempt from the sales tax.
The use tax is imposed at the same rate as the sales tax on purchasesmade outside the District and then brought into the District to be used,stored or consumed, providing that the purchaser has not paid the salestax on the purchases to another jurisdiction.
DC Code Citation: Title 47, Chapters 20 and 22.
A five-tier rate structure is presently in effect:
5.75% – General rate for tangible personalproperty and selected services
6% – Medical Marijuana sales are taxed at a6% rate and are dedicated to the Healthy DCFund.
10% – Restaurant meals, liquor for consumption off and on the premises, rentalvehicles, prepaid telephone calling cards, merchandise sold at the baseball stadium,tickets sold for events at the Verizon Center,and merchandise sold at the Verizon Center.
14.5% – Hotels (transient accommodations)
18% – Parking motor vehicles in commerciallots
Note: The following portions of the sales taxgo to the Convention Center Fund: 1% fromrestaurant meals and 4.45% from transientaccommodations.
Note: The 18% parking in commercial lots taxis dedicated to WMATA
Note: Stadium-related sales tax revenue isdedicated to the Ballpark Revenue Fund.
$1,073,402
Amount is net of transfers to: the Convention Center($116,448), the TaxIncrement Financing(TIF) Fund ($37,554), theBallpark Revenue Fund($14,904), WMATA($67,446), HealthySchools Fund ($4,265),ABRA ($1,170) and theHealthy D.C. Fund($106)
Table 3-18Summary of Major Taxes in the District of Columbia, Fiscal Year 2016

Revenue FY 2017 Proposed Budget and Financial Plan
3-48
ALCOHOLIC BEVERAGETAX
Tax on alcoholic beverages manufactured by a holder of amanufacturer’s license and beverages brought into DC by the holder of a wholesaler’s license.
DC Code Citation: Title 25, Chapter 9
Beer = $2.79 per 31-gallon barrel
Champagne/sparkling wine = $0.45 per gallon
Distilled Spirits = $1.50 per gallon
Light wine (alcohol content 14% or less) = $0.30per gallon
Heavy wine (alcohol content above 14%) = $0.40per gallon
$6,244
FY 2015REVENUE
TAX DESCRIPTION RATE ($ in thousands)
CIGARETTE TAX Tax on the sale or possession of cigarettes in the District. Cigarettes sold to the military and to the federal government are exempt.
DC Code Citation: Title 47, Chapter 24.
$0.1455 per cigarette ($2.91 per pack of 20 cigarettes and little cigars that weigh no morethan 4.5 pounds per thousand). This includes a$0.41 per pack surtax in lieu of a retail sales tax(for packs of 20 or fewer cigarettes). For morethan 20 per pack, the surtax will be incrementally increased by $0.02 per each cigarette above 20.
$0.75 per ounce on moist snuff (finely cut, ground,or powdered tobacco that is not intended to be smoked).
$31,492
CORPORATEFRANCHISE TAX
Tax on the net income of corporations having nexus in the District. All corporations engaging in a trade, business or profession in theDistrict of Columbia must register.
DC Code Citation: Title 47, Chapter 18.
9.4% of taxable income
$250 minimum tax if gross receipts are $1 millionor less; $1,000 minimum tax if gross receipts areover $1 million
$308,027
INDIVIDUAL INCOMETAX
Tax on the taxable income of an individual who is domiciled in theDistrict at any time during the tax year, or who maintains an abode in the District for 183 or more days during the year.
DC Code Citation: Title 47, Chapter 18.
First $10,000 = 4.0%
$10,000 < $40,000 = $400 + 6.0% of excessabove $10,000
$40,000 < $60,000 = $2,200 + 7.0% of excessabove $40,000
$60,000 < $350,000 = $3,600 + 8.5% of excessabove $60,000
More than $350,000 = $28,250 + 8.95% ofexcess above $350,000
Note: Excludes Social Security income and maximum $3,000 exclusion on military retiredpay, pension income, or annuity income from DCor federal government.
$1,868,037
MOTOR VEHICLE EXCISETAX
Tax on the Issuance of every original and subsequent certificate of title on motor vehicles and trailers.
DC Code Citation: Title 50, Chapter 22.
Based on manufacturer's shipping weight:
6% of fair market value – 3,499 lbs or less
7% of fair market value – 3,500 to 4,999 lbs
8% of fair market value – more than 5,000 lbs.
$46,607

FY 2017 Proposed Budget and Financial Plan Revenue
3-49
TOLL TELECOMMUNICATIONSTAX
Tax on gross receipts of companies providing toll telecommunicationservice in the District, including wireless telecommunication providers.
D.C. Code Citation: Title 47, Chapter 39.
10% of gross charges – residential11% of gross charges – nonresidential
Note: 1% of nonresidential telecommunicationstax revenue is dedicated to the Ballpark RevenueFund.
$53,524
Amount is net of$2,681 Ballpark Revenue Fund transfer.
INSURANCE PREMIUMSTAX
Tax on gross insurance premiums received on risks in the District, lesspremiums received for reinsurance assumed, returned premiums anddividends paid to policy-holders. The tax is in lieu of all other taxesexcept real estate taxes and fees provided for by the District'sinsurance law.
D.C. Code Citation: Title 31; Title 47, Chapter 26.
2.0% on policy and membership fees and net premium receipts; 2.0% on companies that issueaccident and loss of health insurance (as of10/1/08) and on HMOs (as of 1/1/09).
Note: The 2.0% premium tax on health insurersand 75% of the 2.0% premium tax from HMOs iscurrently dedicated to the Healthy DC Fund.
$59,702
Amount is net of$44,805 Healthy DCFund Transfer.
ESTATE TAX Tax levied on the estate of every decedent dying while a resident ofthe District, and on the estate of every nonresident decedent owningproperty having a taxable status in the District at the time of his or herdeath.
DC Code Citation: Title 47, Chapter 37.
Tax due is determined by using the DC estate taxcomputation worksheet after computing the exempted amounts.
$48,274
PUBLIC UTILITY TAX The tax is imposed on the gross receipts of telephone, television, andradio companies, and on the units delivered to customers of naturalgas, electricity, and heating oil.
D.C. Code Citation: Title 47, Chapter 25.
Television, radio and telephone companies:10% of gross charges – residential11% of gross charges – nonresidential
Heating oil utilities:$0.17 per gallon – residential$0.187 per gallon – nonresidential
Natural gas utilities:$0.0707 per therm – residential$0.07777 per therm – nonresidential
Electric distribution utilities:$0.0070 per kilowatt hour – residential$0.0077 per kilowatt hour – nonresidential
Note: The additional surcharges on non-residential customers are dedicated to theBallpark Revenue Fund.
$137,171
Amount is net of$8,681 Ballpark Revenue Fund transfer.
FY 2015REVENUE
TAX DESCRIPTION RATE ($ in thousands)
UNINCORPORATEDBUSINESS FRANCHISETAX
Tax on the net income of unincorporated businesses with grossreceipts more than $12,000. A 30% salary allowance for owners anda $5,000 exemption are deductible from net income to arrive attaxable income.
A business is exempt if more than 80% of gross income is derivedfrom personal services rendered by the members of the entity andcapital is not a material income-producing factor. A trade, business orprofessional organization that by law, customs or ethics cannot beincorporated is exempt.
DC Code Citation: Title 47, Chapter 18.
9.4% of taxable income
$250 minimum tax if gross receipts are $1 million or less; $1,000 minimum tax if gross receipts are over $1 million
$139,778
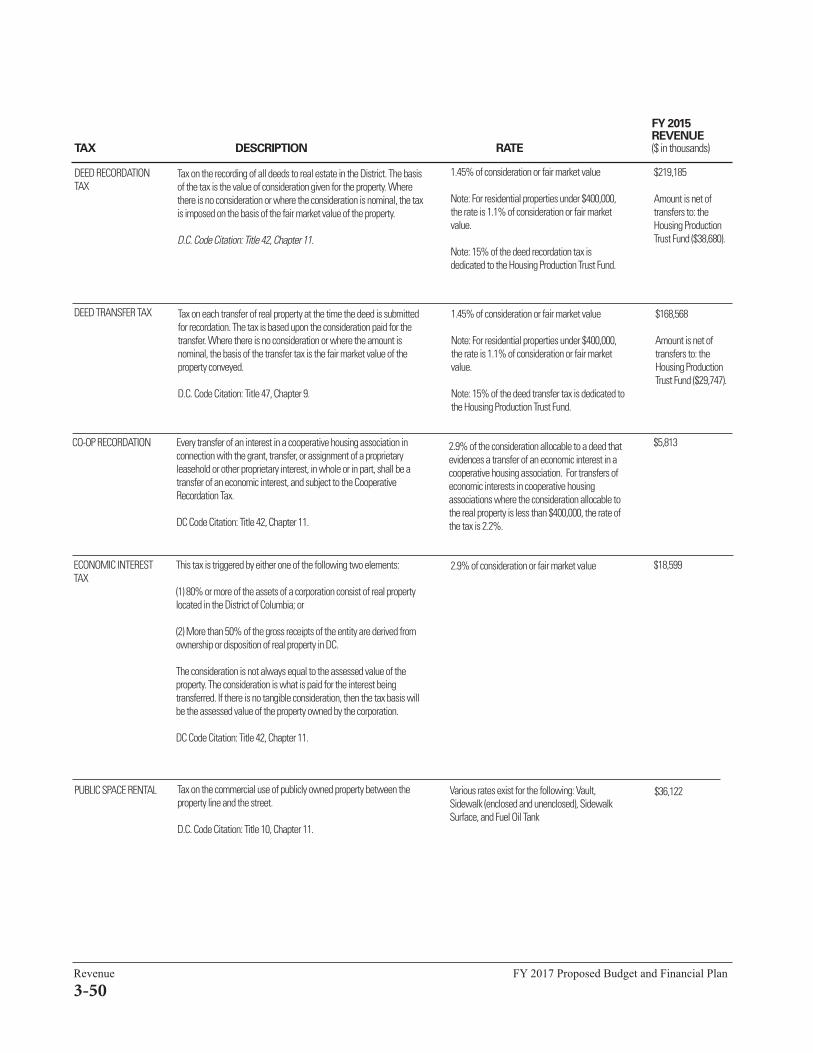
Revenue FY 2017 Proposed Budget and Financial Plan
3-50
DEED TRANSFER TAX Tax on each transfer of real property at the time the deed is submittedfor recordation. The tax is based upon the consideration paid for thetransfer. Where there is no consideration or where the amount isnominal, the basis of the transfer tax is the fair market value of theproperty conveyed.
D.C. Code Citation: Title 47, Chapter 9.
1.45% of consideration or fair market value
Note: For residential properties under $400,000,the rate is 1.1% of consideration or fair marketvalue.
Note: 15% of the deed transfer tax is dedicated tothe Housing Production Trust Fund.
$168,568
Amount is net oftransfers to: theHousing ProductionTrust Fund ($29,747).
ECONOMIC INTERESTTAX
This tax is triggered by either one of the following two elements:
(1) 80% or more of the assets of a corporation consist of real property located in the District of Columbia; or
(2) More than 50% of the gross receipts of the entity are derived fromownership or disposition of real property in DC.
The consideration is not always equal to the assessed value of the property. The consideration is what is paid for the interest being transferred. If there is no tangible consideration, then the tax basis willbe the assessed value of the property owned by the corporation.
DC Code Citation: Title 42, Chapter 11.
2.9% of consideration or fair market value $18,599
FY 2015REVENUE
TAX DESCRIPTION RATE ($ in thousands)
DEED RECORDATIONTAX
Tax on the recording of all deeds to real estate in the District. The basisof the tax is the value of consideration given for the property. Wherethere is no consideration or where the consideration is nominal, the taxis imposed on the basis of the fair market value of the property.
D.C. Code Citation: Title 42, Chapter 11.
1.45% of consideration or fair market value
Note: For residential properties under $400,000,the rate is 1.1% of consideration or fair marketvalue.
Note: 15% of the deed recordation tax is dedicated to the Housing Production Trust Fund.
$219,185
Amount is net oftransfers to: the Housing ProductionTrust Fund ($38,680).
Every transfer of an interest in a cooperative housing association in connection with the grant, transfer, or assignment of a proprietaryleasehold or other proprietary interest, in whole or in part, shall be atransfer of an economic interest, and subject to the CooperativeRecordation Tax.
DC Code Citation: Title 42, Chapter 11.
2.9% of the consideration allocable to a deed thatevidences a transfer of an economic interest in acooperative housing association. For transfers ofeconomic interests in cooperative housing associations where the consideration allocable tothe real property is less than $400,000, the rate ofthe tax is 2.2%.
$5,813CO-OP RECORDATION
PUBLIC SPACE RENTAL Tax on the commercial use of publicly owned property between the property line and the street.
D.C. Code Citation: Title 10, Chapter 11.
Various rates exist for the following: Vault,Sidewalk (enclosed and unenclosed), Sidewalk Surface, and Fuel Oil Tank
$36,122

FY 2017 Proposed Budget and Financial Plan Revenue
3-51
FY 2015REVENUE
TAX DESCRIPTION RATE ($ in thousands)
BALLPARK FEE A fee on annual District gross receipts. It is levied on Districtbusinesses with over $5 million in gross receipts.
D.C. Code Citation: Title 47, Chapter 27B.
Ballpark Fee Schedule:District gross receipts $5 million - $8 million =$5,500District gross receipts $8 million - $12 million =$10,800District gross receipts $12 million - $16 million =$14,000District gross receipts over $16 million = $16,500
Note: All revenue from this fee is dedicated to theBallpark Revenue Fund.
$0
Amount is net of$34,942 BallparkRevenue Fundtransfer.
MOTOR VEHICLE FUELTAX
The tax is imposed on every importer of motor fuels, includinggasoline, diesel fuel, benzol, benzene, naphtha, kerosene, heating oils, all liquefied petroleum gases, and all combustible gases andliquids suitable for the generation of power for motor vehicles.
DC Code Citation: Title 47, Chapter 23
$0.235 per gallon
Note: All revenue from this tax is dedicated to theHighway Trust Fund.
$0
Amount is net of$25,256 HighwayTrust Fund transfer.
Source of General Fund Revenue Amounts: Government of the District of Columbia Comprehensive Annual Financial Report, Year Ended September 30, 2015
HEALTHCARE PROVIDERASSESSMENT
Assessment on the net resident revenue of each nursing facility in the District.
D.C. Code Citation: Title 47, Chapter 12C.
A uniform amount per licensed bed (as specifiedby rules issued by the Mayor) is assessed up to6% of a nursing facility’s net resident revenue.
Note: All revenue from this assessment is dedicated to the Nursing Facility Quality of CareFund.
$0
Amount is net of$12,854 Nursing Facility Quality ofCare Fund transfer
ICF-IDD ASSESSMENT The tax is assessed on the gross revenue of each intermediate carefacility for individuals with intellectual or developmental disabilities(ICF-IDD) in the District.
DC Code Citation: Title 47, Chapter 12D
5.5% of gross revenue
Note: All revenue from this tax is dedicated to theStevie Sellows Quality Improvement Fund.
$0
Amount is net of$5,032 transfer toStevie Sellows.

Page intentionally left blank
1 D.C. Law 13-161 took effect on October 4, 2000, and is codified in § 47-318 and § 47-318.01 of the D.C. Official Code.
2 See D.C. Official Code § 47-318(6).
3 Although the law requires the tax expenditure budget to estimate the revenue loss for the current fiscal year and the subsequent two fiscal years, thisreport covers the current year and the subsequent three fiscal years in order to be consistent with the District’s four-year financial plan and budget.
FY 2017 Proposed Budget and Financial Plan Revenue
3-53
D.C. Law 13-161, the “Tax Expenditure Budget Review Act of 2000,”1 requires the Chief Financial Officer to
prepare a biennial tax expenditure budget that estimates the revenue loss to the District government resulting from
tax expenditures during the current fiscal year and the next two fiscal years. The law defines “tax expenditures”
as “the revenue losses attributable to provisions of federal law and the laws of the District of Columbia that
allow, in whole or in part, a special exclusion, exemption, or deduction from taxes or which provide a special
credit, a preferential rate of tax, or a deferral of tax liability.”2
This report, which estimates the revenue forgone due to tax expenditures in fiscal years 2016 through 2019,3
covers more than 200 separate tax provisions.
The Importance of Tax ExpendituresTax expenditures are often described as “spending by another name,” or “disguised spending.” Policymakers use
tax abatements, credits, deductions, deferrals, and exclusions to promote a wide range of policy goals in
education, human services, public safety, economic development, environmental protection, and other areas.
Instead of pursuing these objectives through direct spending, policymakers use tax reductions to favor particular
activities (such as hiring new employees) or transfer resources to particular groups (such as the blind or elderly).
For example, a program to expand access to higher education could offer tax deductions for college savings
instead of increasing student loans or grants. Regardless of which approach the government uses, there is a real
resource cost in terms of forgone revenue or direct expenditures.
Tax expenditures are frequently used as a policy tool in the District of Columbia. More than 100 tax
expenditures result from federal tax provisions that are mirrored in the D.C. income tax. These are known as
“federal conformity tax expenditures.” An example is the home mortgage interest deduction: the District follows
the federal practice of allowing taxpayers to deduct home mortgage interest payments from their individual
income tax liability. In addition, there are more than 100 tax preferences established by local law. Both types
of tax expenditures (federal conformity and local) warrant regular scrutiny to make sure they are effective,
efficient, and equitable, and to highlight the tradeoffs between tax expenditures and other programs.
Since the previous tax expenditure budget was published in 2014, policymakers have established five new
local tax expenditures. These involve: (1) location incentives for Qualified High Technology Companies (2)
urban farming and good security, (3) tax on unincorporated businesses, (4) deeds to property transferred to a
named beneficiary of a revocable transfer on death, and (5) exemption on security interest instrument. Within
the past two years, policymakers also repealed one of the local tax expenditure: first-time homebuyer credit for
D.C government employees.
Tax expenditures differ from direct expenditures in several respects. Direct spending programs in the District
receive an annual appropriation, and the proposed funding levels are reviewed during the annual budget cycle.
By contrast, tax expenditures remain in place unless policymakers act to modify or repeal them; in this respect,
they are similar to entitlement programs. Direct spending programs are itemized on the expenditure side of the
Tax Expenditure Budget FY 2016 - FY 2019
Revenue FY 2017 Proposed Budget and Financial Plan
3-54
budget, whereas revenues are shown in the budget as aggregate receipts without an itemization of tax
expenditures.
The tax expenditure budget aims to subject tax preferences to the same scrutiny as direct appropriations.
The itemization of tax expenditures provides policymakers with a more complete picture of how the government
uses its resources and should help officials consider ways to reallocate resources more effectively. For example,
if ineffective or outmoded tax expenditures were eliminated, policymakers could free up resources to expand
high-priority direct spending programs or cut tax rates. This exercise is designed to provide policymakers with
the information they need about tax expenditures to make sound fiscal policy decisions.
Structure of the Tax Expenditure BudgetThe tax expenditure budget for FY 2016 – FY 2019 is presented in Table 3-19 at the end of this section. The
table classifies each tax expenditure by the type of tax and provides the statutory authority, year of enactment,
policy area, and estimated revenue loss for fiscal years 2016 through 2019. In addition, an expanded version of
the tax expenditure budget which describes the purpose, structure, and eligibility criteria for each provision will
be published by the Office of Revenue Analysis (ORA) and posted on the CFO’s internet site at www.cfo.dc.gov.
All of the federal conformity expenditures flow through to the District’s individual and business income
taxes; the federal government does not impose property taxes or sales taxes. By conforming to the federal
definition of adjusted gross income (with several exceptions), the District thereby adopts most of the exclusions
and deductions from income that are part of the federal personal and corporate income tax systems. Most other
states with an income tax follow a similar practice.
The provisions in the tax expenditure budget are classified by the following types:
• exclusions, which are items that are not considered part of a taxpayer’s gross income for tax purposes, even
though they increase his or her resources or wealth. Exclusions do not have to be reported on a tax return
but still cause adjusted gross income to be lower than it otherwise would be. Employer contributions to
health and retirement plans are examples.
• exemptions, which are per-person reductions in taxable income that taxpayers can claim because of their
status or circumstances (such as being a senior citizen).
• adjustments, which are reductions in taxable income that are available to all tax filers who meet certain
criteria, regardless of whether or not they itemize their deductions. Adjustments are also known as
“above-the-line” deductions and are entered on the tax return.
• deductions, which are reductions to taxable income that must be itemized on the tax form. This option is not
available to those who choose the standard deduction.
• subtractions, which are reductions from federal adjusted gross income that are used to derive District of
Columbia adjusted gross income. Subtractions reflect income that is taxed by the federal government but
not by the D.C. government.
• credits, which reduce tax liability directly instead of reducing the amount of income subject to taxation.
Credits can be refundable (if the amount of the credit exceeds tax liability, the taxpayer gets the difference
as a direct refund) or non-refundable (the amount of the credit cannot exceed tax liability).
• abatements, which are reductions in tax liability (typically real property tax liability) that are often applied
on a percentage basis or through a negotiated process.

FY 2017 Proposed Budget and Financial Plan Revenue
3-55
• deferrals, which delay the recognition of income to a future year or years. Because they shift the timing of
tax payments, deferrals function like interest-free loans to the taxpayer.
• rebates, which are refunds provided to qualifying taxpayers as a separate payment (as contrasted with tax
credits that are first applied as a reduction of tax liability).
• special rules, a category that is used for federal tax expenditures that involve blended tax rates or special
accounting procedures and do not fit neatly into any other category.
Each tax expenditure was also classified by one of 17 policy or program areas, such as education, health,
social policy, and transportation. The policy areas largely mirror the categories used by the Joint Committee on
Taxation (JCT) of the U.S. Congress, in order to facilitate comparisons. Nevertheless, the categories were
modified and expanded in several cases to make them more relevant to the District of Columbia. For example,
the “business and commerce” category used by the JCT was changed to “economic development” to reflect a
policy focus of particular importance in the District, and a “public safety” category was added (there are no
public safety tax expenditures at the federal level).
The four policy areas with the largest number of federal conformity provisions are housing (30 tax
expenditures), economic development (26), income security (15), education (12), and health (10). Nevertheless,
the ordering of federal conformity tax expenditures by estimated revenue loss for each policy area (FY 2016)
produces a different ranking. Income security provisions account for the largest estimated revenue loss due to
the forgone revenue from employer-provided fringe benefits such as pension contributions, which are excluded
from the employee’s taxable income (as are the earnings on those contributions). Health provisions rank second
in revenue loss for federal conformity provisions, followed by housing and economic development. Many
federal tax expenditures that are classified under economic development concern the definition or timing of
different types of business income, expenses, reserves, and depreciation.
The four policy areas with the largest number of local tax expenditures are housing (30 tax expenditures),
economic development (26), and social policy (15), and income security (12). Once again, the ordering of local
tax expenditures by estimated revenue loss for each policy area produces a different ranking.4 The general law
category (which includes constitutional and statutory mandates for tax policy) had the largest estimated revenue
loss due to the forgone revenues from federal tax-exempt property in the District of Columbia, followed by
economic development, social policy, and housing.
Important CaveatsA particular caution about the interpretation of the revenue loss estimates in the tax expenditure budget deserves
emphasis. The forgone revenue estimate is intended to measure what is being “spent” through the tax system,
or the amount of relief or subsidy provided through that provision. Nevertheless, the forgone revenue is notidentical to the amount of revenue that could be gained by repealing the tax expenditure. There are three main
reasons why:
• First, the estimates of revenue loss are “static” and therefore do not reflect behavioral changes that might occur
if a tax expenditure were repealed. For example, if the District eliminated the local supplement to the federal
earned income tax credit, people might reduce their hours of work and their income tax payments could also
drop.
• Second, the revenue loss for each tax expenditure is estimated independently, which does not account for
interaction effects among different tax provisions. For example, D.C. law establishes that taxpayers may not
claim both the local supplement to the earned income tax credit and the D.C. low-income credit. If the local
earned income credit were abolished, more taxpayers might then claim the low-income credit.
• Third, the D.C. government might not be able to collect the full amount owed for administrative reasons. For
example, if the District disallowed for local income tax purposes an exemption or exclusion that is allowed
4 The estimated revenue loss in these calculations was for FY 2016.

Revenue FY 2017 Proposed Budget and Financial Plan
3-56
on the federal income tax (a process known as “decoupling”), the District would probably not recoup all of
the forgone revenue. The reason is that taxpayers would have to make a separate calculation on their District
income taxes to add back the dollars that had been excluded, and compliance with this requirement would
not be universal (nor would audits detect all violations).
Because of the factors described above, the total forgone revenue from tax expenditures is not equivalent to
the sum of the individual estimates of forgone revenue. The U.S. Government Accountability Office states that:
While sufficiently reliable as a gauge of general magnitude, the sum of the individual revenue loss estimates has
important limitations in that any interactions between tax expenditures will not be reflected in the sum. Thus,
the revenue loss from all or several tax expenditures together might be greater or less than the sum of the estimated
revenue losses from the individual tax expenditures, and no measure of the size or the magnitude of these
potential interactions or behavioral responses to all or several tax expenditures is available.5
MethodologySummary statistics from the Office of Tax and Revenue (OTR) from D.C. tax returns were an important source
of data for the tax expenditure budget and were particularly useful for estimating the forgone revenue from local
income tax provisions. Unfortunately, in many instances tax expenditures cannot be estimated from available
tax data because they involve income, property, or economic activity that is not taxed, and the relevant information
is never reported to the tax office. Therefore, the Office of Revenue Analysis (ORA) often used data from
federal sources (such as the Census Bureau and the Bureau of Economic Analysis) and D.C. government agencies
to estimate the number of beneficiaries and the revenue lost from certain tax expenditures.
OTR generally lacks information on federal income tax expenditures because the amounts excluded are not
reported and the amounts deducted are subtracted from federal adjusted gross income, which is the starting point
for a D.C. income tax return. Therefore, ORA’s federal conformity estimates represent a District of Columbia
portion of the nationwide tax expenditure estimates prepared by the JCT.6 ORA estimated the D.C. portion
using two fractions: (1) a ratio representing the D.C. share of the relevant activity or population, such as D.C.
taxable income divided by national taxable income, and (2) a ratio representing the D.C. average tax rate divided
by the U.S. average tax rate.
Because of the methodological challenges and data issues, it is important to view the revenue estimates as
indicating orders of magnitude rather than providing precise point estimates.
The following is a summary of key terms that are used in the summary table:
• too small: refers to a federal tax expenditure with forgone revenue that was less than $50 million annually,
according to the JCT. The revenue loss to the District from conforming to the federal policy would be very
close to zero.
• sunset: means that there will be no revenue loss because the provision has expired.
• minimal: refers to a local tax expenditure for which precise data are lacking, but the forgone revenue is
estimated to be less than $50,000 per year.
• no estimate: refers to a local tax expenditure for which precise data are lacking, but for which the revenue
loss might not be minimal. In addition, “no estimate” refers to cases in which calculations cannot be made
because there are fewer than three claimants. In order to protect the confidentiality of individual tax records,
U.S. Internal Revenue Service rules provide that, “No statistical tabulations may be released with cells
containing data from fewer than three returns.”
5 U.S. Government Accountability Office, Government Performance and Accountability: Tax Expenditures Represent a Substantial Federal Commitmentand Need to Be Reexamined (GAO-05-960, September 2005), p. 3.
6 In some cases, ORA used tax expenditure estimates from the U.S. Department of the Treasury when data from the Joint Committee on Taxation werenot available.

Page intentionally left blank

Rev
enue
FY
2017 P
roposed
Budget an
d F
inan
cial Plan
3-58 Table 3-19
District of Columbia Tax Expenditure Estimates for FY 2016-2019
Federal Conformity Estimates(Individual and Corporate Income Taxes)
Revenue Forgone ($ in thousands)Internal
Program Year RevenueNo Name of Tax Expenditure Area Enacted Code Section FY 2016 FY 2017 FY 2018 FY 2019
Federal Exclusions1 Capital gains on assets transferred at death Economic development 1921 1001, 1002, 1014,
1015, 1023, 1040, 1221, and 1222 $27,441 $28,086 $27,548 $27,548
2 Capital gains on assets transferred as a gift Economic development 1921 1015 $2,725 $2,993 $3,282 $3,2423 Cash accounting, other than agriculture Economic development 1916 446 and 448 $2,272 $2,272 $2,375 $2,3754 Credit union income Economic development 1937 501(c)(14) and
12 USC 1768 $2,440 $2,542 $2,745 $2,9495 Distribution from redemption of stock to pay taxes imposed at death Economic development 1950 303 too small too small too small too small6 Gain on like-kind exchanges Economic development 1921 1031 $20,643 $21,262 $22,085 $22,6277 Imputed interest Economic development 1964 163(e), 483, 1274,
and 1274A $387 $452 $452 $4528 Interest on small-issue qualified private-activity bonds Economic development 1968 103, 141, 144,
and 146 $515 $515 $515 $5159 Magazine, paperback, and record returns Economic development 1978 458 too small too small too small too small10 Small business stock gains Economic development 1993 1202 $905 $905 $996 $996
108(f), 20 USC 1087ee(a)(5) and
42 USC 2541-11 Discharge of certain student loan debt Education 1984 1(g)(3) $192 $192 $192 $19212 Earnings of Coverdell education savings accounts Education 1998 530 $96 $96 $192 $19213 Earnings of qualified tuition programs Education 1997 529 $1,154 $1,346 $1,538 $1,82714 Employer-provided education assistance Education 1978 127 $915 $915 $915 $91515 Employer-provided tuition reduction Education 1984 117(d) $229 $229 $229 $22916 Interest on education savings bonds Education 1988 135 $19 $19 $19 $19
Interest on state and local private- 103, 141, 142(k), activity bonds issued to finance education 145, 146, and
17 facilities Education 1986 501(c)(3) $4,641 $4,895 $5,156 $5,156(Continued on next page)

FY
2017 P
roposed
Budget an
d F
inan
cial Plan
Rev
enue
3-59
Table 3-19 (continued)
District of Columbia Tax Expenditure Estimates for FY 2016-2019
Federal Conformity Estimates(Individual and Corporate Income Taxes)
Revenue Forgone ($ in thousands)Internal
Program Year RevenueNo. Name Area Enacted Code Section FY 2016 FY 2017 FY 2018 FY 2019
Federal Exclusions (cont.)18 Interest on state and local private-activity student loan bonds Education 1965 103, 141, 144(b), and 146 $776 $776 $903 $90319 Scholarship and fellowship income Education 1954 117 $2,788 $2,884 $3,076 $3,17220 Cafeteria plan benefits Employment 1974 125 $30,193 $33,395 $35,988 $37,97021 Employee awards Employment 1986 74(c) and 274(j) $229 $229 $229 $229
401(a)(28), 404(a)(9), 404(k), 415(c)(6),
512 (e), 1042, 4975(d)(3), 4978,
22 Employee stock ownership plans Employment 1974 and 4979A $724 $724 $804 $80423 Employer-paid meals and lodging (other than military) Employment 1918 119 and 132(e)(2) $1,601 $1,677 $1,754 $1,83024 Housing allowance for ministers Employment 1921 107 and 265 $610 $610 $610 $61025 Miscellaneous fringe benefits Employment 1984 117(d) and 132 $5,871 $5,947 $6,100 $6,405
Spread of acquisition of stock under incentive stock 26 option plans and employee stock purchase plans Employment 1981 422 and 423 -$799 -$799 -$718 -$718
419, 419A, 501(a),27 Voluntary employees' beneficiary association income Employment 1928 501(c)(9), and 4976 $2,440 $2,516 $2,516 $2,516
Interest on state and local private-activity bonds issued 103, 141, 142(f),28 to support energy facilities Energy 1980 and 146 too small too small too small too small29 Accrued interest on savings bonds General fiscal assistance 1951 454(c) $839 $839 $839 $839
Allocation of interest expenses attributable to tax-exempt bond interest by financial institutions 141, 265(a), 265(b),
30 (bonds interest for private nonprofit educational facilities) General fiscal assistance 2009 and 291(e) $2,352 $2,660 $2,978 $3,32531 Interest on public-purpose state and local bonds General fiscal assistance 1913 103, 141, and 146 $20,505 $22,579 $25,060 $28,077
Employer contributions for medical insurance 32 premiums and medical care Health 1918 105, 106, and 125 $117,201 $123,068 $129,387 $135,856
Interest on state and local private-activity bonds issued 103, 141, 145(b), 145(c),33 to support non-profit hospital construction Health 1913 146, and 501(c)(3) $2,196 $2,455 $2,844 $3,250(Continued on next page)
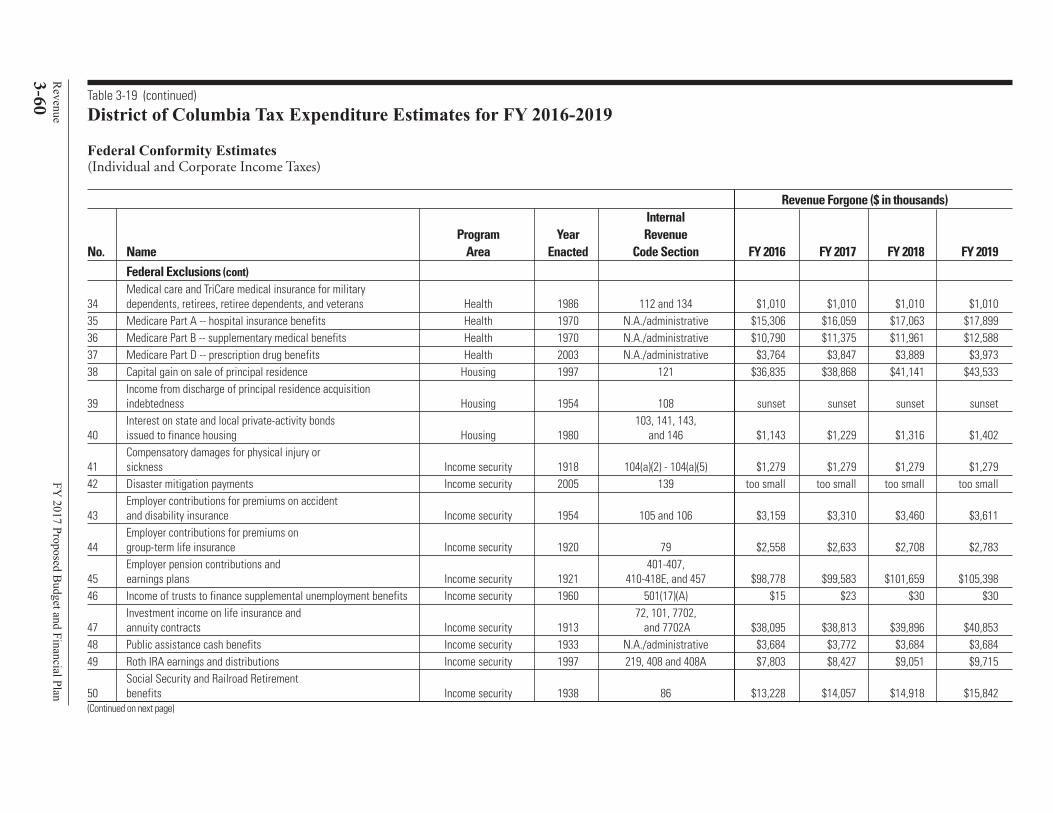
Rev
enue
FY
2017 P
roposed
Budget an
d F
inan
cial Plan
3-60 Table 3-19 (continued)
District of Columbia Tax Expenditure Estimates for FY 2016-2019
Federal Conformity Estimates(Individual and Corporate Income Taxes)
Revenue Forgone ($ in thousands)Internal
Program Year RevenueNo. Name Area Enacted Code Section FY 2016 FY 2017 FY 2018 FY 2019
Federal Exclusions (cont)Medical care and TriCare medical insurance for military
34 dependents, retirees, retiree dependents, and veterans Health 1986 112 and 134 $1,010 $1,010 $1,010 $1,01035 Medicare Part A -- hospital insurance benefits Health 1970 N.A./administrative $15,306 $16,059 $17,063 $17,89936 Medicare Part B -- supplementary medical benefits Health 1970 N.A./administrative $10,790 $11,375 $11,961 $12,58837 Medicare Part D -- prescription drug benefits Health 2003 N.A./administrative $3,764 $3,847 $3,889 $3,97338 Capital gain on sale of principal residence Housing 1997 121 $36,835 $38,868 $41,141 $43,533
Income from discharge of principal residence acquisition39 indebtedness Housing 1954 108 sunset sunset sunset sunset
Interest on state and local private-activity bonds 103, 141, 143, 40 issued to finance housing Housing 1980 and 146 $1,143 $1,229 $1,316 $1,402
Compensatory damages for physical injury or 41 sickness Income security 1918 104(a)(2) - 104(a)(5) $1,279 $1,279 $1,279 $1,27942 Disaster mitigation payments Income security 2005 139 too small too small too small too small
Employer contributions for premiums on accident 43 and disability insurance Income security 1954 105 and 106 $3,159 $3,310 $3,460 $3,611
Employer contributions for premiums on 44 group-term life insurance Income security 1920 79 $2,558 $2,633 $2,708 $2,783
Employer pension contributions and 401-407, 45 earnings plans Income security 1921 410-418E, and 457 $98,778 $99,583 $101,659 $105,39846 Income of trusts to finance supplemental unemployment benefits Income security 1960 501(17)(A) $15 $23 $30 $30
Investment income on life insurance and 72, 101, 7702, 47 annuity contracts Income security 1913 and 7702A $38,095 $38,813 $39,896 $40,85348 Public assistance cash benefits Income security 1933 N.A./administrative $3,684 $3,772 $3,684 $3,68449 Roth IRA earnings and distributions Income security 1997 219, 408 and 408A $7,803 $8,427 $9,051 $9,715
Social Security and Railroad Retirement 50 benefits Income security 1938 86 $13,228 $14,057 $14,918 $15,842(Continued on next page)
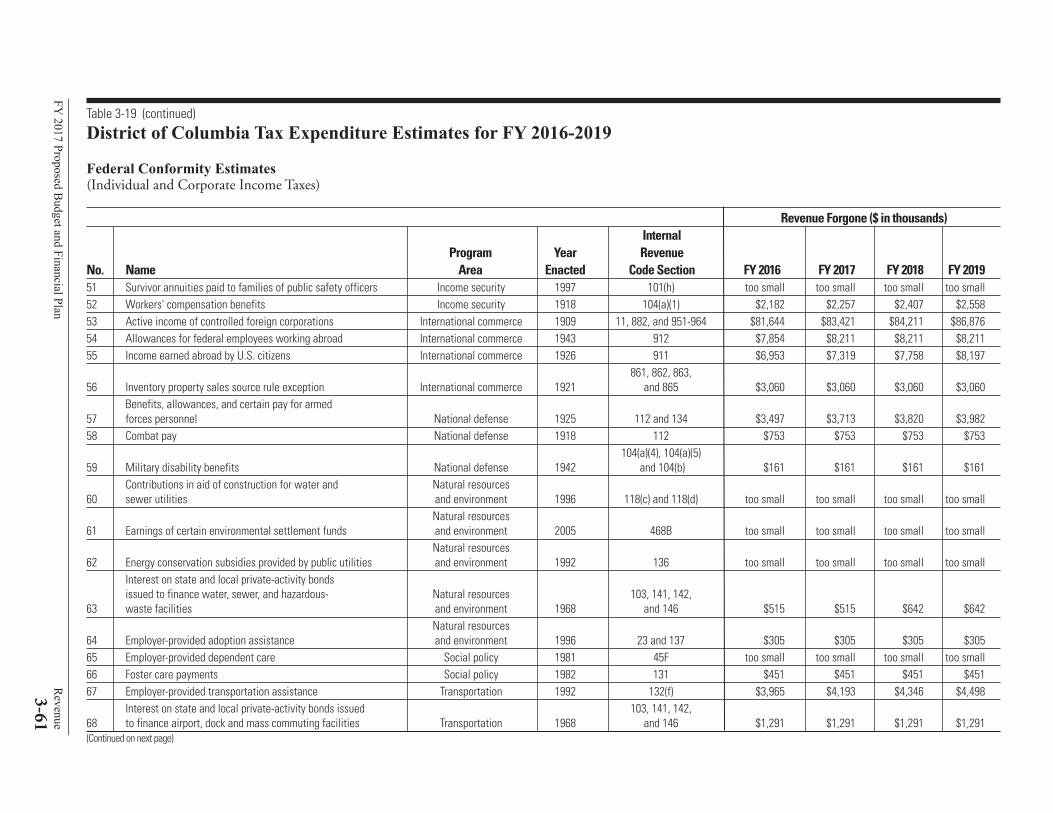
FY
2017 P
roposed
Budget an
d F
inan
cial Plan
Rev
enue
3-61
Table 3-19 (continued)
District of Columbia Tax Expenditure Estimates for FY 2016-2019
Federal Conformity Estimates(Individual and Corporate Income Taxes)
Revenue Forgone ($ in thousands)Internal
Program Year RevenueNo. Name Area Enacted Code Section FY 2016 FY 2017 FY 2018 FY 201951 Survivor annuities paid to families of public safety officers Income security 1997 101(h) too small too small too small too small52 Workers' compensation benefits Income security 1918 104(a)(1) $2,182 $2,257 $2,407 $2,55853 Active income of controlled foreign corporations International commerce 1909 11, 882, and 951-964 $81,644 $83,421 $84,211 $86,87654 Allowances for federal employees working abroad International commerce 1943 912 $7,854 $8,211 $8,211 $8,21155 Income earned abroad by U.S. citizens International commerce 1926 911 $6,953 $7,319 $7,758 $8,197
861, 862, 863, 56 Inventory property sales source rule exception International commerce 1921 and 865 $3,060 $3,060 $3,060 $3,060
Benefits, allowances, and certain pay for armed 57 forces personnel National defense 1925 112 and 134 $3,497 $3,713 $3,820 $3,98258 Combat pay National defense 1918 112 $753 $753 $753 $753
104(a)(4), 104(a)(5)59 Military disability benefits National defense 1942 and 104(b) $161 $161 $161 $161
Contributions in aid of construction for water and Natural resources 60 sewer utilities and environment 1996 118(c) and 118(d) too small too small too small too small
Natural resources 61 Earnings of certain environmental settlement funds and environment 2005 468B too small too small too small too small
Natural resources 62 Energy conservation subsidies provided by public utilities and environment 1992 136 too small too small too small too small
Interest on state and local private-activity bonds issued to finance water, sewer, and hazardous- Natural resources 103, 141, 142,
63 waste facilities and environment 1968 and 146 $515 $515 $642 $642Natural resources
64 Employer-provided adoption assistance and environment 1996 23 and 137 $305 $305 $305 $30565 Employer-provided dependent care Social policy 1981 45F too small too small too small too small66 Foster care payments Social policy 1982 131 $451 $451 $451 $45167 Employer-provided transportation assistance Transportation 1992 132(f) $3,965 $4,193 $4,346 $4,498
Interest on state and local private-activity bonds issued 103, 141, 142, 68 to finance airport, dock and mass commuting facilities Transportation 1968 and 146 $1,291 $1,291 $1,291 $1,291(Continued on next page)

Rev
enue
FY
2017 P
roposed
Budget an
d F
inan
cial Plan
3-62 Table 3-19 (continued)
District of Columbia Tax Expenditure Estimates for FY 2016-2019
Federal Conformity Estimates(Individual and Corporate Income Taxes)
Revenue Forgone ($ in thousands)Internal
Program Year RevenueNo. Name Area Enacted Code Section FY 2016 FY 2017 FY 2018 FY 2019
Federal Exclusions (cont)Interest on state and local private-activity bonds issued
69 to finance highway projects and rail-truck transfer facilities Transportation 2005 103, 141, 142(m), and 146 $127 $127 $261 $26170 G.I. Bill education benefits Veterans' benefits 1917 38 USC 5301 $715 $775 $830 $87671 Veterans' benefits and services Veterans' benefits 1917 38 USC 5301 $4,148 $4,106 $3,937 $3,937
Federal AdjustmentsClassroom expenses of elementary and
72 secondary school educators Education 2002 62 sunset sunset sunset sunset73 Higher education expenses Education 2001 222 sunset sunset sunset sunset74 Interest on student loans Education 1997 221 $1,827 $1,827 $2,019 $2,01975 Contributions to health savings accounts Health 2003 223 $962 $1,087 $1,296 $1,506
Health insurance premiums and long-term care 76 insurance premiums paid by the self-employed Health 1986 162(l) $3,443 $3,729 $3,328 $3,328
401-407, 410-418E,77 Contributions to self-employment retirement plans Income security 1962 and 457 $64,043 $70,372 $77,135 $84,606
Employee contributions to traditional Individual 78 Retirement Accounts Income security 1974 219 and 408 $6,359 $6,404 $6,506 $6,823
Overnight travel expenses of National Guard 79 and Reserve members National defense 2003 62(a)(2)(E) and 162(p) $42 $42 $42 $42
Federal Deductions80 Accelerated depreciation of buildings other than rental housing Economic development 1954 167 and 168 $385 $385 $483 $48381 Accelerated depreciation of equipment Economic development 1954 167 and 168 -$213 $114 $610 $61082 Small life insurance company taxable income Economic development 1984 806 too small too small too small too small83 Amortization of business start-up costs Economic development 1980 195 $103 $211 $211 $21184 Completed contract rules Economic development 1986 460 $1,076 $1,076 $1,184 $1,184
Exception from passive loss rules for $25,000 of rental85 real estate loss Economic development 1986 469(i) $6 $6 $6 $7(Continued on next page)

FY
2017 P
rop
osed
Budget an
d F
inan
cial Plan
Rev
enue
3-63
Table 3-19 (continued)
District of Columbia Tax Expenditure Estimates for FY 2016-2019
Federal Conformity Estimates(Individual and Corporate Income Taxes)
Revenue Forgone ($ in thousands)Program Year Internal Revenue
No. Name Area Enacted Code Section FY 2016 FY 2017 FY 2018 FY 2019Federal Deductions
86 Expensing of depreciable small business property Economic development 1958 179 $3,132 $2,818 $2,403 $2,40387 Expensing of magazine circulation expenditures Economic development 1950 173 too small too small too small too small88 Film and television production costs Economic development 2004 181 sunset sunset sunset sunset89 Gain on non-dealer installment sales Economic development 1986 453 and 453A(b) $7,082 $6,759 $6,599 $6,599
803(a)(2), 805(a) 90 Life insurance company reserves Economic development 1984 (2), and 807 $3,159 $3,258 $3,258 $3,25891 Loss from sale of small business corporation stock Economic development 1958 1244 $0 $0 $0 $092 Property and casualty insurance company reserves Economic development 1986 832(b) $3 $3 $3 $393 Research and development expenditures Economic development 1954 174 and 59 ( e) $5,820 $6,412 $6,609 $7,04494 Amortization of certified pollution control facilities Energy 2005 169(d)(5) $395 $395 $395 $395
Depreciation recovery periods for specific 95 energy property Energy 1986 168(e) $889 $790 $691 $69196 Energy-efficient commercial property Energy 2005 179D $0 $0 $0 $097 Blue Cross and Blue Shield companies Health 1986 833 $407 $407 $407 $40798 Medical and dental care expenses Health 1942 213 $8,474 $8,679 $9,499 $10,04699 Accelerated depreciation of rental housing Housing 1954 167 and 168 $5,039 $5,039 $5,146 $5,146100 Mortgage interest on owner-occupied residences Housing 1913 163(h) $65,753 $70,749 $75,101 $80,338
State and local property taxes on owner-101 occupied residences Housing 1913 164 $18,378 $19,590 $20,701 $22,014
165(c)(3), 165(e),102 Casualty and theft losses Income security 1913 and 165(h) - 165(k) $303 $303 $303 $303103 Deduction of foreign taxes instead of a credit International commerce 1913 901 $232 $232 $232 $232
Financing income of certain controlled foreign 104 corporations International commerce 1962 953 and 954 sunset sunset sunset sunset105 Charitable contributions Social policy 1917/1935 170 and 642(c) $40,603 $41,869 $43,242 $44,614
Costs of removing architectural and transportation 106 barriers to the disabled and elderly Social policy 1976 190 too small too small too small too small(Continued on next page)

Rev
enue
FY
2017 P
roposed
Budget an
d F
inan
cial Plan
3-64 Table 3-19 (continued)
District of Columbia Tax Expenditure Estimates for FY 2016-2019
Federal Conformity Estimates
Revenue Forgone ($ in thousands)Program Year D.C. Code
No. Name Area Enacted Section FY 2016 FY 2017 FY 2018 FY 2019Federal Special Rules
107 60-40 rule for gain or loss from section 1256 contracts Economic development 1981 1256 $1,099 $1,099 $1,099 $1,099108 Interest rate and discounting period assumptions for
reserves of property and casualty insurance companies Economic development 1986 831, 832(b), and 846 $2,728 $2,728 $2,728 $2,728109 Inventory accounting Economic development 1938 475, 491-492 $2,082 $1,784 $1,784 $1,784110 Special alternative tax on small property and casualty 321(a), 501(c)
insurance companies Economic development 1954 (15), 832, and 834 $31 $41 $41 $41111 Apportionment of research and development expenses
for determining foreign tax credits International commerce 1977 861-863 and 904 $197 $197 $197 $197112 Interest-charge domestic international sales corporations International commerce 1986 991-997 $1,481 $1,580 $1,678 $1,678(Continued on next page)

FY
2017 P
roposed
Budget an
d F
inan
cial Plan
Rev
enue
3-65
Table 3-19 (continued)
District of Columbia Tax Expenditure Estimates for FY 2016-2019
Local Tax Expenditure Estimates
Revenue Forgone ($ in thousands)Program Year D.C. Code
No. Name Area Enacted Section FY 2016 FY 2017 FY 2018 FY 2019LOCAL TAX EXPENDITURE ESTIMATESD.C. INCOME TAX(Individual and Corporate Income Taxes)
Exemptions1 Additional personal exemption for the blind Income security 1987 § 47-1806.02(d) $90 $90 $93 $962 Additional personal exemption for the elderly Income security 1987 § 47-1806.02(e) $5,139 $5,139 $5,283 $5,428
Subtractions from Federal Adjusted Gross IncomeQualified high-technology companies: no no no no
3 depreciable business assets Economic development 2001 § 47.1803.3(a)(18) estimate estimate estimate estimate4 College savings plan contributions Education 2001 § 47-4501 - § 47-4512 $1,163 $1,163 $1,163 $1,1635 Public school teacher expenses Education 2007 § 47-1803.03(b-2) $122 $122 $122 $122
Health insurance premiums paid for a same-sex 6 spouse or domestic partner (business income tax) Health 2006 § 47-1803.02(a)(2)(W) $188 $198 $209 $221
Health insurance premiums paid for a same-sex 7 spouse or domestic partner (personal income tax) Health 1992 §47-1803.03(a)(15) $46 $48 $50 $528 Health professional loan repayments Health 2006 § 7-751.01 - § 7-751.16 $76 $76 $76 $769 Long-term care insurance premiums Health 2005 § 47-1803.03(b-1) $246 $246 $246 $24610 Housing relocation assistance Housing 2002 § 42-2851.05 minimal minimal minimal minimal11 D.C. and federal government pension income Income security 1987 § 47-1803.02(a)(2)(N) $4,665 $4,866 $5,071 $5,29012 D.C. and federal government survivor benefits Income security 1987 § 47-1803.02(a)(2)(N) $4,522 $4,717 $4,915 $5,12813 Disability payments for the permanently and totally disabled Income security 1985 § 47-1803.02(a)(2)(M) $95 $99 $103 $10814 Income of persons with a permanent and total disability Income security 2005 § 47-1803.02(a)(2)(V) $604 $630 $656 $684
Taxable amount of social security benefits and railroad 15 retirement Income security 1985 § 47-1803.02(a)(2)(L) $27,819 $29,018 $30,239 $31,546
included included included included16 Social Security benefits for retired workers Income security 1985 § 47-1803.02(a)(2)(L) in #16 in #16 in #16 in #16(Continued on next page)

Rev
enue
FY
2017 P
roposed
Budget an
d F
inan
cial Plan
3-66 Table 3-19 (continued)
District of Columbia Tax Expenditure Estimates for FY 2016-2019
Local Tax Expenditure Estimates
Revenue Forgone ($ in thousands)Program Year D.C. Code
No. Name Area Enacted Section FY 2016 FY 2017 FY 2018 FY 2019Subtractions from Federal Adjusted Gross Income (cont)
included included included included17 Social Security benefits for survivors and dependents Income security 1985 § 47-1803.02(a)(2)(L) in #16 in #16 in #16 in #16
included included included included18 Social Security benefits for the disabled Income security 1985 § 47-1803.02(a)(2)(L) in #16 in #16 in #16 in #16
Natural resources19 Environmental savings account contributions and earnings and environment 2001 § 8-637.03 minimal minimal minimal minimal20 Rental assistance to police officers Public safety 1993 § 42-2902 minimal minimal minimal minimal
§ 47-1803.02(a)(2)21 Compensatory damages awarded in a discrimination case Social policy 2002 (U) and § 47-1806.10 $34 $35 $37 $3822 Poverty lawyer loan assistance Social policy 2007 § 47-1803.02(a)(2)(X) $44 $44 $44 $44
Credits§ 6-1501, § 6-1502,
§ 6-1504, and 23 Economic development zone incentives for businesses Economic development 1988 § 47-1807.06 $0 $0 $0 $0
Qualified high-technology companies: business income 24 tax reduction Economic development 2001 § 47-1817.06 $16,891 $17,651 $18,446 $19,276
Qualified high-technology companies: employee included included included included25 relocation incentives Economic development 2001 § 47-1817.02 in #25 in #25 in #25 in #25
included included included included26 Qualified high-technology companies: employment incentives Economic development 2001 § 47-1817.03 in #25 in #25 in #25 in #25
Qualified high-technology companies: incentives to included included included included27 employ disadvantaged workers Economic development 2001 § 47-1817.05 in #25 in #25 in #25 in #25
Qualified high-technology companies: incentives to retrain included included included included28 disadvantaged workers Economic development 2001 § 47-1817.04 in #25 in #25 in #25 in #25
included included included included29 Qualified social electronic commerce companies Economic development 2012 § 47-1818.02 in #25 in #25 in #25 in #2530 First-time home purchase for D.C. government employees Employment 2000 § 42-2506 $180 $144 $108 $7231 Job growth tax credit Employment 2010 § 47-1807.09 $0 $0 $0 $0(Continued on next page)
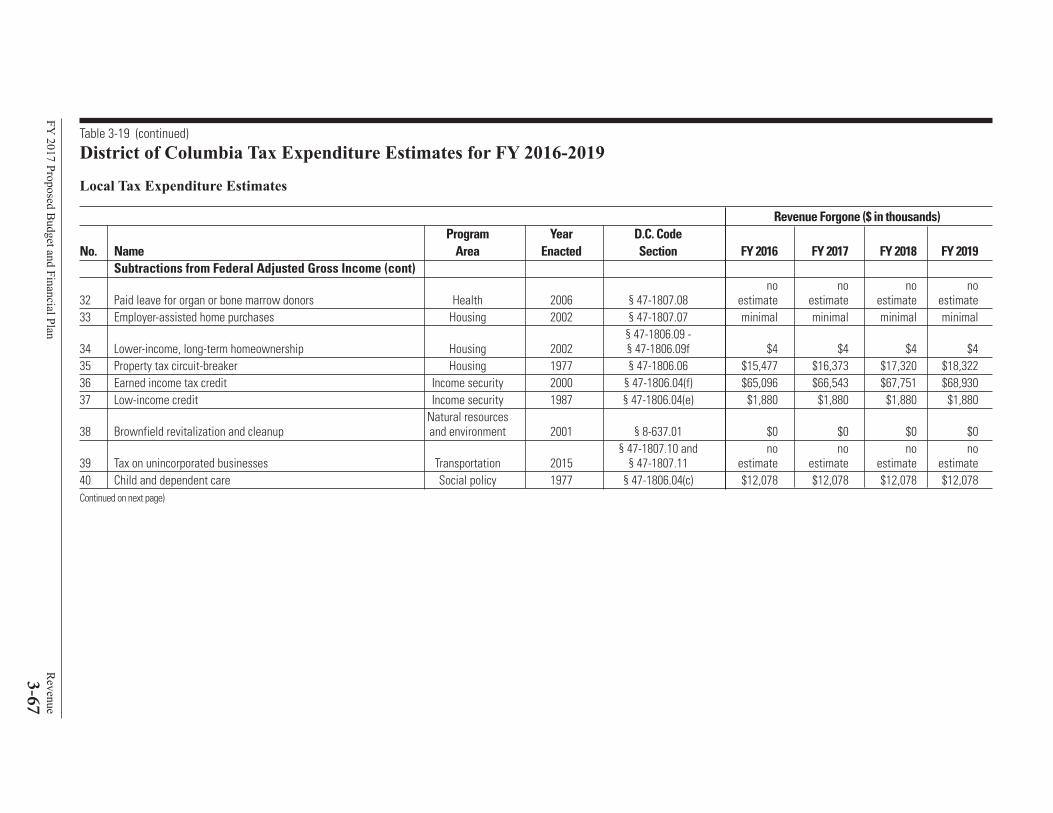
FY
2017 P
roposed
Budget an
d F
inan
cial Plan
Rev
enue
3-67
Table 3-19 (continued)
District of Columbia Tax Expenditure Estimates for FY 2016-2019
Local Tax Expenditure Estimates
Revenue Forgone ($ in thousands)Program Year D.C. Code
No. Name Area Enacted Section FY 2016 FY 2017 FY 2018 FY 2019Subtractions from Federal Adjusted Gross Income (cont)
no no no no32 Paid leave for organ or bone marrow donors Health 2006 § 47-1807.08 estimate estimate estimate estimate33 Employer-assisted home purchases Housing 2002 § 47-1807.07 minimal minimal minimal minimal
§ 47-1806.09 - 34 Lower-income, long-term homeownership Housing 2002 § 47-1806.09f $4 $4 $4 $435 Property tax circuit-breaker Housing 1977 § 47-1806.06 $15,477 $16,373 $17,320 $18,32236 Earned income tax credit Income security 2000 § 47-1806.04(f) $65,096 $66,543 $67,751 $68,93037 Low-income credit Income security 1987 § 47-1806.04(e) $1,880 $1,880 $1,880 $1,880
Natural resources38 Brownfield revitalization and cleanup and environment 2001 § 8-637.01 $0 $0 $0 $0
§ 47-1807.10 and no no no no39 Tax on unincorporated businesses Transportation 2015 § 47-1807.11 estimate estimate estimate estimate40 Child and dependent care Social policy 1977 § 47-1806.04(c) $12,078 $12,078 $12,078 $12,078Continued on next page)

Rev
enue
FY
2017 P
roposed
Budget an
d F
inan
cial Plan
3-68 Table 3-19 (continued)
District of Columbia Tax Expenditure Estimates for FY 2016-2019
Local Tax Expenditure Estimates
Revenue Forgone ($ in thousands)Program Year D.C. Code
No. Name Area Enacted Section FY 2016 FY 2017 FY 2018 FY 2019REAL PROPERTY TAX
Abatements41 New or improved buildings used by high-technology companies Economic development 2001 § 47-811.03 $37 $37 $38 $38
§ 47-857.11 -42 Non-profit organizations locating in designated neighborhoods Economic development 2010 § 47-857.16 $153 $153 $153 $15343 Improvements to low-income housing Housing 2002 § 47-866 $0 $0 $0 $0
§ 47-857.01 - 44 New residential developments Housing 2002 § 47-857.10 $1,540 $1,346 $1,134 $520( § 47-859.01 - 45 NoMA residential developments Housing 2009 § 47-859.05 $5,000 $5,000 $5,000 $5,00046 Preservation of section 8 housing in qualified areas Housing 2002 § 47-865 $0 $0 $0 $047 Single-room-occupancy housing Housing 1994 § 42-3508.06 $0 $0 $0 $048 Qualified High Technology Companies: location incentives Economic development 2015 § 47-1817.01(5) $0 $3,000 $3,000 $3,00049 Vacant rental housing Housing 1985 § 42-3508.02 $0 $0 $0 $050 Urban farming and food security Social Policy 2014 § 47-868 $341 $289 $286 $284
Exemptions51 Development of a qualified supermarket, restaurant,
or retail store Economic development 1988 § 47-1002(23) $6,140 $6,263 $6,389 $6,51652 High-technology commercial real estate database and
service providers Economic development 2010 § 47-4626 $700 $700 $700 $58553 Educational institutions Education 1942 § 47-1002(10) $124,128 $124,748 $125,372 $125,99954 Libraries Education 1942 § 47-1002(7) $425 $427 $429 $43155 Embassies, chanceries, and associated properties
of foreign governments General law 1942 § 47-1002(3) $49,298 $49,544 $49,792 $50,04156 Federal government property General law 1942 § 47-1002(1) $876,621 $881,004 $885,409 $889,83657 Miscellaneous exemptions General law multiple years multiple code sections $122,654 $123,267 $123,884 $124,50358 Hospital buildings Health 1942 § 47-1002(9) $15,216 $15,292 $15,368 $15,44559 Historic property Housing 1974 § 47-842 - § 47-844 $9 $9 $9 $10(Continued on next page)

FY
2017 P
roposed
Budget an
d F
inan
cial Plan
Rev
enue
3-69
Table 3-19 (continued)
District of Columbia Tax Expenditure Estimates for FY 2016-2019
Local Tax Expenditure Estimates
Revenue Forgone ($ in thousands)Program Year D.C. Code
No. Name Area Enacted Section FY 2016 FY 2017 FY 2018 FY 2019Exemptions (cont)
60 Homestead exemption Housing 1978 § 47-850 $58,443 $59,027 $59,617 $60,213Lower-income homeownership households and
61 cooperative housing associations Housing 1983 § 47-3503 $9,761 $9,809 $9,858 $9,908Multi-family and single-family rental and cooperative
62 housing for low- and moderate-income persons Housing 1978 § 47-1002(20) $1,085 $1,090 $1,095 $1,10163 Nonprofit housing associations Housing 1983 § 47-3505 $10,845 $10,899 $10,954 $11,00864 Nonprofit affordable housing developers Housing 2012 § 47-1005.02 $400 $500 $550 $60065 Resident management corporations Housing 1992 § 47-1002(24) $0 $0 $0 $066 Correctional Treatment Facility Public safety 1997 § 47-1002(25) $3,523 $3,629 $3,738 $3,85067 Art galleries Social policy 1942 § 47-1002(6) $2,423 $2,435 $2,447 $2,45968 Cemeteries Social policy 1942 § 47-1002(12) $6,358 $6,389 $6,421 $6,45369 Charitable organizations Social policy 1942 § 47-1002(8) $16,324 $16,406 $16,488 $16,57070 Churches, synagogues, and mosques Social policy 1942 § 47-1002(12) $67,350 $67,686 $68,025 $68,365
Washington Metropolitan Area Transit Authority 71 properties Transportation 1966 § 9-1107.01 $9,732 $9,781 $9,830 $9,879
Credits72 Qualified social electronic commerce companies Economic development 2012 § 47-1818.02 $1,510 $1,580 $1,650 $1,72073 First-time homebuyer credit for D.C. government
employees Employment 2000 § 42-2506 $249 $193 $78 $6274 Assessment increase cap Housing 2001 § 47-864 $23,138 $23,832 $24,547 $25,28475 Credit for senior citizens and persons with disabilities Housing 1986 § 47-863 $27,155 $27,290 $27,427 $27,564
Natural resources76 Brownfield revitalization and cleanup and environment 2001 § 8-637.01 $0 $0 $0 $0
Natural resources § 47-872 and77 Condominium and cooperative trash collection and environment 1990 § 47-873 $2,630 $2,643 $2,657 $2,670(Continued on next page)

Rev
enue
FY
2017 P
roposed
Budget an
d F
inan
cial Plan
3-70 Table 3-19 (continued)
District of Columbia Tax Expenditure Estimates for FY 2016-2019
Local Tax Expenditure Estimates
Revenue Forgone ($ in thousands)Program Year D.C. Code
No. Name Area Enacted Section FY 2016 FY 2017 FY 2018 FY 2019
Deferrals, Rebates, and Multiple Categories78 Economic development zone incentives for real
property owners Economic development 1988 § 6-1501 - § 6-1503 $0 $0 $0 $079 Public charter school tax rebate Education 2005 § 47-867 $1,173 $1,205 $1,248 $1,289
§ 47-858.01 -80 Homeowners in enterprise zones Housing 2002 § 47-858.05 $0 $0 $0 $081 Low-income homeowners Housing 2005 § 47-845.02 $53 $53 $53 $5482 Low-income, senior-citizen homeowners Housing 2005 § 47-845.03 $73 $74 $74 $74
DEED RECORDATION AND TRANSFER TAXExemptions
§ 42-1102(3) and 83 Educational institutions Education 1962 and 1980 § 47-902(3) $1,424 $1,467 $1,511 $1,55684 Bona-fide gifts to the District of Columbia General law 2011 § 47-902(24) $0 $0 $0 $085 Embassies, chanceries, and associated properties § 42-1102(3) and
of foreign governments General law 1962 and 1980 § 47-902(3) $538 $554 $570 $588§ 42-1102(2) and
86 Federal government General law 1962 and 1980 § 47-902(2) $2,376 $2,447 $2,520 $2,596§ 42-1102(2) and
87 Other properties exempt from real property taxation General law 1962 and 1980 § 47-902(2) $1,389 $1,431 $1,474 $1,51888 Special act of Congress (recordation tax only) General law 1962 § 42-1102(4) $0 $0 $0 $0
§ 42-1102(14),§ 47-3503(a)(2),§ 47-3503(a)(3),
§ 47-902(11), and89 Cooperative housing associations Housing 1983 §47-3503(b)(2) $527 $543 $559 $576(Continued on next page)
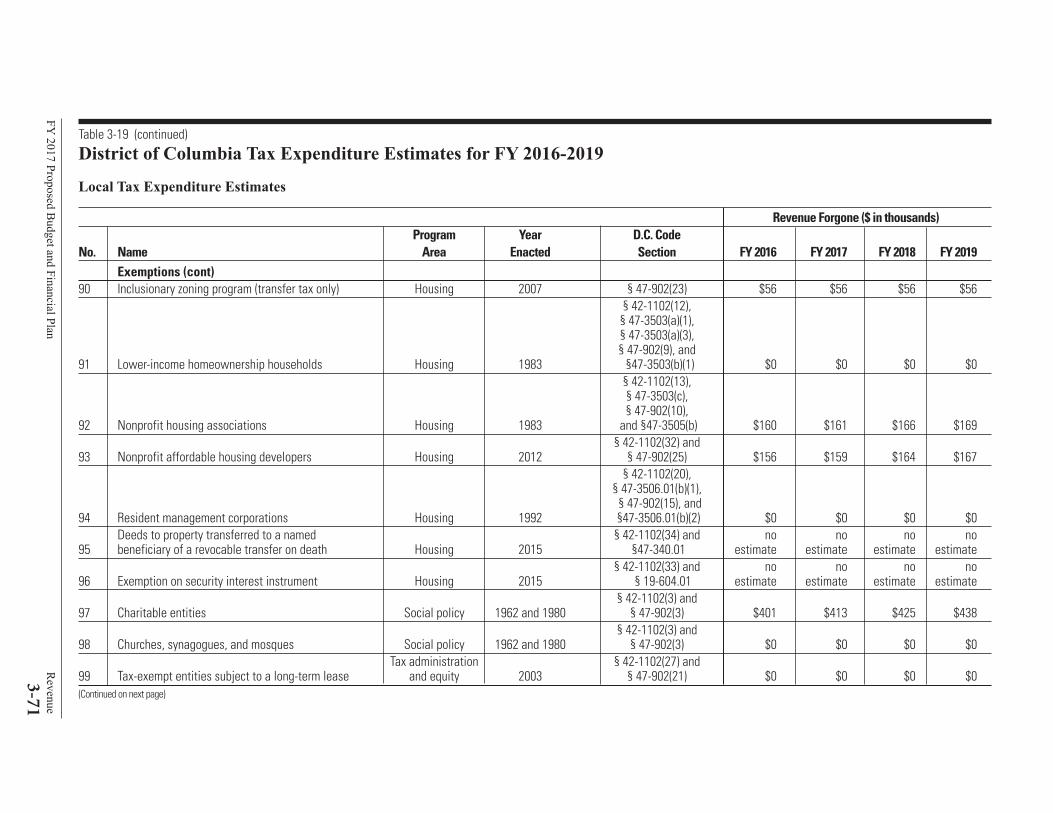
FY
2017 P
roposed
Budget an
d F
inan
cial Plan
Rev
enue
3-71
Table 3-19 (continued)
District of Columbia Tax Expenditure Estimates for FY 2016-2019
Local Tax Expenditure Estimates
Revenue Forgone ($ in thousands)Program Year D.C. Code
No. Name Area Enacted Section FY 2016 FY 2017 FY 2018 FY 2019Exemptions (cont)
90 Inclusionary zoning program (transfer tax only) Housing 2007 § 47-902(23) $56 $56 $56 $56§ 42-1102(12),
§ 47-3503(a)(1),§ 47-3503(a)(3),§ 47-902(9), and
91 Lower-income homeownership households Housing 1983 §47-3503(b)(1) $0 $0 $0 $0§ 42-1102(13), § 47-3503(c), § 47-902(10),
92 Nonprofit housing associations Housing 1983 and §47-3505(b) $160 $161 $166 $169§ 42-1102(32) and
93 Nonprofit affordable housing developers Housing 2012 § 47-902(25) $156 $159 $164 $167§ 42-1102(20),
§ 47-3506.01(b)(1),§ 47-902(15), and
94 Resident management corporations Housing 1992 §47-3506.01(b)(2) $0 $0 $0 $0Deeds to property transferred to a named § 42-1102(34) and no no no no
95 beneficiary of a revocable transfer on death Housing 2015 §47-340.01 estimate estimate estimate estimate§ 42-1102(33) and no no no no
96 Exemption on security interest instrument Housing 2015 § 19-604.01 estimate estimate estimate estimate§ 42-1102(3) and
97 Charitable entities Social policy 1962 and 1980 § 47-902(3) $401 $413 $425 $438§ 42-1102(3) and
98 Churches, synagogues, and mosques Social policy 1962 and 1980 § 47-902(3) $0 $0 $0 $0Tax administration § 42-1102(27) and
99 Tax-exempt entities subject to a long-term lease and equity 2003 § 47-902(21) $0 $0 $0 $0(Continued on next page)

Rev
enue
FY
2017 P
roposed
Budget an
d F
inan
cial Plan
3-72 Table 3-19 (continued)
District of Columbia Tax Expenditure Estimates for FY 2016-2019
Local Tax Expenditure Estimates
Revenue Forgone ($ in thousands)Program Year D.C. Code
No. Name Area Enacted Section FY 2016 FY 2017 FY 2018 FY 2019SALES TAX
Exemptions100 Energy products used in manufacturing Economic development 1949 § 47-2005(11) $5,102 $5,316 $5,529 $5,734101 Internet access service Economic development 1999 § 47-2001(n)(2)(F) $7,674 $7,997 $8,316 $8,624
Materials used in development of a qualified 102 supermarket Economic development 2000 § 47-2005(28) $992 $1,034 $1,075 $1,115103 Professional and personal services Economic development 1949 § 47-2001(n)(2)(B) $304,379 $317,163 $329,850 $342,054
Qualified high-technology companies: 104 certain sales Economic development 2001 § 47-2001(n)(2)(G) $3,399 $3,535 $3,676 $3,823
Qualified high-technology companies: included included included included105 technology purchases Economic development 2001 § 47-2005(31) in #99 in #99 in #99 in #99106 Transportation and communication services Economic development 1949 § 47-2001(n)(2)(A) $54,618 $56,912 $59,188 $61,378107 Federal and D.C. governments General law 1949 § 47-2005(1) $225,696 $235,175 $244,582 $253,631108 Medicine, drugs, and medical devices Health 1949 § 47-2005(14) and (15) $18,945 $19,741 $20,531 $21,290109 Groceries Social policy 1949 § 47-2001(n)(2)(E) $68,457 $71,332 $74,185 $76,930110 Materials used in war memorials Social policy 1957 § 47-2005(16) $0 $0 $0 $0111 Non-profit (501(c)(4)) organizations Social policy 1987 § 47-2005(22) $37,890 $39,482 $41,061 $42,580112 Semi-public institutions Social policy 1949 § 47-2005(3) $57,412 $59,823 $62,216 $64,518
no no no no113 Miscellaneous Tax administration and equity 1949 § 47-2005 estimate estimate estimate estimate
no no no no114 Motor fuels Tax administration and equity 1981 § 47-2005(20) estimate estimate estimate estimate115 Public utility companies Tax administration and equity 1949 § 47-2005(5) $83,945 $87,470 $90,969 $94,335116 State and local governments Tax administration and equity 1949 § 47-2005(2) minimal minimal minimal minimal117 Valet parking services Tax administration and equity 2002 § 47-2001(n)(2)(H) $147 $154 $161 $168(Continued on next page)

FY
2017 P
roposed
Budget an
d F
inan
cial Plan
Rev
enue
3-73
Table 3-19 (continued)
District of Columbia Tax Expenditure Estimates for FY 2016-2019
Local Tax Expenditure Estimates
Revenue Forgone ($ in thousands)Program Year D.C. Code
No. Name Area Enacted Section FY 2016 FY 2017 FY 2018 FY 2019INSURANCE PREMIUMS TAX
CreditTax credit for certified capital investment
118 by insurance companies Economic development 2004 § 31-5233 $6,625 $0 $0 $0
PERSONAL PROPERTY TAX
Exemptionsno no no no
119 Digital audio radio satellite companies Economic development 2000 § 47-1508(a)(8) estimate estimate estimate estimate120 Qualified high-technology companies Economic development 2001 § 47-1508(a)(10) $108 $112 $115 $119121 Qualified supermarkets Economic development 2000 § 47-1508(a)(9) $319 $322 $332 $343
Natural resources122 Solar energy systems and environment 2013 § 47-1508(a)(11) $127 $127 $128 $128
Natural resources123 Cogeneration Systems and environment 2013 § 47-1508(a)(12) $0 $1,370 $1,370 $1,370124 Non-profit organizations Social policy 1902 § 47-1508(a)(1) $6 $6 $6 $6125 Motor vehicles and trailers Transportation 1954 § 47-1508(a)(3) $2,831 $2,859 $2,888 $2,914
Public utility and toll telecommunications Tax administration126 providers and equity 2001 § 47-1508(a)(3A) $10 $10 $10 $10
Tax administration127 Wireless telecommunication companies and equity 1998 § 47-1508(a)(7) minimal minimal minimal minimal
Works of art lent to the National Gallery Tax administration128 by non-residents and equity 1950 § 47-1508(a)(2) $0 $0 $0 $0


FY 2017 Proposed Budget and Financial Plan Operating Expenditures
4-1
4
Operating Expenditures
In FY 2015, the District's Local funds expenditures, excluding Dedicated Taxes, increased by $349.2
million, or 5.5 percent, over FY 2014. Since FY 2012, expenditures have increased by an average of
4.3 percent annually as depicted in Figure 4-1. Table 4A-1 of the Appendix displays Local funds
expenditures by fiscal year for selected agencies and each appropriation title.
Dedicated Tax funds were segregated as separate funds beginning in FY 2007; their expenditures are
shown by agency and appropriation title in Table 4A-2 of the Appendix. They totaled $289.7 million in
FY 2015.
The $349.2 million Local funds increase in FY 2015 was partly due to spending increases of $38.5
million in the Department of General Services, $56.5 million in the Department on Disability Services,
$71.8 million in Pay-Go Capital, $41.0 million in Repayment of Loans and Interest, and a net of $117.4
million in the Public Education System agencies.
On a general operating funds basis, including non-Local funds as well as Local, total expenditures
increased by an average of 3.5 percent annually from FY 2012 to FY 2015 (Table 4A-3 in the Appendix).
Figure 4-1Local Funds Actual Expenditures (Excluding Dedicated Taxes)Does Not Include Enterprise and Other Funds(Dollars in millions)
5,000
6,000
7,000
FY 2012 Expenditures FY 2013 Expenditures FY 2014 Expenditures FY 2015 Expenditures

Operating Expenditures FY 2017 Proposed Budget and Financial Plan
4-2
Figure 4-2 Local Funds Actual Expenditures (Excluding Dedicated Taxes) byAppropriation Title, by Fiscal YearDoes Not Include Enterprise and Other Funds(Dollars in millions)
This chapter examines operating expenditures for the District and reflects expenditure trends.
Specifically, the chapter:
• Examines the growth in expenditures from FY 2012 to FY 2015 by area of spending (agency and
function); and
• Examines the growth by such categories as personal services, contractual services, and subsidies and
transfers.
This chapter focuses primarily on the District's Local funds actual expenditures. It does not discuss
capital expenditures, which are described in the Capital Appendices volume. Furthermore, it does not
include agencies whose operations are captured in other funds, such as proprietary funds and component
units of the District.
Figure 4-2 shows the growth trends of Local funds expenditures by appropriation title from FY 2012
through FY 2015. Tables 4A-1, 4A-2, and 4A-3 in the Appendix to this chapter provide additional detail
on Local, Dedicated Tax, and General Operating funds expenditures in the largest District agencies from
FY 2012 through FY 2015. The following sections describe major elements of growth during this time
period, by appropriation title.

FY 2017 Proposed Budget and Financial Plan Operating Expenditures
4-3
Human Support ServicesThe FY 2015 Local funds expenditures of $1,769.3 million in this appropriation title reflect an increase
of $125.3 million, or 7.6 percent, over the FY 2014 expenditures of $1,644.0 million. The expenditure
change from FY 2012 reflects a 3.6 percent average annual increase. Expenditures in the Human Support
Services appropriation title between FY 2014 and FY 2015 reflect growth that continues a trend of
increases in prior years. This change is primarily due to the growth of the Medicaid program.
• Department of Behavioral Health (DBH) – Formerly named the Department of Mental Health,
this agency was renamed in FY 2014. Local funds spending from FY 2012 through FY 2015
increased by approximately $69.2 million. Additional funding in the amount of $1,815,000 was
provided for the impact of the South Capitol Street Memorial Amendment Act of 2012, and
$1,200,000 was added to increase the number of subsidized housing units. Funds were also
allocated to the juvenile behavioral diversion program. In FY 2014, the Addiction Prevention and
Recovery Administration (APRA) moved from the Department of Health to DBH with a total Local
funds approved budget of $24,235,299.
• Department of Health Care Finance (DHCF) – The impact of the Patient Protection and
Affordable Care Act of 2010 (ACA) resulted in growth of Medicaid spending. Expenditures at
DHCF increased from FY 2012 to FY 2015 by an average of 2.6 percent annually. Beyond
expanding Medicaid, the ACA introduced other reforms that improve the program in all states,
regardless of their Medicaid expansion decision. The law required states to simplify and modernize
their enrollment processes and to create a coordinated eligibility and enrollment system for
Medicaid, the Children’s Health Insurance Program (CHIP), and the Marketplace, to facilitate
enrollment and promote continuity of coverage. The ACA also established an array of new
authorities and funding opportunities for delivery system and payment reform initiatives in
Medicare, Medicaid, and CHIP, designed to advance better and more cost-effective models of care,
particularly for those with high needs and costs whose care is poorly coordinated, leading to both
serious gaps and costly redundancy. Finally, the law provided new options and incentives to help
states rebalance their Medicaid long-term care programs in favor of community-based services and
supports rather than institutional care. Collectively, these provisions have accelerated Medicaid
innovation already underway in many states. Because Medicaid covers many of the highest-need
populations in the U.S., states have unique financial and policy leverage to reform the systems of
care that serve them. The ACA expanded the Medicaid program significantly as part of a broader
plan to cover millions of uninsured Americans. The law also provided for 100 percent federal
funding of the expansion through 2016, declining gradually to 90 percent in 2020 and future years.
Public Education System Local funds expenditures in the Public Education appropriation title increased by 4.1 percent (annual
average) from FY 2012 to FY 2015. District of Columbia Public Schools (DCPS) and the District of
Columbia Public Charter Schools (DCPCS) are budgeted through the Uniform Per Student Funding
Formula (UPSFF) [refer to District of Columbia Official Code §38-29]. This formula provides a
foundation funding level for each student and weighting factors for such characteristics as grade levels
and special education categories. It also accounts for annual inflation and for changes in enrollment.
Local funds expenditures by the District of Columbia Public Schools (DCPS) were higher than any other
District agency until FY 2012, when DHCF expenditures surpassed DCPS. DCHF expenditures
continued to exceed DCPS expenditures in FY 2015. DCPS also employs more than one-fifth of all
District employees. District of Columbia Public Charter Schools has been showing significant annual
growth in enrollment and expenditures, and the trend continued during FY 2015.

Operating Expenditures FY 2017 Proposed Budget and Financial Plan
4-4
Table 4-1 shows enrollment and Local funds expenditure trends for DCPS and DCPCS. Enrollment
in the two systems combined has consistently increased in the last 4 fiscal years.
• District of Columbia Public Schools (DCPS) – Expenditures in FY 2015 at DCPS increased by
8.3 percent over FY 2014. Enrollment increased by 1.9 percent from FY 2014 to FY 2015, and the
foundation level for the UPSFF increased to $9,492 in FY 2015, in accordance with the provisions
of District of Columbia Official Code §38-2909.
• District of Columbia Public Charter Schools (DCPCS) – Expenditures in FY 2015 for DCPCS in
Local funds increased by 5.3 percent over FY 2014. Enrollment increased by 3.2 percent from
FY 2014 to FY 2015, and expenditures per enrolled student increased.
• Office of the State Superintendent of Education (OSSE) – As a result of the Public Education
Reform Amendment Act of 2007, a number of functions from the Department of Human Services,
the University of the District of Columbia, and DCPS moved to OSSE, and the agency has become
the state administering agency for most of the District’s grant funds for public education. Local funds
expenditures showed an increase of $15.2 million, or 12.4 percent, in FY 2015 over FY 2014.
• University of the District of Columbia (UDC) – The District’s subsidy to the University increased
by 10.1 percent from $66.7 million in FY 2014 to $73.5 million in FY 2015.
.
Table 4-1Enrollments and Expenditures in Two Schools Systems (Local Funds Only)
DC Public Schools Public Charter Schools Combined Systems
Enrollment Expenditures Enrollment Expenditures Enrollment Expenditures Expenditures
(dollars in (dollars in (dollars in per enrolled
thousands) thousands) thousands) student*2012 45,191 $638,879 31,562 $508,113 76,753 $1,146,992 $14,944 2013 45,557 $640,642 34,674 $601,428 80,231 $1,242,070 $15,481 2014 47,548 $653,800 37,684 $627,979 85,232 $1,281,778 $15,039 2015 48,439 $708,087 38,905 $661,074 87,344 $1,369,161 $15,676 Annual Growth Rate (2012 - 2015) 1.8% 2.6% 5.4% 6.8% 3.3% 4.5% 1.2%Note: *per enrolled student (whole dollars, not thousands). All enrollment numbers were provided by the Office of the State Superintendent of Education (OSSE) on 2/12/15 and may notmatch previous years reports.
Details may not sum due to rounding.

FY 2017 Proposed Budget and Financial Plan Operating Expenditures
4-5
Public Safety and Justice Local funds expenditures in the public safety area increased by 2.5 percent (annual average) from
FY 2012 to FY 2015. The two largest agencies in this appropriation title are the Metropolitan Police
Department (MPD) and the Fire and Emergency Medical Services Department (FEMS), accounting for
69.0 percent of the expenditures of the appropriation title.
• Metropolitan Police Department (MPD) and Fire and Emergency Medical Services
Department (FEMS) – Expenditures at MPD increased from FY 2012 to FY 2015 by an average of
1.9 percent annually. Expenditures for FEMS increased by 3.5 percent (annual average) from FY
2012 to FY 2015.
• Department of Corrections – This is the third largest agency in the Public Safety appropriation title
based on annual expenditures. There was a Local funds average annual increase of 2.1 percent over
the FY 2012 – FY 2015 period.
• Police Officers’ and Fire Fighters’ Retirement System – This is the fourth largest agency in the
Public Safety appropriation title based on annual expenditures. Under the 1997 Revitalization Act,
the Federal government assumed the District’s pre-June 1997 unfunded pension liability. In
subsequent years, as salaries have increased, adjustments were legislated for pension benefits, and
the sizes of the FEMS and MPD workforce have increased. The pension contribution has fluctuated
in recent years and has slightly declined overall between FY 2012 and FY 2015.
Financing and OtherAgencies in the Financing and Other appropriation title include various debt service functions as well
as the District's reserve funds.
• Repayment of Interest on Short-Term Borrowing – The District issues short-term Tax Revenue
Anticipation Notes (TRANs) in order to finance its seasonal cash flow needs. The total amount of
TRANs outstanding at any time during a fiscal year may not exceed 20 percent of the total anticipated
revenue of the District for such fiscal year, and such notes must mature within the fiscal year in which
they are issued. In FY 2015, the District issued $400 million of TRANs for this purpose.
• Repayment of Loans and Interest – The District may issue long-term debt in the form of General
Obligation Bonds or Income Tax Secured Revenue Bonds to finance capital projects and to refund
indebtedness of the District. Such bond issuances are not permitted during any fiscal year if total debt
service on tax-supported debt exceeds 12 percent of total District general fund expenditures in any
year during the 6-year capital plan period. The Capital Improvements Plan included bond issuance
authority to finance specific capital projects totaling $1.093 billion in Fiscal Year 2015. The District
had approximately $3.5 billion of General Obligation Bonds and approximately $4.3 billion of
Income Tax Secured Revenue Bonds outstanding as of September 30, 2015.
• Equipment Lease Operating – The Master Equipment Lease/Purchase Program provides
tax-exempt financing for projects with short-term to intermediate-term useful lives. Rolling stock
such as police, emergency, and public works vehicles, as well as information technology equipment,
are acquired on a short-term lease/purchase basis. The District has financed approximately $500
million of its capital equipment needs through the program and has approximately $102.5 million in
principal outstanding as of September 30, 2015.
• Repayment of Revenue Bonds – The Council may authorize the issuance of revenue bonds, notes,
or other obligations (including refunding bonds, notes, or other obligations) to borrow funds to
finance governmental projects by creating a security interest in any District revenues. Such bonds,
notes, or other obligations, if issued, are to be secured by a pledge of the revenues realized from the
property, facilities, developments, and improvements financed by the issuance of such bonds, notes,

Operating Expenditures FY 2017 Proposed Budget and Financial Plan
4-6
or other obligations or by the mortgage of real property or the creation of security interest in available
revenues, assets, or other property. In FY 2007, FY 2010, and FY 2013, the District issued bonds for
its New Communities Initiative, with such bonds secured by a portion of revenues dedicated to the
Housing Production Trust Fund. The District had approximately $115.6 million of these bonds
outstanding as September 30, 2015.
• Pay-As-You-Go (Paygo) Capital Fund – Paygo capital financing is a transfer of funds from the
General Fund to the Capital Improvements Fund to pay for capital project expenditures. Although
Paygo is essentially cash financing, capital activities funded with Paygo dollars must be
capital-eligible as defined by the Home Rule Act and OCFO policy. Significant amounts of Paygo
capital funding is planned for the current 6-year capital plan period.
• Highway Trust Fund Transfer - Dedicated Taxes, Convention Center Transfer – Dedicated
Taxes, and TIF and PILOT Transfer – Dedicated Taxes – These agencies were first budgeted in
FY 2010 to make the flow of the dedicated revenues through the General Fund more visible. The TIF
and PILOT Transfer, along with Dedicated Tax Transfers to the Housing Production Trust Fund and
the Baseball Revenue Fund, are no longer budgeted in the General Fund starting in FY 2013.
Other Appropriation TitlesExpenditures in other appropriation titles are:
• Governmental Direction and Support
This appropriation title funds agencies that manage overall government operations, including the
Department of General Services, the Office of the Mayor, the Council of the District of Columbia,
the Office of the City Administrator, the Office of the Chief Technology Officer, the Office of the
Attorney General, and the Office of the Chief Financial Officer. Local funds expenditures in this
appropriation title have shown an average increase in growth at 6.6 percent annually from FY 2012
to FY 2015.
• Economic Development and Regulation
This is the smallest of the appropriation titles. The Department of the Consumer and Regulatory
Affairs, the Housing Authority Subsidy, the Office of the Deputy Mayor for Planning and Economic
Development, the Commission on Arts and Humanities, and the Department of Housing and
Community Development accounted for 85.9 percent of the expenditures in this title in FY 2015.
Local funds expenditures increased from FY 2012 to FY 2015 at an average rate of 19.9 percent
annually.
• Public Works
The Public Works appropriation title is dominated, in Local funds expenditures, by three agencies:
the Department of Public Works (DPW), the Department of Transportation (DDOT), and the subsidy
to the Washington Metropolitan Area Transit Authority (WMATA). DPW increased by 5.3 percent,
on average, annually from FY 2012 to FY 2015 for Local funds, while the Department of
Transportation decreased by 11.0 percent, as other funding sources partially replaced Local funds.
Summary of Local Funds Expenditure Growth by Agency and FunctionAll of the appropriation titles experienced increases in total average annual expenditures since FY 2012.
Expenditures in Financing and Other decreased for FY 2014 over FY 2013, although increasing in
FY 2015 for an average annual increase of 4.7 percent, while Governmental Direction and Support,
Public Education System, and Human Support Services had annual increases since FY 2012. Overall, the
District as a whole had an average annual increase of 4.3 percent for Local Funds expenditures from FY
2012 to FY 2015.
FY 2017 Proposed Budget and Financial Plan Operating Expenditures
4-7
Public Education is the largest appropriation title, comprising 27.4 percent of total Local funds
expenditures. Human Support Services is the second largest appropriation title with a 26.3 percent share
of total Local funds expenditures.
Actual DCPS enrollment has been growing annually and increased again FY 2015. The enrollment
in Public Charter Schools has shown a steady increase at an average annual rate of 5.4 percent since FY
2012. The enrollment in Public Charter Schools accounts for 44.5 percent of total enrollment in the
combined District schools system in FY 2015. From FY 2012 to FY 2015, the combined District schools
system enrollment shows an increase of 3.3 percent annually.
Federal Payment Fund ExpendituresA federal payment is a direct payment made to the District by the Federal government. The
authorization for each payment is found in Division A, Title 1, of the District’s annual Appropriations
Act. Federal payments to the District are subject to federal Government Accountability Office (GAO)
guidelines and government-wide rescissions. During FY 2015, the District received a total of $80.4
million in federal payments that could be spent by the agencies. Table 4A-5 of the Appendix details
the federal payments made to the District from FY 2012 through FY 2015, by agency. These funds
have various availability periods and, in some cases, will be spent over subsequent years. Federal
payments are detailed within each agency’s budget chapter.
In addition, in FY 2015 the District spent $19.0 million from the federal payment for Emergency
Planning and Security Costs. This payment was previously reimbursable, subject to the approval of
the Office of Management and Budget (OMB). In FY 2009, this became a direct federal payment. The
details of the FY 2015 expenses are found in the agency budget chapter for the Emergency Planning
and Security Fund, which is located within the Financing and Other section of Volume 4, Agency
Budget Chapters.
Federal Grants ExpendituresUnlike federal payments, which come directly from the U.S. Treasury as authorized by the annual
Appropriations Act, federal grants are awarded by federal agencies.
Table 4A-6 of the Appendix shows federal grant expenditures from FY 2012 through FY 2015 by agency.
Overall, their annual growth rate was 2.9 percent. The Department of Health Care Finance received the
majority of the funds, consisting primarily of funding for Medicaid.
Expenditure Growth by Object Class, FY 2012 to FY 2015This section examines expenditures by object class – that is, by the type of services paid for, such as
personal services, supplies, or fixed costs for rent or utilities – from FY 2012 through FY 2015. Since
FY 2012, the rate of growth for Local funds expenditures for nonpersonal services (NPS), such as
contractual services, equipment and equipment rental, subsidies and transfers, and debt service, has
risen along with personal services (PS), which include regular salaries and wages and other additional
costs (Figure 4-3). The average annual growth rate from FY 2012 to FY 2015 for Locally funded
personal services (PS) has increased 3.9 percent. Tables 4A-7 and 4A-8 in the appendix to this chapter
provide details.

Operating Expenditures FY 2017 Proposed Budget and Financial Plan
4-8
Personal ServicesFrom FY 2012 to FY 2015, total Local Funds Personal Services costs including salaries, extra pay (the
category including overtime), differential pay (for night or weekend work, for example), and fringe
benefits (primarily health insurance costs) increased at an average annual rate of 3.9 percent.
Table 4-2 shows overtime expenses from FY 2012 through FY 2015 by agency. The Metropolitan Police
Department, Fire and Emergency Medical Services Department, Department of Public Works, Department of
General Services, Department of Corrections, D.C. Public Schools, Department of Behavioral Health, and
Special Education Transportation comprise 80.8 percent of the total FY 2015 overtime expenditures.
Nonpersonal Services As shown in Table 4A-7 of the Appendix, the average annual growth rate from FY 2012 to FY 2015
for Local Funds nonpersonal expenditures, excluding retirement, is 4.8 percent. Since FY 2014,
Nonpersonal Services expenditures have increased by 5.2 percent.

FY 2017 Proposed Budget and Financial Plan Operating Expenditures
4-9
Table 4-2 Overtime Actual Expenditures from Local Funds and Dedicated Taxes(Excluding Enterprise and Other Funds)(Dollars in thousands)
Agency Name FY 2012 FY 2013 FY 2014 FY 2015Metropolitan Police Department 17,281 20,518 21,198 20,849 Fire and Emergency Medical Services 4,909 7,084 10,584 10,451 Department of Public Works 4,244 5,199 6,350 6,190 Department of General Services 2,158 2,409 2,928 4,744 Department of Corrections 2,311 2,081 3,739 4,225 District of Columbia Public Schools 2,250 2,293 3,130 3,447 Department of Behavioral Health 2,364 1,716 2,377 3,380 Special Education Transportation 3,584 3,763 3,754 3,284 Department of Transportation 600 1,940 1,185 2,324 Office of Unified Communications 760 765 1,113 2,254 Department of Human Services 470 705 906 2,071 Department of Youth Rehabilitation Services 4,271 3,912 2,681 2,012 Child and Family Services Agency 639 898 1,294 1,326 Office of the Chief Financial Officer 343 714 541 638 Department of Parks and Recreation 252 242 665 564 Inaugural Expenses 0 978 0 0 Rest of District 1,409 1,708 1,881 2,253 Total Local Funds 47,845 56,925 64,326 70,011Notes:1) The 16 selected agencies reflected overtime costs in excess of $600 thousand in any one year.2) The "Rest of District" is comprised of the remaining 47 agencies.3) The Department of General Services assumed the functions and responsibilities of the Office of Public Education Facilities Modernization and the Municipal Facilities:
Non-Capital agency in FY 2012.4) Details may not sum due to rounding.
Figure 4-3Local Personal Services and Nonpersonal Services Actual Expenditures (Excluding Dedicated Taxes) (Does Not Include Enterprise and Other Funds)(Dollars in millions)
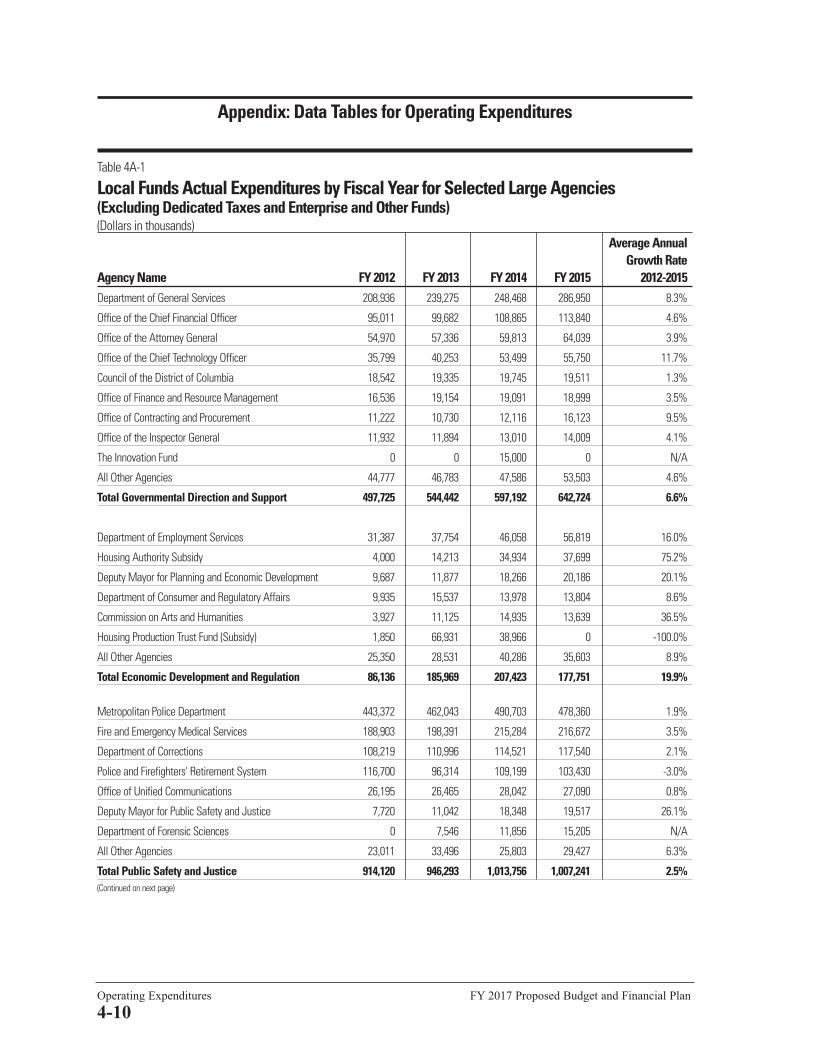
Operating Expenditures FY 2017 Proposed Budget and Financial Plan
4-10
Appendix: Data Tables for Operating Expenditures
Table 4A-1
Local Funds Actual Expenditures by Fiscal Year for Selected Large Agencies(Excluding Dedicated Taxes and Enterprise and Other Funds)(Dollars in thousands)
Average AnnualGrowth Rate
Agency Name FY 2012 FY 2013 FY 2014 FY 2015 2012-2015Department of General Services 208,936 239,275 248,468 286,950 8.3%
Office of the Chief Financial Officer 95,011 99,682 108,865 113,840 4.6%
Office of the Attorney General 54,970 57,336 59,813 64,039 3.9%
Office of the Chief Technology Officer 35,799 40,253 53,499 55,750 11.7%
Council of the District of Columbia 18,542 19,335 19,745 19,511 1.3%
Office of Finance and Resource Management 16,536 19,154 19,091 18,999 3.5%
Office of Contracting and Procurement 11,222 10,730 12,116 16,123 9.5%
Office of the Inspector General 11,932 11,894 13,010 14,009 4.1%
The Innovation Fund 0 0 15,000 0 N/A
All Other Agencies 44,777 46,783 47,586 53,503 4.6%
Total Governmental Direction and Support 497,725 544,442 597,192 642,724 6.6%
Department of Employment Services 31,387 37,754 46,058 56,819 16.0%
Housing Authority Subsidy 4,000 14,213 34,934 37,699 75.2%
Deputy Mayor for Planning and Economic Development 9,687 11,877 18,266 20,186 20.1%
Department of Consumer and Regulatory Affairs 9,935 15,537 13,978 13,804 8.6%
Commission on Arts and Humanities 3,927 11,125 14,935 13,639 36.5%
Housing Production Trust Fund (Subsidy) 1,850 66,931 38,966 0 -100.0%
All Other Agencies 25,350 28,531 40,286 35,603 8.9%
Total Economic Development and Regulation 86,136 185,969 207,423 177,751 19.9%
Metropolitan Police Department 443,372 462,043 490,703 478,360 1.9%
Fire and Emergency Medical Services 188,903 198,391 215,284 216,672 3.5%
Department of Corrections 108,219 110,996 114,521 117,540 2.1%
Police and Firefighters' Retirement System 116,700 96,314 109,199 103,430 -3.0%
Office of Unified Communications 26,195 26,465 28,042 27,090 0.8%
Deputy Mayor for Public Safety and Justice 7,720 11,042 18,348 19,517 26.1%
Department of Forensic Sciences 0 7,546 11,856 15,205 N/A
All Other Agencies 23,011 33,496 25,803 29,427 6.3%
Total Public Safety and Justice 914,120 946,293 1,013,756 1,007,241 2.5%(Continued on next page)

FY 2017 Proposed Budget and Financial Plan Operating Expenditures
4-11
Table 4A-1 (continued)
Local Funds Actual Expenditures by Fiscal Year for Selected Large Agencies(Excluding Dedicated Taxes and Enterprise and Other Funds)(Dollars in thousands)
Average AnnualGrowth Rate
Agency FY 2012 FY 2013 FY 2014 FY 2015 2012-2015District of Columbia Public Schools 638,879 640,642 653,800 708,087 2.6%
Public Charter Schools 508,113 601,428 627,979 661,074 6.8%
State Superintendent of Education (OSSE) 97,019 108,184 122,677 137,856 9.2%
Special Education Transportation 93,059 89,738 86,052 86,222 -1.9%
Non-Public Tuition 119,622 84,086 77,413 74,340 -11.2%
University of the District of Columbia Subsidy 67,362 65,555 66,691 73,458 2.2%
District of Columbia Public Library 35,309 41,583 53,095 56,206 12.3%
Teachers' Retirement System 3,000 6,396 31,573 39,443 90.4%
All Other Agencies 2,743 3,284 3,839 3,841 8.8%
Total Public Education System 1,565,106 1,640,896 1,723,119 1,840,525 4.1%
Department of Health Care Finance 667,761 727,913 716,045 739,256 2.6%
Department of Human Services 178,404 174,865 216,068 233,116 6.9%
Department of Behavioral Health 158,714 172,613 205,866 227,869 9.5%
Child and Family Services Agency 174,538 164,934 156,889 164,796 -1.4%
Department on Disability Services 55,099 54,071 57,216 113,724 19.9%
Department of Youth Rehabilitation Services 105,431 100,185 99,826 94,967 -2.6%
Department of Health 89,864 86,953 67,584 77,647 -3.6%
Department of Parks and Recreation 31,739 33,244 34,593 38,994 5.3%
All Other Agencies 75,143 74,063 89,944 78,919 1.2%
Total Human Support Services 1,536,693 1,588,841 1,644,030 1,769,285 3.6%
Department of Public Works 101,638 105,533 131,933 124,804 5.3%
Department of Transportation 119,485 62,043 74,187 75,050 -11.0%
Mass Transit Subsidies (WMATA) 138,068 195,156 200,810 221,317 12.5%
All Other Agencies 47,100 38,184 44,560 45,866 -0.7%
Public Works Sum 406,291 400,916 451,490 467,037 3.5%
Repayment of Loans and Interest 409,855 455,081 497,173 538,214 7.0%
Pay Go - Capital 33,730 48,439 26,415 98,238 30.6%
District Retiree Health Contribution 109,800 107,800 86,600 91,400 -4.5%
Master Equipment Lease / Purchase Program 49,791 49,953 45,617 43,778 -3.2%
Settlements and Judgments Fund 24,337 15,590 21,292 17,222 -8.3%
All Other Agencies 51,231 62,041 56,216 26,108 -15.5%
Total Financing and Other 678,744 738,905 733,314 814,961 4.7%
Grand Total 5,684,816 6,046,261 6,370,325 6,719,522 4.3%
Notes:1) Details may not sum due to rounding.2) Selected large agencies in each appropriation title constitutes at least 80 percent of each title's FY 2015 expenditures.

Operating Expenditures FY 2017 Proposed Budget and Financial Plan
4-12
Table 4A-2:Dedicated Taxes Funds Actual Expenditures by Fiscal Year by Agency Fund(Excluding Enterprise and Other Funds) (Dollars in thousands)
Average Annual
Growth Rate
Agency FY 2012 FY 2013 FY 2014 FY 2015 2012-2015Housing Production Trust Fund (Subsidy) 37,162 0 0 0 -100.0%Alcoholic Beverage Regulation Administration 460 460 534 925 19.1%Economic Development and Regulation Total 37,622 460 534 925 -60.4%
State Superintendent of Education (OSSE) 244 3,625 4,984 4,848 111.1%Public Education System Total 244 3,625 4,984 4,848 111.1%
Department of Health Care FinanceNursing Homes Quality of Care Fund 10,661 13,207 13,367 12,854 4.8%Healthy DC Fund 26,084 33,718 15,474 45,058 14.6%Hospital Assessment Tax 15,194 15,004 14,099 0 -100.0%Stevie Sellow's 0 2,570 4,732 4,866 N/ADC Provider Fee 0 0 17,838 0 N/A
Human Support Services Total 51,939 64,500 65,510 62,778 4.9%
Mass Transit Subsidies (WMATA) 52,186 54,430 66,985 71,648 8.2%Public Works Total 52,186 54,430 66,985 71,648 8.2%
Baseball Transfer - Dedicated Taxes 55,231 0 0 0 -100.0%Convention Center Transfer-Dedicated Tax 101,093 104,041 105,451 116,448 3.6%Highway Transportation Fund - Transfers 22,778 22,389 22,961 25,256 2.6%Repayment of Revenue Bonds
Housing Production Trust Fund 5,574 6,665 7,824 7,829 8.9%TIF and Pilot Transfer - Dedicated Taxes
Tax Increment Financing - Sales Tax 31,365 0 0 0 -100.0%Tax Increment Financing - Property Tax 23,129 0 0 0 -100.0%
Financing and Other Total 239,170 133,095 136,236 149,533 -11.1%
Grand Total 381,160 256,109 274,249 289,733 -6.6%
Details may not sum due to rounding.

FY 2017 Proposed Budget and Financial Plan Operating Expenditures
4-13
Table 4A-3General Operating Funds Actual Expenditures by Fiscal Year for Selected Large Agencies(Excluding Intra-District Funds)(Dollars in thousands)
Average Annual
Growth Rate
Agency FY 2012 FY 2013 FY 2014 FY 2015 2012-2015Department of General Services 213,151 243,269 253,148 292,066
Office of the Chief Financial Officer 104,875 114,557 122,159 128,909
Office of the Attorney General 72,703 77,083 78,396 83,605
Office of the Chief Technology Officer 45,311 47,445 61,024 64,673
Council of the District of Columbia 18,542 19,335 19,901 19,511
Office of Finance and Resource Management 16,536 19,154 19,192 19,190
Office of Contracting and Procurement 11,222 10,730 12,145 16,427
Office of the Inspector General 13,976 13,749 15,042 16,103
Office of the Mayor 12,060 11,306 11,420 13,340
All Other Agencies 39,244 41,059 57,094 46,095
Governmental Direction and Support Total 547,620 597,688 649,521 699,919 6.3%
Department of Employment Services 87,576 83,612 99,056 113,744
Department of Housing and Community Development 55,882 57,353 42,556 42,570
Department of Consumer and Regulatory Affairs 24,507 30,271 34,890 41,623
Housing Authority Subsidy 4,000 14,213 34,934 37,699
Deputy Mayor for Planning and Economic Development 17,748 20,233 36,225 34,039
Business Improvement Districts Transfer 22,303 23,290 22,343 25,137
Department of Insurance, Securities and Banking 14,569 16,486 17,858 18,416
Housing Production Trust Fund (Subsidy) 39,012 66,931 38,966 0
All Other Agencies 48,297 56,432 74,401 73,424
Economic Development and Regulation Total 313,895 368,821 401,230 386,652 5.3%
Metropolitan Police Department 453,924 468,380 500,579 485,308
Fire and Emergency Medical Services 192,194 200,300 218,185 219,215
Department of Corrections 126,115 130,612 135,313 136,250
Police and Firefighters Retirement System 116,700 96,314 109,199 103,430
Homeland Security/Emergency Management 114,621 125,478 80,567 74,971
All Other Agencies 79,965 99,918 103,550 117,944
Public Safety and Justice Total 1,083,519 1,121,002 1,147,393 1,137,120 1.2%
District of Columbia Public Schools 690,413 698,171 704,177 767,628
Public Charter Schools 508,113 601,428 627,979 661,074
State Superintendent of Education (OSSE) 357,831 351,291 362,373 365,986
Special Education Transportation 93,059 89,738 86,052 86,222
Non-Public Tuition 119,622 84,086 77,413 74,340
University of the District of Columbia Subsidy 67,362 65,555 66,691 73,458
District of Columbia Public Library 36,972 42,647 54,313 57,422
All Other Agencies 5,742 9,679 35,413 43,283
Public Education System Total 1,879,116 1,942,595 2,014,411 2,129,413 3.2%
(Continued on next page)

Operating Expenditures FY 2017 Proposed Budget and Financial Plan
4-14
Table 4A-3 (continued)General Operating Funds Actual Expenditures by Fiscal Year for SelectedLarge Agencies(Excluding Intra-District Funds)(Dollars in thousands)
Average Annual
Growth Rate
Agency FY 2012 FY 2013 FY 2014 FY 2015 2012-2015
Department of Health Care Finance 2,253,569 2,465,026 2,594,746 2,664,592
Department of Human Services 309,961 324,161 348,017 386,217
Department of Behavioral Health 171,163 181,624 229,314 255,871
Child and Family Services Agency 233,550 226,362 222,193 228,683
Department of Health 244,456 230,979 198,782 203,293
Department on Disability Services 92,026 89,955 96,433 156,205
Department of Youth Rehabilitation Services 108,132 100,849 99,826 94,967
All Other Agencies 115,190 116,325 134,644 127,109
Human Support Services Total 3,528,047 3,735,281 3,923,955 4,116,938 3.9%
Mass Transit Subsidies (WMATA) 221,339 284,851 309,436 335,702
Department of Public Works 106,874 112,014 137,389 130,681
Department of Transportation 128,792 75,331 87,583 91,506
Department of Energy and Environment 69,792 69,456 75,063 78,443
All Other Agencies 38,535 35,456 39,402 42,611
Public Works Total 565,332 577,108 648,872 678,943 4.7%
Repayment of Loans and Interest 434,384 479,810 520,508 586,572
Pay Go - Capital 80,878 88,201 59,798 136,245
Convention Center Transfer-Dedicated Tax 101,093 107,041 108,701 120,448
Highway Transportation Fund - Transfers 39,432 35,111 41,488 40,210
District Retiree Health Contribution 109,800 107,800 86,600 91,400
Master Equipment Lease / Purchase Program 49,791 49,953 45,617 43,778
TIF and PILOT Transfer - Dedicated Taxes 54,494 0 12,627 0
Baseball Transfer - Dedicated Taxes 55,231 0 0 0
All Other Agencies 90,751 97,525 77,038 87,268
Financing and Other Total 1,015,854 965,441 952,377 1,105,921 2.1%
Grand Total 8,933,383 9,307,935 9,737,760 10,254,906 3.5%
Notes:1) Details may not sum due to rounding.2) Selected large agencies in each appropriation title constitutes at least 80 percent of each title's FY 2015 expenditures.

FY 2017 Proposed Budget and Financial Plan Operating Expenditures
4-15
Table 4A-4Local Funds Actual Expenditures by Appropriation Year and Fiscal Year(Education Agencies)(Dollars in thousands)
FY 2012 FY 2013 FY 2014 FY 2015
D.C. Public SchoolsExpenditures, current AY and FY 634,445 640,642 644,563 695,390 PLUS: AY Expenditures in prior FY 5,664 4,434 0 9,237 EQUALS: Total AY expenditures 640,109 645,076 644,563 704,627 LESS: AY Expenditures in prior FY (5,664) (4,434) 0 (9,237)PLUS: FY expenditures from following AY 4,434 0 9,237 12,697 EQUALS: Total FY expenditures(As shown in CAFR and table 4-1 and 4A-1 above) 638,879 640,642 653,800 708,087
D.C. Public Charter SchoolsExpenditures, current AY and FY 374,804 422,525 426,696 458,690 PLUS: AY Expenditures in prior FY 120,896 133,309 178,903 201,283 EQUALS: Total AY expenditures 495,700 555,834 605,599 659,973 LESS: AY Expenditures in prior FY (120,896) (133,309) (178,903) (201,283)PLUS: FY expenditures from following AY 133,309 178,903 201,283 202,384 EQUALS: Total FY expenditures(As shown in CAFR and table 4-1 and 4A-1 above) 508,113 601,428 627,979 661,074
Details may not sum due to rounding.
Public Education expenditures are tracked by appropriation year (AY) and fiscal year (FY). Table 4A-4provides a crosswalk between the AY and FY expenditures for key school systems. The FY data are usedthroughout this chapter, although the AY data reflect more comparable data over time.

Operating Expenditures FY 2017 Proposed Budget and Financial Plan
4-16
Table 4A-5 Federal Payments Awarded to the District in its Appropriations Act, FY 2012-2015(Dollars in thousands)
FY 2012 FY 2013 FY 2014 FY 2015Approved Approved Approved Approved
DC National Guard 375 355 375 435 D.C. Public Schools 20,000 18,954 16,000 15,000 Emergency Planning and Security Costs 14,900 23,408 23,800 12,500 Executive Office of the Mayor Forensic Lab (Increased FBI services)Criminal Justice Coordinating Council 1,800 1,706 1,800 1,900 Office of the State Superintendent of Education:
Resident Tuition Assistance 30,000 28,431 30,000 30,000 Public Charter School Improvement/Expansion 20,000 18,954 16,000 15,000
Commission on Judicial Disabilities and Tenure 295 280 295 295 Judicial Nomination Commission 205 194 205 270 Department of Human ServicesDepartment of Youth Rehabilitation ServicesDepartment of Health 5,000 4,738 5,000 5,000 Various — CapitalTotal 92,575 97,020 93,475 80,400 Details may not sum due to rounding.
Notes:
1) This table shows appropriations made to the District that could be expended by District agencies. Unless specified below, the table does not show payments madeto WASA or pass-through payments where the District passes the payment to the designated recipients.
2) The FY 2013 approved budget was affected by sequestration.
3) The FY 2014 $23,800 for Emergency Planning and Security Costs includes $8.9 million for the Presidential Inauguration. The $8.9 million was a reimbursement for aprior year inaugural Local fund cost, for which associated revenues were recorded in Local funds. This was later reversed in the system of record.
4) The FY 2014 $16m for the Federal Payment for DCPS and OSSE was later transferred to Federal Grants.
5) The FY 2015 $15m for the Federal Payment for DCPS was later transferred to Federal Grants.

FY 2017 Proposed Budget and Financial Plan Operating Expenditures
4-17
Table 4A-6Federal Grant Actual Expenditures (including Medicaid), by Fiscal Year(Excluding Federal Payments, and Enterprise and Other Funds)(Dollars in thousands)
Average Annual
Growth RateAgency FY 2012 FY 2013 FY 2014 FY 2015 2012-2015
District of Columbia Public Schools 7,041 33,113 36,359 51,520 64.5%
Department of Behavioral Health 7,479 5,953 20,253 24,716 34.8%
Department on Disability Services 28,799 30,736 34,672 37,371 6.7%
Department of Health Care Finance 1,533,135 1,671,649 1,812,204 1,859,296 4.9%
Department of Human Services 131,364 148,870 131,786 153,002 3.9%
Child and Family Services Agency 57,984 59,974 64,058 62,664 2.0%
Department of Employment Services 31,691 23,080 31,568 33,901 1.7%
Office of the Attorney General for the District of Columbia 16,837 18,749 17,616 17,925 1.6%
Repayment of Loans and Interest 20,157 20,181 18,606 18,440 -2.2%
State Superintendent of Education (OSSE) 210,694 203,871 191,300 182,602 -3.5%
Department of Energy and Environment 26,065 21,161 20,149 19,972 -6.4%
Department of Health 143,120 132,745 118,124 109,299 -6.5%
Department of Housing and Community Development 41,652 42,243 27,881 29,048 -8.6%
Homeland Security and Emergency Management Agency 112,775 123,504 78,500 71,246 -10.8%
Sub Total - Selected Agencies 2,368,794 2,535,828 2,603,075 2,671,002 3.0%
All Other Agencies 48,381 37,090 39,588 42,248 -3.3%
Total General Operating Funds 2,417,175 2,572,919 2,642,662 2,713,249 2.9%
Details may not sum due to rounding.

Operating Expenditures FY 2017 Proposed Budget and Financial Plan
4-18
Table 4A-7Local Funds Actual Expenditures by Fiscal Year for Selected Object Classes(Excluding Dedicated Taxes, and Enterprise and Other Funds)(Dollars in thousands)
Average Annual
Growth Rate Selected Object Classes FY 2012 FY 2013 FY 2014 FY 2015 2012-2015
Regular salaries and wages (0011, 0012, 0099) 1,605,679 1,627,601 1,739,728 1,837,363 3.4%
Extra pay and Overtime (0013, 0015) 109,731 131,763 137,601 152,327 8.5%
Fringe Benefits (0014) 294,967 306,148 326,586 353,015 4.6%
Subtotal, Personal Services 2,010,378 2,065,512 2,203,915 2,342,706 3.9%
FD0 - PS Paid by NPS (0050) - Police/Fire Fighters' Retirement 116,700 96,314 109,199 103,430 -3.0%
GX0 - PS Paid by NPS (0050) - Teachers' Retirement 3,000 6,396 31,573 39,443 90.4%
BG0 - PS Paid by NPS (0050) - Employees' Compensation Fund 16,371 13,314 12,998 13,327 -5.0%
BH0 - PS Paid by NPS (0050) - D.C. Unemployment Compensation Fund 12,203 7,668 6,620 5,055 -19.8%
RH0 - PS Paid by NPS (0050) - District Retiree Health Contribution 109,800 107,800 86,600 91,400 -4.5%
Subtotal, PS with Selected Subsidies and Transfers 258,074 231,493 246,990 252,655 -0.5%
Fixed Cost (0030-0035) 243,106 243,626 245,424 325,153 7.5%
Subsidies and transfers (0050 less Selected Subsidies and
Transfers Subtotal Above) 2,081,855 2,300,760 2,384,109 2,544,913 5.1%
Debt service (0080) 510,808 561,474 589,191 609,752 4.5%
Contractual services (0041) 357,495 383,763 424,828 386,382 2.0%
Other NPS (0020, 0040, 0070, 0060, 0082, 0083, 0084, 0091) 223,100 259,634 275,869 257,961 3.7%
Subtotal, NPS excluding Retirement 3,416,364 3,749,257 3,919,421 4,124,161 4.8%
Total Expenditures 5,684,816 6,046,261 6,370,325 6,719,522 4.3%
Details may not sum due to rounding.

FY 2017 Proposed Budget and Financial Plan Operating Expenditures
4-19
Table 4A-8Dedicated Taxes Funds Actual Expenditures by Fiscal Year for Selected Object Classes(Excluding Enterprise and Other Funds)(Dollars in thousands)
Average Annual Growth Rate
Selected Object Classes FY 2012 FY 2013 FY 2014 FY 2015 2012-2015
Regular salaries and wages (0011, 0012) 202 534 881 1,047 50.9%
Extra pay and Overtime (0013, 0015) 1 6 2 20 111.5%
Fringe Benefits (0014) 38 130 180 222 55.5%
Subtotal, PS 241 671 1,063 1,289 52.1%
Fixed Cost (0030-0035) 0 0 0 1 N/A
Subsidies and transfers (0050) 374,911 243,111 263,923 278,370 -7.2%
Debt service (0080) 5,574 6,665 7,824 7,829 8.9%
Contractual services (0041) 434 5,663 1,407 2,178 49.7%
Other NPS (0020, 0040, 0070, 0060, 0082, 0083, 0084, 0091) 0 0 32 67 N/A
Subtotal, NPS 380,919 255,439 273,186 288,445 -6.7%
Total Expenditures 381,160 256,109 274,249 289,734 -6.6%
Details may not sum due to rounding.


FY 2017 Proposed Budget and Financial Plan FY 2017 - FY 2022 Capital Improvements Plan
5-1
Introduction
The District’s proposed capital budget for FY 2017 - FY 2022 calls for financing $1.310 billion of capital
expenditures in FY 2017. The FY 2017 budget highlights are:
• $430 million for D.C. Public Schools, to include $233 million for renovation of elementary schools, $59 million
for renovation of Coolidge High School, and $77 million for renovation of middle schools;
• $407 million for the District Department of Transportation, to include $19 million for expansion of the Streetcar
line and $120 million for improvements to the South Capitol Street corridor and replacement of the Frederick
Douglass Bridge;
• $143 million for the Washington Metropolitan Transit Authority (WMATA), to include $92 million for the
inter-jurisdictional Capital Funding Agreement and $50 million for the Passenger Rail Investment and
Improvement Act (PRIIA) Funding Agreement;
• $65 million for the Deputy Mayor for Planning and Economic Development, to include $35 million for
McMillan Site Redevelopment;
• $46 million for the District of Columbia Public Library, to include $42 million for the Martin Luther King, Jr.
Memorial central library;
• $46 million for the Department of Health Care Finance for the East End Medical Center; and
• $43 million for the Department of Human Services, to include $20 million for transitional housing.
The proposed capital budget calls for financing of general capital expenditures in FY 2017 from the following
sources:
• $865 million of General Obligation (G.O.) or Income Tax (I.T.) revenue bonds including $5 million in taxable
bonds;
• $7 million of Short-Term Bonds;
• $80 million of pay-as-you-go capital (Paygo) capital financing, which is a transfer of funds from the General
Fund to the General Capital Improvements Fund for the purchase of capital-eligible assets;
• $161 million of federal grants, and payments from Highway Trust Fund revenue;
• $94 million of Grant Anticipation Revenue Vehicle (GARVEE) bonds;
• $27 million of Local Highway Trust Fund revenue (motor fuel taxes) for the local match to support federal
highway grants;
• $45 million of Local Transportation Fund special purpose (Rights-of-Way occupancy fees) revenue;
• $26 million from the sale of assets (land at McMillan and Walter Reed); and
• $5 million from private grants.
This overview chapter summarizes:
• The District’s proposed FY 2017 - FY 2022 capital budget and planned expenditures;
• Major capital efforts; and
• Fund balance of the District’s capital fund.
The Highway Trust Fund and related projects are presented in Appendix H. The D.C. Water and Sewer
Authority's capital program is presented in Appendix I of Volume 5, the FY 2017 Capital Improvements Plan.
FY 2017 - FY 2022Capital Improvements Plan
5

FY 2017 - FY 2022 Capital Improvements Plan FY 2017 Proposed Budget and Financial Plan
5-2
The Proposed FY 2017 - FY 2022 Capital Budget and Planned Expenditures The District budgets for capital projects using a six-year Capital Improvements Plan (CIP), which is updated
annually.
The CIP consists of:
• The appropriated budget authority request for the upcoming CIP six-year period, and
• An expenditure plan with projected funding over the next 6 years.
Each year’s CIP includes many of the projects from the previous year’s CIP, but some projects are proposed to
receive different levels of funding than in the previous year’s budget plan. New projects are added each year as
well.
The CIP is used as the basis for formulating the District's annual capital budget. The Council and the Congress
adopt the budget as part of the District's overall six-year CIP. Inclusion of a project in a congressionally adopted
capital budget and approval of requisite financing gives the District the authority to spend funds for each project.
The remaining five years of the program show the official plan for making improvements to District-owned
facilities in future years.
Following approval of the capital budget, bond acts and bond resolutions are adopted to authorize financing for
the majority of projects identified in the capital budget. The District has issued Income Tax (I.T.) revenue bonds
and General Obligation (G.O.) bonds (both tax-exempt and taxable) to finance some or all of its capital projects.
Where this chapter refers to G.O. bond financing for capital projects, the District might ultimately use I.T. bond
financing depending on market conditions. Capital projects in the CIP are also financed with short-term bonds,
GARVEE bonds, and pay-as-you-go (Paygo) financing. Taxable bonds may be issued by the District where that
funding is appropriate for certain projects.
The District uses two terms in describing budgets for capital projects:
• Budget authority is given to a project at its outset in the amount of its planned lifetime budget; later it can be
increased or decreased during the course of implementing the project. The District's appropriation request
consists of changes to budget authority for all projects in the CIP.
• Allotments are planned expenditure amounts on an annual basis. A multi-year project receives full budget
authority in its first year but only receives an allotment in the amount that is projected to be spent in that first
year. In later years, additional allotments are given annually. If a year's allotment would increase the total
allotments above the current lifetime budget amount, an increase in budget authority is required to cover the
difference.
Table 5-1
Overview(Dollars in thousands)
Total number of projects receiving funding 164
Number of ongoing projects receiving funding 149
Number of new projects receiving funding 15
FY 2017 new budget allotments $1,309,966
Total FY 2017 to FY 2022 planned funding $6,269,408
Total FY 2017 to FY 2022 planned expenditures $6,269,408
FY 2017 Appropriated Budget Authority Request $1,231,930
FY 2017 Planned Debt Service (G.O./I.T. Bonds) $639,032,824
FY 2017-FY 2022 Planned Debt Service (G.O./I.T. Bonds) $4,994,258,257
FY 2017 Proposed Budget and Financial Plan FY 2017 - FY 2022 Capital Improvements Plan
5-3
Agencies may obligate funds up to the limit of (lifetime) budget authority for a project but cannot spend more
than the total of allotments the project has received to date (see Appendix D of Volume 5). The FY 2017 to FY
2022 CIP proposes a net increase in budget authority of $1,232 million during the next six fiscal years (an increase
of $1,660 million of new budget authority offset by $428 million of rescissions).
Planned capital expenditures from local sources in FY 2017 total $1,055 million to be funded primarily by
bonds, Paygo, and the local transportation fund special purpose revenue. To finance these expenditures, the District
plans to borrow $865 million in new G.O./I.T. bonds (including $5 million in new taxable bonds), borrow $7
million in short-term bonds, fund $80 million using Paygo, use $45 million in Local Transportation Fund Special
Purpose Revenue, use $26 million from the sale of assets, use $5 million from private grants, and use $27 million
for the local match to the federal grants from the Federal Highway Administration. Proposed funding sources are
shown in Figure 5-1 and proposed borrowing is shown in Table 5-7.
In recent years, the District has increased its capital expenditures to reinvest in its aging infrastructure. The
District is limited by funding constraints as well as multiple competing demands on capital and is not able to fund
all identified capital needs. As a result of these demands, the District has taken action to meet its priorities while
also maintaining a fiscally sound CIP. This plan has been accomplished by prioritizing capital projects and
rescinding budget authority from projects deemed less important, and by reallocating budget to existing and new
high priority projects to meet the most pressing infrastructure needs.
Figure 5-2 illustrates FY 2017 capital budget allotments by major agency. Funding for the District of Columbia
Public Schools constitutes the largest share of the planned expenditures. Large shares of funding also go toward
the District Department of Transportation, the Washington Metropolitan Area Transit Authority, and the Deputy
Mayor for Planning and Economic Development. In addition, as with all agencies, unspent capital budget
allotments from prior years will be available to be spent in FY 2017.
Table 5-2 summarizes planned expenditure amounts for FY 2017 and budget authority requests for FY 2017-
FY 2022. It includes local funds (G.O./I.T, taxable and short-term bonds, Paygo, local transportation funds, and
sale of assets) and federal grants.
The capital fund pro forma, Table 5-3, summarizes sources and uses in the District’s CIP. The Project
Description Forms that constitute the detail of Volume 5 include projects receiving new allotments in FY 2017
through FY 2022, as included in the pro forma, totaling $1.310 billion in FY 2017.
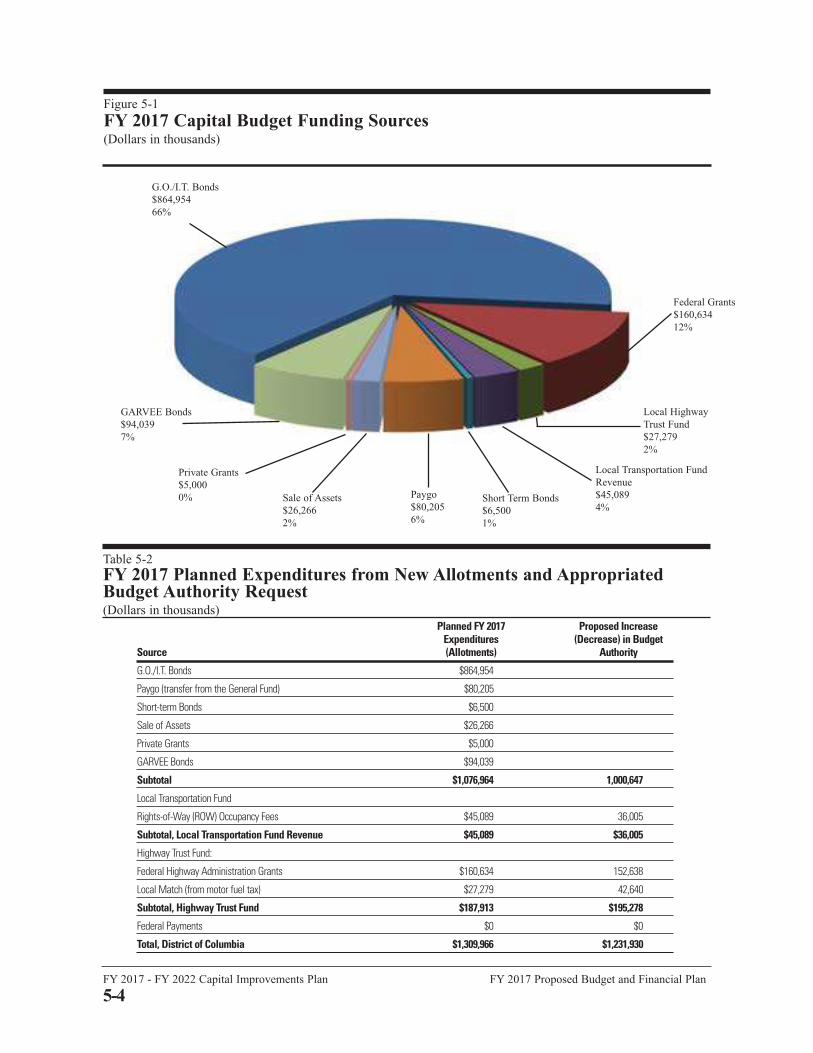
Figure 5-1
FY 2017 Capital Budget Funding Sources(Dollars in thousands)
G.O./I.T. Bonds
$864,954
66%
Local Transportation Fund
Revenue
$45,089
4%
Paygo
$80,205
6%
Sale of Assets
$26,266
2%
GARVEE Bonds
$94,039
7%
Private Grants
$5,000
0% Short Term Bonds
$6,500
1%
Local Highway
Trust Fund
$27,279
2%
Federal Grants
$160,634
12%
Table 5-2
FY 2017 Planned Expenditures from New Allotments and AppropriatedBudget Authority Request(Dollars in thousands)
Planned FY 2017 Proposed Increase Expenditures (Decrease) in Budget
Source (Allotments) Authority
G.O./I.T. Bonds $864,954
Paygo (transfer from the General Fund) $80,205
Short-term Bonds $6,500
Sale of Assets $26,266
Private Grants $5,000
GARVEE Bonds $94,039
Subtotal $1,076,964 1,000,647
Local Transportation Fund
Rights-of-Way (ROW) Occupancy Fees $45,089 36,005
Subtotal, Local Transportation Fund Revenue $45,089 $36,005
Highway Trust Fund:
Federal Highway Administration Grants $160,634 152,638
Local Match (from motor fuel tax) $27,279 42,640
Subtotal, Highway Trust Fund $187,913 $195,278
Federal Payments $0 $0
Total, District of Columbia $1,309,966 $1,231,930
FY 2017 - FY 2022 Capital Improvements Plan FY 2017 Proposed Budget and Financial Plan
5-4

FY 2017 Proposed Budget and Financial Plan FY 2017 - FY 2022 Capital Improvements Plan
5-5
Table 5-3Capital Fund Pro Forma(Dollars in thousands)
6 Year PercentFY 2017 FY 2018 FY 2019 FY 2020 FY 2021 FY 2022 Total of Total
Sources:
G.O. / I.T. Bonds (Tax Exempt) $859,954 $533,824 $654,316 $770,391 $539,172 $449,967 $3,807,625 65.6%
G.O. / I.T. Bonds (Taxable) 5,000 - - 13,800 - - $18,800 0.4%
Short-Term Bonds 6,500 6,474 25,000 25,000 - 10,000 $72,974 0.5%
Paygo 80,205 48,500 53,888 102,325 106,285 107,811 $499,015 6.1%
Sale of Assets 26,266 1,000 1,000 1,000 1,000 1,000 $31,266 2.0%
Private Grants 5,000 - - - - - $5,000 0.4%
Federal Payments - 50,000 50,000 - - - $100,000 0.0%
Local Transportation Fund Revenue 45,089 40,589 39,089 37,589 37,589 37,589 $237,534 3.4%
GARVEE Bonds 94,039 150,000 108,970 - - - $353,010 7.2%
Local Highway Trust Fund 27,279 29,006 30,261 31,518 31,278 31,040 $180,382 2.1%
Federal Grants 160,634 160,634 160,634 160,634 160,634 160,634 $963,804 12.3%
Total Sources $1,309,966 $1,020,027 $1,123,158 $1,142,257 $875,959 $798,041 $6,269,408 100.0%
Uses:
District of Columbia Public Schools $430,203 $184,777 $208,609 $201,618 $141,690 $149,933 $1,316,830 32.8%
Department of Transportation 407,175 511,217 529,254 516,039 453,881 312,787 $2,730,353 30.9%
Local Transportation Fund 219,262 321,577 338,359 323,887 261,968 121,112 1,586,165
Highway Trust Fund 187,913 189,640 190,895 192,152 191,913 191,675 1,144,188
Washington Metropolitan Area Transit Authority 142,712 122,846 169,218 169,365 129,871 96,592 $830,605 10.9%
Office of the Deputy Mayor for Planning and Economic Development 65,266 35,200 37,000 17,000 17,000 9,500 $180,966 5.0%
District of Columbia Public Library 46,495 75,000 70,850 37,000 16,000 2,000 $247,345 3.5%
Department of Health Care Finance 45,700 19,071 18,000 10,953 5,000 - $98,724 3.5%
Department of Human Services 43,471 - - - - - $43,471 3.3%
Department of Parks and Recreation 30,476 24,943 18,950 - 54,057 - 27,835 15,648 $171,909 2.3%
Department of General Services 17,650 4,000 3,000 5,500 7,250 7,900 $45,300 1.3%
Fire and Emergency Medical Services Department 16,175 15,000 27,050 29,000 25,000 18,500 $130,725 1.2%
Office of the Chief Financial Officer 12,000 6,000 - - - 5,500 $23,500 0.9%
Metropolitan Police Department 11,500 6,474 8,500 9,250 3,000 9,500 $48,224 0.9%
University of the District of Columbia 10,000 - - 12,500 12,500 20,000 $55,000 0.8%
Department of Energy and Environment 9,500 5,000 5,000 9,500 8,000 33,906 $70,906 0.7%
Department of Motor Vehicles 5,500 - - - - - $5,500 0.4%
Department of Public Works 5,000 5,000 5,000 23,200 21,431 107,000 $166,631 0.4%
Special Education Transportation 4,275 3,000 3,327 4,000 4,000 4,275 $22,877 0.3%
Office of the State Superintendent of Education 3,929 2,500 3,000 2,500 1,500 - $13,429 0.3%
Office of the Chief Technology Officer 2,940 - - - - - $2,940 0.2%
Office of the Secretary - - 12,900 35,275 - - $48,175 0.0%
Department of Consumer and Regulatory Affairs - - - 2,000 2,000 - $4,000 0.0%
Department of Youth Rehabilitation Services - - - - - 5,000 $5,000 0.0%
Office of Unified Communications - - 3,500 3,500 - - $7,000 0.0%
Total Uses $1,309,966 $1,020,027 $1,123,158 $1,142,257 $875,959 $798,041 $6,269,408 100.0%Note: Details may not sum to totals due to rounding

FY 2017 - FY 2022 Capital Improvements Plan FY 2017 Proposed Budget and Financial Plan
5-6
FY 2017 Operating Budget ImpactIn general, each $13.5 million in borrowing has approximately a $1 million impact on the operating budget for
annual debt service. The capital budget's primary impact on the operating budget is the debt service cost, paid from
local revenue in the operating budget, associated with issuing long-term bonds to finance the CIP. Debt service is
funded in the FY 2017 operating budget and financial plan.
A secondary impact on the operating budget is the cost of operating and maintaining newly completed capital
projects. For example, the replacement of a building’s roof, windows, and mechanical systems may decrease the
cost of utilities, which would effectively lower the owner agency’s operating costs. Conversely, the construction of
a new recreation center is likely to increase the owner agency’s operating costs for staffing the facility and operating
programs there. Similarly, completed information technology projects will likely entail additional operating costs
such as upgrades, license renewals, or training of staff to operate new systems as required.
Table 5-5 reflects the summary of the projected impacts, by agency, and by fiscal year for the 6-year CIP
period. Individual project pages in the “Project Description Forms” section of Volume 5 show more details of the
operating impact resulting from placing a particular newly completed project into service.
Figure 5-2
FY 2017 Capital Budget Allotments, by Agency(Dollars in thousands)
Department of
Transportation
$407,175
31%
District of Columbia Public
Schools
$430,203
33%
Washington Metropolitan
Area Transit Authority
$142,712
11%
District of Columbia Public
Library
$46,495
4%
Department of Health
Care Finance
$45,700
3%
Other Agencies
$128,945
10%
Department of
Human Services
$43,471
3%
Office of the Deputy Mayor
for Planning and Economic
Development
$65,266
5%

FY 2017 Proposed Budget and Financial Plan FY 2017 - FY 2022 Capital Improvements Plan
5-7
FY 2017 FY 2018 FY 2019 FY 2020 FY 2021 FY 2022
Existing General Obligation (G.O.) and Income Tax (I.T.)
Bonds Debt Service (Agency DS0) $593,786,293 $617,343,907 $634,738,380 $636,098,954 $622,053,469 $633,683,778
Prospective I.T./G.O. Bonds Debt Service
2nd FY 2015 CIP (July 16) I.T. / G.O. Bonds ($513.5M) $20,474,018 $23,105,475 $35,832,525 $35,833,125 $35,831,163 $35,830,400
1st FY 2016 CIP (Dec 16) ) I.T. / G.O. Bonds ($500M) $11,250,000 $22,500,000 $22,500,000 $34,894,700 $34,891,050 $34,890,625
2nd FY 2016 CIP (May 17) I.T. / G.O. Bonds ($425.1M) $- $23,028,146 $21,256,750 $31,104,250 $31,101,375 $31,102,000
FY 2017 CIP (Dec 17) I.T. / G.O Bonds ($875M) $- $24,061,263 $48,122,525 $65,656,700 $65,657,000 $65,654,688
FY 2018 CIP (June 18) I.T. / G.O. Bonds ($533.8M) $- $- $29,360,650 $40,058,150 $40,056,100 $40,058,850
FY 2019 CIP (June 19) I.T. / G.O. Bonds ($666.3M) $- $- $- $49,042,113 $49,046,200 $49,044,450
FY 2020 CIP (June 20) I.T. / G.O. Bonds ($804.2M) $- $- $- $- $59,192,638 $59,192,538
FY 2021 CIP (June 21) I.T. / G.O. Bonds ($539.2M) $- $- $- $- $- $29,654,625
FY 2022 CIP (June 22) I.T. / G.O. Bonds ($450M) $- $- $- $- $- $-
Total G.O. Bonds Debt Service (Agency DS0) $625,510,311 $710,038,790 $791,810,830 $892,687,991 $937,828,994 $979,111,953
School Modernization G.O. Bonds Debt Service (Agency SM0)
2007 Issuance ($60M) $2,781,425 $2,781,425 $2,781,425 $2,781,425 $2,781,425 $2,781,425
2008 Issuance ($90M) $10,741,088 $5,967,750 $5,967,750 $5,968,250 $5,968,750 $5,965,500
School Modernization Fund Subtotal (Agency SM0) $13,522,513 $8,749,175 $8,750,925 $8,749,675 $8,750,175 $8,746,925
Housing Production Trust Fund (Agency DT0) $7,835,339 $7,832,389 $7,838,539 $7,839,039 $7,836,089 $7,837,339
Total Long-Term Debt Service $646,868,163 $726,620,354 $808,400,294 $909,276,705 $954,415,258 $995,696,217
Payments on Master Lease Equipment Purchases (Agency EL0) $30,009,362 $23,239,514 $21,163,978 $19,174,130 $13,480,613 $14,227,058
Total Debt Service, General Fund Budget $676,877,525 $749,859,868 $829,564,272 $928,450,835 $967,895,871 $1,009,923,275
Other (Non-General Fund) Debt Service $128,065,005 $127,446,116 $128,175,332 $125,882,671 $124,257,476 $106,972,469
Total Debt Service $804,942,530 $877,305,984 $957,739,604 $1,054,333,506 $1,092,153,347 $1,116,895,744
Total Expenditures $8,323,229,470 $8,362,578,532 $8,597,008,497 $8,886,837,586 $9,156,652,201 $9,419,220,839
Ratio of Debt Service to Total Expenditures 9.671% 10.491% 11.140% 11.864% 11.927% 11.858%
Balance of Debt Service Capacity $193,845,007 $126,203,440 $73,901,415 $12,087,005 $6,644,917 $13,410,757
*Has equal and offsetting revenue component funded by bond proceeds in the amount of the actual expenditures
Table 5-4
OFFICE OF FINANCE AND TREASURY Fiscal Years 2017 - 2022 Debt Service Expenditure Projections

FY 2017 - FY 2022 Capital Improvements Plan FY 2017 Proposed Budget and Financial Plan
5-8
Owner
Agency
Code Agency Name FY 2018 FY 2019 FY 2020 FY 2021 FY 2022
FR0 Department of Forensic Sciences 26,765 133,825 109,522 - 171,927
FX0 Office of the Chief Medical Examiner 65,300 - - - -
CE0 DC Public Library 1,106,799 1,518,703 153,970 580,166 621,244
HA0 Department of Parks and Recreation 913,226 811,872 836,231 861,317 887,152
HT0 Department of Health Care Finance 930,000 930,000 50,000 50,000 -
JA0 Department of Human Services 3,363,896 6,499,728 6,408,256 6,432,704 6,457,285
TO0 Office of the Chief Technology Officer 1,389,400 140,000 - - -
Total 7,795,386 10,034,128 7,557,979 7,924,187 8,137,608
GA0 District of Columbia Public Schools * 6,854,370 6,982,868 208,820 4,376,024 1,596,654
Grand Total $14,649,756 $17,016,996 $7,766,799 $12,300,211 $9,734,262
* Operating impacts for DCPS are applied indirectly, through the per student formula, and as such these impacts are shown separate from other agencies.
Table 5-5
Summary of Capital Estimated Operating Impacts for FY 2018-FY 2022
Table 5-6FTE Data by Agency
FY 2015 FY 2016 FY 2017Agency Actual Approved Plan
AM0 - Department of General Services 23.89 36.75 32.70
AT0 - Office of the Chief Financial Officer 1.51 0.00 26.00
BD0 - Office of Planning 1.19 0.00 0.00
CE0 - D.C. Public Library 2.97 6.00 5.00
CF0 - Department of Employment Services 0.00 0.00 11.00
GF0 - University of the District of Columbia 2.35 5.00 5.00
HA0 - Department of Parks and Recreation 0.33 3.00 2.00
HT0 - Department of Health Care Finance 2.51 0.00 0.00
JA0 - Department of Human Services 35.64 37.50 47.00
KA0 - Department of Transportation 285.70 368.14 334.14
KG0 - District Department of the Environment 0.56 0.00 0.00
RM0 - Department of Behavioral Health 1.50 0.00 0.00
TO0 - Office of the Chief Technology Officer 0.00 0.00 1.00
Total 358.14 456.39 463.84

FY 2017 Proposed Budget and Financial Plan FY 2017 - FY 2022 Capital Improvements Plan
5-9
Capital-Funded PositionsAgencies may receive approval to charge certain personnel expenses to capital projects. However, in order to
qualify and receive approval, the primary duties and responsibilities of a position charged to capital funds must be
directly related to a specific capital project. Full-Time Equivalent (FTE) positions that generally qualify are (a)
architects; (b) engineers; (c) cost estimators; (d) project managers; (e) system developers; (f) construction
managers; and (g) inspectors.
Table 5-6 reflects capital-funded FTE data for each agency for FY 2015 through FY 2017. Additional details
on the FY 2017 FTEs, including the specific number of FTEs approved by project, can be found on the project
pages in the “Project Description Forms” section of Volume 5. They are also summarized on the appropriate agency
pages, for those agencies that have approved FTEs.
Figure 5-3 shows the total number of capital-funded positions between FY 2008 and FY 2015, the approved
positions for FY 2016, and the planned positions in the CIP for FY 2017.
Table 5-7
Proposed Bond Borrowing, FY 2016 Through FY 2022(Dollars in thousands)
Plan Proposed Proposed Proposed Proposed Proposed Proposed
Source FY 2016 FY 2017 FY 2018 FY 2019 FY 2020 FY 2021 FY 2022
G.O./ I.T. bonds, general, including
capital fund deficit reduction $1,079,092 $925,132 $1,408,778 $666,316 $804,191 $539,172 $449,967
GARVEE Bonds $- $94,039 $150,000 $108,970 $- $- $-
Total $1,079,092 $1,019,171 $1,558,778 $775,286 $804,191 $539,172 $449,967
Notes: All amounts and methods of borrowing are subject to change depending on status of projects and market conditions.
Figure 5-3
Number of Capital-Funded FTE Positions From FY 2008 to FY 2017

FY 2017 - FY 2022 Capital Improvements Plan FY 2017 Proposed Budget and Financial Plan
5-10
Details on the District's Sources of Funds for Capital ExpendituresThe District's proposed FY 2017 - FY 2022 capital budget includes a number of funding sources. The District uses
the following sources to fund capital budget authority across a large number of agencies that have capital programs:
• G.O. or I.T bonds, including taxable, and short-term bonds;
• Paygo capital funding;
• Sale of assets;
• Federal Grants; and
• Private Grants.
In addition to the above sources, the District's Department of Transportation (DDOT) uses the following sources
to fund its capital projects:
• Federal Highway Administration grants, for Highway Trust Fund projects;
• Grant Anticipation Revenue Vehicle (GARVEE) bonds, which are repaid from future Federal funding;
• Dedicated motor fuel tax revenues and a portion of the Rights-of-Way Occupancy Fees for Highway Trust
Fund projects (these provide the local match for the Federal Highway Administration grants); and
• Local Transportation Fund (a portion of the Rights-of-Way Occupancy Fees, Public Inconvenience Fees, and
Utility Marking Fees).
Projects funded by these sources are detailed in the project description pages for DDOT and in Appendix H of
Volume 5.
Major Capital EffortsThe FY 2017 – FY 2022 Capital Improvements Plan (CIP) provides for major investments in the following areas:
• Transportation Infrastructure;
• Education;
• Public Health and Wellness;
• Economic Development;
• Fiscal Stability; and
• Public Safety.
Transportation Infrastructure
Metrorail and Metrobus. The continued growth and vitality of the city and region greatly relies on a safe, efficient,
and reliable Metro system to transport residents and visitors alike. The CIP includes $831 million for safety
improvements, improving the effectiveness of the current rail and bus networks, increasing system capacity, and
rebuilding the Metro system.
Streetcar, Circulator, and H Street Bridge. A retooled streetcar system and an expanded Circulator system will
add capacity to the District’s transportation network, provide links to activity centers that complement Metrorail
service, and offer a potentially cleaner and more sustainable transportation alternative. The CIP provides $575.7
million for Circulator and streetcars, giving priority to the H Street – Benning Road Metro Station streetcar segment
and replacement of the H Street Bridge. The H Street Bridge is an important link in the line that provides for rider
transfers to Amtrak’s Union Station and the Metrorail system, and it must be replaced. The CIP provides $160
million to support the cost of replacing the bridge.
South Capitol Street. The CIP includes $698.6 million for replacement of the Frederick Douglass Bridge over the
Anacostia River and improvements to the South Capitol Street Corridor. South Capitol Street will be transformed
from an expressway to an urban boulevard and gateway to the Monumental Core of the city that will support
economic development on both sides of the Anacostia River.

FY 2017 Proposed Budget and Financial Plan FY 2017 - FY 2022 Capital Improvements Plan
5-11
Streetscapes, Trails, and Green Space. The concept of park-like landscaping in the District’s public right-of-ways
dates back to surveyor Pierre L’Enfant, who outlined how to landscape his exceptionally wide avenues. The
District’s investment in streetscapes, trails, and green space will beautify the city, improve quality of life, and
complement investments in transit by providing safe and convenient bicycle and pedestrian access throughout the
city. The 6-year capital budget plans for $154.2 million of investment in sidewalks, trails, trees, green space, and
streetlights.
Local Streets and Alleys. The 6-year capital budget also plans for $350 million of investment in the District’s local
roadways, alleys, curbs, and sidewalks across the eight wards to ensure they are safe, reliable, and functional.
Consolidation of Public Works Facilities. The Department of Public Works (DPW) is designing a new facility to
consolidate fleet maintenance and storage of heavy equipment at DPW’s West Virginia Avenue compound to
enable the agency to consolidate operations at that location. The CIP includes $133.6 million for construction of
this facility.
Education
Public Schools Modernization. The District is currently undertaking a comprehensive schools modernization
initiative that began in 2008. So far, over $4 billion has been invested. This CIP commits to an additional
investment of $1.3 billion over the next six years for modernization of elementary, middle, and high school
facilities. The budget includes funding for three modernized middle schools and four modernized high schools.
21st Century Public Libraries. Continuing efforts to fully modernize the Martin Luther King Jr. Memorial Library,
the CIP includes $179 million that will be used to renovate and reconfigure this historic landmark. The result will
be a world-class central library offering residents and visitors a vibrant center of activity for reading, learning, and
community discussion. Libraries in District neighborhoods will receive an additional $61.8 million to renovate and
modernize Southeast Library, update I.T. systems including public access computers, and construct new
state-of-the-art facilities, including a new Lamond Riggs and Southwest Library.
University Facilities. The University of the District of Columbia is building a new student center and making
campus improvements that will enhance the collegiate experience for its students, faculty, staff, and guests. The
CIP provides $55 million of budget authority for University improvements.
Public Health and Wellness
Replacement of D.C. General Shelter. The CIP includes $20 million for the Department of Human Services to
continue acquisition of property and construct small scale emergency and temporary housing for families.
Access to Health and Human Support Services. The CIP includes $23.5 million to complete development of a
new, state-of-the-art information technology application designed to assist persons seeking assistance with health
and other human support services.
Parks and Recreation Facilities. Public parks and recreation facilities enhance the quality of life and wellness of
District residents. The District is committed to providing all residents of the District, and especially the District’s
youth, with access to quality recreation centers, athletic fields, swimming pools, tennis courts, play areas, and parks.
This 6-year capital budget plans for $170.3 million for investments in parks and recreation facilities across the city.
East End Medical Center. The District places a high priority on providing public health services to all District
residents. Since taking control of the operations of the Not-for-Profit Hospital Corporation, commonly referred to

FY 2017 - FY 2022 Capital Improvements Plan FY 2017 Proposed Budget and Financial Plan
5-12
as United Medical Center (“UMC”), in 2010, the District has invested millions of dollars in the District’s only acute
care hospital on the city’s East End. The CIP includes $98.7 million for additional improvements to continue the
repositioning of the hospital in the marketplace.
Anacostia River Clean-Up. The Anacostia River, once a pristine river, is now degraded mainly because of its
highly urbanized location. The river and adjacent former Kenilworth landfill are the focus of large-scale restoration
efforts by the District of Columbia. The District’s goal is to restore the Anacostia to a fishable and swimmable river
by the year 2032. The $66.4 million of capital budget for hazardous material remediation on the Anacostia River
and its shoreline will fund continued efforts to achieve this goal.
Economic Development
New Communities. The CIP provides $53.5 million of budget that will be used to replace severely distressed
housing and decrease concentrations of poverty by redeveloping public housing properties into mixed-use,
mixed-income communities for current and future residents.
McMillan Redevelopment. The 25-acre former McMillan Reservoir Sand Filtration Plant site will be redeveloped
into a mixed-use project that will include historic preservation, open space, residential, retail, office, and hotel uses.
The goal is to create an architecturally distinct, vibrant, mixed-use development that provides housing,
employment, retail, cultural, and recreational opportunities for District residents. The project will include affordable
and workforce housing, and 35 percent of the local contracting opportunities must go to Certified Business
Enterprises. The CIP provides $48.9 million for site infrastructure over the next three fiscal years.
Walter Reed, Saint Elizabeths, and Hill East. These three critical redevelopment projects are funded in the CIP to
continue investments in site infrastructure totaling $78.6 million.
Fiscal Stability
Financial System Modernization. The Office of the Chief Financial Officer is in the process of modernizing its
tax system to add the functionality found in modern systems, support real-time financial management, provide
greater integration with other District IT systems, and increase tax compliance and collections. The CIP includes
$17 million for modernization of the integrated tax system.
Public Safety
Emergency Vehicles. Older emergency vehicles must be replaced on a regular basis to ensure that responders have
reliable equipment. The CIP provides $83.3 million for purchase of pumpers, ladder trucks, heavy rescue trucks,
ambulances, and large support vehicles. An additional $32.5 million is provided for replacement of police cruisers
and specialty/support vehicles.
Power Line Undergrounding. The CIP includes $39 million to move key overhead power lines to underground
lines in the District to improve safety and reliability of the District’s electrical system. Placing select power feeders
underground will result in a reduction in the frequency and the duration of power outages experienced in affected
service areas.

FY 2017 Proposed Budget and Financial Plan FY 2017 - FY 2022 Capital Improvements Plan
5-13
Fund Balance of the Capital Fund From FY 2008 through FY 2015, the District's Comprehensive Annual Financial Report (CAFR) showed a deficit
for 2 years in the General Capital Improvements Fund (the "capital fund") (see Table 5-8). The shortfall at the end
of FY 2012 and again in FY 2014 meant that capital expenditures had exceeded financing sources by that amount
on a cumulative basis. The timing and amounts of borrowing for those two years resulted in the temporary negative
fund balance. The District's General Fund had advanced funds to the capital fund to cover the expenditures.
The FY 2015 CAFR reports a General Capital Improvements Fund surplus of $36 million. This represents an
increase of $150 million over the FY 2014 negative ending fund balance of $114 million. This turnaround is due
primarily to the difference in timing of revenues and expenditures in the Fund. The balance as of the end of FY
2015 is representative of the activity in the fund as of that date. For FY 2015 budget allotments, an additional
borrowing of $527.1 million is planned for the spring of 2016.
The District must still keep a close watch on the underlying status of the capital fund. The long-term solution
to the capital fund shortfall includes development of, and monitoring against, agency spending plans for their
capital projects that manage each year’s overall expenditures against that year’s revenues. In past years, the District
borrowed amounts above new capital budget allotments, to help repay the General Fund for advances it made to
the capital fund. This additional borrowing took place in amounts of either $25 million or $50 million annually, for
a total of $300 million, for several years, ending in FY 2013. Planned borrowing exceeds allotments by $10 million
in FY 2017, $12 million in FY 2019, and $20 million in FY 2020.
Table 5-8
Fund Balance in the General Capital Improvements Fund, FY 2008-FY 2015(Dollars in millions)
Positive/(Negative)
Fiscal Year Fund Balance
2008 586.9
2009 406.9
2010 133.4
2011 5.0
2012 (116.3)
2013 102.4
2014 (114.2)
2015 35.8

Appendices


Appendix A:
D.C. Comprehensive FinancialManagementPolicy


FY 2017 Proposed Budget and Financial Plan D.C. Comprehensive Financial Management Policy
Appendix A-1
IntroductionIn accordance with requirements set forth in the District of Columbia Home Rule Act, approved December
24, 1973 (Pub. L. No. 93-198; 87 Stat. 774; D.C. Official Code §§1-201.01 et seq.) (Home Rule Act), this
Comprehensive Financial Management Policy provides a framework for fiscal decision-making for the Office
of the Chief Financial Officer (OCFO) and the Government of the District of Columbia (“District government”
or “District”). The intent of this document is to establish policies that ensure the availability of financial
resources to meet the present and future needs of the citizens of the District of Columbia. This document
establishes the District government’s policies in the following areas:
• Debt Management
• Financial Asset Management
• Capital Asset Management
• Reserve Management
• Fiscal Management
• Economic Development
These financial management policies were established by the OCFO subject to continuing review and
comment by the Mayor of the District of Columbia (Mayor) and the Council of the District of Columbia. The
OCFO will consider amendments to this document on a continuing basis using the established review and
approval process.
Debt Management Policy
Responsibility and AuthorizationThe District government will maintain, at all times, debt management policies that are fiscally prudent, are
consistent with District and federal laws, and reflect the District’s unique municipal status and limitations.
Collectively, Title IV Part E of the Home Rule Act and the Income Tax Secured Bond Authorization Act
authorize the District to issue bonds, to provide for the payment of undertaking capital projects, and notes, to
pay general governmental expenses in anticipation of the collection or receipt of revenues.
Credit RatingsThe District will do everything in its power to attain and maintain the highest possible credit ratings for its out-
standing bonds, including producing balanced budgets and financial statements with “clean” audit opinions
annually, implementing and maintaining sound financial and debt management policies and practices, and
maintaining regular communications with the major rating agencies.
Appendix A
District of Columbia
Comprehensive Financial ManagementPolicy

D.C. Comprehensive Financial Management Policy FY 2017 Proposed Budget and Financial Plan
Appendix A-2
Long-Term Debt CapacityThe District will stay within its statutorily mandated debt limits: (a) total debt service on long-term tax
supported debt in any fiscal year cannot exceed 17 percent of General Fund revenue, and (b) total debt service
on long-term tax supported debt in any fiscal year, or the five succeeding fiscal years as reflected in the
financial plan and capital improvements plan, cannot exceed 12 percent of General Fund expenditures. Also,
the District will maintain other debt ratios and practices that are prudent in light of industry standards, rating
agencies’ benchmarks and the District’s long-term financial health. The District will seek to balance the need
for improvements to its capital infrastructure with the need to maintain reasonable debt ratios and debt service
expense levels.
Timing and Amount of Long-Term BorrowingWhen the District engages in annual long-term borrowing for its capital projects, it shall do so in amounts that
are planned and reasonably expected to be spent up to two years after the date of such borrowing. Such
borrowing amounts will be determined in the context of an ongoing effort to balance the need for continuing
development and refurbishment of the District’s infrastructure with the need to prudently manage the District’s
debt obligations.
Method of Bond SaleThe District shall monitor and evaluate market conditions in consideration of the respective credit, prior to
coming to market, to determine which method of sale, competitive or negotiated, is optimal for issuance.
Determination will be made by the OCFO, supported by a recommendation of the Treasurer, to proceed with
the sale method that is likely to yield a more favorable result for the District.
Composition of Debt PortfolioThe District shall issue general obligation bonds, income tax secured bonds, or tax-supported revenue bonds,
depending on a determination by the Chief Financial Officer (CFO) regarding the type of bond issuance that
is most favorable for the District. The District shall issue tax-exempt bonds, except under circumstances in
which the nature of the project(s) being financed (or some portion thereof) require the issuance of taxable
bonds, or circumstances in which taxable bonds are deemed to provide a more favorable result (for example,
the issuance of Build America Bonds pursuant to the American Recovery and Reinvestment Act). The District
shall issue fixed-rate or variable-rate debt; however, not more than 20 percent of outstanding debt may be
variable-rate bonds. This policy allows the District to take advantage of the generally lower interest rates
associated with variable-rate debt without over-exposing itself to higher levels of risk associated with such
debt. In addition, with every issuance of debt, the District shall evaluate whether or not it is financially
beneficial to issue the debt with bond insurance or some other form of credit enhancement, and shall structure
the issuance accordingly. The District will regularly examine its financing structures and the financial market-
place to determine what form of debt is most beneficial to issue (e.g. income tax secured revenue bonds,
general obligation bonds, other revenue bonds, or master lease/purchase financing) to fund certain govern-
mental projects.
Timely Debt Service PaymentsThe District shall escrow funds received from its Special Real Property Tax levy in amounts sufficient to
ensure timely payment of all principal and interest due on its outstanding general obligation bonds, and shall
set aside income tax revenues in amounts sufficient to ensure timely payment of all principal and interest due
on its outstanding income tax secured revenue bonds, as required by the relevant debt statutes, bond
indentures, and covenants.
Compliance with Arbitrage RegulationsThe District shall contract with a reputable firm to perform annual analyses of the District’s investment and
expenditure of bond proceeds in order to ensure compliance with federal arbitrage regulations.
FY 2017 Proposed Budget and Financial Plan D.C. Comprehensive Financial Management Policy
Appendix A-3
Refunding of Outstanding DebtThe District will regularly monitor its outstanding debt for optimal opportunities and timing to refund
(refinance) such debt at lower interest rates to produce debt service savings to the District, to remove or change
outdated or unwanted bond covenants, or for other reasons that may benefit the District.
Selection of Financial Consultants and Service ProvidersTo assist with issuing bonds in the most efficient and effective manner, and to ensure compliance with all
applicable legal requirements, the District shall select Bond Counsel, Disclosure Counsel, and Financial
Advisors, and generally does so on a competitive basis through a Request for Proposals (RFP) process.
However, this process does not preclude the District from engaging Bond Counsel, Disclosure Counsel, or
Financial Advisors without the competitive process where a unique or emergency situation warrants such
engagement as permitted by law. The District will document such situations in writing.
Equipment Financing ProgramThe District currently maintains a program to finance (on a tax-exempt basis) the acquisition of agency
capital equipment with estimated useful lives of five to ten years. This program is part of the District’s policy
of seeking to match the useful lives of its capital assets with the duration of the debt that finances such assets,
identifying competitive cost of financing, as well as managing agency operating costs associated with
equipment lease financing. The District may decide to end this program if the CFO determines it is no longer
in the best interest of the District.
Independent Agency/Instrumentality Debt IssuanceThe CFO shall determine whether or not it is advisable for certain independent agencies/instrumentalities of
the District that have segregated revenue streams to pursue issuing bonds supported by such revenue streams.
If the CFO determines that such a transaction is advisable, the CFO shall, through the Mayor, submit a
written request to the District Council for enactment of the necessary authorizing legislation. The CFO must
approve the ultimate structure of any such transaction, and must approve the transaction itself. In the event of
such a financing, the independent agency/instrumentality shall provide pertinent information and documents
to the CFO related to such financing (including the project or program financed) on an ongoing basis and upon
request.
Short-Term BorrowingThe District’s policy is to issue short-term debt in the form of Tax Revenue Anticipation Notes (TRANs) to
finance any intra-year seasonal cash flow needs. TRANs must be repaid by the end of the fiscal year in which
they are issued. A long-term policy goal is for the District to obtain and maintain sufficient operating cash
balances in order to minimize or eliminate the need for short-term borrowing.
The District may utilize additional short-term financing vehicles including Bond Anticipation Notes,
Commercial Paper, and others to meet interim capital funding needs. Bond Anticipation Notes and
Commercial Paper may be rolled or redeemed with the issuance of long-term debt.
Financial Asset Management Policy
Authorization and ResponsibilityThe CFO, established by the District of Columbia Financial Responsibility and Management Assistance Act
of 1995, approved April 17, 1995 (Pub.L. No. 104-8, §302(a), 109 Stat 142, D.C. Official Code §1-204.24a),
is responsible for maintaining custody of all public funds belonging to or under the control of the District
government and depositing all amounts paid in such depositories and under such terms and conditions as may
be designated by the District Council pursuant to Section 424 of the Home Rule Act. Except where prescribed
by law, the CFO has delegated this responsibility to the Treasurer of the District of Columbia (Treasurer).

D.C. Comprehensive Financial Management Policy FY 2017 Proposed Budget and Financial Plan
Appendix A-4
The Treasurer, on behalf of the CFO, actually maintains custody of all public funds belonging to or under
the control of the District government, or its agencies, and deposits all funds in depositories pursuant to
D.C. Official Code §1-204.24d(11). The Treasurer is responsible for the administration and supervision of the
Office of Finance and Treasury (OFT), which includes the responsibility for the collection and deposit of all
receipts. The Treasurer shall also specify operational procedures and standards to be used for all depository
intake facilities.
Deposit of Cash Receipts Policy
All District government agencies and instrumentalities, including component units, boards, commissions and
other public entities, are subject to D.C. Official Code §§47-351 et seq. and shall deposit all cash, checks and
other negotiable instruments received within two business days after collection or receipt of such monies.
Items deposited pursuant to D.C. Official Code §§47-351 et seq. shall be properly posted in the District’s
accounting system of record within two business days of receipt. If cash needs to be collected by an agency,
OFT cashiers must either collect the actual cash or have oversight of the collection process.
Background: The timely deposit of monies received provides several benefits. The most important benefit is
effective and efficient control of these funds, which reduces the risk of loss due to errors, carelessness or theft.
In addition, the timely deposit of funds helps to maximize cash flow for interest earnings; lowers borrowing
needs, and lessens the risk of returned checks due to non-sufficient funds or account closure. It also provides
a responsive service to the payers who would otherwise be uncertain whether their checks were received.
Disbursement of Public Funds PolicyAll disbursements from District depository accounts shall be made by check, electronic transfer or pay cards.
All District agencies shall comply with the OCFO’s Financial Management and Control Orders No. 08-008
and No. 07-004A*, which establish guidelines of authority, indicate required documentation, and require
expediency in the processing of payment vouchers. All District agencies and employees shall comply with the
OCFO’s Financial Management and Control Order No. 12-24, which governs the establishment, control and
maintenance of bank accounts, checks and signature authority to prevent fraud, abuse or other irregularities.
Likewise, all District agencies shall also comply with the provisions in the District’s Quick Payment Act,
which ensures the timely payment of public funds to vendors, suppliers, and contractors.
Background: OFT recognizes the financial risks associated with the issuance of checks. The prevalence of
check fraud demands that the District take measures to safeguard the District’s funds, including the use of a
single state check design. Checks issued by the District government use a controlled paper stock with
numerous security features and a background design that makes all District government checks easily
recognizable as official, legal payment instruments of the District government. In addition, the District uses
banking services and policies that prevent fraud by requiring that the District’s banking institutions only honor
checks that the District has previously identified as being validly issued. To further reduce costs and risks, the
District has and will continue to reduce its use of checks as a predominant means of disbursement.
Collateralization PolicyIt is the policy of OFT to ensure that at all times the District’s funds held at financial institutions are fully
federally insured or, at a minimum, collateralized at 102 percent in compliance with the Financial Institution
Deposit and Investment Amendment Act of 1997, effective March 18, 1998 (D.C. Law 12-56, D.C. Official
Code §47-351 et seq.) (the Deposit Act). The responsibility for monitoring financial institutions’ compliance
with the District’s collateral requirements on a daily basis is delegated to the Banking Services Unit in OFT.

FY 2017 Proposed Budget and Financial Plan D.C. Comprehensive Financial Management Policy
Appendix A-5
Banking Services PolicyIt is the policy of the District government to procure banking services and establish bank accounts pursuant to
competitive award practices consistent with the Deposit Act and the OCFO’s standard contracting processes.
OFT shall routinely monitor bank performance using predetermined performance standards and assess
penalties for failure to perform. Bank accounts shall only be opened by OFT. Agencies cannot open bank
accounts independently.
Electronic Benefit Transfer (EBT) Payment PolicyOFT, in conjunction with the Department of Human Services, shall administer the District’s Electronic Benefit
Transfer (EBT) Program in compliance with the Personal Responsibility and Work Opportunity
Reconciliation Act of 1996, approved August 6, 1996 (Pub. L. No. 104-193; 110 Stat. 2105) (Welfare Reform
Act) and provide necessary training to eligible District of Columbia residents who participate in the EBT
Program.
Background: The Welfare Reform Act of 1996 mandated that all states and the District of Columbia
establish an electronic delivery system for the distribution of food stamp benefits (Supplemental Nutrition
Assistance Program, or SNAP) by October 2002. As a result, the District’s EBT system was implemented in
1998. The system electronically delivers both SNAP and cash assistance (Temporary Assistance for Needy
Families, or TANF) benefits to District recipients. EBT is a special application of electronic funds transfer
(EFT) technology, which allows both TANF and SNAP benefits to be loaded directly to a pay card
eliminating the former costly and cumbersome processes surrounding paper food stamps and check writing.
Also, it provides access to mainstream payment methods for District citizens, provides food retailers with
point-of-sale methods of accepting SNAP payments, enhances methods used to account for SNAP benefits,
and facilitates more efficient payments to individual merchants with funds from the U.S. Department of
Agriculture.
Internal Control Policy Related to Financial AssetsThe District government shall maintain sound internal control policies and practices to ensure: (a) compliance
with applicable laws, guidelines, regulations, and professional standards; and (b) adequate safeguarding of
cash under the control of agencies, component units, boards and commissions. Therefore, agencies must
adhere to the following policies and prescribed practices:
• Employees who handle cash, checks, credit cards, pay cards or any other negotiable instruments should be
bonded as a condition of employment and should not record the related transactions in the general ledger
nor maintain accounting records;
• Cash shall not be accepted or received directly by any District agencies except OFT. Exceptions to this
policy must be approved in advance and oversight provided by OFT;
• Check payments received shall be restrictively endorsed payable to the D.C. Treasurer, not to an agency or
a District employee;
• Cash receipts shall be reconciled daily and discrepancies shall be investigated promptly by the designated
authorized personnel;
• Access to cash shall be restricted to OFT cashiers and secured when not in use; and
• Any site that secures cash, checks, pay cards or other negotiable financial instruments shall maintain them
securely in a vault under dual control for access or removal. Dual control requires two people to cooper-
ate in maintaining and confirming assets, with the work of one employee being verified or approved by a
second employee. Both are equally accountable for the protection of asset.

D.C. Comprehensive Financial Management Policy FY 2017 Proposed Budget and Financial Plan
Appendix A-6
Investment PrioritiesThe District will invest cash not needed for immediate disbursement in a manner consistent with applicable
District law and policy, and in doing so will: (a) provide for the safekeeping of principal amounts invested, (b)
maintain adequate liquidity to fund the District’s operations and other funding needs, and (c) maximize
earnings on invested funds, in that order of priority. The maximization of earnings will be accomplished by
analyzing up-to-date cash flow projections documenting the amounts and timing of the District’s operating
cash needs over the course of a given fiscal year, as well as the general investment environment and the
respective earnings (interest) rates available to the District from the various permissible investment
instruments. Based on these factors, the appropriate investment decision will be made.
Investment of Operating Cash Balances
Each business day, using same-day data from banks (check/ACH/wire clearings), OFT will determine if the
District has excess cash on hand for that particular day and factor in a cushion for unexpected disbursements. Any
excess cash will be invested in one or more of the permissible investment instruments in accordance with the
policy described in the “Investment Priorities” section above.
Investment of Additional Bank Account BalancesThe District government will strive to ensure that no cash balances sit idle without being invested. The
majority of the District’s operating bank accounts are structured such that all funds not utilized in collection or
disbursement accounts at the end of a given day will be consolidated to the pooled cash account and invested
or will be used to generate credit to offset bank fees.
Investment of Bond Escrow and Note Escrow FundsThe District government will invest bond escrow and note escrow balances (funds set aside for the payment
of principal and/or interest on outstanding District bonds or notes) in accordance with the same general
policy guidelines described in the “Investment Priorities” section above, except that the maximum duration of
such investments (the liquidity aspect referenced above) will be determined by the principal and/or interest
payment due dates on the bonds or notes as opposed to operating cash flow projections as well as any other
requirements contained in the respective bond or note documents.
Investment of Bond and Note ProceedsProceeds from the sale of District bonds and notes shall be invested in allowable investments in accordance
with applicable federal and District laws, stipulations in the respective bond or note documents as to how such
funds are to be invested, federal arbitrage regulations regarding the investment of bond and note proceeds (both
of which may be more restrictive than District law), and pre-determined payout schedules (or estimates) for
such proceeds (based on the purpose and manner of use of such funds).
Investment of Debt Service Reserve FundsDebt service reserve funds established either from the proceeds from the sale of District bonds and notes or
other sources shall be invested in allowable investments in accordance with applicable federal and District
laws, stipulations in the respective bond or note documents as to how such funds are to be invested, federal
arbitrage regulations regarding the investment of bond and note proceeds (both of which may be more
restrictive than District law), and pre-determined payout schedules (or estimates) for such proceeds (based on
the purpose and manner of use of such Funds) as well as any other requirements contained in the respective
bond or note documents.
Investment of Bond and Note Related AccountsInvestment of bond and note related accounts shall be invested in allowable investments in accordance with
applicable federal and District laws, stipulations in the respective bond or note documents as to how such funds
FY 2017 Proposed Budget and Financial Plan D.C. Comprehensive Financial Management Policy
Appendix A-7
are to be invested, federal arbitrage regulations regarding the investment of bond and note proceeds (both of
which may be more restrictive than District law), and pre-determined payout schedules (or estimates) for such
proceeds (based on the purpose and manner of use of such Funds), as well as any other requirements contained
in the respective bond or note documents.
Investment of Statutory Reserve FundsInvestment of statutory reserve funds (see Reserve Management Policy section) of the District shall be
invested in permitted investments in accordance with District law and policy.
Limits on Placement of Funds In accordance with applicable law, the District will not deposit/invest more than 25 percent of its funds on hand
with any one financial institution, and will not deposit/invest an amount with any one financial institution that
amounts to more than 25 percent of the assets of such institution.
Capital Asset Management Policy
Policy for Defining Capital AssetsCapital assets are long-lived items that provide a benefit for a number of future periods. They are either
classified as “capitalized assets,” subject to the District’s standard depreciation rules, or “controllable
property,” which are neither capitalized nor depreciated for financial reporting purposes. Proper accounting for
capital assets requires the capitalization of appropriate expenditures for each of the following asset categories:
• Land - non-expendable, real property, for which title is held by the District;
• Land Improvements - including the cost of permanent attachments, other than buildings, which add value
to land;
• Buildings - all real estate, excluding land and land improvements, used for shelter, dwelling, and other
similar purpose;
• Leasehold Improvements (Real Property) – permanent improvements or betterments that increases the
useful lives of the leased property;
• Equipment/Furniture/Vehicles - tangible personal property that is: a) complete in itself; b) does not lose
identity or become a component of the building where it resides; c) of a durable nature with an expected
service life of three or more years;
• Intangible Assets – assets that lack physical substance, are nonfinancial in nature, and have an initial
useful life extending beyond a single reporting period, including, for example, easements, water rights,
patents, trademarks, and computer software;
• Construction-in-Progress (CIP) - includes the costs incurred when constructing long-lived assets
(e.g., buildings and other improvements); CIP represents the costs associated with incomplete projects; and
• Infrastructure Assets - long-lived capital assets that normally can be preserved for a significantly greater
number of years than most capital assets and that are normally stationary in nature. Examples of
infrastructure assets include roads, sidewalks, bridges, tunnels, drainage systems, water and sewer systems,
dams, street lighting systems and transit subway systems.
General Capital Asset PolicyCapital assets must be properly authorized, classified, valued and adequately safeguarded. Physical and
accounting control policies and procedures established by the Office of Financial Operations and Systems
(OFOS) must be followed by each agency. Each agency must implement the following policies.
• All capital assets that have been capitalized or are a part of controllable inventory shall be included on the
agency’s capital asset listing;

D.C. Comprehensive Financial Management Policy FY 2017 Proposed Budget and Financial Plan
Appendix A-8
• All capitalized or controllable assets shall be reported in the Fixed Assets Subsystem (FAS) of the System
of Accounting and Reporting (SOAR) maintained by OFOS;
• Each agency shall designate an individual who will be responsible for accounting for capital assets and
ensuring that all divisions within the agency comply with District requirements;
• All agencies shall adhere to the capitalization and controllable inventory policies and procedures
established by OFOS;
• All acquisitions and disposals of capital assets shall be properly authorized by applicable laws and
approved by the agency director or designee. In addition to the agency director, some acquisitions and
disposals may require the approval of the appropriate regulating bodies; and
• All agencies shall maintain documentation related to the acquisition, use, and disposal of capital assets.
Such documentation is to be retained throughout the life of each capital asset and for a specified period of
time after disposal, consistent with the OCFO’s and the District’s records retention policies. Where bond
proceeds are used to acquire or improve the property, all agencies shall work with the Mayor and the
OCFO to ensure that the acquisition, use, transfer or disposition of the property is in compliance with the
applicable laws.
Capitalization Policy• All land, land improvements and building additions must be capitalized regardless of cost;
• Capital improvements shall be capitalized if the total project cost is $5,000 or more, and the improvements
increase the utility of the asset or significantly extend its useful life by two years or more. Expenditures
for improvements that do not increase the service utility of the asset or significantly extend its life should
be classified as repairs and maintenance and not capitalized;
• Furniture, vehicles, and equipment shall be capitalized if the aggregate cost is $5,000 or more and the
useful life of the asset is three years or greater. Costs pertaining to computers include amounts incurred
for monitors, cables, battery packs or any additional accessories needed for the equipment to function.
Capitalizable computer costs do not include printers because printing functions can be spooled to a central
printer, allowing several computers to utilize it;
• Computer software system costs shall be capitalized if the total cost including purchase, installation, and
testing is $5,000 or more. Training that is directly related to installation and testing should be capitalized.
The cost of training after the system has been placed in service should be expensed as incurred. Upgrades
and enhancements should only be capitalized if such costs significantly increase the life or functionality of
the system by two years or more;
• Computer hardware system costs shall be capitalized if the total cost including acquisition, installation, and
testing is $5,000 or more. The cost of each component of a computer hardware system should be initially
recorded as controllable inventory in the FAS. When the hardware system is ready for its intended use, the
inventoried costs should be grouped and capitalized as one unit of property in the FAS. Upgrades and
enhancements should only be capitalized if such costs significantly increase the life or functionality of the
system by two years or more;
• Betterments shall be capitalized if the cost is $5,000 or more and the addition made to the capital asset is
expected to prolong its life or increase its efficiency over and above that resulting from repairs or
maintenance. The cost of the betterment is added to the book value of the asset. Betterments do not include
building improvements. Betterments that cost less than $5,000 should be classified as expenses and
charged against the operating budget;
• Equipment with a unit cost of less than $5,000 shall be identified as controllable equipment of the agency.
The minimum unit cost level required to be identified as controllable equipment of the agency is $1,000,
except certain items. Equipment below $1,000 may be tagged with a property identification number and
recorded on a supplementary listing for stewardship and sensitivity reasons; and
• Agencies may account for and record items under $5,000 in the FAS. Agencies shall record and maintain
a supplementary listing internally on the agency FAS or in the OFOS FAS for those items that are between

FY 2017 Proposed Budget and Financial Plan D.C. Comprehensive Financial Management Policy
Appendix A-9
$1,000 and $5,000. The agency shall also maintain records for items less than $1,000 that are considered
sensitive or at high risk of theft, such as weapons, computer components, and cellular equipment.
Controllable Property PolicyControllable property is non-capitalized tangible property that is considered valuable and/or sensitive with a
high risk of theft with a value of less than $5,000 and/or with an expected life of less than three years. Similar
to capitalized property, controllable property is subject to the requirements of this Comprehensive Financial
Management Policy regarding security, stewardship, maintenance, and utilization. These assets shall be
excluded from depreciation calculations and financial reports. They shall, however, appear on other
management information reports and capital assets records. Persons provided with controllable property (e.g.,
cellular telephones, iPads and laptop computers) for their direct official use shall be held responsible and liable
for the asset(s) assigned to them. Such assets shall be returned to the agency whenever an individual’s
employment with the agency terminates.
Physical Inventory PolicyTo ensure that personal property capital assets are properly safeguarded and accounted for, the OFOS shall
conduct a physical inventory of personal property capital assets on a biennial basis. The inventory shall be
conducted based upon the assets listed in the FAS as of a given date. Each agency shall be responsible for
making sure that the proper personnel are available to guide the inventory contractor to the location of the
assets. The physical inventory shall be properly managed and supervised by the individual who is
responsible for the agency’s property management function to ensure that the inventory process is effective
and efficient. OFOS shall oversee reconciliations and adjustments to the detailed accounting records
resulting from the physical inventory.
Acquisition PolicyCapital assets shall be initially recorded at historical cost, which is defined as the cash or cash equivalent cost
of obtaining the asset and bringing it to the location and condition necessary for its intended use. Donated
assets shall be recorded at fair market value at the date of acquisition, generally defined as “consideration given
or consideration received, whichever is more clearly determinable.” Construction-in-progress represents
capitalization of labor, material, and overhead costs of a capital project. When the project is completed, costs
in the construction-in-progress balance sheet account shall be reclassified to one or more of the property and
equipment accounts.
Valuation Policy
The most desired method of valuation is original cost (historical). Such data can be determined by retrieving origi-
nal invoices, purchase orders, check copies, contracts, minutes, or auditor’s work papers. However, if the original
cost cannot be established, estimated historical cost data may be used.
Document Retention PolicyDocuments related to the acquisition, use, and disposal of capital assets shall be retained throughout the life of
the capital asset and for a minimum of three fiscal years following the disposal of the capital asset, or as
required by applicable laws and regulations.
Depreciation PolicyThe FAS automatically calculates and posts depreciation for capital assets. Depreciation expense shall be
calculated using the straight-line method based on the useful life of the capital assets.
Property Control Policy Each agency fiscal officer (or designee) shall identify an individual who will be responsible for accounting for

D.C. Comprehensive Financial Management Policy FY 2017 Proposed Budget and Financial Plan
Appendix A-10
capital assets and ensure that all divisions within the agency comply with the District’s accounting and
inventory policy.
Disposal PolicyAll disposals of capital assets shall be properly authorized by applicable laws and approved by the agency
director or designee. In addition to the agency director, appropriate regulatory bodies shall approve some
disposals. All proceeds from the sale of District government property shall be dedicated for use by the
government for the construction and rehabilitation of its facilities, unless the District Council approves an
exception. Where bond proceeds are used to acquire or improve the property, all agencies shall work with the
Mayor and the OCFO to ensure that the disposition of the property is in compliance with the applicable laws.
Reserve Management Policy
Emergency Reserve Fund ManagementIt is the policy of the District government to comply with D.C. Official Code §1-204.50a for the establishment,
deposit, maintenance, use and replenishment of the District of Columbia’s Emergency Reserve Fund. Any
modifications to these requirements shall be implemented when the law changes and reflected in the policy.
The Emergency Reserve Fund may only be used for unanticipated and nonrecurring extraordinary needs
of an emergency nature, including a natural disaster or calamity as defined by section 102 of the
Robert T. Stafford Disaster Relief and Emergency Assistance Act (Pub. L. 100-707, effective November 23,
1988) or unexpected liability created by Federal Law. The Fund may not be used to fund any department,
agency, or office of the District government administered by a receiver or other official appointed by a court,
shortfalls in any projected reductions included in the budget proposed by the District government for the
fiscal year, or settlements and judgments made by or against the District of Columbia government. Funds may
only be allocated after an analysis has been prepared by the CFO, and only after a projection by the CFO that
the entire Contingency Reserve Fund (see next section) will be completely exhausted at the time of the
allocation. Interest earned on the Emergency Reserve Fund shall remain in the account for permitted uses
pursuant to D.C. Official Code §1-204.50a.
For purposes of cash flow management, the CFO or his/her designee may borrow from the Emergency
Reserve Fund as long as the terms of D.C. Official Code §1-204.50a are adhered to.
The District shall budget and deposit sufficient funds in each fiscal year to maintain or replenish the
Emergency Reserve Fund, as required by D.C. Official Code §1-204.50a, or move unassigned fund balance
into the Fund as needed. Replenishment of an allocation may also be made within the same fiscal year through
a reprogramming of budget authority or a supplemental appropriation.
The District government will invest Emergency Reserve Fund account balances in accordance with the
same general policy guidelines described in the “Investment Priorities” section above.
Background: The District is required to maintain an Emergency Reserve Fund equaling a minimum of 2
percent of the qualified operating expenditures based on the applicable Comprehensive Annual Financial
Report (CAFR) pursuant to D.C. Official Code §1-204.50a.
Contingency Reserve Fund ManagementIt is the policy of the District of Columbia to comply with D.C. Official Code §1-204.50a for the
establishment, deposit, maintenance, use and replenishment of the District of Columbia’s Contingency
Reserve Fund. Any modifications to these requirements shall be implemented when the law changes and
reflected in the Policy.
The Contingency Reserve Fund may be used only for nonrecurring or unforeseen needs that arise during
a fiscal year, including expenses associated with unforeseen weather or other natural disasters, unexpected

FY 2017 Proposed Budget and Financial Plan D.C. Comprehensive Financial Management Policy
Appendix A-11
obligations created by Federal law or new public safety or health needs or requirements that have been
identified after the budget process has occurred, or opportunities to achieve cost savings. The Fund may also
be used, if needed, to cover revenue shortfalls experienced by the District government for three consecutive
months (based on a two-month rolling average) that are 5 percent or more below the budget forecast. The
Contingency Reserve Fund may not be used to fund any shortfalls in any projected reductions that are
included in the budget proposed by the District government for the fiscal year. Funds may only be allocated
after an analysis has been prepared by the CFO and all other surplus funds available to the District have been
completely exhausted. Interest earned on the Contingency Reserve Fund shall remain in the account for
permitted uses pursuant to D.C. Official Code §1-204.50a.
For purposes of cash flow management, the CFO or his/her designee may borrow from the Contingency
Reserve Fund as long as the terms of D.C. Official Code §1-204.50a are adhered to.
The District shall budget and deposit sufficient funds in each fiscal year to maintain or replenish the
Contingency Reserve Fund as required by D.C. Official Code §1-204.50a or move unassigned fund balance
into the Fund as needed. Replenishment of an allocation may also be made within the same fiscal year through
a reprogramming of budget authority or a supplemental appropriation.
The District government will invest Contingency Reserve Fund account balances in accordance with the
same general policy guidelines described in the “Investment Priorities” section above.
Background: The District is required to maintain a Contingency Reserve Fund equaling a minimum of 4
percent of the qualified operating expenditures based on the applicable CAFR pursuant to D.C. Official Code
§1-204.50a.
Fiscal Stabilization Reserve and Cash Flow Reserve FundsIt is the policy of the District government to comply with current requirements for building and maintaining
the District of Columbia’s Fiscal Stabilization and Cash Flow Reserve Funds as defined by D.C. Official Code
§47-392.02. Any modifications to these requirements shall be implemented when the law changes and shall
be reflected in the Policy.
The District government will invest fiscal stabilization and cash flow reserve account balances in
accordance with the same general policy guidelines described in the “Investment Priorities” section above.
Background: The Fiscal Stabilization Reserve Fund may be used by the Mayor for certain purposes for which
the Contingency Reserve Fund may be used, as specified in section 450A(b)(4) of the Home Rule Act, D.C.
Official Code §1-204.50a(b)(4), as certified by the CFO, with approval of the Council by act. At full funding,
this reserve must equal 2.34 percent of the District’s General Fund operating expenditures for each fiscal year.
The Cash Flow Reserve may be used by the CFO or his/her designee to cover cash flow needs. When amounts
are used, the Cash Flow Reserve must be replenished in the same fiscal year of use. At full funding, this
reserve must equal 8.33 percent of the General Fund operating budget for each fiscal year.
If either the Fiscal Stabilization Reserve or the Cash Flow Reserve is below full funding upon issuance of
the CAFR, the CFO must commit 50 percent of the unassigned end-of-year fund balance to each reserve, or
100 percent of the end-of-year fund balance to the remaining reserve that has not reached full capacity, to fully
fund the reserves to the extent allowed by the end-of-year fund balance. Moreover, if the amount required for
the Contingency Reserve or Emergency Reserve is reduced, the amount required to be retained in the Fiscal
Stabilization Reserve is to be increased by the same amount.

D.C. Comprehensive Financial Management Policy FY 2017 Proposed Budget and Financial Plan
Appendix A-12
Fiscal Management Policy
Balanced BudgetPursuant to the Home Rule Act, the District shall both create and operate under a balanced budget throughout
the fiscal year. Proposed expenditures under the Mayor’s budget proposal to the Council, and the District’s
budget proposal to Congress, must be balanced within estimated revenues and other resources as certified by
the CFO (see Home Rule Act § 424(d)(5)(A); D.C. Code § 1-204.24d(5)(A)). During the year, if revenue
forecasts change (see “Revenues” below) such that an unbalanced budget would result, the budget must be
adjusted, following approved procedures, to re-attain balance.
A balanced budget for the District is comprised of budgets for each agency, which sum to a total that is
balanced within certified revenues. No agency may spend more than its budget (see “Anti-Deficiency Act”
below). As each agency spends within its budget, the District’s total spending cannot exceed its total budget,
thus assuring the District’s total spending does not exceed its revenues.
RevenuesThe District shall strive to maintain a balanced and diversified revenue system to protect against adverse
fluctuations in any one source of revenue, which may result from changes in local and/or national economic
conditions.
Quarterly Revenue Adjustments: The OCFO shall make revised quarterly adjustments to the revenue
estimated for the year in progress, as required by law (D.C. Official Code §1-204.24d(5)(B)). These
adjustments, as certified by the CFO, will be submitted to the Mayor and the District Council. They shall serve
as the basis for determining whether revenues are in balance with anticipated expenditures. In addition, the
CFO’s certified revenue estimates shall be used as the basis for any request for supplemental appropriations
submitted to the U.S. Congress that would increase the total amount of General Fund revenue appropriated to
the District.
General Fund BalanceIn FY 2011, the District implemented Governmental Accounting Standards Board (GASB) Statement No. 54,
Fund Balance Reporting and Governmental Fund Type Definitions. Consistent with the requirements of that
Statement, the District’s General Fund balance is comprised of five components: nonspendable, restricted,
committed, assigned, and unassigned, which are described more fully below.
• Nonspendable – resources which cannot be spent because they are either: (a) not in spendable form; or
(b) legally or contractually required to be maintained intact.
• Restricted – resources with use constraints which are either: (a) externally imposed by creditors (such as
through debt covenants), grantors, contributors, or laws or regulations of other governments; or (b)
imposed by law through constitutional provisions or enabling legislation.
• Committed – resources which can only be used for specific purposes pursuant to limitations imposed by
formal action of the District government’s highest level of decision-making authority (the Mayor and the
District Council). Amounts in this category may be redeployed for other purposes with the appropriate due
process. Committed amounts cannot be used for any other purpose unless the District government
removes or changes the specified use by taking the same type of action it used to previously commit the
amounts.
• Assigned – resources neither restricted nor committed, for which the District has a stated intended use as
established by the Mayor, District Council, or a body or official to which the Mayor or District Council has
delegated the authority to assign amounts for specific purposes. These are resources where the
constraints/restrictions are less binding than that for committed resources.

FY 2017 Proposed Budget and Financial Plan D.C. Comprehensive Financial Management Policy
Appendix A-13
• Unassigned – resources which cannot be classified in one of the other four categories. The General Fund
is the only fund which may report a positive unassigned fund balance amount. In other governmental
funds, if expenditures incurred for specific purposes exceed the amounts restricted, committed, or assigned
to those purposes, negative unassigned fund balance may be reported.
Fund balance appropriated for the current fiscal year’s operating budget shall be used only to the extent
needed, if any, to balance the current fiscal year’s actual revenues to actual expenditures. In a given year,
actual revenues may exceed projected and appropriated revenues. When this occurs, the District shall first
apply the excess revenues before it applies any appropriated fund balance. Under no circumstances shall the
District apply more fund balance than has been duly appropriated.
Moreover, it is the policy of the District to use restricted resources first, followed by committed resources
and then assigned resources, when expenses are incurred for purposes for which any of these resources are
available.
The portion of the fund balance of the General Fund that is restricted or committed shall be maintained for
its specific purpose, unless modified by subsequent legislation. The District strives to maintain within its
restricted and/or committed fund balance components an amount up to the level that would result in sufficient
working cash to reduce the need for short-term borrowing to finance operations of the subsequent year.
Background: The fund balance of the General Fund represents the difference between the Fund’s assets and
its liabilities at the end of a fiscal year, or September 30th. The ending fund balance of a fiscal year is also the
beginning fund balance of the ensuing fiscal year. Positive differences between revenues and expenditures, or
surpluses, increase the fund balance. Negative differences, or deficits, decrease the fund balance.
An ever-growing fund balance that is inaccessible is not advantageous to the District because it restricts
the District’s ability to allocate resources among priorities. The amount of the fund balance is not indicative of
funds that may be used for any purpose in the future. Rather, unassigned fund balance would represent an
amount that may be used for District priorities after approval by both the District Council and the U.S.
Congress.
Expenditure Reporting The District shall make expenditures only in accordance with federal appropriations law and the District’s
budget approved by Congress and the District Council. Financial statements will accurately reflect these
expenditures. The District’s CAFR shall reflect expenditures in the relevant appropriation titles.
Accrual AccountingThe District shall prepare financial statements using both the modified accrual and the full accrual bases of
accounting in accordance with GASB Statement No. 34, Basic Financial Statements – and Management’s
Discussion and Analysis – for State and Local Governments.
Background: The District implemented the requirements of GASB Statements Nos. 34, 35, 36, 37, and 38
during FY 2002 as required by GASB. As a result of this implementation, in FY 2002 the District began
issuing two full accrual financial statements (a Statement of Net Position and a Statement of Activities) and
including a Management’s Discussion and Analysis section in its CAFR. Accrual accounting reports all of the
revenues and costs of providing services each year. This approach includes not just current assets and
liabilities (such as cash and accounts payable) but also capital assets and long-term liabilities (such as
buildings and infrastructure, including bridges and roads, and general obligation debt). Accrual accounting
helps the District meet the following important objectives of financial reporting.
• Assess the finances of the government in its entirety, including the year’s operating results;
• Determine whether the government’s overall financial position has improved or deteriorated;
• Evaluate whether the government’s current-year revenues are sufficient to pay for current-year services;
D.C. Comprehensive Financial Management Policy FY 2017 Proposed Budget and Financial Plan
Appendix A-14
• Assess the government’s cost of providing services to its citizenry:
- Assess how the government finances its programs – through user fees and other program revenues
versus general tax revenues;
• Understand the extent to which the government has invested in capital assets, including roads, bridges,
• and other infrastructure assets; and
• Make better comparisons between governments.
Tax Expenditure BudgetThe CFO is required by law to prepare a biennial tax expenditure budget that estimates the revenue loss to the
District government resulting from tax expenditures during the current fiscal year and the next three fiscal
years.
Special Purpose Revenues Special Purpose Revenues are program revenues that are generated from fees, fines, special assessments,
charges for services, and reimbursements that are set aside for a specific purpose for the District agency that
collects the revenues to cover the cost of performing the related function. Special Purpose Revenues are
classified as General Fund revenues.
Program revenues are defined as revenues that derive directly from the program itself or from parties
outside the reporting government's taxpayers or citizenry as a whole; they reduce the net cost of the function
to be financed from the government's general revenues.
An agency may have more than one fund within the Special Purpose Revenue category. Revenues will be
estimated for each agency’s funds on a quarterly basis consistent with all general fund revenues.
It is the policy of the District government that all program revenues generated by any agency belong to the
District as a whole, unless otherwise required by law. As a general rule, all revenues should be allocated
through the budget and appropriations process. Dedicated funds limit the use of the District's General Fund
revenue by earmarking a portion of the revenue for special purposes.
In certain limited cases, Special Purpose Revenue fund accounts are necessary to support a particular
program or activity. In such limited cases of need, the agency fund account must be created through the
normal legislative process and adhere to requirements to be recommended by the CFO and adopted by the
Mayor and District Council. Since program revenues are reported in a governmental fund, they should
therefore be accounted for under the modified accrual basis of accounting in fund financial statements.
The District could commit or assign in fund balance unspent program revenues in accordance with the
criteria established by Generally Accepted Accounting Principles, and make available for use in subsequent
years if permitted by the authorizing legislation that established the fund. The function of restricted or com-
mitted fund balance is simply to isolate the portion of fund balance that is restricted by external entities or
enabling legislation, or committed through the actions of both the legislative and executive branches of the
District. Assigned fund balance represents management's intended use of resources and generally should
reflect actual plans approved by the District. District agencies must have budget authority to expend Special
Purpose Revenues, as with other revenue sources. Budget authority is backed by certified revenue estimates,
planned use of certified amounts set aside in the fund balance, or a combination of these two sources.
Unassigned fund balance represents residual resources after the allocation of resources to all other classifica-
tions.
Expenditures are limited to the lesser of budget authority or available resources, which is the sum of
realized revenues and available fund balance.
Special Purpose Revenue budgets may be modified in accordance with federal appropriations law.
Reprogramming of budget authority from one agency fund to another is also permissible pursuant to
reprograming statutes. The CFO shall have discretion to reduce budget authority for agency funds where
revenue falls short of estimates.

FY 2017 Proposed Budget and Financial Plan D.C. Comprehensive Financial Management Policy
Appendix A-15
Any existing Special Purpose Revenue fund accounts that are not supported by legislative authority may
be converted to local revenue. In addition, when required to cover a revenue shortfall, such revenue may also
be converted to local revenue.
GrantsThe District depends on Federal and Private Grant Funds to support a wide range of services and programs for
the citizens of the District. This section sets forth the District’s policies related to resource development, grants
administration and reporting, budget authority for grants, and fairness in awarding grants.
Resource Development: To better serve District residents, all District agencies shall pursue to the maximum
extent possible federal and other funding opportunities that enhance their ability to carry out the Mayor’s
strategic plan and initiatives and address the needs of the residents of this city, without binding the District to
unrealistic financial commitments.
Background: For the last decade, grants have comprised approximately one-fourth of the District’s annual
budget, and as such, have contributed significantly to the District’s ability to meet the needs of its citizens. The
District’s policy is to continue and, to the extent possible, increase its use of funds from other sources to
maximize delivery of services to residents.
Grant Administration and Reporting: The District of Columbia government, by accepting grant funds, and
when designating subgrantees, agrees to administer and report on them in strict adherence to the grantors’
programmatic and financial rules and regulations, the District’s Grants Policies and Procedures Manual, and
applicable federal and District laws.
Budget Authority for Grants: District agencies will spend grant funds for allowable costs only at such time
as a grant award has been received, and to the extent they have budget authority to do so. Budget authority
applies to a particular fiscal year. If a grant covers multiple fiscal years, the sum of the budget authority across
those fiscal years should not exceed the grant award amount. Changes in budget authority will be made only
in accordance with the District’s policies and procedures regarding budget modifications (increases or
decreases in overall budget authority for a grant) or reprogrammings (increases or decreases in particular line
items within a grant that leaves the overall budget authority unchanged). Spending grant funds without
budget authority is a violation of the Anti-Deficiency Act. Agency updates to the spending plans required by
the Anti-Deficiency Act should reflect all changes to grant budget authority.
Background: Many of the grants that the District receives have performance year(s) different from the
District’s fiscal year. The timing differences between the grant year(s) and the District’s fiscal year impact the
budgeting for grants. Through the budget modification process, the CFO submits documentation to the District
Council requesting the establishment of budget authority for new grant awards received during the fiscal year
or grant budget authority not included in the congressionally approved budget for the fiscal year. This process
is unique among the District’s funding types and is mainly due to the nature of grants in comparison to the
District’s fiscal year requirements. All government officials work together to ensure that this administrative
process is as efficient as possible. The efficiency of the process can play a critical role in grants management.
Fairness in Awarding Grants: It is the intent of the District to have a fair and open competitive process for
the awarding of grant funds. To that end, the following procedures shall be followed:
• A Notice of Funds Availability (NOFA) shall be prepared and published in the D.C. Register.
• The agency administering the grant shall prepare the Request for Applications (RFA).
• For the purpose of awarding grants, District government agencies shall hold fair and open competitions
that comply with the D.C. Grants Policies and Procedures Manual and the Notice of Final Rulemaking,
Chapter 50: Subgrants to Private and Public Agencies.
D.C. Comprehensive Financial Management Policy FY 2017 Proposed Budget and Financial Plan
Appendix A-16
The only exception to the above procedures occurs when an organization merits a targeted grant, and the
awarding of this targeted grant becomes transparent and is justified through the budget formulation process.
After the NOFA has been published and the RFA released, the District government agency appoints a
neutral and objective review panel. The panel is comprised of a minimum of three individuals with knowledge
and expertise in the objectives of the grant and RFA, as well as in the standard administrative requirements
mandated by the source of funds. The review panel scores the submitted applications and makes
recommendations on which applications should be funded. The head of the District agency administering the
grant makes final decisions on awards and amounts. After this review and before the agency issues the award
documents, the Agency Fiscal Officer shall certify that the award funds are in place and available for
distribution.
Background: The receipt of grant funds triggers many requirements including, but not limited to, spending
and reporting requirements. Grant awards typically mandate the terms and conditions governing grants and
incorporate the relevant regulations and statutes. Funds that are awarded to private and public agencies by
District agencies, as subgrants, are bound by the appropriate U.S. Office of Management and Budget (OMB)
Circular and Cost Principles as well as any policy guidelines issued by the grantor. Subgrants to other District
agencies are generally awarded through the Memorandum of Understanding process. Grants to parties outside
the District government generally are awarded through a grant agreement that specifies the performance
obligations of the grantee. In the case of grant awards from general funds, grantees must comply with both
the appropriate OMB Circular and Cost Principles and any other policy guidance included in the grant
agreement. The CFO will meet the District’s reporting requirements by publishing the Congressional Grant
Budget and Activity report sent to Congress and the District Council, which provides grant-level information;
and monthly financial status reports, which provide summaries at the agency level.
Donated Funds Monitoring Policy Donated funds shall be authorized and monitored pursuant to D.C. Official Code § 1-329.01, Mayor’s Order
2010-167, effective October 15, 2010, and the related donation agreement with the respective donor. All
donated funds shall be used for the specific purpose expressed in the respective donation agreement,
deposited into the appropriate account, and shall be available for the intended purpose of the donation until
expended or unless the donor, for valid reasons, requests a refund. The Office of the City Administrator (OCA)
or a designee and the respective District agency or entity that receives the donation shall be responsible for
monitoring the expenditure of the donated funds, in accordance with the applicable rules and regulations.
CapitalPrior to recommending or approving new projects, the District must ensure that the budget for all capital
expenditures, including any planned acquisitions and any necessary replacement of assets, does not exceed
designated revenue streams and available debt service capacity. The annualized cost of any proposed changes
is compared to the approved budget totals from the prior 6-year Capital Improvements Program (CIP) period
for each fiscal year. New projects may be approved only insofar as the designated revenue streams are not
exceeded and long-term financing cost of the CIP stays within available funding limits, which require that debt
service costs not exceed a cap of 12 percent of the District’s General Fund expenditures, as detailed in the Debt
Management Policy.
Anti-Deficiency ActDistrict officials and employees must comply with: (a) the federal Anti-Deficiency Act, 31 U.S.C. §§1341,
1342, 1349 through 1351, 1511 through 1519 and D.C. Official Code §§ 1-206.03(e) and 47-105 (the “Federal
ADA”); and (b) the District Anti-Deficiency Act, D.C. Official Code §§47-355.01 et seq. (the “D.C. ADA”,
and (a) and (b) together, as amended from time to time, the “Anti-Deficiency Acts”). Among other provisions,
the D.C. ADA requires agency heads and agency fiscal officers to submit a spending plan and a position

FY 2017 Proposed Budget and Financial Plan D.C. Comprehensive Financial Management Policy
Appendix A-17
roster (Schedule A) at the beginning of each fiscal year to the CFO. Managers must submit, on a quarterly
basis, projections of year-end spending to the agency head and agency fiscal officer, with summarized reports
being forwarded to the District’s CFO no more than 30 days after the end of each quarter. Employees are
prohibited from:
• Making or authorizing an expenditure or obligation exceeding an amount available in an appropriation for
an agency or fund;
• Obligating the District for the payment of money before an appropriation is made or before a certification
of the availability of funds is made, unless authorized by law;
• Approving a disbursement without appropriate authorization;
• Allowing an expenditure or obligation to exceed apportioned amounts;
• Deferring recording a transaction incurred in the current fiscal year to a future fiscal year;
• Submitting a required plan or projection in an untimely manner;
• Knowingly reporting incorrectly on spending to date or on projected total annual spending;
• Failing to adhere to a spending plan through overspending that is greater than 5 percent of the agency’s
budget, or $1 million; or
• Making or authorizing an expenditure or obligation for one capital project from another capital project.
A review board was established, consistent with the Act and implementing regulations, to review potential
violations referred to the board, determine culpability, and recommend penalties for violations. The CFO
submits quarterly reports to the Mayor and the District Council on actual expenditures and obligations
compared to planned levels. The CFO also is required to develop the quarterly apportionment of funds, by
source of funds, for each agency, based on the spending plans submitted by the agency heads and fiscal
officers.
Background: District officials and employees are bound by the Anti-Deficiency Acts, which bar them from
obligating funds except in accordance with appropriations. Further, the D.C. ADA establishes a greater level
of control than does the Federal ADA, and it provides specific penalties for violations. Spending plans are one
of the D.C. ADA's key requirements to ensure that appropriations are not exceeded.
Economic Development Policy
Real Property Tax ExemptionsThe Office of Tax and Revenue (OTR) implements real property tax exemptions in accordance with
applicable law. Except for property exempted by specific legislation or immune from taxation by the District,
real property is taxable unless an administrative exemption with respect to such property has been granted. As
a general matter, owners of property for which an exemption is sought must apply to OTR. The applicable
requirements for exemption are generally set forth in D.C. Official Code § 47-1002 and the regulations
promulgated thereunder. OTR reviews each application and determines whether the requirements for the
applicable category of exemption, including those pertaining to ownership and use of the property, have been
met. A property cannot qualify for exemption simply because its owner is exempt from federal income tax or
other taxes. Once granted, the exemption remains in effect as long as the property continues to meet the
applicable requirements and the owner files the required annual use reports. If ownership of the property
changes, the categorical exemption terminates.
Analysis of Proposed Tax Exemptions and AbatementsPursuant to the Exemptions and Abatements Information Requirement Act of 2011, effective September 14,
2011 (D.C. Law 19-21; D.C. Official Code § 47-4701 et seq.), new tax abatements and exemptions proposed
under Title 47 or Title 42 (§42-1103) of the D.C. Official Code are subject to OCFO analysis prior to

D.C. Comprehensive Financial Management Policy FY 2017 Proposed Budget and Financial Plan
Appendix A-18
consideration by the District Council. The advisory analysis includes a determination of whether or not the
abatement is needed to (a) meet the fiscal needs of the specific existing building, entity, or persons receiving
the abatement, (b) cause a specific development project to go forward, or (c) achieve the policy goal of the
abatement if the abatement broadly applies to a category of taxpayers. It also includes the estimated cost of
the proposed tax abatement. Finally, the District’s fiscal impact analysis procedures require that the District
budget incorporate any reductions in revenue that result from newly authorized tax abatements, prior to such
abatements taking effect.
Debt Financing ToolsThe District may provide public-sector financing of economic development to qualified projects pursuant to
District laws and subject to the District’s laws on borrowing limitations (D.C. Official Code §47-334 et seq.,
the Cap Act). The OCFO works with the executive branch of the District government in the review,
consideration, and approval of the financing of qualified projects.
The primary economic development debt financing instruments used are:
• Tax Increment Financing bonds or notes, in which incremental tax revenues from a project area are pledged
to pay debt service on tax increment financing bonds or notes issued to finance a portion of a qualified
project; and
• Payment In-Lieu-of-Taxes (PILOT) financing bonds and notes, in which the PILOT payments from a
project area are pledged to pay debt service on PILOT bonds or notes issued to finance a portion of a
qualified project. PILOT bonds or notes are used only for projects located on parcels that were
previously exempt from the payment of real property taxes.
In addition, the District assists private entities, primarily nonprofit organizations and owners of rental
apartment complexes, by issuing private activity revenue bonds on their behalf. The District’s Revenue Bond
Program is administered by the Office of the Deputy Mayor for Planning and Economic Development, and
housing development related bonds are issued by the District of Columbia Housing Finance Agency. The debt
service on these bonds is payable solely from the revenue of the private entity and is not the District’s
obligation.

Appendix B:
Basis of Budgeting and Accounting


FY 2017 Proposed Budget and Financial Plan Basis of Budgeting and Accounting
Appendix B-1
The Government of the District of Columbia provides the following information regarding key tenets of its Basisof Budgeting and Accounting:
BackgroundFour basic differences between the basis of accounting and the basis of budgeting for state and local governmentsare:
(1) Basis Differences – these differences arise when the basis of accounting used to develop and approve the budgetdiffers from the basis of accounting required by Generally Accepted Accounting Principles (GAAP) for financialreporting. Two such differences are the use of the cash basis for budget purposes and the treatment ofencumbrances as expenditures to develop the budget;
(2) Perspective Differences – these differences exist when the structure of financial information for budgetarypurposes differs from the fund structure that is used to prepare the basic financial statements. For example,some governments may budget by program and not by fund type;
(3) Entity Differences – these differences arise when the appropriated budget either includes or excludes organizations and programs. For example, the general fund of a blended component unit reported as a majorspecial revenue fund may not be included in the budget of the primary government and may not have a budget of its own; and
(4) Timing Differences – these differences include a significant variance between budgetary practices and GAAPregarding the authorized carry-forward of appropriated funds. Also, in GAAP, accounting revenues are recognized in governmental funds as soon as they are both “measurable” and “available,” whereas revenuerecognition under the budgetary basis of accounting may be deferred until amounts are actually received incash.
When any of these differences exist, GAAP requires governments to present a reconciliation of budgetarycomparison information to GAAP information in the notes to the Financial Statements/Required SupplementaryInformation, on the face of the budgetary statement, or as an attached schedule to the budgetary statement.
Accounting SystemThe District's accounting system is organized and operated on a fund basis. A fund is a group of self-balancingaccounts combined into a separate accounting entity having its own assets, deferred outflows of resources, liabilities,deferred inflows of resources, equity, revenue and expenditures/expenses. Funds are established for the purpose ofcarrying on specific activities or attaining certain objectives in accordance with special regulations, restrictions, orlimitations. The District follows GAAP when determining the types of funds to be established and is guided by the“minimum number of funds principle” and sound financial management practices when determining the number
Appendix B
Basis of Budgeting andAccounting
Basis of Budgeting and Accounting FY 2017 Proposed Budget and Financial Plan
Appendix B-2
of funds to be set up within each fund type. Specialized accounting and reporting principles and practices applyto governmental funds. Proprietary and trust funds are accounted for in the same manner as business enterprises.
Internal ControlThe District’s management team is responsible for establishing and maintaining adequate internal controls designedto ensure that the assets of the District are protected from loss, theft or misuse and to ensure that adequateaccounting data are compiled to allow for the preparation of financial statements in conformity with GAAP. Theinternal control structure is designed to provide reasonable, but not absolute, assurance that these objectives are metwithin three broad, overriding categories:
(a) efficiency and effectiveness of operations; (b) reliability of financial reporting; and (c) compliance with applicable laws and regulations.
The concept of reasonable assurance recognizes that: (1) The cost of a control should not exceed the benefits likely to be derived; and (2) The valuation of costs and benefits requires estimates and judgments by management.
Basis of BudgetingThe basis of budgeting refers to the conventions used for recognition of costs and revenue in budget developmentand in establishing and reporting appropriations, which provide the legal authority to spend or collect revenues.The District uses a modified accrual basis for budgeting governmental funds. Proprietary funds are budgeted usingaccrual concepts. All operating and capital expenditures and revenue are identified in the budgeting process becauseof the need for appropriation authority.
The budget is fully reconciled to the accounting system at the beginning of the fiscal year and in preparing theComprehensive Annual Financial Report (CAFR) at the end of the fiscal year. A number of GAAP adjustmentsare made to reflect balance sheet requirements and their effect on the budget.
Budgetary ControlThe District maintains budgetary controls designed to monitor compliance with expenditure limitations containedin the annual appropriated budget approved by the United States Congress. The level of budgetary control (thatis, the level at which expenditures cannot legally exceed the appropriated amount) is established by function withinthe General Fund. The District also uses an encumbrance recording system as one technique for maintainingbudgetary control. In addition, the District adopts a project-length financial plan for its capital projects. Generally,encumbered amounts lapse at year-end in the General Fund but not in the Capital Projects Fund, Special Revenuefunds, or the fund for Federal Payments, depending on the appropriation language for each Federal Payment.
Basis of AccountingThe District’s financial statements are prepared in accordance with GAAP. As such, the measurement focus andbasis of accounting applied in the preparation of the District’s financial statements are as follows:• The District’s government-wide financial statements focus on all of the District’s economic resources and use
the full accrual basis of accounting; and• The District’s fund financial statements focus primarily on the sources, uses, and balances of current financial
resources and use the modified accrual basis of accounting.

Appendix C
Fund Structureand Relationshipto BudgetStructure

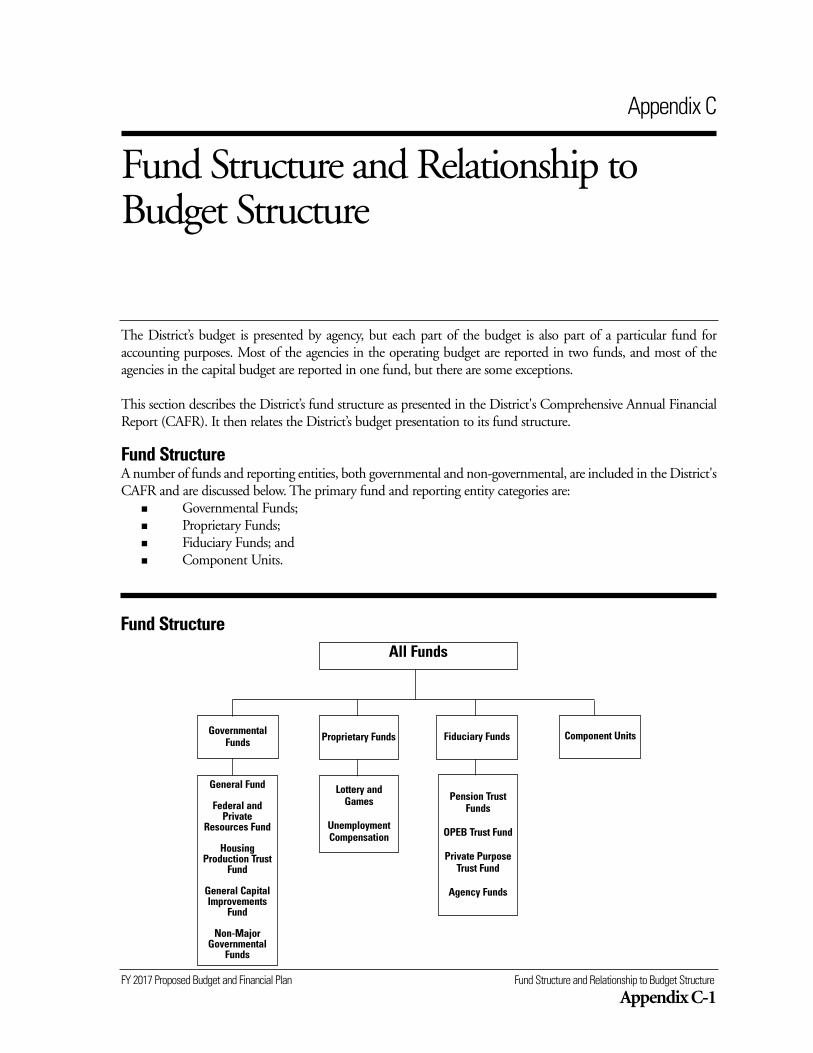
FY 2017 Proposed Budget and Financial Plan Fund Structure and Relationship to Budget Structure
Appendix C-1
The District’s budget is presented by agency, but each part of the budget is also part of a particular fund for accounting purposes. Most of the agencies in the operating budget are reported in two funds, and most of the agencies in the capital budget are reported in one fund, but there are some exceptions.
This section describes the District’s fund structure as presented in the District's Comprehensive Annual FinancialReport (CAFR). It then relates the District’s budget presentation to its fund structure.
Fund StructureA number of funds and reporting entities, both governmental and non-governmental, are included in the District'sCAFR and are discussed below. The primary fund and reporting entity categories are:
n Governmental Funds;n Proprietary Funds;n Fiduciary Funds; andn Component Units.
Appendix C
Fund Structure and Relationship toBudget Structure
GovernmentalFunds Proprietary Funds Fiduciary Funds Component Units
Pension TrustFunds
OPEB Trust Fund
Private PurposeTrust Fund
Agency Funds
General Fund
Federal andPrivate
Resources Fund
HousingProduction Trust
Fund
General CapitalImprovements
Fund
Non-MajorGovernmental
Funds
Lottery andGames
UnemploymentCompensation
Fund StructureAll Funds

Fund Structure and Relationship to Budget Structure FY 2017 Proposed Budget and Financial Plan
Appendix C-2
Governmental FundsGovernmental Funds include four major and six non-major funds. The major governmental funds are:n General Fund;n Federal and Private Resources Fund;n Housing Production Trust Fund; andn General Capital Improvements Fund.
The non-major governmental funds are:n Tobacco Settlement Financing Corporation Fundn Tax Increment Financing Program Fund;n Payment-in-Lieu-of-Taxes Special Revenue Fund;n Baseball Special Revenue Fund;n Debt Service Fund; andn Highway Trust Fund.
General FundThe General Fund records three sources of revenue: Local funds, Dedicated Taxes, and Special Purpose Revenues.These are known as appropriated funds.n Local funds are the District's primary source of revenue. Nearly all of the District's tax receipts - the most
significant of which are income taxes, sales taxes, and property taxes - are recorded as Local funds. In addition,certain non-tax revenues (those fines, fees, and miscellaneous revenues not dedicated for a particular agency'suse) are part of Local funds. Finally, an annual transfer from the Lottery goes into Local funds.
n Dedicated Taxes are those taxes that, by law, are dedicated to a particular purpose. Examples include a specified portion of sales tax that is dedicated to the Washington Convention and Sports Authority and the fullamount of the motor fuel tax, which is dedicated to the Highway Trust Fund. As detailed below, some dedicated taxes are not part of the General Fund.
n Special Purpose Revenues are non-tax revenues collected by District agencies that, by law, are dedicated to support the functions those agencies perform. Examples include certain fees and permit charges that the public pays for and whose proceeds are used by the agency to carry out operations in that same area. Some agencies retain unused revenues collected in a given fiscal year in the restricted or committed portions of theFund Balance. They are allowed to spend those revenues, if they receive appropriation authority to do so, in asucceeding year.
Descriptions of General Fund revenues, as well as historical data and estimates for FY 2016 and the next three years,can be found in chapter 3 of this Executive Summary volume.
Federal and Private Resources FundThe Federal and Private Resources Fund records five sources of revenue, each of which is an appropriated fund.n Federal Grants are grants the District receives from federal agencies, including block grants, formula grants,
certain entitlements, and competitive grants.n Federal Payments are direct appropriations from the Congress to the District, usually to a particular District
agency for a particular purpose.n Federal Medicaid Payments are the federal share of the District's Medicaid costs. Generally, the federal govern-
ment pays 70 percent of the cost of Medicaid while the District pays 30 percent, although the proportions differ in certain circumstances.
n Private Grants are grants the District receives from non-federal sources.n Private Donations are donations to District agencies from private individuals or organizations.

FY 2017 Proposed Budget and Financial Plan Fund Structure and Relationship to Budget Structure
Appendix C-3
Housing Production Trust FundThe Housing Production Trust Fund (HPTF) provides financial assistance to a variety of affordable housing programs and opportunities across the District of Columbia, including initiatives to build affordable rental housing, preserve expiring federal-assisted housing, and help provide affordable homeownership opportunities forlow-income families.
General Capital Improvements FundThe General Capital Improvements Fund accounts for all District capital project activity other than activity in theHighway Trust Fund. It records revenues from multiple sources, primarily bond proceeds of different types, Pay-as-you-go (Paygo) transfers from the General Fund, and federal grants for capital projects, most of which are high-way construction grants.
Non-Major Governmental FundsSpecial Revenue Funds account for specific revenue that is legally restricted to expenditures for particular purposes. They are as follows:n The Tobacco Settlement Financing Corporation Fund accounts for activities relating to the tobacco litigation
settlement.n The Tax Increment Financing (TIF) Program Fund accounts for activities relating to tax increment financing
development initiatives. These initiatives involve borrowing to finance a project and using the incremental taxrevenues generated by the project to repay the borrowed funds.
n The Payment-in-Lieu-of-Taxes (PILOT) Special Revenue Fund accounts for activities relating to developmentinitiatives that are similar to TIF projects, except that repayment is made from PILOT revenues instead of taxrevenues.
n The Baseball Special Revenue Fund accounts for the revenues that are legally restricted to expenditures for baseball project purposes, including taxes dedicated to this fund and rent paid by the Nationals to the District.
The Debt Service Fund accounts for the payment of principal and interest on ballpark revenue bonds. Itreceives a transfer from the Baseball Special Revenue Fund in the amount required to make debt service paymentseach year.
The Highway Trust Fund accounts for the District's local match to federal highway construction grants. TheDistrict typically finances about 20 percent of federal highway projects while federal grants finance about 80 percent, but this proportion can differ for every project.
Proprietary FundsProprietary Funds are District units that charge customers for the services provided, whether to outside customersor to other units of the District. The District has two Proprietary Funds:n D.C. Lottery and Charitable Games Board, which not only operates and is financed like a private business
where net income is key to sound management, but also can finance the costs of its goods and services provided to the public on a continuing basis primarily through user charges. The Lottery accounts for revenuefrom lotteries and daily numbers games operated by the District and from licenses to conduct charitable games,and it transfers its profits to help finance the General Fund.
n Unemployment Compensation Fund, which accounts for funds used to pay benefits to unemployed formeremployees of the District, federal government, and private employers within the District. The fund is administered by the Department of Employment Services.
Fiduciary FundsFiduciary Funds account for assets held by the District in a trustee or agency capacity. These assets cannot be usedto support the District's programs. The District's Fiduciary Funds are:n The Pension Trust Funds, which account for resources accumulated and used for retirement annuity payments
for police officers, firefighters, public school teachers and their survivors. Resources are contributed by

Fund Structure and Relationship to Budget Structure FY 2017 Proposed Budget and Financial Plan
Appendix C-4
employees and by the District and federal governments at amounts determined by an annual actuarial study.The funds are administered by a 13-member Retirement Board. The administrative costs of the board areaccounted for in the funds.
n The Other Post-Employment Benefits (OPEB) Trust Fund, which accounts for resources accumulated andused for postemployment health insurance and life insurance premiums for former District employees.
n The Private Purpose Trust Fund, which accounts for the District's sponsored college tuition savings plan.n The agency funds, which account for refundable deposits required of various licenses, include monies held in
escrow as an agent for individuals, private organizations or other governments.
Component UnitsComponent units are legally separate organizations for which the District is financially accountable because theirgoverning bodies are appointed by the Mayor, with the consent of the Council, or other District officials. TheDistrict has five component units:
n Health Benefit Exchange Authority, which implements a health care exchange program in the District ofColumbia in accordance with the Patient Protection and Affordable Care Act.
n Washington Convention and Sports Authority, which maintains and operates the Washington ConventionCenter for local public shows, civic events, and other activities; maintains and operates the National GuardArmory for nonmilitary events and the Robert F. Kennedy Memorial Stadium; and promotes the District as asporting event site.
n Not-for-Profit Hospital Corporation, commonly known as United Medical Center and United MedicalNursing Center, which provides inpatient, outpatient, psychiatric, and emergency care and manages a skillednursing facility.
n Housing Finance Agency, which receives funds from public and private sources to alleviate the shortage of hous-ing through greater supply and less expensive mortgage and construction loans.
n University of the District of Columbia (UDC), which accounts for resources received and used by theUniversity of the District of Columbia. The unit contains four separate fund groups: Current Funds, LoanFund, Endowment Fund, and Plant Funds. A budget is prepared for only the Current Funds.
The District established the District of Columbia Tobacco Settlement Financing Corporation (the "TobaccoCorporation") as a special purpose, independent instrumentality of the District government. The TobaccoCorporation is a blended component unit because it provides services exclusively to the District.
Budget Structure and Relationship to Fund StructureIn FY 2016, the District is publishing six budget volumes: this Executive Summary volume, four volumes covering the operating budget, and one volume covering the capital budget. The operating budget includes agencies whose revenues and expenditures are recorded in the General Fund and the Federal and Private ResourcesFund. In addition, the operating budget includes certain agencies that operate outside these two funds. The capital budget includes agencies in the General Capital Improvements Fund and the Highway Trust Fund.
Operating BudgetThe District’s operating budget (volumes 2 through 4 and volume 6) includes all spending in the General Fundand the Federal and Private Resources Fund. All agencies described in volumes 2, 3, and 4 of the budget docu-ments, except for those in the appropriation title “Enterprise and Other Funds” (part H of volume 4), are budget-ed in, and make expenditures in, one of these two funds.
The "Enterprise and Other Funds” section of the budget includes agencies that operate through both governmental and non-governmental funds. These agencies relate to fund categories as follows:

FY 2017 Proposed Budget and Financial Plan Fund Structure and Relationship to Budget Structure
Appendix C-5
Note that the "Ballpark Revenue Fund" is the name of the agency that includes budget for expenditures madethrough both the Baseball Special Revenue Fund and the Debt Service Fund, both of which are non-major governmental funds. As such, this agency includes budget authority for the debt service portion of its expenditurestwice: once to provide budget authority to transfer revenue from the Baseball Special Revenue Fund to the DebtService Fund, and a second time to make the debt service expenditures from the Debt Service Fund.
Capital BudgetThe capital budget volume (volume 5) includes all revenues and expenditures related to the General CapitalImprovements Fund. All agency capital budget chapters show spending in this fund, except for a portion of thebudget of the District Department of Transportation (DDOT). Some of DDOT's projects are financed by bondrevenues or Paygo capital and are budgeted in the General Capital Improvements Fund. But its Highway TrustFund projects are financed by a mix of federal grants and local match. As noted above, the federal grant portion ofthese projects is recorded in the General Capital Improvements Fund, while the local match is recorded in theHighway Trust Fund, a non-major governmental fund.
Transfers Between FundsThe District’s budget includes a number of transfers between funds.
Dedicated taxes are sometimes dedicated to an agency within the General Fund, in which case they are simply a source of revenue and budget authority for the agency. But certain dedicated taxes are allocated to agencies outside the General Fund. Some of these are transfers through the General Fund, while others are not:n Dedicated tax revenues flow through the General Fund to two agencies: the Washington Convention and
Sports Authority and the Highway Trust Fund. The revenues are in the Dedicated Tax appropriated fund, inthe General Fund, and the operating budget includes a General Fund transfer agency that records an “expenditure” of these funds as the transfer is made. The budget for the Washington Convention and SportsAuthority is included in part H of volume 4, and the budget for the Highway Trust Fund is in volume 6.
n Four allocations of dedicated taxes are not transferred through the General Fund – the tax revenues go directly to the agencies and are never considered part of General Fund revenue. These are the allocations to theTax Increment Financing Program, Repayment of PILOT Financing, the Ballpark Revenue Fund, and theHousing Production Trust Fund. The budgets for these four agencies are included in part H of volume 4.
Fund Category AgencyGovernmental Funds - Major • Housing Production Trust FundGovernmental Funds - Non-Major • Tax Increment Financing (TIF) Program
• Repayment of PILOT Financing• Ballpark Revenue Fund
Proprietary Funds • D.C. Lottery and Charitable Games Control Board• Unemployment Insurance Trust Fund
Fiduciary Funds • D.C. Public Library Agency Trust FundComponent Units • Health Benefit Exchange Authority
• Washington Convention and Sports Authority• Not-For-Profit Hospital Corporation• Housing Finance Agency• University of the District of Columbia
Other • Water and Sewer Authority• Washington Aqueduct• District of Columbia Retirement Board

Fund Structure and Relationship to Budget Structure FY 2017 Proposed Budget and Financial Plan
Appendix C-6
In some cases, more dedicated tax revenue is allocated to these agencies than is needed. Specifically, revenuesfor the Ballpark Revenue Fund and for some projects in the Tax Increment Financing Program and in Repaymentof PILOT Financing have accumulated faster than needed for the purposes of these agencies, which is to pay debtservice on past borrowings. Depending on legislation and bond documents in each instance, the excess amountsmay be available for transfer to the General Fund, and in recent years these transfers have added to General Fundresources.
Other transfers are budgeted each year. Each year, the District budgets a transfer of Local Funds to theUniversity of the District of Columbia. In addition, the Lottery (a Proprietary Fund) transfers revenues to theGeneral Fund each year; these revenues become part of Local Funds.
Pay-as-you-go (Paygo) capital refers to the use of current-year operating budget revenue for a capital project, to supplement the long-term financing that is typically used for capital projects. Similar to the Dedicated Tax transfers above, the operating budget includes a General Fund Paygo (transfer) agency that records an “expenditure” of these funds as the transfer is made from the General Fund to the General Capital ImprovementsFund. Occasionally, funds previously transferred through Paygo to the General Capital Improvements Fund butnot spent will be transferred back to the General Fund.
Indirect Cost Recovery refers to the District’s ability to use a portion of federal grant revenues to fund central services that provide indirect support for grant-receiving agencies. Terms are set out in each grant agreement. Theserevenues are accumulated and transferred each year from the Federal and Private Resources Fund, where grant revenue is first recorded, to the General Fund, where the transfer helps support spending by General Fund agencies.
Bond Issuance Costs are the costs related to issuing General Obligation Bonds, Income Tax-Secured RevenueBonds, and other long-term debt. These costs include (but are not limited to) expenses related to underwriting,credit enhancement, financial advisory, documentation, and credit ratings on the bonds. A portion of the bondproceeds is used to pay these costs. Once bond proceeds are received for the General Obligation Bonds, or theIncome Tax Secured Revenue Bonds, almost all of the proceeds are recorded in the General Capital ImprovementsFund. The portion used to pay for issuance costs, however, is recorded directly in the General Fund. The issuancecosts for other long-term debt are recorded to the applicable budget and fund at the time the bonds are issued.
New Appropriated Funds in FY 2015Through FY 2014, agencies in “Enterprise and Other Funds” (part H of the operating budget) were budgeted forthe most part as receiving Special Purpose Revenue, and several agencies were also budgeted as receiving Local fundsor Dedicated Taxes. These are the same appropriated funds that are part of the General Fund, even though theseagencies do not operate in the General Fund. For FY 2015, two new appropriated funds, “Enterprise and OtherFunds” and “Enterprise and Other Funds – Dedicated,” were created to replace the use of Special Purpose Revenue,Local, and Dedicated Taxes by these agencies. The result is that these three appropriated funds now refer exclusivelyto General Fund revenue, while the two new appropriated funds together display all budget for the Enterprise andOther Funds.
Intra-District BudgetsNote that each agency’s operating budget total may also include an intra-District budget. Intra-District budget represent agreements between two agencies whereby one agency purchases services from the other. The buyingagency makes an expenditure against its own budget authority (Local, Dedicated Tax, Special Purpose Revenue,Federal, or Private) by transferring resources to the selling agency. The selling agency receives this expenditure asintra-District revenue, establishes intra-District budget authority, and spends against that authority to provide theservice. An agency's total "gross funds" budget includes its intra-District budget authority. Because such arrange-ments appear as expenditures twice, once in each agency, the intra-District totals are excluded from the District-wide calculations of the total "gross funds" budget. They also are excluded from the CAFR totals reported at theend of the year.

Appendix D
Current ServicesFunding Level(CSFL)Development


FY 2017 Proposed Budget and Financial Plan Current Services Funding Level (CSFL) Development
Appendix D-1
OverviewThe Current Services Funding Level (CSFL) is a Local funds only representation of the true cost of operatingDistrict agencies, before consideration of policy decisions. The CSFL reflects changes from the FY 2016 approvedbudget across multiple programs, and it estimates how much it would cost an agency to continue its current programs and operations into FY 2017. The FY 2017 CSFL adjustments to the FY 2016 Local funds budget aredescribed in the FY 2016 Approved Budget to FY 2017 Proposed Budget, by Revenue Type table (Table 5) of nearly every District agency’s budget chapter.
MethodologyThe starting point in estimating the required level of programmatic funding for the upcoming fiscal year (FY 2017)was the approved budget of the current fiscal year (FY 2016). One-time expenditures in FY 2016 were removedfrom the calculation, since they were assumed not to continue into FY 2017. There were several components within the approved budget that were considered basic to most agencies and required the application of a standardmethodology. In these instances, the same calculations were applied across all District agencies; however, some calculations were restricted only to a particular agency or a specific group of agencies and to applicable ComptrollerSource Groups (CSGs), or expenditure types, such as Salaries, Fringe Benefits, Contracts, or Supplies. Finally, specific assumptions were applied to certain agencies, in some cases for known budget items that were likely torecur, and in other cases because characteristics were unique to the agency, such as debt service obligations.
General Assumptions Used to Develop the CSFLThe following are the general assumptions that were applied to nearly all District agencies in the FY 2017 CSFL:
1. Fringe Benefit Rate Adjustments (By Agency): The FY 2017 fringe benefit rate adjustment was calculated based on: 1) a four-year average of fringe data; 2) the percentage of health and other benefits to totalfringe; and 3) a projection of growth in benefits.
2. Consumer Price Index (CPI) Growth Factor: 2.3 Percent Year-over-Year (YoY) increase to NonpersonalServices (NPS) costs (CSG 41): The 2.3 percent inflation factor is based on the seasonally adjusted CPI forthe Metropolitan Washington region, which is forecasted by the Office of Revenue Analysis. The Office ofBudget and Planning used the CPI to adjust for inflation.
3. FY 2017 Pay Raise: This shows the effect of pay raises on the budget, for the agencies that have approved compensation agreements.
Appendix D
Current Services Funding Level (CSFL)Development

Current Services Funding Level (CSFL) Development FY 2017 Proposed Budget and Financial Plan
Appendix D-2
Specific Assumptions Used to Develop the CSFLThe following are the specific assumptions that were applied only to certain CSGs within one particular agency orwithin specific groups of agencies:
1. Removal of One-Time Items: All FY 2016 one-time items were removed from the CSFL.
2. Recurring Budget Items: Where applicable, recurring budget items were identified to adjust CSGs 11 (RegularPay - Continuing Full Time), 13 (Additional Gross Pay), 14 (Fringe Benefits – Current Personnel), 15(Overtime Pay), 40 (Other Services and Charges), 41 (Contractual Services - Other), and 50 (Subsidies andTransfers). Recurring budget items for all other CSGs were not adjusted in the FY 2017 CSFL.
3. Personal Services Adjustments: This reflects the projected full-year impact of new positions requested in theFY 2016 budget, approved union contracts, and corresponding salary Fringe Benefits adjustments.
4. Fixed Cost Inflation Factor: YoY Increase to Fixed Costs (CSGs 30, 31, 32, 33, 34, and 35): The fixed costsfor the FY 2017 CSFL were derived from cost estimates provided by the Department of General Services,telecommunication estimates provided by the Office of Finance and Resource Management, and fleet estimatesprovided by the Department of Public Works.
5. Medicaid Growth Factor: Percent Increase in Medicaid: The rate of 1.6 percent was provided by theDepartment of Health Care Finance.
6. Student Funding Formula Inflation Factor: The funding formula was increased by 2.0 percent to account forinflationary costs that are generally associated with educating students in the District of Columbia PublicSchools and Public Charter Schools.
7. Debt Service Adjustments: Projected adjustments were provided by the Office of Finance and Treasury.
8. Operating Impact of Capital: Projected adjustments for completed capital projects that will have operatingcosts were included in the CSFL.
9. Other Adjustments: These adjustments were unique to a particular agency and did not meet the criteria of theother adjustment scenarios.

Appendix E
AgencyPerformancePlans


FY 2017 Proposed Budget and Financial Plan Agency Performance Plans
Appendix E-1
OverviewThe Office of the City Administrator (OCA) is building a robust performance management program across the
District. This process includes making several updates to the format and submission process for annual agency
performance plans.
Under the new process, agencies had the opportunity to update major components of their performance
plan for FY 2017 including: objectives, key performance indicators and workload measures. Ultimately, the
revised performance plans will be able to communicate more effectively the important work each agency plans
to do over the coming year and how each agency will work to improve its performance. First drafts of the high-
level components of each agency’s performance plan (objectives, key performance indicators, and operations)
are published online with the Mayor’s FY 2017 budget submission.
The following provides a background of annual performance plans and their uses, a summary of major
changes in FY 2017, a description of the major components and a summary of the performance management
timeline.
Background:Annual Performance Plans can help accomplish several purposes, these include:
• Provide clear direction on how an agency plans to make progress toward achieving its mission and
aligning to the Mayor’s goals and vision for the District,
• Help to align and prioritize resources,
• Be a tool to monitor progress toward completion of strategic initiatives and key projects,
• Communicate to the Mayor, the Council of the District of Columbia, and the public on what the agency
plans to do to improve its performance over the coming year.
The OCA heard from several agencies about the problems the prior annual performance plans
presented: they did not encompass the full scope of agency activities nor did they often align with an agency’s
budget; content was difficult to understand by the public; and for many agencies, content was outdated. The
new system incorporates changes to address these problems. In addition, it increases flexibility to help all
agencies more clearly communicate what they plan to achieve and help the Mayor and City Administrator
track their performance throughout the year.
Structure:
I. Major Changes
• In FY 2017, all agencies had the ability to update their strategic objectives, key performance indicators,
and workload measures to reflect their current mission. After FY 2017, these components should remain
stable unless agency requirements change or new data that would be helpful to track performance becomes
available.
Appendix E
Agency Performance Plans

Agency Performance Plans FY 2017 Proposed Budget and Financial Plan
Appendix E-2
• All agencies will include a Strategic Objective on Excellence in Government along with standardized
metrics across all agencies provided by the OCA. These metrics will track areas like spending,
contracting, hiring and customer service. This is new standardized data being reported in the performance
plans across government agencies that will help the Mayor, the Council of the District of Columbia, and
the public to compare an agency’s performance across government. OCA will work over the next several
months to have the data in these areas ready for view in FY 2017.
• Agencies will include Daily Services and major long-term Key Projects through the addition of an
Operations component. This addition will help agencies better reflect all of the work they do to achieve
their Strategic Objectives and is defined in greater detail below.
II. Components
Below is a summary of each component in the Annual Performance Plan.
• Strategic Objectives. Strategic Objectives describe what the agency will do, at a high level, to achieve its
Mission. These are action-based sentences that define what an agency does for its customers, whether the
customers are citizens or other District agencies.
o New for FY 2017, each agency will be required to add an Excellence in Government Strategic
Objective and several key performance indicators. These indicators are as follows:
■ Contracts/Procurement - Percent of Expendable Budget spent on Certified Business
Enterprises
■ Contracts/Procurement - Contracts lapsed into retroactive status
■ Budget - Local funds unspent
■ Budget - Federal Funds returned
■ Customer Service - Meeting Service Level Agreements
■ Human Resources - Vacancy Rate
■ Human Resources - Employee District residency
■ Human Resources - Employee Onboard Time
■ Performance Management - Employee Performance Plan Completion
o For agencies that do not track one of the measures above in one of the District’s citywide databases,
OCA will work with that agency to substitute a corresponding measure.
• Key Performance Indicators. Key Performance Indicators measure how well an agency is achieving its
Strategic Objectives. They are outcome oriented and should be used to answer the question, “What does
the agency need to measure to determine success?”
• Operations. Operations include the work that happens on a daily basis to help achieve the Strategic
Objectives. This is further divided into Daily Services, such as sanitation disposal, and long-term Key
Projects that are high profile, one-time and span several years, such as the redevelopment of Walter Reed
Army Medical Center. Many agencies will mostly have Daily Services, whereas some agencies that have
substantial amounts of capital funds will have several Key Projects.
Available in the second draft to be published in the Congressional Submission of the FY 2017 budget
(typically done in late June or early July):
• Workload Measures. Workload Measures cover inputs and outputs of Operations such as the number of
driver’s licenses issued. Workload Measures include major components that provide
crucial information about an agency’s work and the work that is needed to make progress toward the
Strategic Objective.

FY 2017 Proposed Budget and Financial Plan Agency Performance Plans
Appendix E-3
Available in the final draft to be published on the OCA website by October 1, 2016:
• Strategic Initiatives. Strategic Initiatives are defined as changes and/or enhancements to Operations that
will help make progress on the Strategic Objective. Strategic Initiatives are typically completed or
implemented in one or two years. Strategic Initiatives may affect more than one Operational function. A
Strategic Initiative can encompass several areas:
o How an agency will improve a Daily Service, for example, by streamlining the intake process for
customers accessing an agency’s service.
o How an agency will implement a new component to a current Daily Service, for example, by rolling
out body-worn cameras for police officers on patrol.
o How an agency will implement the current phase and expected progress for long-term Key Projects,
for example, by completing the initial design work for construction of a new District facility. Daily
Services may not always have a corresponding Strategic Initiatives but Key Projects will always
have an Initiative that describes the year’s expectations.
III. How are Performance Plans used?
Annual Performance Plans will be used at several points during the year to help the Mayor, City Administrator
and Deputy Mayors prioritize resources, track progress, and make adjustments during the year as needed. The
draft Annual Performance Plans will be used during budget meetings to understand how changes in funding
are expected to affect performance.
After Annual Performance Plans are finalized, OCA and Deputy Mayors will meet with agencies once per
quarter to assess how progress on the Performance Plan is being made. These meetings can help identify areas
where progress is stalled and talk about what adjustments and assistance are needed to help move forward. In
addition, they will also serve as a way to check in and see that the agency continues to remain focused on areas
that are important to the Mayor throughout the year. For example, adjustments could need to be made for new
laws, regulations or new potential focus areas that arise after the performance plan is published. These changes
will be communicated in a transparent way where the public can see where and why a focus was changed.


Appendix F, G, Hand I
Summary Tables:FY 2017 Proposed Budget and Financial Plan
F: FY 2017 Proposed Budget - General Fund
G: FY 2017 Proposed Budget - Gross Funds
H: FY 2017 Proposed Full-Time Equivalent
Employment Authority - General Fund
I: FY 2017 Proposed Full-Time Equivalent
Employment Authority - Gross Funds


Agency
Code Agency Name
FY 2015 Actuals
General Fund
FY 2016 Approved
General Fund
FY 2017 Proposed
Local Funds
FY 2017 Proposed
Dedicated Taxes
FY 2017 Proposed
Other Funds
Total, FY 2017
Proposed
General Fund
Change from
FY 2016
Approved
General Fund
Governmental Direction and Support
AB0 Council of the District of Columbia 19,511 22,321 23,902 0 0 23,902 1,582
AC0 Office of the District of Columbia Auditor 4,460 4,663 5,202 0 0 5,202 539
DX0 Advisory Neighborhood Commissions 825 927 934 0 0 934 7
AL0 Uniform Law Commission 41 50 50 0 0 50 0
AA0 Office of the Mayor 10,021 7,825 9,069 0 0 9,069 1,244
AH0 Mayor's Office of Legal Counsel 0 1,596 1,642 0 0 1,642 46
AI0 Office of the Senior Advisor 0 1,894 2,200 0 0 2,200 306
BA0 Office of the Secretary 4,239 3,463 2,531 0 1,000 3,531 68
AE0 Office of the City Administrator 4,310 6,420 7,319 0 338 7,657 1,237
EM0 Deputy Mayor for Greater Economic Opportunity 0 698 2,946 0 0 2,946 2,248
RK0 D.C. Office of Risk Management 3,380 2,923 4,052 0 0 4,052 1,129
BE0 D.C. Department of Human Resources 8,912 8,627 8,451 0 479 8,930 303
JR0 Office of Disability Rights 980 1,070 1,103 0 0 1,103 34
RJ0 Captive Insurance Agency 2,211 1,489 2,072 0 237 2,308 820
AS0 Office of Finance and Resource Management 19,190 21,873 23,380 0 407 23,787 1,914
PO0 Office of Contracting and Procurement 16,427 21,343 23,906 0 375 24,281 2,938
TO0 Office of the Chief Technology Officer 64,466 72,417 65,994 0 12,153 78,147 5,730
AF0 Contract Appeals Board 1,201 1,449 1,492 0 0 1,492 43
AM0 Department of General Services 292,066 324,253 325,865 0 7,561 333,426 9,173
DL0 Board of Elections 7,485 7,390 7,593 0 0 7,593 203
CJ0 Office of Campaign Finance 2,439 2,704 2,792 0 0 2,792 88
CG0 Public Employee Relations Board 1,311 1,274 1,293 0 0 1,293 19
CH0 Office of Employee Appeals 1,525 1,745 1,795 0 0 1,795 51
EA0 Metropolitan Washington Council of Governments 450 472 495 0 0 495 23
AG0 D.C. Board of Ethics and Government Accountability 1,455 1,774 1,910 0 150 2,060 286
CB0 Office of the Attorney General for the District of Columbia 65,337 58,973 59,003 0 4,209 63,211 4,238
AR0 Statehood Initiatives 137 230 234 0 0 234 5
AD0 Office of the Inspector General 14,009 14,595 15,954 0 0 15,954 1,359
AT0 Office of the Chief Financial Officer 128,488 162,340 125,131 0 43,493 168,624 6,284
Total, Governmental Direction and Support 674,876 756,796 728,310 0 70,402 798,711 41,915
Appropriation Title (thousands of dollars)
Government of the District of Columbia
FY 2017 Proposed Budget
General Fund
FY 2017 Proposed Budget and Financial Plan
Page F-1

Agency
Code Agency Name
FY 2015 Actuals
General Fund
FY 2016 Approved
General Fund
FY 2017 Proposed
Local Funds
FY 2017 Proposed
Dedicated Taxes
FY 2017 Proposed
Other Funds
Total, FY 2017
Proposed
General Fund
Change from
FY 2016
Approved
General Fund
Appropriation Title (thousands of dollars)
Government of the District of Columbia
FY 2017 Proposed Budget
General Fund
Economic Development and Regulation
EB0 Office of the Deputy Mayor for Planning and Economic Development 33,589 36,378 13,473 0 20,975 34,448 -1,930
BD0 Office of Planning 9,420 9,462 9,025 0 100 9,125 -337
EN0 Department of Small and Local Business Development 8,524 9,642 10,415 0 0 10,415 772
TK0 Office of Motion Picture and Television Development* 866 0 0 0 0 0 0
CI0 Office of Cable Television, Film, Music, and Entertainment 0 13,601 1,625 0 10,339 11,964 -1,637
BJ0 Office of Zoning 2,625 2,606 2,915 0 0 2,915 309
DB0 Department of Housing and Community Development 13,521 14,666 11,986 0 3,790 15,776 1,110
CF0 Department of Employment Services 79,615 98,315 64,022 0 44,105 108,127 9,812
DA0 Real Property Tax Appeals Commission 1,680 1,636 1,703 0 0 1,703 67
CR0 Department of Consumer and Regulatory Affairs 41,623 44,012 20,008 0 35,518 55,526 11,515
CQ0 Office of the Tenant Advocate 2,191 2,788 2,788 0 0 2,788 0
BX0 D.C. Commission on the Arts and Humanities 13,728 15,196 14,475 0 200 14,675 -521
LQ0 Alcoholic Beverage Regulation Administration 6,188 8,142 0 1,170 7,098 8,268 126
DH0 Public Service Commission 12,764 12,729 0 0 13,316 13,316 587
DJ0 Office of the People's Counsel 6,405 7,648 0 0 7,436 7,436 -212
SR0 Department of Insurance, Securities, and Banking 17,624 25,610 0 0 26,279 26,279 669
CT0 Office of Cable Television* 6,881 0 0 0 0 0 0
HY0 Housing Authority Subsidy 37,699 59,425 59,425 0 0 59,425 0
HP0 Housing Production Trust Fund Subsidy 0 50,179 55,054 0 0 55,054 4,875
ID0 Business Improvement Districts Transfer 25,137 28,000 0 0 37,000 37,000 9,000
Total, Economic Development and Regulation 320,080 440,037 266,913 1,170 206,157 474,240 34,203
*In FY 2016, funding and FTEs for the Office of Motion Picture and Television Development (TK0) and the Office of Cable Television (CT0) were transferred to the Office of Cable Television, Film, Music, and Entertainment (CI0).
Public Safety and Justice
FA0 Metropolitan Police Department 483,620 513,771 516,662 0 7,864 524,526 10,755
FB0 Fire and Emergency Medical Services Department 217,243 231,798 250,003 0 1,025 251,028 19,230
FD0 Police Officers' and Fire Fighters' Retirement System 103,430 136,115 145,631 0 0 145,631 9,516
FL0 Department of Corrections 135,902 150,733 126,404 0 20,168 146,572 -4,161
FK0 District of Columbia National Guard 4,273 5,026 5,020 0 0 5,020 -7
BN0 Homeland Security and Emergency Management Agency 3,725 4,552 4,667 0 0 4,667 116
FH0 Office of Police Complaints 2,133 2,292 2,366 0 0 2,366 75
FY 2017 Proposed Budget and Financial Plan
Page F-2
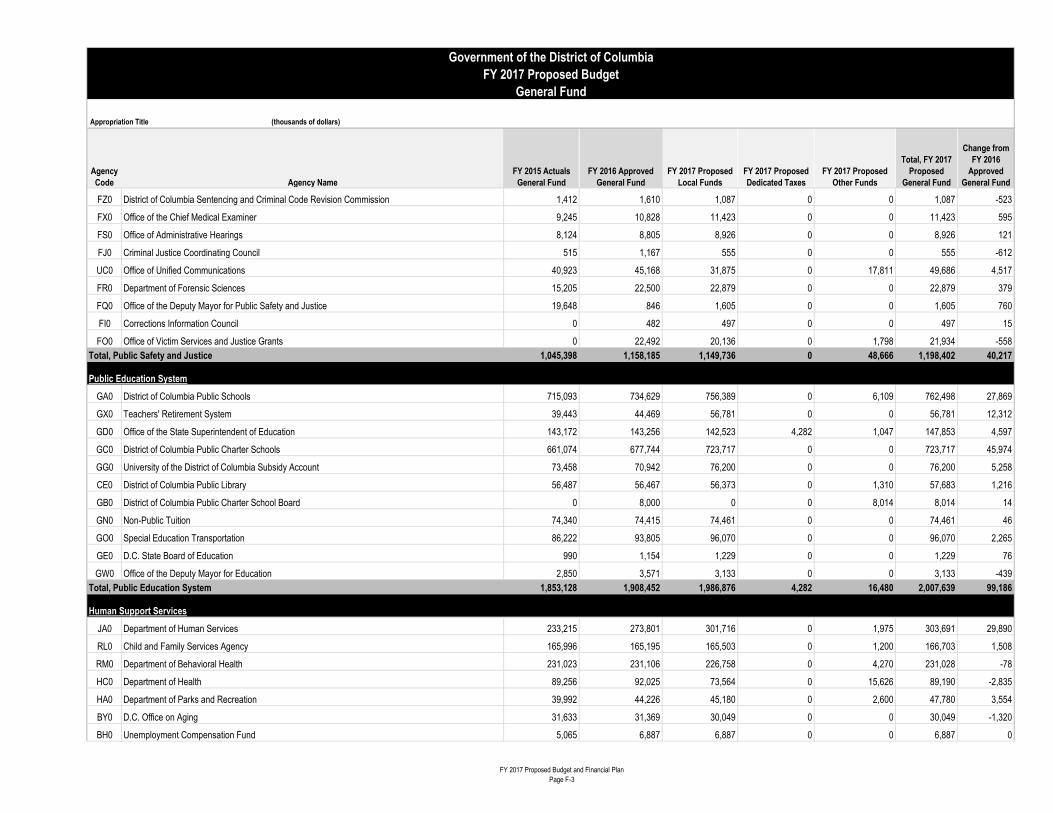
Agency
Code Agency Name
FY 2015 Actuals
General Fund
FY 2016 Approved
General Fund
FY 2017 Proposed
Local Funds
FY 2017 Proposed
Dedicated Taxes
FY 2017 Proposed
Other Funds
Total, FY 2017
Proposed
General Fund
Change from
FY 2016
Approved
General Fund
Appropriation Title (thousands of dollars)
Government of the District of Columbia
FY 2017 Proposed Budget
General Fund
FZ0 District of Columbia Sentencing and Criminal Code Revision Commission 1,412 1,610 1,087 0 0 1,087 -523
FX0 Office of the Chief Medical Examiner 9,245 10,828 11,423 0 0 11,423 595
FS0 Office of Administrative Hearings 8,124 8,805 8,926 0 0 8,926 121
FJ0 Criminal Justice Coordinating Council 515 1,167 555 0 0 555 -612
UC0 Office of Unified Communications 40,923 45,168 31,875 0 17,811 49,686 4,517
FR0 Department of Forensic Sciences 15,205 22,500 22,879 0 0 22,879 379
FQ0 Office of the Deputy Mayor for Public Safety and Justice 19,648 846 1,605 0 0 1,605 760
FI0 Corrections Information Council 0 482 497 0 0 497 15
FO0 Office of Victim Services and Justice Grants 0 22,492 20,136 0 1,798 21,934 -558
Total, Public Safety and Justice 1,045,398 1,158,185 1,149,736 0 48,666 1,198,402 40,217
Public Education System
GA0 District of Columbia Public Schools 715,093 734,629 756,389 0 6,109 762,498 27,869
GX0 Teachers' Retirement System 39,443 44,469 56,781 0 0 56,781 12,312
GD0 Office of the State Superintendent of Education 143,172 143,256 142,523 4,282 1,047 147,853 4,597
GC0 District of Columbia Public Charter Schools 661,074 677,744 723,717 0 0 723,717 45,974
GG0 University of the District of Columbia Subsidy Account 73,458 70,942 76,200 0 0 76,200 5,258
CE0 District of Columbia Public Library 56,487 56,467 56,373 0 1,310 57,683 1,216
GB0 District of Columbia Public Charter School Board 0 8,000 0 0 8,014 8,014 14
GN0 Non-Public Tuition 74,340 74,415 74,461 0 0 74,461 46
GO0 Special Education Transportation 86,222 93,805 96,070 0 0 96,070 2,265
GE0 D.C. State Board of Education 990 1,154 1,229 0 0 1,229 76
GW0 Office of the Deputy Mayor for Education 2,850 3,571 3,133 0 0 3,133 -439
Total, Public Education System 1,853,128 1,908,452 1,986,876 4,282 16,480 2,007,639 99,186
Human Support Services
JA0 Department of Human Services 233,215 273,801 301,716 0 1,975 303,691 29,890
RL0 Child and Family Services Agency 165,996 165,195 165,503 0 1,200 166,703 1,508
RM0 Department of Behavioral Health 231,023 231,106 226,758 0 4,270 231,028 -78
HC0 Department of Health 89,256 92,025 73,564 0 15,626 89,190 -2,835
HA0 Department of Parks and Recreation 39,992 44,226 45,180 0 2,600 47,780 3,554
BY0 D.C. Office on Aging 31,633 31,369 30,049 0 0 30,049 -1,320
BH0 Unemployment Compensation Fund 5,065 6,887 6,887 0 0 6,887 0
FY 2017 Proposed Budget and Financial Plan
Page F-3

Agency
Code Agency Name
FY 2015 Actuals
General Fund
FY 2016 Approved
General Fund
FY 2017 Proposed
Local Funds
FY 2017 Proposed
Dedicated Taxes
FY 2017 Proposed
Other Funds
Total, FY 2017
Proposed
General Fund
Change from
FY 2016
Approved
General Fund
Appropriation Title (thousands of dollars)
Government of the District of Columbia
FY 2017 Proposed Budget
General Fund
BG0 Employees' Compensation Fund 19,886 20,221 21,521 0 0 21,521 1,300
HM0 Office of Human Rights 3,134 3,741 3,860 0 0 3,860 119
BZ0 Office on Latino Affairs 2,670 2,782 2,799 0 0 2,799 17
JY0 Children and Youth Investment Collaborative 7,000 5,510 4,920 0 0 4,920 -590
AP0 Office on Asian and Pacific Islander Affairs 946 835 855 0 0 855 20
VA0 Office of Veterans' Affairs 323 419 408 0 5 413 -6
JZ0 Department of Youth Rehabilitation Services 94,967 105,676 101,529 0 0 101,529 -4,147
JM0 Department on Disability Services 118,824 124,988 118,738 0 7,163 125,902 914
HT0 Department of Health Care Finance 805,296 773,961 706,421 81,907 3,493 791,821 17,860
HX0 Not-for-Profit Hospital Corporation Subsidy 7,000 0 2,000 0 0 2,000 2,000
HE0 D.C. Health Benefit Exchange Subsidy 0 29,614 0 0 0 0 -29,614
HG0 Office of the Deputy Mayor for Health and Human Services 1,261 1,391 2,086 0 0 2,086 695
Total, Human Support Services 1,857,486 1,913,747 1,814,796 81,907 36,332 1,933,035 19,288
Public Works
KT0 Department of Public Works 130,682 133,355 136,295 0 7,561 143,856 10,501
KA0 District Department of Transportation 86,308 105,731 74,436 0 24,418 98,853 -6,878
KV0 Department of Motor Vehicles 34,709 38,105 29,899 0 9,864 39,763 1,658
KG0 Department of Energy and Environment 58,229 77,963 17,226 0 59,814 77,040 -923
TC0 D.C. Taxicab Commission 7,288 8,399 4,068 0 7,842 11,910 3,511
KC0 Washington Metropolitan Area Transit Commission 127 127 139 0 0 139 12
KE0 Washington Metropolitan Area Transit Authority 335,703 372,213 248,361 66,670 53,600 368,631 -3,582
Total, Public Works 653,046 735,893 510,423 66,670 163,099 740,192 4,299
Financing and Other
DS0 Repayment of Loans and Interest 568,132 596,741 620,191 0 5,319 625,510 28,770
ZA0 Repayment of Interest on Short-Term Borrowings 723 3,750 2,500 0 0 2,500 -1,250
ZB0 Debt Service - Issuance Costs 5,638 6,000 6,000 0 0 6,000 0
SM0 Schools Modernization Fund 11,412 14,276 13,523 0 0 13,523 -753
DT0 Repayment of Revenue Bonds 7,829 7,832 0 7,835 0 7,835 3
ZH0 Settlements and Judgments 17,222 21,292 21,292 0 0 21,292 0
ZZ0 John A. Wilson Building Fund 4,336 4,745 4,369 0 0 4,369 -376
UP0 Workforce Investments 0 17,815 18,025 0 0 18,025 210
FY 2017 Proposed Budget and Financial Plan
Page F-4

Agency
Code Agency Name
FY 2015 Actuals
General Fund
FY 2016 Approved
General Fund
FY 2017 Proposed
Local Funds
FY 2017 Proposed
Dedicated Taxes
FY 2017 Proposed
Other Funds
Total, FY 2017
Proposed
General Fund
Change from
FY 2016
Approved
General Fund
Appropriation Title (thousands of dollars)
Government of the District of Columbia
FY 2017 Proposed Budget
General Fund
DO0 Non-Departmental 0 21,286 2,504 0 3,142 5,646 -15,640
ELO Master Equipment Lease/Purchase Program 43,778 48,413 30,009 0 0 30,009 -18,404
PA0 Pay-As-You-Go Capital Fund 136,245 72,466 75,705 0 49,589 125,294 52,829
RH0 District Retiree Health Contribution 91,400 95,400 31,000 0 0 31,000 -64,400
KZ0 Highway Transportation Fund - Transfers 40,210 22,504 0 24,754 0 24,754 2,250
EZ0 Convention Center Transfer-Dedicated Taxes 120,448 125,054 3,186 119,100 0 122,286 -2,767
ZV0 Section 103 Judgments - Financing and Other 21,100 0 0 0 0 0 0
Total, Financing and Other 1,068,473 1,057,573 828,305 151,689 58,050 1,038,044 -19,529
TOTAL GENERAL OPERATING FUNDS 7,472,486 7,970,683 7,285,360 305,718 599,185 8,190,263 219,580
Note: Agency budgets in this table are entered at the whole dollar but rounded to nearest thousands of dollars by funding type. This may cause rounding differences at the General Fund level.
FY 2017 Proposed Budget and Financial Plan
Page F-5


Agency
Code Agency Name
FY 2015
Actuals
Gross Funds
FY 2016
Approved
Budget
Gross Funds Local Funds
Dedicated
Taxes
Other
Funds
Subtotal,
General
Fund
Federal
Funds
Private
Funds
Enterprise
and Other-
Dedicated
Taxes
Enterprise
and Other
Subtotal Gross
Funds - Less
Intra-District
Funds
Intra-
District
Funds
Total FY 2017
Proposed Budget
Gross Funds
Governmental Direction and Support
AB0 Council of the District of Columbia 19,539 22,391 23,902 0 0 23,902 0 0 0 0 23,902 30 23,932
AC0 Office of the District of Columbia Auditor 4,460 4,663 5,202 0 0 5,202 0 0 0 0 5,202 0 5,202
DX0 Advisory Neighborhood Commissions 825 927 934 0 0 934 0 0 0 0 934 0 934
AL0 Uniform Law Commission 41 50 50 0 0 50 0 0 0 0 50 0 50
AA0 Office of the Mayor 14,158 11,519 9,069 0 0 9,069 3,535 0 0 0 12,604 682 13,286
AH0 Mayor's Office of Legal Counsel 0 1,596 1,642 0 0 1,642 0 0 0 0 1,642 0 1,642
AI0 Office of the Senior Advisor 0 1,894 2,200 0 0 2,200 0 0 0 0 2,200 0 2,200
BA0 Office of the Secretary 4,440 3,463 2,531 0 1,000 3,531 0 0 0 0 3,531 0 3,531
AE0 Office of the City Administrator 5,027 6,420 7,319 0 338 7,657 0 0 0 0 7,657 0 7,657
EM0 Deputy Mayor for Greater Economic Opportunity 0 698 2,946 0 0 2,946 0 0 0 0 2,946 395 3,341
RK0 D.C. Office of Risk Management 3,380 2,923 4,052 0 0 4,052 0 0 0 0 4,052 0 4,052
BE0 D.C. Department of Human Resources 15,973 13,830 8,451 0 479 8,930 0 0 0 0 8,930 5,858 14,788
JR0 Office of Disability Rights 1,612 1,713 1,103 0 0 1,103 522 0 0 0 1,625 145 1,770
RJ0 Captive Insurance Agency 2,211 1,489 2,072 0 237 2,308 0 0 0 0 2,308 0 2,308
AS0 Office of Finance and Resource Management 28,668 36,512 23,380 0 407 23,787 0 0 0 0 23,787 12,737 36,524
PO0 Office of Contracting and Procurement 45,682 22,823 23,906 0 375 24,281 0 0 0 0 24,281 2,380 26,661
TO0 Office of the Chief Technology Officer 101,770 104,174 65,994 0 12,153 78,147 48 0 0 0 78,195 32,196 110,391
AF0 Contract Appeals Board 1,201 1,449 1,492 0 0 1,492 0 0 0 0 1,492 0 1,492
AM0 Department of General Services 423,275 464,753 325,865 0 7,561 333,426 0 0 0 0 333,426 143,990 477,416
DL0 Board of Elections 7,691 7,390 7,593 0 0 7,593 0 0 0 0 7,593 0 7,593
CJ0 Office of Campaign Finance 2,439 2,704 2,792 0 0 2,792 0 0 0 0 2,792 0 2,792
CG0 Public Employee Relations Board 1,311 1,274 1,293 0 0 1,293 0 0 0 0 1,293 0 1,293
CH0 Office of Employee Appeals 1,525 1,745 1,795 0 0 1,795 0 0 0 0 1,795 0 1,795
EA0 Metropolitan Washington Council of Governments 450 472 495 0 0 495 0 0 0 0 495 0 495
AG0 D.C. Board of Ethics and Government Accountability 1,455 1,774 1,910 0 150 2,060 0 0 0 0 2,060 0 2,060
CB0 Office of the Attorney General for the District of Columbia 85,738 84,029 59,003 0 4,209 63,211 22,570 456 0 0 86,238 3,052 89,290
AR0 Statehood Initiatives 137 230 234 0 0 234 0 0 0 0 234 0 234
AD0 Office of the Inspector General 16,103 17,215 15,954 0 0 15,954 2,569 0 0 0 18,522 0 18,522
AT0 Office of the Chief Financial Officer 136,336 170,934 125,131 0 43,493 168,624 525 0 0 0 169,149 8,640 177,789
Total, Governmental Direction and Support 925,449 991,052 728,310 0 70,402 798,711 29,770 456 0 0 828,937 210,105 1,039,043
Government of the District of Columbia
FY 2017 Proposed Budget
Gross Funds
FY 2017 Proposed Budget by Type of Funding Appropriation Title (thousands of dollars)
FY 2017 Proposed Budget and Financial Plan
Page G-1

Agency
Code Agency Name
FY 2015
Actuals
Gross Funds
FY 2016
Approved
Budget
Gross Funds Local Funds
Dedicated
Taxes
Other
Funds
Subtotal,
General
Fund
Federal
Funds
Private
Funds
Enterprise
and Other-
Dedicated
Taxes
Enterprise
and Other
Subtotal Gross
Funds - Less
Intra-District
Funds
Intra-
District
Funds
Total FY 2017
Proposed Budget
Gross Funds
Government of the District of Columbia
FY 2017 Proposed Budget
Gross Funds
FY 2017 Proposed Budget by Type of Funding Appropriation Title (thousands of dollars)
Economic Development and Regulation
EB0 Office of the Deputy Mayor for Planning and Economic Development 34,499 39,872 13,473 0 20,975 34,448 1,756 0 0 0 36,204 0 36,204
BD0 Office of Planning 10,167 10,312 9,025 0 100 9,125 525 10 0 0 9,660 140 9,800
EN0 Department of Small and Local Business Development 9,501 10,338 10,415 0 0 10,415 579 0 0 0 10,993 0 10,993
TK0 Office of Motion Picture and Television Development* 866 0 0 0 0 0 0 0 0 0 0 0 0
CI0 Office of Cable Television, Film, Music, and Entertainment 0 13,601 1,625 0 10,339 11,964 0 0 0 0 11,964 0 11,964
BJ0 Office of Zoning 2,644 2,630 2,915 0 0 2,915 0 0 0 0 2,915 24 2,939
DB0 Department of Housing and Community Development 128,707 285,210 11,986 0 3,790 15,776 53,754 0 0 0 69,530 101,178 170,708
CF0 Department of Employment Services 113,796 146,695 64,022 0 44,105 108,127 35,350 1 0 0 143,478 0 143,478
DA0 Real Property Tax Appeals Commission 1,680 1,636 1,703 0 0 1,703 0 0 0 0 1,703 0 1,703
CR0 Department of Consumer and Regulatory Affairs 43,517 44,012 20,008 0 35,518 55,526 0 0 0 0 55,526 0 55,526
CQ0 Office of the Tenant Advocate 2,191 2,907 2,788 0 0 2,788 0 0 0 0 2,788 0 2,788
BX0 D.C. Commission on the Arts and Humanities 14,555 15,955 14,475 0 200 14,675 692 0 0 0 15,366 168 15,534
LQ0 Alcoholic Beverage Regulation Administration 6,188 8,142 0 1,170 7,098 8,268 0 0 0 0 8,268 0 8,268
DH0 Public Service Commission 13,277 13,186 0 0 13,316 13,316 551 22 0 0 13,889 0 13,889
DJ0 Office of the People's Counsel 6,405 7,648 0 0 7,436 7,436 0 0 0 0 7,436 0 7,436
SR0 Department of Insurance, Securities, and Banking 18,531 25,821 0 0 26,279 26,279 0 0 0 0 26,279 125 26,404
CT0 Office of Cable Television* 6,890 0 0 0 0 0 0 0 0 0 0 0 0
HY0 Housing Authority Subsidy 37,699 59,425 59,425 0 0 59,425 0 0 0 0 59,425 0 59,425
HP0 Housing Production Trust Fund Subsidy 0 50,179 55,054 0 0 55,054 0 0 0 0 55,054 0 55,054
ID0 Business Improvement Districts Transfer 25,137 28,000 0 0 37,000 37,000 0 0 0 0 37,000 0 37,000
Total, Economic Development and Regulation 476,251 765,571 266,913 1,170 206,157 474,240 93,207 33 0 0 567,480 101,635 669,115
*In FY 2016, funding and FTEs for the Office of Motion Picture and Television Development (TK0) and the Office of Cable Television (CT0) were transferred to the Office of Cable Television, Film, Music, and Entertainment (CI0).
Public Safety and Justice
FA0 Metropolitan Police Department 525,631 541,532 516,662 0 7,864 524,526 3,229 0 0 0 527,756 25,378 553,134
FB0 Fire and Emergency Medical Services Department 223,200 231,798 250,003 0 1,025 251,028 3,022 0 0 0 254,050 400 254,450
FD0 Police Officers' and Fire Fighters' Retirement System 103,430 136,115 145,631 0 0 145,631 0 0 0 0 145,631 0 145,631
FL0 Department of Corrections 136,504 150,919 126,404 0 20,168 146,572 0 0 0 0 146,572 351 146,923
FK0 District of Columbia National Guard 10,911 13,317 5,020 0 0 5,020 8,163 0 0 0 13,183 0 13,183
BN0 Homeland Security and Emergency Management Agency 74,994 132,744 4,667 0 0 4,667 129,862 0 0 0 134,529 0 134,529
DQ0 Commission on Judicial Disabilities and Tenure 307 295 0 0 0 0 310 0 0 0 310 0 310
FY 2017 Proposed Budget and Financial Plan
Page G-2

Agency
Code Agency Name
FY 2015
Actuals
Gross Funds
FY 2016
Approved
Budget
Gross Funds Local Funds
Dedicated
Taxes
Other
Funds
Subtotal,
General
Fund
Federal
Funds
Private
Funds
Enterprise
and Other-
Dedicated
Taxes
Enterprise
and Other
Subtotal Gross
Funds - Less
Intra-District
Funds
Intra-
District
Funds
Total FY 2017
Proposed Budget
Gross Funds
Government of the District of Columbia
FY 2017 Proposed Budget
Gross Funds
FY 2017 Proposed Budget by Type of Funding Appropriation Title (thousands of dollars)
DV0 Judicial Nomination Commission 202 270 0 0 0 0 275 0 0 0 275 0 275
FH0 Office of Police Complaints 2,133 2,292 2,366 0 0 2,366 0 0 0 0 2,366 0 2,366
FZ0 District of Columbia Sentencing and Criminal Code Revision Commission 1,412 1,610 1,087 0 0 1,087 0 0 0 0 1,087 0 1,087
FX0 Office of the Chief Medical Examiner 9,731 10,884 11,423 0 0 11,423 0 0 0 0 11,423 512 11,935
FS0 Office of Administrative Hearings 9,561 10,220 8,926 0 0 8,926 60 0 0 0 8,986 1,645 10,632
FJ0 Criminal Justice Coordinating Council 2,779 3,142 555 0 0 555 2,000 0 0 0 2,555 75 2,630
UC0 Office of Unified Communications 41,743 45,468 31,875 0 17,811 49,686 0 0 0 0 49,686 325 50,011
FT0 Homeland Security Grants 5,924 4,134 0 0 0 0 0 0 0 0 0 4,077 4,077
FR0 Department of Forensic Sciences 16,149 23,275 22,879 0 0 22,879 376 0 0 0 23,255 821 24,076
FQ0 Office of the Deputy Mayor for Public Safety and Justice 26,302 846 1,605 0 0 1,605 0 0 0 0 1,605 0 1,605
FI0 Corrections Information Council 0 482 497 0 0 497 0 0 0 0 497 0 497
FO0 Office of Victim Services and Justice Grants 0 30,363 20,136 0 1,798 21,934 12,257 0 0 0 34,191 0 34,191
Total, Public Safety and Justice 1,190,913 1,339,704 1,149,736 0 48,666 1,198,402 159,554 0 0 0 1,357,956 33,585 1,391,542
Public Education System
GA0 District of Columbia Public Schools 875,542 885,942 756,389 0 6,109 762,498 41,648 220 0 0 804,365 101,516 905,882
GX0 Teachers' Retirement System 39,443 44,469 56,781 0 0 56,781 0 0 0 0 56,781 0 56,781
GD0 Office of the State Superintendent of Education 406,901 454,034 142,523 4,282 1,047 147,853 320,803 0 0 0 468,655 37,802 506,458
GC0 District of Columbia Public Charter Schools 661,074 677,744 723,717 0 0 723,717 0 0 0 0 723,717 0 723,717
GG0 University of the District of Columbia Subsidy Account 73,458 70,942 76,200 0 0 76,200 0 0 0 0 76,200 0 76,200
CE0 District of Columbia Public Library 57,451 57,402 56,373 0 1,310 57,683 924 0 0 0 58,607 17 58,624
GB0 District of Columbia Public Charter School Board 0 8,000 0 0 8,014 8,014 0 0 0 0 8,014 0 8,014
GN0 Non-Public Tuition 74,340 74,415 74,461 0 0 74,461 0 0 0 0 74,461 0 74,461
GO0 Special Education Transportation 101,510 97,305 96,070 0 0 96,070 0 0 0 0 96,070 3,000 99,070
GE0 D.C. State Board of Education 990 1,182 1,229 0 0 1,229 0 18 0 0 1,248 0 1,248
GW0 Office of the Deputy Mayor for Education 2,850 3,571 3,133 0 0 3,133 0 0 0 0 3,133 0 3,133
Total, Public Education System 2,293,559 2,375,007 1,986,876 4,282 16,480 2,007,639 363,375 238 0 0 2,371,251 142,336 2,513,587
Human Support Services
JA0 Department of Human Services 397,845 463,062 301,716 0 1,975 303,691 208,434 0 0 0 512,126 2,852 514,978
RL0 Child and Family Services Agency 230,672 244,837 165,503 0 1,200 166,703 63,778 40 0 0 230,522 1,058 231,580
RM0 Department of Behavioral Health 271,469 272,717 226,758 0 4,270 231,028 23,443 544 0 0 255,014 18,408 273,422
HC0 Department of Health 266,124 261,769 73,564 0 15,626 89,190 133,205 0 0 0 222,394 64,823 287,217
FY 2017 Proposed Budget and Financial Plan
Page G-3

Agency
Code Agency Name
FY 2015
Actuals
Gross Funds
FY 2016
Approved
Budget
Gross Funds Local Funds
Dedicated
Taxes
Other
Funds
Subtotal,
General
Fund
Federal
Funds
Private
Funds
Enterprise
and Other-
Dedicated
Taxes
Enterprise
and Other
Subtotal Gross
Funds - Less
Intra-District
Funds
Intra-
District
Funds
Total FY 2017
Proposed Budget
Gross Funds
Government of the District of Columbia
FY 2017 Proposed Budget
Gross Funds
FY 2017 Proposed Budget by Type of Funding Appropriation Title (thousands of dollars)
HA0 Department of Parks and Recreation 42,223 46,701 45,180 0 2,600 47,780 0 0 0 0 47,780 2,475 50,255
BY0 D.C. Office on Aging 42,125 41,213 30,049 0 0 30,049 8,769 0 0 0 38,819 1,662 40,480
BH0 Unemployment Compensation Fund 5,065 6,887 6,887 0 0 6,887 0 0 0 0 6,887 0 6,887
BG0 Employees' Compensation Fund 19,886 20,221 21,521 0 0 21,521 0 0 0 0 21,521 0 21,521
HM0 Office of Human Rights 3,720 4,008 3,860 0 0 3,860 322 0 0 0 4,182 40 4,222
BZ0 Office on Latino Affairs 3,065 3,177 2,799 0 0 2,799 0 0 0 0 2,799 396 3,195
JY0 Children and Youth Investment Collaborative 7,000 5,510 4,920 0 0 4,920 0 0 0 0 4,920 0 4,920
AP0 Office on Asian and Pacific Islander Affairs 1,151 835 855 0 0 855 0 0 0 0 855 0 855
VA0 Office of Veterans' Affairs 323 419 408 0 5 413 0 0 0 0 413 0 413
JZ0 Department of Youth Rehabilitation Services 96,002 106,020 101,529 0 0 101,529 0 0 0 0 101,529 344 101,873
JM0 Department on Disability Services 156,255 162,425 118,738 0 7,163 125,902 40,646 10 0 0 166,558 50 166,607
HT0 Department of Health Care Finance 2,764,826 3,005,454 706,421 81,907 3,493 791,821 2,191,023 0 0 0 2,982,843 89,063 3,071,906
HX0 Not-for-Profit Hospital Corporation Subsidy 7,000 0 2,000 0 0 2,000 0 0 0 0 2,000 0 2,000
HE0 D.C. Health Benefit Exchange Subsidy 0 29,614 0 0 0 0 0 0 0 0 0 0 0
HG0 Office of the Deputy Mayor for Health and Human Services 1,261 1,391 2,086 0 0 2,086 0 0 0 0 2,086 0 2,086
Total, Human Support Services 4,316,011 4,676,260 1,814,796 81,907 36,332 1,933,035 2,669,620 594 0 0 4,603,249 181,169 4,784,418
Public Works
KT0 Department of Public Works 155,141 158,045 136,295 0 7,561 143,856 0 0 0 0 143,856 27,210 171,066
KA0 District Department of Transportation 91,506 113,676 74,436 0 24,418 98,853 11,695 0 0 0 110,548 308 110,856
KV0 Department of Motor Vehicles 38,215 43,148 29,899 0 9,864 39,763 0 0 0 0 39,763 5,270 45,033
KG0 Department of Energy and Environment 80,055 106,215 17,226 0 59,814 77,040 27,937 0 0 0 104,977 1,875 106,851
TC0 D.C. Taxicab Commission 8,032 8,599 4,068 0 7,842 11,910 0 0 0 0 11,910 200 12,110
KC0 Washington Metropolitan Area Transit Commission 127 127 139 0 0 139 0 0 0 0 139 0 139
KE0 Washington Metropolitan Area Transit Authority 335,703 372,213 248,361 66,670 53,600 368,631 0 0 0 0 368,631 0 368,631
Total, Public Works 708,778 802,023 510,423 66,670 163,099 740,192 39,632 0 0 0 779,824 34,863 814,686
Financing and Other
DS0 Repayment of Loans and Interest 586,572 615,003 620,191 0 5,319 625,510 18,262 0 0 0 643,772 0 643,772
ZA0 Repayment of Interest on Short-Term Borrowings 723 3,750 2,500 0 0 2,500 0 0 0 0 2,500 0 2,500
ZB0 Debt Service - Issuance Costs 5,638 6,000 6,000 0 0 6,000 0 0 0 0 6,000 0 6,000
SM0 Schools Modernization Fund 11,412 14,276 13,523 0 0 13,523 0 0 0 0 13,523 0 13,523
DT0 Repayment of Revenue Bonds 7,829 7,832 0 7,835 0 7,835 0 0 0 0 7,835 0 7,835
FY 2017 Proposed Budget and Financial Plan
Page G-4

Agency
Code Agency Name
FY 2015
Actuals
Gross Funds
FY 2016
Approved
Budget
Gross Funds Local Funds
Dedicated
Taxes
Other
Funds
Subtotal,
General
Fund
Federal
Funds
Private
Funds
Enterprise
and Other-
Dedicated
Taxes
Enterprise
and Other
Subtotal Gross
Funds - Less
Intra-District
Funds
Intra-
District
Funds
Total FY 2017
Proposed Budget
Gross Funds
Government of the District of Columbia
FY 2017 Proposed Budget
Gross Funds
FY 2017 Proposed Budget by Type of Funding Appropriation Title (thousands of dollars)
ZH0 Settlements and Judgments 17,222 21,292 21,292 0 0 21,292 0 0 0 0 21,292 0 21,292
ZZ0 John A. Wilson Building Fund 4,336 4,745 4,369 0 0 4,369 0 0 0 0 4,369 0 4,369
UP0 Workforce Investments 0 17,815 18,025 0 0 18,025 0 0 0 0 18,025 0 18,025
DO0 Non-Departmental 0 21,286 2,504 0 3,142 5,646 0 0 0 0 5,646 0 5,646
EP0 Emergency Planning and Security Fund 19,009 13,000 0 0 0 0 34,895 0 0 0 34,895 0 34,895
ELO Master Equipment Lease/Purchase Program 43,778 48,413 30,009 0 0 30,009 0 0 0 0 30,009 0 30,009
PA0 Pay-As-You-Go Capital Fund 136,245 72,466 75,705 0 49,589 125,294 0 0 0 0 125,294 0 125,294
RH0 District Retiree Health Contribution 91,400 95,400 31,000 0 0 31,000 0 0 0 0 31,000 0 31,000
KZ0 Highway Transportation Fund - Transfers 40,210 22,504 0 24,754 0 24,754 0 0 0 0 24,754 0 24,754
EZ0 Convention Center Transfer-Dedicated Taxes 120,448 125,054 3,186 119,100 0 122,286 0 0 0 0 122,286 0 122,286
ZV0 Section 103 Judgments - Financing and Other 21,100 0 0 0 0 0 0 0 0 0 0 0 0
Total, Financing and Other 1,105,922 1,088,835 828,305 151,689 58,050 1,038,044 53,157 0 0 0 1,091,201 0 1,091,201
TOTAL GENERAL OPERATING FUNDS 11,016,883 12,038,453 7,285,360 305,718 599,185 8,190,263 3,408,315 1,321 0 0 11,599,899 703,693 12,303,592
Enterprise and Other Funds
LA0 Water and Sewer Authority* 541,605 0 0 0 0 0 0 0 535,825 535,825 0 535,825
LB0 Washington Aqueduct* 62,728 0 0 0 0 0 0 0 59,770 59,770 0 59,770
DC0 D.C. Lottery and Charitable Games Control Board 212,190 220,000 0 0 0 0 0 0 0 215,000 215,000 0 215,000
DY0 District of Columbia Retirement Board* 32,302 0 0 0 0 0 0 0 39,096 39,096 0 39,096
ES0 Washington Convention and Sports Authority* 134,670 0 0 0 0 0 0 0 146,959 146,959 0 146,959
HF0 Housing Finance Agency* 10,798 0 0 0 0 0 0 0 11,740 11,740 0 11,740
GF0 University of the District of Columbia* 153,968 0 0 0 0 0 0 0 162,543 162,543 0 162,543
UW0 D.C. Public Library Agency Trust Fund 0 17 0 0 0 0 0 0 0 17 17 0 17
UI0 Unemployment Insurance Trust Fund 118,778 235,000 0 0 0 0 0 0 0 194,147 194,147 0 194,147
UZ0 Housing Production Trust Fund 73,009 100,000 0 0 0 0 0 0 44,946 55,054 100,000 0 100,000
TX0 Tax Increment Financing (TIF) Program 57,499 70,006 0 0 0 0 0 0 54,756 0 54,756 0 54,756
BK0 Ballpark Revenue Fund 66,304 67,507 0 0 0 0 0 0 56,947 11,538 68,485 0 68,485
TY0 Repayment of PILOT Financing 15,901 18,741 0 0 0 0 0 0 31,113 0 31,113 0 31,113
HW0 Not-for-Profit Hospital Corporation * 129,000 0 0 0 0 0 0 0 132,000 132,000 0 132,000
FY 2017 Proposed Budget and Financial Plan
Page G-5

Agency
Code Agency Name
FY 2015
Actuals
Gross Funds
FY 2016
Approved
Budget
Gross Funds Local Funds
Dedicated
Taxes
Other
Funds
Subtotal,
General
Fund
Federal
Funds
Private
Funds
Enterprise
and Other-
Dedicated
Taxes
Enterprise
and Other
Subtotal Gross
Funds - Less
Intra-District
Funds
Intra-
District
Funds
Total FY 2017
Proposed Budget
Gross Funds
Government of the District of Columbia
FY 2017 Proposed Budget
Gross Funds
FY 2017 Proposed Budget by Type of Funding Appropriation Title (thousands of dollars)
HI0 D.C. Health Benefit Exchange Authority 55,122 32,513 0 0 0 0 0 0 0 34,521 34,521 0 34,521
TF0 D.C. Tobacco Settlement Financing Corp. 40,409 0 0 0 0 0 0 0 0 0 0 0 0
Total, Enterprise and Other Funds 639,211 1,808,855 0 0 0 0 0 0 187,762 1,598,210 1,785,972 0 1,785,972
GRAND TOTAL, DISTRICT GOVERNMENT 11,656,094 13,847,308 7,285,360 305,718 599,185 8,190,263 3,408,315 1,321 187,762 1,598,210 13,385,871 703,693 14,089,565
*These agencies do not use the District's financial system for their actual expenditure transactions.
Note: Agency budgets in this table are entered at the whole dollar but rounded to nearest thousands of dollars by funding type. This may cause rounding differences at the Gross Funds level.
FY 2017 Proposed Budget and Financial Plan
Page G-6

Agency
Code Agency Name
FY 2015
Actuals
General Fund
FTEs
FY 2016
Approved
General Fund
FTEs
FY 2017
Proposed
Local Funds
FTEs
FY 2017
Proposed
Dedicated Taxes
FTEs
FY 2017
Proposed
Other Funds
FTEs
Total, FY 2017
Proposed
General Fund
FTEs
Change from
FY 2016
Approved
General Fund
FTEs
Governmental Direction and Support
AB0 Council of the District of Columbia 171.2 189.5 197.5 0.0 0.0 197.5 8.0
AC0 Office of the District of Columbia Auditor 31.0 31.0 33.0 0.0 0.0 33.0 2.0
DX0 Advisory Neighborhood Commissions 2.5 2.5 2.5 0.0 0.0 2.5 0.0
AA0 Office of the Mayor 76.3 66.2 79.8 0.0 0.0 79.8 13.6
AH0 Mayor's Office of Legal Counsel 0.0 11.0 10.0 0.0 0.0 10.0 -1.0
AI0 Office of the Senior Advisor 0.0 17.0 17.0 0.0 0.0 17.0 0.0
BA0 Office of the Secretary 29.1 25.0 19.0 0.0 6.0 25.0 0.0
AE0 Office of the City Administrator 32.6 53.0 49.5 0.0 2.5 52.0 -1.0
EM0 Deputy Mayor for Greater Economic Opportunity 0.0 5.0 14.0 0.0 0.0 14.0 9.0
RK0 D.C. Office of Risk Management 22.3 25.0 36.0 0.0 0.0 36.0 11.0
BE0 D.C. Department of Human Resources 92.6 89.3 84.0 0.0 6.3 90.3 1.0
JR0 Office of Disability Rights 8.0 8.0 8.0 0.0 0.0 8.0 0.0
RJ0 Captive Insurance Agency 0.0 0.0 0.0 0.0 1.0 1.0 1.0
AS0 Office of Finance and Resource Management 38.9 39.0 38.8 0.0 0.0 38.8 -0.2
PO0 Office of Contracting and Procurement 180.7 178.0 198.0 0.0 0.0 198.0 20.0
TO0 Office of the Chief Technology Officer 204.0 204.8 195.9 0.0 15.9 211.8 7.0
AF0 Contract Appeals Board 9.6 10.0 10.0 0.0 0.0 10.0 0.0
AM0 Department of General Services 651.4 678.0 667.7 0.0 13.5 681.2 3.2
DL0 Board of Elections 62.4 60.0 60.0 0.0 0.0 60.0 0.0
CJ0 Office of Campaign Finance 32.4 30.0 30.0 0.0 0.0 30.0 0.0
CG0 Public Employee Relations Board 9.3 9.0 9.0 0.0 0.0 9.0 0.0
CH0 Office of Employee Appeals 13.7 15.0 15.0 0.0 0.0 15.0 0.0
AG0 D.C. Board of Ethics and Government Accountability 13.9 15.0 15.0 0.0 0.0 15.0 0.0
CB0 Office of the Attorney General for the District of Columbia 483.9 410.6 401.6 0.0 6.7 408.3 -2.3
AR0 Statehood Initiatives 2.3 1.0 1.0 0.0 0.0 1.0 0.0
Appropriation Title
Government of the District of Columbia
FY 2017 Proposed Full-Time Equivalent Employment Authority
General Fund
FY 2017 Proposed Budget and Financial Plan
Page H-1
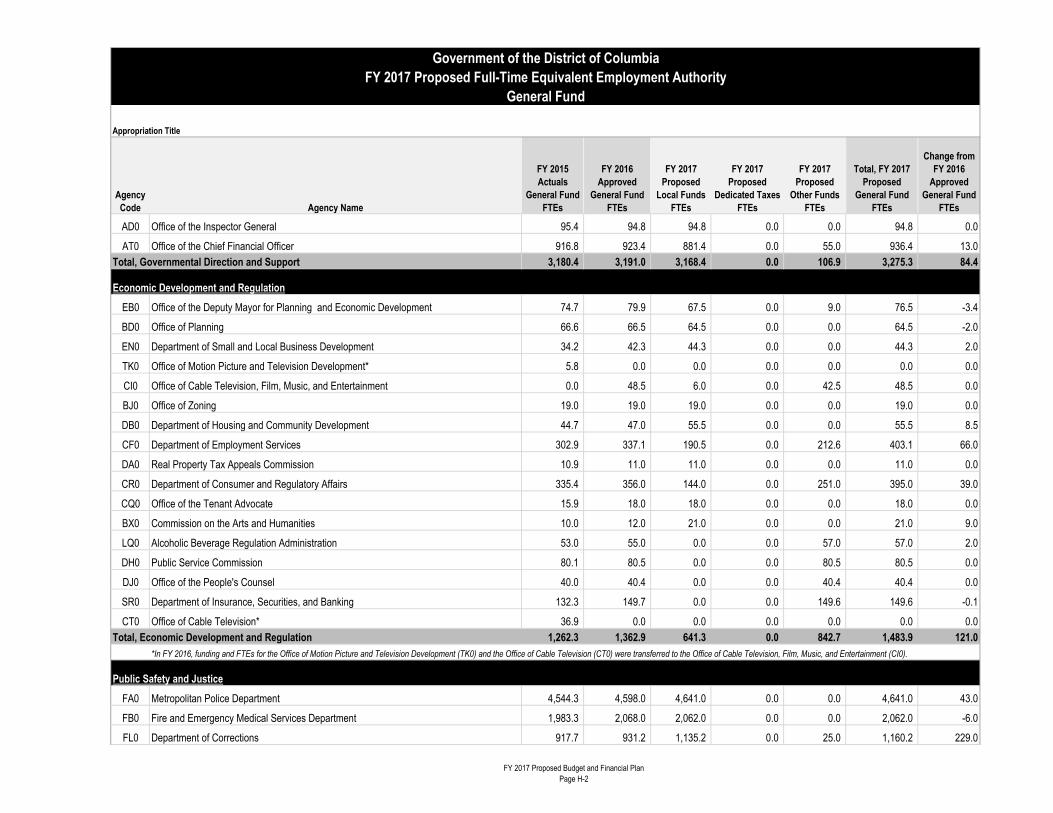
Agency
Code Agency Name
FY 2015
Actuals
General Fund
FTEs
FY 2016
Approved
General Fund
FTEs
FY 2017
Proposed
Local Funds
FTEs
FY 2017
Proposed
Dedicated Taxes
FTEs
FY 2017
Proposed
Other Funds
FTEs
Total, FY 2017
Proposed
General Fund
FTEs
Change from
FY 2016
Approved
General Fund
FTEs
Appropriation Title
Government of the District of Columbia
FY 2017 Proposed Full-Time Equivalent Employment Authority
General Fund
AD0 Office of the Inspector General 95.4 94.8 94.8 0.0 0.0 94.8 0.0
AT0 Office of the Chief Financial Officer 916.8 923.4 881.4 0.0 55.0 936.4 13.0
Total, Governmental Direction and Support 3,180.4 3,191.0 3,168.4 0.0 106.9 3,275.3 84.4
Economic Development and Regulation
EB0 Office of the Deputy Mayor for Planning and Economic Development 74.7 79.9 67.5 0.0 9.0 76.5 -3.4
BD0 Office of Planning 66.6 66.5 64.5 0.0 0.0 64.5 -2.0
EN0 Department of Small and Local Business Development 34.2 42.3 44.3 0.0 0.0 44.3 2.0
TK0 Office of Motion Picture and Television Development* 5.8 0.0 0.0 0.0 0.0 0.0 0.0
CI0 Office of Cable Television, Film, Music, and Entertainment 0.0 48.5 6.0 0.0 42.5 48.5 0.0
BJ0 Office of Zoning 19.0 19.0 19.0 0.0 0.0 19.0 0.0
DB0 Department of Housing and Community Development 44.7 47.0 55.5 0.0 0.0 55.5 8.5
CF0 Department of Employment Services 302.9 337.1 190.5 0.0 212.6 403.1 66.0
DA0 Real Property Tax Appeals Commission 10.9 11.0 11.0 0.0 0.0 11.0 0.0
CR0 Department of Consumer and Regulatory Affairs 335.4 356.0 144.0 0.0 251.0 395.0 39.0
CQ0 Office of the Tenant Advocate 15.9 18.0 18.0 0.0 0.0 18.0 0.0
BX0 Commission on the Arts and Humanities 10.0 12.0 21.0 0.0 0.0 21.0 9.0
LQ0 Alcoholic Beverage Regulation Administration 53.0 55.0 0.0 0.0 57.0 57.0 2.0
DH0 Public Service Commission 80.1 80.5 0.0 0.0 80.5 80.5 0.0
DJ0 Office of the People's Counsel 40.0 40.4 0.0 0.0 40.4 40.4 0.0
SR0 Department of Insurance, Securities, and Banking 132.3 149.7 0.0 0.0 149.6 149.6 -0.1
CT0 Office of Cable Television* 36.9 0.0 0.0 0.0 0.0 0.0 0.0
Total, Economic Development and Regulation 1,262.3 1,362.9 641.3 0.0 842.7 1,483.9 121.0
*In FY 2016, funding and FTEs for the Office of Motion Picture and Television Development (TK0) and the Office of Cable Television (CT0) were transferred to the Office of Cable Television, Film, Music, and Entertainment (CI0).
Public Safety and Justice
FA0 Metropolitan Police Department 4,544.3 4,598.0 4,641.0 0.0 0.0 4,641.0 43.0
FB0 Fire and Emergency Medical Services Department 1,983.3 2,068.0 2,062.0 0.0 0.0 2,062.0 -6.0
FL0 Department of Corrections 917.7 931.2 1,135.2 0.0 25.0 1,160.2 229.0
FY 2017 Proposed Budget and Financial Plan
Page H-2

Agency
Code Agency Name
FY 2015
Actuals
General Fund
FTEs
FY 2016
Approved
General Fund
FTEs
FY 2017
Proposed
Local Funds
FTEs
FY 2017
Proposed
Dedicated Taxes
FTEs
FY 2017
Proposed
Other Funds
FTEs
Total, FY 2017
Proposed
General Fund
FTEs
Change from
FY 2016
Approved
General Fund
FTEs
Appropriation Title
Government of the District of Columbia
FY 2017 Proposed Full-Time Equivalent Employment Authority
General Fund
FK0 District of Columbia National Guard 38.7 39.5 39.5 0.0 0.0 39.5 0.0
BN0 Homeland Security and Emergency Management Agency 19.2 26.5 28.0 0.0 0.0 28.0 1.5
FH0 Office of Police Complaints 22.4 23.3 23.3 0.0 0.0 23.3 0.0
FZ0 District of Columbia Sentencing and Criminal Code Revision Commission 10.4 11.0 6.0 0.0 0.0 6.0 -5.0
FX0 Office of the Chief Medical Examiner 72.9 73.0 82.0 0.0 0.0 82.0 9.0
FS0 Office of Administrative Hearings 69.5 75.3 73.3 0.0 0.0 73.3 -2.0
FJ0 Criminal Justice Coordinating Council 1.3 2.3 2.3 0.0 0.0 2.3 0.0
UC0 Office of Unified Communications 305.5 304.8 336.3 0.0 0.0 336.3 31.5
FR0 Department of Forensic Sciences 122.3 130.3 187.0 0.0 0.0 187.0 56.8
FQ0 Office of the Deputy Mayor for Public Safety and Justice 13.5 6.0 11.0 0.0 0.0 11.0 5.0
FI0 Corrections Information Council 0.0 6.0 6.0 0.0 0.0 6.0 0.0
FO0 Office of Victim Services and Justice Grants 0.0 13.0 10.6 0.0 0.8 11.4 -1.6
Total, Public Safety and Justice 8,121.0 8,308.0 8,643.4 0.0 25.8 8,669.2 361.1
Public Education System
GA0 District of Columbia Public Schools 7,173.3 7,207.5 7,245.9 0.0 9.8 7,255.7 48.2
GD0 Office of the State Superintendent of Education 256.0 248.2 259.4 16.0 0.4 275.8 27.6
GC0 District of Columbia Public Charter Schools 1.0 1.0 1.0 0.0 0.0 1.0 0.0
CE0 District of Columbia Public Library 596.6 593.1 547.3 0.0 0.0 547.3 -45.8
GN0 Non-Public Tuition 18.5 18.0 18.0 0.0 0.0 18.0 0.0
GO0 Special Education Transportation 1,513.1 1,396.0 1,393.7 0.0 0.0 1,393.7 -2.3
GE0 D.C. State Board of Education 16.9 19.0 19.0 0.0 0.0 19.0 0.0
GW0 Office of the Deputy Mayor for Education 13.9 16.0 18.0 0.0 0.0 18.0 2.0
Total, Public Education System 9,589.3 9,498.8 9,502.2 16.0 10.2 9,528.5 29.6
Human Support Services
JA0 Department of Human Services 440.3 517.6 538.5 0.0 13.0 551.5 34.0
RL0 Child and Family Services Agency 644.4 672.0 672.0 0.0 0.0 672.0 0.0
RM0 Department of Behavioral Health 1,185.6 1,208.0 1,160.5 0.0 37.5 1,198.0 -10.0
FY 2017 Proposed Budget and Financial Plan
Page H-3

Agency
Code Agency Name
FY 2015
Actuals
General Fund
FTEs
FY 2016
Approved
General Fund
FTEs
FY 2017
Proposed
Local Funds
FTEs
FY 2017
Proposed
Dedicated Taxes
FTEs
FY 2017
Proposed
Other Funds
FTEs
Total, FY 2017
Proposed
General Fund
FTEs
Change from
FY 2016
Approved
General Fund
FTEs
Appropriation Title
Government of the District of Columbia
FY 2017 Proposed Full-Time Equivalent Employment Authority
General Fund
HC0 Department of Health 259.6 277.9 178.3 0.0 110.5 288.8 10.9
HA0 Department of Parks and Recreation 567.0 548.4 739.5 0.0 0.0 739.5 191.1
BY0 D.C. Office on Aging 34.3 34.0 31.0 0.0 0.0 31.0 -3.0
HM0 Office of Human Rights 31.5 35.6 34.7 0.0 0.0 34.7 -1.0
BZ0 Office on Latino Affairs 9.2 10.0 10.0 0.0 0.0 10.0 0.0
AP0 Office on Asian and Pacific Islander Affairs 5.9 6.0 6.0 0.0 0.0 6.0 0.0
VA0 Office of Veterans' Affairs 2.9 4.0 4.0 0.0 0.0 4.0 0.0
JZ0 Department of Youth Rehabilitation Services 557.9 554.5 554.5 0.0 0.0 554.5 0.0
JM0 Department on Disability Services 209.4 210.6 206.1 0.0 0.0 206.1 -4.5
HT0 Department of Health Care Finance 96.2 120.3 104.4 5.5 10.9 120.8 0.4
HG0 Office of the Deputy Mayor for Health and Human Services 9.6 9.0 15.8 0.0 0.0 15.8 6.8
Total, Human Support Services 4,053.8 4,207.9 4,255.1 5.5 171.9 4,432.5 224.7
Public Works
KT0 Department of Public Works 1,256.9 1,280.0 1,278.0 0.0 28.0 1,306.0 26.0
KA0 District Department of Transportation 544.3 553.4 544.4 0.0 5.0 549.4 -4.0
KV0 Department of Motor Vehicles 261.5 268.0 217.0 0.0 42.0 259.0 -9.0
KG0 Department of Energy and Environment 210.9 248.8 108.6 0.0 148.3 256.9 8.1
TC0 D.C. Taxicab Commission 53.6 63.3 0.0 0.0 64.0 64.0 0.7
Total, Public Works 2,327.2 2,413.5 2,148.0 0.0 287.3 2,435.3 21.8
Financing and Other
DO0 Non-Departmental 0.0 40.0 40.0 0.0 0.0 40.0 0.0
Total, Financing and Other 0.0 40.0 40.0 0.0 0.0 40.0 0.0
TOTAL GENERAL OPERATING FUNDS 28,533.9 29,022.1 28,398.4 21.5 1,444.8 29,864.7 842.6
FY 2017 Proposed Budget and Financial Plan
Page H-4

Agency
Code Agency Name
FY 2015
Actuals
Gross Funds
FTEs
FY 2016
Approved
Budget
Gross Funds
FTEs
Local Funds
FTEs
Dedicated
Taxes
FTEs
Other Funds
FTEs
Subtotal,
General Fund
FTEs
Federal
Funds
FTEs
Private
Funds
FTEs
Enterprise and
Other Funds -
Dedicated Taxes
FTEs
Enterprise
and Other
FTEs
Subtotal,
Gross Funds -
Less Intra-
District Funds
FTEs
Intra-
District
Funds
FTEs
Total FY 2017
Proposed Budget
Gross Funds
FTEs
Governmental Direction and Support
AB0 Council of the District of Columbia 171.2 189.5 197.5 0.0 0.0 197.5 0.0 0.0 0.0 0.0 197.5 0.0 197.5
AC0 Office of the District of Columbia Auditor 31.0 31.0 33.0 0.0 0.0 33.0 0.0 0.0 0.0 0.0 33.0 0.0 33.0
DX0 Advisory Neighborhood Commissions 2.5 2.5 2.5 0.0 0.0 2.5 0.0 0.0 0.0 0.0 2.5 0.0 2.5
AA0 Office of the Mayor 89.3 72.5 79.8 0.0 0.0 79.8 2.3 0.0 0.0 0.0 82.1 4.4 86.5
AH0 Mayor's Office of Legal Counsel 0.0 11.0 10.0 0.0 0.0 10.0 0.0 0.0 0.0 0.0 10.0 0.0 10.0
AI0 Office of the Senior Advisor 0.0 17.0 17.0 0.0 0.0 17.0 0.0 0.0 0.0 0.0 17.0 0.0 17.0
BA0 Office of the Secretary 29.1 25.0 19.0 0.0 6.0 25.0 0.0 0.0 0.0 0.0 25.0 0.0 25.0
AE0 Office of the City Administrator 40.8 53.0 49.5 0.0 2.5 52.0 0.0 0.0 0.0 0.0 52.0 0.0 52.0
EM0 Deputy Mayor for Greater Economic Opportunity 0.0 5.0 14.0 0.0 0.0 14.0 0.0 0.0 0.0 0.0 14.0 4.0 18.0
RK0 D.C. Office of Risk Management 22.3 25.0 36.0 0.0 0.0 36.0 0.0 0.0 0.0 0.0 36.0 0.0 36.0
BE0 D.C. Department of Human Resources 132.4 117.3 84.0 0.0 6.3 90.3 0.0 0.0 0.0 0.0 90.3 44.0 134.3
JR0 Office of Disability Rights 11.0 11.0 8.0 0.0 0.0 8.0 3.0 0.0 0.0 0.0 11.0 0.0 11.0
RJ0 Captive Insurance Agency 0.0 0.0 0.0 0.0 1.0 1.0 0.0 0.0 0.0 0.0 1.0 0.0 1.0
AS0 Office of Finance and Resource Management 46.0 46.0 38.8 0.0 0.0 38.8 0.0 0.0 0.0 0.0 38.8 5.2 44.0
PO0 Office of Contracting and Procurement 180.7 191.0 198.0 0.0 0.0 198.0 0.0 0.0 0.0 0.0 198.0 20.0 218.0
TO0 Office of the Chief Technology Officer 282.5 282.0 195.9 0.0 15.9 211.8 0.0 0.0 0.0 0.0 211.8 75.2 287.0
AF0 Contract Appeals Board 9.6 10.0 10.0 0.0 0.0 10.0 0.0 0.0 0.0 0.0 10.0 0.0 10.0
AM0 Department of General Services 651.4 700.0 667.7 0.0 13.5 681.2 0.0 0.0 0.0 0.0 681.2 22.0 703.2
DL0 Board of Elections 62.4 60.0 60.0 0.0 0.0 60.0 0.0 0.0 0.0 0.0 60.0 0.0 60.0
CJ0 Office of Campaign Finance 32.4 30.0 30.0 0.0 0.0 30.0 0.0 0.0 0.0 0.0 30.0 0.0 30.0
CG0 Public Employee Relations Board 9.3 9.0 9.0 0.0 0.0 9.0 0.0 0.0 0.0 0.0 9.0 0.0 9.0
CH0 Office of Employee Appeals 13.7 15.0 15.0 0.0 0.0 15.0 0.0 0.0 0.0 0.0 15.0 0.0 15.0
AG0 D.C. Board of Ethics and Government Accountability 13.9 15.0 15.0 0.0 0.0 15.0 0.0 0.0 0.0 0.0 15.0 0.0 15.0
CB0 Office of the Attorney General for the District of Columbia 784.5 592.4 401.6 0.0 6.7 408.3 151.8 7.0 0.0 0.0 567.1 22.5 589.6
AR0 Statehood Initiatives 2.3 1.0 1.0 0.0 0.0 1.0 0.0 0.0 0.0 0.0 1.0 0.0 1.0
AD0 Office of the Inspector General 113.0 112.0 94.8 0.0 0.0 94.8 17.3 0.0 0.0 0.0 112.0 0.0 112.0
AT0 Office of the Chief Financial Officer 956.8 969.9 881.4 0.0 55.0 936.4 0.0 0.0 0.0 0.0 936.4 45.7 982.0
Total, Governmental Direction and Support 3,688.2 3,593.0 3,168.4 0.0 106.9 3,275.3 174.3 7.0 0.0 0.0 3,456.6 243.0 3,699.6
Government of the District of Columbia
FY 2017 Proposed Full-Time Equivalent Employment Authority
Gross Funds
FY 2017 Proposed Budget by Type of FundingAppropriation Title
FY 2017 Proposed Budget and Financial Plan
Page I-1

Agency
Code Agency Name
FY 2015
Actuals
Gross Funds
FTEs
FY 2016
Approved
Budget
Gross Funds
FTEs
Local Funds
FTEs
Dedicated
Taxes
FTEs
Other Funds
FTEs
Subtotal,
General Fund
FTEs
Federal
Funds
FTEs
Private
Funds
FTEs
Enterprise and
Other Funds -
Dedicated Taxes
FTEs
Enterprise
and Other
FTEs
Subtotal,
Gross Funds -
Less Intra-
District Funds
FTEs
Intra-
District
Funds
FTEs
Total FY 2017
Proposed Budget
Gross Funds
FTEs
Government of the District of Columbia
FY 2017 Proposed Full-Time Equivalent Employment Authority
Gross Funds
FY 2017 Proposed Budget by Type of FundingAppropriation Title
Economic Development and Regulation
EB0 Office of the Deputy Mayor for Planning and Economic Development 79.5 86.0 67.5 0.0 9.0 76.5 2.5 0.0 0.0 0.0 79.0 0.0 79.0
BD0 Office of Planning 70.1 70.0 64.5 0.0 0.0 64.5 3.5 0.0 0.0 0.0 68.0 1.0 69.0
EN0 Department of Small and Local Business Development 37.2 46.0 44.3 0.0 0.0 44.3 3.7 0.0 0.0 0.0 48.0 0.0 48.0
TK0 Office of Motion Picture and Television Development* 5.8 0.0 0.0 0.0 0.0 0.0 0.0 0.0 0.0 0.0 0.0 0.0 0.0
CI0 Office of Cable Television, Film, Music, and Entertainment 0.0 48.5 6.0 0.0 42.5 48.5 0.0 0.0 0.0 0.0 48.5 0.0 48.5
BJ0 Office of Zoning 19.0 19.0 19.0 0.0 0.0 19.0 0.0 0.0 0.0 0.0 19.0 0.0 19.0
DB0 Department of Housing and Community Development 151.8 170.0 55.5 0.0 0.0 55.5 35.5 0.0 0.0 0.0 91.0 80.0 171.0
CF0 Department of Employment Services 580.2 587.0 190.5 0.0 212.6 403.1 207.9 0.0 0.0 0.0 611.0 0.0 611.0
DA0 Real Property Tax Appeals Commission 10.9 11.0 11.0 0.0 0.0 11.0 0.0 0.0 0.0 0.0 11.0 0.0 11.0
CR0 Department of Consumer and Regulatory Affairs 335.4 356.0 144.0 0.0 251.0 395.0 0.0 0.0 0.0 0.0 395.0 0.0 395.0
CQ0 Office of the Tenant Advocate 15.9 18.0 18.0 0.0 0.0 18.0 0.0 0.0 0.0 0.0 18.0 0.0 18.0
BX0 Commission on the Arts and Humanities 18.0 19.0 21.0 0.0 0.0 21.0 7.0 0.0 0.0 0.0 28.0 0.0 28.0
LQ0 Alcoholic Beverage Regulation Administration 53.0 55.0 0.0 0.0 57.0 57.0 0.0 0.0 0.0 0.0 57.0 0.0 57.0
DH0 Public Service Commission 83.0 83.6 0.0 0.0 80.5 80.5 4.1 0.0 0.0 0.0 84.6 0.0 84.6
DJ0 Office of the People's Counsel 40.0 40.4 0.0 0.0 40.4 40.4 0.0 0.0 0.0 0.0 40.4 0.0 40.4
SR0 Department of Insurance, Securities, and Banking 138.1 149.7 0.0 0.0 149.6 149.6 0.0 0.0 0.0 0.0 149.6 0.0 149.6
CT0 Office of Cable Television* 36.9 0.0 0.0 0.0 0.0 0.0 0.0 0.0 0.0 0.0 0.0 0.0 0.0
Total, Economic Development and Regulation 1,674.8 1,759.2 641.3 0.0 842.7 1,483.9 264.1 0.0 0.0 0.0 1,748.1 81.0 1,829.1
*In FY 2016, funding and FTEs for the Office of Motion Picture and Television Development (TK0) and the Office of Cable Television (CT0) were transferred to the Office of Cable Television, Film, Music, and Entertainment (CI0).
Public Safety and Justice
FA0 Metropolitan Police Department 4,581.0 4,620.0 4,641.0 0.0 0.0 4,641.0 13.0 0.0 0.0 0.0 4,654.0 9.0 4,663.0
FB0 Fire and Emergency Medical Services Department 2,042.8 2,068.0 2,062.0 0.0 0.0 2,062.0 42.0 0.0 0.0 0.0 2,104.0 0.0 2,104.0
FL0 Department of Corrections 917.9 932.0 1,135.2 0.0 25.0 1,160.2 0.0 0.0 0.0 0.0 1,160.2 1.8 1,162.0
FK0 District of Columbia National Guard 117.3 127.0 39.5 0.0 0.0 39.5 89.5 0.0 0.0 0.0 129.0 0.0 129.0
BN0 Homeland Security and Emergency Management Agency 86.5 92.0 28.0 0.0 0.0 28.0 77.1 0.0 0.0 0.0 105.1 0.0 105.1
DQ0 Commission on Judicial Disabilities and Tenure 2.0 2.0 0.0 0.0 0.0 0.0 2.0 0.0 0.0 0.0 2.0 0.0 2.0
DV0 Judicial Nomination Commission 1.3 2.0 0.0 0.0 0.0 0.0 2.0 0.0 0.0 0.0 2.0 0.0 2.0
FH0 Office of Police Complaints 22.4 23.3 23.3 0.0 0.0 23.3 0.0 0.0 0.0 0.0 23.3 0.0 23.3
FZ0 District of Columbia Sentencing and Criminal Code Revision Commission 10.4 11.0 6.0 0.0 0.0 6.0 0.0 0.0 0.0 0.0 6.0 0.0 6.0
FX0 Office of the Chief Medical Examiner 73.9 73.0 82.0 0.0 0.0 82.0 0.0 0.0 0.0 0.0 82.0 4.0 86.0
FY 2017 Proposed Budget and Financial Plan
Page I-2

Agency
Code Agency Name
FY 2015
Actuals
Gross Funds
FTEs
FY 2016
Approved
Budget
Gross Funds
FTEs
Local Funds
FTEs
Dedicated
Taxes
FTEs
Other Funds
FTEs
Subtotal,
General Fund
FTEs
Federal
Funds
FTEs
Private
Funds
FTEs
Enterprise and
Other Funds -
Dedicated Taxes
FTEs
Enterprise
and Other
FTEs
Subtotal,
Gross Funds -
Less Intra-
District Funds
FTEs
Intra-
District
Funds
FTEs
Total FY 2017
Proposed Budget
Gross Funds
FTEs
Government of the District of Columbia
FY 2017 Proposed Full-Time Equivalent Employment Authority
Gross Funds
FY 2017 Proposed Budget by Type of FundingAppropriation Title
FS0 Office of Administrative Hearings 76.8 83.3 73.3 0.0 0.0 73.3 0.0 0.0 0.0 0.0 73.3 10.0 83.3
FJ0 Criminal Justice Coordinating Council 14.0 17.0 2.3 0.0 0.0 2.3 15.0 0.0 0.0 0.0 17.3 0.8 18.0
UC0 Office of Unified Communications 311.1 310.8 336.3 0.0 0.0 336.3 0.0 0.0 0.0 0.0 336.3 6.0 342.3
FR0 Department of Forensic Sciences 131.8 136.0 187.0 0.0 0.0 187.0 5.0 0.0 0.0 0.0 192.0 3.3 195.3
FQ0 Office of the Deputy Mayor for Public Safety and Justice 20.6 6.0 11.0 0.0 0.0 11.0 0.0 0.0 0.0 0.0 11.0 0.0 11.0
FI0 Corrections Information Council 0.0 6.0 6.0 0.0 0.0 6.0 0.0 0.0 0.0 0.0 6.0 0.0 6.0
FO0 Office of Victim Services and Justice Grants 0.0 13.0 10.6 0.0 0.8 11.4 2.6 0.0 0.0 0.0 14.0 0.0 14.0
Total, Public Safety and Justice 8,409.7 8,522.3 8,643.4 0.0 25.8 8,669.2 248.2 0.0 0.0 0.0 8,917.3 34.8 8,952.1
Public Education System
GA0 District of Columbia Public Schools 8,001.1 8,114.9 7,245.9 0.0 9.8 7,255.7 367.4 0.0 0.0 0.0 7,623.1 562.7 8,185.8
GD0 Office of the State Superintendent of Education 360.1 370.0 259.4 16.0 0.4 275.8 124.1 0.0 0.0 0.0 399.9 3.4 403.3
GC0 District of Columbia Public Charter Schools 1.0 1.0 1.0 0.0 0.0 1.0 0.0 0.0 0.0 0.0 1.0 0.0 1.0
CE0 District of Columbia Public Library 602.2 598.1 547.3 0.0 0.0 547.3 4.0 0.0 0.0 0.0 551.3 0.0 551.3
GN0 Non-Public Tuition 18.5 18.0 18.0 0.0 0.0 18.0 0.0 0.0 0.0 0.0 18.0 0.0 18.0
GO0 Special Education Transportation 1,513.1 1,396.0 1,393.7 0.0 0.0 1,393.7 0.0 0.0 0.0 0.0 1,393.7 0.0 1,393.7
GE0 D.C. State Board of Education 16.9 19.0 19.0 0.0 0.0 19.0 0.0 0.0 0.0 0.0 19.0 0.0 19.0
GW0 Office of the Deputy Mayor for Education 13.9 16.0 18.0 0.0 0.0 18.0 0.0 0.0 0.0 0.0 18.0 0.0 18.0
Total, Public Education System 10,526.8 10,533.1 9,502.2 16.0 10.2 9,528.5 495.5 0.0 0.0 0.0 10,024.0 566.1 10,590.0
Human Support Services
JA0 Department of Human Services 1,214.5 1,046.8 538.5 0.0 13.0 551.5 541.3 0.0 0.0 0.0 1,092.8 21.0 1,113.8
RL0 Child and Family Services Agency 793.4 825.0 672.0 0.0 0.0 672.0 153.0 0.0 0.0 0.0 825.0 0.0 825.0
RM0 Department of Behavioral Health 1,390.5 1,427.8 1,160.5 0.0 37.5 1,198.0 113.0 0.0 0.0 0.0 1,311.0 98.8 1,409.7
HC0 Department of Health 599.4 611.6 178.3 0.0 110.5 288.8 327.2 0.0 0.0 0.0 616.0 12.4 628.3
HA0 Department of Parks and Recreation 569.6 551.4 739.5 0.0 0.0 739.5 0.0 0.0 0.0 0.0 739.5 6.0 745.5
BY0 D.C. Office on Aging 77.4 61.0 31.0 0.0 0.0 31.0 16.3 0.0 0.0 0.0 47.3 15.7 63.0
HM0 Office of Human Rights 33.9 38.0 34.7 0.0 0.0 34.7 2.4 0.0 0.0 0.0 37.0 0.0 37.0
BZ0 Office on Latino Affairs 9.2 10.0 10.0 0.0 0.0 10.0 0.0 0.0 0.0 0.0 10.0 0.0 10.0
AP0 Office on Asian and Pacific Islander Affairs 5.9 6.0 6.0 0.0 0.0 6.0 0.0 0.0 0.0 0.0 6.0 0.0 6.0
VA0 Office of Veterans' Affairs 2.9 4.0 4.0 0.0 0.0 4.0 0.0 0.0 0.0 0.0 4.0 0.0 4.0
JZ0 Department of Youth Rehabilitation Services 557.9 554.5 554.5 0.0 0.0 554.5 0.0 0.0 0.0 0.0 554.5 0.0 554.5
JM0 Department on Disability Services 429.5 439.0 206.1 0.0 0.0 206.1 228.9 0.0 0.0 0.0 435.0 0.0 435.0
FY 2017 Proposed Budget and Financial Plan
Page I-3

Agency
Code Agency Name
FY 2015
Actuals
Gross Funds
FTEs
FY 2016
Approved
Budget
Gross Funds
FTEs
Local Funds
FTEs
Dedicated
Taxes
FTEs
Other Funds
FTEs
Subtotal,
General Fund
FTEs
Federal
Funds
FTEs
Private
Funds
FTEs
Enterprise and
Other Funds -
Dedicated Taxes
FTEs
Enterprise
and Other
FTEs
Subtotal,
Gross Funds -
Less Intra-
District Funds
FTEs
Intra-
District
Funds
FTEs
Total FY 2017
Proposed Budget
Gross Funds
FTEs
Government of the District of Columbia
FY 2017 Proposed Full-Time Equivalent Employment Authority
Gross Funds
FY 2017 Proposed Budget by Type of FundingAppropriation Title
HT0 Department of Health Care Finance 216.7 251.1 104.4 5.5 10.9 120.8 129.3 0.0 0.0 0.0 250.0 0.0 250.0
HG0 Office of the Deputy Mayor for Health and Human Services 9.6 9.0 15.8 0.0 0.0 15.8 0.0 0.0 0.0 0.0 15.8 0.0 15.8
Total, Human Support Services 5,910.3 5,835.1 4,255.1 5.5 171.9 4,432.5 1,511.3 0.0 0.0 0.0 5,943.9 153.8 6,097.7
Public Works
KT0 Department of Public Works 1,417.2 1,438.0 1,278.0 0.0 28.0 1,306.0 0.0 0.0 0.0 0.0 1,306.0 158.0 1,464.0
KA0 District Department of Transportation 544.3 553.4 544.4 0.0 5.0 549.4 20.0 0.0 0.0 0.0 569.4 0.0 569.4
KV0 Department of Motor Vehicles 263.0 270.0 217.0 0.0 42.0 259.0 0.0 0.0 0.0 0.0 259.0 8.0 267.0
KG0 Department of Energy and Environment 325.3 372.8 108.6 0.0 148.3 256.9 110.7 0.0 0.0 0.0 367.6 13.2 380.8
TC0 D.C. Taxicab Commission 53.6 64.0 0.0 0.0 64.0 64.0 0.0 0.0 0.0 0.0 64.0 0.0 64.0
Total, Public Works 2,603.5 2,698.2 2,148.0 0.0 287.3 2,435.3 130.7 0.0 0.0 0.0 2,566.0 179.2 2,745.2
Financing and Other
DO0 Non-Departmental 0.0 40.0 40.0 0.0 0.0 40.0 0.0 0.0 0.0 0.0 40.0 0.0 40.0
Total, Financing and Other 0.0 40.0 40.0 0.0 0.0 40.0 0.0 0.0 0.0 0.0 40.0 0.0 40.0
TOTAL GENERAL OPERATING FUNDS 32,813.3 32,981.0 28,398.4 21.5 1,444.8 29,864.7 2,824.1 7.0 0.0 0.0 32,695.8 1,257.8 33,953.7
Enterprise and Other Funds
DC0 D.C. Lottery and Charitable Games Control Board 65.8 73.5 0.0 0.0 0.0 0.0 0.0 0.0 0.0 73.5 73.5 0.0 73.5
DY0 District of Columbia Retirement Board* 62.6 0.0 0.0 0.0 0.0 0.0 0.0 0.0 69.6 69.6 0.0 69.6
GF0 University of the District of Columbia* 968.4 0.0 0.0 0.0 0.0 0.0 0.0 0.0 968.4 968.4 0.0 968.4
HI0 D.C. Health Benefit Exchange Authority 29.9 73.0 0.0 0.0 0.0 0.0 0.0 0.0 0.0 92.0 92.0 0.0 92.0
Total, Enterprise and Other Funds 95.7 1,177.5 0.0 0.0 0.0 0.0 0.0 0.0 0.0 1,203.5 1,203.5 0.0 1,203.5
GRAND TOTAL, DISTRICT GOVERNMENT 32,909.0 34,158.5 28,398.4 21.5 1,444.8 29,864.7 2,824.1 7.0 0.0 1,203.5 33,899.3 1,257.8 35,157.2
*These agencies do not use the District's financial system for their actual expenditure transactions.
FY 2017 Proposed Budget and Financial Plan
Page I-4

Appendix J:
Glossary of Budget Terms


FY 2017 Proposed Budget and Financial Plan Glossary of Budget Terms
Appendix J-1
Appendix J
Glossary of Budget Terms
Accrual Basis of Accounting – An accounting method that recognizes the financial effect of
transactions, events, and interfund activities when they occur, regardless of the timing of related cash
flows. Accordingly, revenues are recognized when they are earned and expenses when they are incurred,
not when cash changes hands. Contrast this term to "modified accrual basis of accounting."
Activity – A component part of the District's program structure that is comprised of a set of services
grouped around a common purpose or result.
Additional Gross Pay – Pay other than base compensation and premium pay. Examples include Holiday
Pay, Longevity Pay, Shift Differential, and Terminal Leave.
Agency Financial Operations Program (AFO) – A program within an agency's performance plan
under Performance-Based Budgeting. AFO is used to track the funding and FTE count for all Office of
the Chief Financial Officer (OCFO) FTEs assigned to the agencies. Though many of these employees
work on-site at agency locations, all financial positions within District agencies report to the Chief
Financial Officer. Under AFO, these costs fall within one of three activities: (1) Budget Operations, (2)
Accounting Operations, (3) ACFO. Six Associate Chief Financial Officers (ACFOs), each representing
one of the major appropriation titles in the District's budget, manage agency financial operations.
Agency fiscal officers report to their respective ACFO, who serves as the key contact between the Office
of Chief Financial Officer and the Office of Budget and Finance, in the Office of the City Administrator,
in managing agency finances. For budgetary purposes, funding for these positions assigned to the
agencies is included in the various agency budgets. This funding is not duplicated in the budget for the
OCFO.
Agency Management Program (AMP) – A program within an agency's performance plan under
Performance-Based Budgeting. AMP is used to track costs associated with common administrative
expenses across the District. Under AMP, these costs fall within 15 activities: (1) Personnel, (2) Training
and Employee Development, (3) Labor-Management Partnerships, (4) Contracting and Procurement, (5)
Property Management, (6) Information Technology, (7) Financial Management, (8) Risk Management,
(9) Legal Services, (10) Fleet Management, (11) Communications, (12) Customer Service, (13)
Performance Management, (14) Language Access, and (15) Court-Ordered Supervision. Many agencies
do not include all 15 of these activities.
Allocable Revenue – Revenue earned, collected, and used by the agency responsible for generating the
revenue.
Allocation – The movement of budget from a central budget item, like a Reserve fund, to a specific
budget location. In the case of the Highway Transportation Fund, the movement of capital budget from
a master project to a capital project authorized within the master project group.
Amendment – A proposed change to a budget that is not yet finally approved, but has been formally
submitted by the executive to the legislative branch.

Glossary of Budget Terms FY 2017 Proposed Budget and Financial Plan
Appendix J-2
Annualization – A budget increase to provide full-year budget authority for a budgetary item that was
only partially funded in the prior-year budget.
Appropriated Revenue – Authority to collect revenue by an agency on behalf of the District Treasury;
such revenue is used to support the operations of all agencies.
Appropriation – Authority to spend funds appropriated by Congress and financed by general District
revenues.
Appropriation Group (or Appropriation Title) – The eight broad areas into which the District
categorizes services to the citizens of Washington D.C. They include Governmental Direction and
Support, Economic Development and Regulation, Public Safety and Justice, Public Education System,
Human Support Services, Public Works, Financing and Other, and Enterprise and Other Funds.
Arbitrage – The ability to obtain tax-exempt bond proceeds and invest the funds in higher-yielding
taxable securities, resulting in a profit. Generally, tax-exempt bond issues, which were issued on or after
September 1, 1986, are subject to the arbitrage rebate requirements issued by the Federal Treasury (IRS),
requiring that any profit or “arbitrage” be “rebated” to the U.S. Department of the Government.
Attrition – Voluntary employment losses, such as retirements and resignations.
Bonds – Officially called debt securities, bonds provide ways for governments to raise large sums of
money by borrowing. Bonds usually have a principal amount and a contract interest rate. For fixed rate
bonds, the principal can be paid at maturity while the interest is generally paid semi-annually as a
percent of the principal. For example, a government could issue $10,000,000 in bonds with a 5 percent
interest rate. If the bonds matured in five years, then the $10,000,000 principal amount would be repaid
to the bondholder on the fifth anniversary of issuance. During that period, $500,000 would be paid in
interest each year or $250,000 semiannually. Governments may also issue floating rate bonds, where
interest accrues at rates that are reset periodically (typically weekly or monthly). Interest payments may
be due on a monthly basis, with principal due at maturity.
Bond Rating – A bond rating is an independent assessment of the creditworthiness of a bond issued by
a state or municipality (including all short and long-term indebtedness) rated by these agencies. The three
primary rating agencies are Standard & Poor's Ratings Services (S & P), Moody's Investors Service, Inc.
(Moody's), and Fitch Ratings, Inc. (Fitch). Bond ratings measure the probability of the timely repayment
of principal and interest of a bond. Generally, a higher credit rating would lead to a more favorable effect
Bond RatingsRating S & P Moody’s FitchBest Quality; extremely strong capacity to pay principal and interest AAA Aaa AAAHigh Quality; very strong capacity to pay principal and interest AA Aa AAUpper Medium Quality; strong capacity to pay principal and interest A A AMedium Grade; adequate capacity to pay principal and interest BBB Baa BBBSomewhat Speculative BB Ba BBLow Grade, Speculative B B BLow Grade, Partial Recovery Possible CCC Caa CCCLow Grade, Default Recovery Possible CC Ca CCRecovery Unlikely C C C

FY 2017 Proposed Budget and Financial Plan Glossary of Budget Terms
Appendix J-3
on the marketability of a bond and lower cost of borrowing for the borrower. The credit rating symbols
(long-term) for investment grade bonds range from the highest ratings of AAA, AA, and A to BBB-, the
lowest investment grade ratings. Pluses are added to distinguish strength and minuses reflect
weaknesses. Bonds rated below BBB- are referred to as speculative, low grade or junk bonds. The Bond
Ratings table denotes the bond rating codes of the various rating agencies.
Budget – A plan of financial and operational intent embodying an estimate of proposed expenditures for
a given period and proposed means of financing.
Budget Authority – Authority provided by law to enter into obligations that will result in expenditures.
It may be classified by the period of availability (one-year, multiple-year, no-year), by the timing of
congressional action (current or permanent), or by the manner of determining the amount available
(definite or indefinite).
Budget Establishment – The period immediately preceding the beginning of the budget fiscal year
during which final budgets are prepared and entered into the formal accounting records of the District.
Budget Formulation – The budget planning and development process from the initial budget call up to
and including final approval by Congress.
Budget Modification – A change in any portion of the budget during the fiscal year.
Budget Reserve – Funds that are earmarked to protect the District against shortfalls in revenue and
unforeseen expenditures.
Build America Bonds (BABs) – The American Recovery and Reinvestment Act of 2009 provides
federal subsidies for state and local governments to borrow at lower costs. Build America Bonds are
taxable bonds issued by state and local governments to give them access to the conventional corporate
debt markets where a portion of the debt service on these bonds are reimbursed from a direct federal
payment subsidy. The Treasury Department directs subsidy payments to participating state or local
governmental issuers in an amount equaling up to 35 percent of the interest payment on the Build
America Bonds. The federal subsidy payment effectively lowers the net borrowing costs and increases
the amount municipalities can borrow, compared to traditional tax-exempt or tax credit bonds.
CAFR – State and local governments issue an annual financial report referred to as the Comprehensive
Annual Financial Report or CAFR. The CAFR has, at a minimum, the following three parts: (1) an
introductory section, (2) a financial section, and (3) a statistical section. Some of the principal users of
the CAFR are credit or bond rating agencies (Fitch Ratings, Moody’s Investors Service, Standard and
Poor’s Ratings Services), institutions which buy and sell bonds, and those charged with managing and
governing the state or local government.
Capital Budget – The budget that provides for the acquisition of District-owned assets that help meet
the long-term and infrastructure needs, as summarized in the Capital Improvements Program.
Capital Improvements Program (CIP) – A plan for initiating the development, improvement, or
replacement of District-owned assets during a six-year period. As annually revised, this plan provides
the basis for future-year capital budget requests.
Certificates of Participation (COP) – Borrowing that is secured by the pledge of the issuing
municipality to annually appropriate (each year that the COPs are outstanding) an amount sufficient to
pay debt service on the bonds. In a typical lease-purchase arrangement, the District as lessee purchases
property under contract from a lessor, usually a private corporation, another public entity, or a special
purpose nonprofit corporation. The lessor receives a portion of each lease payment as tax-exempt
interest. One common way of financing this is the Certificate of Participation (COP), where the lessor
assigns the lease and lease payments to a trustee.

Glossary of Budget Terms FY 2017 Proposed Budget and Financial Plan
Appendix J-4
Chart of Accounts – A chart of expenditure and revenue accounts used to record each type of financial
transaction incurred by District agencies.
Charter School – A private non-profit entity that accepts and educates public school students under the
terms of a charter granted by the District’s chartering authority. Charter Schools receive the same public
funding as D.C. Public Schools pursuant to the District’s uniform per student funding formula;
additionally, a facilities allowance is provided.
Collateral – Security pledged to a creditor to assure that the obligor of a municipal credit will meet its
payment obligations. When the obligor has performed, the creditor must release the collateral.
Component Unit – Legally separate organizations which meet the following criteria: (a) the primary
government appoints a voting majority of the organization’s board; and (b) there is a financial
benefit/burden relationship between the primary government and the organization or the primary
government is able to impose its will on the organization.
Comptroller Object – This represents the lowest level of the General Ledger Account structure for
operating statement statewide accounting purposes. It includes revenue, expenditure, transfer and
statistical accounts.
Comptroller Source Group – This is used to group Comptroller Objects for reporting purposes. Also
called Object Class.
Consolidated Plan – The U.S. Department of Housing and Urban Development requires a single or
consolidated plan and submission for the following federal grant programs: Community Development
Block Grant (CDBG), HOME Investments Partnerships Program, Emergency Shelter Grants (ESG), and
the Housing Opportunities for Persons with AIDS (HOPWA) grant.
Contractual Services – A budgetary classification of nonpersonal services that includes funds for
contractual services.
Controllable Property – Non-capitalized tangible property with a value that is less than $5,000 that is
considered to be sensitive with a high risk of theft or loss; such property typically has an expected
useful life of less than three years.
Current Services Funding Level (CSFL) – The CSFL is a Local funds ONLY representation of the true
cost of operating District agencies in the next budget year, without consideration of any new policy
decisions.
Debt Cap – This is a measure of the District’s long-term debt capacity, supported by District revenues.
The District has statutorily mandated debt limits of (a) 17 percent (maximum annual debt service to total
General Fund revenues) for general obligation bonds, and (b) 12 percent (annual debt service to total
General Fund expenditures) for all tax-supported debt.
Debt Ratio – Debt ratios are a means of measuring the affordability or burden of a municipality’s
outstanding debt. Common measurements include debt per capita, debt per general fund expenditures,
and debt as a percentage of total income.
Debt Service – The payment of interest and the repayment of principal to bondholders on specified dates.
Generally, principal is repaid once a year. Interest on fixed rate bonds is paid twice a year at six-month
intervals, and interest on floating rate bonds is generally paid monthly.
Dedicated Taxes – Tax revenues that are dedicated by law to a particular agency for a particular purpose.
Dedicated Tax revenue is part of General Fund revenue.
Encumbrance – An amount of funds committed for the payment of goods and services ordered but not
yet received.

FY 2017 Proposed Budget and Financial Plan Glossary of Budget Terms
Appendix J-5
Enterprise Funds – Budget and accounting units created for particular purposes, such as water and
sewer or other self-sustaining operations, to separate the revenue and financial control of such operations
from the District's General Fund.
Entitlement – A service or grant that, under District or Federal law, must be provided to all applicants.
Equipment and Equipment Rental – The name of the object class used to allocate funds for such
needs.
Escrow Agreement for Refunding Bonds – The legal document outlining the terms and conditions
under which proceeds of refunding bonds are used to pay the debt service of refunded bonds. The escrow
(which should be irrevocable) stipulates which bond or bonds are to be refunded, whether the bonds will
be redeemed at a call date or paid until maturity and what the refunding bond proceeds are invested in.
Usually refunding bonds are invested in U.S. government securities.
Expenditure – A payment for goods or services received.
FMAP (Federal Medicaid Assistance Percentage) – The percentage of Medicaid expenditures that is
reimbursed by the Federal Government. For the District, this percentage is generally 70 percent for most
Medicaid functions.
Federal Funds
• Federal Grants: Funding provided by the federal government via a federal agency for a specific
purpose with the conditions for the administration of the funding dictated by each grantor
organization.
• Federal Payments: Funding specifically detailed in the Federal Funds portion of the District of
Columbia Appropriations Act with the conditions for the administration of the funding found within
the statute and federal appropriations law.
• Federal Medicaid Payments: Funding provided to pay for a portion of the health care costs of
eligible individuals, with oversight performed by District and federal authorities.
Fixed Costs – Expenses that do not change in proportion to the activity of a business and are related to
the everyday functioning of a business. In the District, fixed costs are categorized as electricity, heating
fuel, janitorial services, natural gas, occupancy, telecommunication, postage, rent, security services,
steam, water and sewer, and fleet fuel and services. While the expense item is fixed, the costs do have
variability. Rate fluctuations and consumption levels play a large part in determining the amount of fixed
costs.
Fringe Benefits – Part of overall employee compensation costs, including life and health insurance and
retirement and social security contributions.
Full-Time Equivalent (FTE) – An employment indicator that translates the total number of hours
worked in a year by all employees, including part-time workers, to an equivalent number of work years.
For example, one FTE generally equals 2,080 hours and 0.75 FTE equals 1,560 hours.
Fund – A budgeting and accounting device used to establish accounts for separating revenues and their
related obligations and expenditures for one purpose from those revenues, obligations, and expenditures
for other purposes.
Fund Accounting – Method of organizing and maintaining accounting activities on a fund basis. A fund
is defined as a separate, distinct accounting entity that has its own assets, liabilities, equity, revenues, and
expenditures/expenses. Funds are established for the purpose of carrying on specific activities or
attaining certain objectives in accordance with special regulations, restrictions, or limitations.
Glossary of Budget Terms FY 2017 Proposed Budget and Financial Plan
Appendix J-6
Fund Balance – The difference between fund assets and deferred outflows of resources and fund
liabilities and deferred inflows of resources. The fund balance is cumulative over the life of the fund.
Generally Accepted Accounting Principles (GAAP) – Uniform minimum standard for accounting and
financial reporting. GAAP includes the conventions, rules, and procedures that serve as the norm for the
fair presentation of financial statements. The standard setting body which establishes GAAP for
governmental entities is the Governmental Accounting Standards Board (GASB).
GASB – Established in June 1984, the Governmental Accounting Standards Board (GASB) is the
ultimate authoritative accounting and financial reporting standard-setting body for state and local
governments. Although GASB standards do not have the force of law, governments are required to
follow GASB standards in order to obtain clean opinions from their auditors, and failure to comply with
GASB standards can adversely affect a state or local government’s bond ratings and thus, its attempts to
issue bonds.
GFOA – The Government Finance Officers Association of the United States and Canada is the premier
association of public finance professionals. Since its inception in 1906, originally as the Municipal
Finance Officers Association, the organization has played a major role in the development and
promotion of GAAP for state and local government. The GFOA has sponsored the Certificate of
Achievement for Excellence in Financial Reporting Program since 1946. Under this program,
governments that achieve the highest standards in financial reporting are awarded a prestigious
Certificate of Achievement. The GFOA also sponsors the Distinguished Budget Presentation Award
Program, which recognizes governments whose budgets are deemed exemplary as policy
documents, financial guides, operational guides, and communication devices. The GFOA also publishes
Governmental Accounting, Auditing, and Financial Reporting (GAAFR), also known as “the Blue
Book”.
GPRA – Government Performance and Results Act. Legislation that requires the establishment of a
direct relationship between the use of federal funds and the delivery of services by federal agencies.
Many federal grants require GPRA performance measures as part of the reporting process.
General Fund – The principal operating fund of the District, which is used to account for all financial
resources except those required to be accounted for in another fund. General Fund revenues consist of
Local, Dedicated Tax, and Special Purpose Revenues.
General Obligation Bonds – Bonds are issued directly by state or local governments or their agencies
to meet essential government functions such as schools and highway construction. These bonds are
backed by the issuer’s pledge of its full faith, credit and taxing power to meet interest and principal
payments.
Gift Funds – Financial donations to the District government, which may only be accepted on behalf of
the District by the Mayor, which may be earmarked for a specific purpose.
Grant – Contributions of assets (usually cash) by a government unit or private entity for specified
purposes. The District government receives grants from the federal government (and occasionally from
private entities) for a variety of purposes. District agencies also make grants to non-profit or other
non-District government organizations. When the source of the District’s grant to a non-District
government organization is itself a grant, the District’s grant is called a “subgrant.”
Grant Anticipation Revenue Vehicle (GARVEE) Bonds – Bonds used by state or state infrastructure
agencies under the guidelines of the National Highway System Designation Act to finance major high-
way projects receiving Federal funding. States must repay the bonds using federal funds expected to be
received in the future; however, the federal government does not guarantee that the funds will be made
available to repay the bonds.

FY 2017 Proposed Budget and Financial Plan Glossary of Budget Terms
Appendix J-7
Gross Budget – A total budget amount that includes resources from all funding sources.
Imprest Fund – A fund of a designated amount out of which payments for expenses of small amounts
are made (sometimes referred to as petty cash).
Income Tax Revenue Secured Bond – Revenue bonds secured by and paid solely from the individual
income tax and the business franchise tax received by the District.
Indirect Costs – Administrative overhead costs incurred by the District in managing grant programs.
Industrial Revenue Bond – A bond issued by the District on behalf of a non-profit or other eligible
entity to finance or refinance projects including housing, health facilities, transit, higher education, and
or other industrial or commercial development.
Inflation – An increase in general price of goods or services resulting in a decline in the purchasing
power of currently available money.
Infrastructure – Long-lived assets that are stationary in nature and normally can be preserved for a
significantly greater number of years than most capital assets. Examples of infrastructure include such
assets as highways, bridges, drainage systems, and water and sewer systems.
Interest Accrual – The interest that has accumulated on a bond since the last interest payment up to, but
not including, the settlement date.
Intra-District – An accounting mechanism used to track payments for services provided by one District
agency to another District agency, similar to an internal service fund.
Key Result Measures – A set of result performance measures that are contained within each program.
They are comprised of one result measure from each of the activities within that program.
Local Education Agency (LEA) – An education agency at the local level that exists primarily to
operate schools or to contract for educational services. This term is used synonymously with the terms
"school district, “school system," and "local basic administrative unit."
Local Revenue – Includes tax and non-tax revenue that is not earmarked for a particular purpose and is
allocated to fund District programs during the annual budget process. Local revenue is part of General
Fund revenue.
Mandate – Any responsibility, action or procedure that is imposed by one government on another
through constitutional, legislative, administrative, executive, or judicial action as a direct order, or that is
required as a condition of aid.
MARC – Maximum Allowable Request Ceiling. The maximum Local fund budget that the agencies are
allowed to request at the beginning of the budget formulation process.
Match – A locally provided cash or in-kind services contribution required to supplement or equal a grant
or gift as a condition for receiving the funds.
Mission – The mission is a clear, concise statement of the purpose of the agency. The mission focuses
on the broad, yet distinct, results the agency will achieve for its customers.
Modified Accrual Basis of Accounting – A basis of accounting that recognizes revenues in the period
they become measurable and available, and expenditures in the period in which the associated liability
is incurred.
Municipal Bond – A bond issued by a state or a political subdivision. Also a bond issued by a state
agency or authority. In general, interest earned on municipal bonds is exempt from federal income taxes
and state and local taxes in the state if the investor lives in the issuing state.

Glossary of Budget Terms FY 2017 Proposed Budget and Financial Plan
Appendix J-8
Nonpersonal Services (NPS) – A budget category that includes budget objects for reporting other than
personnel-related expenditures. Nonpersonal services includes supplies, utilities, communications, rent,
other services and charges, subsidies and transfers, equipment and equipment rental, and debt service.
Nonrecurring Expenditures – One-time expenditures for special items, such as a new fire truck or a
computer system, that do not need to be budgeted for again in the year following their purchase.
Notice of Funding Availability (NOFA) – A public notice that an agency will issue a Request for
Applications (RFA), informing interested parties when and where an RFA may be obtained.
Object Category – The category of object classes for which the District budgets in the operating
budget. There are two object categories: Personal Services (salaries, fringe benefits, additional pay, and
overtime) and Nonpersonal Services (all object classes that are not personal services).
Object Class – A budgetary classification that breaks down the object categories of personal services and
nonpersonal services into more specific types of expenditure, such as fringe benefits (Object Class 14)
or supplies (Object Class 20). Also called Comptroller Source Group.
Objectives – Measurable activities of a program that are sought to achieve the overall mission.
Obligations – The amount of expenditures already made as well as the cost of commitments requiring
future payments.
Operating Budget – The budget that encompasses the day-to-day District activities. The operating
budget includes employee salaries, supplies, and other non-personnel items related to current activities.
The operating budget also includes debt service and overhead costs related to daily operations.
Other Services and Charges – A budgetary classification of nonpersonal services that includes funds
for printing, postage, tuition, travel, conference, and membership dues.
Overtime Pay – Pay for full-time employees whose work hours exceed their regular tour of duty,
generally, for hours of work authorized in excess of 40 hours in a pay status in a workweek in accordance
with provisions of section 7 of the Fair Labor Standards Act of 1938 (FLSA), as amended (29 USC 207).
Personal Services (PS) – A budget category that includes budget objects for reporting personnel-
related expenditures. Personal Services includes regular pay, other pay, additional gross pay, overtime,
and fringe benefits.
Performance-Based Budgeting (PBB) – A budget system in which budget decisions are based on or
informed by performance information that describes the cost or efficiency of producing an activity and
the results achieved for customers.
Performance Measures – Measures that describe the information managers and other decision-makers
need in order to make good business decisions. Different types of measures include demand/input,
output, outcome, and efficiency.
Performance Plan – An agency-level plan that contains the agency’s mission, summary of services,
objectives, initiatives, and performance measures for a set period of time.
Phase – A budgeted task (e.g. design, project management, construction) necessary to achieve the
completion of a capital project.
Private Revenue – Funding from private grants to fund the intended purpose of the grant.
Program – A component part of the District's program structure. Comprised of a set of activities that
have a common purpose or result, organized as a sub-unit of an agency for accounting, budgeting,
planning, and performance measurement purposes.

FY 2017 Proposed Budget and Financial Plan Glossary of Budget Terms
Appendix J-9
Program Structure – The delineation of programs, activities, and services that constitute the work of an
agency.
Project – a capital project is an investment in the infrastructure of the District that results in a new
District-owned asset, increases the value of an existing District-owned asset, or increases the life of a
District-owned asset by at least 2 years.
Proprietary Fund – Fund category that often emulates the private sector and focuses on the
measurement of net income. Expenditures are typically funded by user charges and fees. Governments
may have two types of proprietary funds: enterprise funds and/or internal service funds.
Qualified Zone Academy Bond (QZAB) – A federal bond program established to help schools raise
funds to: renovate and repair buildings, invest in equipment and up-to-date technology, develop
challenging curricula, and train quality teachers. QZABs reduce the burden of interest payments by
giving financial institutions holding the bonds (or other debt mechanism) a tax credit in lieu of interest
for construction in eligible low-income schools. Through a tax credit to the lending institution, the
federal government covers all of the interest on these bonds, resulting in savings up to 50 percent of the
cost of these renovation and improvement projects.
Real (Constant) Dollars – Refers to an adjusted value of currency used to compare dollar values from
one period to another. Due to inflation, the purchasing power of the dollar changes over time, so in order
to compare dollar values from one year to another, they need to be converted from nominal (current)
dollar values to constant dollar values.
Reallocation – The modification of budget from one phase of a capital project to another. The total
budget for the project remains the same.
Redirections – The permanent shift of funds or positions within an agency.
Regular Pay – Continuing – Salary and wages for all continuing full-time employees.
Regular Pay – Other – Salary and wages for part-time, part-year, or temporary employees.
Reorganization – A change in the budget and reporting structures within an agency.
Reprogramming – Any budget modification for purposes other than those originally planned, which
results in an offsetting reallocation of budget authority from one budget category to another, or from one
capital project to another.
Request for Applications (RFA) – The document that describes the requirements for subgrant
applications.
Request for Proposals (RFP) – A solicitation document requesting from prospective contractors to
submit a business proposal with a detailed description of the manner in which they plan to achieve the
goals specified by the RFP, were they awarded a contract to do so. The plan usually includes the
proposer’s corporate and financial information, estimate of total cost, and required completion schedule.
Rescission – A legislative cancellation of budget authority previously approved by the Council and the
Congress.
Revenue Bond – A special type of municipal bond distinguished by its guarantee of repayment solely
from revenues generated by a specified revenue-generating entity or source associated with the purpose
of the bonds, rather than from general tax revenue.
Revenue – The annual income or receipts of the District from taxes, charges, grants, and investments.
Revenue Category – General types of revenue, such as taxes.

Glossary of Budget Terms FY 2017 Proposed Budget and Financial Plan
Appendix J-10
Revenue Class – Specific revenues, such as real property taxes.
Review Panel – A team of qualified individuals responsible for reviewing, scoring, and recommending
applicants for subgrant awards.
Revolving Fund – A fund that is replenished as amounts are used, either by additional appropriations or
by income/revenue from the programs the fund finances. Therefore, the fund retains a balance at all
times.
Service-Level Budgeting – The development of budgets at program level four in SOAR. This is one
level below the current level of budgeting for most agencies, which is at the activity level.
Special Purpose Revenue – Funds used to account for proceeds derived from specific revenue sources
(other than expendable trusts, special assessments, or major capital projects) that are legally restricted to
expenditures for specified purposes. Formerly called O-type or other revenue, Special Purpose Revenue
is part of General Fund revenue.
Strategic Business Plan – A strategic business plan establishes and articulates the purpose, strategic
goals, operational organization, and performance expectations for an agency.
Strategic Goal – In strategic business planning, refers to goal statements that describe in measurable
terms the significant results that an agency must accomplish over the next 2 to 5 years to respond to the
critical trends, issues, and challenges.
Structural Balance – The degree to which revenues match expenditures over time.
Subgrant – The commitment of funds from a grant by a District government agency to a governmental
or private organization to support specific services and operations. See D.C. Municipal Regulations, Title
I, Chapter 50.
Subsidies and Transfers – The name of the object class used to allocate funds for a variety of public
welfare and support costs and to transfer funds to other organizations, such as the Washington
Metropolitan Area Transit Authority, providing services to District residents.
Supplemental Budget – An increase in the District’s budget during the course of the fiscal year, after
the budget has first been approved. After approval by Council and signature by the Mayor, a
Supplemental Budget must also go to Congress for review. Within certain limits, the District may
implement a Supplemental Budget after a 30-day review by Congress, if Congress does not disapprove
it.
Supplies and Materials – The names of the budgetary object class used to allocate funds for
consumable materials.
System of Accounting and Reporting (SOAR) – The financial management system currently used by
the District as its official accounting system of record.
Tax Abatement – A decrease in the amount of tax as legislated by the Council. The abatement could be
in furtherance of an economic development strategy or to generally provide for tax relief.
Tax Increment Financing – A method to pay for the costs of qualifying improvements necessary to
create new development or redevelopment. The financing of the qualifying improvements is paid from
increased property and/or sales taxes generated from the new development or redevelopment that would
not occur “but for” such assistance.
Tobacco Securitization – Securitization is a financing method whereby a party sells bonds to investors
backed by a future stream of payments. With tobacco securitization, the future stream of payments is the
periodic payments tobacco companies will make as part of a settlement reached by the companies and

FY 2017 Proposed Budget and Financial Plan Glossary of Budget Terms
Appendix J-11
various states in 1998. The District received funds up front from the proceeds of the bond sale. The
investors receive principal and interest payments on their bonds from the tobacco companies’ payments.
Securitization shifts the risk that the tobacco companies will stop making settlement payments from the
government to private investors or insurers.
Trust and Agency Funds – Fiduciary funds that are used to account for assets held by the District in a
trustee capacity or as an agent for individuals, private organizations, and other governments.
Transfers – Reallocation of resources (funds or positions) among agencies or funds.
Unfunded Liabilities – Potential or actual debts for which no current funding is available.
Uniform Per Student Funding Formula (UPSFF) – Funding formula used by the District that
determines the annual appropriation of Local funds for the operation of D.C. Public Schools and D.C.
Public Charter Schools based on the number of students, the grade level, and the special programs in
which they are enrolled.
WAE – The abbreviation for a “when-actually-employed” appointment. This is a temporary appointment
under which the employee serves on an intermittent basis.
Weighted Student Formula (WSF) – Funding formula used by the D.C. Public School system to
annually fund each school. The formula is based on enrollment, grade level, special education needs, free
and reduced price lunch eligibility, and English as a Second Language characteristics.
Within-Grade (Step) Increase – A salary increase awarded to an employee based on longevity of
service and acceptable performance.


WWWW
Office of the Chief Financial Officer | Office of Budget and Planning1350 Pennsylvania Avenue, Suite 229, Washington, DC 20004 | 202.727.6234 | fax 202.727.1400www.cfo.dc.gov | www.dc.gov
Submitted to the Council of the District of Columbiaby Muriel Bowser, Mayor
Government of the District of Columbia
March 24, 2016
GOVERNMENT OF THE DISTRICT OF COLUMBIA
GOVERNMENT OF THE DISTRICT OF COLUMBIA
MURIEL BOWSER, MAYOR
FY 2017 Proposed Budget and Financial Plan
VOLUME 5 FY 2017 TO FY 2022 CAPITAL IMPROVEMENTS PLAN(Including Highway Trust Fund)
FY 2017 Proposed Budget and Financial Plan
VO
LUM
E 5 – FY 2017 TO
FY 2022 CA
PITA
L IMP
RO
VE
ME
NT
S PL
AN
(IN
CLU
DIN
G H
IGH
WAY T
RUST
FUN
D)
A Fair Shot
165073_FY17 Budget Cover_Vol5.indd All Pages 3/15/16 10:56 AM