
Vulnerability profiling of cities - home - pubs.iied.orgpubs.iied.org/pdfs/10657IIED.pdfAsian Cities...
38
Asian Cities Climate Resilience WoRKING PAPER SERIES 8: 2014 Vulnerability profiling of cities A framework for climate-resilient urban development in India By JyoTI PARIKH, GEETA SANDAL AND PRIyANK JINDAL
Transcript of Vulnerability profiling of cities - home - pubs.iied.orgpubs.iied.org/pdfs/10657IIED.pdfAsian Cities...

Asian Cities Climate Resilience WoRKING PAPER SERIES 8: 2014
Vulnerability profiling of citiesA framework for climate-resilient urban development in IndiaBy JyoTI PARIKH, GEETA SANDAL AND PRIyANK JINDAL

AsiAn Cities ClimAte ResilienCe 2
About the AuthorsJyoti K Parikh is executive director of Integrated Research and Action for Development (IRADe), New Delhi. She is a Member of the Prime Minister’s Council on Climate Change India and received a Nobel Peace Prize, which was awarded to Intergovernmental Panel on Climate Change (IPCC) authors in 2007. Jyoti completed her PhD in theoretical physics at the University of Maryland, College Park and her MSc at the University of California, Berkeley. Email: [email protected]
Geeta Sandal is a research analyst at Integrated Research and Action for Development (IRADe). She completed her master’s degree in environmental planning at CEPT University Ahmadabad and her master’s degree in geography from Himachal Pradesh University, Shimla. Geeta also has a post-graduate diploma in geo-informatics for GIS development in collaboration with Salzburg University Austria. Email: [email protected]
Priyank Jindal is also a research analyst at Integrated Research and Action for Development (IRADe). He has a master’s degree in business administration from the Institute of Management Studies, DAVV Indore and a certificate on risk-sensitive land-use planning and earthquake risk mitigation and management. Email: [email protected]

AsiAn Cities ClimAte ResilienCe 3
ContentsAbout the Authors 2
List of tables and figures 4
Abstract 5
Acronyms 6
Preface 7
Acknowledgements 8
1 Introduction 9
1.1 overview of Indian cities and urbanization patterns 9
1.2 Climate variability and change-induced risk 10
1.3 Initiatives by the government of India 11
2 The hazards, infrastructure, governance and socio-economic variables (HIGS) methodology 13
2.1 Hazards and extreme events 15
2.2 Infrastructure services 16
2.3 Governance 18
2.4 Socio-economic characteristics 18
2.5 HIGS vulnerability profile template 19
3 Application of the HIGS framework 22
3.1 Applying the HIGS rapid vulnerability assessment 22
3.2 A short analytical snapshot of the two cities 22
3.3 Analysis of HIGS data set for climate resilient cities 31
4 Concluding comments 33
References 35

AsiAn Cities ClimAte ResilienCe 4
List of tables and figuresFigure 1. Percentage of population residing in urban areas in India 1950–2010 10
Figure 2. HIGS framework and detailed list of variables 15
Table 1. Vulnerability profile template: a framework for city level application 21
Table 2. Vulnerability profile of Hyderabad 25
Table 3. Vulnerability profile of Haridwar 28

AsiAn Cities ClimAte ResilienCe 5
AbstractThis working paper presents a holistic approach for how a city can customise its rapid vulnerability assessment in order to understand what is required for building climate resilience. The framework can be used to highlight the potential impact of climate change on urban services arising from the geographical setting of a city; the nature, size and density of its settlements; and the existing coping capacity of its society and governance system. The situation is aggravated by growing urban populations, high urban poverty and backlogs in the provision of basic infrastructure and services. Currently, a structured approach and the use of datasets to understand the distribution of vulnerability to climate change impacts across India are lacking. The framework proposed here provides a systematic approach to preparing vulnerability profiles in cities, by creating datasets which enable an initial analysis of vulnerability. The framework considers the sensitivity and exposure of the cities. It also highlights the need for integration of climate-resilience considerations in urban planning.
The framework known as HIGS (hazard exposure, infrastructure, governance, socio-economic variables) is positioned as a rapid assessment methodology. The framework consists of gathering relevant data in each category in order to identify key vulnerabilities and their linkages with natural causes, sustainable practices and the capacities of the concerned authorities.
This framework has been tested on twenty Indian cities that have diverse physiographic and demographic characteristics. In this paper, the challenges of selecting and aggregating vulnerability indicators in the Indian context are also discussed. The viability of the HIGS framework is demonstrated by two city case studies, each representing different physiographic characteristics, hazard exposures and population sizes.
AsiAn Cities ClimAte ResilienCe 6
AcronymsACCCRN Asian Cities Climate Change Resilience Network
ADB Asian Development Bank
AMSL Above mean sea level
BMTPC Building Materials and Technology Promotion Council
CAA Constitution Amendment Act
CDMP City disaster management plans
CPHEEo Central Public Health and Environmental Engineering organisation
EWS Economically weaker sections
GDP Gross domestic product
GHEP Green Hyderabad Environment Programme
HRVA Hazard rapid vulnerability assessment
HUDA Hyderabad Urban Development Authority
IMD India Meteorological Department
JnNURM Jawaharlal Nehru National Urban Renewal Mission
LIG Lower income group
LPCD Litres per capita per day
MCH Municipal Corporation Hyderabad
MGD Million gallons per day
MGI McKinsey Global Institute
MLD Million litres per day
MoUD Ministry of Urban Development
MSL Mean sea level
MSW Municipal solid waste
NAPCC National Action Plan for Climate Change
NATMo National Atlas and Thematic Mapping organisation
NCR National capital region
NSSo National Social Survey organisation
SLB Service-level benchmarks
UA Urban agglomeration
UFW Unaccounted-for water
AsiAn Cities ClimAte ResilienCe 7
Preface This working paper is prepared from the IRADe report Climate Resilient Urban Development: Vulnerability profiles of 20 Indian cities and supported by ACCCRN. It provides a framework for rapid vulnerability assessments of cities. The approach adds value in terms of information overview, collection and analysis of the existing data, vulnerability assessments and indicators. The objective of this working paper is to discuss in detail the methodology applied for preparing vulnerability profiles of cities, in order to bring the methodology used in the report into the public domain.
Natural hazards can have disastrous consequences for cities if they are not adequately prepared. Cities with well-built infrastructure and efficient, responsive, alert and participative government and capable citizens will respond better. The hazard, infrastructure, governance and socio-economic variables (HIGS) framework was developed and tested in twenty Indian cities with diverse physiographic characteristics and demography. Efforts towards improving city preparedness and resilience will not be in vain even if hazards do not occur. In this paper, we also discuss the challenges of selecting and aggregating vulnerability indicators in the Indian context. The application of the HIGS framework is demonstrated by taking two Indian cities, Hyderabad and Haridwar, as case studies. Both cities represent different physiographic characteristics, hazard exposures and population sizes.
This working paper will help policy makers, urban planners, city administrators, experts, academicians, students and aid agencies to appreciate issues regarding urban climate vulnerability, and help them to deal with climate change-related impacts and formulate adaptation strategies.
AsiAn Cities ClimAte ResilienCe 8
AcknowledgementsWe thank everyone who contributed to the richness and the multi-disciplinary perspective of the report Climate Resilient Urban Development: Vulnerability profiles of 20 Indian cities and are grateful to the ACCCRN and Rockefeller Foundation for their financial support to conduct this research. We are grateful to IIED for giving IRADe an opportunity to introduce the framework in the public domain and would like to thank Diane Archer from IIED for providing valuable comments and suggestions. Sincere gratitude and thanks is also due to Dr. Krit Parikh, Chairman of IRADe, who has given us guidance and taken a deep interest in this work. Finally, we would like to thank the IRADe staff for their sincere support and efforts.

AsiAn Cities ClimAte ResilienCe 9
1 IntroductionIndia’s total population is growing, and is becoming increasingly urban (Figure 1). The urban population has increased from 17.97 percent in 1961 to 31.16 percent in 2011 (Tripathi 2013). Increasing urbanization has led to the expansion of populations into areas which are exposed to hazards related to climatic events, with a resulting increase in vulnerability of local populations.
Climate change is expected to increase the incidence of extreme events, by altering average climatic conditions and inducing greater climate variability, hence increasing extreme weather events like floods and droughts. This also includes the possible occurrence of new threats, such as sea-level rise, where they did not previously exist (IPCC 2012). Additionally, the inadequacy of the existing infrastructure in urban areas and poor management and governance has reduced cities’ ability to cope and respond quickly to extreme events. Hence it is important for cities to be able to undertake a rapid assessment of their vulnerability, in order to understand where they need to build their capacity to plan for adaptation, and to develop infrastructure systems which will not lead to cascading failures of other elements or related systems and key service deliveries.
The rapid vulnerability assessment approach presented here aims to allow cities to examine various aspects, which may contribute to their vulnerability to climate change, such as extremes in temperature and precipitation. In contrast to some other approaches to vulnerability assessment, the hazard, infrastructure, governance and socio-economic variables (HIGS) framework also underlines the necessity of identifying all the elements which can contribute to urban resilience, including governance systems and institutions (see Figure 2). This includes considering socio-economic aspects of vulnerability and the impact of inefficient or insufficient infrastructure services on resilience. The HIGS framework serves as a rapid vulnerability profiling tool which can be of use to researchers, planners and authorities to plan effectively and adequately for climate change impacts.
1.1 overview of Indian cities and urbanization patterns The urban population in India has increased from 28.5 million in 1901 to 377 million in 2011 (Census of India, 2011). The number of metropolitan cities (million-plus residents) has risen sharply, from 35 to 53 during 2001–2011, out of which eight have five-million plus residents. They now account for 42.6 per cent of the total urban population, up from 37.8 per cent in 2001 (Census of India 2011).1 The average size of towns and cities in India has grown from 33,624 in 1961 to about 61,159 in 2011 (MoUD 2011). Cities have become the major source of national income. In 1995, India’s GDP was split almost evenly between its urban and rural economies, but by 2008, urban GDP accounted for 58 per cent of the overall GDP (MGI 2010). The population growth and dynamic shift to urban sprawl, coupled with the economic growth of cities, have led to a variety of challenges such as providing basic services to all and a satisfactory quality of life. Increasing land prices and limited access to employment opportunities for unskilled labourers contributes to urban poverty and the growth of slums and informal settlements, which are very often located in highly hazard-prone areas within a city.
1 The Census of India 2011 classes urban agglomerations (UAs)/towns according to their populations. The UAs/towns which have at least 1,000,000 residents are categorised as Class I UA/towns, while Class II towns have populations between 50,000 to a million.

AsiAn Cities ClimAte ResilienCe 10
The impacts of climate change, both direct and indirect, and resource conflicts may further increase the pace of rural-urban migration over the next few decades. This leads to the possibility of severe stress in urban areas due to a mix of climate-related impacts such as water scarcity and environmental service breakdowns and flooding, with the consequent risk of waterborne diseases and epidemics. Although urban India attracts investment, cities often struggle to deliver even basic infrastructure services to all its residents, including those living in informal settlements. While new urban centres like the Delhi NCR region (Gurgaon, Noida, and Ghaziabad) and new townships seek to ensure full service provision, infrastructure systems may break down and struggle with growing populations. This increases the stress on infrastructure services and built and natural environments of cities. Consequently, this may affect the resilience of cities to the threats posed by climate change impacts.
Figure 1. Percentage of population residing in urban areas in India 1950–2010
Source: United Nations (2012).
1.2 Climate variability and change-induced riskThe location of many urban areas with large populations and critical economic assets in high-risk zones contributes to high vulnerability to hazards and increases the impacts of climate change (Munich Re 2000). The frequency of hazards such as floods and droughts has increased over the years (De et al. 2005). In India, over 40 million hectares of land is prone to floods, and the average area affected by floods annually is about 8 million hectares, while 68 per cent of the country is susceptible to drought (Ministry of Home Affairs 2004). Climate change could also influence the micro-climate of cities, leading to extreme weather conditions which can cause health problems and affect the quality of life of residents.
There are approximately 130 cities and towns along the 7500km coastline of India. These low-lying and densely populated coastal cities, including Mumbai, Kolkata, Chennai, Surat and Thiruvananthapuram are vulnerable to cyclones and associated hazards such as storm surges, high winds and heavy rainfall (Parikh et al. 2013). Riverine cities like Delhi, Indore, Allahabad, Hyderabad and Haridwar are highly exposed to floods. River deltas are among the world’s
17.617.9
18.819.8
21.323.1
24.325.5
26.627.7
29.230.9
1955 1960 1965 1970 1975 1980 1985 1990 1995 2000 2005 2010
AsiAn Cities ClimAte ResilienCe 11
most valuable and heavily populated areas, while some cities grew on the banks of major rivers such as the Ganges and Brahmaputra. Inland cities like Jodhpur, Jaipur, Gwalior and Bhopal are exposed to heat waves and droughts. The frequency and intensity of the hazards will vary depending on the form of settlement, geographic considerations and the nature of the local economy (IPCC 2012). Some of the impacts may take unusual forms in urban areas, for example flooding which is not directly caused by river flooding but by overwhelmed urban storm drains and sewers during extreme rainfall events. These may become more common in future (Tanner et al. 2009). With large populations living in coastal areas and on flood plains, Indian cities need particular attention as millions are simultaneously vulnerable.
Available observational evidence indicates that regional changes in climate and particularly increases in temperature have already affected a diverse set of physical and biological systems in many parts of the world (IPCC 2001). one of the most significant impacts of climate change on India is potential changes in the monsoon pattern. Trend analyses of one-day extreme rainfall series for the period 1951–2007 show that extreme rainfall is increasing in many places in India (INCCA 2010). Roy and Balling Jnr (2004) also reported an overall increase in extreme rainfall events and their intensities during the period 1901–2000. About 75 per cent of annual rainfall is delivered by the southwest monsoon during a short period of four months. However, there is a large variation in the amount of rainfall received at various geographical locations both within and between states in India. The frequency of extreme rainfall (rainfall ≥ 124.4mm) shows an increasing trend and is significant at the 98 per cent level (Attri and Tyagi 2010).
The accelerated development of Indian cities has neglected adequate planning for natural drainage, ecology and environment, resulting in the aggravation of an already precarious situation. The urban poor face increased risks, especially slum and squatter settlements dwellers, partly due to their heightened exposure to natural hazards and partly due to their lower adaptive capacity, given their precarious livelihoods. Permanent changes to local ecosystems induced by climate change such as the salinisation of groundwater and river estuaries might also alter the local economic base, whilst having indirect impacts on food prices.
Adaptation to such changes may be difficult to achieve, but it is essential. If cities are to make progress in paving the way for climate-resilient urban development, they must improve their understanding of natural hazards and climate change-induced risks they face, and the factors that influence vulnerability. It is critical for cities to better understand these risks and how they vary across time scales and spatially across geographical locations, and how they can affect city-level development sectors like infrastructure, municipal finance and other public private assets. This will assist in developing comprehensive and integrated city-level climate and natural hazard risk profiles that incorporate observed climate variability and climate-induced natural hazards. It is necessary for urban areas to adopt adaptation approaches in view of likely future climate change impacts.
1.3 Initiatives by the government of India India is still in the very early stages of implementing an effective response to the threat of climate change. In order to respond to the challenges of climate change, on 6th June 2008 the government of India constituted the Prime Minister’s Council on Climate Change, which will coordinate national action for assessment, adaptation and mitigation of climate change. The council has broad-based representation from key stakeholders, including government, industry and civil society and sets out broad directions for national actions in respect of climate change.
India’s National Action Plan on Climate Change (NAPCC)2 outlined eight missions in 2008, for addressing climate change at the national level. The Ministry of New and Renewable Energy has launched a solar cities initiative for 40
2 The National Action Plan on Climate Change (NAPCC) was released on 30th June 2008 to state India’s contribution towards combating climate change. The plan outlines eight national missions running through to 2017. The ministries involved submitted detailed plans to the Prime Minister’s Council on Climate Change in December 2008. The NAPCC consists of several targets on climate change issues and addresses the country’s urgent and critical concerns through a directional shift in the development pathway. It outlines measures on climate change-related adaptation and mitigation while simultaneously advancing development. The missions form the core of the plan, representing multi-pronged, long-term and integrated strategies for achieving goals in the context of climate change.

AsiAn Cities ClimAte ResilienCe 12
cities. Numerous agencies in India along with government are trying to make Indian cities more climate responsive. Climate change action plans are made by state authorities and mostly handled by the Department of Environment and Forests. Most of these initiatives are very recent, and there appears to be a lack of coordination or accommodation among stakeholders and local agencies. There is also no road map for adaptation or mitigation programmes. Thus, it appears that most government agencies, NGos and the private sector conduct their own activities to cope with climate change without coordinating with each other.
After the initiative of the government of India to strengthen municipal governance by the enactment of the Constitution (74th Amendment) Act (CAA) in 1992, cities today are quite well placed to make decisions and to initiate innovative and replicable responses to climate change. There may also be fewer barriers to action at the city level of governance in the context of competing developmental priorities and investments related to the adaptation of cities. This could be resolved if there is an increased understanding of exposure to natural hazards, the sensitivity of urban areas, and their capacity to adapt. This would highlight aspects of urban development that are of immediate concern, for instance informal settlements and basic urban infrastructure such as water supply and drainage systems, which are already stretched to the limit and could be of priority if the aim is to build climate resilience (Anthony 2003).
In the context of urban areas, resilience can be seen to be composed of a number of characteristics which together contribute to a city’s ability to anticipate, prepare for, respond to and recover from the impacts of climate change. These characteristics are particularly relevant when considering the resilience of infrastructure systems and the actions of agents, which are shaped by governance systems. The characteristics include flexibility, redundancy and safe failure, responsiveness, resourcefulness and a capacity to learn (Brown et al. 2012).
Cities may need assistance from the district, state and national levels in pushing forward an adaptation and resilience-building agenda. The state plays an important role in overseeing the generic problems of all cities and coming up with a strategy to address these. It also serves as an intermediary for the implementation of national initiatives. States have the task of monitoring national funds availed by cities, while supporting other cities.
Hence, with regard to addressing the impact of climate change on an urban scale, it is important to enhance urban governance and well-informed local authorities are crucial for this. There is the need for central and state levels of government to be engaged in the agendas of cities, and to foster the important role of cities in promoting development and civic engagement. The strategic level of action will be at that of the city government, and a framework for multi-level action at national, state and city scales will facilitate effective action to build resilience.

AsiAn Cities ClimAte ResilienCe 13
2 The hazards, infrastructure, governance and socio-economic variables (HIGS) methodology
As the previous section demonstrated, city governments have a strategic role to play in developing a city’s resilience to climate change. This requires a good understanding of the hazards, risks, vulnerabilities and adaptive capacity existing in the city. It can be a challenge for decision makers at city level and other urban climate-resilience practitioners to select a suitable methodology to carry out this analysis, in order to then develop city-level climate action plans in a given scenario. An important challenge in the development of vulnerability indicators for carrying out vulnerability assessments is the need to balance pragmatism with ambition. There is clearly a requirement and need to develop robust, credible and salient methods for measuring vulnerability to climate change in urban areas and to inform the actions of local authorities, research institutes and NGos as well as other organisations working in the field. The challenges for developing climate change vulnerability indicators concern conceptual gaps, methodological questions, data concerns and applicability. At present, ongoing initiatives and projects like ACCCRN3 and NAPCC help to bridge the knowledge gaps and provide potential approaches to vulnerability assessments. However, there remains a continuing challenge in drawing together the range of relevant issues at the national level, and there is a danger that indicators can be inaccurate or outdated, because of the constraints of data availability.
The application of vulnerability indicators at city level reveals a number of critical issues: indicators developed in a class or type of city at a particular scale may not be applicable to other regions or other cities because of data availability, comparability and data acquisition, or because of a lack of availability of information about the details of data selection methods. Using existing methodologies for vulnerability assessments, it is possible to develop a customised methodology specific to climate change. The objective of this paper is therefore to develop a common understanding of a possible tool for this analysis, the HIGS framework, and the underlying variables within it, using the datasets available at various levels: national, state and city.
The HIGS framework can be used to present and analyse the vulnerability of Indian cities, using four sets of variables which highlight the vulnerable features of a city. These can then guide action towards building resilience. This chapter explains how the components of each of these variables are relevant to a city’s vulnerability, and presents example indicators to be used within each variable. These four variables are: hazards, infrastructure, governance and socio-economic characteristics.
3 Asian Cities Climate Change Resilience Network (ACCCRN) is an initiative to develop, test and demonstrate practical strategies for responding to the impacts of climate change on urban areas. While the work of ACCCRN partners in India focuses on building resilience at the city level, ACCCRN is also regional and global in its outlook and outreach.
AsiAn Cities ClimAte ResilienCe 14
The framework has been developed to systematically understand urban issues that shape climate-resilient urban development and to organise the various urban climate-risk issues in such a way that policies and projects can be developed by cities to address these risks. The framework can provide a holistic overview of the existing state of a city’s vulnerability, through a rapid hazard and vulnerability assessment (RHVA) and concomitantly can be used to develop a tailored approach for climate-resilient urban development. The HIGS framework seeks to respond to existing challenges which city administrations may face in carrying out vulnerability profiles, such as the lack of time and resources, by enabling a rapid vulnerability assessment based on secondary data sources. All local authorities should be able to prepare a vulnerability profile for their cities, and update the datasets periodically, or when any new information is available. The city-level vulnerability profile will provide critical information on the vulnerability of the city’s infrastructure and services and on local communities, together with related underlying factors. The continued profiling of the cities at regular intervals can allow an assessment of whether conditions are improving or not. This information, when integrated into decision-making processes, can aid the identification and prioritisation of specific actions by which progress can be made for climate-resilient urban development.
Existing methodologies for multi-hazard assessments are diverse in nature and generally require large datasets, specific software, digital maps, satellite imageries and also skilled professional expertise to analyse and assess the scenarios. By comparison, the HIGS framework requires pooling of data from available secondary sources and from published reports from different government departments at national, sub-national and city levels. While data availability does remain a concern at the level of Indian urban centres, the Census of India and National Social Survey organisation (NSSo), state and national statistical reports and atlases provide a range of datasets across time scales and administrative boundaries. To prepare a HIGS vulnerability profile, the collected data can be compared to the city-level benchmarks provided by the national authorities in terms of infrastructure services coverage and availability, in order to understand where gaps remain in service provision, hence exposing city residents to further risk.
The HIGS framework has been conceptualised to assess climate vulnerability in cities, which is an important step towards enabling planned adaptation. The key issue in climate adaptation practice is to make effective use of available climate information, despite large uncertainties and unfamiliar or unhelpful data formats. There is a lack of probabilistic data regarding climate impacts, the present condition and coverage of infrastructure, and ongoing plans, which government authorities could use to design infrastructure standards. While this framework does not address the climate data problem, it helps in understanding the current status of the services and condition of the city infrastructure as well as its management, providing a systematic way to collect the necessary data for analysing the capacity and ability of a city to cope with climate change-induced hazards. The outputs from applying the HIGS framework can also support broader comparative analysis among cities. The application of the HIGS framework highlights the scope for, and can strengthen the implementation of, an urban climate-resilience programme.
The following sections outline each of the four variables in more detail, in order to demonstrate how the framework may be applied by a city administration. As the HIGS framework has been applied to two case studies, the sources used for collecting data for each of the variables are also described.

AsiAn Cities ClimAte ResilienCe 15
Figure 2. HIGS framework and detailed list of variables
2.1 Hazards and extreme eventsIdentifying hazards requires analysis of their frequency, duration, area and extent, and the possibility of secondary hazards. In the HIGS framework, each of the multiple hazards is treated separately and identified through parallel processes. The information collected includes location, minimum and maximum temperatures and rainfall range, and the extent of and intensity of floods, droughts and cyclones. The change in climate may lead to changes in the frequency, intensity, spatial extent, duration and timing of extreme weather and climate events, and can result in unprecedented extreme weather events, so understanding past weather events can help to predict future climate impacts. The IPCC special report on extreme events (IPCC 2012) states that increases in the frequency and magnitude of warm daily temperature extremes and decreases in cold extremes will occur in the 21st century at a global scale. This will further enhance the length, frequency and/or intensity of warm spells or heat waves over most land areas.
The frequency of the occurrences of climate-related hazardous events is taken into account by HIGS to assess the exposure of the city to climate risks. In India, data on hazards and hazard risk reduction are lacking at the city level, which is a major challenge for improvements in urban vulnerability reduction, and therefore data from other sources must be used. The selection of the hazards included in the framework is based on the Urban Statistics Handbook (NIUA 2001). The Vulnerability Atlas of India prepared by the Building Materials and Technology Promotion Council (BMTPC 2006) and maps developed by National Atlas and Thematic Mapping organization (NATMo) are important sources to analyse and crosscheck the exposure of Indian cities to natural hazards.
HHazards: physical and meteorological indicators ■■ Temperature (maximum,
minimum)■■ Precipitation (maximum,
minimum)■■ Mean sea level■■ Frequency of droughts■■ Frequency of floods■■ Frequency of cyclones
GGovernance and institutions indicators■■ Participation■■ Transparency■■ Accountability ■■ Response efficiency
and capability■■ Innovative financing
SSocio-economic indicators ■■ Demographic composition
(sex ratio, age structure)■■ Slum population
(poverty status)■■ Literacy rate■■ Migration flow■■ Urbanisation trend and urban
sprawl
IInfrastructure and urban services indicators■■ Water supply■■ Sewerage system■■ Solid waste management■■ Stormwater drainage■■ Transportation■■ Power■■ Housing
HIGS framework for climate responsive urban development
AsiAn Cities ClimAte ResilienCe 16
2.1.1 Floods
India experiences floods due to heavy rainfall during monsoons. However, floods can also be caused by cyclones, storm surges and the mismanagement or insufficient capacity of dams and embankments. These floods are exacerbated by a lack of adequate water-drainage systems, which most cities suffer from. Where drain systems do exist, they are often outdated, with insufficient capacity to cope with changing land uses and predicted higher rainfall intensity. Poor maintenance, the improper disposal of solid waste, dumping of construction debris into drains, and encroachments on natural drains all contribute significantly to increases in the incidences of flooding and waterlogging.
2.1.2 Droughts
The HIGS framework considers both meteorological drought and hydrological drought. Meteorological drought refers to instances where actual rainfall in an area is significantly less than the climatological mean of that area. For example, the country as a whole may have a normal monsoon, but different meteorological districts and sub-divisions can have below-normal rainfall. Hydrological drought refers to a marked depletion of surface water causing very low stream flow and drying of lakes, rivers and reservoirs.
A region’s risk of water shortage is a major parameter defining the drought vulnerability of urban areas. The relevant data can be collected from the Indian Meteorological Department (IMD) and state environment reports.
2.1.3 Extreme events
Variations in minimum and maximum precipitation and temperature patterns influence the occurrences and intensity of natural hazards. When the overall distribution of the climate variable changes, what happens to the mean climate may be different from what happens to the extremes at either end of the distribution (IPCC 2012). Hence, for the analysis of the trend of occurrences of extreme events like floods, droughts and heat waves (the monthly maximum and minimum temperature and rainfall), the data set for the past 50 years (1950 to 2000) from the Indian Meteorological Department (IMD) can be used for the HIGS analysis.
2.2 Infrastructure servicesInfrastructure services can be subject to multiple stresses, whether these are climate related or not. Extreme weather events associated with climate change will increase disruptions to infrastructure services, and infrastructure which is already stressed by age and/or by demand levels that exceed their design capacity will be particularly susceptible to damage by climate impacts. In most Indian cities, the existing infrastructure is under tremendous stress (McKinsey and Company 2009). Many impacts of climate change do not create new risks but increase risk levels to existing vulnerable populations and systems. Further, even in normal situations, inadequate or absent appropriate infrastructure can slowly reduce the coping capacity of the community to a major hazard, and may itself become a hazard. For example, inadequate sanitation facilities can turn into a major hazard by causing epidemics when floods occur and spread waste.
The underlying variables used in this indicator include the provision of basic services such as water supply, sewerage, solid waste management, stormwater drainage systems, transportation, energy and housing. Each sector has different levels of exposure and susceptibility to risk and capacities and resources for coping and recovery. The data set for the analysis of water supply, sewerage, stormwater drainage and solid waste management can be obtained from service-level benchmarking (MoUD-SLB 2010), city development plans and official websites of development authorities and municipal corporations. The ICLEI report (2009) on Energy and Carbon Emissions Profiles of 54 South Asian Cities provides an overview on the power consumption of various sectors in India at city level.

AsiAn Cities ClimAte ResilienCe 17
2.2.1 Water supply
The management of water supplies for cities simultaneously calls for interaction with off-stream uses such as irrigation, power, cooling and control of floods, which may be competing demands. Inland cities can suffer from scarce water resources due to extended periods of drought, the effects of which can be aggravated by poor infrastructure. The effects of drought are widespread but can be particularly severe on drinking water supplies. Erosion and saline intrusion adversely affect water tables and the quality of water in coastal cities, in turn leading to increased vulnerability for those who cannot afford to purchase drinking water privately. The HIGS framework considers per capita water availability in the cities, water supply coverage and water resources (surface water and ground water), demand and supply gaps, non-revenue water, and, in addition, any changes in precipitation patterns that will further affect availability. The resilience of water supply systems is relevant as all levels of government and particularly the private sector and communities have important stakes in effective and efficient water systems, necessary for their daily lives.
2.2.2 Solid waste management, sewage and sanitation
Climate change could cause hydrological changes that may overtake the capacity of drainage infrastructure, sewage systems and water treatment facilities in cities. In the context of climate resilience, the infrastructure systems are also sensitive to location and should be built to withstand and function during extreme events. Additionally, the development and installation of new facilities might be required in order to ensure flexibility and redundancy in urban basic services and to meet growing demand. Existing outdated or insufficient infrastructure may also need to be upgraded to reduce climate change impacts amongst vulnerable groups
Adequate provision of sanitation services can play an important role in reducing the incidence of disease during floods. This involves sewage collection and/or coverage of piped sewer lines, and reuse, recycling and treatment capacity. The lack of sewage lines may force people to defecate in the open, polluting the ground water and creating health risks. In the case of waste-water treatment, work stations are often located in the lowest areas of the city to allow flow with minimal pumping – but with climate change, these areas may become more susceptible to flooding. Therefore, the HIGS framework considers coverage of sanitation infrastructure.
Consideration is also given to per capita municipal solid waste collection and management, which includes collection, segregation, handling, transportation and treatment infrastructure. Solid waste management can have a bearing on the effectiveness of drainage systems, depending on whether residents have to dispose of waste inappropriately, such as in drains.
2.2.3 Stormwater drainage
Heavy rainfall events are a normal phenomenon during the southwest monsoon season in most of the cities and towns in India, and a principal cause of urban floods. However, due to changing urban land-use patterns, urban hydrology has changed from gradual rising discharge to quicker and higher peak flows. This is aggravated by old drainage systems which were designed at the benefit-cost ratio prevalent at the time, which frequently is now inadequate, with enhanced socio-economic activities in cities and a growing, unaffordable risk of failure (Apte 2009). Understanding the characteristics of each city’s rainfall distribution can inform the design of appropriate systems, which could accommodate projected increases in rainfall intensity.
2.2.4 Transportation
Urban transport affects all aspects of daily city life and economic activity, and thus is a vital component of a city’s economic and social resilience. The connectivity and efficiency of transportation can also help facilitate evacuation to safe areas during extreme weather events and other disasters. A reliable and redundant urban transport infrastructure

AsiAn Cities ClimAte ResilienCe 18
plays a very important role, not only for the city itself, but also the region in terms of social, economic and environmental benefits. The physical consequences associated with climate change can pose risks for transport infrastructure. The location of roads will be particularly relevant in assessing the likely impact of climate change: roads in low-lying or coastal areas will be most susceptible to the effects of sea-level rise and flooding, whereas roads located in hot climate zones will be particularly vulnerable to increased temperature and solar radiation.
2.2.5 Energy
Currently, illumination accounts for approximately 30 per cent of total residential electricity consumption all over the world; followed by refrigerators, fans, electric water heaters and televisions (Productivity Commission 2012). Appliance penetration, particularly of refrigerators and air-conditioning units, is expected to be the main driver for the growth of residential energy demand by 2020 (MGI 2007). This section of HIGS deals with energy consumption in the cities by different sectors. A stable electricity supply is a vital component of a city’s economic productivity, and thus sources and distribution systems for power need to be made resilient to climate change impacts, including storms, strong winds and extreme heat. Powergeneration capacity is also an important consideration in a context of high temperatures, which may lead to increased power consumption. In this context, ICLEI’s 2009 energy and carbon emissions report can be used as a resource document for Indian cities carrying out the HIGS assessment.
2.2.6 Housing
Housing structures can be highly vulnerable to natural hazards. The types of materials used in construction, and the type of construction, will play an important role in determining the ability to withstand natural hazards. Houses made of wood and mud-stones (kutcha houses) are highly vulnerable to floods and wind hazards, compared to houses of concrete. Although there is a low percentage of kutcha houses in urban areas, these are mostly inhabited by urban poor populations, who already have a low coping capacity. The technical group on the estimation of housing shortage (Ministry of Housing and Urban Poverty Alleviation 2007) projected the total shortage of dwelling units in urban areas in 2007 to be 24.71 million and the shortage during the plan period (2007–12), including the backlog, is estimated to be 26.53 million, of which 99 per cent pertains to economically weaker sections (EWS) and lower income group (LIG) segments of the urban population. Such backlogs force people to reside in areas that are ecologically fragile and exposed to natural disasters, such as riverbanks. This section of HIGS collects data pertaining to the total number of exposed households on the basis of material used for wall construction. Data on total housing units and construction material is collected from the Census of India of 2001 and 2011.
2.3 GovernanceClimate change will be pivotal in redefining development in the 21st century. Given the potential magnitude of impending changes in institutional and social relationships, the gaps in current knowledge about the role of institutions in adapting to climate change are remarkably large. In the HIGS framework, ‘governance’ gives an indication of the responsiveness of cities as well as their institutional framework. Accountability, innovative financing and responsiveness (efficiency and capability) are the sub-variables considered. These are assessed on the basis of existing systems like budgets and financial statements, and initiatives such as updated websites, consultations, meetings, public grievance systems, help lines, privatisation of local governance, training programmes, digital data, city disaster management plans (CDMP) and emergency phone numbers. The existence of such systems can support and strengthen the city’s response to climate change and natural hazards, in particular by meeting the needs of local communities through more effective prevention and preparedness measures, and the integration of risk management into long-term development planning.

AsiAn Cities ClimAte ResilienCe 19
In the context of Indian urban governance, two institutions are of prime importance: the municipal corporation and the urban development authority. These institutions carry the responsibility of sustainable urban development and delivering basic services to urban dwellers. other institutions of relevance in the development of the city are the state-level department for urban development, the environment and climate change department, the pollution control board, the electricity corporation, and the public works department. All of these institutions and agencies should be involved in an integrated approach to building resilience at the city level.
Decentralisation and autonomy in urban planning provide a good indicator of the level of control that city authorities possess to integrate new factors and approaches to urban development. In addition, decentralised systems of governance provide a basis for people’s participation in planning processes at the local level. Mechanisms to ensure transparency and accountability in climate-sensitive sectors are critical to ensure that the most vulnerable groups of citizens benefit from resilience-building measures. Participatory grievance procedures are an illustrative mechanism for those most at risk or in cases where vulnerability is being increased by institutional action or inaction. Resilience in the face of uncertain climate shocks and stresses relies upon responsiveness and flexibility of a governance system, enabling it to respond rapidly to a range of different scenarios and communicated needs. The resourcefulness and networking ability of local institutions is of immense importance. The governance indicator allows discussion on the capacity of urban institutions such as local bodies and development authorities to deal with normal and extreme situations. The capacity indicators are based on their preparedness for extreme events, such as the existence of action plans for climate change or disaster-preparedness plans.
2.4 Socio-economic characteristicsThis indicator attempts to assess the socio-economic aspects of vulnerability and intends to answer questions such as who is vulnerable and what are the underlying drivers of vulnerability? The different attributes of groups and individuals such as socio-economic class, membership, gender, age and income correspond to the characteristics that have been linked to differential vulnerability to hazards. Social vulnerability is partially the product of social inequalities that influence or shape the susceptibility of various groups to harm, and also govern their ability to respond (Cutter et al. 2003). It is, however, important to note that social vulnerability is not only due to exposure to hazards alone, but also to the sensitivity and resilience of the broader system to prepare, cope and recover from such hazards (Turner et al. 2003).
This section of the HIGS framework provides an overview of the city’s socio-economic characteristics including demographic composition and trends, urban poverty and slums. This can ensure that gender issues are considered within climate change planning and programmes. The HIGS analysis includes attributes which provide an indication of the socio-economic vulnerability of the city, by considering population, population density, age, composition and characteristics, and the proportion of residents living in informal settlements. These factors determine the future stress on cities as well as the coping capacity of residents.
2.4.1 Population density
The effects of climate change are unevenly distributed. Being a developing country, India has cities with high urban densities and this can increase vulnerability and risk to these populations. Many of the highest density areas are informal settlements, housing the urban poor, lacking proper infrastructure and services, and in highly exposed locations, without access to institutional support.
2.4.2 Sex ratio and literacy
Women, senior citizens and children may be amongst those most vulnerable to extreme climate events. Literacy can be an important consideration, as it enables urban residents to access information and develop awareness regarding measures to prepare and adapt to extreme climate impacts.

AsiAn Cities ClimAte ResilienCe 20
2.4.3 Urbanisation trends and urban sprawl
Urban growth models developed by various government and research agencies have suggested focusing on the 100 largest cities for the majority of future investments (MGI 2010; HPEC 2011). The rapid expansion of riverine and coastal cities over last the few decades from safer cores to high-risk flood plains and coastal environments have already increased the risk profile of these areas, and further expansion in many of these cities may result in exposing more people to natural hazard risks.
2.4.4 Urban poverty and informal settlements
The urban poor can be very vulnerable to climate shocks, whether direct or indirect. They are extremely vulnerable to macroeconomic shocks that undermine their earning capacity, with consequent impacts on access to food, housing, services and health. Those living in informal settlements often have no choice but to settle in areas that are particularly exposed to hazards, and lack hazard-reducing infrastructure such as drainage and sanitation. They may also lack well-constructed housing with security of tenure which ensures they can return to their homes after disaster events. Economically, they may lack savings or large food stocks that they can draw on over time, and small shocks may keep them in a cycle where they cannot move beyond coping to adaptation. Lack of safety nets and social support systems, such as health insurance, as well as the lack of property rights and tenure further contribute to the vulnerability of the urban poor. Census of India datasets provide information on the percentage of the population living in informal settlements in cities, while city development plans and the India urban poverty report (MoHUPA 2009) provide information on accessibility and delivery of services.
2.5 HIGS vulnerability profile templateTable 1 provides a summary of all the components under each of the four variables used in the HIGS framework, which allow an assessment of a city’s vulnerability to climate change impacts. It must be borne in mind that these details provide for a rapid assessment of vulnerability, and for certain components it may be helpful to also carry out additional data collection. For example, for the natural hazard component, it could be useful in certain cities to carry out hydrological modelling of current and projected water flows and floods, to better understand the patterns of risks.

AsiAn Cities ClimAte ResilienCe 21
Table 1. Vulnerability profile template: a framework for city level application
Variables Description
Natural Hazards
Temperature observed trends Maximum and minimum monthly temperature (1950–2000).
Rainfall observed trends Maximum and minimum monthly rainfall (1950–2000).
Extreme events Floods, flash floods, droughts, heat waves, cold waves.
Exposure to other hazards Cyclones, sea-level rise, landslides, storm surges.
Infrastructure status
Water supply Per capita water availability, water supply coverage and water resources (surface water and ground water) and demand and supply gaps, non-revenue water.
Sewerage Sewage collection and/or coverage of piped sewer lines, reuse and recycle and treatment capacity.
Solid waste management Per capita MSWkg/day, collection of waste. It can also involve collection, segregation, handling, transport and treatment.
Stormwater drainage Coverage, period of its installation, design capacity, number of cases of water logging reported.
Transportation Road coverage, connectivity, efficiency of transportation, congestion.
Power Energy consumption in the cities by different sectors.
Housing Available housing units, construction material used (kutcha/pucca houses).
Governance
Administrative unit assigned to address climate change and hazards
Government institutions authorised to handle climate change and disaster.
Willingness of city leadership to address climate change
Initiatives by the government if any.
Socio-economic characteristics
Population Current population, sex ratio, literacy rate, population age composition (number of children between 0–6 years and people above the age of 60 years).
Density People per km2.
Urban poverty Slum population and population below poverty line.
Percentage of urban areas susceptible to hazards
Affected areas.
Per capita GDP City GDP (per capita).

AsiAn Cities ClimAte ResilienCe 22
3 Application of the HIGS framework
Climate change poses a variety of challenges for city management, and there is a need to develop methods for understanding and managing risk. This conceptual framework analyses four key elements (physiographic and hazard-related characteristics, socio-economic characteristics, infrastructure services, and governance) and the general components of each, and acts as a tool to assess the vulnerability of cities. The vulnerability assessment provides data and information on which to base actions for climate adaptation at the city level. The HIGS framework can help city managers to understand their city’s exposure to climate change impacts, as well as potential areas for action to reduce risk and build the capacity to cope with and adapt to the remaining risks. These variables highlight the anticipated stresses on a city, and its potential to act with constrained resources. once the data are collected and analysed for each variable of HIGS, local government and organisations can engage with the framework to address priority issues and collect further data or carry out further analyses as necessary. The framework also addresses the institutional factors that constrain effective responses to system fragility or undermine the ability of authorities to take action.
3.1 Applying the HIGS rapid vulnerability assessmentThese datasets collected through HIGS can provide an indication of the current status of a city’s resilience by using comparisons to government-set benchmarks for certain components of the HIGS framework, such as service provision. As part of the ongoing endeavour to facilitate critical reforms in the urban sector, the Ministry of Urban Development has now adopted national benchmarks in four key sectors: water supply, sewerage, solid waste management and stormwater drainage. The data provided by the Central Public Health and Environmental Engineering organisation (CPHEEo) are also used with regard to the reach and coverage of infrastructure provision and health services. The data collected for the HIGS assessment can then be compared to city-level benchmarks.
It is intended that the HIGS framework provide a rapid assessment methodology for city authorities to understand the key vulnerable points in their cities, in order to pinpoint priority areas for action. As such, the methodology relies on secondary data collection which can be carried out by consultants, urban local bodies (ULBs), NGos, academics or any other agency hired by the city government. However, it is recommended that the city government is involved in the process of assessing the variables and the implications for shaping priority action areas to ensure that the city becomes more prepared for the possible impacts of climate change impacts, which may be a worsening of the intensity or frequency of the climate-related hazards that the city is already facing.
To provide an example of the HIGS framework being applied in practice, and to highlight the methodology used, two cities have been selected as case studies. These are Hyderabad and Haridwar. The results of collecting the relevant data for each city and reviewing their vulnerability profiles are detailed below. Tables 2 and 3 provide a summary of the data collected for each city.

AsiAn Cities ClimAte ResilienCe 23
3.2 A short analytical snapshot of the two citiesHyderabad and Haridwar represent diverse physiographic and demographic characteristics. The risks faced by the cities lie in the degree of exposure to different extreme events that they face, which can occur with varying severity at different geographical scales. However, the possibility of slow-onset and indirect climate impacts must also be considered.
Hyderabad is a land-locked riverine city located 548m above mean sea level and the sixth largest urban agglomeration in India, with a metropolitan population of 7.75 million. Hyderabad is the capital of the state of Andhra Pradesh. Currently, the Hyderabad urban agglomeration (UA) area extends to over 778.17km2. It has evolved into a hub of information technology and has witnessed rapid expansion due to an industrial boom and increased trade opportunities. With an increasing population and growing urban sprawl, the city’s natural resources and urban services are suffering from tremendous stress. The encroachment of water bodies has reduced their carrying capacity, resulting in unprecedented floods in the city in August 2000, due to 24cm of rainfall in 24 hours (Chigurupati and Manikonda 2007).
Haridwar is a hill city, lying between the Shivalik mountain range of the Himalayas in the north and northeast, and the Ganges River in the south, covering an area of about 2360km2. The city is known for its rich and ancient religious and cultural heritage. The city has now emerged as a major industrial location in Uttarakhand State. The total population of the city in 2001 was 0.1 million, increasing to 0.3 million in 2011. Human activities have been responsible to a large extent for many of the environmental problems faced by this mountain city (Mohan and Sinha 2010). The natural ecosystem has been disturbed and compromised by industrialisation. The Himalayas are now being especially exploited, to provide raw materials for the growing number of forest-based industries.
3.2.1 Hazard exposure
Hyderabad and Haridwar are exposed to different natural hazards due to the nature of their locations. Hyderabad is a riverine city, and is exposed to floods due to its location within the catchment area of rivers Godavari and Krishna. The flood frequency is affected by changes in the year to year variability in precipitation, and by changes in short-term rainfall properties. Hyderabad faces heat waves and it is projected that the average number of days per year with night temperatures above 27°C will approximately triple until 2050 (Matthias et al. 2009). The number and extent of water bodies is decreasing rapidly owing to recurrent droughts, however the Hyderabad Urban Development Authority (HUDA) has notified 169 lakes for protection and conservation. Moreover, that notification also restricts activity in a 30m buffer zone around water bodies.
Haridwar, being situated in the Himalayan zone, is vulnerable to natural hazards like flash floods, landslides and occasional droughts. It is likely that an increase in the rainfall intensity of the summer monsoon will lead to increased risks of flooding. The erratic behaviour of the monsoon with the melting of Himalayan glaciers could cause floods in Haridwar City in future, including flash floods. Nallahs4 are generally choked, causing rainwater to flood the city, and there have been increasing incidences of flooding in recent years.
Climate change has affected temperature and precipitation variation across India and data from 1950 to 2000 from the Indian Metrological Department has been collected to understand the variation in mean maximum and minimum temperatures and precipitation. The analysis suggests that Hyderabad experienced maximum intensity of rainfall in the evening and night, attributed to the diurnal variation of rainfall for monsoon months for the data period (1949–1998). The city receives 603mm of rainfall and the pattern of extreme precipitation events from 1910 to 2000 has shown an increasing trend.
Haridwar experienced annual maximum temperatures of 300C to 420C and annual minimum winter temperatures of 40C to 140C. The climate of the city is very humid during the monsoon, at between 70 and 85 per cent. During summer it is between 40 and 60 per cent. The temperature variation over the last five decades has shown that the temperature exceeded the mean maximum temperature (390C) in the month of May about seven times during 1971–80 and 1991–2000.
4 A ravine or gully.

AsiAn Cities ClimAte ResilienCe 24
3.2.2 Infrastructure
Hyderabad is becoming more liable to urban flooding and waterlogging even during small shower spells, due to the lack of stormwater drainage. In 2010–2011 there were more than 300 incidences of waterlogging/urban flooding in the city. At the same time, due to the lack of a piped water supply, it is suffering from water scarcity and drought-like conditions. Nearly 50 per cent of the city’s water is sourced from River Krishna, which is 250km from the city. In part due to the long distances of water transportation, water availability for drinking purposes is insufficient and is rapidly deteriorating over time (Savage and Dasgupta 2006). There is a deficit of nearly 10 per cent of the total demand, and this deficit is projected to increase to 32.5 per cent by 2021 (HMDA 2009). There are also insufficiencies in the sewage network, as the existing sewerage system covers only 70 per cent of the Municipal Corporation Hyderabad (MCH) area (prior to 1994) and is overloaded due to population growth. However, the sewer connections cover 95 per cent of the total water supply connections in the MCH area, whereas in the peripheral municipality, a large percentage of the population is not supplied with safe sanitation facilities due to the lack of any well-established sewerage system.
In Haridwar, the supply system for services is highly erratic and unreliable. There are frequent power failures and voltage fluctuations in the city. Water supply and sanitation is inadequate. Considering 30 per cent unaccounted-for water (UFW), the total quantity of water reaching the 344,000 residents of the city (including a floating population of about 160,000) is about 42 million litres per day (MLD). The average per capita supply rate may therefore be assumed as 122 litres per day, which is slightly below the norm of 135 litres per day prescribed by CPHEEo. This leads to a widening gap between demand and supply, while the operating mechanism suffers from deteriorating financial and technical administration. Haridwar is likely to face problems in the near future with water and sewage backing up into streets; hazardous waste leaks; water pipeline leaks; flooding of transit air tunnels and vent shafts; malfunctions of major electrical and transit systems; erosion and corrosion of roadbeds and other facilities; and weakened support structures (CDP 2007).
3.2.3 Governance
When considering existing structures and institutions which can contribute to the city’s preparedness to extreme climate events, Haridwar has, through experience, developed two sets of organisational structures – one for normal circumstances and the mela committee, which was established to deal with emergency situations. The city also has a hazard management authority, which has developed a district hazard action plan. In Hyderabad, there are some examples of government-led initiatives which can contribute to urban climate change adaptation as well as mitigation efforts. HUDA has taken up the task of restoring the lakes in the Hyderabad metropolitan area to conserve the water bodies and to increase the groundwater table with clean water. In the first phase, out of 169 large water bodies notified, 87 lakes have been included in the Green Hyderabad Environment Programme (GHEP) from 2004 onwards. The programme was funded by the Royal Netherlands Embassy until March 2004 and the government of India took over the responsibility of funding the programme thereafter. HUDA has also adopted environmental building regulations and guidelines (EBRGs) which guide citizens on most issues such as energy consumption, water requirements, ecology and geology on site, building materials, sewage disposal, stormwater management, solid waste management and pollution control.
3.2.4 Socio-economic variables
Decadal census data is a source of information regarding population characteristics and composition, and can provide an indication of socio-economic vulnerability. In both Haridwar and Hyderabad, population growth has shown an increasing trend, when compared to the previous decadal census results. The city of Hyderabad experienced 34 per cent decadal population growth, whereas Haridwar saw 40 per cent decadal population growth in 2011 (Census of India 2011). Women, children and the elderly, and those on low or irregular incomes, can be considered more vulnerable to possible climate change impacts. Greater Hyderabad Municipal Corporation has 11 per cent of its population aged 0–6 years; 49 per cent
AsiAn Cities ClimAte ResilienCe 25
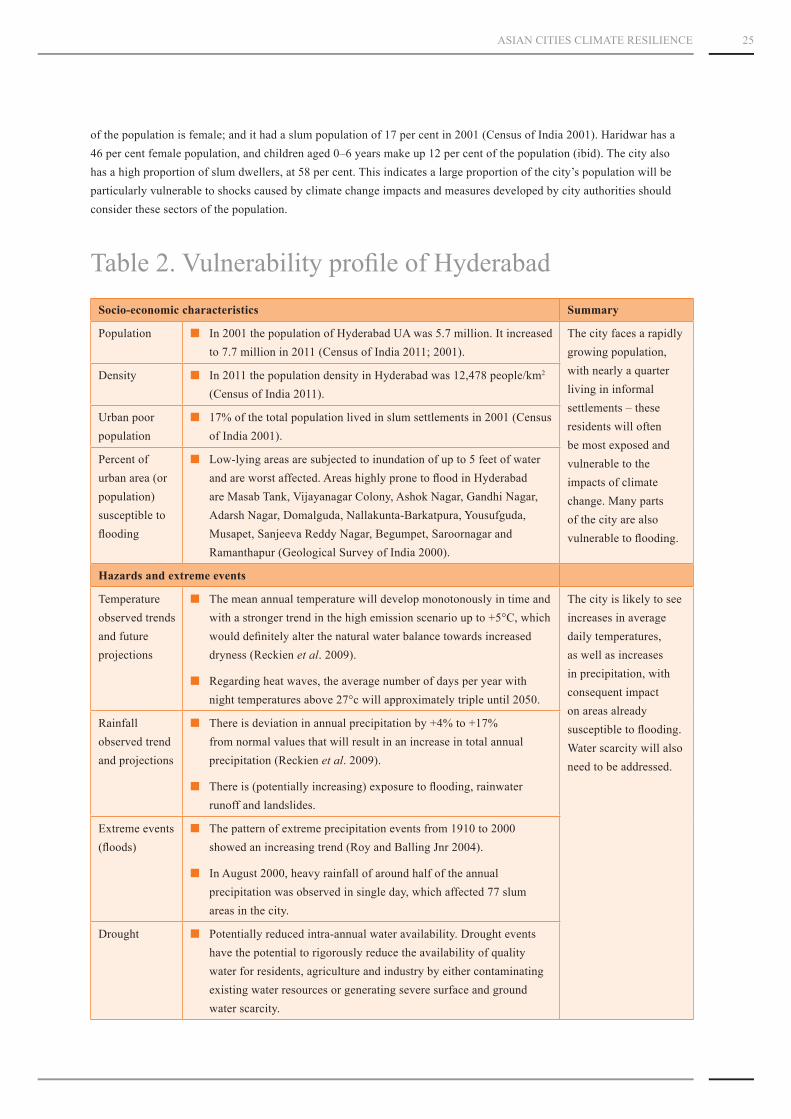
of the population is female; and it had a slum population of 17 per cent in 2001 (Census of India 2001). Haridwar has a 46 per cent female population, and children aged 0–6 years make up 12 per cent of the population (ibid). The city also has a high proportion of slum dwellers, at 58 per cent. This indicates a large proportion of the city’s population will be particularly vulnerable to shocks caused by climate change impacts and measures developed by city authorities should consider these sectors of the population.
Table 2. Vulnerability profile of HyderabadSocio-economic characteristics Summary
Population ■■ In 2001 the population of Hyderabad UA was 5.7 million. It increased to 7.7 million in 2011 (Census of India 2011; 2001).
The city faces a rapidly growing population, with nearly a quarter living in informal settlements – these residents will often be most exposed and vulnerable to the impacts of climate change. Many parts of the city are also vulnerable to flooding.
Density ■■ In 2011 the population density in Hyderabad was 12,478 people/km2 (Census of India 2011).
Urban poor population
■■ 17% of the total population lived in slum settlements in 2001 (Census of India 2001).
Percent of urban area (or population) susceptible to flooding
■■ Low-lying areas are subjected to inundation of up to 5 feet of water and are worst affected. Areas highly prone to flood in Hyderabad are Masab Tank, Vijayanagar Colony, Ashok Nagar, Gandhi Nagar, Adarsh Nagar, Domalguda, Nallakunta-Barkatpura, yousufguda, Musapet, Sanjeeva Reddy Nagar, Begumpet, Saroornagar and Ramanthapur (Geological Survey of India 2000).
Hazards and extreme events
Temperature observed trends and future projections
■■ The mean annual temperature will develop monotonously in time and with a stronger trend in the high emission scenario up to +5°C, which would definitely alter the natural water balance towards increased dryness (Reckien et al. 2009).
■■ Regarding heat waves, the average number of days per year with night temperatures above 27°c will approximately triple until 2050.
The city is likely to see increases in average daily temperatures, as well as increases in precipitation, with consequent impact on areas already susceptible to flooding. Water scarcity will also need to be addressed.
Rainfall observed trend and projections
■■ There is deviation in annual precipitation by +4% to +17% from normal values that will result in an increase in total annual precipitation (Reckien et al. 2009).
■■ There is (potentially increasing) exposure to flooding, rainwater runoff and landslides.
Extreme events (floods)
■■ The pattern of extreme precipitation events from 1910 to 2000 showed an increasing trend (Roy and Balling Jnr 2004).
■■ In August 2000, heavy rainfall of around half of the annual precipitation was observed in single day, which affected 77 slum areas in the city.
Drought ■■ Potentially reduced intra-annual water availability. Drought events have the potential to rigorously reduce the availability of quality water for residents, agriculture and industry by either contaminating existing water resources or generating severe surface and ground water scarcity.

AsiAn Cities ClimAte ResilienCe 26
Infrastructure status
Water supply ■■ The present water supply from the available sources is 206 MGD.
■■ The per capita water availability in the city is 122 LPCD (MoUD-SLB 2010).
■■ The city’s main water source, the River Krishna, is 250km away.
■■ only 66% of the population has access to a water supply.
■■ The supply and demand gap is projected to increase to 32.5% by 2021.
■■ Leakages in supply and unauthorised tapping affects up to 40% of the water supplied.
■■ Intermittent piped water supply.
There are gaps in the city’s infrastructure provision which need to be addressed for both development and adaptation purposes, particularly bearing in mind the city’s population growth. In particular, there are large inadequacies in the coverage of sewerage networks and stormwater drains, while the water supply system is subject to inefficiencies through leakages and rapidly growing demand. Power supply is also lagging behind demand. Addressing these infrastructure deficiencies will contribute to the city’s resilience.
Sewerage ■■ In the city, the coverage of sewerage network services is 46%. Coverage of toilets is 98%.
■■ Collection efficiency of network is just 40% (MoUD-SLB 2010)
Solid waste management
■■ 2000–2500 tonnes per day of solid waste generated in the city.
■■ The collection efficiency is 80%. But no segregation of the collected waste is done.
Stormwater drainage
■■ only 40% of coverage, the system is designed for a rainfall of 12mm/hour whereas average intensity is 23mm/hour and peak is 52mm/hour.
■■ 351 incidences of water logging in the city in 2010–2011 (MoUD-SLB 2010).
Transportation ■■ only 30% of all commuters use public transport for commuting.
■■ High fares and low efficiency.
Housing ■■ There are 881,512 housing units in urban Hyderabad (Census of India 2011).
■■ There has been an increase of 88.7% in built-up area permissions in 2006–2007. A 15 year projection shows 133% increase in residential areas, while commercial areas will increase by 21 times (HMDA 2009).
■■ 28.1% of houses in Hyderabad’s urban areas are highly vulnerable to flood hazards, and 7.9% of city houses are vulnerable to wind hazards (Census of India 2011).
Table 2. Vulnerability profile of Hyderabad (cont.)

AsiAn Cities ClimAte ResilienCe 27
Infrastructure status (cont.)
Power ■■ Lack of capital to replace power sources with energy-efficient modes.
■■ Power theft is very common in the city.
■■ In 2001, the gap between electricity demand and supply was 7.8% with peak power shortages being as high as 13%. The annual growth rate of number of electricity consumers is 7% and total connected load is 8%.
■■ The rate of growth in energy consumption is currently outstripping the municipality’s ability to construct new energy-generation facilities, including traditional plants or large-scale renewable energy facilities.
■■ 45% of Hyderabad’s urban energy consumption is by the building sector
Governance
Administrative unit assigned to address climate change
■■ Hyderabad is the administrative headquarter of the state: the environment department and assigned urban development department at state level have significant stakes in the sustainable and climate-resilient development of the city (CDP 2005).
■■ Hyderabad Metropolitan Development Authority (HMDA) and Hyderabad Municipal Corporation have demonstrated their willingness to consider climate issues through several initiatives such as environmental building regulations.
■■ They have also worked in collaboration with the Natural Resources Defence Council (NRDC) to identify challenges and opportunities towards climate-responsive development.
Whilst there is an awareness of the need to link environmental concerns with growth and urban development, there remains a need to ensure that guidelines are implemented. The city’s role as an administrative headquarters highlights the strategic importance of taking measures to build resilience.
Willingness of city leadership to address climate change
■■ Hyderabad Metropolitan Development Authority (HMDA) adopted environmental building regulations and guidelines (EBRGs) which guide citizens on most urban issues such as climate, energy consumption, water requirements, ecology and geology on site, building materials, sewage disposal, comfort, stormwater management, solid waste management and pollution control.
Table 2. Vulnerability profile of Hyderabad (cont.)

AsiAn Cities ClimAte ResilienCe 28
Table 3. Vulnerability profile of Haridwar Socio-economic characteristics Summary
Population ■■ The population of Haridwar City was 0.1 million in 2001, increasing to 0.3 million in 2011 (Census of India 2011). It experienced 26.3% decadal growth in 1991–2001. According to some estimates, population growth rate will increase in the next couple of decades and then stabilise at a natural growth rate of 2.5% per annum (CDP 2007).
The city is experiencing very rapid growth and a very high proportion of the city’s residents live in informal settlements, where they will be frequently exposed to hazardous situations.Density ■■ 612 people per km2 in 2001 (CDP 2007).
Urban poor population
■■ 58% of the city’s population lives in slums. There are a total of 49 slums in the city, with 20 major slums (CDP 2007).
Percentage of urban area (or population) susceptible to flooding
■■ 9.2% of the area of the city is prone to flooding.
Natural hazards
Temperature observed trends and future projections
■■ The PRECIS (RCM based on HadCM3) outputs for the A2–2080 scenarios indicate that an increase in the temperature is less in the relatively hilly Haridwar in relation to other areas like Dehradun in Uttarakhand (Aggarwal et al. 2010).
The city is likely to see increased rainfall intensity, which, due to its hilly situation, makes it particularly at risk of flash floods and waterlogging.
Rainfall observed trends and projections
■■ Average annual rainfall is around 2300 mm (CDP 2007). Haridwar is sensitive to any change in rainfall patterns. Seasonal rainfall i.e. June–September is projected to increase significantly (CDP 2005).
Extreme events(floods)
■■ Due to steep slopes and large catchment areas, runoff is high, causing waterlogging and backflow in many areas. Natural drains have been encroached on in many places.
Infrastructure status
Water supply ■■ The per capita water supply in the city is 122 LPCD (after leakage loss of about 30%) (CDP 2007).
■■ Total water production capacity is 60 MLD.
■■ Total water availability 42 MLD.
■■ Around 85% of the city’s population has a piped water supply (CDP 2007).
■■ Some of the existing pipelines in the old city area have outlived their utility leading to frequent breakdown and leakages. There are also undetected leakages due to construction of metalled roads over the pipeline.
■■ Haridwar declared a critical region to check further extraction of groundwater.
The city faces gaps in service provision which should be addressed as far as possible, particularly to ensure that those who are already exposed in informal settlements are supplied with hazard-reducing infrastructure. The lack of solid waste collection should be addressed as this will have secondary implications on the efficiency of drainage systems. The high number of pilgrims

AsiAn Cities ClimAte ResilienCe 29
Infrastructure status (cont.)
Sewerage ■■ 80% of the population is connected to a sewage system.
■■ Sewage generation is 33 MLD (CDP 2007).
■■ However, the sewage treatment capacity is 26 MLD with a gap of 7 MLD.
■■ There are 15 working sewage-pumping stations for carrying sewage downstream for treatment and irrigation.
and tourists coming to the city means that the transportation sector is an important part of the city’s growth and development. There is also a need for adequate provision of other basic services.
Solid waste management
■■ 190 MT of solid waste is generated per day with the major portion coming from domestic sector. There is practically no primary collection system in the city.
■■ Localities have to engage private sweepers for door-to-door primary collection called mohalla swachhata samities (MSS).
■■ Haridwar Nagar Palika Parishad (HNPP) disposes of the solid waste at mainly two locations: Jwalapur, located about 7km from the city and National Highway 74 at a distance of about 8km from the city.(CDP 2007).
Stormwater drainage
■■ Majority of the area is covered with drains, except for the informal settlements.
■■ Garbage and other kinds of solid waste is dumped in drains due to the lack of a solid waste collection system.
Transportation ■■ Vehicle density is 557 vehicles per km of road, which is very high. About 85% of the total motorised vehicles on the roads are two wheeled (CDP 2007).
■■ During mela periods, there is also heavy pedestrian traffic due to visiting pilgrims from various parts of the country in the city.
Power ■■ 16.0174 million units (MU) of power is generated daily on average by Uttarakhand Jal Vidyut Nigam Limited (UJVN Lmited 2013).
■■ 11.5101 MU daily is the Uttarakhand share from central sector generating stations.
Housing ■■ Haridwar Development Authority, private developers and religious trusts are the primary institutions providing housing in Haridwar.
■■ Due to the shortage of housing, there are high incidences of unauthorised construction activities on undeveloped land – 90% of houses are made of burnt bricks (Census of India 2011), which according to the Vulnerability Atlas of India (BMTPC 2006) are moderately vulnerable to floods and wind-related hazards.
Table 3. Vulnerability profile of Haridwar (cont.)

AsiAn Cities ClimAte ResilienCe 30
Governance
Administrative unit assigned to address climate change
■■ The state of Uttarakhand, since its creation in 2000, has established institutions and promoted programmes to facilitate mainstreaming of various adaptation measures, build resilience of vulnerable communities and households, deepen impacts of national missions and/or provide co-benefits through development interventions.
■■ The District Hazard Management Authority was formed in Haridwar in December 2007.
■■ Land use/land cover change studies were carried out for Nainital and Haridwar cities using high-resolution satellite imageries (IKoNoS and WV2) (Government of Uttarakhand 2012).
■■ To get the benefit of a range of urban development interventions, including the development of city sanitation plans, the city is part of the JnNURM programme.
■■ The state of Uttarakhand has already been undertaking a range of initiatives across various sectors that are supportive of building adaptive resilience to climate change as well as supporting mitigation activities, but these have a rural focus:
■■ Crop insurance schemes for agricultural crops and fruits;
■■ Deepened agriculture extension services to sub-block levels, holding twice-yearly extension-cum-inputs provision ‘fairs’ with agricultural scientists and providing alternative extension services for rain-fed organic agriculture on a very large scale;
■■ organic Commodities Board (UoCB) for operationalising organic farming and revitalising rain-fed agriculture.
■■ Watershed management directorates (WMD) under the watershed development department with detailed multi-layer land-use details for 1110 micro-watersheds ready to operationalise local-level adaptation measures at the grassroots level.
The city has its own hazard management authority, which can play an important role in driving adaptation and resilience-building activities in the city. While the state is supportive of resilience-building initiatives, these have a predominantly rural focus and similar initiatives should be applied in urban areas as well. Given the city’s hilly topography, it is important that it is integrated into wider watershed management systems which may extend beyond the municipality’s borders.
Willingness of city leadership to address climate change
■■ District hazard-management action plan and city development plans are made to build the capacity to cope with the natural hazards.
Table 3. Vulnerability profile of Haridwar (cont.)

AsiAn Cities ClimAte ResilienCe 31
3.3 Analysis of HIGS data set for climate resilient cities
The data collected for the HIGS analysis above shows that both cities already face risks from multiple natural hazards and extreme weather events which may become more frequent due to climate change. The data also shows that emerging urban risks are likely to pose a far greater challenge due to the concentration of large populations in relatively small geographical areas; unplanned and haphazard expansion; unsafe constructions; and a lack of preparedness at the community or administration level, with inadequate capacity to meet catastrophic post-disaster situations.
For example, both cities are facing rapid urbanisation but are lagging behind in providing infrastructure services. Hyderabad became a Class I city with a population of 7.7 million in 2011. However, the per capita water supply in the city was just 122 LPCD in 2010–2011, which is below the assigned benchmark of 135 to 150 LPCD for Class I cities. Haridwar, while it has a much smaller population, also faces similar limitations in per capita water supply. Similarly, the portions of the cities’ populations living in informal settlements are lacking the provision of basic services.
The resilience of cities can be assessed by measuring flexibility, redundancy and resourcefulness in their systems. The HIGS approach makes use of diverse sets of variables to get a picture of the overall climate risk to a city. The vulnerability profiles provide a rapid assessment of the existing vulnerabilities and gaps in systems, and thus act as a starting point for prioritising resilience-building actions to be implemented at the city level. Based on the analysis of the data collected for the two cities above, a number of recommended actions are suggested below for the city decision makers, as well as some general actions of relevance to all urban areas and cities in India.
■■ Rejuvenation of water bodies: floods are being caused by the uneven distribution of rainfall, rapid urbanization, and the encroachment into and filling up of natural drainage channels and urban lakes due to the construction of buildings on high-value urban land. Hyderabad has reported its highest number of waterlogging/flooding situations during 2010–2011. Informal settlement colonies have emerged in the cities, and the lack of proper planning of these areas means they lack drainage systems, thus making them particularly vulnerable to flood hazards. By restoring lakes and urban water bodies, the risk of flooding can be reduced as they act as natural moderators. Restoration may also help provide an alternative water source in a context of growing water scarcity.
■■ Hazard risk-reduction strategies: the analysis of the two cities shows that there is a lack of hazard-reducing measures being applied by the city governments. Existing inadequacies in building by-laws and codes, development control regulations and land-use planning guidelines should be addressed and used to strengthen a compliance framework for addressing urban risk reduction issues.
■■ Addressing the needs of those living in informal settlements: both cities have considerable populations living in informal settlements, which therefore lack access to basic services and infrastructure including storm drainage and sanitation. Ensuring that these services are supplied will have positive impacts on the lives of the residents, ensuring better health and living conditions, whilst also reducing the vulnerability of residents to future extreme climate events.
■■ Prioritisation of the climate resilience agenda at city level: cities need to evaluate their priority adaptation strategies. Where necessary, further data collection or modelling may be required to supplement existing information and aid decision making. City authorities should be made aware that any delay in action means more severe consequences and higher costs. Investment in adaptation measures and infrastructure is not considered a priority, and resources may be lacking for such investment. There is an urgent need to remedy the lack of information regarding adaptation costs, and analyse the social and economic impacts of not taking action. There are no concrete examples of ongoing, planned government measures or investment projects (at the local or state level) to address vulnerability in either city.

AsiAn Cities ClimAte ResilienCe 32
■■ Enhanced institutional and policy coordination at the level of local institutions and capacity building at local and national levels. If there is no dedicated agency or committee to address hazards at the city scale, this should be established – and a HIGS analysis can provide the necessary impetus to do so, by revealing key vulnerabilities. A coordinated approach is also very important across all relevant agencies within a city, to ensure integrated initiatives. Measures may also need to be integrated with those of agencies outside of city boundaries, such as for watershed management, as in the case of Haridwar. More generally, there is a need to enhance institutional and policy coordination at the level of local institutions, and also build the capacity of local and national-level institutions to understand and respond to climate change-related impacts.
■■ Develop sustainable urban development indicators: these concern measuring and monitoring service delivery, which also plays a key role in ensuring that citizens have the necessary hazard-reducing infrastructure available, as well as access to key services such as public health. The use of such indicators could supplement the information collected through a HIGS rapid vulnerability assessment, as resilience is linked to urban development measures which can also have positive effects on adaptation to climate change impacts.

AsiAn Cities ClimAte ResilienCe 33
4 Concluding commentsIn Indian cities today, a lack of resources, capacity and awareness about the potential impacts of climate change has resulted in little action being taken to implement measures to ensure climate resilience in urban areas. Most municipal authorities are already grappling with large deficits in infrastructure and services and do not see climate change adaptation as a priority, even when there is a trend towards more intense and frequent extreme weather events and climate-related hazards. Infrastructure such as roads, water networks, transmission lines, schools and hospitals which provide basic services to urban populations are vulnerable to extreme climatic events such as floods, storms or extreme heat. There is a need for an increased understanding amongst urban agencies of the need to address these climate impacts, including which areas for action to prioritise, and to integrate considerations of potential future climate when implementing any urban development measures. This includes also preparing for the indirect impacts of climate change, such as increased incidences of vector-borne disease, alongside direct impacts such as flooding, sea-level rise, cyclones and drought.
A rapid vulnerability assessment tool, such as the HIGS framework, helps to address this by raising awareness of the vulnerabilities within a city, which will enhance the city administration’s knowledge and hence their ability to plan for climate-induced hazards. HIGS is one tool that can be used by city planners, researchers and academicians for an initial assessment. The framework provides an overview of the city’s infrastructure status; it also provides an initial dataset of the city’s current situation which can be used for continual assessment at regular intervals, by collecting new data.
As with any methodology relying on the collection of secondary data, the effectiveness and usefulness of the dataset collected depends very much on data being available, accurate and comparable. The current situation of unavailable, outdated or scattered data makes this task more challenging. The approach however allows for a mix of both quantitative data, such as the reach of infrastructure services, as well as qualitative data regarding existing governance structures related to city-level hazard management. The fact that the tool relies on secondary data collection also means that data can be rapidly collected by anyone with access to the Internet and government sources of information such as the census. This tool also highlights the importance of collecting and centralising data on a regular basis, to allow for such initiatives and also comparative studies across cities. The implementation of the HIGS rapid vulnerability assessment has also raised the issue of the need for reliable databases for Indian cities and for a task force for improving urban statistics and data establishment at the city level by the authorities. The next endeavour will be to more systematically and comprehensively link such datasets with service-level benchmarks so as to make gaps in service provision more easily identifiable.
The value of such a rapid assessment tool is that it can be used to kick-start a process of preparing for potential climate change impacts in situations which might otherwise not be on the agenda of city authorities, or not seen as a priority. It can identify gaps in data and knowledge which could be remedied by city agencies for better and more informed decision making. By getting climate change to be considered by planners and agencies, considerations of climate-related hazards can be integrated into planned urban development activities to ensure that resilience-building features are integrated, such as building storm drains of sufficient capacity for anticipated increases in rainfall intensity, or raising sanitation facilities above not only current but also anticipated flood levels.

AsiAn Cities ClimAte ResilienCe 34
Such a framework can also be a useful tool to raise awareness beyond the city agencies and authorities themselves. For example, the results of the dataset can be used to involve the wider populace in discussions around approaches to building resilience, by involving NGos, academics and community groups. Where appropriate, the results of the rapid vulnerability assessment can be the start of a more in-depth and localised process of vulnerability assessment, for example within particularly hazard-prone or low-income areas of the city. Where there are gaps in data for the HIGS dataset, it may be possible to involve community groups or NGos in the collection of more up-to-date data. The HIGS process, by making city managers and practitioners aware of existing and future risks faced by the city, opens up the door for participatory approaches to planning for climate resilience and highlights priority areas and sectors for action.
The framework can therefore be a tool for promoting both sustainable and inclusive urban development, while identifying areas of action for resilience-building in cities. The analysis at city level can kick-start action and further investigations into the city’s particular risks. This will help city planners and agencies to develop the necessary approaches and strategies for climate change in a way that integrates this within urban development, and shapes future urban development through an awareness of climate risks which need to be considered. City-level policies can thus be developed accordingly for climate-resilient urban development and governance.

AsiAn Cities ClimAte ResilienCe 35
References Aggarwal, P.K., S.N. Kumar and H. Pathak. 2010. Impacts of climate change on growth and yield of rice and wheat in the Upper Ganga Basin. Worldwide Fund for Nature (WWF) and Indian Agricultural Research Institute (IARI). See http://assets.wwfindia.org/downloads/impacts_of_climate_change_on_growth_and_yield_of_rice_and_wheat_in_the_upper_ganga_basin.pdf
Anthony, G. 2003. Cities and Climate Change. Paper prepared as a background paper for the World Development Report 2003 and presented at the World Bank’s Urban Forum in April 2002.
See http://unfccc.int/files/cooperation_and_support/capacity_building/application/pdf/wbcitiescc.pdf
Apte, N.y. 2009. Urban Floods in context of India. India Meteorological Department, New Delhi. See www.unescap.org/idd/events/2009_EGM-DRR/India-Apte-Innovative-ways-of-managing-Urban-Floods-comments-final.pdf
Attri, S.D. and A. Tyagi. 2010. Climate Profile of India. Contribution to the Indian Network of Climate Change Assessment (INCCA) (National Communication-II). Ministry of Environment and Forests, India Meteorological Department, Ministry of Earth Sciences: New Delhi.
BMTPC. 2006. Vulnerability Atlas of India. First Revision. Buildings Materials and Technology Promotion Council (BMTPC), Ministry of Housing and Urban Poverty Alleviation, Government of India: New Delhi.
Brown, A., A. Dayal and C. Rumbaitis del Rio. 2012. From practice to theory: emerging lessons from Asia for building urban climate resilience. Environment and Urbanization 24:2, IIED: London.
CDP. 2007. Haridwar City Development Plan Revised. GHK International: UK and Haridwar Development Authority. See http://nagarnigamharidwar.com/CDP_HARIDWAR.PDF
CDP. 2005. Hyderabad City Development Plan. Greater Hyderabad Municipal Corporation, Government of Hyderabad. See www.ghmc.gov.in/downloads/cdpdefault.asp
Census of India. 2011. Rural Urban Distribution of Population, Provisional Population Totals. office of the Registrar General and Census Commissioner, Ministry of Home Affairs, Government of India.
Census of India. 2001. Rural Urban Distribution of Population, Provisional Population Totals. office of the Registrar General and Census Commissioner, Ministry of Home Affairs, Government of India.
Chigurupati, R. and V. Manikonda. 2007. Hyderabad’s water issue and the Musi River need for integration solutions. Draft paper presented at the International Water Conference 12th–14th September 2007, Berlin.
Cutter, S.L., B. J. Boruff and W. Lynn Shirley. 2003. Social Vulnerability to Environmental Hazards. Social Science Quarterly 84: 2, Southwestern Social Science Association. See at www.colorado.edu/hazards/resources/socy4037/Cutter%20%20%20Social%20vulnerability%20to%20environmental%20hazards.pdf
De, U.S., R.K. Dube and G.S Rao. 2005. Extreme Weather Events over India in the Last 100 years. Journal of Indian Geophysical Union 9:3, 173–187. See http://indiaenvironmentportal.org.in/files/extreme%20events.pdf
Geological Survey of India. 2000. August 2000 Flood in Hyderabad City: Causative factors and suggestions to avoid recurrence. See www.portal.gsi.gov.in/gsiDoc/pub/cs_hydflood_aug00.pdf

AsiAn Cities ClimAte ResilienCe 36
Government of Uttarakhand. 2012. Transforming crisis into opportunity. State Action Plan on Climate Change, Government of Uttarakhand. See www.uttarakhandforest.org/Data/SC_Revised_UAPCC_27june12.pdf
HMDA. 2009. Environmental Building Guidelines for Hyderabad. Hyderabad Metropolitan Development Authority. See www.hmda.gov.in/ebgh/home/issueswefaceinourcity.html
ICLEI. 2009. Energy and Carbon Emissions Profiles of 54 South Asian Cities. British High Commission, New Delhi.
INCCA. 2010. Climate Change and India – A 4x4 Assessment: A sectoral and regional analysis for 2030s. Indian Network for Climate Change Assessment (INCCA), Ministry of Environment and Forests, Government of India. See http://moef.nic.in/downloads/public-information/fin-rpt-incca.pdf
IPCC. 2012. Managing the Risks of Extreme Events and Disasters to Advance Climate Change Adaptation: A special report of working groups I and II of the Intergovernmental Panel on Climate Change. Field, C.B., V. Barros, T.F. Stocker, D. Qin, D.J. Dokken, K.L. Ebi, M.D. Mastrandrea, K.J. Mach, G.-K. Plattner, S.K. Allen, M. Tignor, and P.M. Midgley (eds.). Cambridge University Press: Cambridge and New york. See http://ipcc-wg2.gov/SREX/images/uploads/SREX-All_FINAL.pdf
IPCC. 2001. Climate Change 2001: The scientific basis. Contribution of Working Group I to the Third Assessment Report of the Intergovernmental Panel on Climate Change. Cambridge: Cambridge University Press.
Matthias, K., B. Lüdeke and M. Budde. 2009. Evaluating Climate Change Scenarios from AOGCMs to Hyderabad. Concept paper, Potsdam Institute for Climate Impact Research, Research Domain II: Climate Impacts and Vulnerabilities.
McKinsey and Company. 2009. Building India: Accelerating Infrastructure Projects. McKinsey and Company, Inc.
MGI. 2010. India’s Urban Awakening: Building inclusive cities, sustaining economic growth. McKinsey Global Institute, McKinsey and Company.
MGI. 2007. Curbing Global Energy Demand Growth: The energy productivity opportunity. McKinsey Global Institute, pp. 57–104. See www.mckinsey.com/insights/energy_resources_materials/curbing_global_energy_demand_growth
Ministry of Home Affairs. 2004. Disaster Management in India: A status report. National Disaster Division, Ministry of Home Affairs, Government of India. See www.ndmindia.nic.in/EQ
Ministry of Housing and Urban Poverty Alleviation. 2007. Report of the Technical Group on Estimation of Urban Housing Shortage. See http://mhupa.gov.in/ministry/housing/HoUSINGSHoRTAGE-REPT.pdf
Mohan, D. and S. Sinha. 2010. Vulnerability assessment of people, livelihoods and ecosystems in the Ganga Basin. WWF India. See http://www.cakex.org/virtual-library/3458
MoHUPA. 2009. India Urban Poverty Report 2009. UNDP India, Ministry of Housing and Urban Poverty Allivation (MoHUPA), Government of India. oxford University Press.
MoUD. 2011. India’s Urban Demographic Transition: The 2011 census results (provisional). JNNURM Directorate, Ministry of Urban Development and National Institute of Urban Affairs (NIUA), New Delhi.
MoUD-SLB. 2010. Service Level Benchmarking (SLB) Target Notification 2010–2011. Administrative Staff College of India. Ministry of Urban Development, New Delhi.
Munich Re. 2000. World of Natural Disasters. CD RoM edition. Munich Re: Munich.
NIUA. 2001. Urban Statistics Handbook 2000. National Institute of Urban Affairs (NIUA): Delhi.
Parikh, J., P. Jindal and G. Sandal. 2013. Climate Resilient Urban Development: Vulnerability profiles of 20 Indian cities. IRADe: New Delhi.
Productivity Commission. 2012. Barriers to Effective Climate Change Adaptation. Draft Report: Canberra.
Reckien, D., M.K. Lüdeke, H.F. Reusswig, o. Kit, S. Hofmann, L. Meyer-ohlendorf, U. Anders, M. Budde and A. otto. 2009. Sustainable climate change adaptation and mitigation options in the future megacity of Hyderabad/India: scenario development and leverage points on influence networks. Presentation to the second German–Indian Conference

AsiAn Cities ClimAte ResilienCe 37
on Research for Sustainability, Germany. United Nations Univerity, Bonn, 27th–28th April 2009. See http://edoc.gfz-potsdam.de/pik/get/4549/0/0ab2bfa39d6168f4bde0c00dc7120d3a/4549.pdf
Roy, S.S. and R.C. Balling Jnr. 2004. Trends in extreme daily precipitation on indices in India. International Journal of Climatology 24: 457–466. See http://onlinelibrary.wiley.com/doi/10.1002/joc.995/pdf
Savage, D. and S. Dasgupta. 2006. Governance framework for delivery of urban services. In: R.B. Lall (ed). India Infrastructure Report 2006: Urban infrastructure. oxford University Press: New Delhi.
Tanner, T., T. Mitchell, E. Polack and B. Guenther. 2009. Urban Governance for Adaptation: Assessing climate change resilience in ten Asian cities. IDS Working Paper 315. Institute of Development Studies, University of Sussex.
Tripathi, S. 2013. An Overview of India’s Urbanization, Urban Economic Growth and Urban Equity. MPRA Paper 45537. See http://mpra.ub.uni-muenchen.de/45537/1/MPRA_paper_45537.pdf
Trivedi, T.P. 2009. DARE/ICAR Annual Report 2008–2009. Indian Council of Agricultural Research (ICAR): New Delhi.
Turner, B. L., R.E. Kasperson, P.A. Matsone, J.J. McCarthy, R.W. Corell, L. Christensen, N. Eckley, J.X. Kasperson, A. Luerse, M.L. Martello, C. Polsky, A. Pulsipher and A. Schiller. 2003. A Framework for Vulnerability Analysis in Sustainability Science. The National Academy of Sciences. See www.pnas.org/cgi/doi/10.1073/pnas.1231335100
Tyler, S. and M. Moench. 2012. A framework for urban climate resilience. Climate and Development 4:4, 311–326.
United Nations. 2012. World Urbanization Prospects: The 2011 revision. CD-RoM Edition. United Nations, Department of Economic and Social Affairs, Population Division.
UJVL. 2013. Uttarakhand Jal Vidyut Nigam Ltd. See www.uttarakhandjalvidyut.com (accessed 24 January 2014).

Vulnerability profiling of cities: a framework for climate-resilient urban development in India
Asian Cities Climate Resilience Working Paper Series
This working paper series aims to present research outputs around the common theme of urban climate resilience in Asia. It serves as a forum for dialogue and to encourage strong intellectual debate over concepts relating to urban resilience, results from the ground, and future directions. The series is also intended to encourage the development of local research capacity and to ensure local ownership of outputs.
The series has arisen out of the Asian Cities Climate Change Resilience Network (ACCCRN, www.acccrn.org), an initiative funded by the Rockefeller Foundation.
The series is intended to present research in a preliminary form for feedback and discussion. Readers are encouraged to provide comments to the authors whose contact details are included in each publication.
Published by IIED, March 2014
IIED order no: 10657 http://pubs.iied.org/10657IIED.html
ISBN 978-1-78431-027-1
80-86 Gray’s Inn Road, London WC1X 8NH, UK
Tel: +44 (0)20 3463 7399
Fax: +44 (0)20 3514 9055
email: [email protected]
www.iied.org


