Vulnerability assessment of groundwater pollution in the vicinity...
10
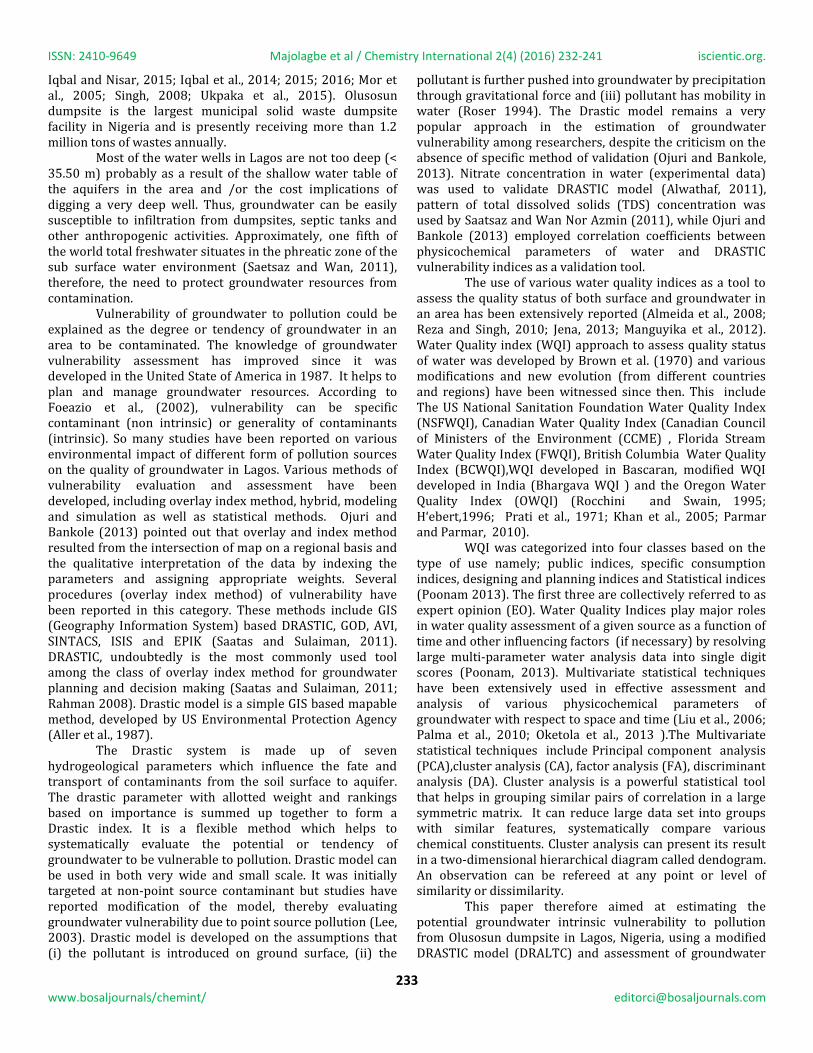
232 www.bosaljournals/chemint/ [email protected] Article type: Research article Article history: Received November 2015 Accepted December 2015 October 2016 Issue Keywords: Modified DRASTIC model DRALTC model Vulnerability Water quality index Cluster analysis The deleterious impacts of dumpsite activities and the associated risk on both the environment and human is consequential, hence this study assessed groundwater vulnerability to pollution from dumpsite using a modified DRASTIC model. Six hydrogeological factors: D- Depth to water, R- Net Recharge, A- Aquifer media, L- Distance of well to dumpsite, T- Topography, and C- Clay content were used in the modification (DRALTC) based on peculiarity of the study area. Cluster analysis of groundwater data and Water Quality Index (WQI) were also evaluated. The groundwater vulnerability index was characterized by two zones; forty five percent (45%) moderate and fifty five percent (55%) high zones. The dendogram showed three clusters of chemical dissimilarities. The WQI showed values between 61.8 and 205, indicating good, poor and very poor class of water. The analysis of the groundwater samples showed nitrate concentration ranging from 7.60 to 35.6 mg/L and from 8.56 to 32.4 mg/L in dry and rainy seasons, respectively. The DRALTC model was validated using nitrate concentration. Though, there appeared relative groundwater protection from contamination, there is still need for measures to mitigate further contamination and associated risk in the moderate vulnerability zones. DRALTC model is proved a good tool in groundwater management. © 2016 International Scientific Organization: All rights reserved. Capsule Summary: In this work the groundwater vulnerability to dumpsite pollution revealing index from moderate to high was assessed. The Water Quality Index ranged from 61.8 to 205 delineating good-poor-very poor water type. Cite This Article As: A. O. Majolagbe, A. A. Adeyi and O. Osibanjo. Vulnerability assessment of groundwater pollution in the vicinity of an active dumpsite (Olusosun), Lagos, Nigeria. Chemistry International 2(4) (2016) 232-241. INTRODUCTION Groundwater is a major source of water supply for domestic, agricultural, recreational, and industrial purposes in Lagos, a fast emerging mega city in Africa. Consequently, the adequacy of groundwater resources, both in quality and quantity is essential for socio-economic sustainability in the area. However, the aquifer and groundwater are under intense threats from both natural and anthropogenic sources such as urbanization, infiltration from dumpsites, intrusion of sea water and effects of various land use configurations (Adesola et al., 2016; Babarinde and Onyiaocha, 2016; Osibanjo and Majolagbe, 2012; Qureshi et al., 2015; Sayed, 2015; Thrumalaivasan et al., 2003; Ukpaka, 2016). The pollutant that infiltrate from dumpsite has once been described as the worst threats to groundwater quality (Bilal et al., 2014; Iqbal and Bhatti, 2014; Iqbal and Khera, 2015; Chemistry International 2(4) (2016) 232-241 Vulnerability assessment of groundwater pollution in the vicinity of an active dumpsite (Olusosun), Lagos, Nigeria Abdulrafiu O. Majolagbe 1,2, * Adebola A. Adeyi 1 and Oladele Osibanjo 1 1 Department of Chemistry, University of Ibadan, Ibadan, Nigeria 2 Department of Chemistry, Lagos state University, P.M.B. 1087, Apapa, Lagos, Nigeria *Corresponding author’s E. mail: [email protected] ARTICLE INFO ABSTRACT
Transcript of Vulnerability assessment of groundwater pollution in the vicinity...
ISSN: 2410-9649 Majolagbe et al / Chemistry International 2(4) (2016) 232-241 iscientic.org.
232 www.bosaljournals/chemint/ [email protected]
Article type: Research article Article history: Received November 2015 Accepted December 2015 October 2016 Issue Keywords: Modified DRASTIC model DRALTC model Vulnerability Water quality index Cluster analysis
The deleterious impacts of dumpsite activities and the associated risk on both the environment and human is consequential, hence this study assessed groundwater vulnerability to pollution from dumpsite using a modified DRASTIC model. Six hydrogeological factors: D- Depth to water, R- Net Recharge, A- Aquifer media, L- Distance of well to dumpsite, T- Topography, and C- Clay content were used in the modification (DRALTC) based on peculiarity of the study area. Cluster analysis of groundwater data and Water Quality Index (WQI) were also evaluated. The groundwater vulnerability index was characterized by two zones; forty five percent (45%) moderate and fifty five percent (55%) high zones. The dendogram showed three clusters of chemical dissimilarities. The WQI showed values between 61.8 and 205, indicating good, poor and very poor class of water. The analysis of the groundwater samples showed nitrate concentration ranging from 7.60 to 35.6 mg/L and from 8.56 to 32.4 mg/L in dry and rainy seasons, respectively. The DRALTC model was validated using nitrate concentration. Though, there appeared relative groundwater protection from contamination, there is still need for measures to mitigate further contamination and associated risk in the moderate vulnerability zones. DRALTC model is proved a good tool in groundwater management.
© 2016 International Scientific Organization: All rights reserved.
Capsule Summary: In this work the groundwater vulnerability to dumpsite pollution revealing index from moderate to high was assessed. The Water Quality Index ranged from 61.8 to 205 delineating good-poor-very poor water type.
Cite This Article As: A. O. Majolagbe, A. A. Adeyi and O. Osibanjo. Vulnerability assessment of groundwater pollution in the vicinity of an active dumpsite (Olusosun), Lagos, Nigeria. Chemistry International 2(4) (2016) 232-241.
INTRODUCTION Groundwater is a major source of water supply for domestic, agricultural, recreational, and industrial purposes in Lagos, a fast emerging mega city in Africa. Consequently, the adequacy of groundwater resources, both in quality and quantity is essential for socio-economic sustainability in the area. However, the aquifer and groundwater are under
intense threats from both natural and anthropogenic sources such as urbanization, infiltration from dumpsites, intrusion of sea water and effects of various land use configurations (Adesola et al., 2016; Babarinde and Onyiaocha, 2016; Osibanjo and Majolagbe, 2012; Qureshi et al., 2015; Sayed, 2015; Thrumalaivasan et al., 2003; Ukpaka, 2016). The pollutant that infiltrate from dumpsite has once been described as the worst threats to groundwater quality (Bilal et al., 2014; Iqbal and Bhatti, 2014; Iqbal and Khera, 2015;
Chemistry International 2(4) (2016) 232-241
Vulnerability assessment of groundwater pollution in the vicinity of an active dumpsite (Olusosun), Lagos, Nigeria
Abdulrafiu O. Majolagbe1,2,* Adebola A. Adeyi1 and Oladele Osibanjo1
1Department of Chemistry, University of Ibadan, Ibadan, Nigeria
2Department of Chemistry, Lagos state University, P.M.B. 1087, Apapa, Lagos, Nigeria *Corresponding author’s E. mail: [email protected]
A R T I C L E I N F O A B S T R A C T
ISSN: 2410-9649 Majolagbe et al / Chemistry International 2(4) (2016) 232-241 iscientic.org.
233 www.bosaljournals/chemint/ [email protected]
Iqbal and Nisar, 2015; Iqbal et al., 2014; 2015; 2016; Mor et al., 2005; Singh, 2008; Ukpaka et al., 2015). Olusosun dumpsite is the largest municipal solid waste dumpsite facility in Nigeria and is presently receiving more than 1.2 million tons of wastes annually.
Most of the water wells in Lagos are not too deep (< 35.50 m) probably as a result of the shallow water table of the aquifers in the area and /or the cost implications of digging a very deep well. Thus, groundwater can be easily susceptible to infiltration from dumpsites, septic tanks and other anthropogenic activities. Approximately, one fifth of the world total freshwater situates in the phreatic zone of the sub surface water environment (Saetsaz and Wan, 2011), therefore, the need to protect groundwater resources from contamination.
Vulnerability of groundwater to pollution could be explained as the degree or tendency of groundwater in an area to be contaminated. The knowledge of groundwater vulnerability assessment has improved since it was developed in the United State of America in 1987. It helps to plan and manage groundwater resources. According to Foeazio et al., (2002), vulnerability can be specific contaminant (non intrinsic) or generality of contaminants (intrinsic). So many studies have been reported on various environmental impact of different form of pollution sources on the quality of groundwater in Lagos. Various methods of vulnerability evaluation and assessment have been developed, including overlay index method, hybrid, modeling and simulation as well as statistical methods. Ojuri and Bankole (2013) pointed out that overlay and index method resulted from the intersection of map on a regional basis and the qualitative interpretation of the data by indexing the parameters and assigning appropriate weights. Several procedures (overlay index method) of vulnerability have been reported in this category. These methods include GIS (Geography Information System) based DRASTIC, GOD, AVI, SINTACS, ISIS and EPIK (Saatas and Sulaiman, 2011). DRASTIC, undoubtedly is the most commonly used tool among the class of overlay index method for groundwater planning and decision making (Saatas and Sulaiman, 2011; Rahman 2008). Drastic model is a simple GIS based mapable method, developed by US Environmental Protection Agency (Aller et al., 1987).
The Drastic system is made up of seven hydrogeological parameters which influence the fate and transport of contaminants from the soil surface to aquifer. The drastic parameter with allotted weight and rankings based on importance is summed up together to form a Drastic index. It is a flexible method which helps to systematically evaluate the potential or tendency of groundwater to be vulnerable to pollution. Drastic model can be used in both very wide and small scale. It was initially targeted at non-point source contaminant but studies have reported modification of the model, thereby evaluating groundwater vulnerability due to point source pollution (Lee, 2003). Drastic model is developed on the assumptions that (i) the pollutant is introduced on ground surface, (ii) the
pollutant is further pushed into groundwater by precipitation through gravitational force and (iii) pollutant has mobility in water (Roser 1994). The Drastic model remains a very popular approach in the estimation of groundwater vulnerability among researchers, despite the criticism on the absence of specific method of validation (Ojuri and Bankole, 2013). Nitrate concentration in water (experimental data) was used to validate DRASTIC model (Alwathaf, 2011), pattern of total dissolved solids (TDS) concentration was used by Saatsaz and Wan Nor Azmin (2011), while Ojuri and Bankole (2013) employed correlation coefficients between physicochemical parameters of water and DRASTIC vulnerability indices as a validation tool.
The use of various water quality indices as a tool to assess the quality status of both surface and groundwater in an area has been extensively reported (Almeida et al., 2008; Reza and Singh, 2010; Jena, 2013; Manguyika et al., 2012). Water Quality index (WQI) approach to assess quality status of water was developed by Brown et al. (1970) and various modifications and new evolution (from different countries and regions) have been witnessed since then. This include The US National Sanitation Foundation Water Quality Index (NSFWQI), Canadian Water Quality Index (Canadian Council of Ministers of the Environment (CCME) , Florida Stream Water Quality Index (FWQI), British Columbia Water Quality Index (BCWQI),WQI developed in Bascaran, modified WQI developed in India (Bhargava WQI ) and the Oregon Water Quality Index (OWQI) (Rocchini and Swain, 1995; H‘ebert,1996; Prati et al., 1971; Khan et al., 2005; Parmar and Parmar, 2010).
WQI was categorized into four classes based on the type of use namely; public indices, specific consumption indices, designing and planning indices and Statistical indices (Poonam 2013). The first three are collectively referred to as expert opinion (EO). Water Quality Indices play major roles in water quality assessment of a given source as a function of time and other influencing factors (if necessary) by resolving large multi-parameter water analysis data into single digit scores (Poonam, 2013). Multivariate statistical techniques have been extensively used in effective assessment and analysis of various physicochemical parameters of groundwater with respect to space and time (Liu et al., 2006; Palma et al., 2010; Oketola et al., 2013 ).The Multivariate statistical techniques include Principal component analysis (PCA),cluster analysis (CA), factor analysis (FA), discriminant analysis (DA). Cluster analysis is a powerful statistical tool that helps in grouping similar pairs of correlation in a large symmetric matrix. It can reduce large data set into groups with similar features, systematically compare various chemical constituents. Cluster analysis can present its result in a two-dimensional hierarchical diagram called dendogram. An observation can be refereed at any point or level of similarity or dissimilarity.
This paper therefore aimed at estimating the potential groundwater intrinsic vulnerability to pollution from Olusosun dumpsite in Lagos, Nigeria, using a modified DRASTIC model (DRALTC) and assessment of groundwater
ISSN: 2410-9649 Majolagbe et al / Chemistry International 2(4) (2016) 232-241 iscientic.org.
234 www.bosaljournals/chemint/ [email protected]
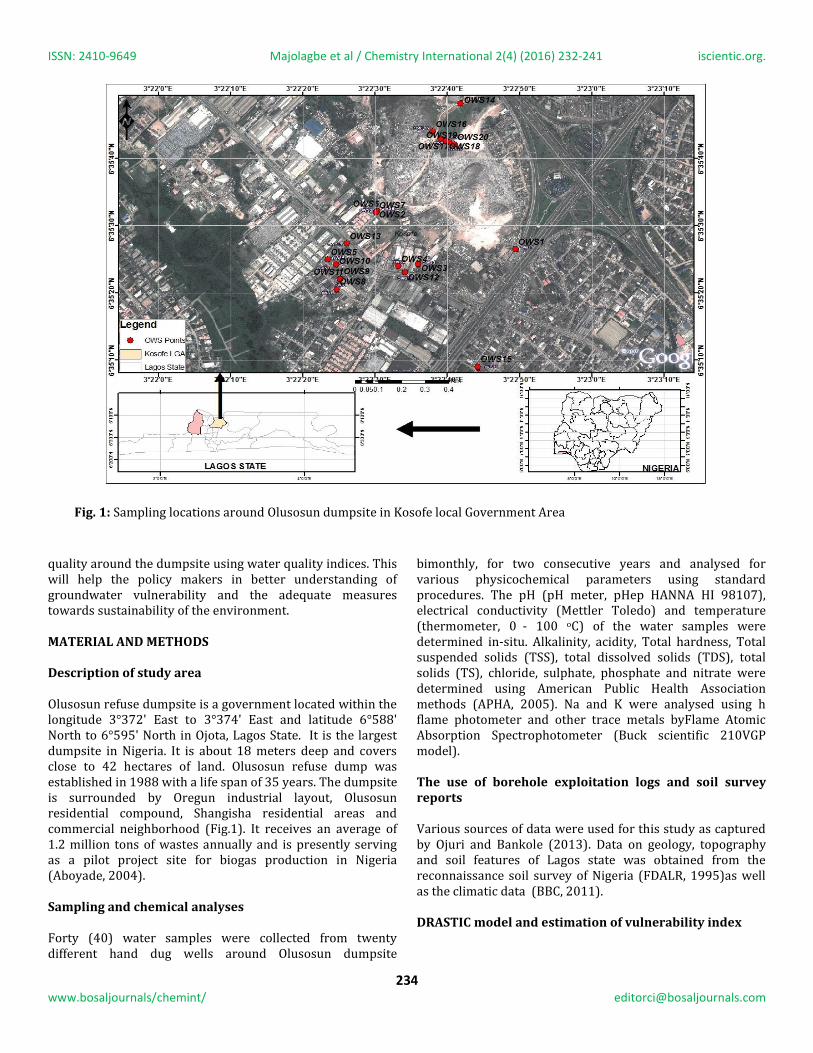
quality around the dumpsite using water quality indices. This will help the policy makers in better understanding of groundwater vulnerability and the adequate measures towards sustainability of the environment. MATERIAL AND METHODS Description of study area Olusosun refuse dumpsite is a government located within the longitude 3°372' East to 3°374' East and latitude 6°588' North to 6°595' North in Ojota, Lagos State. It is the largest dumpsite in Nigeria. It is about 18 meters deep and covers close to 42 hectares of land. Olusosun refuse dump was established in 1988 with a life span of 35 years. The dumpsite is surrounded by Oregun industrial layout, Olusosun residential compound, Shangisha residential areas and commercial neighborhood (Fig.1). It receives an average of 1.2 million tons of wastes annually and is presently serving as a pilot project site for biogas production in Nigeria (Aboyade, 2004). Sampling and chemical analyses Forty (40) water samples were collected from twenty different hand dug wells around Olusosun dumpsite
bimonthly, for two consecutive years and analysed for various physicochemical parameters using standard procedures. The pH (pH meter, pHep HANNA HI 98107), electrical conductivity (Mettler Toledo) and temperature (thermometer, 0 - 100 oC) of the water samples were determined in-situ. Alkalinity, acidity, Total hardness, Total suspended solids (TSS), total dissolved solids (TDS), total solids (TS), chloride, sulphate, phosphate and nitrate were determined using American Public Health Association methods (APHA, 2005). Na and K were analysed using h flame photometer and other trace metals byFlame Atomic Absorption Spectrophotometer (Buck scientific 210VGP model). The use of borehole exploitation logs and soil survey reports Various sources of data were used for this study as captured by Ojuri and Bankole (2013). Data on geology, topography and soil features of Lagos state was obtained from the reconnaissance soil survey of Nigeria (FDALR, 1995)as well as the climatic data (BBC, 2011). DRASTIC model and estimation of vulnerability index
Fig. 1: Sampling locations around Olusosun dumpsite in Kosofe local Government Area
ISSN: 2410-9649 Majolagbe et al / Chemistry International 2(4) (2016) 232-241 iscientic.org.
235 www.bosaljournals/chemint/ [email protected]
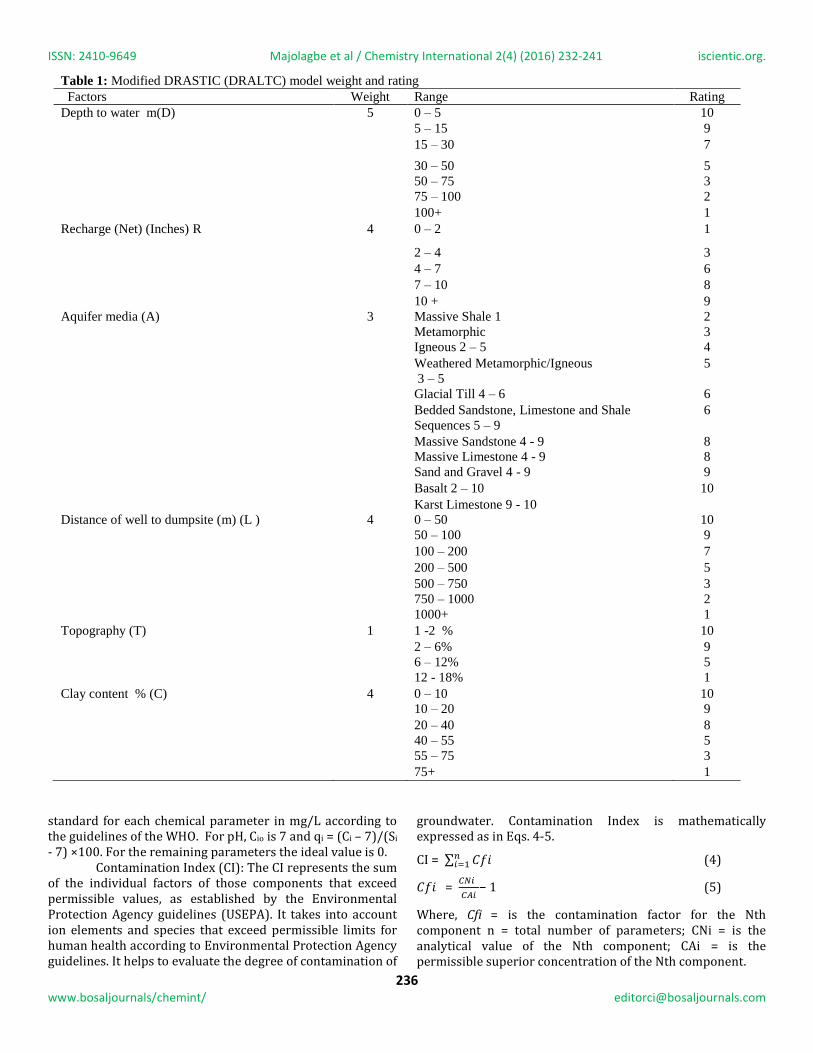
DRASTIC is a groundwater quality model for evaluating the pollution potential of large areas using the hydrogeologic settings of the region. A hydrogeological setting is defined as a mapable unit with common hydrogeologic characteristics. There are seven hydrogeological parameters or factors that make up the acronym DRASTIC. DRASTIC parameters influence the fate and transport of water from soil surface to aquifer. In this study, modification was made on the DRASTIC model so as to reflect and accommodate some peculiarity of the dumpsite. This result in the formation of six hydrogeologic parameter based model, DRALTC. Each factor was then assigned a weight (w) based on its relative significance in affecting the pollution potential. The weight was further allotted a rating (r) for different ranges of values. The typical ratings range from 1 - 10 and weights are from 1 – 5 as shown in Table 1.0.
The DRALTC vulnerability index was computed through the summation of products of ratings and weights for each factor as shown in Eq. 1:
DRALTC Index = DrDw + RrRw + ArAw + LrLw + TrTw + CrCw (1)
Where, Dr = Rating to Depth to water, Dw = Weights assigned to Depth to water, Rr = Ratings for ranges of aquifer recharge, Rw = Weights for ranges the aquifer recharge, Ar = Ratings assigned to aquifer media, Aw = Weights assigned to aquifer media, Lr = Ratings to the distance from well to the dumpsite, Lw = Weights assigned to distance from well to the dumpsite, Tr = Ratings for topography (slope), Tw = Weights for topography, Cr = Ratings for rates clay content, Cw = Weights given to clay content. The vulnerability index of the study area can be classified into four groups : >190, Very High groundwater pollution potential; 160–190, High
groundwater pollution potential; 101–159, moderate groundwater pollution potential; < 100, Low groundwater pollution potential. Water quality indices Two international water quality indices were applied in this study so as to have wider interpretations of the field data used. These are Water Quality Index (WQI) and Contamination Index (CI). Water Quality Index (WQI): Three steps are involved in the calculation of WQI as described by Srinivas and Nageswararao (2013). In the first step, each of the parameters was assigned a weight (wi) according to its relative importance in the overall quality of the water for drinking purpose. A maximum weight of 5 has been assigned to nitrate due to its major importance in water quality assessment. In the second step, the relative weight was calculated using rlation shown in Eq. 2.
Wi = 𝑤𝑖
∑ 𝑤𝑖𝑛𝑖=1
(2)
Where, Wi is the relative weight, wi is the weight of each parameter and n is the number of parameters. Calculated Wi values of the parameter are given in Table 2. In the third step, a quality rating scale (qi) for each parameter was assigned by dividing the concentration of each water sample by its respective standard according to the WHO guidelines and the results multiplied by 100 (Eq. 3).
qi = (Ci – Cio / Si - Cio) × 100 (3)
Where, Ci is the concentration of each chemical parameter in each water sample in mg/L, Cio is the ideal value of the parameter in pure water and Si is the Indian drinking water
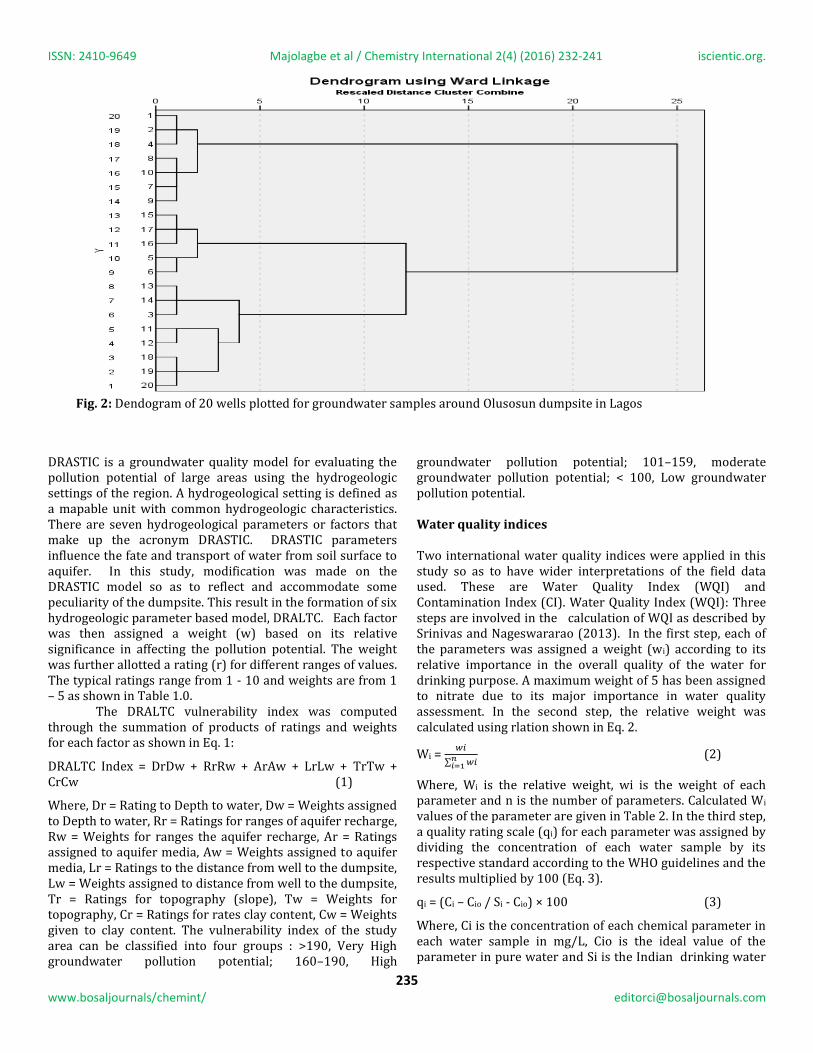
Fig. 2: Dendogram of 20 wells plotted for groundwater samples around Olusosun dumpsite in Lagos
ISSN: 2410-9649 Majolagbe et al / Chemistry International 2(4) (2016) 232-241 iscientic.org.
236 www.bosaljournals/chemint/ [email protected]
standard for each chemical parameter in mg/L according to the guidelines of the WHO. For pH, Cio is 7 and qi = (Ci – 7)/(Si - 7) ×100. For the remaining parameters the ideal value is 0.
Contamination Index (CI): The CI represents the sum of the individual factors of those components that exceed permissible values, as established by the Environmental Protection Agency guidelines (USEPA). It takes into account ion elements and species that exceed permissible limits for human health according to Environmental Protection Agency guidelines. It helps to evaluate the degree of contamination of
groundwater. Contamination Index is mathematically expressed as in Eqs. 4-5.
CI = ∑ 𝐶𝑓𝑖𝑛𝑖=1 (4)
𝐶𝑓𝑖 = 𝐶𝑁𝑖
𝐶𝐴𝑖− 1 (5)
Where, Cfi = is the contamination factor for the Nth component n = total number of parameters; CNi = is the analytical value of the Nth component; CAi = is the permissible superior concentration of the Nth component.
Table 1: Modified DRASTIC (DRALTC) model weight and rating
Factors Weight Range Rating
Depth to water m(D) 5 0 – 5 10
5 – 15 9
15 – 30 7
30 – 50 5
50 – 75 3
75 – 100 2
100+ 1
Recharge (Net) (Inches) R 4 0 – 2 1
2 – 4 3
4 – 7 6
7 – 10 8
10 + 9
Aquifer media (A) 3 Massive Shale 1 2
Metamorphic 3
Igneous 2 – 5 4
Weathered Metamorphic/Igneous
3 – 5
5
Glacial Till 4 – 6 6
Bedded Sandstone, Limestone and Shale
Sequences 5 – 9
6
Massive Sandstone 4 - 9 8
Massive Limestone 4 - 9 8
Sand and Gravel 4 - 9 9
Basalt 2 – 10 10
Karst Limestone 9 - 10
Distance of well to dumpsite (m) (L ) 4 0 – 50 10
50 – 100 9
100 – 200 7
200 – 500 5
500 – 750 3
750 – 1000 2
1000+ 1
Topography (T) 1 1 -2 % 10
2 – 6% 9
6 – 12% 5
12 - 18% 1
Clay content % (C) 4 0 – 10 10
10 – 20 9
20 – 40 8
40 – 55 5
55 – 75 3
75+ 1

ISSN: 2410-9649 Majolagbe et al / Chemistry International 2(4) (2016) 232-241 iscientic.org.
237 www.bosaljournals/chemint/ [email protected]
To calculate the WQI, the sub index (SI) was first determined for each parameter and then used to determine the WQI using relations shown in Eqs. 6-7.
SIi = Wi × qi (6)
Wi = ∑ 𝑆𝐼𝑖𝑛𝑖=1 (7)
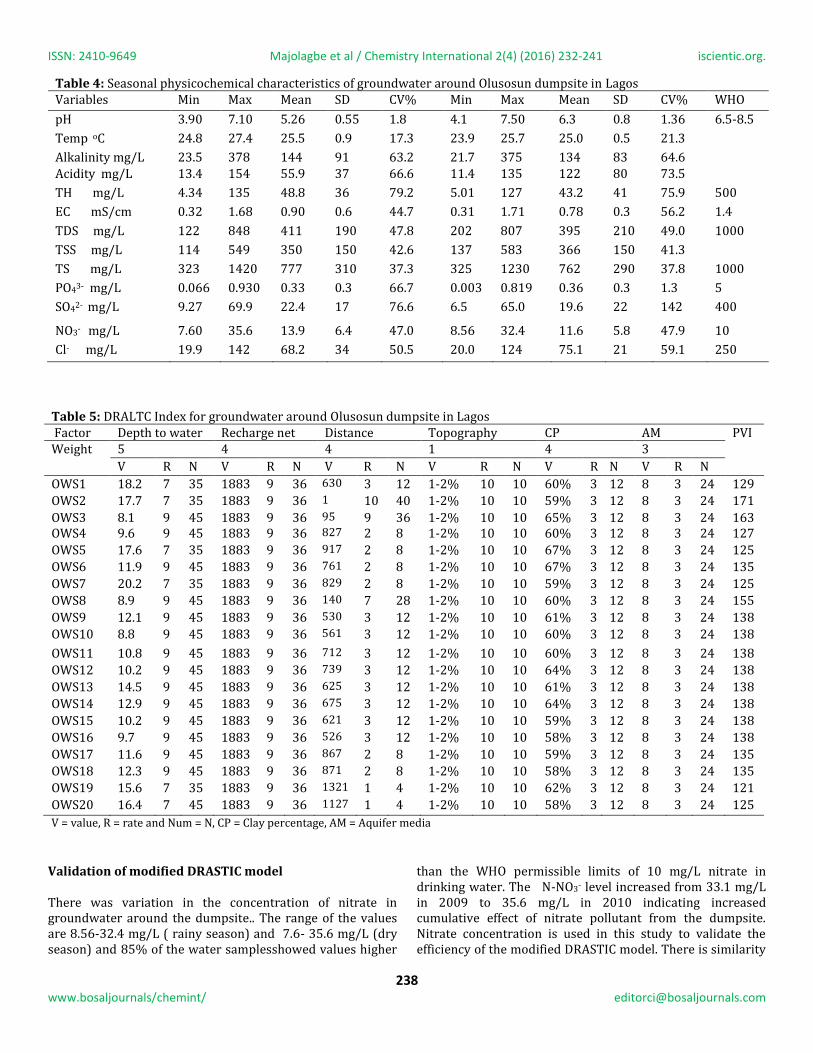
Where, SIi is the sub index of the ith parameter. The calculated WQI values are classified into four types as shown in Table 3. RESULTS AND DISCUSSION The results of the descriptive statistics of physicochemical parameters of groundwater sample during both dry and rainy season is presented in Table 4 and the computational results of modified DRASTIC (DRALTC) vulnerability index is shown in Table 5. The groundwater vulnerability index of the study area showed an observation depicting moderate to high groundwater vulnerability. The relatively high vulnerability can be attributed to low depth of water despite an average of 63 % clay content of the soil in the study area.
Two distinct groups were delineated; Group A comprising of eleven wells: OWS 2, 3, 8, 9, 10, 11, 12, 13, 14, 15 and 16. The wells revealed indices ranging from high to very high groundwater vulnerability potentials to dumpsite pollution while group B is made up of nine wells: OWS 1, 4, 5, 6, 7, 17, 18, 19and 20, reflecting wells with moderate groundwater pollution potentials. T. Cluster analysis The dendogram of hierarchical cluster analysis (Fig 2) revealed three main clusters. The clustering of wells indicates
groundwater quality varied in a way to suggest the influence of both natural (geochemical formation of the environment) and anthropogenic sources which include seepage and infiltration of pollutants from the dumpsite.
The dendogram also reflects variation of water quality with season. Cluster I comprises of wells OWS 1, 2, 4, 8, 10, 7 and 9. The wells are all located on the eastern part of the dumpsite. The wells are scattered upstream of the dumpsite and split into subgroup based on the chemical characteristics of the water from the wells. Wells OWS 1, 2 and 4 (sub group A) have mean values of the anions: PO43- , Cl- and NO3- as 0.58. 50.6 and 13.6 mg/L, respectively.
The sub group B has 0.43, 57.1 and 16.9 mg/L for respectively for PO43- , Cl- and NO3-. The chloride level in the water may be attributed to contribution from both dumpsite and the nearby canal to the dumpsite. The pH also revealed the contribution of the canal. Sub group A is more acidic (pH = 4.6) than sub group B with pH value of 6.0. Cluster II is made up of wells OWS 5, 6, 15, 16 and 17. The wells are located on the northern part of the dumpsite. The wells splits into two with OWS 5 and 6 comprised of subgroup A and OWS 15, 16 and 17 made up of sub group B.
The inclusion of total dissolved solids distinguished this cluster from others. The TDS mean value for subgroup A was 794 mg/L while subgroup B had 560 mg/L. TSS value was the highest for this cluster. However, this cluster is less acidic than cluster I, possibly as a result of pollutant input from other anthropogenic sources. This cluster shows the moderately polluted region of the study area.
The cluster III comprises of eight wells: OWS 3, 11, 12, 13, 14, 18, 19 and 20. It is the most polluted region of the study area. The wells are scattered on the southern part of the dumpsite. These wells constitute the downstream sampling points around the dumpsite. The cluster III is further splited into three sub group with different chemical characteristics. Sub group A has OWS 3, 13 and 14; sub group B has OWS 11 and 12 while sub group C consist of wells OWS 18, 19 and 20. The cluster has the highest chloride level, (142 m/L) indicating contamination possibly from dumpsite as well as seepage from septic tanks from residential area. The pH of sub group A is neutral and is within the WHO limits (6.5 –8.5) for drinking water.
Table 2: Relative weight of the chemical parameters Chemical parameters WHO standards Weight Relative weight (Wi)
pH 6.5 – 8.5 4 0.1818
Total hardness 300 2 0.0909
Ca 75 2 0.0909
Mg 30 0.0909
Cl 250 3 0.1363
Total dissolved solids 500 4 0.1818
Nitrate 10 5 0.2272
Table 3: Water quality classification based on WQI value WQI Water quality
< 50 Excellent
50 – 100 Good
100 – 200 Poor
200 – 300 Very poor
ISSN: 2410-9649 Majolagbe et al / Chemistry International 2(4) (2016) 232-241 iscientic.org.
238 www.bosaljournals/chemint/ [email protected]
Validation of modified DRASTIC model There was variation in the concentration of nitrate in groundwater around the dumpsite.. The range of the values are 8.56-32.4 mg/L ( rainy season) and 7.6- 35.6 mg/L (dry season) and 85% of the water samplesshowed values higher
than the WHO permissible limits of 10 mg/L nitrate in drinking water. The N-NO3- level increased from 33.1 mg/L in 2009 to 35.6 mg/L in 2010 indicating increased cumulative effect of nitrate pollutant from the dumpsite. Nitrate concentration is used in this study to validate the efficiency of the modified DRASTIC model. There is similarity
Table 4: Seasonal physicochemical characteristics of groundwater around Olusosun dumpsite in Lagos Variables Min Max Mean SD CV% Min Max Mean SD CV% WHO
pH 3.90 7.10 5.26 0.55 1.8 4.1 7.50 6.3 0.8 1.36 6.5-8.5
Temp oC 24.8 27.4 25.5 0.9 17.3 23.9 25.7 25.0 0.5 21.3
Alkalinity mg/L 23.5 378 144 91 63.2 21.7 375 134 83 64.6 Acidity mg/L 13.4 154 55.9 37 66.6 11.4 135 122 80 73.5
TH mg/L 4.34 135 48.8 36 79.2 5.01 127 43.2 41 75.9 500
EC mS/cm 0.32 1.68 0.90 0.6 44.7 0.31 1.71 0.78 0.3 56.2 1.4
TDS mg/L 122 848 411 190 47.8 202 807 395 210 49.0 1000
TSS mg/L 114 549 350 150 42.6 137 583 366 150 41.3
TS mg/L 323 1420 777 310 37.3 325 1230 762 290 37.8 1000
PO43- mg/L 0.066 0.930 0.33 0.3 66.7 0.003 0.819 0.36 0.3 1.3 5
SO42- mg/L 9.27 69.9 22.4 17 76.6 6.5 65.0 19.6 22 142 400
NO3- mg/L 7.60 35.6 13.9 6.4 47.0 8.56 32.4 11.6 5.8 47.9 10
Cl- mg/L 19.9 142 68.2 34 50.5 20.0 124 75.1 21 59.1 250
Table 5: DRALTC Index for groundwater around Olusosun dumpsite in Lagos Factor Depth to water Recharge net Distance Topography CP AM PVI Weight 5 4 4 1 4 3
V R N V R N V R N V R N V R N V R N
OWS1 18.2 7 35 1883 9 36 630 3 12 1-2% 10 10 60% 3 12 8 3 24 129
OWS2 17.7 7 35 1883 9 36 1 10 40 1-2% 10 10 59% 3 12 8 3 24 171
OWS3 8.1 9 45 1883 9 36 95 9 36 1-2% 10 10 65% 3 12 8 3 24 163 OWS4 9.6 9 45 1883 9 36 827 2 8 1-2% 10 10 60% 3 12 8 3 24 127
OWS5 17.6 7 35 1883 9 36 917 2 8 1-2% 10 10 67% 3 12 8 3 24 125
OWS6 11.9 9 45 1883 9 36 761 2 8 1-2% 10 10 67% 3 12 8 3 24 135
OWS7 20.2 7 35 1883 9 36 829 2 8 1-2% 10 10 59% 3 12 8 3 24 125
OWS8 8.9 9 45 1883 9 36 140 7 28 1-2% 10 10 60% 3 12 8 3 24 155
OWS9 12.1 9 45 1883 9 36 530 3 12 1-2% 10 10 61% 3 12 8 3 24 138
OWS10 8.8 9 45 1883 9 36 561 3 12 1-2% 10 10 60% 3 12 8 3 24 138
OWS11 10.8 9 45 1883 9 36 712 3 12 1-2% 10 10 60% 3 12 8 3 24 138
OWS12 10.2 9 45 1883 9 36 739 3 12 1-2% 10 10 64% 3 12 8 3 24 138
OWS13 14.5 9 45 1883 9 36 625 3 12 1-2% 10 10 61% 3 12 8 3 24 138
OWS14 12.9 9 45 1883 9 36 675 3 12 1-2% 10 10 64% 3 12 8 3 24 138
OWS15 10.2 9 45 1883 9 36 621 3 12 1-2% 10 10 59% 3 12 8 3 24 138
OWS16 9.7 9 45 1883 9 36 526 3 12 1-2% 10 10 58% 3 12 8 3 24 138
OWS17 11.6 9 45 1883 9 36 867 2 8 1-2% 10 10 59% 3 12 8 3 24 135
OWS18 12.3 9 45 1883 9 36 871 2 8 1-2% 10 10 58% 3 12 8 3 24 135
OWS19 15.6 7 35 1883 9 36 1321 1 4 1-2% 10 10 62% 3 12 8 3 24 121
OWS20 16.4 7 45 1883 9 36 1127 1 4 1-2% 10 10 58% 3 12 8 3 24 125
V = value, R = rate and Num = N, CP = Clay percentage, AM = Aquifer media
ISSN: 2410-9649 Majolagbe et al / Chemistry International 2(4) (2016) 232-241 iscientic.org.
239 www.bosaljournals/chemint/ [email protected]
to some extent between the results of groundwater vulnerability index and the pattern of spatial distribution of N-NO3- concentration in the water. Water quality indices The quality of groundwater under consideration with respect to drinking purpose can been established based on the WHO guidelines for drinking water (Table 4.0). The calculated WQI classified the water as good - poor – very poor based on the classification shown in Table 3.0. The range of WQI values was 61.8- 205 for groundwater around the dumpsite. The spatial variations classified 10% of the samples collected around Olusosun dumpsite as excellent, 35% as good, 55% as poor and 5% as very poor. Groundwater qualities of some of the wells are critical to human health and would require urgent attention. These wells include OWS 3, OWS 4, OWS 8, OWS 14, OWS 17 and OWS 18 around the dumpsite. CONCLUSIONS This study assessed the groundwater vulnerability potential to dumpsite pollution using a modified DRASTIC (DRALTC) model. The vulnerability index varied from moderate to high. The high clay soil around the dumpsite inhibits infiltration of pollutants into the groundwater thereby reducing the impacts of the dumpsite. The Water Quality Index ranged from 61.8 to 205 delineating good-poor-very poor class of water type. About sixty percent of water collected around the dumpsite are unsafe for human consumption without further treatment. The study demonstrated that DRASTIC model is a good tool in environmental management, for it helps in evolving policies necessary for environmental sustainability. ACKNOWLEDGEMENTS The authors gratefully acknowledged the effort and contributions of Dr Oluwapelumi O. Ojuri of Federal University of technology, Akure, Nigeria.
REFERENCES
Aboyade, A., 2004. The potential for climate change
mitigation in Nigeria solid waste disposal sector. A case
study of Lagos. MSc thesis, Lund University, Sweden. Pp
1- 47.
Adesola, B., Ogundipe, K., Sangosanya, K.T., Akintola, B.D.,
Oluwa, A., Hassan, E., 2016. Comparative study on the
biosorption of Pb(II), Cd(II) and Zn(II) using Lemon grass
(Cymbopogon citratus): Kinetics, isotherms and
thermodynamics. . Chemistry International 2, 89-102.
Aller, L., Bennett, T., Lehr, J., Petty, R., Hackett, G., 1987.
DRASTIC: a standardized system for evaluating
groundwater pollution potential using hydrogeologic
settings: U.S. environmental protection agency report
600/2- 87/035, Pp. 622.
Almeida, C., Quintar, S., González, P., Mallea, M., 2008.
Assessment of irrigation water quality. A proposal
of a quality profile. Environ. Monit. Assess. 142(1–
3),149–152. APHA/AWWA/WPCF. 2005. Standard
Methods for the Examination of Water and Wastewater.
21st ed. Washington.
Babarinde, A., Onyiaocha, G.O., 2016. Equilibrium sorption of
divalent metal ions onto groundnut (Arachis hypogaea)
shell: kinetics, isotherm and thermodynamics. Chemistry
International 2, 37-46.
Bilal, N., Ali, S., Iqbal, M., 2014. Application of Advanced
Oxidations Processes for the Treatments of Textile
Effluents. Asian Journal of Chemistry 26, 1882-1886.
British Broadcasting Services (BBC), 2011. Weather BBC
Weather Lagos Nigeria, BBC, London.
Brown, R. M., McClelland, N. I., Deininger, R. A., Tozer, R.,
1970. A Water Quality Index. Do we dare? Water and
Sewage Works 117, 339- 343.
FD- ALR (Federal Department of Agricultural Land
Resources). 1995. “Reconnaissance Soil Survey of
Nigeria,” FDALR, Lagos, Pp. 281.
Foster, S.S.D., Hirata, R., Gomes, D., D'Elia, M., Paris, M., 2002.
Groundwater quality protection: A guide for water
utilities, municipal authorities, and environment
agencies. 2th ed. Washington, DC, USA: World Bank.
H‘ebert, S., 1996. Development d’un indice de la quality
bacteriologique et aters-chimique de l’eau pour des
rivi‘eres du Quebec’ Report of the Ministi‘ere de l.
Environnement et dela Faune, Quebec, Q.C, Canada.
Iqbal, M., 2016. Vicia faba bioassay for environmental toxicity
monitoring: A review. Chemosphere 144, 785-802.
Iqbal, M., Bhatti, I.A., 2014. Re-utilization option of industrial
wastewater treated by advanced oxidation process.
Pakistan Journal of Agriculture Sciences 51, 1141-1147.
Iqbal, M., Bhatti, I.A., 2015. Gamma radiation/H2O2 treatment
of a nonylphenol ethoxylates: Degradation, cytotoxicity,
and mutagenicity evaluation. Journal of Hazardous
Materials 299, 351-360.
Iqbal, M., Bhatti, I.A., Zia-ur-Rehman, M., Bhatti, H.N., Shahid,
M., 2014. Efficiency of Advanced Oxidation Processes for
Detoxification of Industrial Effluents. Asian Journal of
Chemistry 26, 4291-4296.
Iqbal, M., Khera, R.A., 2015. Adsorption of copper and lead in
single and binary metal system onto Fumaria indica
biomass. Chemistry International 1, 157b-163b.
Iqbal, M., Nisar, J., 2015. Cytotoxicity and mutagenicity
evaluation of gamma radiation and hydrogen peroxide
ISSN: 2410-9649 Majolagbe et al / Chemistry International 2(4) (2016) 232-241 iscientic.org.
240 www.bosaljournals/chemint/ [email protected]
treated textile effluents using bioassays. Journal of
Environmental Chemical Engineering 3, 1912-1917.
Jena, V., Dixit, S., Gupta, S., 2013. Assessment of Water quality
index of industrial area surface water samples.
International Journal of ChemTech Research 5(1), 278-
283.
Khan, A.A., Tobin, A., Paterson, R., Khan, H., Warren, R., 2005.
Application of CCME procedure for deriving site-specific
water quality guidelines for the CCME Water Quality
Index. Water Quality Research Journal of Canada 40(4),
448–456.
Lee, S., 2003. Evaluation of Waste Disposal Site Using DRAS-
TIC System in Southern Korea. Environmental Geology
44(6), 654-664.
Liu, C.C., Jean, J.S., Nath, B., Lee, M.K., Hor, L.I., 2009.
Geochemical characteristics of the fluids and muds
from two southern Taiwan mud volcanoes: Implications
for water-sediment interaction and groundwater arsenic
enrichment. Applied Geochemistry 24, 1793–1802.
Mangukiya, R., Bhattacharya, T., Chakraborty, S., 2012.
Quality characterization of groundwater using Water
Quality Index in Surat city, Gujarat, India. ISCA
International Research Journal of Environmental
Sciences 1(4), 14-23.
Mor, S., Ravindra, K., Vischher, A.R.P., Dahiya, P., Chandra, P.,
2005. Municipal Solid Waste Characterisation and its
assessment for potential methane generation at Gazipur
Landfill Site, Delhi: A case study. Science of The Total
Environment 371, 1–10.
Ojuri, O.O., Bankole, O.T., 2013. Groundwater vulnerability
assessment and validation for a fast growing city in
Africa: A cse study of Lagos, Nigeria. Journal of
Environmental Protection 4, 454-465.
Oketola, A. A., Adekolurejo, S. M., Osibanjo, O., 2013. Water
Quality Assessment of River Ogun Using Multivariate
Statistical Techniques. Journal of Environmental
Protection 4, 466- 479.
Osibanjo, O., Majolagbe, A.O., 2012. Physicochemical quality
assessment of groundwater based on land use in
Lagos city, southwest, Nigeria. Chemistry International
2(2), 79-86.
Palma, P., Alvarenga, P., Palma, V.L., Fernandes, R. M., Soares,
A. M., Barbosa, I.R., 2010. Assessment of anthropogenic
sources of water pollution using multivariate statistical
techniques: A case study of the Alqueva’s reservoir,
Portugal. Environmental Monitoring and Assessment
165, 539–552.
Parmar, K., Parmar, V., 2010. Evaluation of water quality
index for drinking purposes of river Subernarekha in
Singhbhum district. International Journal of
Environmental Sciences 1(1), 77-81.
Poonam, T., Tanushree, B., Sukalyan, C. 2013. Water quality
indices- important tools for water quality assessment: A
review. International Journal of Advances in Chemistry
1(1), 23-61.
Prati, L., Pavanello, R., Pesarin, F., 1971. Assessment of
surface water quality by a single index of pollution,
Water Research 5(7), 41–75.
Qureshi, K., Ahmad, M.Z., Bhatti, I.A., Iqbal, M., Khan, A., 2015.
Cytotoxicity reduction of wastewater treated by
advanced oxidation process. Chemistry International 1,
53-59.
Rahman, A., 2008. A GIS based DRASTIC model for assessing
groundwater vulnerability in shallow aquifer in Aligarh,
India. Applied Geography 28 (1) 32-53.
Reza, R., Singh, G., 2010. Assessment of groundwater quality
status by using water quality index method in Orissa,
India. World Applied Sciences Journal 9 (12), 1392-1397.
Rocchini, R., Swain LG. 1995. The British Columbia Water
Quality Index, Water Quality Branch, EP Department,
B.C., Ministry of Environment, Land and Park, Victoria,
B.C., Canada, 13.
Rosen, L., 1994. A study of the DRASTIC methodology with
emphasis on Swedish condition. Groundwater 32(2),
278-285.
Saataz, M., Sulaian, W., 2011. GIS DRASTIC model for
groundwater vulnerability estimation of Asten–
Kouchesfahan plain, Northern Iran. International Journal
of Water 6(1/2), 1- 14.
Sayed, M., 2015. Efficient removal of phenol from aqueous
solution by the pulsed high-voltage discharge process in
the presence of H2O2. Chemistry International 1, 81-86.
Singh, U.K., Kumar, M., Chauhan, R., Jha, P.K., Ramanathan,
A., Subramanian, V.. 2008. Assessment of the impact of
landfill on groundwater quality: a case study of the
Pirana site in western India. Environmental Monitoring
and Assessment 141(1-3), 309-21.
Srinivas, G. R., Nageswarara, G. 2013. Assessment of
groundwater quality using Water Quality Index. Archives
of Environmental Science 7, 1-5.
Thirumalaivasan, D., Karmegam, M., Venugopal, K., 2003.
AHPDRASTIC: software for specific aquifer vulnerability
assessment using DRASTIC model and GIS.
Environmental Modelling and Software 18,645–656.
Ukpaka, C., 2016. Development of model for bioremediation
of crude oil using moringa extract. Chemistry
International 2, 19-28.
http://www.ncbi.nlm.nih.gov/pubmed?term=Ramanathan%20A%5BAuthor%5D&cauthor=true&cauthor_uid=17899419
ISSN: 2410-9649 Majolagbe et al / Chemistry International 2(4) (2016) 232-241 iscientic.org.
241 www.bosaljournals/chemint/ [email protected]
Ukpaka, C., Wami, E., Amadi, S., 2015. Effect of pollution on
metal corrosion: A case study of carbon steel metal in
acidic media. Current Science Perspectives 1, 107-111.
Yahia, A., Bouabid, M., 2011. Assessment of aquifer
vulnerability based on GIS and ARCGIS method: A case
study of Sanaa Basin (Yemen). Journal of Water
Resources and Protection 3(4), 845- 855.
Visit us at: http://bosaljournals.com/chemint/
Submissions are accepted at: [email protected]