VTA 2013 Sustainability Report
24
SUSTAINABILITY SUSTAINABILITY REPORT MAY 2014 201 3 Measuring VTA’S Environmental Progress
-
Upload
scvta -
Category
Government & Nonprofit
-
view
640 -
download
5
description
This report includes data from 2007 to 2012 on VTA’s use of fuel, energy, water, and its generation of waste at its five major facilities. The report also describes VTA’s past accomplishments, current initiatives, and future plans.
Transcript of VTA 2013 Sustainability Report

i
SUSTAINABILITY
SUSTAINABILITY REPORT
MAY 2014
2013
Measuring VTA’SEnvironmental Progress

Santa Clara Valley Transportation Authority
2013 Sustainability Report
vta.org/sustainability
(408) 321-7575 • TTY (408) 321-2330

Executive Summary ..........................................................................................1
About VTA ............................................................................................................2
Report Purpose and Scope ..............................................................................3
Purpose .............................................................................................................................. 3
Scope .................................................................................................................................. 3
Cerone Bus Operating Division and Overhaul & Repair Facility (North San Jose)... 3
Chaboya Bus Operating Division (South San Jose) .................................................... 3
North Bus Operating Division (Mountain View) ........................................................... 3
Guadalupe Light Rail Operating & Maintenance Division (Downtown San Jose) ... 4
River Oaks Division (North San Jose) ............................................................................... 4
Sustainability Program Overview ...................................................................4
Introduction ...................................................................................................................... 4
Sustainability Team ........................................................................................................ 5
Accomplishments ........................................................................................................... 5
Energy........................................................................................................................................... 5
Transportation ............................................................................................................................ 7
Waste ............................................................................................................................................. 7
Water Conservation ................................................................................................................. 8
TABLE OF CONTENTS
4

Environmental Performance ............................................................................9
Fuel Use ............................................................................................................................. 9
Energy ................................................................................................................................ 10
Electricity Usage and Costs ................................................................................................. 10
Solar Electricity Production ................................................................................................. 12
Natural Gas Usage and Costs .............................................................................................. 12
Water .................................................................................................................................. 13
Waste and Recycling .................................................................................................... 13
Current Projects ..................................................................................................16
Utility Management Software .................................................................................... 16
Utility Meter GIS .............................................................................................................. 16
Energy Efficiency ........................................................................................................... 16
Environmental Management Systems Institute .................................................. 17
Waste Reduction and Recycling .............................................................................. 17
Silicon Valley Berryessa Extension .......................................................................... 18
Outreach and Education ............................................................................................. 18
Future Projects and Goals ................................................................................19
TABLE OF CONTENTS

1
Executive SummaryEach year VTA monitors its progress toward meeting objectives
and targets of its Sustainability Program. Annual reporting was
adopted as part of VTA’s Sustainability Program in February
2008. This is VTA’s sixth annual sustainability report. Sustain-
ability performance is measured against the 2007 baseline year
and compared to the previous reporting year.
Since the 2007 baseline year, VTA has made significant prog-
ress towards reducing its environmental footprint. Fuel use has
decreased due to the introduction of hybrids to replace older
diesel buses and vehicles. Electricity use has decreased as a
result of lighting retrofits, energy efficient fixtures and practic-
es, and solar installations. The amount of hazardous waste and
waste diverted to landfills has decreased due to better aware-
ness and recycling programs.
In comparison to the previous reporting year (2012), VTA has
continued to reduce fuel usage, natural gas usage, and waste.
Electrical usage has stayed consistent, while water use has
increased. The increase of water use is primarily attributed to
higher irrigation usage. Following the January 2014 Drought
Declaration by Governor Brown, VTA has committed to reduce
water use by 10%.
In addition to documenting VTA’s cost and resource savings,
this report also describes the programs, achievements, and
goals of the Sustainability Program. Major accomplishments in
2013 include awarding contracts for utility management soft-
ware and office paper made out of 30% post-consumer waste,
retrofitting facilities and station platforms with energy efficient
lighting fixtures, and implementing Environmental Management
System policies and procedures at the Cerone Bus Division.
VTA’s Sustainability Team is currently implementing the Utility
Management Software and Services Project to improve moni-
toring and measurement of energy, water, gas, and garbage.
This year, VTA will begin a pilot program of installing solar-pow-
ered trash compactors at select transit centers. Future projects
include conducting a greenhouse gas
inventory and studying opportunities for
renewable energy projects.
To learn more about VTA’s Sustainability
Program, visit www.vta.org/sustainability.

2
About VTAThe Santa Clara Valley Transportation Authority
(VTA) is an independent special district
responsible for bus, light rail and paratransit
operations, congestion management,
specific highway improvement projects, and
transportation planning in Santa Clara County.
VTA is both a transit provider and a multi-
modal transportation planning organization
involved with transit, highways and roadways,
bikeways, and pedestrian facilities. In this
capacity, VTA partners with the cities, towns
and County of Santa Clara, as well as intra-
county agencies, to develop a practical,
multimodal transportation infrastructure that
meets evolving travel needs.
VTA provides transit services to the
346-square-mile urbanized portion of Santa
Clara County that is composed of 15 cities and
towns and unincorporated areas with a total
population of more than 1.8 million residents.
VTA operates 75 bus routes and has an active
fleet of 432 buses, as of January 2014. VTA
operates 42.2 miles of light rail service and has
an active fleet of 99 light rail vehicles.
The mission of VTA is to provide the
public with a safe and efficient countywide
transportation system. The system should
increase access and mobility, reduce
congestion, improve the environment and
support economic development, thereby
enhancing quality of life.

3
Report Purpose and Scope
PurposeThe purpose of this report is to measure,
track, and effectively manage current and
future sustainability program initiatives.
Annual reporting was adopted as part of
VTA’s Sustainability Program in February
2008. The strategy is stated as follows:
“Establish benchmarks to measure the
progress and performance of VTA’s
Sustainability Program and report back to the
VTA Board of Directors on an annual basis.
Among other actions, this report will involve
reassessing VTA’s fuel, electricity, and water
usage on a regular basis.”
ScopeVTA has five main facility locations includ-
ing three bus facilities, one light rail facility,
and one administrative facility. The scope of
this report is limited to these main operating
facilities.
Cerone Bus Operating Division and Overhaul & Repair Facility (North San Jose)VTA’s Cerone facility includes the Cerone Bus
Operating Division, the Overhaul and Repair
(O&R) Division, and the Distribution Center.
Cerone Minor Maintenance serves as a base
for operations, fueling, servicing, detailing,
running repair, and preventive maintenance.
The O&R facility provides a centralized major
maintenance program for the entire VTA bus
fleet, including paint and body repair, uphol-
stery, farebox repair, transmission and small
component rebuild, engine overhaul, and the
heavy repair and maintenance associated
with major component removal. This facility
also supports steam cleaning and a water
treatment plant to treat wastewater from
cleaning operations. The Distribution Center
is responsible for the distribution of parts to
support all bus operating divisions. This Divi-
sion is also responsible for storage of inactive
vehicles and is responsible for decommission-
ing and disposal of revenue and non-revenue
vehicles.
Chaboya Bus Operating Division (South San Jose)The Don Pedro Chaboya Bus Operating Divi-
sion is VTA’s largest-capacity bus operations
and maintenance facility. The facility includes
a maintenance shop, fueling facility, two bus
washers, transit operations, bus operator
training, a maintenance training building, a
facilities maintenance building, steam clean-
ing equipment and a water treatment plant to
treat wastewater from cleaning operations.
North Bus Operating Division (Mountain View)The North Division is the smallest of VTA’s
operating facilities and includes a mainte-
nance shop, fueling facility, bus wash, transit
operations, steam cleaning equipment and a
water treatment plant.
4
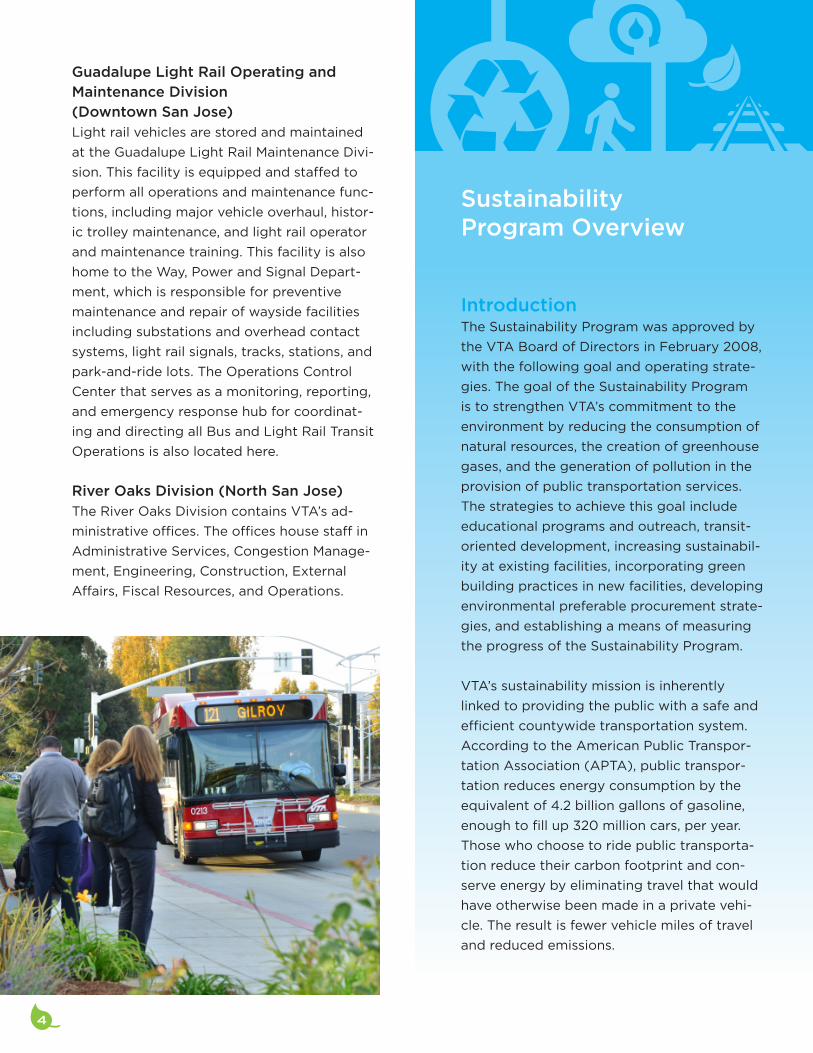
Guadalupe Light Rail Operating and Maintenance Division (Downtown San Jose)Light rail vehicles are stored and maintained
at the Guadalupe Light Rail Maintenance Divi-
sion. This facility is equipped and staffed to
perform all operations and maintenance func-
tions, including major vehicle overhaul, histor-
ic trolley maintenance, and light rail operator
and maintenance training. This facility is also
home to the Way, Power and Signal Depart-
ment, which is responsible for preventive
maintenance and repair of wayside facilities
including substations and overhead contact
systems, light rail signals, tracks, stations, and
park-and-ride lots. The Operations Control
Center that serves as a monitoring, reporting,
and emergency response hub for coordinat-
ing and directing all Bus and Light Rail Transit
Operations is also located here.
River Oaks Division (North San Jose)The River Oaks Division contains VTA’s ad-
ministrative offices. The offices house staff in
Administrative Services, Congestion Manage-
ment, Engineering, Construction, External
Affairs, Fiscal Resources, and Operations.
Sustainability Program Overview
IntroductionThe Sustainability Program was approved by
the VTA Board of Directors in February 2008,
with the following goal and operating strate-
gies. The goal of the Sustainability Program
is to strengthen VTA’s commitment to the
environment by reducing the consumption of
natural resources, the creation of greenhouse
gases, and the generation of pollution in the
provision of public transportation services.
The strategies to achieve this goal include
educational programs and outreach, transit-
oriented development, increasing sustainabil-
ity at existing facilities, incorporating green
building practices in new facilities, developing
environmental preferable procurement strate-
gies, and establishing a means of measuring
the progress of the Sustainability Program.
VTA’s sustainability mission is inherently
linked to providing the public with a safe and
efficient countywide transportation system.
According to the American Public Transpor-
tation Association (APTA), public transpor-
tation reduces energy consumption by the
equivalent of 4.2 billion gallons of gasoline,
enough to fill up 320 million cars, per year.
Those who choose to ride public transporta-
tion reduce their carbon footprint and con-
serve energy by eliminating travel that would
have otherwise been made in a private vehi-
cle. The result is fewer vehicle miles of travel
and reduced emissions.

5
VTA became a signatory of the APTA Sus-
tainability Commitment in September 2009.
The commitment sets out common sustain-
ability principles, an action plan and a course
for progress. Signatories can obtain higher
recognition by achieving additional actions,
putting long-term processes into place, and
attaining reduction targets for a series of indi-
cators. VTA is signed up for the Bronze level,
but could move up to Silver, Gold or Platinum
as we achieve our goals. Under Bronze, VTA
is committed to reduction targets of 2% over
the baseline within two years. These reduc-
tion targets have been met for VTA’s five
main operating divisions.
There is no dedicated source of funds for the
Sustainability Program. Funding is dependent
on the two-year budget process. In FY 14/15,
VTA budgeted $1.2 million for the program.
Future funding would enable VTA to continue
current and planned projects.
Sustainability TeamA Sustainability Team of 10-15 employees
meets bimonthly to plan projects and monitor
the progress of VTA’s Sustainability Program.
Members of the Sustainability Team represent
VTA’s diverse array of responsibilities and
functions including Operations, Facilities
Maintenance, Engineering, Construction, Fiscal
Resources, and Congestion Management. In
addition, approximately five employees allocate
a portion of their time to support the program.
AccomplishmentsPrior to the implementation of a formal
sustainability program, VTA made ongoing
improvements to improve operations and
reduce costs. Examples include: Energy Man-
agement System upgrades (2004); replacing
HVAC equipment with more efficient models
(1997 to 2006); and installing cool roofing
materials (2005).
In 2008, when the Sustainability Program was
adopted, audits were completed to analyze
operations and identify improvement op-
portunities, including formal audits by PG&E
and the Santa Clara Valley Water District. The
Sustainability Team focused on “low-hanging
fruit” items first and was able to accomplish
over $800,000 in annual savings. Past ac-
complishments since the adoption of VTA’s
Sustainability Program are described below.
Energy
In 2012, Lockheed Martin’s Heavy Industry
Energy Efficiency Program performed a site
audit of select light rail stations and Gua-
dalupe Division exterior lighting to evaluate
potential energy saving opportunities. Lock-
heed’s Program recommended that VTA re-
place the existing 102 High Pressure Sodium
(HPS) lamps (100-150 watts each) with LED
fixtures (40 watts each). The replacement
was complete in early 2013. The lighting qual-
ity and visibility of the station has improved
from a yellow to white color. Implementing 4

6
this measure has resulted in an estimated
annual cost savings of $7,962, lowering the
capital cost to $45,842. This results in a pay-
back of 5 to 6 years.
In 2011, solar parking structures consisting of
5,070 SunPower high-efficiency solar panels,
totaling 2.1 megawatts, were installed at Ce-
rone, Chaboya, and North Divisions. The clean
electricity provided from these solar panel
systems will offset VTA’s three bus mainte-
nance divisions’ electricity demand and save
$2.7 million in electricity costs over the next
20 years. The solar panels will help cut Cali-
fornia’s atmospheric pollution by reducing
carbon dioxide levels by an estimated 2,000
metric tons each year, which is equivalent to
removing more than 9,000 cars from Califor-
nia’s roads or planting 10,000 acres of trees
over the next 20 years. The panels also shade
and protect VTA vehicles.
In 2009, VTA’s Sustainability Program imple-
mented several initiatives to conserve energy
and reduce costs. To minimize electricity
usage of light rail operations, VTA optimized
the number of cars per light rail train during
peak and non-peak hour and began turn-
ing off auxiliary power systems for light rail
vehicles parked at the Guadalupe Light Rail
Division. Based on a PG&E evaluation, it is
estimated that these measures have achieved
an annual electricity savings of approximately
six million kilowatt hours, avoided three mil-
lion pounds of greenhouse gases, and annual
cost savings of approximately $723,000. A
submeter was also purchased at the Guada-
lupe Light Rail Division which helped identify
$107,000 in overcharges in PG&E’s billing.
Modifications were completed at the River
Oaks Division to enable participation in
PG&E’s Automated Demand Response Pro-
gram to reduce electricity usage during peri-
ods of high demand. VTA received $35,000 in
technical and participation incentives to help
fund the modifications.
VTA’s Information Technology Department
programmed desktop computers to auto-
matically go into hibernation mode after two
hours of no activity and replaced 60 CRT
monitors with energy efficient LCD monitors.
Finally, VTA partnered with a local technolo-
gy company to install a 27-kilowatt High Gain
Solar Plant at the Cerone Division. The proj-
ect was a pilot to market a new type of solar
collector that was designed to collect more
energy per square foot and be less expensive
to procure than traditional solar flat panels.
Skyline Solar built the plant at no cost to VTA.
Solar panels installed at VTA’s three bus maintenance divisions are expected to save $2.7 million in
electricity costs over the next 20 years.

7
In 2008, VTA partnered with PG&E to com-
plete Integrated Energy Audits of its main
operating divisions. The audits recommended
retrofitting existing fluorescent and metal
halide lighting fixtures with energy efficient
models. To date, VTA has replaced over 2,100
lighting fixtures with T-8s, T-5s, and LEDs.
Occupancy sensors have also been installed
in conference and break rooms per audit rec-
ommendations.
TransportationIn March 2013, VTA received a free electric
vehicle charging station (EVCS) from Charge-
Point, which was installed at River Oaks Divi-
sion. Demand quickly outpaced capacity, and a
second EVCS was purchased for River Oaks
in June 2013. These two chargers have the
ability to charge four vehicles simultaneously.
VTA is currently working on bringing electric
vehicle charging to other divisions and facilities.
In 2009, the Sustainability Program funded
projects to update bike lockers and purchase
fuel efficient non-revenue vehicles. The fund-
ing assisted with the conversion of 110 bike
lockers across 12 transit centers, to utilize
BikeLink smart cards. The BikeLink smart
cards enable on-demand bike parking which
facilitates a greater number of users. In addi-
tion, 15 fuel-efficient hybrids were purchased
to retire older vehicles in the non-revenue fleet.
WasteContinual improvements have been made to
VTA’s recycling programs and services to re-
duce the amount of waste hauled off to land-
fills. In 2013, recycling posters were updated
to reflect VTA’s mixed recycling program for
paper, metal, glass, plastic, wood, and card-
board. Site visits were conducted to monitor
recycling usage at VTA’s operating divisions
and BART field offices. In 2012, new recy-
cling containers were added to bus operator
and maintenance training areas at Chaboya
Division. In 2009, a composting program was
started at the River Oaks cafeteria. Compost
bins are used by the kitchen staff and patrons
to discard leftover food scraps and napkins.
VTA’s Sustainability Program strives to find
creative solutions for items that do not have
a traditional recycling market. In 2011, VTA
started donating spent CDs and DVDs to Re-
source Area for Teachers, a non-profit organi-
zation and certified Green Business, that uses
the items for educational projects. In 2010,
a local polymer recycling vendor was identi-
fied for recycling plastic vandal shields at bus
maintenance divisions.
Electronic, universal, and hazardous waste is
collected for recycling and proper disposal.
In 2012, VTA reduced hazardous waste by 105
tons over calendar year 2011 and improved
recycling. In 2008, battery recycling was ex-
panded at the River Oaks Division.
Optimized the number of cars per light rail train = annual savings of
$251,515 and 2,032,774 kWh
Turning off auxiliary power = annual savings of
$471,725 and 3,812,536 kWh
Combined these savings equate to the electricity needed to power the San Jose SAP Center for over 7 months

8
Water ConservationIn 2010, Facilities Maintenance replaced
most of the bottled water coolers at VTA’s
main operating divisions and administra-
tive offices with new filtration units. Some
bottled water coolers were retained for
emergency supply. The filtration units
reduce environmental impacts associated
with transport, delivery, and bottling of wa-
ter and result in a 75% cost savings to VTA.
In 2009, many improvements were made
to VTA’s irrigation systems including flow
sensors, irrigation controllers, and sprinkler
nozzles. Automatic shut off-flow sensors
were installed on backflow preventers at
five park-and-ride lots: Great Mall, Peniten-
cia, I-880 Milpitas, Evelyn and Hostetter.
The sensors monitor abnormally high or
low flows at each location and will auto-
matically shut off flow to avoid unneces-
sary water usage. Since installation, VTA
staff have received and reacted to alerts of
abnormal flows such as up to 18.9 gallons
per minute at the Hostetter park-and-ride.
Weather-based irrigation controllers were
installed at 21 facilities in partnership with
the Santa Clara Valley Water District. The
controllers enable staff to receive email
alerts, configure watering schedules re-
motely, and manage irrigation controls
based on soil, slope, plant type, and weath-
er conditions. This measure is anticipated
to save over twelve million gallons of water
and $37,000 per year.
Sprinkler nozzles were also replaced with
MP Rotators, which distribute water more
efficiently and more uniformly, at the Peni-
tencia Creek Park-and-Ride, the Hostetter
Park-and-Ride, the Great Mall Park-and-
Ride, and the River Oaks Division.
VTA’s Cerone Division was grazed by a herd
of goats and sheep between 2009 and
2012. The animals were managed by Living
Systems Land Management and offered a natural and
cost-effective solution to weed and grass mowing. The
grazing was discontinued due to potential impact to
burrowing owls.
In 2008, Water Use Surveys were conducted in part-
nership with the Santa Clara Valley Water District. The
surveys recommended toilets, urinals, showerheads,
and aerators be replaced with low-flow equipment. To
date, VTA has replaced over 90 bathroom fixtures.

9
Environmental Performance
IntroductionThis section documents VTA’s sustainabil-
ity performance using key metrics such as
fuel use, energy use, water consumption,
and waste diversion. Performance is calcu-
lated from utility accounts since the baseline
year. The 2007 baseline year represents VTA
operations prior to implementation of the
Sustainability Program.
Fuel UseVTA purchases fuel through a joint procure-
ment by the Regional Transit Coordinating
Council. VTA has a contract with SC Fuels to
supply Ultra-Low Sulfur Diesel Fuel (15 parts
per million), Bio-Diesel, and Unleaded Gaso-
line. The majority of VTA’s fleet uses diesel
fuel. The average fuel economy is 5 miles per
gallon (mpg) for hybrid buses and 4 mpg for
standard diesel buses.
Graph 1 shows the annual fuel use for VTA’s rev-
enue and non-revenue fleet from the baseline
year of 2007 to 2013. In 2013, total annual fuel
usage was approximately 3.9 million gallons.
This is a decrease of 19% over the base year
of 2007, and a 5% decrease from the previous
year. Fuel usage has declined due to service
changes and replacement of older vehicles
with fuel efficient hybrids. In 2013, VTA spent
$14,256,582 on fuel. This graph excludes fuel
Graph 1: Fuel Use for VTA’s Revenue and Non-Revenue Fleet from 2007 to 2013
4

10
used for paratransit service, operated by Outreach
and Escort, Inc. As of February 2014, the para-
transit fleet is composed of 110 hybrid sedans, 90
minivans, 19 modified vans, and 31 small buses. In
FY 12/13, the fleet averaged 20.6 mpg and con-
sumed 333,874 gallons of fuel. Fuel economy has
increased by 5.4% from the previous year and by
39% from 2007.
EnergyVTA’s electricity and natural gas is supplied by
Pacific Gas and Electric (PG&E), City of Palo Alto,
Silicon Valley Power (City of Santa Clara), and
Solar Star. At Cerone Division, VTA uses liquefied
natural gas or propane for heating.
Electricity Usage and CostsGraphs 2 and 3 show the annual electricity use at
Cerone, Chaboya, North, and River Oaks Divisions,
and Traction Power (includes Guadalupe Division
and traction power substations) respectively. This
data includes electricity supplied by VTA’s solar
installations at Cerone, Chaboya, and North Di-
visions, which became operational in December
2011. Traction power, which operates the light
rail system, is the largest user of electricity at VTA.
VTA spends an average of $4.1 million annually
on electricity for its main divisions and traction
power. In 2013, total electricity use for the Divi-
sions and traction power was 30,947,517 kilowatt
hours (kWh).
Since 2007, VTA’s overall electrical use has de-
creased by 16.7% due to energy efficiency projects,
resulting in a cost savings of over $2 million. In the
last year, however, traction power electrical use has
increased by as a result of an 8% increase in the
total train miles. Electricity use at operating facili-
ties was consistent with 2012.
Graph 2: Electrical Usage at VTA’s Main Operating Facilities from 2007 to 2013

11
Graph 3: VTA’s Traction Power from 2007 to 2013
Graph 4: Solar Electricity Production in 2013 by Month
12
performance in comparison to existing Power
Purchase Agreement contract amounts and pro
forma expectations will be evaluated in 2014.
Natural Gas Usage and CostsNatural Gas is used for operating space heaters
and heating water at Chaboya, North and Gua-
dalupe Divisions. River Oaks Division uses natural
gas for heating water only. Propane is used for
heating at Cerone Division.
Graph 6 shows the annual use of natural gas
at Chaboya, North, River Oaks, and Guadalupe
Divisions. In 2013, total natural gas usage was
141,625 therms. Usage has decreased by 18%
from a record-high in 2008. VTA spent approxi-
mately $108,000 on natural gas in 2013 which is
lower than the annual average of $133,000.
In summer of 2012, VTA reviewed its usage at
North Division, which was high compared to
Chaboya and Guadalupe Divisions. A leak was
found and repaired above the paint booth in
October, resulting in an annual savings of ap-
proximately $10,000.
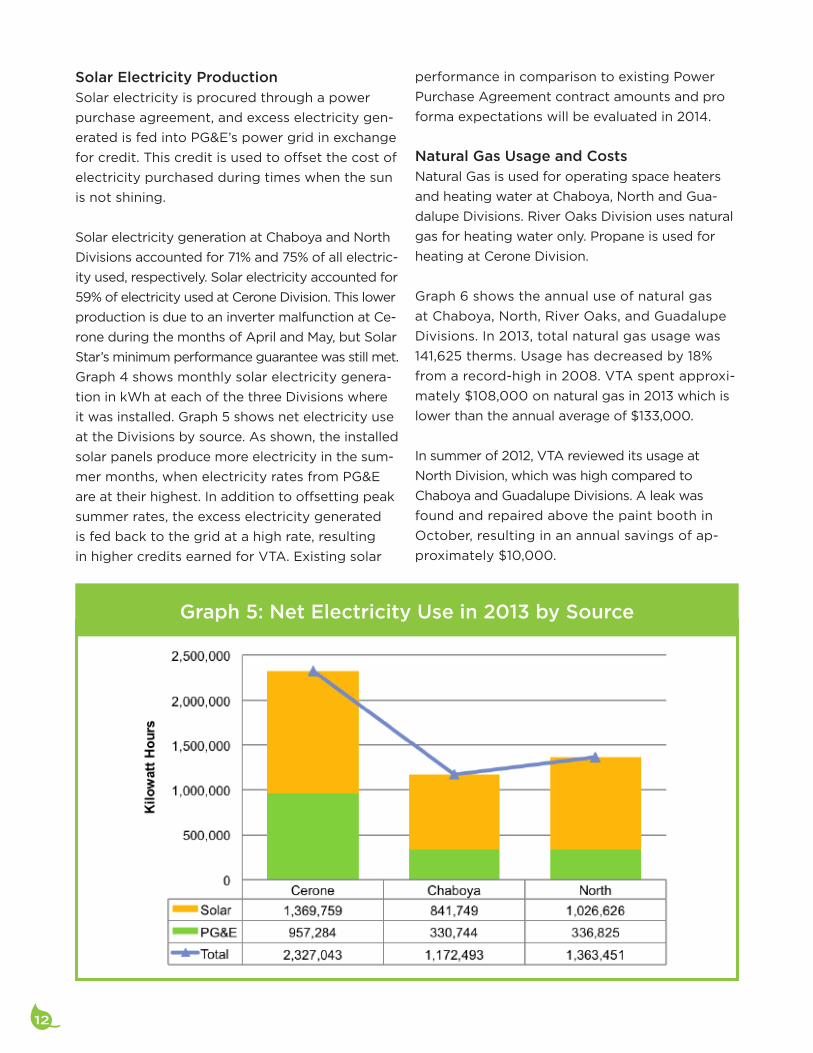
Solar Electricity ProductionSolar electricity is procured through a power
purchase agreement, and excess electricity gen-
erated is fed into PG&E’s power grid in exchange
for credit. This credit is used to offset the cost of
electricity purchased during times when the sun
is not shining.
Solar electricity generation at Chaboya and North
Divisions accounted for 71% and 75% of all electric-
ity used, respectively. Solar electricity accounted for
59% of electricity used at Cerone Division. This lower
production is due to an inverter malfunction at Ce-
rone during the months of April and May, but Solar
Star’s minimum performance guarantee was still met.
Graph 4 shows monthly solar electricity genera-
tion in kWh at each of the three Divisions where
it was installed. Graph 5 shows net electricity use
at the Divisions by source. As shown, the installed
solar panels produce more electricity in the sum-
mer months, when electricity rates from PG&E
are at their highest. In addition to offsetting peak
summer rates, the excess electricity generated
is fed back to the grid at a high rate, resulting
in higher credits earned for VTA. Existing solar
Graph 5: Net Electricity Use in 2013 by Source

13
WaterGraph 7 shows annual water use from 2007 to
2013. VTA’s water is supplied from Great Oaks
Water Company, San Jose Water Company, and
the cities of San Jose, Santa Clara, Sunnyvale, Mil-
pitas, Morgan Hill, Mountain View, and Palo Alto.
River Oaks Division used the most water in 2013,
at approximately 12.1 million gallons. Water is
used primarily for irrigation and indoor/domes-
tic use. Exceptionally high water use this year
can be attributed to intensive irrigation of new
landscaping due to record-low precipitation lev-
els. 2013 was the driest year on record for Santa
Clara County.
Water use at Chaboya, North, and Cerone Divi-
sions is attributed to bus washing, indoor/do-
mestic use, irrigation, and general cleaning. Bus
wash schedules have been modified to account
for weather conditions. Water usage in 2013 has
decreased at Chaboya and North Divisions, but
increased at Cerone Division, in comparison with
the previous year.
Water use at the Guadalupe Division is attribut-
ed to washing light rail vehicles, indoor/domes-
tic use, irrigation, pressure washing and cleaning
parts. Water usage in 2013 decreased by 6% in
comparison to the previous year due to contin-
ued water conservation measures.
Waste and RecyclingWhile VTA has waste and recycling programs at
its major operating divisions, it does not currently
have recycling programs onboard its vehicles or
at its transit facilities. Recycling services include
wood pallets and green waste. VTA’s solid waste
providers are Republic Services (City of San 4
Graph 6: Natural Gas Usage at VTA’s Main Operating Facilities from 2007 to 2013

14
Jose, formerly Allied Waste), City of Mountain
View, and the City of Milpitas. VTA staff collects
waste from its transit facilities and disposes of it at
either the Newby Island or Zanker Landfill. Some
waste is also handled by Clear Channel Communi-
cations, who maintains certain bus shelters under
an advertising agreement with VTA.
Graph 8 shows the annual waste and recycling
generation at VTA’s main operating divisions
from 2007 to 2013. Waste and recycling fluctu-
ates seasonally and from year-to-year based on
project cycles. In 2013, approximately 340 tons of
materials (mixed paper, plastic, aluminum, glass,
wood, and metal) were recycled and 1369 tons of
waste were collected by VTA’s solid waste pro-
viders. Overall, 40.3% of waste has been reduced
Graph 7: Water Use at VTA’s Main Operating Facilities from 2007 to 2013
since 2007 at VTA’s main operating divisions.
However, waste levels increased 3.5% in the past
year. The dip in 2009 is most likely attributed to
the addition of a compost program at the River
Oaks cafeteria and adjustment of hauling services
and container sizes to meet current needs.
Graph 9 shows hazardous waste production at
VTA’s main operating divisions for years recorded
between 2001 and 2013. Hazardous waste is pro-
duced primarily by bus washing and other main-
tenance activities. Since 2001, total production
of hazardous waste has decreased by 70%, due
to improvements in waste management, training,
and awareness. The increase at Guadalupe Divi-
sion in 2013 was due to non-routine maintenance
of the steam cleaning system.

15
Graph 8: Waste and Recycling at VTA’s Main Operating Divisions from 2007 to 2013
Graph 9: Harzardous Waste at VTA’s Main Operating Divisions for Select Years

16
Current Projects
This section describes projects currently under-
way or in development by VTA’s Sustainability
Team. The projects are supported by the Sus-
tainability Program budget. VTA has currently
allocated $1.2 million in its two-year FY14/15
budget for the Sustainability Program.
Utility Management Software In December 2013, VTA signed a contract with
EnergyCAP Inc. for Utility Management Soft-
ware and Services. Using EnergyCAP software,
VTA will monitor utility usage at all operating
divisions, transit centers, stops, platforms, and
other facilities. This data will be used to find op-
portunities for efficiency improvements, catch
mistakes in invoices from utility providers, and
identify leaks. The utility management program
is scheduled to go live in July 2014.
Utility Meter GISA Utility Meter GIS is being developed to im-
prove monitoring of utilities across the entire
VTA system and is expected to be complete in
early 2015. The Utility Meter GIS will have exact
meter locations, photos of each meter, and de-
tailed notes on how to find them.
Energy EfficiencyVTA is currently retrofitting facility lighting to
energy efficient fixtures and installing LED light-
ing on station platforms. Lighting retrofits are
being made at all maintenance bays at the Gua-
dalupe Light Rail Division. Lights at this facility

17
will be upgraded from T-5 to LEDs. At station
platforms, VTA is replacing High Pressure
Sodium (HPS) lights with LEDs at the follow-
ing light rail stations: Children’s Discovery
Museum, Tasman, River Oaks, Orchard, Bo-
naventura, Component, Karina, Metro/Airport,
and Gish. A total of 121 HPS fixtures (100-150
watts each) will be replaced with 121 LED
fixtures (40 watts each). These retrofits are
estimated to achieve an annual savings of $
9,445, resulting in a payback of 5 to 6 years.
Environmental Management Systems InstituteIn 2013, VTA was accepted into the Federal
Transit Administration’s (FTA) fourth round of
Environmental Management Systems (EMS)
training and technical assistance for public
transportation agencies. VTA identified an
EMS Core Team to attend trainings at Virginia
Tech over the 18-month program and selected
the Cerone Bus Division as the EMS fence line.
FTA’s training is designed to help agencies
develop and implement an EMS, using the
14001 Standard of the International Orga-
nization for Standardization (ISO). The Vir-
ginia Tech Team will perform a Gap Audit
in 2014 to measure VTA’s progress towards
implementing its EMS. At the conclusion
of the program in 2015, FTA and Virginia
Tech will publish a case study documenting
VTA’s commitment to continual improve-
ment and pollution prevention according to
the ISO Standard.
Waste Reduction and Recycling The Sustainability Program is currently working
with VTA’s Technology Working Group to re-
duce paper use in administrative offices. In 2013,
VTA approved a new contract for office paper
made out of 30% post-consumer waste. Prior to
this contract, no minimum recycled content was
specified. Employees are encouraged to print
and copy documents only when necessary and
to use multi-functional devices to scan and share
documents electronically.
Improvements are continually being made to exist-
ing recycling programs. For example, new contain-
ers are being added to field offices, break areas, and
near printers to make recycling more convenient
for employees. Starting with the Great Mall Transit
Center in 2015, VTA will begin a solar-powered trash
compactor pilot program. These waste receptacles
monitor and report remaining capacity to reduce
weekly pickup trips. Both features are powered by a
solar photovoltaic panel located on top of the bin.
Replacing High Pressure Sodium lamps with LED fixtures improves light quality and efficiency at VTA station platforms.Replacing high pressure sodium lamps with LED fixtures improves light quality and efficiency at VTA station platforms.
The EMS Core Team implements procedures to ensure VTA’s environmental performance improves year after year.

18
Silicon Valley Berryessa ExtensionVTA, BART and the Design-Build Contractor
(Joint Venture of Skanska, Shimmick, Herzog)
aim to achieve best practices in sustainability
performance through design and construc-
tion of the Silicon Valley Berryessa Extension
Project. The two BART stations, in Milpitas
and San Jose, are designed based on CAL-
Green 2010 Standards. This includes green
building measures in energy efficiency, water
conservation, sustainable materials sourcing,
occupant comfort and site impact. Some of
the Project Sustainability Measures currently
being pursued under the CALGreen umbrella
include:
• Use of supplementary cement materials
in concrete mixes. The project estimates
offseting 15% of Portland cement with
fly-ash.
• Use of low-flow indoor plumbing fixtures.
The project estimates that annual po-
table water consumption will be reduced
by 35% as a result of this measure.
• Maximize recycling and reuse of demoli-
tion waste.
• Use of available city recycled water for
landscape irrigation requirements.
• Use of collected ground water for dust
control during excavations.
• Use of LED fixtures instead of high density
mercury or sodium vapor lamps.
• Use of escalator permanent variance to operate
on crawl speeds when users are not present,
resulting in reduced energy use and costs.
The Project has incorporated sustainability in the
construction process through aggressive waste
diversion goals and potable water reduction. Over
25,000 tons of construction waste has been gener-
ated since construction began in spring 2012. The
total landfill diversion rate is 98.4%. Dust-suppres-
sion water trucks are encouraged to refill with col-
lected groundwater whenever possible. At least 1.4
million gallons of potable water has been conserved
due to this reuse, as of January 2014.
Outreach and Education One of VTA’s ongoing goals is to increase envi-
ronmental awareness and promote environmental
stewardship in the workplace and in the local com-
munity. Ongoing outreach and education to VTA
employees includes:
• Introductory sustainability presentation at each
New Employee Orientation,
• Monthly articles in employee newsletter
Timepoint,
• Bike to Work Day competitions,
• Nominations of “Sustainability AllStars” – a
recognition program for employees acting as
stewards of the environment,
Future Milpitas StationFuture Berryessa Station

19
• Brown Bag Lunch and Learn events,
• E-Waste drop-off days for household
waste,
• Seasonal “Farmer’s Markets” put on by
employees who share produce grown at
home,
• Volunteer litter clean-up days, and
• Spare the Air Alert messages when a Bay
Area Spare the Air Day is issued.
In addition, VTA’s Sustainability Program works
collaboratively with Sustainable Silicon Valley,
Joint Venture Silicon Valley, and local agencies
to combat climate change and promote envi-
ronmental stewardship. For example, VTA is
a task force member for the Silicon Valley 2.0
Project, a regional effort, managed by the Santa
Clara County Office of Sustainability and funded
by the Strategic Growth Council, to minimize
the anticipated impacts of climate change and
reduce the generation of local greenhouse gas
emissions.
Future Projects and Goals
In addition to continuing the work described
above, VTA’s Sustainability Program identifies
at least two additional projects for the next
fiscal year.
1. Conduct a greenhouse gas inventory
A greenhouse gas inventory is an accounting
of greenhouse gases emitted to or removed
from the atmosphere over a period of time.
Estimating greenhouse gases emissions would
enable VTA to create an emissions baseline,
monitor progress, and assess the relative
contributions of emission sources per APTA
recommendations.
2. Continue to explore funding for renewable
energy projects and study opportunities for
energy storage
In November 2012, a Request for Proposals
was issued to procure a fuel cell for electric-
ity generation at Guadalupe Division. Un-
fortunately, negotiations did not result in an
acceptable financing package. VTA is also
looking into energy storage opportunities.

201402-9333
Santa Clara Valley Transportation Authority
3331 North First Street
San Jose, CA 95134-1927
vta.org/sustainability
(408) 321-7575 • TTY (408) 321-2330