VRSN Working Sample
32
VeriSign (VRSN) Valuation Writing Sample Valuation Date: January 25, 2016 By Michael Ijeh
-
Upload
michael-ijeh -
Category
Documents
-
view
349 -
download
2
Transcript of VRSN Working Sample

VeriSign (VRSN) Valuation Writing Sample
Valuation Date: January 25, 2016
By
Michael Ijeh

Page | 2
Table of Contents
Basics for VeriSign
Competitive Landscape
Financial Analysis
Common-Size Statement Analysis
Financial Ratio Analysis
Growth Rate Analysis
Key Forecasting Assumptions
Valuation
Market Approach
Income Approach
Conclusion
Summary
Basis for Estimation
Risks to Estimation
Income Approach Risk Sensitivity Matrix
Appendix
Sources
Financial Statements
Comparable Company Analysis

Page | 3
Basics for VeriSign
Company Description
Founded in 1995, VeriSign (Nasdaq:VRSN) is an internet
service based company that primarily functions in the domain
name registry industry. VeriSign operates the infrastructure for
the .com, .net, .tv, .cc, .name, .jobs, .edu and .gov top-level
domains. In addition, manages and protects the DNS
infrastructure for more than 135 million domain names,
processing more than 120 billion Internet queries daily. Verisign
provides these services under long-term agreements with
Internet Corporation for Assigned Names and Numbers
(ICANN), a global multi-stakeholder non-profit, and the U.S.
Department of Commerce (DOC). VeriSign also has a Network
Intelligence & Availability (NIA) service that consists of DDoS
Protection Services, Verisign iDefense Services and Managed DNS Service. The NIA services provide
infrastructure assurance to organizations and are more complementary to its domain name registry service.
Sources and Uses of Revenue
VeriSign generates revenue by charging a fee for registered domain names on an annual basis. For its two main
generic top-level domains (gTLDs), .com and .net, the fees charged are based on the agreements with the
Internet Corporation for Assigned Names and Numbers (ICANN). Within the agreement, the most VeriSign can
charge per .com domain name is $7.85 through 2018, while the most to be charged per .net domain name is
currently $6.79 and can increase by 7% a year through 2018. In most cases, VeriSign uses promotional pricing
and rarely charges the maximum licensing fee allowed. VeriSign also generates revenue with its international
domain names (IDNs) services, which enable Internet users to access websites in characters representing their
local language for second-level domain names (the part of web address to the left of the dot.). Domain names are
registered from 1 to 10 years and VeriSign typically experiences higher domain growth and deferred revenue
during the first quarter of the year. VeriSign also has a Network Intelligence and Availability (NIA) service
business line that generates revenue by offering infrastructure and cloud-based security services. This service,
however, does not make up a substantial amount of their overall revenue. Management of the company does not
give specifics to this business line, but I estimate that it comprises approximately 4% of total revenue to date.
Page | 4
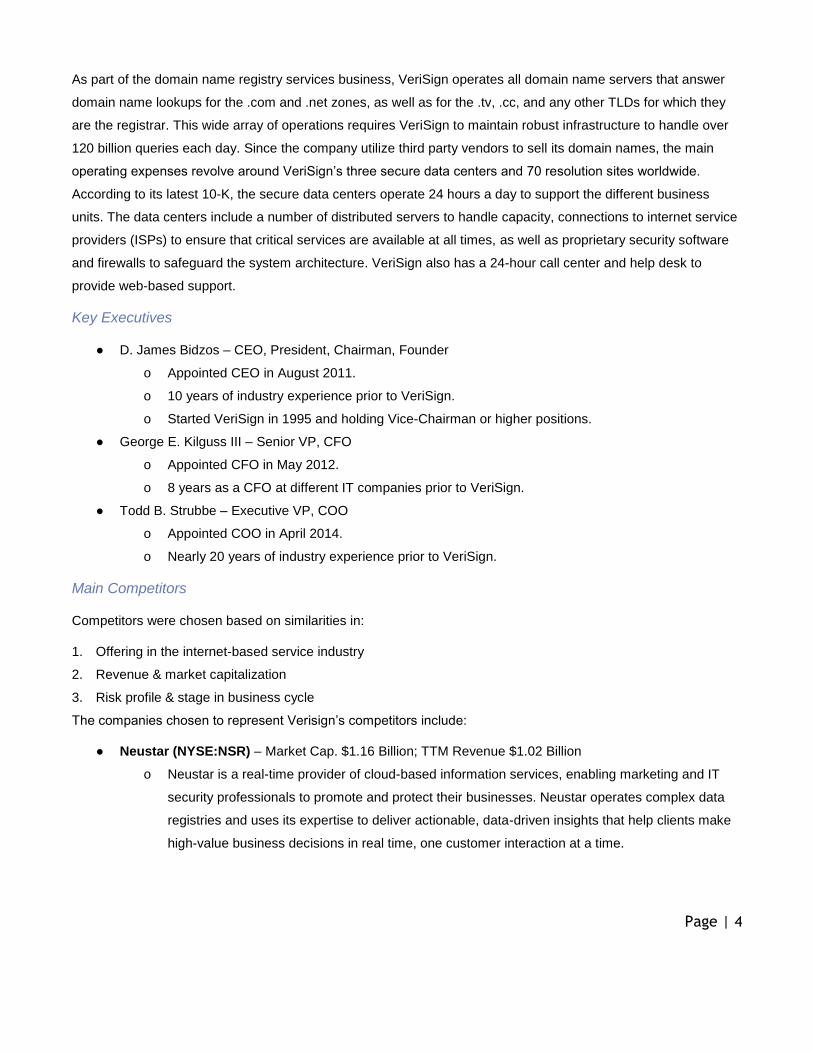
As part of the domain name registry services business, VeriSign operates all domain name servers that answer
domain name lookups for the .com and .net zones, as well as for the .tv, .cc, and any other TLDs for which they
are the registrar. This wide array of operations requires VeriSign to maintain robust infrastructure to handle over
120 billion queries each day. Since the company utilize third party vendors to sell its domain names, the main
operating expenses revolve around VeriSign’s three secure data centers and 70 resolution sites worldwide.
According to its latest 10-K, the secure data centers operate 24 hours a day to support the different business
units. The data centers include a number of distributed servers to handle capacity, connections to internet service
providers (ISPs) to ensure that critical services are available at all times, as well as proprietary security software
and firewalls to safeguard the system architecture. VeriSign also has a 24-hour call center and help desk to
provide web-based support.
Key Executives
● D. James Bidzos – CEO, President, Chairman, Founder
o Appointed CEO in August 2011.
o 10 years of industry experience prior to VeriSign.
o Started VeriSign in 1995 and holding Vice-Chairman or higher positions.
● George E. Kilguss III – Senior VP, CFO
o Appointed CFO in May 2012.
o 8 years as a CFO at different IT companies prior to VeriSign.
● Todd B. Strubbe – Executive VP, COO
o Appointed COO in April 2014.
o Nearly 20 years of industry experience prior to VeriSign.
Main Competitors
Competitors were chosen based on similarities in:
1. Offering in the internet-based service industry
2. Revenue & market capitalization
3. Risk profile & stage in business cycle
The companies chosen to represent Verisign’s competitors include:
● Neustar (NYSE:NSR) – Market Cap. $1.16 Billion; TTM Revenue $1.02 Billion
o Neustar is a real-time provider of cloud-based information services, enabling marketing and IT
security professionals to promote and protect their businesses. Neustar operates complex data
registries and uses its expertise to deliver actionable, data-driven insights that help clients make
high-value business decisions in real time, one customer interaction at a time.
Page | 5
● Web.com Group (NasdaqGS:WEB) – Market Cap. $956 Million; TTM Revenue $540 Million
o Web.com Group provides a full range of Internet services to small businesses to help them
compete and succeed online. Web.com meets the needs of small businesses anywhere along
their lifecycle with affordable, subscription-based solutions including domains, hosting, website
design and management, search engine optimization, online marketing campaigns, local sales
leads, social media, mobile products, and eCommerce solutions.
● Tucows (NasdaqCM:TCX) – Market Cap. $211 Million; TTM Revenue $167 Million
o Tucows provides domain name and email services through a global distribution network of more
than 13,000 web hosting companies and Internet service providers. Tucows is an accredited
registrar with the Internet Corporation for Assigned Names and Numbers, or ICANN, and
generates revenue primarily through the provision of domain registration and other Internet
services to service providers who offer such services to their own customers in a process known
as wholesale distribution.
● Rightside Group (NasdaqGS:NAME)– Market Cap. $161 Million; TTM Revenue $209 Million
o Rightside is a recognized leader in Internet domain name services. With a mission to advance the
way businesses and consumers define and present themselves online, the company is the
industry’s only end-to-end vertically integrated provider operating at scale and able to service all
aspects of a domain name. Rightside is also a chief participant in a historic expansion of the
Internet name space - broadening domain name extensions from just 22 legacy options like .com
and .net to potentially more than 1,300 including ~700 generic Top Level Domains (gTLDs) and
600 branded Top Level Domains (like .Loreal or .Google).
Business Strategy
According to its latest 10-Q filing and investor presentation, the key points from VeriSign’s Management included:
● From Q3 2014-2015, revenues increased by $10.8 million, or by 4%, to $265.8 million, primarily due to a
3% increase in the number of domain names ending in .com and .net (135.2M versus 130M a year ago)
and increases in the .net domain name registration fees in February 2014 and 2015. Growth in the
domain name base was primarily driven by continued Internet growth and new domain name promotional
programs.
● Due to ongoing economic uncertainty, the introduction of new gTLDs, and changing marketing strategies
by certain registrars, management believes there is a limited rate of growth of the domain name base,
which leads to a slowdown in revenue for FY 2015.
● Growth in domain names are coming from all geographies, but the area with the fastest growth is in the
Asia Pacific.

Page | 6
● 2.3 million shares of stock were repurchased for $156 million. At the end of Q3, VeriSign has a total of
$605 million remaining in its $1.0 billion share repurchase program.
● Progress is being made for the preparation of the launch of the international domain name (IDN) versions
of .com and .net. Expect these top level IDNs to launch in Q1 2016.
Main risk factors addressed by management included:
● Since most of VeriSign’s revenue is derived from its Registry Services business line, limitations on its
ability to raise prices on domain name registrations and any failure to renew key agreements could
materially and adversely affect VeriSign’s business, results of operations, financial condition and cash
flows.
● Governmental regulation and the application of new and existing laws in the U.S. and overseas may slow
business growth, increase its costs of doing business, create potential liability and have an adverse effect
on VeriSign’s business.
● Changes in Internet user behavior, either as a result of evolving technologies or user practices, may
impact the demand for domain names.
Accounting Analysis
Overall, VeriSign disclosed most of the information needed to accurately analyze its financial statements. The key
problems in the analysis revolved around VeriSign’s Subordinated Convertible Debenture, which adds a layer of
complexity to analyzing its financial statements. Additionally, I would have preferred to know more about the NIA
services business line for VeriSign. Even though the revenues from NIA “are not significant in relation to
(VeriSign’s) consolidated revenues,” (VRSN 2014 10-K) I believe that this business line may start to play a key
role in future operations.
Competitive Landscape
Industry Overview
There are very few companies within the domain name registry space, mainly because VeriSign’s contract with
ICANN grants them with the most used root zone, .com. This is why other third party domain name websites have
to go through VeriSign, thus effectively creating a monopolistic business model. Despite this fact, the threat of
new entrants is an increasing concern. With the anticipated release of nearly 1300 new gTLDs in the years to
come, there will be plenty of new domain names to choose from when starting a website. In addition, if any
problems, such as cyber-attacks, happen between now and 2018, VeriSign may not be able to renew its contracts
for the exclusive rights for registering .net and .com domain names. In a lot of ways, ICANN both greatly helps
and hurts VeriSign.

Page | 7
Key Success Factors
One factor that is very important is the number of clients a firm might have under contract. To have a variety of
customers and being connected to as many internet users as possible is crucial in the internet-based services,
which also leads to having high renewal rates as another key factor. Lastly, being innovative and flexible in the
services offered is also very important, especially in an industry where standards are changing continually.
VeriSign’s Competitive Advantages & Disadvantages
Advantages
● The contract with ICANN is crucial to VeriSign’s operations, and is by far its biggest competitive
advantage in relation to the rest of the industry.
● With the internet growing to 299 million domain names at the end of 2015, VeriSign already holds
substantial portion of the market (approx. 45%).
● With nationwide contracts with all Fortune
500 companies, VeriSign is generating revenue
while being exposed to different markets across
the globe. Some of its customers include Wal-
Mart, Microsoft, GE, Delta Air Lines, Verizon,
Amazon, Pfizer, and Boeing.
Disadvantages
● When compared to its peer group,
VeriSign really only offers one service that has two
components (.com and .net registry). Even though
the IDN expansion of those two root names will be
critical in the growth strategy going forward, VeriSign’s peer group offers more services and root names,
which helps in decreasing the volatility of business growth and helps in creating customizable solutions
for its customers.
Top-Down Factors
● The Internet Corporation for Assigned Names and Numbers (ICANN) was created to “ensure a stable and
unified global Internet.” To further their mission, ICANN has created a new generic Top-Level Domain
(gTLD) program in order to increase competition and choice in the domain space. As mentioned above,
VeriSign’s contract with ICANN for the exclusive rights to have ownership over well-known domain names
is the key factor to VeriSign’s competitive advantage, but as ICANN also allows thousands of new gTLDs
to hit the market, VeriSign must find different ways to compete.

Page | 8
● Domestically, the trend of firms generating more business from online advertising and e-commerce sales
will lead to higher renewal rates and growth for VeriSign. This is expected to play a larger role in the
economy as the demographics of the United States continue to become younger and younger, as
millennials tend to shop more online and spend more time on the Internet in general.
● On a global scale, domain name registry tends to grow World GDP grows. This happens because as
emerging economies expand, they have increased access to different technologies, including the Internet
overall. This explains why, for the past few fiscal years, most of VeriSign’s growth has come from outside
the United States. Since global economic growth remains varied across regions, VeriSign must find areas
experiencing economic prosperity and develop effective methods to promote its new domain names in
those markets. This is why its IDN program could significantly increase revenue as the United States only
make up 10% of internet users as of 2014, but makes up nearly 60% of VeriSign’s revenue as of its latest
10-K. With internet penetration still below 40% as of 2014, if VeriSign can continue to find a way to reach
and excel in markets outside of the U.S., then they may be able to add another 135 million domain names
to its system in years to come.
Page | 9
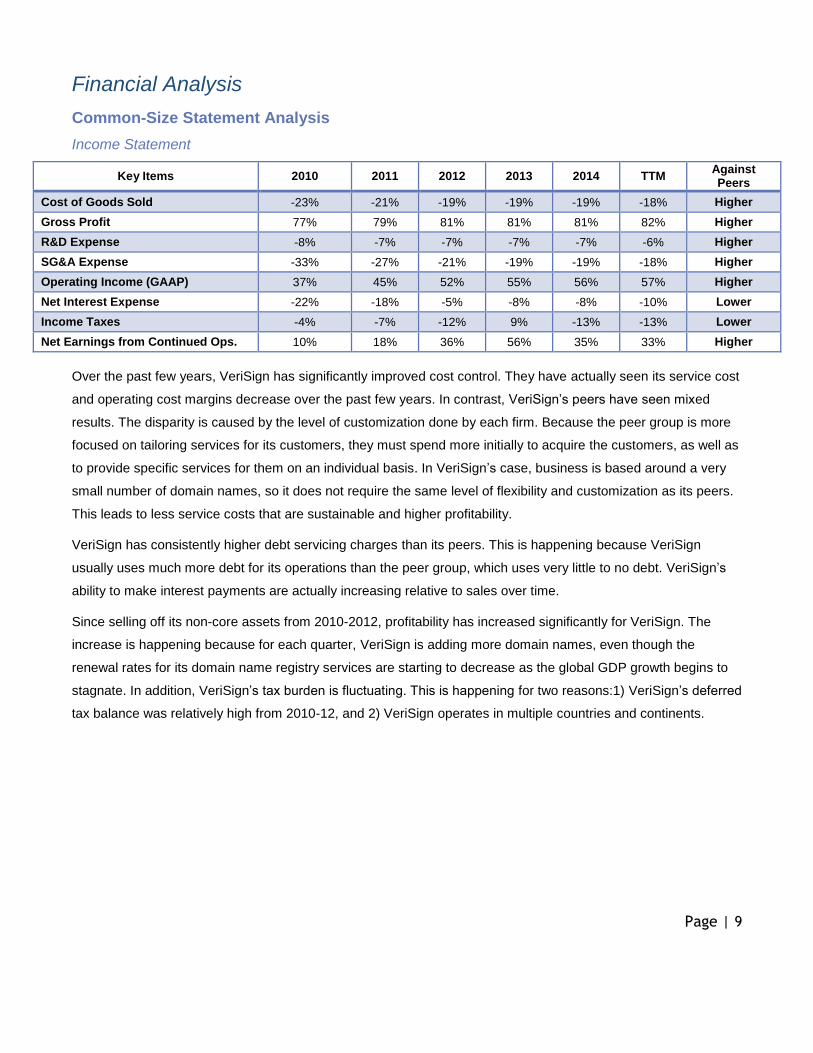
Financial Analysis
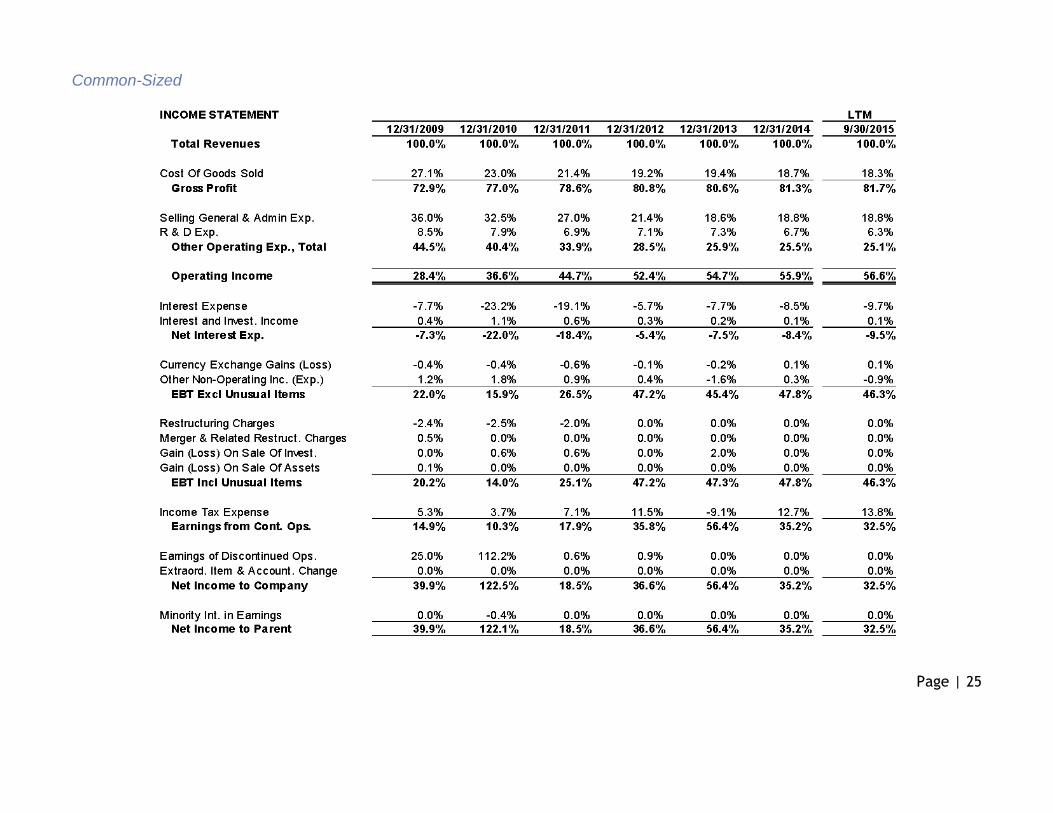
Common-Size Statement Analysis
Income Statement
Key Items 2010 2011 2012 2013 2014 TTM Against Peers
Cost of Goods Sold -23% -21% -19% -19% -19% -18% Higher
Gross Profit 77% 79% 81% 81% 81% 82% Higher
R&D Expense -8% -7% -7% -7% -7% -6% Higher
SG&A Expense -33% -27% -21% -19% -19% -18% Higher
Operating Income (GAAP) 37% 45% 52% 55% 56% 57% Higher
Net Interest Expense -22% -18% -5% -8% -8% -10% Lower
Income Taxes -4% -7% -12% 9% -13% -13% Lower
Net Earnings from Continued Ops. 10% 18% 36% 56% 35% 33% Higher
Over the past few years, VeriSign has significantly improved cost control. They have actually seen its service cost
and operating cost margins decrease over the past few years. In contrast, VeriSign’s peers have seen mixed
results. The disparity is caused by the level of customization done by each firm. Because the peer group is more
focused on tailoring services for its customers, they must spend more initially to acquire the customers, as well as
to provide specific services for them on an individual basis. In VeriSign’s case, business is based around a very
small number of domain names, so it does not require the same level of flexibility and customization as its peers.
This leads to less service costs that are sustainable and higher profitability.
VeriSign has consistently higher debt servicing charges than its peers. This is happening because VeriSign
usually uses much more debt for its operations than the peer group, which uses very little to no debt. VeriSign’s
ability to make interest payments are actually increasing relative to sales over time.
Since selling off its non-core assets from 2010-2012, profitability has increased significantly for VeriSign. The
increase is happening because for each quarter, VeriSign is adding more domain names, even though the
renewal rates for its domain name registry services are starting to decrease as the global GDP growth begins to
stagnate. In addition, VeriSign’s tax burden is fluctuating. This is happening for two reasons:1) VeriSign’s deferred
tax balance was relatively high from 2010-12, and 2) VeriSign operates in multiple countries and continents.
Page | 10
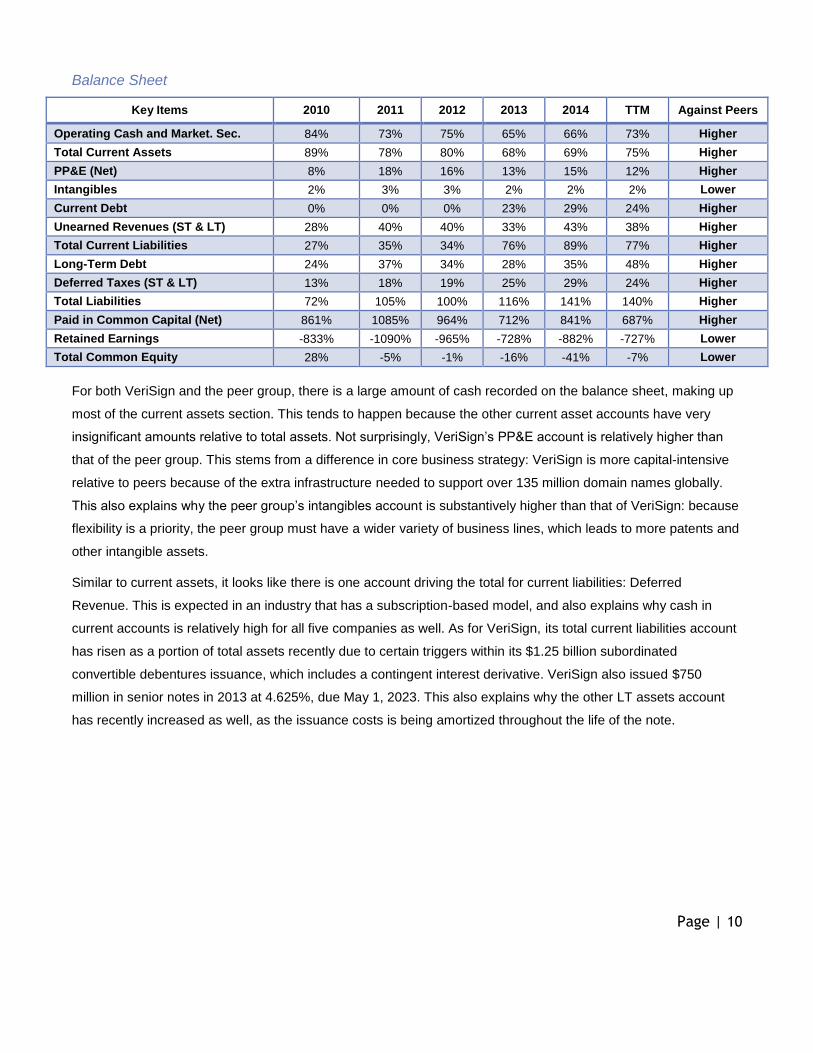
Balance Sheet
Key Items 2010 2011 2012 2013 2014 TTM Against Peers
Operating Cash and Market. Sec. 84% 73% 75% 65% 66% 73% Higher
Total Current Assets 89% 78% 80% 68% 69% 75% Higher
PP&E (Net) 8% 18% 16% 13% 15% 12% Higher
Intangibles 2% 3% 3% 2% 2% 2% Lower
Current Debt 0% 0% 0% 23% 29% 24% Higher
Unearned Revenues (ST & LT) 28% 40% 40% 33% 43% 38% Higher
Total Current Liabilities 27% 35% 34% 76% 89% 77% Higher
Long-Term Debt 24% 37% 34% 28% 35% 48% Higher
Deferred Taxes (ST & LT) 13% 18% 19% 25% 29% 24% Higher
Total Liabilities 72% 105% 100% 116% 141% 140% Higher
Paid in Common Capital (Net) 861% 1085% 964% 712% 841% 687% Higher
Retained Earnings -833% -1090% -965% -728% -882% -727% Lower
Total Common Equity 28% -5% -1% -16% -41% -7% Lower
For both VeriSign and the peer group, there is a large amount of cash recorded on the balance sheet, making up
most of the current assets section. This tends to happen because the other current asset accounts have very
insignificant amounts relative to total assets. Not surprisingly, VeriSign’s PP&E account is relatively higher than
that of the peer group. This stems from a difference in core business strategy: VeriSign is more capital-intensive
relative to peers because of the extra infrastructure needed to support over 135 million domain names globally.
This also explains why the peer group’s intangibles account is substantively higher than that of VeriSign: because
flexibility is a priority, the peer group must have a wider variety of business lines, which leads to more patents and
other intangible assets.
Similar to current assets, it looks like there is one account driving the total for current liabilities: Deferred
Revenue. This is expected in an industry that has a subscription-based model, and also explains why cash in
current accounts is relatively high for all five companies as well. As for VeriSign, its total current liabilities account
has risen as a portion of total assets recently due to certain triggers within its $1.25 billion subordinated
convertible debentures issuance, which includes a contingent interest derivative. VeriSign also issued $750
million in senior notes in 2013 at 4.625%, due May 1, 2023. This also explains why the other LT assets account
has recently increased as well, as the issuance costs is being amortized throughout the life of the note.
Page | 11
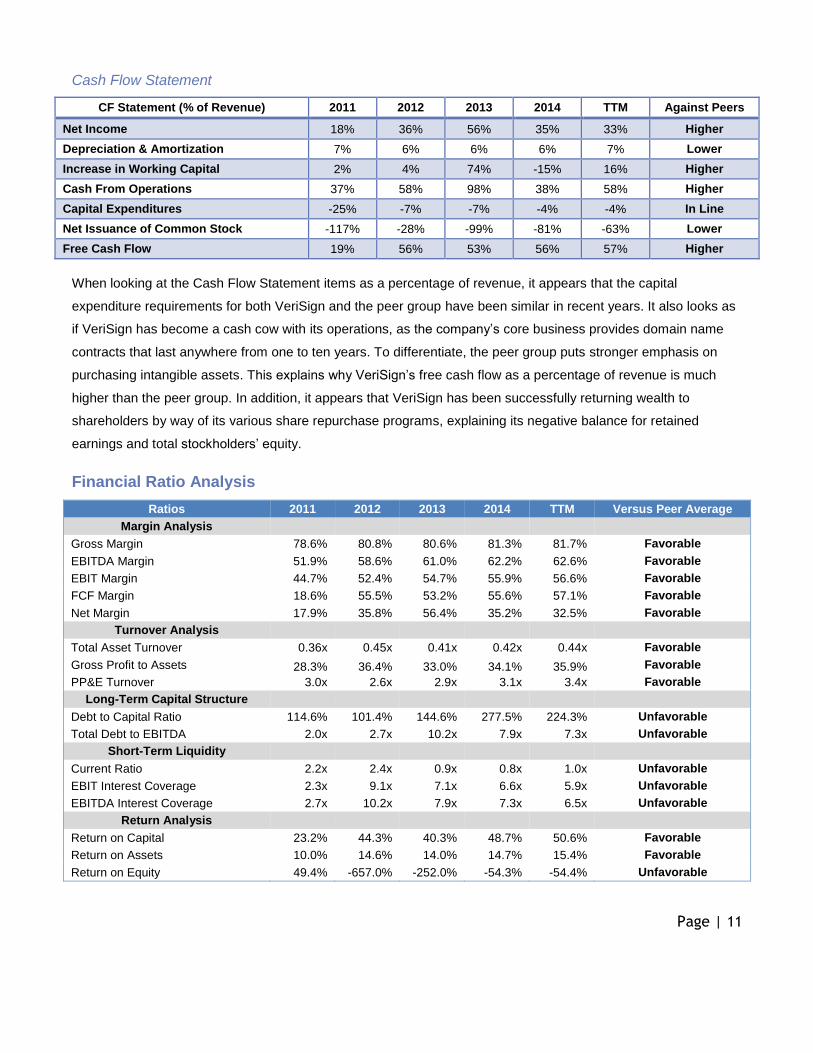
Cash Flow Statement
CF Statement (% of Revenue) 2011 2012 2013 2014 TTM Against Peers
Net Income 18% 36% 56% 35% 33% Higher
Depreciation & Amortization 7% 6% 6% 6% 7% Lower
Increase in Working Capital 2% 4% 74% -15% 16% Higher
Cash From Operations 37% 58% 98% 38% 58% Higher
Capital Expenditures -25% -7% -7% -4% -4% In Line
Net Issuance of Common Stock -117% -28% -99% -81% -63% Lower
Free Cash Flow 19% 56% 53% 56% 57% Higher
When looking at the Cash Flow Statement items as a percentage of revenue, it appears that the capital
expenditure requirements for both VeriSign and the peer group have been similar in recent years. It also looks as
if VeriSign has become a cash cow with its operations, as the company’s core business provides domain name
contracts that last anywhere from one to ten years. To differentiate, the peer group puts stronger emphasis on
purchasing intangible assets. This explains why VeriSign’s free cash flow as a percentage of revenue is much
higher than the peer group. In addition, it appears that VeriSign has been successfully returning wealth to
shareholders by way of its various share repurchase programs, explaining its negative balance for retained
earnings and total stockholders’ equity.
Financial Ratio Analysis
Ratios 2011 2012 2013 2014 TTM Versus Peer Average Margin Analysis
Gross Margin 78.6% 80.8% 80.6% 81.3% 81.7% Favorable
EBITDA Margin 51.9% 58.6% 61.0% 62.2% 62.6% Favorable
EBIT Margin 44.7% 52.4% 54.7% 55.9% 56.6% Favorable
FCF Margin 18.6% 55.5% 53.2% 55.6% 57.1% Favorable
Net Margin 17.9% 35.8% 56.4% 35.2% 32.5% Favorable Turnover Analysis
Total Asset Turnover 0.36x 0.45x 0.41x 0.42x 0.44x Favorable
Gross Profit to Assets 28.3% 36.4% 33.0% 34.1% 35.9% Favorable
PP&E Turnover 3.0x 2.6x 2.9x 3.1x 3.4x Favorable Long-Term Capital Structure
Debt to Capital Ratio 114.6% 101.4% 144.6% 277.5% 224.3% Unfavorable
Total Debt to EBITDA 2.0x 2.7x 10.2x 7.9x 7.3x Unfavorable Short-Term Liquidity
Current Ratio 2.2x 2.4x 0.9x 0.8x 1.0x Unfavorable
EBIT Interest Coverage 2.3x 9.1x 7.1x 6.6x 5.9x Unfavorable
EBITDA Interest Coverage 2.7x 10.2x 7.9x 7.3x 6.5x Unfavorable
Return Analysis
Return on Capital 23.2% 44.3% 40.3% 48.7% 50.6% Favorable
Return on Assets 10.0% 14.6% 14.0% 14.7% 15.4% Favorable
Return on Equity 49.4% -657.0% -252.0% -54.3% -54.4% Unfavorable
Page | 12
In terms of positive trends, VeriSign has very strong margins as well as strong turnover ratios, both of which are
very favorable when compared to the peer group. VeriSign is experiencing these favorable trends because of
heightened focus on its domain name registry business and divestures in years prior to 2012. Outsourcing domain
name sales to third party vendors is also helping keep costs relatively low by decreasing human capital
requirements as compared with the peer group.
For negative trends, it is troublesome to see that most of its leverage and liquidity ratios were either decreasing or
very volatile. These differences mainly stem from VeriSign taking on significantly more debt than the peer group,
as well as VeriSign’s stock buyback and divesture strategies, which decreased its asset base.
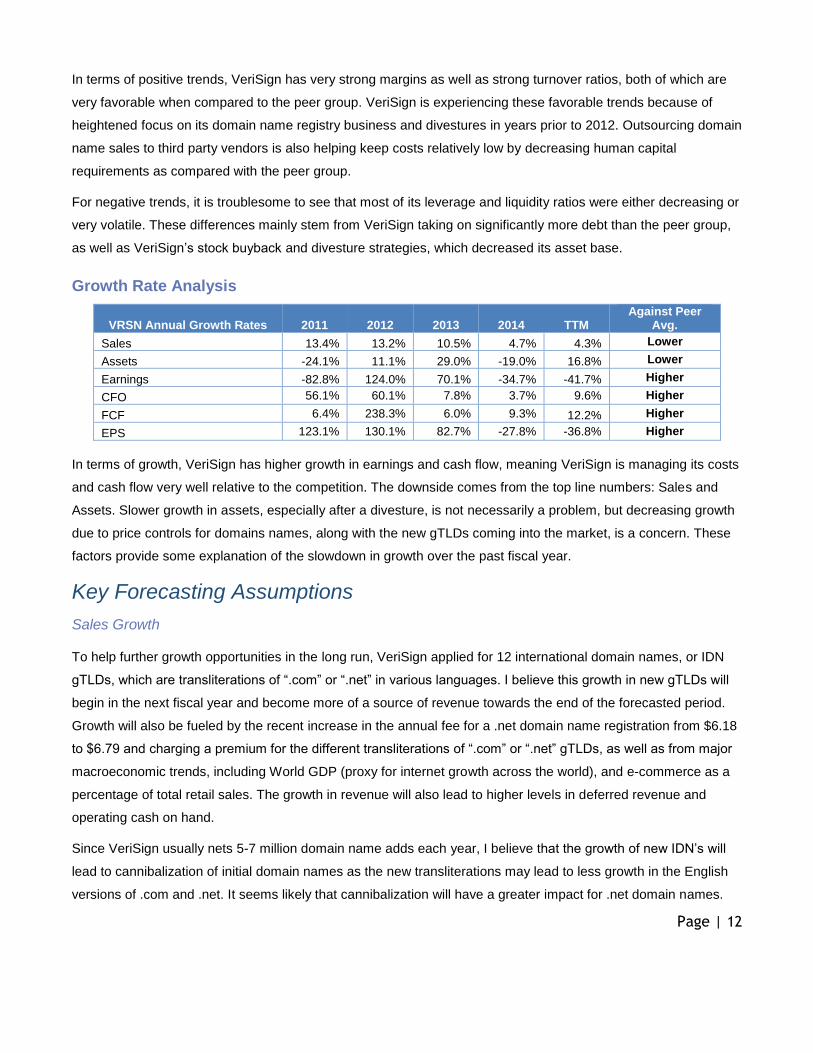
Growth Rate Analysis
VRSN Annual Growth Rates 2011 2012 2013 2014 TTM Against Peer
Avg.
Sales 13.4% 13.2% 10.5% 4.7% 4.3% Lower
Assets -24.1% 11.1% 29.0% -19.0% 16.8% Lower
Earnings -82.8% 124.0% 70.1% -34.7% -41.7% Higher
CFO 56.1% 60.1% 7.8% 3.7% 9.6% Higher
FCF 6.4% 238.3% 6.0% 9.3% 12.2% Higher
EPS 123.1% 130.1% 82.7% -27.8% -36.8% Higher
In terms of growth, VeriSign has higher growth in earnings and cash flow, meaning VeriSign is managing its costs
and cash flow very well relative to the competition. The downside comes from the top line numbers: Sales and
Assets. Slower growth in assets, especially after a divesture, is not necessarily a problem, but decreasing growth
due to price controls for domains names, along with the new gTLDs coming into the market, is a concern. These
factors provide some explanation of the slowdown in growth over the past fiscal year.
Key Forecasting Assumptions
Sales Growth
To help further growth opportunities in the long run, VeriSign applied for 12 international domain names, or IDN
gTLDs, which are transliterations of “.com” or “.net” in various languages. I believe this growth in new gTLDs will
begin in the next fiscal year and become more of a source of revenue towards the end of the forecasted period.
Growth will also be fueled by the recent increase in the annual fee for a .net domain name registration from $6.18
to $6.79 and charging a premium for the different transliterations of “.com” or “.net” gTLDs, as well as from major
macroeconomic trends, including World GDP (proxy for internet growth across the world), and e-commerce as a
percentage of total retail sales. The growth in revenue will also lead to higher levels in deferred revenue and
operating cash on hand.
Since VeriSign usually nets 5-7 million domain name adds each year, I believe that the growth of new IDN’s will
lead to cannibalization of initial domain names as the new transliterations may lead to less growth in the English
versions of .com and .net. It seems likely that cannibalization will have a greater impact for .net domain names.
Page | 13
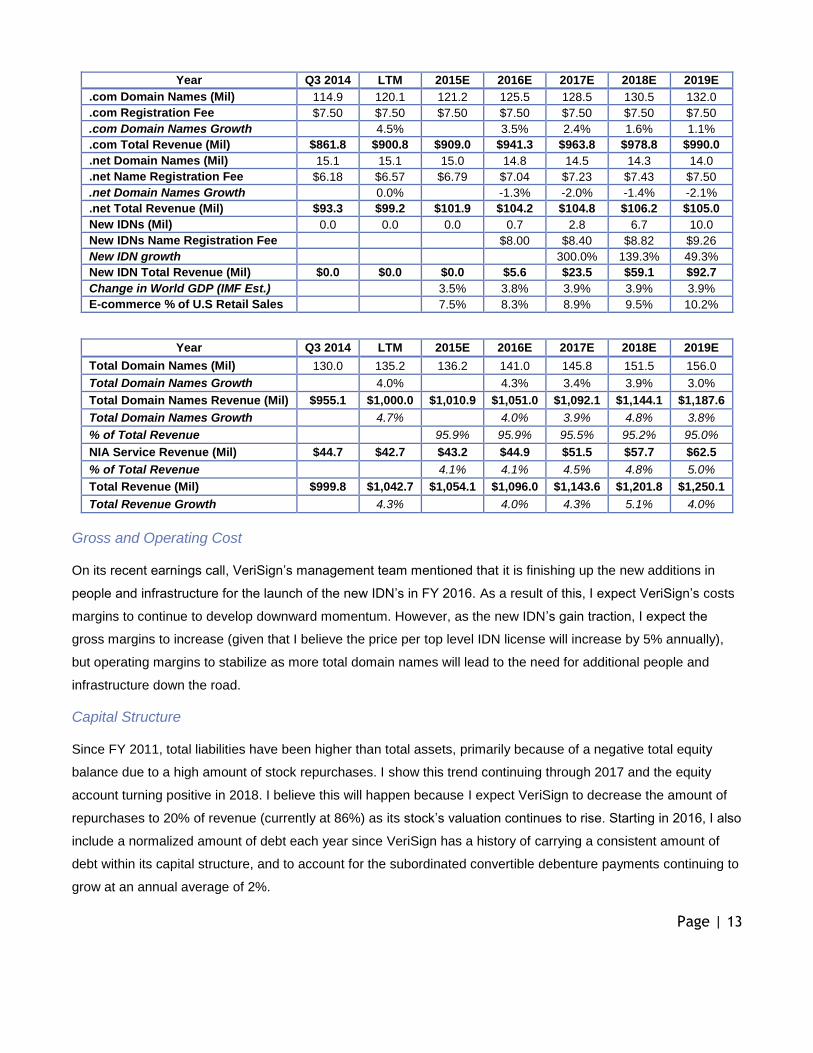
Year Q3 2014 LTM 2015E 2016E 2017E 2018E 2019E .com Domain Names (Mil) 114.9 120.1 121.2 125.5 128.5 130.5 132.0 .com Registration Fee $7.50 $7.50 $7.50 $7.50 $7.50 $7.50 $7.50 .com Domain Names Growth 4.5% 3.5% 2.4% 1.6% 1.1% .com Total Revenue (Mil) $861.8 $900.8 $909.0 $941.3 $963.8 $978.8 $990.0 .net Domain Names (Mil) 15.1 15.1 15.0 14.8 14.5 14.3 14.0 .net Name Registration Fee $6.18 $6.57 $6.79 $7.04 $7.23 $7.43 $7.50 .net Domain Names Growth 0.0% -1.3% -2.0% -1.4% -2.1% .net Total Revenue (Mil) $93.3 $99.2 $101.9 $104.2 $104.8 $106.2 $105.0 New IDNs (Mil) 0.0 0.0 0.0 0.7 2.8 6.7 10.0 New IDNs Name Registration Fee $8.00 $8.40 $8.82 $9.26 New IDN growth 300.0% 139.3% 49.3% New IDN Total Revenue (Mil) $0.0 $0.0 $0.0 $5.6 $23.5 $59.1 $92.7 Change in World GDP (IMF Est.) 3.5% 3.8% 3.9% 3.9% 3.9% E-commerce % of U.S Retail Sales 7.5% 8.3% 8.9% 9.5% 10.2%
Year Q3 2014 LTM 2015E 2016E 2017E 2018E 2019E
Total Domain Names (Mil) 130.0 135.2 136.2 141.0 145.8 151.5 156.0 Total Domain Names Growth 4.0% 4.3% 3.4% 3.9% 3.0% Total Domain Names Revenue (Mil) $955.1 $1,000.0 $1,010.9 $1,051.0 $1,092.1 $1,144.1 $1,187.6
Total Domain Names Growth 4.7% 4.0% 3.9% 4.8% 3.8% % of Total Revenue 95.9% 95.9% 95.5% 95.2% 95.0% NIA Service Revenue (Mil) $44.7 $42.7 $43.2 $44.9 $51.5 $57.7 $62.5
% of Total Revenue 4.1% 4.1% 4.5% 4.8% 5.0% Total Revenue (Mil) $999.8 $1,042.7 $1,054.1 $1,096.0 $1,143.6 $1,201.8 $1,250.1
Total Revenue Growth 4.3% 4.0% 4.3% 5.1% 4.0%
Gross and Operating Cost
On its recent earnings call, VeriSign’s management team mentioned that it is finishing up the new additions in
people and infrastructure for the launch of the new IDN’s in FY 2016. As a result of this, I expect VeriSign’s costs
margins to continue to develop downward momentum. However, as the new IDN’s gain traction, I expect the
gross margins to increase (given that I believe the price per top level IDN license will increase by 5% annually),
but operating margins to stabilize as more total domain names will lead to the need for additional people and
infrastructure down the road.
Capital Structure
Since FY 2011, total liabilities have been higher than total assets, primarily because of a negative total equity
balance due to a high amount of stock repurchases. I show this trend continuing through 2017 and the equity
account turning positive in 2018. I believe this will happen because I expect VeriSign to decrease the amount of
repurchases to 20% of revenue (currently at 86%) as its stock’s valuation continues to rise. Starting in 2016, I also
include a normalized amount of debt each year since VeriSign has a history of carrying a consistent amount of
debt within its capital structure, and to account for the subordinated convertible debenture payments continuing to
grow at an annual average of 2%.
Page | 14
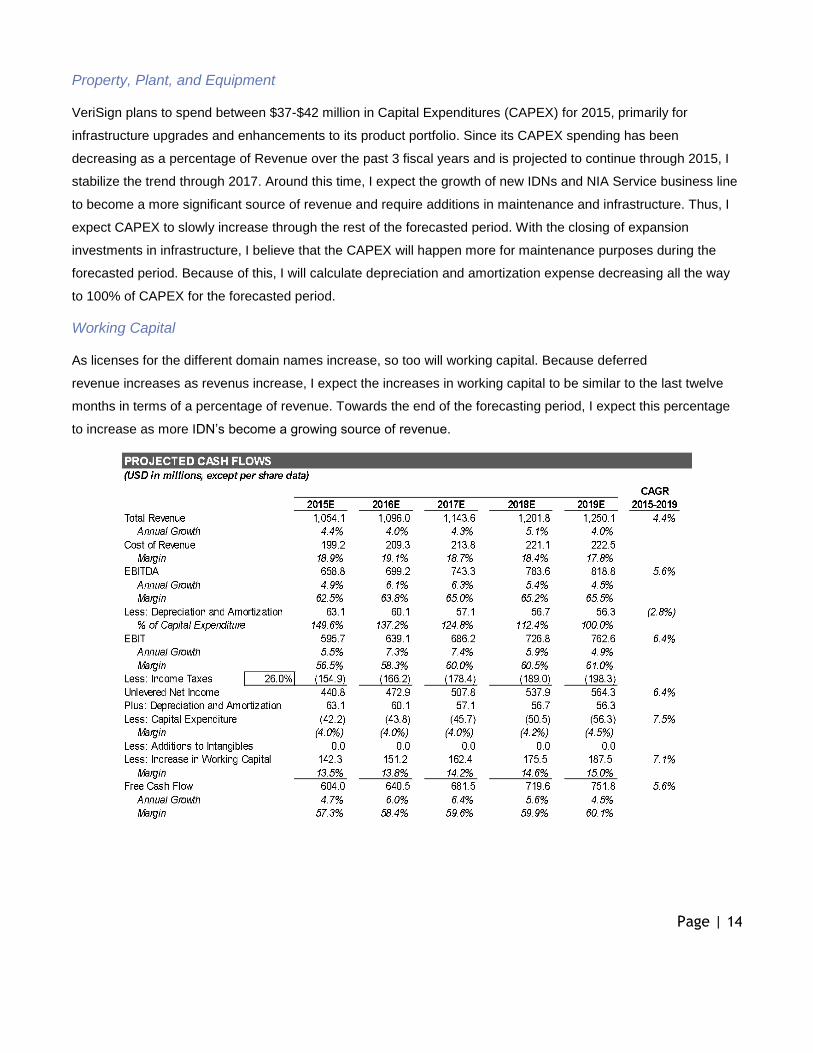
Property, Plant, and Equipment
VeriSign plans to spend between $37-$42 million in Capital Expenditures (CAPEX) for 2015, primarily for
infrastructure upgrades and enhancements to its product portfolio. Since its CAPEX spending has been
decreasing as a percentage of Revenue over the past 3 fiscal years and is projected to continue through 2015, I
stabilize the trend through 2017. Around this time, I expect the growth of new IDNs and NIA Service business line
to become a more significant source of revenue and require additions in maintenance and infrastructure. Thus, I
expect CAPEX to slowly increase through the rest of the forecasted period. With the closing of expansion
investments in infrastructure, I believe that the CAPEX will happen more for maintenance purposes during the
forecasted period. Because of this, I will calculate depreciation and amortization expense decreasing all the way
to 100% of CAPEX for the forecasted period.
Working Capital
As licenses for the different domain names increase, so too will working capital. Because deferred
revenue increases as revenus increase, I expect the increases in working capital to be similar to the last twelve
months in terms of a percentage of revenue. Towards the end of the forecasting period, I expect this percentage
to increase as more IDN’s become a growing source of revenue.

Page | 15
Valuation
Market Approach
Comparable Companies Valuation
For the multiples chosen to compare against peers, VeriSign historically trades at a premium. The main factors
that supported this premium include:
● VeriSign has contracts with the largest corporations in the world and a very well know product globally.
When one thinks about creating a website, the first domain they think of is .com.
● Although the growth is low due to company maturity, VeriSign has significantly higher margins (about 4-
5x higher) in terms of operating income and free cash flow relative to the peer group.
● Over the past 5 years from the valuation date (01/25/16), VeriSign’s stock has increased by 131%. Only
Tucows (TCX) has outperformed VeriSign in terms of stock appreciation in that timeframe.
It appears that investors in this industry favor margins over growth, and going forward, I expect the higher margins
and cash generation of VeriSign relative to peers to continue. Because of the premium placed on margins, the
target multiples I will use are 14x 2016 Operating Income and 7.5x 2016 Revenue.
Based on the midpoint of the two multiples, cash and equivalents net debt of $29.5 million and 111.5 million
shares outstanding, I derive a target price of $77 per share using the market approach.
Multiple ’16 EBIT ($M)
2016 Multiple
Target EV ($M)
Target Price
Best Case
Worst Case
EV/EBIT $639.1 14.0x $8,977 $81 $91 $68
Multiple ‘16 Rev. ($M)
2016 Multiple
Target EV ($M)
Target Price
Best Case
Worst Case
EV/Revenue 1,096.0 7.5x $8,250 $74 $81 $64

Page | 16
Present Value of Growth Opportunity (PVGO) Analysis
To get a sense of how the growth expectations are reflected in the VeriSign’s stock price, I used the Present
Value of Growth Opportunity (PVGO) formula with the purpose of understanding how the growth expectations
compare to the market.
Share Price
2016 EPS
2016 EPS Growth
Cost of Equity ST Growth ST
Growth% PVGO PVGO%
VRSN $74.62 $3.96 12.7% 10.5% $37.71 50.5% $36.91 49.5% S&P 500 $1,877.08 $118.59 -0.2% 9.0% $1,317.67 70.2% $559.41 29.8%
Because the S&P 500 construction mainly includes companies that aren’t in the technology, media, or
telecommunication (TMT) space (over 86%), it is expected that a company that is a part of one of those sectors
will have a higher percentage of growth reflected beyond the next twelve months. VeriSign is no exception to this:
almost 50% of the growth expectations that are reflected in its stock price reflects growth that will happen after
fiscal year 2016. This result also shows that investors are expecting growth to stem from the new IDN’s and NIA
Services, which I do not believe neither will play a major role in the company mix until 2017. Because of this, I do
hold that too much of the price is based on long term growth though, as VeriSign already has nearly half the
domain market and it is unlikely that the new IDN’s will have a significant impact on revenue anytime soon.
However, consensus among equity research analysts indicates the coming year to be relatively flat in terms of
earnings growth in the overall market, while I am forecasting earnings for VeriSign to grow approximately 12.7%
in 2016. This is important to note since the PVGO of the market is usually around 30-40% at a growth rate of 8-
12%, which actually indicates that the S&P 500 might be overvalued itself and that investors will be willing to pay
a premium for any earnings growth in the near term. Based on these considerations, I conclude that VeriSign is
reasonably priced based on the growth expectations at time of valuation.
Income Approach
Cost of Capital
To calculate the WACC, I first calculated VeriSign’s cost of debt. Since VeriSign is given a BBB Credit Rating by
Morningstar, I decided to use the interest rate for a 10-year corporate bond with the same rating. On the date of
valuation, the interest rate was approximately 5%. Since I am forecasting a 26% tax rate throughout the period,
the after-tax cost of debt will be 3.7%. For the cost of equity, I used the CAPM formula against the S&P 500 over
the past 5 years with an average market return of 9% and using the 10-year US Treasury bond as the risk free
rate. With a beta of 1.22, the cost of equity will be 10.5%. With the market value of equity being 81.7% of the
enterprise value, I computed the WACC to be 9.3%.
Kd Wd Ke We WACC
3.7% 18.3% 10.5% 81.7% 9.3%
Page | 17
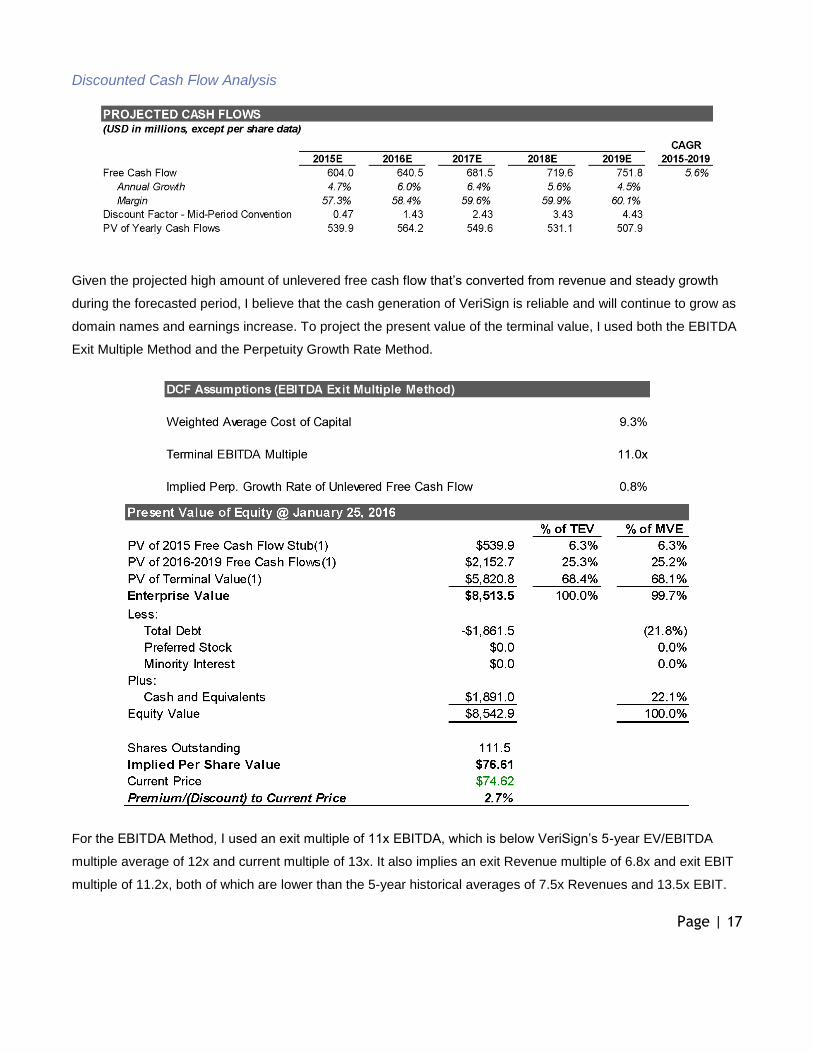
Discounted Cash Flow Analysis
Given the projected high amount of unlevered free cash flow that’s converted from revenue and steady growth
during the forecasted period, I believe that the cash generation of VeriSign is reliable and will continue to grow as
domain names and earnings increase. To project the present value of the terminal value, I used both the EBITDA
Exit Multiple Method and the Perpetuity Growth Rate Method.
For the EBITDA Method, I used an exit multiple of 11x EBITDA, which is below VeriSign’s 5-year EV/EBITDA
multiple average of 12x and current multiple of 13x. It also implies an exit Revenue multiple of 6.8x and exit EBIT
multiple of 11.2x, both of which are lower than the 5-year historical averages of 7.5x Revenues and 13.5x EBIT.
Page | 18
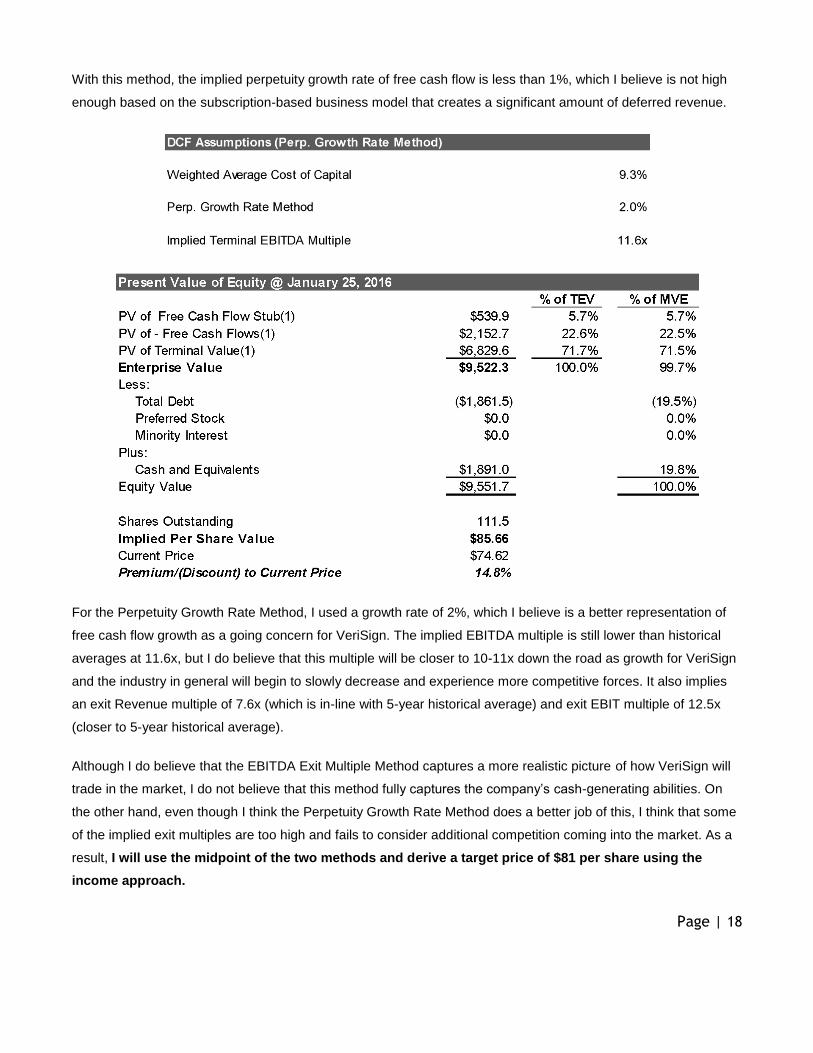
With this method, the implied perpetuity growth rate of free cash flow is less than 1%, which I believe is not high
enough based on the subscription-based business model that creates a significant amount of deferred revenue.
For the Perpetuity Growth Rate Method, I used a growth rate of 2%, which I believe is a better representation of
free cash flow growth as a going concern for VeriSign. The implied EBITDA multiple is still lower than historical
averages at 11.6x, but I do believe that this multiple will be closer to 10-11x down the road as growth for VeriSign
and the industry in general will begin to slowly decrease and experience more competitive forces. It also implies
an exit Revenue multiple of 7.6x (which is in-line with 5-year historical average) and exit EBIT multiple of 12.5x
(closer to 5-year historical average).
Although I do believe that the EBITDA Exit Multiple Method captures a more realistic picture of how VeriSign will
trade in the market, I do not believe that this method fully captures the company’s cash-generating abilities. On
the other hand, even though I think the Perpetuity Growth Rate Method does a better job of this, I think that some
of the implied exit multiples are too high and fails to consider additional competition coming into the market. As a
result, I will use the midpoint of the two methods and derive a target price of $81 per share using the
income approach.
Page | 19
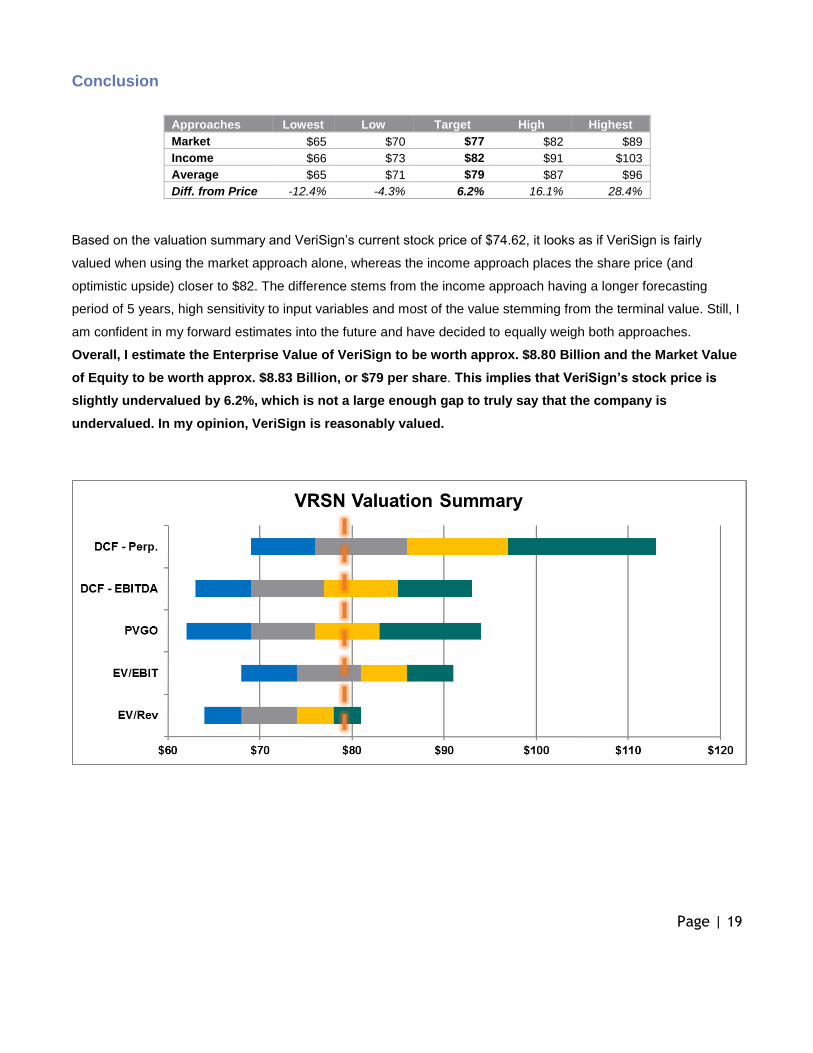
Conclusion
Approaches Lowest Low Target High Highest Market $65 $70 $77 $82 $89 Income $66 $73 $82 $91 $103 Average $65 $71 $79 $87 $96 Diff. from Price -12.4% -4.3% 6.2% 16.1% 28.4%
Based on the valuation summary and VeriSign’s current stock price of $74.62, it looks as if VeriSign is fairly
valued when using the market approach alone, whereas the income approach places the share price (and
optimistic upside) closer to $82. The difference stems from the income approach having a longer forecasting
period of 5 years, high sensitivity to input variables and most of the value stemming from the terminal value. Still, I
am confident in my forward estimates into the future and have decided to equally weigh both approaches.
Overall, I estimate the Enterprise Value of VeriSign to be worth approx. $8.80 Billion and the Market Value
of Equity to be worth approx. $8.83 Billion, or $79 per share. This implies that VeriSign’s stock price is
slightly undervalued by 6.2%, which is not a large enough gap to truly say that the company is
undervalued. In my opinion, VeriSign is reasonably valued.

Page | 20
Summary
Basis for Estimation
My estimated value of VeriSign stems from these factors:
● Compared to its peers and the industry as a whole, VeriSign has a track record of having consistently
higher margins and cash from operations, as well as increasing wealth through its various share
repurchase programs. The relatively lower risk associated with VeriSign explains why the stock usually
trades at a substantial premium to its peers, as well as why I expect this to continue. However, the
downside to the premium is that there is less room for multiple expansion, and any changes in the
perception of the .com and .net domain names could lead to a reversion to the mean.
● Over this fiscal year, VeriSign will more than likely increase its annual licensing fee for .net registries by
nearly 7% or its maximum limit each year. This will increase revenue since renewal rates won’t
dramatically change based on length of licensing contracts (1-10 years). I believe that the market has
accounted for this increase in pricing, as well as for the growth in e-commerce sales and internet usage
worldwide. The unknown factor that leads to a slightly higher valuation than the market is the growth in
IDN’s in the long run. If successful, the non-Latin versions of .com and .net could be a way to connect
with the emerging markets in the Asia-Pacific, which has the highest potential for internet growth.
● Because ICANN is planning on approving as many as 1300 new gTLDs within the next few years, I think
that the influx of options will lead to potential customers leaning on what they know best when registering
for websites, which is .com. Even in the event that the new gTLDs are a success, over 200 of the new
domain names will be serviced by VeriSign since they provide the infrastructure and security services
needed for domain names.
Page | 21
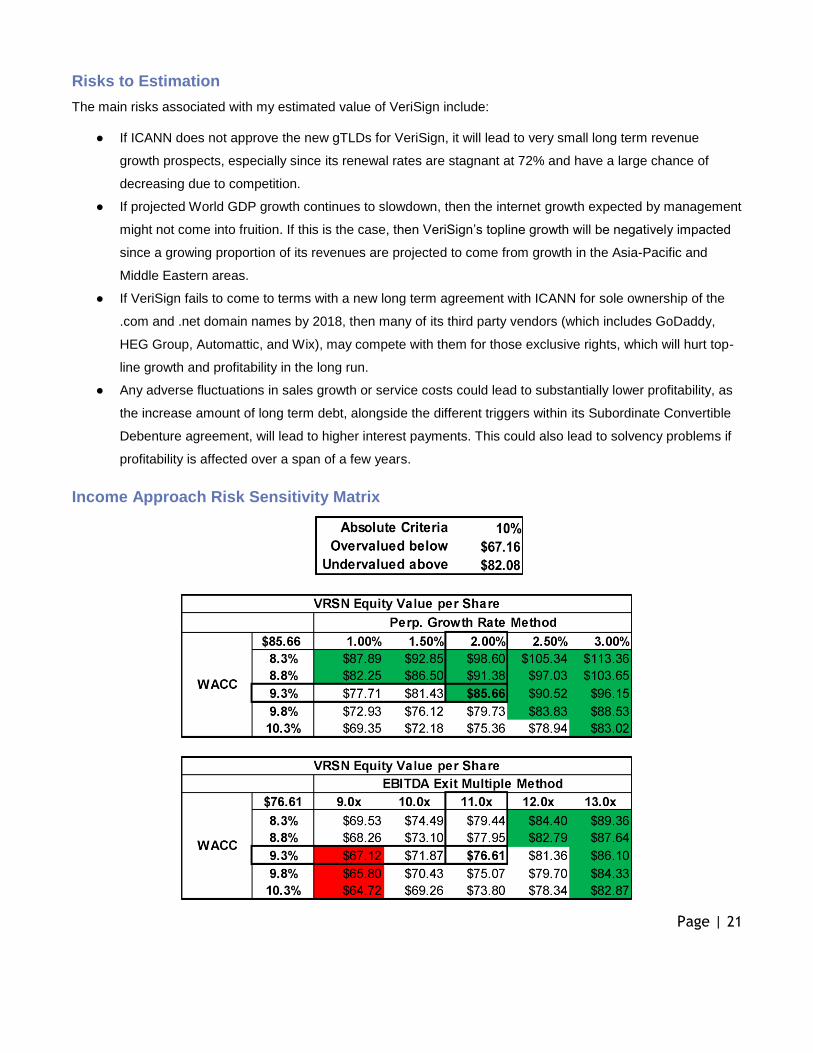
Risks to Estimation
The main risks associated with my estimated value of VeriSign include:
● If ICANN does not approve the new gTLDs for VeriSign, it will lead to very small long term revenue
growth prospects, especially since its renewal rates are stagnant at 72% and have a large chance of
decreasing due to competition.
● If projected World GDP growth continues to slowdown, then the internet growth expected by management
might not come into fruition. If this is the case, then VeriSign’s topline growth will be negatively impacted
since a growing proportion of its revenues are projected to come from growth in the Asia-Pacific and
Middle Eastern areas.
● If VeriSign fails to come to terms with a new long term agreement with ICANN for sole ownership of the
.com and .net domain names by 2018, then many of its third party vendors (which includes GoDaddy,
HEG Group, Automattic, and Wix), may compete with them for those exclusive rights, which will hurt top-
line growth and profitability in the long run.
● Any adverse fluctuations in sales growth or service costs could lead to substantially lower profitability, as
the increase amount of long term debt, alongside the different triggers within its Subordinate Convertible
Debenture agreement, will lead to higher interest payments. This could also lead to solvency problems if
profitability is affected over a span of a few years.
Income Approach Risk Sensitivity Matrix
Page | 22
Appendix
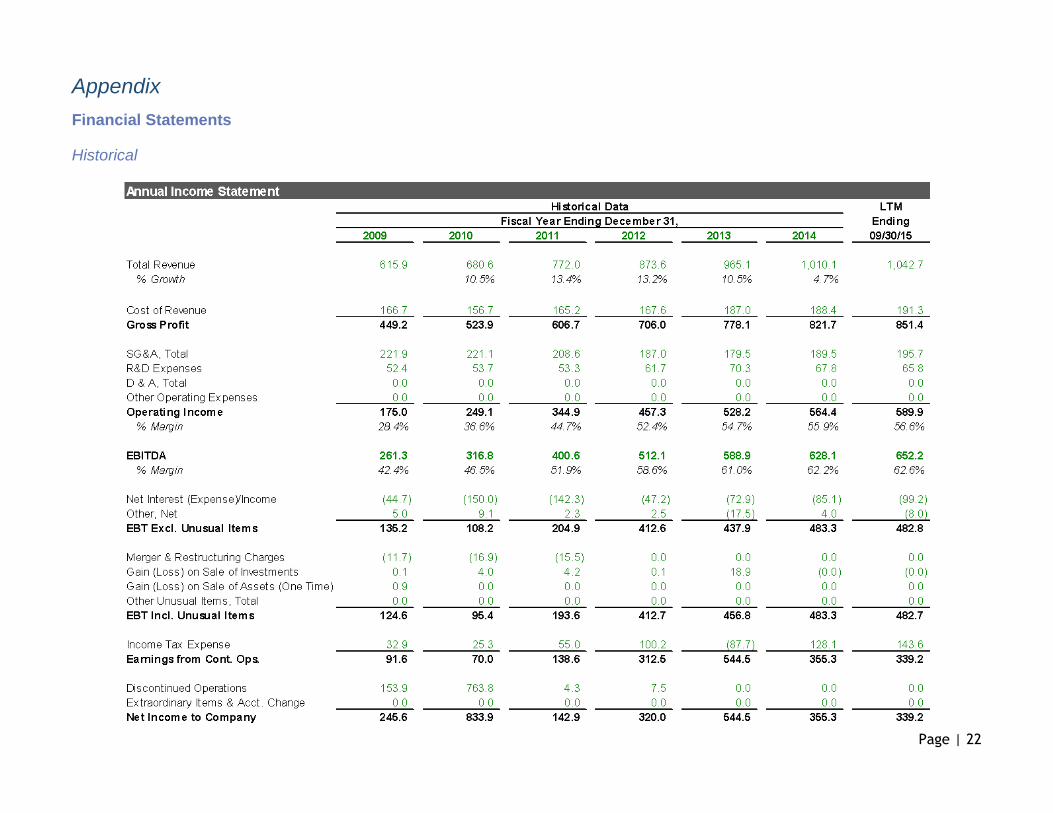
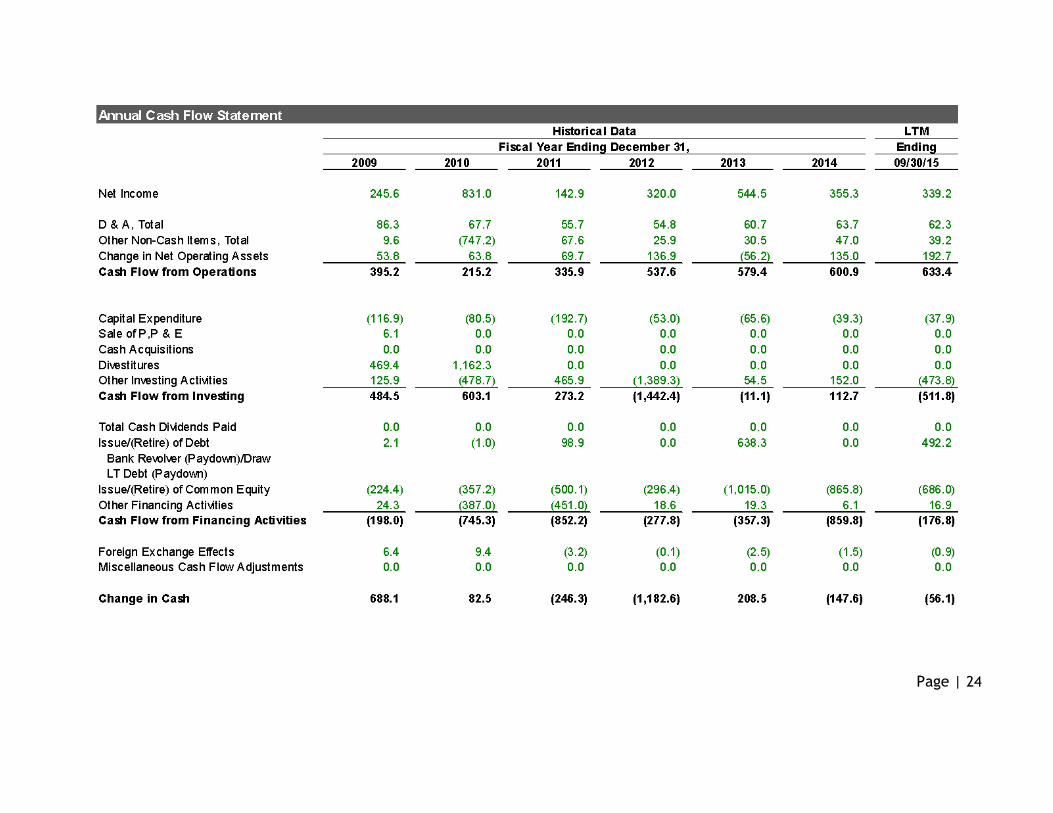
Financial Statements
Historical

Page | 23
Page | 24
Page | 25
Common-Sized

Page | 26

Page | 27
Projected

Page | 28

Page | 29

Page | 30

Page | 31
Comparable Company Analysis

Page | 32
Sources
● Bloomberg
● Capital IQ
● Morningstar
● Mahesh VC blog
● EDGAR Online for VeriSign’s and Competitors 10-K’s and 10-Q’s
● VeriSign’s Press Releases, Proxy Statement, Blog, and Investor Presentations
● ICANN
● Seeking Alpha Earnings Transcripts
● Zacks
● Wall St. Journal
● business2community blog
● theguardian blog
● JP Morgan Equity Research
● Topeka Capital Markets Equity Research
● CFA Institute
● Aswath Damodaran’s website and blog
● Hoovers
● KPCB’s 2015 Internet Trends Report
● “The Secrets of Economic Indicators” by Bernard Baumohl
● “Accounting for Value” by Stephen Penman