UNITED STATES DISTRICT COURT EMPLOYEES’ RETIREMENT SYSTEM, CLASS
Voluntary Benefits:What is controlling employees’ choices?A consumer research study for employee benefits plan sponsors
Sun Life Financial Employee Benefits Group
June 2011
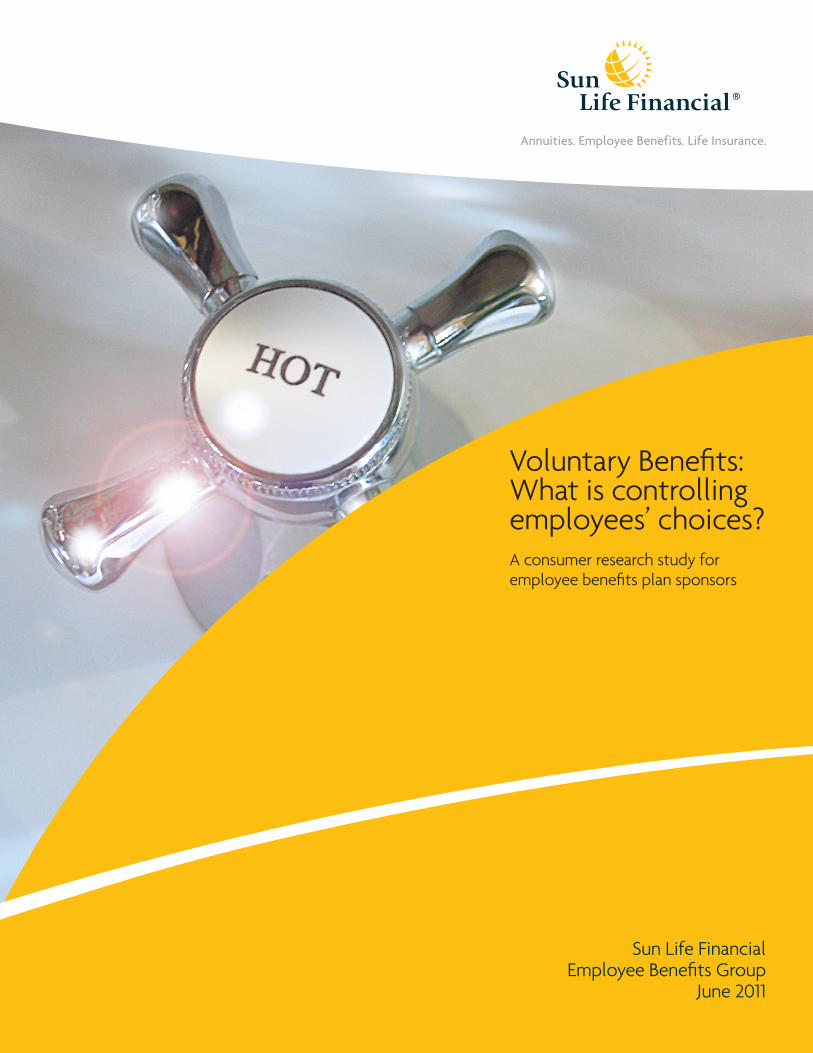
Indicators studied as part of this research:
Indicator ........................................................................................................Page
#1 Rising health insurance costs ..................................................................4-5
#2 Employee values ...........................................................................................6-7
#3 Method of learning .................................................................................... 8-9
#4 Enrollment method ..................................................................................... 10
#5 Reason for electing benefits ...................................................................... 11
#6 Employer funding......................................................................................12-13
#7 Benefits assistance ....................................................................................14-15
Sun Life Financial Employee Benefits Group Research Study

Survey objectives Sun Life Financial’s Employee Benefits Group conducted its third
annual research study focused on voluntary employee benefits.
As in previous years, this study focused on four key objectives:
• To determine which factors have the greatest impact on
whether an individual purchases voluntary benefits through
his or her employer;
• To identify how people want to learn about their benefits—
and from whom they want to learn about them;
• To find out if preferred methods of learning and certain methods
of enrollment lead to higher participation; and
• To probe a variety of other factors that might control how
employees elect, and make changes to, their benefits.
Survey overview While much of the research confirms results from our 2010 report “Voluntary Benefits: Key Factors Influencing
Employees’ Choices,” our latest survey revealed some interesting new findings, including:
1) When learning about benefits, getting assistance increased purchase rates—When asked how they preferred to
learn about benefits, the same number of survey participants used some type of assistance method, such as: one-
on-one consultations, benefit fairs, toll-free services and group meetings, versus a self-taught method, like going
online or reviewing printed materials. However, those who used assistance methods to learn about their benefits
were more likely to purchase or enroll in them.
2) When enrolling in benefits, getting assistance actually decreased purchase rates—When asked how they
preferred to enroll in their benefits, this year only 24% said they preferred to enroll using an assistance method,
like a one-on-one meeting with a benefits advisor. In fact, assistance methods of enrollment, when used on their
own, actually showed lower purchase rates for many benefits. In contrast, the two self-taught methods, online
and paper enrollment, resulted in the highest purchase rates. This new finding, which will continue to be tracked,
seems to suggest that employees preferred to get assistance when learning about benefits, but wanted to enroll
in benefits on their own.
In addition, this year’s survey findings seemed to suggest multicultural differences among respondents. In many
cases, the results revealed that different ethnic groups valued and purchased their benefits differently.
While this overview highlights just a few of the findings from our latest survey, overall results continued to
show that voluntary benefits are important to employees. The findings above suggest that along with offering
these benefits, providing self-enrollment materials and helping employees learn about your offerings, there
is an additional opportunity to consider employee preferences to make learning about and enrolling in these
benefits as easy as possible. At Sun Life Financial, we remain committed to reevaluating trends in employee
benefits and making the results readily available to you. We hope you find these latest insights helpful in
evaluating your own benefits program.
1Sun Life Financial Employee Benefits Group Research Study
Voluntary Benefits Definition
For the purposes of this
study, voluntary benefits
were defined as any benefits
offered through the
workplace for which the
employees either share in the
cost or pay the full cost.
Survey methodology
Primary Shared
33%
67%
Part Time
Full Time
90%
10%
Families & Singles with Children
Families & Singles without Children
60%
40%
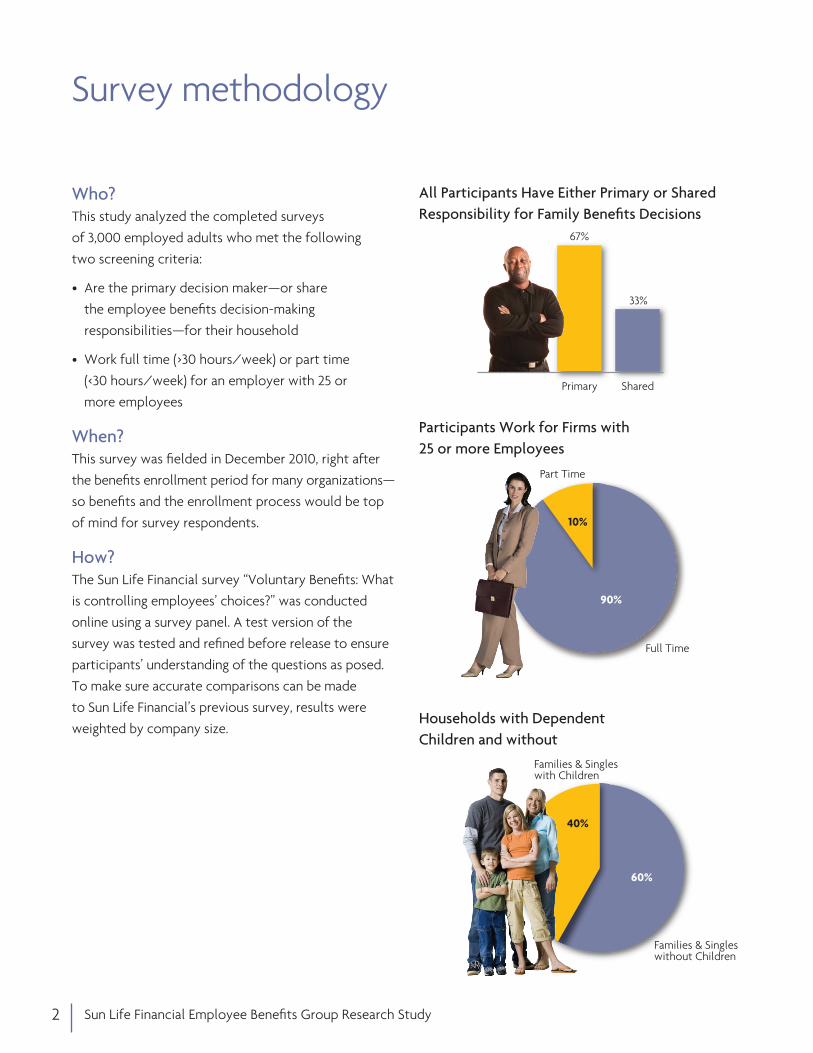
Who? This study analyzed the completed surveys
of 3,000 employed adults who met the following
two screening criteria:
• Are the primary decision maker—or share
the employee benefits decision-making
responsibilities—for their household
• Work full time (>30 hours/week) or part time
(<30 hours/week) for an employer with 25 or
more employees
When? This survey was fielded in December 2010, right after
the benefits enrollment period for many organizations—
so benefits and the enrollment process would be top
of mind for survey respondents.
How? The Sun Life Financial survey “Voluntary Benefits: What
is controlling employees’ choices?” was conducted
online using a survey panel. A test version of the
survey was tested and refined before release to ensure
participants’ understanding of the questions as posed.
To make sure accurate comparisons can be made
to Sun Life Financial’s previous survey, results were
weighted by company size.
2 Sun Life Financial Employee Benefits Group Research Study
All Participants Have Either Primary or Shared Responsibility for Family Benefits Decisions
Participants Work for Firms with 25 or more Employees
Households with Dependent Children and without

AffluentFamilies
ComfortableFamilies
Families & Singles with Children 40% Families & Singles without Children 60%
SustainingFamilies
Empty Nesters
Independents
13% 25% 35%19% 8%
Dependent Children
Education
Income
HomeOwnership
Marital Status
Age Range
Yes
Graduate/Post-College Graduate
>$100K
Own
Married
35–54
Yes
Some College/Graduated College
$50K–$99.9K
Own
Married
25–54
Yes
HS Graduate/Graduated College
<$50K
Mixed
Mixed
25–54
No
Graduated College
$25K–$100K
Mixed
Mixed
25–44
Affluent Families
No
Some College/College Graduate
$25K–$150K
Own
Married
45+
Empty NestersComfortable Families
SustainingFamilies Independents
Cluster analysis As part of our analysis, all data were organized by
demographic clusters, as highlighted below. These
clusters grouped participant responses based on a
combination of factors that are often thought to drive
benefits decisions—including age, marital status, home
ownership, income, education and whether or not
there were dependent children.
Wherever differences are significant across these
clusters, we’ll point that out in the following pages.
For example, ethnicity seemed to impact a few findings:
• more than 50% of the Hispanic participants indicated
that they have dependent children at home, and
• when compared to other ethnic groups, Hispanics
and African Americans had the largest share of
sustaining families.
PROFILE OF CLUSTERS ANALYZED FOR THIS STUDY
3Sun Life Financial Employee Benefits Group Research Study

01020304050607080
Cancel/decrease other insurance
Reduce spending in other areas
% Increase in Health Insurance Costs
5%
80%
70%
60%
50%
40%
30%
20%
10%
0%
15% 25% 35% 50%
% W
ho W
ould
Tak
e Sp
ecifi
c A
ctio
n
Eliminate/decrease contributions to their retirement plan
Cancel medical insurance
#1 RISING HEALTH INSURANCE COSTS
How will rising health insurance costs affect voluntary benefits decisions?With all the uncertainty around healthcare reform
and what the changes will mean for the future cost of
benefits, employees were asked what they would be
most likely to do if their out-of-pocket cost of health
insurance were to increase over a variety of levels,
including 5%, 15%, 25%, 35% and 50%.
Respondents were offered a choice of four options,
as detailed in the chart below. Following are some
key findings based on their responses:
At a 5% rise in health insurance costs, the majority or
70% of respondents still feel they can absorb the cost
difference of medical insurance by reducing spending
in other areas. However, this percentage continues to
decrease, falling from 84% in 2008 to 70% in 2010. Not
surprisingly, more households now feel they will be
forced to cancel or decrease other insurance benefits
to cover the increased cost of their medical benefits.
In fact, the percentage more than doubled from 6%
in 2008 to 15% in 2010.
Similar to last year, even with up to a 35% rise in health insurance costs, the majority still said they’d
reduce spending in other areas to address the increase.
When faced with a 50% increase in health insurance costs, the value of the benefit drops. In fact, 38% of
survey participants said they would actually cancel
their medical insurance. Yet, for the third consecutive
year, fewer than 20% of all survey participants said
they would neither cancel or decrease their other
insurance benefits if the cost of their health insurance
increased by 50%.
WHAT EMPLOYEES MAY DO IF HEALTH INSURANCE COSTS INCREASE
4 Sun Life Financial Employee Benefits Group Research Study
Respondents continue to value their non-medical insurance benefits, refusing to cancel or decrease them even if the cost of medical increases by 50%.
BENEFITS EMPLOYEES ARE MOST LIKELY TO KEEP/CANCEL
5Sun Life Financial Employee Benefits Group Research Study
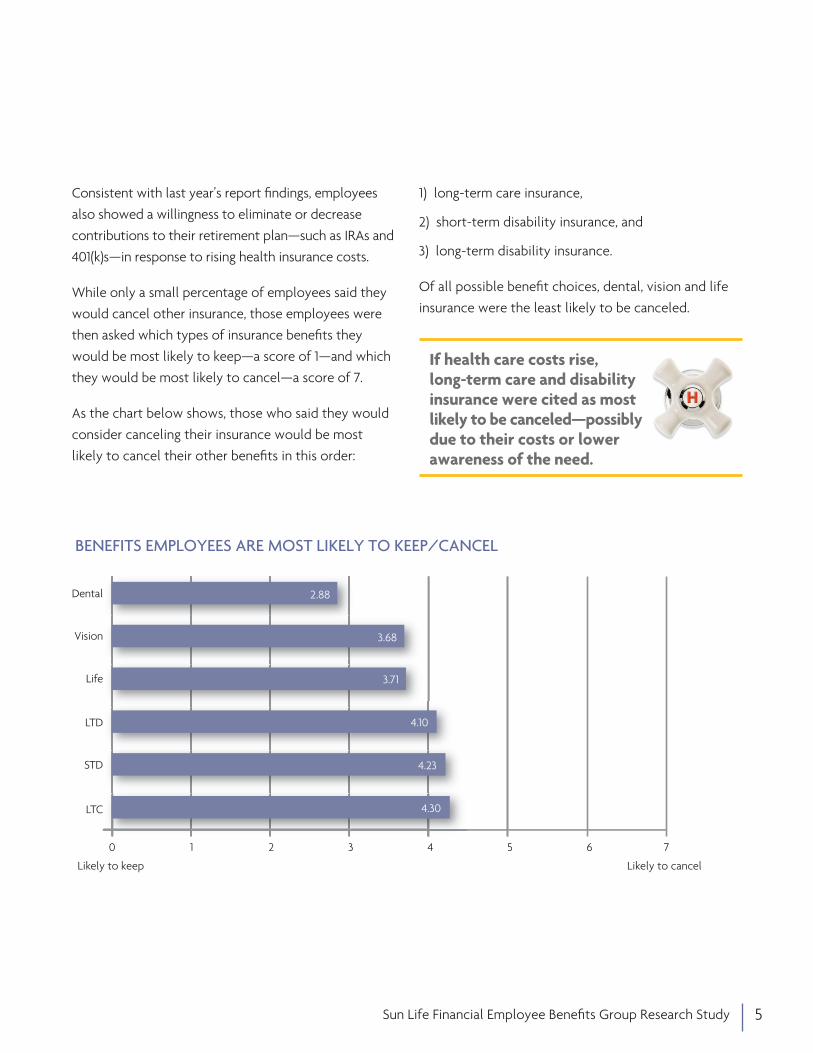
Consistent with last year’s report findings, employees
also showed a willingness to eliminate or decrease
contributions to their retirement plan—such as IRAs and
401(k)s—in response to rising health insurance costs.
While only a small percentage of employees said they
would cancel other insurance, those employees were
then asked which types of insurance benefits they
would be most likely to keep—a score of 1—and which
they would be most likely to cancel—a score of 7.
As the chart below shows, those who said they would
consider canceling their insurance would be most
likely to cancel their other benefits in this order:
1) long-term care insurance,
2) short-term disability insurance, and
3) long-term disability insurance.
Of all possible benefit choices, dental, vision and life
insurance were the least likely to be canceled.
0 1 2 3 4 5 76 0 1 2 3 4 5
Vision 3.68
Dental 2.88
LTD 4.10
Life 3.71
STD 4.23
LTC 4.30
Likely to keep Likely to cancel
If health care costs rise, long-term care and disability insurance were cited as most likely to be canceled—possibly due to their costs or lower awareness of the need.
% o
f Em
ploy
ees
Ass
igni
ng a
Poi
nt V
alue
> 0
86%86%
Dental
100%
80%
60%
40%
20%
0%Vision
77%77%
LTD
61%60%
STD
56%56%
Life
64%62%
LTC
46%46%
401(k)
77%76%
4446%%
Cash
32%38%
2009 2010
#2 EMPLOYEE VALUES
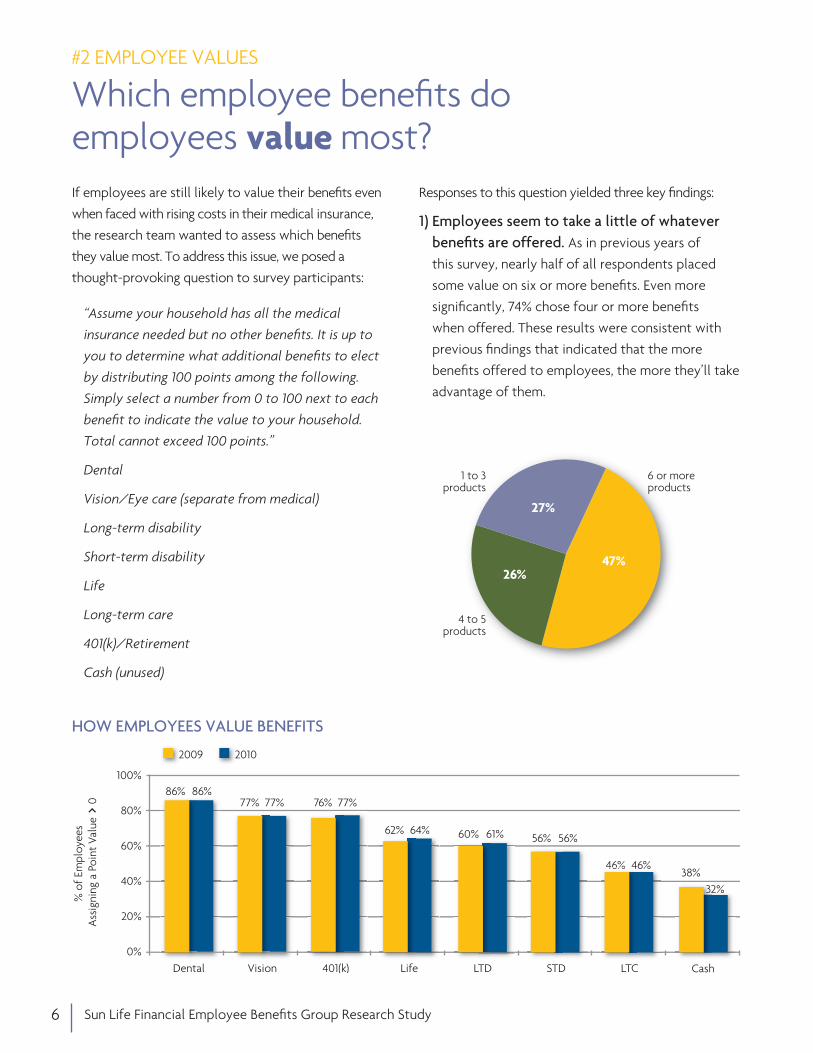
Which employee benefits do employees value most?If employees are still likely to value their benefits even
when faced with rising costs in their medical insurance,
the research team wanted to assess which benefits
they value most. To address this issue, we posed a
thought-provoking question to survey participants:
“Assume your household has all the medical
insurance needed but no other benefits. It is up to
you to determine what additional benefits to elect
by distributing 100 points among the following.
Simply select a number from 0 to 100 next to each
benefit to indicate the value to your household.
Total cannot exceed 100 points.”
Dental
Vision/Eye care (separate from medical)
Long-term disability
Short-term disability
Life
Long-term care
401(k)/Retirement
Cash (unused)
Responses to this question yielded three key findings:
1) Employees seem to take a little of whatever benefits are offered. As in previous years of
this survey, nearly half of all respondents placed
some value on six or more benefits. Even more
significantly, 74% chose four or more benefits
when offered. These results were consistent with
previous findings that indicated that the more
benefits offered to employees, the more they’ll take
advantage of them.
6 Sun Life Financial Employee Benefits Group Research Study
27%
47%26%
1 to 3products
4 to 5products
6 or more products
HOW EMPLOYEES VALUE BENEFITS
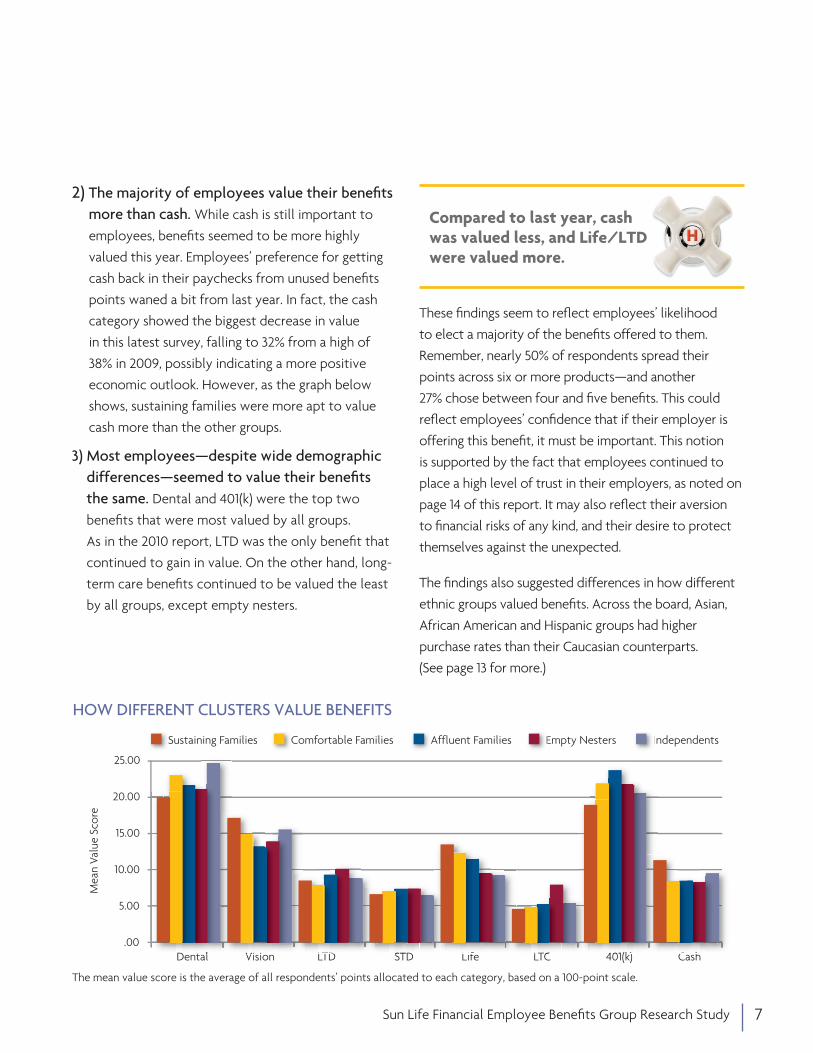
2) The majority of employees value their benefits more than cash. While cash is still important to
employees, benefits seemed to be more highly
valued this year. Employees’ preference for getting
cash back in their paychecks from unused benefits
points waned a bit from last year. In fact, the cash
category showed the biggest decrease in value
in this latest survey, falling to 32% from a high of
38% in 2009, possibly indicating a more positive
economic outlook. However, as the graph below
shows, sustaining families were more apt to value
cash more than the other groups.
3) Most employees—despite wide demographic differences—seemed to value their benefits the same. Dental and 401(k) were the top two
benefits that were most valued by all groups.
As in the 2010 report, LTD was the only benefit that
continued to gain in value. On the other hand, long-
term care benefits continued to be valued the least
by all groups, except empty nesters.
These findings seem to reflect employees’ likelihood
to elect a majority of the benefits offered to them.
Remember, nearly 50% of respondents spread their
points across six or more products—and another
27% chose between four and five benefits. This could
reflect employees’ confidence that if their employer is
offering this benefit, it must be important. This notion
is supported by the fact that employees continued to
place a high level of trust in their employers, as noted on
page 14 of this report. It may also reflect their aversion
to financial risks of any kind, and their desire to protect
themselves against the unexpected.
The findings also suggested differences in how different
ethnic groups valued benefits. Across the board, Asian,
African American and Hispanic groups had higher
purchase rates than their Caucasian counterparts.
(See page 13 for more.)
HOW DIFFERENT CLUSTERS VALUE BENEFITS
0
5
10
15
20
2525.00
20.00
15.00
10.00
5.00
.00
Mea
n Va
lue
Scor
e
Comfortable FamiliesCSustaining FamiliesS Affluent FamiliesA Empty NestersE IndependentsI
Vision LTD LTC CashSTD 401(k)Dental Life C hDt ll LTCC hhD 401(k)01(k)k)t l LifVi iVi ii LTDLTDD LTCC CCSTDTDSTTD 4001DD LiffVV LT LLL 44DDD LLL
7Sun Life Financial Employee Benefits Group Research Study
Compared to last year, cash was valued less, and Life/LTD were valued more.
The mean value score is the average of all respondents’ points allocated to each category, based on a 100-point scale.
As in past years of this survey, Sun Life Financial also
explored how employees want to learn about their
benefits and if those preferences impacted their
buying decisions.
First, employees were asked to indicate all the ways
they could have learned about their benefits and
which methods they preferred. They were also asked
how much time they spent reviewing information on
different benefits and what impact that had on their
decision to purchase. Following are four key findings:
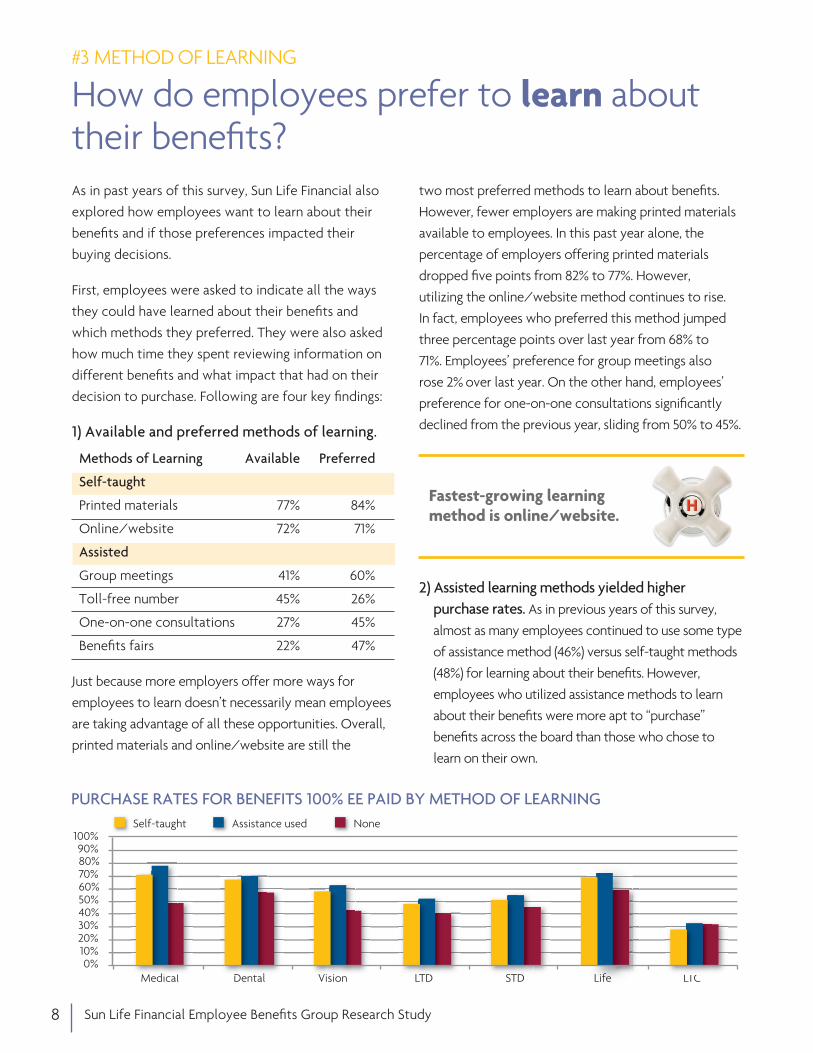
1) Available and preferred methods of learning.
Methods of Learning Available Preferred
Self-taught
Printed materials 77% 84%
Online/website 72% 71%
Assisted
Group meetings 41% 60%
Toll-free number 45% 26%
One-on-one consultations 27% 45%
Benefits fairs 22% 47%
Just because more employers offer more ways for
employees to learn doesn’t necessarily mean employees
are taking advantage of all these opportunities. Overall,
printed materials and online/website are still the
two most preferred methods to learn about benefits.
However, fewer employers are making printed materials
available to employees. In this past year alone, the
percentage of employers offering printed materials
dropped five points from 82% to 77%. However,
utilizing the online/website method continues to rise.
In fact, employees who preferred this method jumped
three percentage points over last year from 68% to
71%. Employees’ preference for group meetings also
rose 2% over last year. On the other hand, employees’
preference for one-on-one consultations significantly
declined from the previous year, sliding from 50% to 45%.
2) Assisted learning methods yielded higher purchase rates. As in previous years of this survey,
almost as many employees continued to use some type
of assistance method (46%) versus self-taught methods
(48%) for learning about their benefits. However,
employees who utilized assistance methods to learn
about their benefits were more apt to “purchase”
benefits across the board than those who chose to
learn on their own.
#3 METHOD OF LEARNING
How do employees prefer to learn about their benefits?
8 Sun Life Financial Employee Benefits Group Research Study
01020304050607080
80%70%
90%100%
60%50%40%30%20%10%0%
Self-taught Assistance used None
Dental Vision LifeLTD LTCMedical STDD Cl Dt lt l LifeDD CCM di li l DDDD Vi ii i LTDLTD LTCLTCMM d STST
PURCHASE RATES FOR BENEFITS 100% EE PAID BY METHOD OF LEARNING
Fastest-growing learning method is online/website.
0
20
40
60
80
100100%
90%
80%
70%
60%
50%
40%
30%
20%
10%
0%
Did not reviewD <15 minutes< 15-30 minutes1 30-60 minutes3 >1 hour>
STDDentalMedical LTCLifeVision LTD
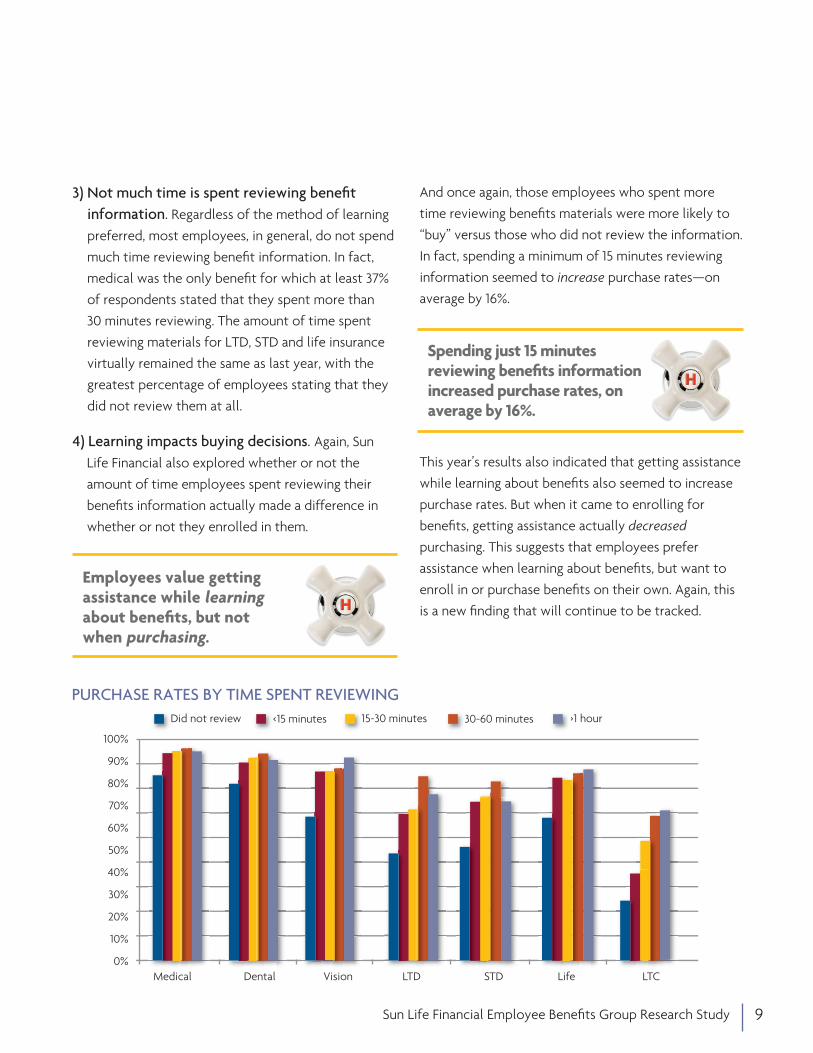
3) Not much time is spent reviewing benefit information. Regardless of the method of learning
preferred, most employees, in general, do not spend
much time reviewing benefit information. In fact,
medical was the only benefit for which at least 37%
of respondents stated that they spent more than
30 minutes reviewing. The amount of time spent
reviewing materials for LTD, STD and life insurance
virtually remained the same as last year, with the
greatest percentage of employees stating that they
did not review them at all.
4) Learning impacts buying decisions. Again, Sun
Life Financial also explored whether or not the
amount of time employees spent reviewing their
benefits information actually made a difference in
whether or not they enrolled in them.
And once again, those employees who spent more
time reviewing benefits materials were more likely to
“buy” versus those who did not review the information.
In fact, spending a minimum of 15 minutes reviewing
information seemed to increase purchase rates—on
average by 16%.
This year’s results also indicated that getting assistance
while learning about benefits also seemed to increase
purchase rates. But when it came to enrolling for
benefits, getting assistance actually decreased
purchasing. This suggests that employees prefer
assistance when learning about benefits, but want to
enroll in or purchase benefits on their own. Again, this
is a new finding that will continue to be tracked.
PURCHASE RATES BY TIME SPENT REVIEWING
9Sun Life Financial Employee Benefits Group Research Study
Employees value getting assistance while learning about benefits, but not when purchasing.
Spending just 15 minutes reviewing benefits information increased purchase rates, on average by 16%.

10 Sun Life Financial Employee Benefits Group Research Study
#4 ENROLLMENT METHOD
Which enrollment method is most preferred and used by employees? Employers utilize several different methods to make
it easy for employees to enroll in the benefits they
want. For purposes of this survey, enrollment
methods included:
• Online/website • Paper form
• One-on-one meeting • Toll-free number
• Other
According to our survey results this year, online
enrollment surpassed paper enrollment and continues
to grow. In fact, utilization of online enrollment far
outpaces all other methods as it rose from 43% to 48%
in just one year, while paper form enrollment dropped
from 48% to 43% during the same period. Our survey
results also indicated that online enrollment is now
preferred by 54% of respondents, a significant increase
over 2008 and 2009. Employees’ preference for one-on-
one and paper form enrollment methods, by contrast,
has steadily declined.
There were also a couple of interesting findings to note
about the ways in which employees preferred to enroll.
1) I’ll make my own decisions... When asked how
they would like to handle the question of which
benefits to enroll in, 52% said they preferred to just be
given the descriptions and they’ll make the decision of
whether or not to enroll—by themselves. Although this
number is down slightly from last year, empty nesters
were still significantly more likely to prefer this method
than other segments.
2) And I’ll enroll on my own too. This year fewer
respondents said they preferred to enroll in benefits
through a one-on-one meeting with a benefits advisor
versus respondents of last year’s study. In fact,
one-on-one enrollment methods alone actually
showed lower purchase rates for many of the benefits.
The two methods that resulted in the least interaction
with a third party, online and paper enrollment,
resulted in the highest purchase rates.
When looking at preferences across demographics,
online/website is the most preferred method and is most
prevalent with affluent families. Sustaining families and
empty nesters are the two groups that seem most open
to meeting one-on-one with a benefits advisor.
0
10
20
30
40
50
50%
40%
30%
20%
10%
0%
20092 20102
Paper enrollment
form
One-on-one meeting
Toll-free number
Online/website
Noneof theabove
METHOD USED FOR ENROLLING
Online enrollment surpassed paper forms as the preferred method of enrollment.
11
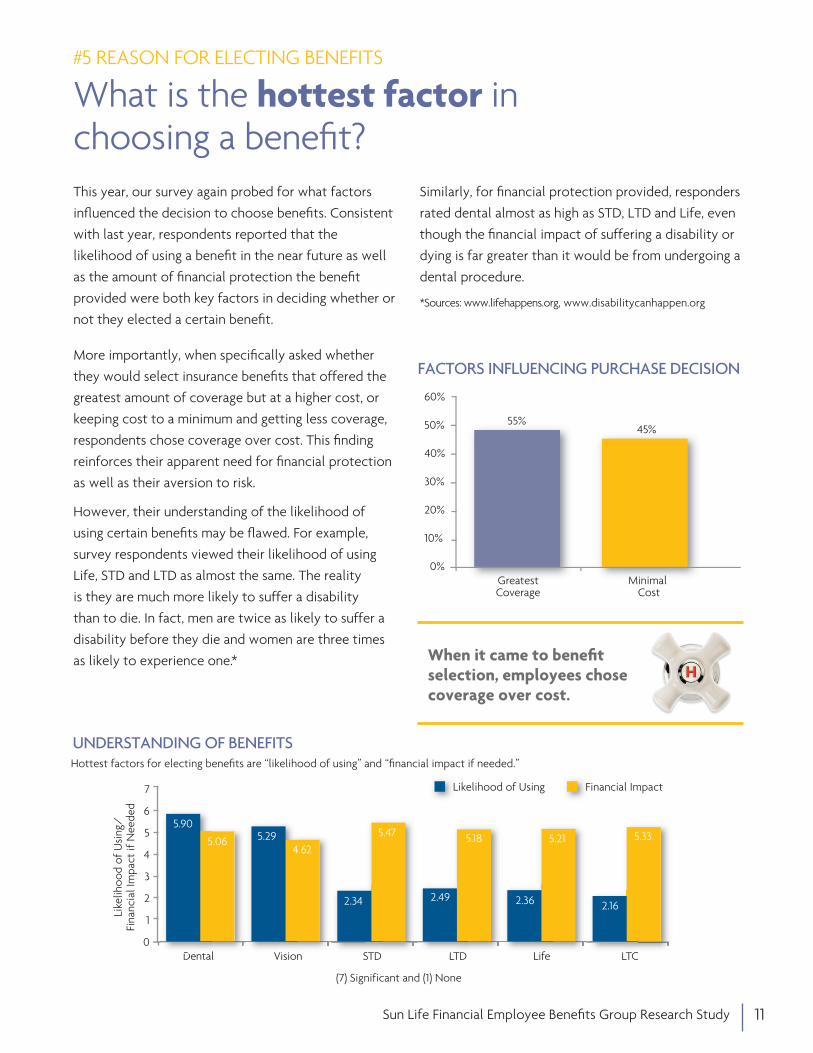
This year, our survey again probed for what factors
influenced the decision to choose benefits. Consistent
with last year, respondents reported that the
likelihood of using a benefit in the near future as well
as the amount of financial protection the benefit
provided were both key factors in deciding whether or
not they elected a certain benefit.
More importantly, when specifically asked whether
they would select insurance benefits that offered the
greatest amount of coverage but at a higher cost, or
keeping cost to a minimum and getting less coverage,
respondents chose coverage over cost. This finding
reinforces their apparent need for financial protection
as well as their aversion to risk.
However, their understanding of the likelihood of
using certain benefits may be flawed. For example,
survey respondents viewed their likelihood of using
Life, STD and LTD as almost the same. The reality
is they are much more likely to suffer a disability
than to die. In fact, men are twice as likely to suffer a
disability before they die and women are three times
as likely to experience one.*
Similarly, for financial protection provided, responders
rated dental almost as high as STD, LTD and Life, even
though the financial impact of suffering a disability or
dying is far greater than it would be from undergoing a
dental procedure.
*Sources: www.lifehappens.org, www.disabilitycanhappen.org
7.006.005.004.003.002.001.00
2.169 2.343 2.151
0
1
2
3
4
5
6
7
6
5
4
3
2
1
0Dental
LTD STD Life
Life LTC
30.00
25.00
20.00
15.00
10.00
5.00
.00
26.96
FinancialProtection Provided
Likelihood of Using in the Near Future
Advice from Family Members
and/or ThirdParty
Informationfrom YourEmployer
News Headlinesand Advertising
Familiarity with the Insurance
Provider
28.13
8.68
21.15
3.00
12.07
Likelihood of using: (7) significant and (1) is none.
Like
lihoo
d of
Usi
ng/
Fina
ncia
l Im
pact
if N
eede
d
l LTCD tt LifLif LTC
5.90
5.06
VisionVi iVi i
5.294.62
LTDLTDLLTD
2.49
5.18
2.36 2.16
5.335.21
STDSTDSTD
2.34
5.47
Likelihood of UsingL Financial ImpactF
(7) Significant and (1) None
#5 REASON FOR ELECTING BENEFITS
What is the hottest factor in choosing a benefit?
UNDERSTANDING OF BENEFITS
When it came to benefit selection, employees chose coverage over cost.
Hottest factors for electing benefits are “likelihood of using” and “financial impact if needed.”
FACTORS INFLUENCING PURCHASE DECISION
Sun Life Financial Employee Benefits Group Research Study
0
10
20
30
40
50
60 60%
50%
40%
30%
20%
10%
0%Minimal
CostMinimalGreatest
Coverage
55%45%

0
10
20
30
40
40%
30%
20%
10%
0%
2009 Funding
2008Funding
2010Funding
Medical
13%
17%14%
Dental
13%16%
14%
Vision
13%
18%
14%
LTD
25%22%
25%
STD
27%30% 29%
Life
32%33% 33%
LTC
12%
17% 16%
0
20
40
60
80
10040%
30%
20%
10%
0%
Dental Dental Vision LTD STD LTCLife
09 Shared 09 100% EE Paid
90%
69%
78%
55%
66%68%
48% 30%
77%
66%
45%
31%
#6 EMPLOYER FUNDING
Does employer funding influence higher benefits election? Again this year we surveyed employees about their
attitudes around funding their benefits to see if
changes in this area, as well as the general economy,
had impacted their thinking.
To be able to accurately test this idea, our research
team ensured that the study included three different
funding scenarios:
• 100% employer paid,
• 100% employee paid, and
• some level of cost sharing.
Following are some key findings related to
employer funding.
Increase in Benefits Offered at 100% Employer Paid
Compared to the 2010 report, this year’s results
indicate that there’s been an increase across the board
in benefits that were offered at 100% employer paid.
While results show the greatest increases occurred in
LTD and LTC benefits, 100% employer-paid benefits
overall are still at, or below, 2008 levels.
Moreover, results showed that employers are more
likely to share the cost of benefits with employees.
Although some shifting in how benefits are funded has
occurred in the last year, most of this shift appears
to be from an employer-paid model to a shared-cost
model—not to 100% employee funded.
On an even more encouraging note, the survey
indicated that refusal rates have dropped across the
board over last year. This may indicate stabilizing in
the market and possibly a renewed sense of employee
confidence. In fact, refusal rates for most benefits
receded to 2008 levels. Specifically, refusal rates for
medical, vision and life insurance all declined sharply.
Refusal rates, however, for LTC and LTD remained the
highest at 54% and 31%, respectively. But refusal rates
for vision significantly decreased by 4% over last year.
Holding Steady with Employee-Paid Benefits The percentage of households that were asked to pay
100% of benefits remained fairly consistent with 2010’s
report results. On average employees will still elect
benefits—even if they have to pay 100% of the cost.
PERCENTAGE OFFERED AT 100% EMPLOYER PAID
12 Sun Life Financial Employee Benefits Group Research Study
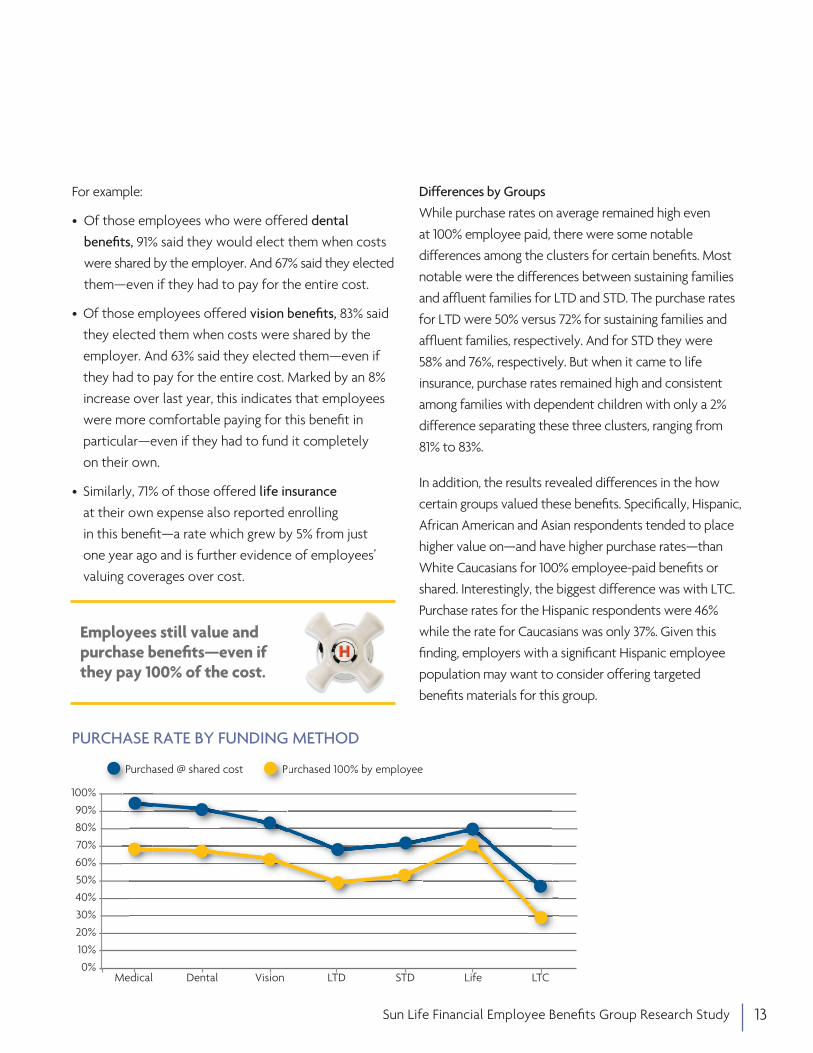
For example:
• Of those employees who were offered dental benefits, 91% said they would elect them when costs
were shared by the employer. And 67% said they elected
them—even if they had to pay for the entire cost.
• Of those employees offered vision benefits, 83% said
they elected them when costs were shared by the
employer. And 63% said they elected them—even if
they had to pay for the entire cost. Marked by an 8%
increase over last year, this indicates that employees
were more comfortable paying for this benefit in
particular—even if they had to fund it completely
on their own.
• Similarly, 71% of those offered life insurance
at their own expense also reported enrolling
in this benefit—a rate which grew by 5% from just
one year ago and is further evidence of employees’
valuing coverages over cost.
Differences by Groups While purchase rates on average remained high even
at 100% employee paid, there were some notable
differences among the clusters for certain benefits. Most
notable were the differences between sustaining families
and affluent families for LTD and STD. The purchase rates
for LTD were 50% versus 72% for sustaining families and
affluent families, respectively. And for STD they were
58% and 76%, respectively. But when it came to life
insurance, purchase rates remained high and consistent
among families with dependent children with only a 2%
difference separating these three clusters, ranging from
81% to 83%.
In addition, the results revealed differences in the how
certain groups valued these benefits. Specifically, Hispanic,
African American and Asian respondents tended to place
higher value on—and have higher purchase rates—than
White Caucasians for 100% employee-paid benefits or
shared. Interestingly, the biggest difference was with LTC.
Purchase rates for the Hispanic respondents were 46%
while the rate for Caucasians was only 37%. Given this
finding, employers with a significant Hispanic employee
population may want to consider offering targeted
benefits materials for this group.
100%
10%
20%
30%
40%
50%
60%
70%
80%
90%
0%Medical
Purchased @ shared cost Purchased 100% by employee
Dental Vision LTD STD Life LTC0
20
40
60
80
100PuP PuP
PURCHASE RATE BY FUNDING METHOD
13Sun Life Financial Employee Benefits Group Research Study
Employees still value and purchase benefits—even if they pay 100% of the cost.

05
101520253035404545%
40%
35%
30%
25%
20%
15%
10%
5%
0%
20082 20092 20102
EmployerSpouse/Family
FinancialAdvisor/
Broker
Insurer/Carrier
OtherFriend/Colleague
No One/Myself
#7 BENEFITS ASSISTANCE
Whom do employees trust most to explain and help select their benefits?Just as in the 2010 report, we explored whom employees
would trust most to explain their coverage and even help
select their benefits.
The new data suggests that employees trust their
employer most to explain coverages to them. In fact, 38%
of respondents in the survey said they would turn to their
employer for coverage explanations. In addition, their
preference to seek those explanations from their benefit
carrier or insurer has declined from previous years.
There was also a shift this year when it came to whom
employees would trust to actually help them select
benefits. Last year, spouse/family was ranked highest at
25%. But this year, that percentage fell by a couple
of points, while seeking advice from their employer
grew by 3%.
Although fewer than 10% of respondents turned to their
financial advisor/broker for help last year, in this year’s
survey, their trust for this resource seemed to grow a
bit more when it came to both explaining and selecting
benefits. While only 6% sought explanations from their
broker last year, 8% said they would turn to them in this
year’s survey. Likewise, last year only 9% said they would
seek their help when selecting benefits, but this year 11%
said they trusted them most to help them select benefits.
WHOM DO EMPLOYEES TRUST TO EXPLAIN COVERAGES?
14 Sun Life Financial Employee Benefits Group Research Study
Respondents trusted employers most to explain coverage, even more than last year.
05
101520253035404545%
40%
35%
30%
25%
20%
15%
10%
5%
0%
20082 20092 20102
EmployerSpouse/Family
FinancialAdvisor/
Broker
Insurer/Carrier
OtherFriend/Colleague
No One/Myself
30%25%20%15%10%5%0%
Comfortable FamiliesCSustaining FamiliesS Affluent FamiliesA Empty NestersE IndependentsI
05
1015202530354045
EmployerSpouse/Family
FinancialAdvisor/
Broker
Insurer/Carrier
OtherFriend/Colleague
No One/Myself
15Sun Life Financial Employee Benefits Group Research Study
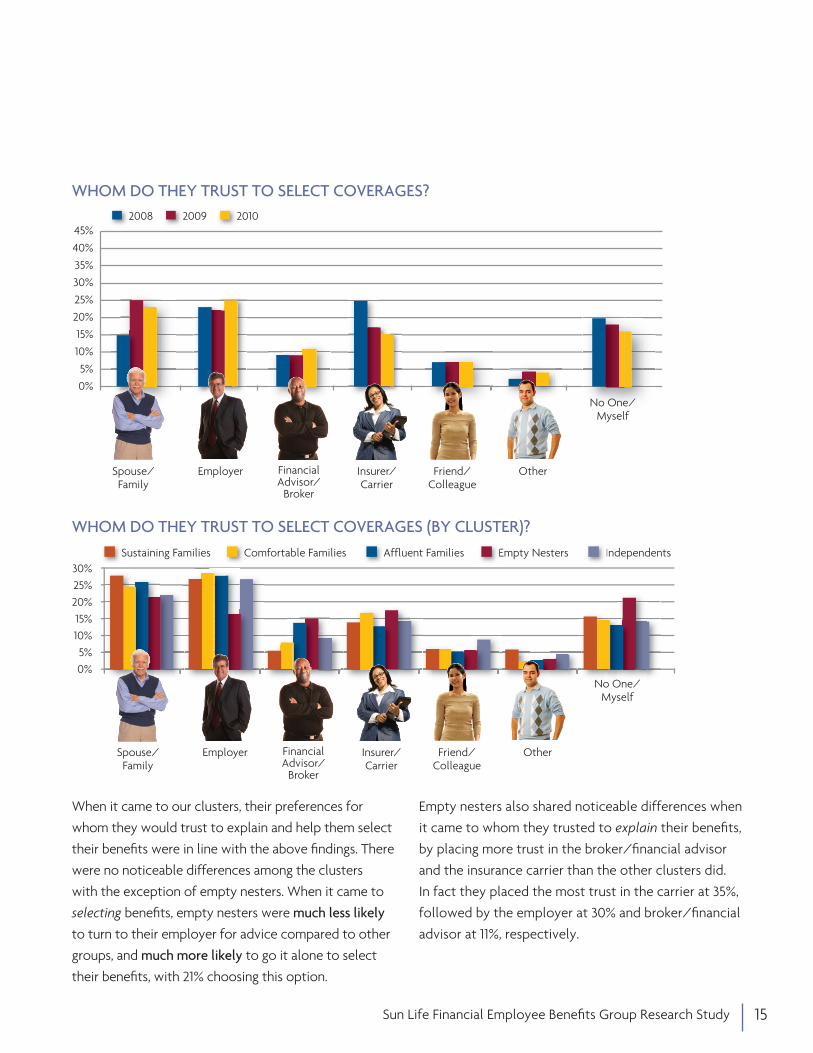
WHOM DO THEY TRUST TO SELECT COVERAGES?
WHOM DO THEY TRUST TO SELECT COVERAGES (BY CLUSTER)?
When it came to our clusters, their preferences for
whom they would trust to explain and help them select
their benefits were in line with the above findings. There
were no noticeable differences among the clusters
with the exception of empty nesters. When it came to
selecting benefits, empty nesters were much less likely
to turn to their employer for advice compared to other
groups, and much more likely to go it alone to select
their benefits, with 21% choosing this option.
Empty nesters also shared noticeable differences when
it came to whom they trusted to explain their benefits,
by placing more trust in the broker/financial advisor
and the insurance carrier than the other clusters did.
In fact they placed the most trust in the carrier at 35%,
followed by the employer at 30% and broker/financial
advisor at 11%, respectively.
We hope you found the highlights from Sun Life Financial Employee Benefits Group Research Study
interesting. We hope you’ll leverage them to enhance your voluntary benefits offerings and your
employees’ appreciation for and participation in your program.
Recognize that employees value voluntary benefits. Don’t assume employees will cancel supplemental benefits to compensate for rising health
insurance costs. While that may be true for some employees, the survey showed that certain
benefits, regardless of funding, are still important to employees. Continue to offer those benefits
that they value most.
Offer employees assistance with learning about benefits. But let them enroll on their own. The employees in this survey relied on self-taught methods as well as assistance methods
almost equally to learn about benefits. But those who used assistance had a much higher
purchase rate versus those who learned about benefits on their own. When it came to actually
enrolling in/purchasing benefits, those who used assistance methods, however, had lower
purchasing rates than those who enrolled on their own. Consider assistance to help employees
learn about your benefits. But, for enrollment, offer employees a “do it yourself” option.
Use online methods to educate and enroll. Utilizing online/websites to learn about and enroll in benefits has continued to grow. In fact,
online/website usage now exceeds paper forms as the preferred method of enrollment. Partner
with carriers who offer online communications and enrollment.
Encourage employees to review benefit materials. Results showed that the more time employees spent reviewing materials, the more likely they
were to enroll. In fact, just spending 15 minutes seemed to significantly increase the likelihood of
purchasing benefits. And to make this 15 minutes more meaningful, look to partner with carriers
who take a simplified, plain language approach to their benefits materials.
Stress the need for disability protection. Employees’ lack of understanding for disability insurance continued. In fact, as we revealed last
year, they continue to rate the financial protection provided by dental benefits almost as high
as disability benefits even though the financial impact of a dental procedure is far less than the
potential loss of income due to disability. Raise awareness of the serious risk disability poses.
Perhaps refer employees to third-party tools such as those available from Council for Disability
Awareness at www.disabilitycanhappen.org.
Recognize needs of different employee groups. This year’s study revealed multicultural differences in responses among ethnic groups. In fact,
results showed that different ethnic groups had higher purchase rates for benefits than their
Caucasian counterparts. Consider partnering with carriers who offer multicultural support.
16 Sun Life Financial Employee Benefits Group Research Study

Thanks for your interest in our 2011 research study.
Translate this information into action by contacting your benefits broker today.
One Sun Life Executive Park • Wellesley Hills, MA 02481 www.sunlife.com/us
GVMPBCH-1322 SPLC234256/11(exp.6/13)
1.TheSunLifeFinancialgroupofcompaniesoperatesunderthe“SunLifeFinancial”name.SunLifeFinancialInc.,thepubliclytradedholdingcompanyfortheSunLifeFinancialgroupofcompanies,isnotaninsurancecompany.IntheUnitedStatesandelsewhere,insuranceproductsareofferedbymembersoftheSunLifeFinancialgroupthatareinsurancecompanies.Theseinsurancecompanysubsidiariesofferproductswithguarantees,thatrelyontheissuingcompany’sfinancialstrengthandclaims-payingability.
2.MutualfundsareofferedthroughMFSInvestmentManagement.®
ResearchsponsoredbySunLifeFinancialEmployeeBenefitsGroupandfieldedbytheresearchdivisionofGenRe.
GroupinsurancepoliciesareunderwrittenbySunLifeAssuranceCompanyofCanada(WellesleyHills,MA)inallstates,exceptNewYork,underPolicyFormSeries93P-LH,98P-ADD,02-SL,07-SL,01C-LH-PT,GP-AandGC-A.InNewYork,groupinsurancepoliciesareunderwrittenbySunLifeInsuranceandAnnuityCompanyofNewYork(NewYork,NY)underPolicyFormSeries93P-LH-NY,02P-NYSTD,98P-ADD-NY,02-NYSL,07-NYSL,01NYC-LH-PT,GP-AandGC-A.Productofferingsmaynotbeavailableinallstatesandmayvarydependingonstatelawsandregulations.
©2011SunLifeAssuranceCompanyofCanada,WellesleyHills,MA02481.Allrightsreserved.SunLifeFinancialandtheglobesymbolareregisteredtrademarksofSunLifeAssuranceCompanyofCanada.Visitusatwww.sunlife.com/us.
Get to know Sun Life Financial1
We understand your need for financial independence and security throughout your life.
Count on us—and take advantage of our more than 145 years of consistent financial strength and a strong global presence.
Partner with us—and enjoy straightforward communications, simple business transactions, and timely service that addresses your needs.
Grow with us—and tap into our broad array of innovative solutions for you, your family, and your business.
As a leading provider of annuities, employee benefits, life insurance, and mutual funds, we are one of the oldest and largest financial services organizations worldwide.2