Volume 8 Number 16 28 April 2016 Pages 3273–3398 ... · Analytical Methods ISSN 1759-9660 PAPER...
11
Analytical Methods www.rsc.org/methods ISSN 1759-9660 PAPER J. O. Tegenfeldt et al. Simplifying microfluidic separation devices towards field-detection of blood parasites Volume 8 Number 16 28 April 2016 Pages 3273–3398
Transcript of Volume 8 Number 16 28 April 2016 Pages 3273–3398 ... · Analytical Methods ISSN 1759-9660 PAPER...

Analytical Methodswww.rsc.org/methods
ISSN 1759-9660
PAPERJ. O. Tegenfeldt et al.Simplifying microfl uidic separation devices towards fi eld-detection of blood parasites
Volume 8 Number 16 28 April 2016 Pages 3273–3398

AnalyticalMethods
PAPER
Ope
n A
cces
s A
rtic
le. P
ublis
hed
on 0
8 M
arch
201
6. D
ownl
oade
d on
31/
05/2
016
12:0
0:02
. T
his
artic
le is
lice
nsed
und
er a
Cre
ativ
e C
omm
ons
Attr
ibut
ion
3.0
Unp
orte
d L
icen
ce.
View Article OnlineView Journal | View Issue
Simplifying micro
aDivision of Solid State Physics, NanoLund
Lund, Sweden. E-mail: jonas.tegenfeldt@f
46 222 8063bWelcome Trust Centre for Medical Parasito
Inammation, College of Medical, Veterinary
UK
† Electronic supplementary informa10.1039/c6ay00443a
Cite this: Anal. Methods, 2016, 8, 3291
Received 14th February 2016Accepted 20th February 2016
DOI: 10.1039/c6ay00443a
www.rsc.org/methods
This journal is © The Royal Society of C
fluidic separation devices towardsfield-detection of blood parasites†
S. H. Holm,a J. P. Beech,a M. P. Barrettb and J. O. Tegenfeldt*a
With our sights set on a simple and inexpensive diagnostics device based on extraction and enrichment of
parasites from human blood, we present a device design that relies on a combination of multiple different
deterministic lateral displacement arrays. Our end goal is a microfluidic device that will be easy to use in the
rural, resource-deprived areas where simple-to-use medical tools are crucially needed for rapid and
accurate diagnosis. Here, we exemplify this in the application of blood parasite enrichment from
a sample of blood. With trypanosomes as a model system we show a combination of functionalities
designed into a single device based on several deterministic lateral displacement arrays of different
depths arranged in series. With only one inlet and no expensive or complicated pumping mechanisms to
run separations we ensure the level of simplicity necessary for field use.
Introduction
For many tropical diseases, identifying parasites or infectedblood cells among a huge background of normal blood cells isthe gold standard for diagnosis.1 Particle separation techniquessuch as acoustophoresis,2 margination3 and inertial focusing4,5
have been developed that show great promise as candidates forthe eld diagnosis of tropical diseases, however the gapbetween how microuidics devices are run in labs and how theyneed to be run in the eld is still considerable. In well-equippedlabs there are pressure pumps, expensive pressure control unitsor syringe pumps plus advanced microscopes to monitor devicefunction, giving information that is in turn used to makechanges to ow rates and pressures. In the eld however thelack of equipment, and in many cases maybe even access toa power grid, means that devices designed to work well in thelab, are doomed to failure. One approach would be to developcheaper, less power consuming ow-control and opticalsystems. Another approach is to develop systems that require aslittle control as possible, which can perform complex opera-tions with minimum requirements on external control. Paper-based microuidics6 is the epitome of the second approach,where all functions are designed into the device and the onlyexternal control required is the application of a droplet ofsample followed by a simple visual readout. While these
, Lund University, PO Box 118, S-221 00
.lth.se; Fax: +46 46 222 3637; Tel: +46
logy, Institute of Infection, Immunity and
and Life Sciences, University of Glasgow,
tion (ESI) available. See DOI:
hemistry 2016
systems are promising for many applications, they are not well-suited to high-resolution particle separations for which devicestructures oen need to be much more well-dened on themicroscopic scale than the random brous structure of paper.Here we describe a device that is designed to perform complex,high-resolution size and shape-based particle separationwithout expensive uidic control equipment. The separationmechanism in our device is deterministic lateral displacement(DLD).7 The basic concept is to use simple and cheap pressuregeneration (a disposable syringe where air is compressed to givean over-pressure), simple sample input (one inlet only for theentire device), and sequential particle sorting units based onDLD to decomplex a mixture of particles. While applicable toany system containing particles that differ in size and/or shapewe focus here on the separation of parasites from the genusTrypanosoma from blood cells. We have previously shown howtrypanosomes and erythrocytes exhibit different behaviours inDLD devices as the device depth is changed, a fact that wepreviously used to perform separations.8 In the present work weuse multiple array parameters, including depth, to realizecomplex functions in our device while simultaneously simpli-fying uid control and use the decomplexing of a mixture ofhuman blood and trypanosomes as a test system.
Endemic to sub-Saharan Africa, human African trypanoso-miasis (HAT) is a fatal vector-borne parasitic disease caused bythe protozoan parasite Trypanosoma brucei, transmitted by tse-tse ies.9 Its diagnosis relies to a great extent on tedious andlaborious microscopic detection in blood smears or lymph nodeaspirates.10 The key bottleneck with conventional microscopicdiagnosis of HAT is the relatively low number of parasitesagainst the overwhelming background of blood cells. Conse-quently the detection threshold for normal microscopic diag-nosis is relatively high (�10 000 ml�1)11 in comparison to the
Anal. Methods, 2016, 8, 3291–3300 | 3291
Analytical Methods Paper
Ope
n A
cces
s A
rtic
le. P
ublis
hed
on 0
8 M
arch
201
6. D
ownl
oade
d on
31/
05/2
016
12:0
0:02
. T
his
artic
le is
lice
nsed
und
er a
Cre
ativ
e C
omm
ons
Attr
ibut
ion
3.0
Unp
orte
d L
icen
ce.
View Article Online
parasitaemia (parasite number density in blood). This variesperiodically during the course of the disease but can at times beas low as 100 ml�1, and consequently, there could be more than50 million blood cells (predominantly erythrocytes) per para-site.11 Today, expensive and power-consuming technologies,such as ion exchange chromatography and centrifugation, areavailable at most modern facilities, and can be used for rela-tively efficient parasite detection (via enrichment relative toblood cell concentration). However, it is challenging to employthese tools in the geographical areas where the disease isprevalent, due to the lack of reliable power and storage facili-ties. Our aim is to use a microuidic sorting scheme to extractthe parasites for visual inspection, thus addressing the limita-tions of current technologies.
Deterministic lateral displacement
Our device, Fig. 1, can be fabricated in cheap materials, has nomoving parts or power requirements and being no larger thana microscope slide, is highly portable. It is based on Deter-ministic Lateral Displacement (DLD), a method rst shown in2004 by Huang et al. that in its simplest conguration separatesparticles based on size.7 In brief, DLD uses an array of obstaclesin a uidic channel. Particles smaller than a critical size followthe overall ow direction, while larger particles are deected atan angle relative to the ow, dened by the array. The criticalsize depends on the obstacle–obstacle distance (perpendicularto the ow direction, Gap) and the distance each row is shiedrelative to the previous (Row shi), see Fig. 2A.12–16
The method has been shown capable of size-fractionatinga wide range of samples including blood components,17,18
cancer cells19 and synthetic particles such as droplets in two-
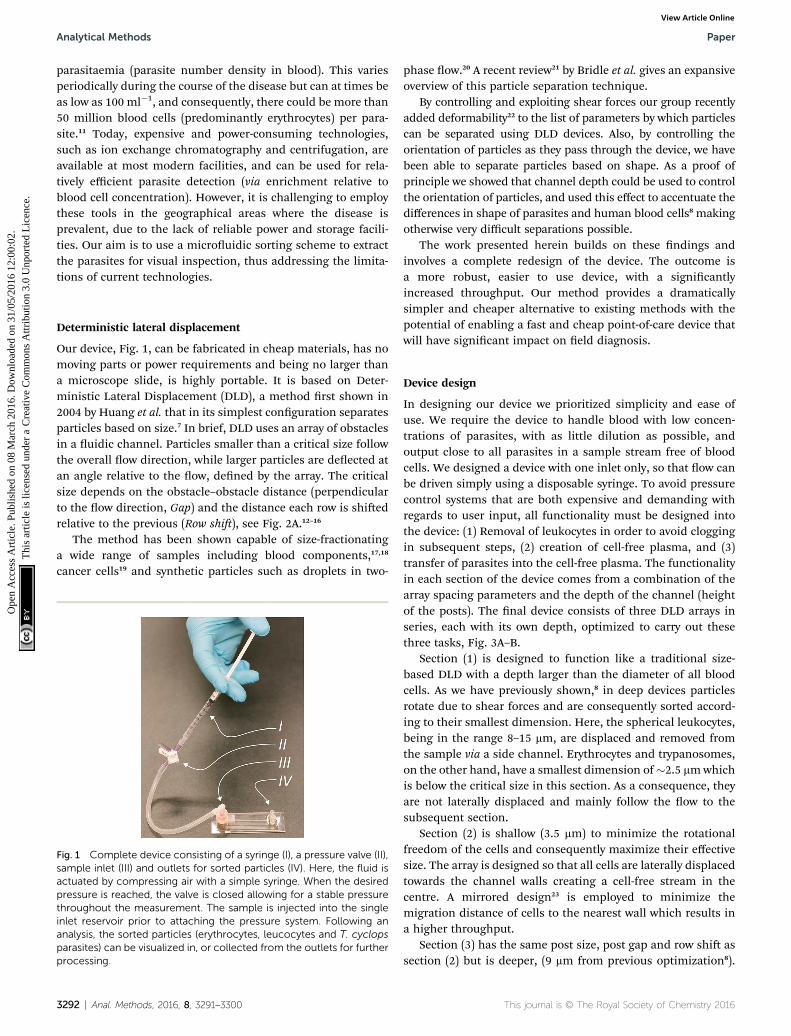
Fig. 1 Complete device consisting of a syringe (I), a pressure valve (II),sample inlet (III) and outlets for sorted particles (IV). Here, the fluid isactuated by compressing air with a simple syringe. When the desiredpressure is reached, the valve is closed allowing for a stable pressurethroughout the measurement. The sample is injected into the singleinlet reservoir prior to attaching the pressure system. Following ananalysis, the sorted particles (erythrocytes, leucocytes and T. cyclopsparasites) can be visualized in, or collected from the outlets for furtherprocessing.
3292 | Anal. Methods, 2016, 8, 3291–3300
phase ow.20 A recent review21 by Bridle et al. gives an expansiveoverview of this particle separation technique.
By controlling and exploiting shear forces our group recentlyadded deformability22 to the list of parameters by which particlescan be separated using DLD devices. Also, by controlling theorientation of particles as they pass through the device, we havebeen able to separate particles based on shape. As a proof ofprinciple we showed that channel depth could be used to controlthe orientation of particles, and used this effect to accentuate thedifferences in shape of parasites and human blood cells8 makingotherwise very difficult separations possible.
The work presented herein builds on these ndings andinvolves a complete redesign of the device. The outcome isa more robust, easier to use device, with a signicantlyincreased throughput. Our method provides a dramaticallysimpler and cheaper alternative to existing methods with thepotential of enabling a fast and cheap point-of-care device thatwill have signicant impact on eld diagnosis.
Device design
In designing our device we prioritized simplicity and ease ofuse. We require the device to handle blood with low concen-trations of parasites, with as little dilution as possible, andoutput close to all parasites in a sample stream free of bloodcells. We designed a device with one inlet only, so that ow canbe driven simply using a disposable syringe. To avoid pressurecontrol systems that are both expensive and demanding withregards to user input, all functionality must be designed intothe device: (1) Removal of leukocytes in order to avoid cloggingin subsequent steps, (2) creation of cell-free plasma, and (3)transfer of parasites into the cell-free plasma. The functionalityin each section of the device comes from a combination of thearray spacing parameters and the depth of the channel (heightof the posts). The nal device consists of three DLD arrays inseries, each with its own depth, optimized to carry out thesethree tasks, Fig. 3A–B.
Section (1) is designed to function like a traditional size-based DLD with a depth larger than the diameter of all bloodcells. As we have previously shown,8 in deep devices particlesrotate due to shear forces and are consequently sorted accord-ing to their smallest dimension. Here, the spherical leukocytes,being in the range 8–15 mm, are displaced and removed fromthe sample via a side channel. Erythrocytes and trypanosomes,on the other hand, have a smallest dimension of�2.5 mmwhichis below the critical size in this section. As a consequence, theyare not laterally displaced and mainly follow the ow to thesubsequent section.
Section (2) is shallow (3.5 mm) to minimize the rotationalfreedom of the cells and consequently maximize their effectivesize. The array is designed so that all cells are laterally displacedtowards the channel walls creating a cell-free stream in thecentre. A mirrored design23 is employed to minimize themigration distance of cells to the nearest wall which results ina higher throughput.
Section (3) has the same post size, post gap and row shi assection (2) but is deeper, (9 mm from previous optimization8).
This journal is © The Royal Society of Chemistry 2016
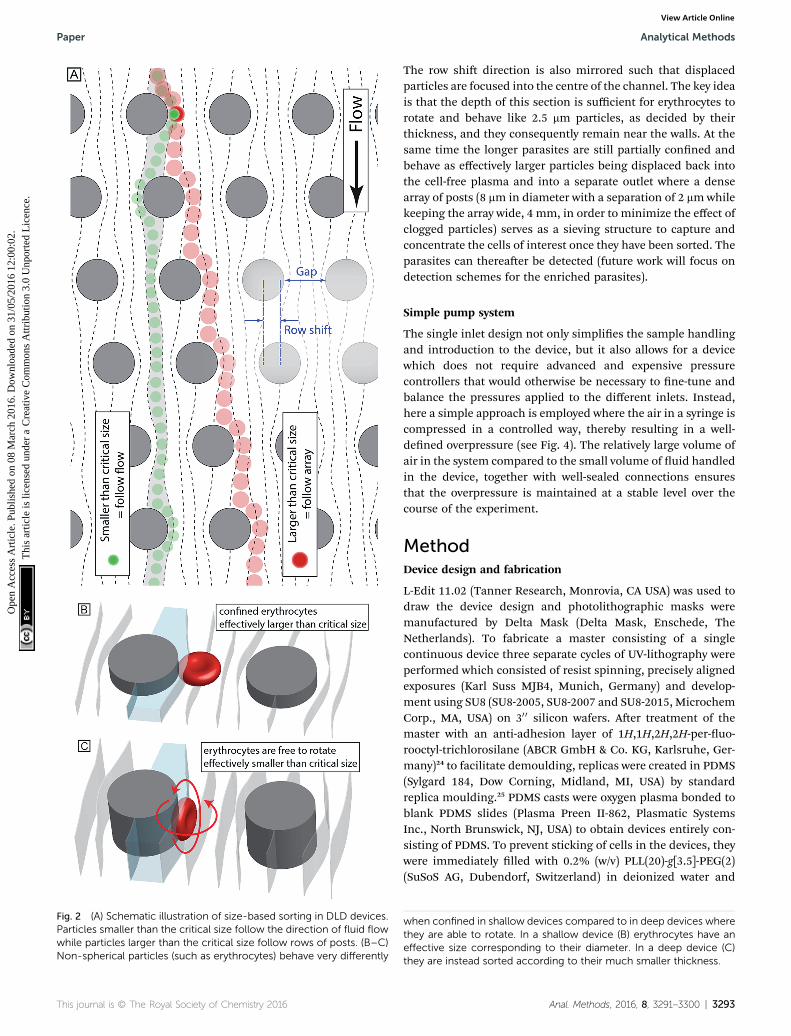
Fig. 2 (A) Schematic illustration of size-based sorting in DLD devices.Particles smaller than the critical size follow the direction of fluid flowwhile particles larger than the critical size follow rows of posts. (B–C)Non-spherical particles (such as erythrocytes) behave very differently
This journal is © The Royal Society of Chemistry 2016
Paper Analytical Methods
Ope
n A
cces
s A
rtic
le. P
ublis
hed
on 0
8 M
arch
201
6. D
ownl
oade
d on
31/
05/2
016
12:0
0:02
. T
his
artic
le is
lice
nsed
und
er a
Cre
ativ
e C
omm
ons
Attr
ibut
ion
3.0
Unp
orte
d L
icen
ce.
View Article Online
The row shi direction is also mirrored such that displacedparticles are focused into the centre of the channel. The key ideais that the depth of this section is sufficient for erythrocytes torotate and behave like 2.5 mm particles, as decided by theirthickness, and they consequently remain near the walls. At thesame time the longer parasites are still partially conned andbehave as effectively larger particles being displaced back intothe cell-free plasma and into a separate outlet where a densearray of posts (8 mm in diameter with a separation of 2 mmwhilekeeping the array wide, 4 mm, in order to minimize the effect ofclogged particles) serves as a sieving structure to capture andconcentrate the cells of interest once they have been sorted. Theparasites can thereaer be detected (future work will focus ondetection schemes for the enriched parasites).
Simple pump system
The single inlet design not only simplies the sample handlingand introduction to the device, but it also allows for a devicewhich does not require advanced and expensive pressurecontrollers that would otherwise be necessary to ne-tune andbalance the pressures applied to the different inlets. Instead,here a simple approach is employed where the air in a syringe iscompressed in a controlled way, thereby resulting in a well-dened overpressure (see Fig. 4). The relatively large volume ofair in the system compared to the small volume of uid handledin the device, together with well-sealed connections ensuresthat the overpressure is maintained at a stable level over thecourse of the experiment.
MethodDevice design and fabrication
L-Edit 11.02 (Tanner Research, Monrovia, CA USA) was used todraw the device design and photolithographic masks weremanufactured by Delta Mask (Delta Mask, Enschede, TheNetherlands). To fabricate a master consisting of a singlecontinuous device three separate cycles of UV-lithography wereperformed which consisted of resist spinning, precisely alignedexposures (Karl Suss MJB4, Munich, Germany) and develop-ment using SU8 (SU8-2005, SU8-2007 and SU8-2015, MicrochemCorp., MA, USA) on 30 0 silicon wafers. Aer treatment of themaster with an anti-adhesion layer of 1H,1H,2H,2H-per-uo-rooctyl-trichlorosilane (ABCR GmbH & Co. KG, Karlsruhe, Ger-many)24 to facilitate demoulding, replicas were created in PDMS(Sylgard 184, Dow Corning, Midland, MI, USA) by standardreplica moulding.25 PDMS casts were oxygen plasma bonded toblank PDMS slides (Plasma Preen II-862, Plasmatic SystemsInc., North Brunswick, NJ, USA) to obtain devices entirely con-sisting of PDMS. To prevent sticking of cells in the devices, theywere immediately lled with 0.2% (w/v) PLL(20)-g[3.5]-PEG(2)(SuSoS AG, Dubendorf, Switzerland) in deionized water and
when confined in shallow devices compared to in deep devices wherethey are able to rotate. In a shallow device (B) erythrocytes have aneffective size corresponding to their diameter. In a deep device (C)they are instead sorted according to their much smaller thickness.
Anal. Methods, 2016, 8, 3291–3300 | 3293

Fig. 3 (A) Basic principle of how orientation changes the effective sizeof particles of different shape. (B) Schematic overview with the threedifferent sections colour coded. Arrows represent the direction ofdisplacement in each section. (C) False-coloured mosaic image con-sisting of 34 time-integrated micrographs showing the trajectories oferythrocytes and the parasites through the device.
Analytical Methods Paper
Ope
n A
cces
s A
rtic
le. P
ublis
hed
on 0
8 M
arch
201
6. D
ownl
oade
d on
31/
05/2
016
12:0
0:02
. T
his
artic
le is
lice
nsed
und
er a
Cre
ativ
e C
omm
ons
Attr
ibut
ion
3.0
Unp
orte
d L
icen
ce.
View Article Online
allowed to rest for at least 20min before ushing with deionizedwater for another 20min. Silicon inlets and outlets 12mm and 5mm outer diameter silicon tubing (228-0725 and 228-0707,VWR International LLC, Radnor, PA, USA) were glued (ElastosilA07, Wacker Chemie AG, Munich, Germany) onto the device.The sample was applied to the inlet reservoir, which wassubsequently connected to the syringe to drive the samplethrough the device.
To maximize the throughput, the device has been kept aswide as possible. This means however that, together with therelatively small angle of displacement, the device needs to belong. In fact, the nal device is around 14 cm. To t this onto
3294 | Anal. Methods, 2016, 8, 3291–3300
a standard glass slide the device is split up into its threedifferent sections with multiple channels connecting the end ofeach array with the start of the proceeding array, see Fig. 5A–B.To ensure that the particles maintain their relative lateralposition while moving between the different sections, carefulcalculations and CFD simulations (COMSOL Multiphysics 4.3,Comsol AB, Stockholm, Sweden) have been conducted, the keybeing to keep a constant resistance across the width of thedevice such that the ow and particle proles are preservedaround the 180� bends. More info on this optimization can befound in ESI section (3).†
Experimental setup
All experiments were performed in compliance with the relevantlaws and institutional guidelines. Blood was extracted via ngerpricking (Haemolance, MedCore AB, Kista, Sweden) of healthyvolunteers from which informed consent was obtained. Prior toeach experiment, the devices were ushed with sterile lteredCunningham's medium26 with 20% fetal calf serum (Cat. No.F2442, Sigma-Aldrich, St. Louis, MO, USA), the medium used toculture the parasites, and 2 mM EDTA (Cat. No. E6758, Sigma-Aldrich) to inhibit coagulation of the blood. It is important tonote that Cunningham's medium is only necessary to sustainour model system.
In order to obtain good statistics on the device performance,measurements were oen conducted with the same device forseveral hours. Consequently, to counteract particle sedimenta-tion and ensure a homogenous sample, a small magnetic stirbar (length 5 mm, diameter 2 mm) was placed in the inletreservoir and controlled by a magnet connected to a smallelectric motor. With a stir rate of �1 Hz and the dimensions ofthe stir bar and inlet reservoir as given above, the shear rate isestimated to be on the order of 10 s�1 to 100 s�1, which is lessthan the physiological shear rates of up to�104 s�1.27,28 Further,microscopic examination conrmed that the stir bar did notinduce any morphological changes in the sample. For actualeld use of the nal device, the short time of analysis wouldeliminate the need for any stirring.
Measurements and analysis
The lateral distribution of cells was characterized at the end ofeach section in the device through an inverted Nikon EclipseTE2000-U microscope (Nikon Corporation, Tokyo, Japan) usingan EMCCD camera (iXon EM+ DU-897, Andor Technology Ltd,Belfast, UK) and various objective lenses (Nikon, 10/20x PlanFluor and 60x Apo TIRF). Differential Interference Contrast(DIC) was used to ensure adequate contrast of blood cells andtrypanosomes.
Particle tracking soware, based on available MATLAB code,was written in MATLAB R2014b (The MathWorks Inc, Natick,MA, USA) and optimized for accurate and efficient particlerecognition. Detailed information together with the code can befound in ESI section (4).†
Blood and trypanosomes were analysed at concentrations,which allowed for automated particle tracking while the addi-tion of anticoagulants opened up for measurements over several
This journal is © The Royal Society of Chemistry 2016
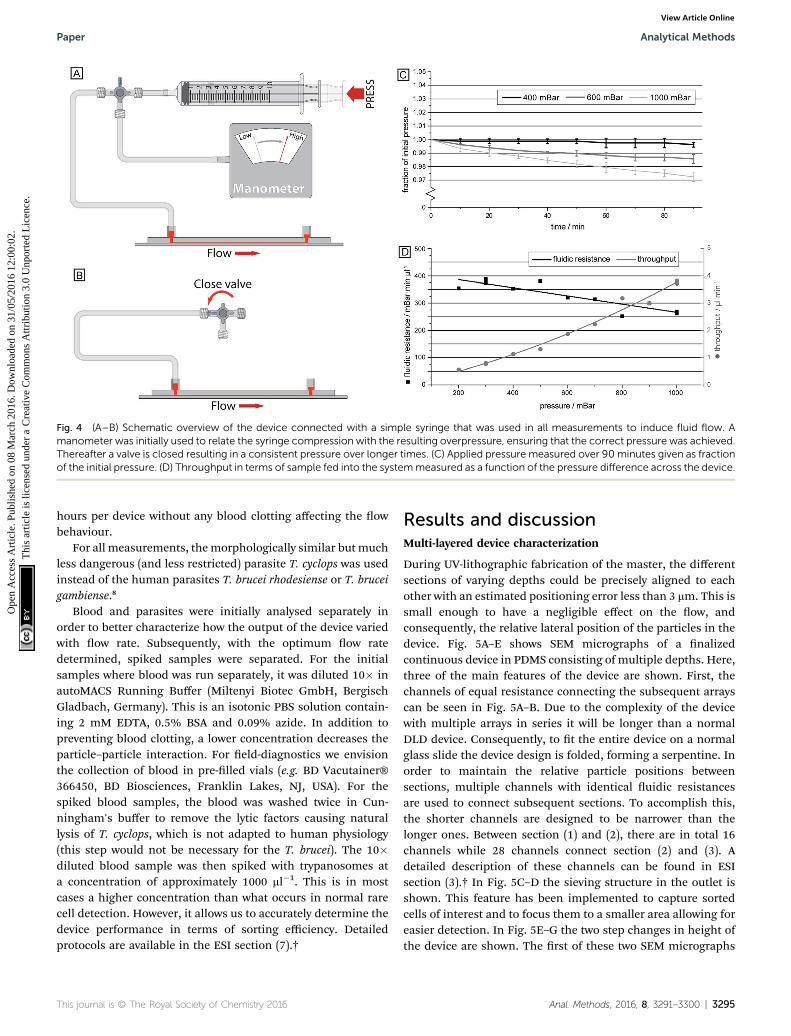
Fig. 4 (A–B) Schematic overview of the device connected with a simple syringe that was used in all measurements to induce fluid flow. Amanometer was initially used to relate the syringe compression with the resulting overpressure, ensuring that the correct pressure was achieved.Thereafter a valve is closed resulting in a consistent pressure over longer times. (C) Applied pressure measured over 90 minutes given as fractionof the initial pressure. (D) Throughput in terms of sample fed into the systemmeasured as a function of the pressure difference across the device.
Paper Analytical Methods
Ope
n A
cces
s A
rtic
le. P
ublis
hed
on 0
8 M
arch
201
6. D
ownl
oade
d on
31/
05/2
016
12:0
0:02
. T
his
artic
le is
lice
nsed
und
er a
Cre
ativ
e C
omm
ons
Attr
ibut
ion
3.0
Unp
orte
d L
icen
ce.
View Article Online
hours per device without any blood clotting affecting the owbehaviour.
For all measurements, themorphologically similar but muchless dangerous (and less restricted) parasite T. cyclops was usedinstead of the human parasites T. brucei rhodesiense or T. bruceigambiense.8
Blood and parasites were initially analysed separately inorder to better characterize how the output of the device variedwith ow rate. Subsequently, with the optimum ow ratedetermined, spiked samples were separated. For the initialsamples where blood was run separately, it was diluted 10� inautoMACS Running Buffer (Miltenyi Biotec GmbH, BergischGladbach, Germany). This is an isotonic PBS solution contain-ing 2 mM EDTA, 0.5% BSA and 0.09% azide. In addition topreventing blood clotting, a lower concentration decreases theparticle–particle interaction. For eld-diagnostics we envisionthe collection of blood in pre-lled vials (e.g. BD Vacutainer®366450, BD Biosciences, Franklin Lakes, NJ, USA). For thespiked blood samples, the blood was washed twice in Cun-ningham's buffer to remove the lytic factors causing naturallysis of T. cyclops, which is not adapted to human physiology(this step would not be necessary for the T. brucei). The 10�diluted blood sample was then spiked with trypanosomes ata concentration of approximately 1000 ml�1. This is in mostcases a higher concentration than what occurs in normal rarecell detection. However, it allows us to accurately determine thedevice performance in terms of sorting efficiency. Detailedprotocols are available in the ESI section (7).†
This journal is © The Royal Society of Chemistry 2016
Results and discussionMulti-layered device characterization
During UV-lithographic fabrication of the master, the differentsections of varying depths could be precisely aligned to eachother with an estimated positioning error less than 3 mm. This issmall enough to have a negligible effect on the ow, andconsequently, the relative lateral position of the particles in thedevice. Fig. 5A–E shows SEM micrographs of a nalizedcontinuous device in PDMS consisting of multiple depths. Here,three of the main features of the device are shown. First, thechannels of equal resistance connecting the subsequent arrayscan be seen in Fig. 5A–B. Due to the complexity of the devicewith multiple arrays in series it will be longer than a normalDLD device. Consequently, to t the entire device on a normalglass slide the device design is folded, forming a serpentine. Inorder to maintain the relative particle positions betweensections, multiple channels with identical uidic resistancesare used to connect subsequent sections. To accomplish this,the shorter channels are designed to be narrower than thelonger ones. Between section (1) and (2), there are in total 16channels while 28 channels connect section (2) and (3). Adetailed description of these channels can be found in ESIsection (3).† In Fig. 5C–D the sieving structure in the outlet isshown. This feature has been implemented to capture sortedcells of interest and to focus them to a smaller area allowing foreasier detection. In Fig. 5E–G the two step changes in height ofthe device are shown. The rst of these two SEM micrographs
Anal. Methods, 2016, 8, 3291–3300 | 3295
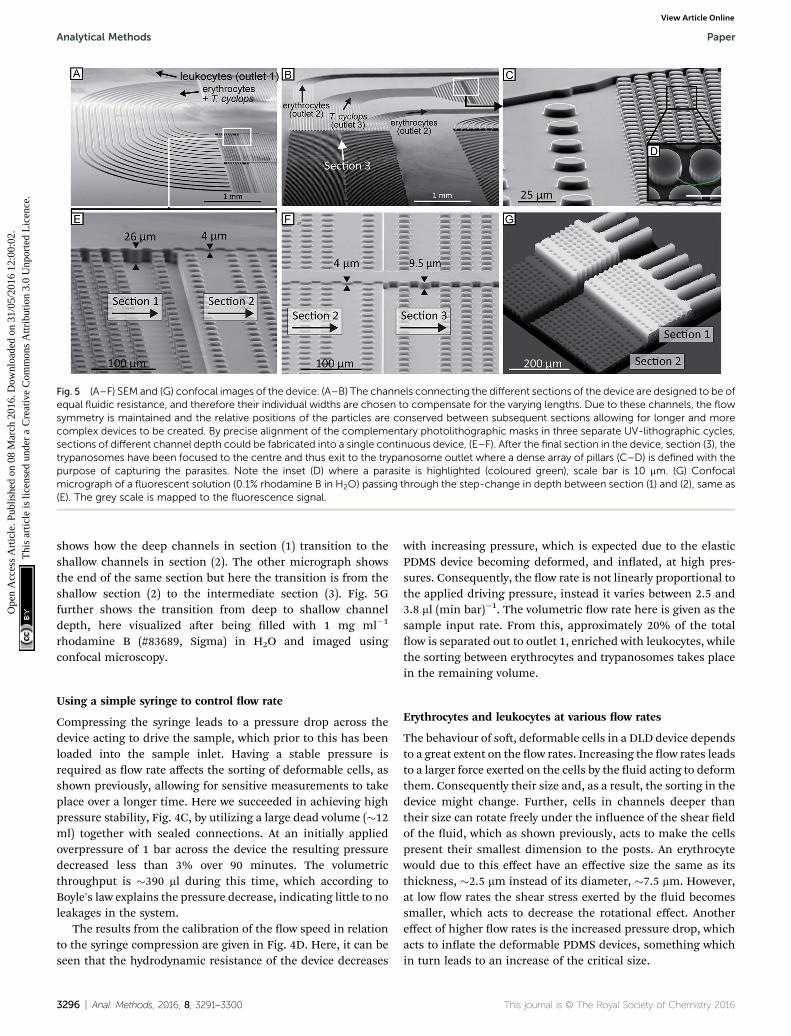
Fig. 5 (A–F) SEM and (G) confocal images of the device. (A–B) The channels connecting the different sections of the device are designed to be ofequal fluidic resistance, and therefore their individual widths are chosen to compensate for the varying lengths. Due to these channels, the flowsymmetry is maintained and the relative positions of the particles are conserved between subsequent sections allowing for longer and morecomplex devices to be created. By precise alignment of the complementary photolithographic masks in three separate UV-lithographic cycles,sections of different channel depth could be fabricated into a single continuous device, (E–F). After the final section in the device, section (3), thetrypanosomes have been focused to the centre and thus exit to the trypanosome outlet where a dense array of pillars (C–D) is defined with thepurpose of capturing the parasites. Note the inset (D) where a parasite is highlighted (coloured green), scale bar is 10 mm. (G) Confocalmicrograph of a fluorescent solution (0.1% rhodamine B in H2O) passing through the step-change in depth between section (1) and (2), same as(E). The grey scale is mapped to the fluorescence signal.
Analytical Methods Paper
Ope
n A
cces
s A
rtic
le. P
ublis
hed
on 0
8 M
arch
201
6. D
ownl
oade
d on
31/
05/2
016
12:0
0:02
. T
his
artic
le is
lice
nsed
und
er a
Cre
ativ
e C
omm
ons
Attr
ibut
ion
3.0
Unp
orte
d L
icen
ce.
View Article Online
shows how the deep channels in section (1) transition to theshallow channels in section (2). The other micrograph showsthe end of the same section but here the transition is from theshallow section (2) to the intermediate section (3). Fig. 5Gfurther shows the transition from deep to shallow channeldepth, here visualized aer being lled with 1 mg ml�1
rhodamine B (#83689, Sigma) in H2O and imaged usingconfocal microscopy.
Using a simple syringe to control ow rate
Compressing the syringe leads to a pressure drop across thedevice acting to drive the sample, which prior to this has beenloaded into the sample inlet. Having a stable pressure isrequired as ow rate affects the sorting of deformable cells, asshown previously, allowing for sensitive measurements to takeplace over a longer time. Here we succeeded in achieving highpressure stability, Fig. 4C, by utilizing a large dead volume (�12ml) together with sealed connections. At an initially appliedoverpressure of 1 bar across the device the resulting pressuredecreased less than 3% over 90 minutes. The volumetricthroughput is �390 ml during this time, which according toBoyle's law explains the pressure decrease, indicating little to noleakages in the system.
The results from the calibration of the ow speed in relationto the syringe compression are given in Fig. 4D. Here, it can beseen that the hydrodynamic resistance of the device decreases
3296 | Anal. Methods, 2016, 8, 3291–3300
with increasing pressure, which is expected due to the elasticPDMS device becoming deformed, and inated, at high pres-sures. Consequently, the ow rate is not linearly proportional tothe applied driving pressure, instead it varies between 2.5 and3.8 ml (min bar)�1. The volumetric ow rate here is given as thesample input rate. From this, approximately 20% of the totalow is separated out to outlet 1, enriched with leukocytes, whilethe sorting between erythrocytes and trypanosomes takes placein the remaining volume.
Erythrocytes and leukocytes at various ow rates
The behaviour of so, deformable cells in a DLD device dependsto a great extent on the ow rates. Increasing the ow rates leadsto a larger force exerted on the cells by the uid acting to deformthem. Consequently their size and, as a result, the sorting in thedevice might change. Further, cells in channels deeper thantheir size can rotate freely under the inuence of the shear eldof the uid, which as shown previously, acts to make the cellspresent their smallest dimension to the posts. An erythrocytewould due to this effect have an effective size the same as itsthickness, �2.5 mm instead of its diameter, �7.5 mm. However,at low ow rates the shear stress exerted by the uid becomessmaller, which acts to decrease the rotational effect. Anothereffect of higher ow rates is the increased pressure drop, whichacts to inate the deformable PDMS devices, something whichin turn leads to an increase of the critical size.
This journal is © The Royal Society of Chemistry 2016

Paper Analytical Methods
Ope
n A
cces
s A
rtic
le. P
ublis
hed
on 0
8 M
arch
201
6. D
ownl
oade
d on
31/
05/2
016
12:0
0:02
. T
his
artic
le is
lice
nsed
und
er a
Cre
ativ
e C
omm
ons
Attr
ibut
ion
3.0
Unp
orte
d L
icen
ce.
View Article Online
The erythrocytes and parasites were initially measuredseparately at various ow rates to allow for automated particletracking of a large number of cells. Thereaer, spiked bloodsamples were analysed at the most promising ow rates.
The results from the separate measurements of erythrocytesand T. cyclops are presented in Fig. 6, with the sorting efficiencyfurther analysed in Fig. 7.
In Fig. 7 the output of each section is given for both eryth-rocytes and T. cyclops at several different ow rates as a fractionof the total number of that cell type in that specic section. Itcan be seen that in section (1), Fig. 6B, the fraction of cellsseparated out are larger at low ow rates but converges to�20%with increasing ow rates (and consequently �80% of the cellscontinue to section (2)). Section (1) is deeper than the largestdimensions of both cell types, the length of the T. cyclops andthe diameter of the erythrocytes. As a result the cells can rotatefreely as discussed previously, resulting in a decreased effectivesize. With the section designed with a critical size of 7.1 mm, thecells are not expected to be laterally displaced. However, at lowow rates the shear stress exerted on the particles by the uid islimited which leads to a decrease in both the orientation of thecells and also the cell deformation. As a consequence, thefraction of cells sorted out into outlet 1 can be higher than theexpected 20%.
Fig. 6 Sorting efficiencies as a function of flowrate (i.e. the fraction of cewhich is focused along the channel walls and the fraction in section (3) wof that cell type in that specific section. (A) Schematic overview of the desection the erythrocytes and parasites are sorted out in proportion to theparasites are focused to the side. (D) For the separation of T. cyclopsefficiency. Each data point represents a minimum of 1000 counts. For therythrocytes and T. cyclops.
This journal is © The Royal Society of Chemistry 2016
In section (2), Fig. 6C, the cells are steered towards the sidesof the channel to open up a cell-free stream in the centre. Due tothe low depth of this section, the cells are restricted fromrotating which leads them to display a larger effective size andconsequently they are more easily laterally displaced into theside streams along the channel walls. Here, the side streams aredened as the outermost 25% on both sides of the channelwhile the centre stream constitutes the remaining 50%. The sizeof these streams is dened by how the end of section (3) isdivided into outlet 2 and 3, meaning that any cells residing inthe centre stream at the end of section (2) are likely to also besorted into outlet 3. In the same way, any cells residing in theside streams will end up in outlet 2 unless they are laterallydisplaced in section (3).
At lower ow rates, around 95% of cells entering section (2)will at the end reside in the side streams. However, at high owrates the so erythrocytes will, by deforming due to shearforces, avoid being laterally displaced and will end up asa contaminant among the parasites in outlet 3. At 3.8 ml min�1
around 20% of the erythrocytes exiting this section do so in thecentre stream and are expected to end up as a contamination inoutlet 3, leading to poor separation sensitivity.
Section (3) is identical to section (2) except for the directionof displacement and the depth, Fig. 6D. By the increase in depth
lls in section (1) that is sorted out into outlet 1, the fraction in section (2)hich are sorted out into outlet 3). The numbers are given as the fractionvice highlighting the origin of the data in the graphs. (B) After the firstfluid flow going into the outlet. (C) In section (2) most erythrocytes andand erythrocytes intermediate flow rates give the highest separatione highest flow rates the number of counts was around 7000 for both
Anal. Methods, 2016, 8, 3291–3300 | 3297
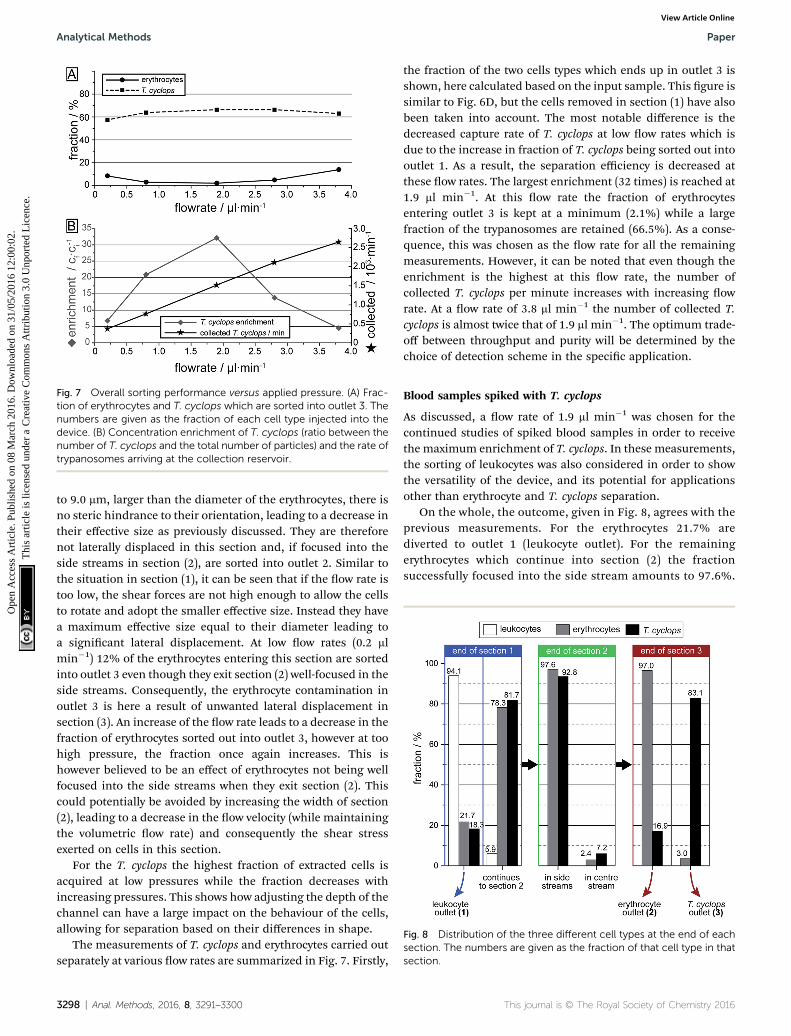
Fig. 7 Overall sorting performance versus applied pressure. (A) Frac-tion of erythrocytes and T. cyclops which are sorted into outlet 3. Thenumbers are given as the fraction of each cell type injected into thedevice. (B) Concentration enrichment of T. cyclops (ratio between thenumber of T. cyclops and the total number of particles) and the rate oftrypanosomes arriving at the collection reservoir.
Fig. 8 Distribution of the three different cell types at the end of eachsection. The numbers are given as the fraction of that cell type in thatsection.
Analytical Methods Paper
Ope
n A
cces
s A
rtic
le. P
ublis
hed
on 0
8 M
arch
201
6. D
ownl
oade
d on
31/
05/2
016
12:0
0:02
. T
his
artic
le is
lice
nsed
und
er a
Cre
ativ
e C
omm
ons
Attr
ibut
ion
3.0
Unp
orte
d L
icen
ce.
View Article Online
to 9.0 mm, larger than the diameter of the erythrocytes, there isno steric hindrance to their orientation, leading to a decrease intheir effective size as previously discussed. They are thereforenot laterally displaced in this section and, if focused into theside streams in section (2), are sorted into outlet 2. Similar tothe situation in section (1), it can be seen that if the ow rate istoo low, the shear forces are not high enough to allow the cellsto rotate and adopt the smaller effective size. Instead they havea maximum effective size equal to their diameter leading toa signicant lateral displacement. At low ow rates (0.2 mlmin�1) 12% of the erythrocytes entering this section are sortedinto outlet 3 even though they exit section (2) well-focused in theside streams. Consequently, the erythrocyte contamination inoutlet 3 is here a result of unwanted lateral displacement insection (3). An increase of the ow rate leads to a decrease in thefraction of erythrocytes sorted out into outlet 3, however at toohigh pressure, the fraction once again increases. This ishowever believed to be an effect of erythrocytes not being wellfocused into the side streams when they exit section (2). Thiscould potentially be avoided by increasing the width of section(2), leading to a decrease in the ow velocity (while maintainingthe volumetric ow rate) and consequently the shear stressexerted on cells in this section.
For the T. cyclops the highest fraction of extracted cells isacquired at low pressures while the fraction decreases withincreasing pressures. This shows how adjusting the depth of thechannel can have a large impact on the behaviour of the cells,allowing for separation based on their differences in shape.
The measurements of T. cyclops and erythrocytes carried outseparately at various ow rates are summarized in Fig. 7. Firstly,
3298 | Anal. Methods, 2016, 8, 3291–3300
the fraction of the two cells types which ends up in outlet 3 isshown, here calculated based on the input sample. This gure issimilar to Fig. 6D, but the cells removed in section (1) have alsobeen taken into account. The most notable difference is thedecreased capture rate of T. cyclops at low ow rates which isdue to the increase in fraction of T. cyclops being sorted out intooutlet 1. As a result, the separation efficiency is decreased atthese ow rates. The largest enrichment (32 times) is reached at1.9 ml min�1. At this ow rate the fraction of erythrocytesentering outlet 3 is kept at a minimum (2.1%) while a largefraction of the trypanosomes are retained (66.5%). As a conse-quence, this was chosen as the ow rate for all the remainingmeasurements. However, it can be noted that even though theenrichment is the highest at this ow rate, the number ofcollected T. cyclops per minute increases with increasing owrate. At a ow rate of 3.8 ml min�1 the number of collected T.cyclops is almost twice that of 1.9 ml min�1. The optimum trade-off between throughput and purity will be determined by thechoice of detection scheme in the specic application.
Blood samples spiked with T. cyclops
As discussed, a ow rate of 1.9 ml min�1 was chosen for thecontinued studies of spiked blood samples in order to receivethe maximum enrichment of T. cyclops. In these measurements,the sorting of leukocytes was also considered in order to showthe versatility of the device, and its potential for applicationsother than erythrocyte and T. cyclops separation.
On the whole, the outcome, given in Fig. 8, agrees with theprevious measurements. For the erythrocytes 21.7% arediverted to outlet 1 (leukocyte outlet). For the remainingerythrocytes which continue into section (2) the fractionsuccessfully focused into the side stream amounts to 97.6%.
This journal is © The Royal Society of Chemistry 2016
Paper Analytical Methods
Ope
n A
cces
s A
rtic
le. P
ublis
hed
on 0
8 M
arch
201
6. D
ownl
oade
d on
31/
05/2
016
12:0
0:02
. T
his
artic
le is
lice
nsed
und
er a
Cre
ativ
e C
omm
ons
Attr
ibut
ion
3.0
Unp
orte
d L
icen
ce.
View Article Online
From this number, a small fraction (0.6%) is not retainedalong the sides of the channel in section (3) but instead endup in outlet 3 (T. cyclops outlet) as a contamination. Theremaining 97.0% which still remain in the side streams exitinto the correct outlet which is close to the result of theseparate measurements.
For the trypanosomes 18.3% is laterally displaced into outlet1 while 92.8% of the remaining parasites are successfullyfocused into the side streams. This is, in agreement withprevious measurements a smaller fraction than for the eryth-rocytes. But as the T. cyclops should exit into outlet 3 from thecentre of section (3), this would lead to an increased sortingefficiency. In the end, 83.1% of the remaining T. cyclops exit intooutlet 3, equivalent to a 30-fold enrichment in the numberconcentration. The leukocytes are, contrary to the other cells,laterally displaced to a great extent in section (1). The majorityof them, 94.1%, are sorted out into outlet 1 while the remainingfraction continues to the shallower section (2). A large fractionof these leucocytes are not able to enter this shallow section,however over the time scale of our experiments the number ofleucocytes ltered out was too small to adversely affect thedevice performance. This is believed to be an effect of thedevice's robustness to pressure changes, with section (2) beingaimed at focusing all cells towards the wall. The result of this isthat any smaller pressure variations will not have an effect onthe device performance.
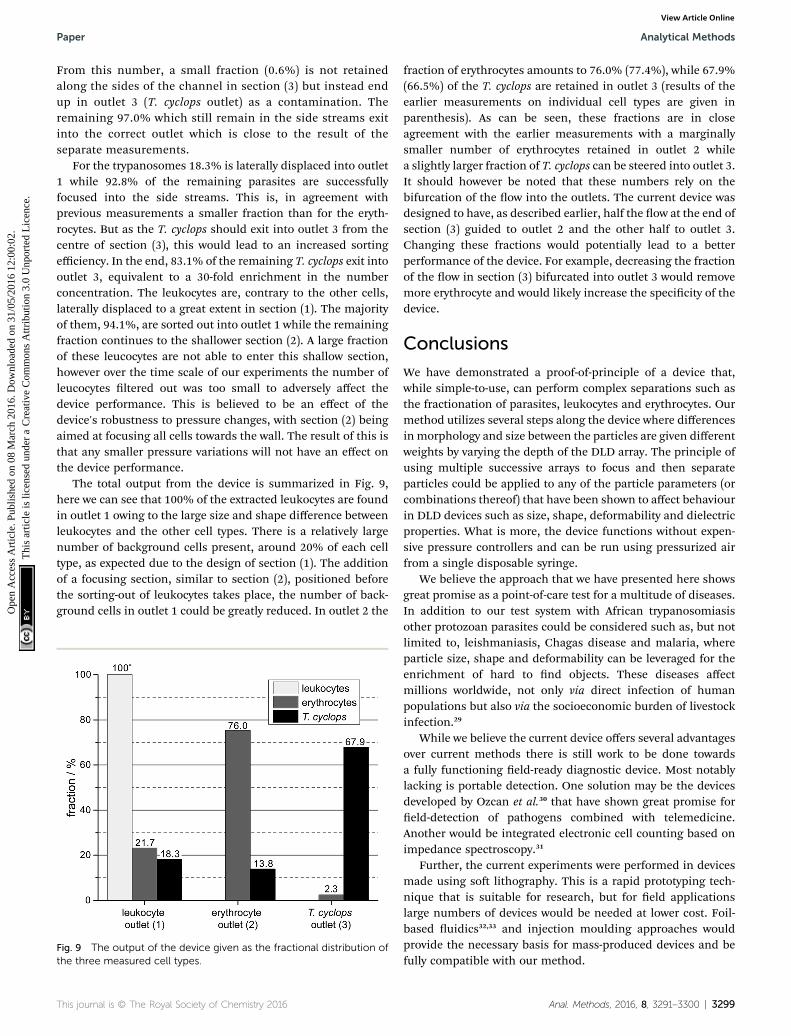
The total output from the device is summarized in Fig. 9,here we can see that 100% of the extracted leukocytes are foundin outlet 1 owing to the large size and shape difference betweenleukocytes and the other cell types. There is a relatively largenumber of background cells present, around 20% of each celltype, as expected due to the design of section (1). The additionof a focusing section, similar to section (2), positioned beforethe sorting-out of leukocytes takes place, the number of back-ground cells in outlet 1 could be greatly reduced. In outlet 2 the
Fig. 9 The output of the device given as the fractional distribution ofthe three measured cell types.
This journal is © The Royal Society of Chemistry 2016
fraction of erythrocytes amounts to 76.0% (77.4%), while 67.9%(66.5%) of the T. cyclops are retained in outlet 3 (results of theearlier measurements on individual cell types are given inparenthesis). As can be seen, these fractions are in closeagreement with the earlier measurements with a marginallysmaller number of erythrocytes retained in outlet 2 whilea slightly larger fraction of T. cyclops can be steered into outlet 3.It should however be noted that these numbers rely on thebifurcation of the ow into the outlets. The current device wasdesigned to have, as described earlier, half the ow at the end ofsection (3) guided to outlet 2 and the other half to outlet 3.Changing these fractions would potentially lead to a betterperformance of the device. For example, decreasing the fractionof the ow in section (3) bifurcated into outlet 3 would removemore erythrocyte and would likely increase the specicity of thedevice.
Conclusions
We have demonstrated a proof-of-principle of a device that,while simple-to-use, can perform complex separations such asthe fractionation of parasites, leukocytes and erythrocytes. Ourmethod utilizes several steps along the device where differencesin morphology and size between the particles are given differentweights by varying the depth of the DLD array. The principle ofusing multiple successive arrays to focus and then separateparticles could be applied to any of the particle parameters (orcombinations thereof) that have been shown to affect behaviourin DLD devices such as size, shape, deformability and dielectricproperties. What is more, the device functions without expen-sive pressure controllers and can be run using pressurized airfrom a single disposable syringe.
We believe the approach that we have presented here showsgreat promise as a point-of-care test for a multitude of diseases.In addition to our test system with African trypanosomiasisother protozoan parasites could be considered such as, but notlimited to, leishmaniasis, Chagas disease and malaria, whereparticle size, shape and deformability can be leveraged for theenrichment of hard to nd objects. These diseases affectmillions worldwide, not only via direct infection of humanpopulations but also via the socioeconomic burden of livestockinfection.29
While we believe the current device offers several advantagesover current methods there is still work to be done towardsa fully functioning eld-ready diagnostic device. Most notablylacking is portable detection. One solution may be the devicesdeveloped by Ozcan et al.30 that have shown great promise foreld-detection of pathogens combined with telemedicine.Another would be integrated electronic cell counting based onimpedance spectroscopy.31
Further, the current experiments were performed in devicesmade using so lithography. This is a rapid prototyping tech-nique that is suitable for research, but for eld applicationslarge numbers of devices would be needed at lower cost. Foil-based uidics32,33 and injection moulding approaches wouldprovide the necessary basis for mass-produced devices and befully compatible with our method.
Anal. Methods, 2016, 8, 3291–3300 | 3299

Analytical Methods Paper
Ope
n A
cces
s A
rtic
le. P
ublis
hed
on 0
8 M
arch
201
6. D
ownl
oade
d on
31/
05/2
016
12:0
0:02
. T
his
artic
le is
lice
nsed
und
er a
Cre
ativ
e C
omm
ons
Attr
ibut
ion
3.0
Unp
orte
d L
icen
ce.
View Article Online
Acknowledgements
This work was carried out within NanoLund at Lund Univer-sity as part of LAPASO (EU FP7 project 607350) and was sup-ported by the Swedish Research Council (VR) grants no. 2007-584, 2011-6035 and 2015-05426, the Crafoord Foundationgrants no. 2005-1123, 2008-0841 and 2015-0007 and the Knutand Alice Wallenberg Foundation. All device processing wereconducted within Lund Nano Lab. We would like to thankZhen Li (Lund University, Sweden) for her help in acquiringconfocal images.
Notes and references
1 P. Mitashi, E. Hasker, V. Lejon, V. Kande, J. J. Muyembe,P. Lutumba and M. Boelaert, PLoS Neglected Trop. Dis.,2012, 6, e1919.
2 A. Lenshof, C. Magnusson and T. Laurell, Lab Chip, 2012, 12,1210–1223.
3 H. Wei Hou, H. Y. Gan, A. A. Bhagat, L. D. Li, C. T. Lim andJ. Han, Biomicrouidics, 2012, 6, 24115–2411513.
4 M. E. Warkiani, G. Guan, K. B. Luan, W. C. Lee,A. A. S. Bhagat, P. Kant Chaudhuri, D. S.-W. Tan,W. T. Lim, S. C. Lee, P. C. Y. Chen, C. T. Lim and J. Han,Lab Chip, 2014, 14, 128–137.
5 D. Di Carlo, Lab Chip, 2009, 9, 3038–3046.6 D. M. Cate, J. A. Adkins, J. Mettakoonpitak and C. S. Henry,Anal. Chem., 2015, 87, 19–41.
7 L. R. Huang, E. C. Cox, R. H. Austin and J. C. Sturm, Science,2004, 304, 987–990.
8 S. H. Holm, J. P. Beech, M. P. Barrett and J. O. Tegenfeldt, LabChip, 2011, 11, 1326–1332.
9 M. P. Barrett, R. J. S. Burchmore, A. Stich, J. O. Lazzari,A. C. Frasch, J. J. Cazzulo and S. Krishna, Lancet, 2003, 362,1469–1480.
10 J. E. Rosenblatt, L. B. Reller and M. P. Weinstein, Clin. Infect.Dis., 2009, 49, 1103–1108.
11 F. Chappuis, L. Loutan, P. Simarro, V. Lejon and P. Buscher,Clin. Microbiol. Rev., 2005, 18, 133–146.
12 D. W. Inglis, J. A. Davis, R. H. Austin and J. C. Sturm, LabChip, 2006, 6, 655–658.
13 K. Loutherback, K. Chou, J. Newman, J. Puchalla, R. Austinand J. Sturm, Microuid. Nanouid., 2010, 9, 1143–1149.
14 S. Cerbelli, M. Giona and F. Garofalo, Microuid. Nanouid.,2013, 15, 431–449.
3300 | Anal. Methods, 2016, 8, 3291–3300
15 M. Jiang, K. Budzan and G. Drazer, Microuid. Nanouid.,2015, 19, 427–434.
16 R. Devendra and G. Drazer, Microuid. Nanouid., 2014, 17,519–526.
17 J. A. Davis, D. W. Inglis, K. J. Morton, D. A. Lawrence,L. R. Huang, S. Y. Chou, J. C. Sturm and R. H. Austin, Proc.Natl. Acad. Sci. U. S. A., 2006, 103, 14779–14784.
18 D. W. Inglis, K. J. Morton, J. A. Davis, T. J. Zieziulewicz,D. A. Lawrence, R. H. Austin and J. C. Sturm, Lab Chip,2008, 8, 925–931.
19 K. Loutherback, J. D’Silva, L. Liu, A. Wu, R. H. Austin andJ. C. Sturm, AIP Adv., 2012, 2, 042107.
20 H. N. Joensson, M. Uhlen and H. A. Svahn, Lab Chip, 2011,11, 1305–1310.
21 J. McGrath, M. Jimenez and H. Bridle, Lab Chip, 2014, 14,4139–4158.
22 J. P. Beech, S. H. Holm, K. Adolfsson and J. O. Tegenfeldt,Lab Chip, 2012, 12, 1048–1051.
23 Y. S. Lubbersen, R. M. Boom and M. A. I. Schutyser, Chem.Eng. Process., 2014, 77, 42–49.
24 M. Beck, M. Graczyk, I. Maximov, E. L. Sarwe, T. G. I. Ling,M. Keil and L. Montelius, Microelectron. Eng., 2002, 61–62,441–448.
25 Y. Xia and G. M. Whitesides, Angew. Chem., Int. Ed., 1998, 37,550–575.
26 I. Cunningham, J. Protozool., 1977, 24, 325–329.27 T. G. Papaioannou and C. Stefanadis, Hellenic Journal of
Cardiology, 2005, 46, 9–15.28 O. Traub and B. C. Berk, Arterioscler., Thromb., Vasc. Biol.,
1998, 18, 677–685.29 P. M. Kristjanson, B. M. Swallow, G. J. Rowlands,
R. L. Kruska and P. N. de Leeuw, Agricultural Systems,1999, 59, 79–98.
30 Z. Gorocs and A. Ozcan, IEEE Reviews in BiomedicalEngineering, 2013, 6, 29–46.
31 H. Morgan and D. Spencer, Chapter 10, MicrouidicImpedance Cytometry for Blood Cell Analysis, The RoyalSociety of Chemistry, 2015.
32 J. P. Beech, T. Makela, P. Majander and J. O. Tegenfeldt,Presented in part at the mTAS - the 12th internationalconference on miniaturized systems for chemistry and lifesciences, San Diego, CA, USA, 2008.
33 A. Laurberg Vig, T. Makela, P. Majander, V. Lambertini,J. Ahopelto and A. Kristensen, J. Micromech. Microeng.,2011, 21, 035006.
This journal is © The Royal Society of Chemistry 2016