Volume 7, Issue 9 • September 2017 Oklahoma Economic … · vestige of Ronald Reagan has even...
8
A publication of the Office of the State Treasurer • Treasurer Ken Miller, Ph.D. Economic Report TM Oklahoma News and analysis of Oklahoma’s economy State Capitol Building, Room 217 • Oklahoma City, OK 73105 • (405) 521-3191 • www.treasurer.ok.gov Volume 7, Issue 9 • September 2017 SEE SPECIAL PAGE 4 Depending on who you listen to, either Oklahoma’s safety net services are teetering on the brink of collapse after tax cuts have left the coffers bare, or evil bureaucrats are plotting to steal hard-earned money from poor, suffering taxpayers for no good reason. Such is the scenario in the ongoing political theater of the First Extraordinary Session of the 56th Oklahoma Legislature, where the vestige of Ronald Reagan has even been pressed into service. After the state supreme court declared as unconstitutional a late- session attempt to raise more than $200 million from a $1.50 per pack assessment – termed a “fee” – on cigarettes, Governor Mary Fallin called this latest special session to fill the resulting budget hole and make long-term changes to correct an existing structural budget imbalance. Opponents and proponents are playing to the extremes in the battle for the hearts and minds of legislators and the electorate. But, as is often the case during pitched battles over taxes, the unvarnished truth likely lies somewhere in between. The final chapter of this special session has yet to be written, but it is not the first, or likely the last, to be called to address some of Oklahoma’s most pressing problems. Well, isn’t that special? Inside • Treasurer’s commentary: In defense of conservatism • September Gross Receipts to the Treasury show growth in income, sales and energy • For second month, state jobless rate tops U.S. rate in August • Economic Indicators Editor Tim Allen, Deputy Treasurer for Communications and Program Administration “ . . . the vestige of Ronald Reagan has even been pressed into service.” Incentive Evaluation Commission consultant recommends elimination of capital gains tax credit SEE ELIMINATE PAGE 3 The consultant for the state’s Incentive Evaluation Commission (IEC) is recommending ending a 12-year-old capital gains deduction. “The incentive overall cannot, with the data available, be credibly shown to have significant economic impact or a positive return on investment for the State,” PFM Group Consulting LLC writes in its executive summary presented to the commission on September 29. The deduction, started in 2005 for individuals and in 2006 for corporations, allows deduction of gains from the sale of Oklahoma capital. The rationale for the deduction is to encourage capital investment in the state. However, in its report, PFM writes that between 2010 and 2014 the program is estimated to have
Transcript of Volume 7, Issue 9 • September 2017 Oklahoma Economic … · vestige of Ronald Reagan has even...

A publication of the Office of the State Treasurer • Treasurer Ken Miller, Ph.D.
Economic Report TM
Oklahoma
News and analysis of Oklahoma’s economy
State Capitol Building, Room 217 • Oklahoma City, OK 73105 • (405) 521-3191 • www.treasurer.ok.gov
Volume 7, Issue 9 • September 2017
SEE SPECIAL PAGE 4
Depending on who you listen to, either Oklahoma’s safety net services are teetering on the brink of collapse after tax cuts have left the coffers bare, or evil bureaucrats are plotting to steal hard-earned money from poor, suffering taxpayers for no good reason.
Such is the scenario in the ongoing political theater of the First Extraordinary Session of the 56th Oklahoma Legislature, where the vestige of Ronald Reagan has even been pressed into service.
After the state supreme court
declared as unconstitutional a late-session attempt to raise more than $200 million from a $1.50 per pack assessment – termed a “fee” – on cigarettes, Governor Mary Fallin called this latest special session to fill the resulting budget hole and make long-term changes to correct an existing structural budget imbalance.
Opponents and proponents are playing to the extremes in the battle
for the hearts and minds of legislators and the electorate. But, as is often the case during pitched battles over taxes,
the unvarnished truth likely lies somewhere in between.
The final chapter of this special session has yet to be written, but it is not the
first, or likely the last, to be called to address some of Oklahoma’s most pressing problems.
Well, isn’t that special?
Inside
• Treasurer’s commentary: In defense of conservatism
• September Gross Receipts to the Treasury show growth in income, sales and energy
• For second month, state jobless rate tops U.S. rate in August
• Economic Indicators
Editor
Tim Allen, Deputy Treasurer for Communications and Program Administration
“. . . the vestige of Ronald Reagan has even been pressed into service.”
Incentive Evaluation Commission consultant recommends elimination of capital gains tax credit
SEE ELIMINATE PAGE 3
The consultant for the state’s Incentive Evaluation Commission (IEC) is recommending ending a 12-year-old capital gains deduction.
“The incentive overall cannot, with the data available, be credibly shown to have significant economic impact or a positive return on investment for the State,” PFM Group Consulting LLC writes in its executive summary presented to the commission on September 29.
The deduction, started in 2005 for individuals and in 2006 for corporations, allows deduction of gains from the sale of Oklahoma capital.
The rationale for the deduction is to encourage capital investment in the state. However, in its report, PFM writes that between 2010 and 2014 the program is estimated to have
Treasurer’s CommentaryBy Ken Miller, Ph.D.
Oklahoma Economic Report TM September 2017
www.treasurer.ok.gov • Page 2
If all your friends jumped off a fiscal cliff, would you do it too?
The answer from Senator Tom Coburn and Representative Tom Cole is no.
Though staunchly opposed to increasing tax rates, both men recently made national headlines; Coburn for his willingness to increase receipts by eliminating loopholes and preferential tax treatments and Cole for suggesting Republicans accept a compromise solution ensuring 98-percent of Americans avoid a tax hike.
Grover Norquist claims both positions defy the anti-tax pledge, the revenue-neutral standard for tax policy changes made famous by his Americans for Tax Reform advocacy group.
Until now, ideology-based conservatives like Norquist have defined conservatism by their own terms. Absurdly, yet expectedly, the
conservative credentials of both Coburn and Cole are under fire. Such reality-based conservatives who dare step out, or in it, get branded with the M-word to be thrashed about in the public square clothed in the “moderate” label regardless of the fit.
Norquist lambasted Coburn saying, “he lied his way into office.” Coburn struck back by defining the difference between cheap and courageous conservatism, stating the former is that of rhetoric, pledges and pandering while the latter is that of truth, action, solutions and sacrifice.
Oklahoma also has ideologically-driven interest groups that seek their own definition of conservatism.
One such group, the Oklahoma
Council of Public Affairs, has upped the ante on the Norquist gold standard where anything short of complete elimination of the state’s largest source of revenue is deemed not conservative.
Is it not conservative to be cautious in our approach to needed income tax reduction, to protect the state credit rating, to pay our debts and to ensure sufficient funding for core services with a diversified and dependable revenue structure?
In Oklahoma, those who say cuts in tax rates should be offset by cuts in spending and by broadening the base – ironically the very position heralded as conservative at the federal level– are burnished with the moderate brand.
Perhaps one can find some humor in the dictionary definition of conservative as “moderately cautious.” Its synonyms –
In defense of conservatism
SEE COMMENTARY PAGE 3
“Reality-based conservatives get thrashed about in the public square clothed in the ‘moderate’ label regardless of the fit.”
EDITOR’S NOTE: This commentary was originally published in November 2012. Unfortunately, these words remain relevant five years later in the current debate about addressing Oklahoma’s ongoing revenue problem.

www.treasurer.ok.gov • Page 3
Oklahoma Economic Report TM September 2017
Opinions and positions cited in the Oklahoma Economic ReportTM are not necessarily those of Oklahoma State Treasurer Ken Miller or his staff, with the exception of the Treasurer’s Commentary, which of course, is the viewpoint of the treasurer.
CommentaryFROM PAGE 2
reasonable, temperate and judicious – are descriptors that most would normally appreciate. But for us on the right, the term “moderate” is decidedly negative and misdirected at reality-based conservatives who dare question the ideological.
Even with a consistent record of cutting taxes and spending, this conservative economist was dinged for questioning a study by Arduin, Laffer and Moore and even jabbed in a Wall Street Journal editorial for issuing a “bogus” opposing report.
Of course, no such report existed and the editorial was written by Stephen Moore, who along with Laffer was being paid by OCPA for services rendered. Seemingly forgotten was that our policy positions are in alignment much
more often than not.
Recently, the Oklahoman urged “caution in cutting the income tax without offsets,” siding with the more “moderate voices.” Their use of the M-word may be correct according to Webster’s.
But in politics such characterization scores a win for the agenda-driven ideologues who seek to redefine conservatism, which begs the question: moderate compared to what?
Ronald Reagan, the deserved standard bearer of conservative principles, would no doubt be attacked in today’s political climate since he failed the revenue-neutral test by signing several tax increases.
The fact that he greatly lowered
income tax rates overall and shrunk the highest marginal rate from 70 to 28 percent would not be good enough.
When reminded of this inconvenient fact, Republican Senator Jon Kyl said, “Reagan was in a situation where he had to compromise in order to get some things done.” Gee, with the pending fiscal cliff and three years with no federal budget, I guess we’re not there yet.
Though the 100-percent litmus test currently shows little sign of abatement, with principled statesmen like Coburn reclaiming the real(ist) definition of conservatism, perhaps soon we will be able to focus our energy on the 99-percent where conservatives agree rather than the 1-percent where we do not.
FROM PAGE 1
Eliminate
Read the PFM evaluation of the Capital Gains Tax Deduction at https://go.usa.gov/xnczS
created a net loss of $465 million in state tax revenue.
As an alternative, PFM offered three changes in the deduction, should the program remain in place:
1. Target the incentive to a specific industry to make determining the success of the program easier and to limit the risk to the state.
2. Require gains to be re-invested in Oklahoma. No such requirement currently exists. The change would ensure better returns for the state.
3. Improve data aggregation to allow better measurement of the deduction’s impact.
The IEC, which is required to issue a report to the Legislature by the end of the year, has not yet decided
whether to adopt the consultant’s recommendation.
Learn more

www.treasurer.ok.gov • Page 4
Oklahoma Economic Report TM September 2017
FROM PAGE 1
Special
A total of 12 special sessions have been called in the past 30 years, according to the website of the Oklahoma Secretary of State.
Nine special sessions were called by Republican governors – four by Henry Bellmon, three by Frank Keating, and two by Fallin. Two were called by Democratic Governor David Walters, while Democrat Brad Henry called one.
Disparate reasons
Special session topics have included emergencies, such as recovery from the 1995 Murrah Building bombing and rebuilding correctional facilities following a 1988 prison riot, to business recruitment, with tax incentives passed to attempt to lure a $1 billion United Airlines facility to the state.
Other reasons have included workers compensation reform, Truth in Sentencing, finishing a budget and tax agreement, and a proposed reduction in the gross production tax during an oil price downturn in 1998-1999.
Hard ball politics were behind two 1987 special sessions called by Bellmon to push through reforms at the Oklahoma Tax Commission (OTC). The second session was called immediately after the Legislature adjourned the first without taking any action.
To leverage legislative action, Bellmon vetoed the OTC appropriation and allowed the agency to shut down until reforms were passed.
The big one
The most significant special session of the past generation was called by Bellmon in late 1989 to enact reforms in common education and raise taxes to fund them.
It lasted seven-and-a-half months, and included heated rhetoric and a march on the State Capitol Building by several hundred teachers. The result included class size limitations, abolishment of county school superintendents, and a teacher pay raise.
Increases in individual and corporate income tax rates and a half-cent hike in the sales tax raised $230 million.
When he signed House Bill 1017 into law, Bellmon called it, “probably the most pleasurable moment of my political career.”
State supreme court action
Both special sessions called by Governor Fallin have come in reaction to rulings by the state supreme court.
In 2013, she called legislators into session to pass tort reform. The court had thrown out the original legislation because it contained multiple subjects and violated the constitutional prohibition against logrolling. The bill was divided into some two dozen measures that were passed in special session.
The current special session was prompted by the court finding the cigarette fee was passed in violation of tax increase provisions of the state constitution.
Gov. Henry BellmonJuly 1 & 6, 1987 - Tax Commission reformAugust 16, 1988 - PrisonsJuly 11, 1989 - Education & tax increases
Gov. David WaltersJanuary 14, 1991 - United Airlines tax incentivesJune 20, 1994 - Workers compensation reform
Gov. Frank KeatingMay 18, 1995 - Murrah bombing recoveryJune 15, 1998 - Truth in SentencingJanuary 20, 1999 - Gross Production tax cut
Gov. Brad HenryMay 25, 2006 - Budget and tax cuts
Gov. Mary FallinSeptember 3, 2013 - Tort reformSeptember 25, 2017 - Budget shortfall, teacher pay
Special Sessions

www.treasurer.ok.gov • Page 5
Oklahoma Economic Report TM September 2017
September Gross Receipts to the Treasury show growth in income, sales and energySeptember Gross Receipts to the Treasury provide further evidence of economic recovery in Oklahoma, as total collections top those from the same month of the prior year for a sixth consecutive month, State Treasurer Ken Miller announced October 4.
Gross receipts for September are $1 billion, ahead of collections from last September by $72.4 million, or 7.7 percent.
Gross receipts from the past 12
months, at $11.2 billion, are more than those from the prior 12 months by 2.3 percent, or just over $250
million, Miller said.
“Economic momentum in the state is going up,” Miller said. “In September, gross receipts show
increased income and consumption, attributable at least in part to increased oil field activity during the past several months.”
All major revenue streams, except for
SEE REVENUE PAGE 6
“Economic momentum in the state is going up.”
August Gross Receipts to the Treasury totalled $879.7 million, while the General Revenue Fund (GRF), as reported by the Office of Management and Enterprise Services, received $413.7 million, or 47%, of the total.
The GRF received between 32.7% and 54.1% of monthly gross receipts during the past 12 months.
From August gross receipts, the GRF received:
• Individual income tax: 59.8%
• Corporate income tax: 26.9%
• Sales tax: 45.3%
• Gross production-Gas: 71.1%
• Gross production-Oil: 13.3%
• Motor vehicle tax: 25.7%
• Other sources: 40.9%
August GRF allocations are above the estimate by 1.9 percent. Fiscal-year-to-date collections are ahead of the estimate by 0.9 percent.
August insurance premium taxes totaled $5.98 million, a decrease of $6.83 million, or 53.3%, from the prior year.
Tribal gaming fees generated $11.2 million during the month, up by $693,350, or 6.6%, from August 2016.
August Gross Receipts to the
Treasury & General Revenue compared
Source: Office of the State Treasurer
Monthly Gross Receipts vs. Prior Year
Dollar change (in millions) from prior year
Income Tax Sales TaxGross Production Motor Vehicle Other-$50
-$25
$0
$25
$50
Oct-16
Nov-16Dec-16
Jan-17Feb-17
Mar-17Apr-17
May-17Jun-17
Jul-17Aug-17
Sep-17
PRELIMINARY September-16 September-17 Variance From Prior Year Variance From Prior YearIncome Tax $349.4 $368.0 $18.6 5.3%Gross Production $31.5 $50.2 $18.7 59.4%Sales Tax (1) $348.4 $384.2 $35.8 10.3%Motor Vehicle $64.3 $60.0 -$4.3 -6.7%Other Sources (2) $146.0 $149.6 $3.6 2.5%TOTAL REVENUE $939.6 $1,012.0 $72.4 7.7%

www.treasurer.ok.gov • Page 6
Oklahoma Economic Report TM September 2017
RevenueFROM PAGE 5
motor vehicle taxes, are up over the prior year in September. The gross production tax on oil and natural gas is ahead of last September’s receipts by almost 60 percent.
Gross income tax collections are up by more than 5 percent, and sales tax is higher by more than 10 percent. Motor vehicle receipts are off from last year’s receipts by 6.7 percent.
The 12-month picture shows continued, steady growth. Only corporate income tax payments are shown as lower than those from the previous 12-month period.
Growth in individual income, sales, gross production and motor vehicle taxes show increases ranging from 0.5 percent to 41.8 percent.
New revenue boosts bottom line
New revenue resulting from legislation enacted earlier this year is boosting monthly receipts. The tax commission attributes a total of $23.8 million in September to those law changes.
The largest amount, $11.1 million, came from a new 1.25 percent state sales tax on motor vehicles. A $5 fee on motor vehicle registration increased collections by $1.5 million for the month.
Changing the 1 percent horizontal drilling gross production tax rate to 4 percent generated $6.9 million during the month. Elimination and suspension of gross production rebate payments added $3 million to gross collections.
Ending a discount for businesses that remit sales tax added $1.3 million for the month, and a new fee assessed on professional sports tickets contributed $102,473.
Since August, the law changes have yielded $40.5 million in new gross revenue.
September collections
September gross collections total $1 billion, up $72.4 million, or 7.7 percent, from September 2016.
Gross income tax collections, a combination of personal and corporate income taxes, generated $368 million, an increase of $18.6 million, or 5.3 percent, from the previous September.
Individual income tax collections for the month are $297.5 million, up by $14.1 million, or 5 percent, from the prior year. Corporate collections are $70.5 million, an increase of $4.5 million, or 6.7 percent.
Sales tax collections, including remittances on behalf of cities and counties, total $384.2 million in September. That is $35.8 million, or 10.3 percent, more than September 2016.
Gross production taxes on oil and natural gas generated $50.2 million in September, an increase of $18.7 million, or 59.4 percent, from last September. Compared to August reports, gross production collections are up by $6.4 million, or 14.6 percent.
SEE REVENUE PAGE 7Source: Oklahoma Tax Commission
Gross Production Tax CollectionsOctober 2015 – September 2017
$0
$20
$40
$60
Oct Nov Dec Jan Feb Mar Apr May Jun Jul Aug Sep
Prior 12 monthsCurrent 12 months
(in m
illio
ns)

www.treasurer.ok.gov • Page 7
Oklahoma Economic Report TM September 2017
For second month, state jobless rate tops U.S. rate in AugustOklahoma’s seasonally-adjusted unemployment rate rose one-tenth of a percentage point to 4.5 percent in August, according to figures released by the Oklahoma Employment Security Commission.
State jobless numbers improved by five-tenths of a percentage point over the year.
For a second consecutive month, the Oklahoma rate is one-tenth of a percentage point higher than the U.S. jobless rate.
Motor vehicle taxes produced $60 million, down by $4.3 million, or 6.7 percent, from the same month of last year.
Other collections, consisting of about 60 different sources including use taxes, along with taxes on fuel, tobacco, and alcoholic beverages, produced $149.6 million during the month. That is $3.6 million, or 2.5 percent, more than last September.
Twelve-month collections
Gross revenue totals $11.2 billion from the past 12 months. That is $251.8 million, or 2.3 percent, more than collections from the previous 12 months.
Gross income taxes generated $4 billion for the October 2016-September 2017 period, reflecting a decrease of $39.4 million, or 1 percent, from the October
RevenueFROM PAGE 6 2015-September 2016 period.
Individual income tax collections total $3.6 billion, up by $16.2 million, or 0.5 percent, from the prior 12 months. Corporate collections are $403.5 million for the period, a decrease of $55.6 million, or 12.1 percent, over the previous period.
Sales taxes for the period generated $4.3 billion, an increase of $81.9 million, or 1.9 percent, from the prior year.
Oil and gas gross production tax collections brought in $484.8 million during the past 12 months, up by $142.9 million, or 41.8 percent, from the previous 12-month period.
Motor vehicle collections total $756.1 million for the period. This is an increase of $6.2 million, or 0.8 percent, from the trailing period.
Other sources generated $1.6 billion,
up by $60.2 million, or 3.8 percent, from the previous 12 months.
About Gross Receipts to the Treasury
Since March 2011, the Office of the State Treasurer has issued the monthly Gross Receipts to the Treasury report, which provides a timely and broad view of the state’s macro economy.
It is provided in conjunction with the General Revenue Fund allocation report from the Office of Management and Enterprise Services, which provides important information to state agencies for budgetary planning purposes.
The General Revenue Fund receives less than half of the state’s gross receipts with the remainder paid in rebates and refunds, remitted to cities and counties, and placed into off-the-top earmarks to other state funds.
O K L A H O M A E M P L O Y M E N T S E C U R I T Y C O M M I S S I O N
Economic Research & Analysis …Bringing Oklahoma’s Labor Market to Life!
This publication is produced by the Economic Research & Analysis (ER&A) division of the Oklahoma Employment Security Commission as a no cost service. All information contained within this document is available free of charge on the OESC website (www.ok.gov/oesc_web/Services/Find_Labor_Market_Statistics/index.html) and through labor market information (LMI) publications developed by the ER&A division. All statistics are preliminary and have been adjusted for seasonal factors. Beginning in January 2010, seasonally adjusted LAUS estimates are calculated using a new methodology designed to reduce estimation volatility. More information on this change can be found at www.bls.gov/lau/lassaqa.htm. All data is collected under strict guidelines provided by the Bureau of Labor Statistics. Although a large amount of data has been presented, this in no way suggests that all data has been included. Due to space restrictions, only relevant industries and sectors are included. Unless otherwise noted, data is rounded to the nearest 10.
FOR RELEASE: September 15, 2017
OKLAHOMA EMPLOYMENT REPORT – August 2017 Oklahoma unemployment rate up again in August Oklahoma’s seasonally adjusted unemployment rate rose to 4.5 percent in August, while the U.S. unemployment rate was little changed at 4.4 percent in August. The state’s seasonally adjusted unemployment rate was down by 0.5 percentage point compared to August 2016.
In August, statewide seasonally adjusted employment decreased by 97 persons (0.0 percent), and unemployment increased at the same time by 2,274 persons (2.9 percent). Over the year, seasonally adjusted unemployment fell by 10,034 persons (-11.0 percent).
August 2017Unemp.
rate* Labor force* Employment* Unemployment*
Oklahoma 4.5% 1,819,326 1,737,850 81,476United States 4.4% 160,571,000 153,439,000 7,132,000
* Data adjusted for seasonal factors
OKLAHOMAUnemp.
rate* Labor force* Employment* Unemployment*
Aug '17 4.5% 1,819,326 1,737,850 81,476July '17 4.4% 1,817,149 1,737,947 79,202
June '17 4.3% 1,822,548 1,743,629 78,919May '17 4.3% 1,830,811 1,751,784 79,027April '17 4.3% 1,835,764 1,757,402 78,362
Mar'17 4.3% 1,836,595 1,756,875 79,720
Aug '16 5.0% 1,823,438 1,731,928 91,510
* Data adjusted for seasonal factors
August 2017 Number Percent Number Percent
Labor force 2,177 0.1% -4,112 -0.2%Employment -97 0.0% 5,922 0.3%
Unemployment 2,274 2.9% -10,034 -11.0%
Monthly change* Annual change*
* Data adjusted for seasonal factors
Oklahoma Unemployment ReportAugust 2017
Source: OESC
www.treasurer.ok.gov • Page 8
Oklahoma Economic Report TM
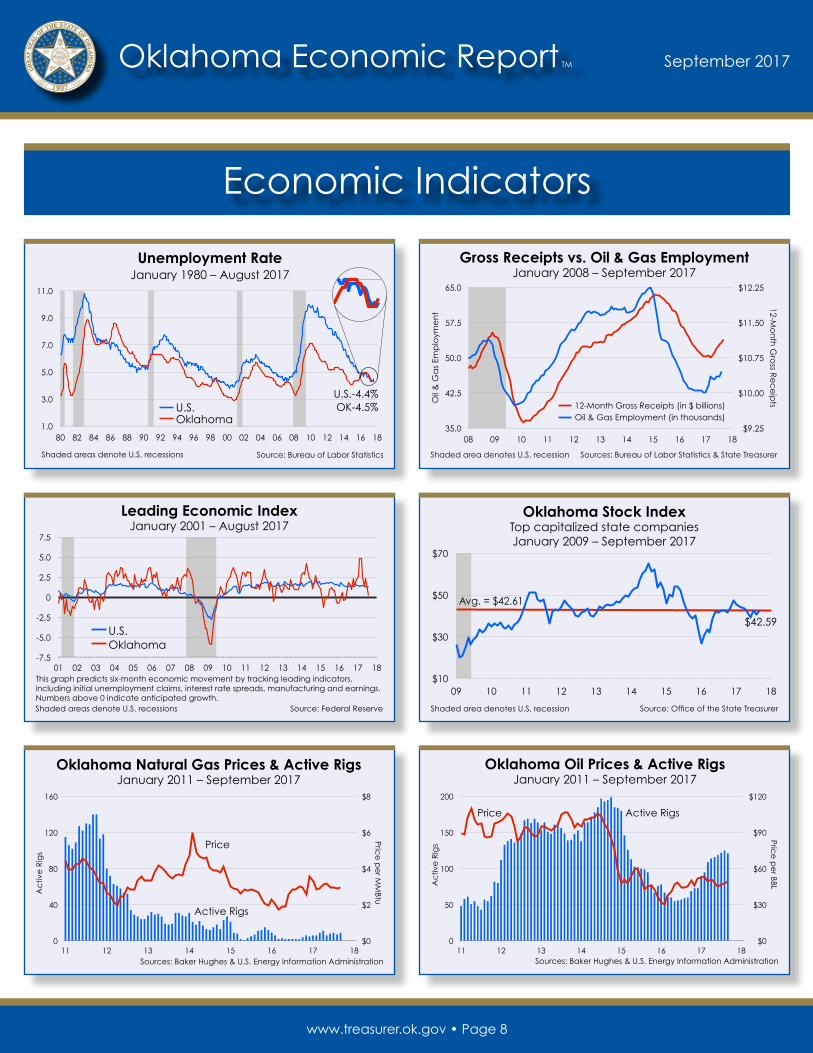
Economic Indicators
September 2017
$10
$30
$50
$70
09 10 11 12 13 14 15 16 17 18
Oklahoma Stock IndexTop capitalized state companiesJanuary 2009 – September 2017
Shaded area denotes U.S. recession Source: Office of the State Treasurer
Avg. = $42.61
$42.59
U.S.Oklahoma
1.0
3.0
5.0
7.0
9.0
11.0
80 82 84 86 88 90 92 94 96 98 00 02 04 06 08 10 12 14 16 18
Source: Bureau of Labor Statistics
Unemployment RateJanuary 1980 – August 2017
Shaded areas denote U.S. recessions
OK-4.5%U.S.-4.4%U.S.
Oklahoma1.0
3.0
5.0
7.0
9.0
11.0
80 82 84 86 88 90 92 94 96 98 00 02 04 06 08 10 12 14 16 18
Sources: Baker Hughes & U.S. Energy Information Administration
Oklahoma Natural Gas Prices & Active RigsJanuary 2011 – September 2017
0
40
80
120
160
11 12 13 14 15 16 17 18$0
$2
$4
$6
$8
Active Rigs
Price
Price
pe
r MM
Btu
Ac
tive
Rig
s
Oklahoma Oil Prices & Active RigsJanuary 2011 – September 2017
Sources: Baker Hughes & U.S. Energy Information Administration
Price
pe
r BBLAc
tive
Rig
s
0
50
100
150
200
11 12 13 14 15 16 17 18$0
$30
$60
$90
$120
Active RigsPrice
Gross Receipts vs. Oil & Gas EmploymentJanuary 2008 – September 2017
Shaded area denotes U.S. recession Sources: Bureau of Labor Statistics & State Treasurer
35.0
42.5
50.0
57.5
65.0
08 09 10 11 12 13 14 15 16 17 18$9.25
$10.00
$10.75
$11.50
$12.25
Oil
& G
as
Emp
loym
en
t
12-Mo
nth
Gro
ss Re
ce
ipts 12-Month Gross Receipts (in $ billions)
Oil & Gas Employment (in thousands)
Leading Economic IndexJanuary 2001 – August 2017
Source: Federal ReserveShaded areas denote U.S. recessions
This graph predicts six-month economic movement by tracking leading indicators, including initial unemployment claims, interest rate spreads, manufacturing and earnings. Numbers above 0 indicate anticipated growth.
U.S.Oklahoma
-7.5
-5.0
-2.5
0
2.5
5.0
7.5
01 02 03 04 05 06 07 08 09 10 11 12 13 14 15 16 17 18


![Untitled-1 [] · GOLD PATCHES VESTIGE detox footpatches . Detox & Rejuvenation dietary . Plus Vestige Hoodia Plus Fitness + Diet VESTIGE slimming capsules Fitness + Diet VESTIGE protein](https://static.fdocuments.us/doc/165x107/5f4881605320ff26161a56ca/untitled-1-gold-patches-vestige-detox-footpatches-detox-rejuvenation.jpg)