Volume 42 CONSULTING ECOLOGY - ecansw.org.au
28
Volume 42 CONSULTING ECOLOGY February 2019 Journal of the Ecological Consultants Association of NSW www.ecansw.org.au ISSN 1836 – 6813
Transcript of Volume 42 CONSULTING ECOLOGY - ecansw.org.au

Volume 42
CONSULTING ECOLOGY February 2019
Journal of the Ecological Consultants Association of NSW
www.ecansw.org.au
ISSN 1836 – 6813
VOLUME 42 February 2019
INSIDE THIS ISSUE!
1 ECA Office Bearers 2018-2019
1 Message from the Acting President
3 Photo Competition
3 ECA Research Grant Winners 2019
4 Euroky - Hunt for the Coconut Crab
5 Euroky - Rocky Creek Dam Tunnel
7 Upcoming events
7 Membership report
7 Recent Literature
10 Scat and hair analysis: do’s, don’ts and possibilities
11 The Greenspace Bird Calculator: a tool to help monitor avian biodiversity in urban greenspaces
16 Environmental DNA: A Tool for the Future in Ecological Consultancy
24 Advertising with the ECA
24 Contributions to the Newsletter, Volume 41
Back cover ECA Photo Gallery
Editor: Brian Wilson
Design and Layout: Amy Rowles
Front Cover Photo: Diuris pardina in Kosciuszko National Park.
Courtesy of Amy Rowles

ECA Office Bearers 2018-2019
President:
Belinda Pellow
1st Vice-President:
Stephen Ambrose
2nd Vice-President:
Danny Wotherspoon
Secretary:
Adam Greenhalgh
Treasurer:
Andrew Lothian
Councillors:
Martin Denny
Alison Hunt
Veronica Silver
Daniel McDonald
Narawan Williams
Jason Berrigan
Ashleigh McTackett
John Travers
Administration Assistant:
Membership Officer:
Amy Rowles
Administration Assistant:
Membership Officer:
Amy Rowles
415 Parishs Road,
Hilldale NSW 2420
Message from the Acting President
Dear Members,
I am writing this message on a cold winter’s day (strange,
considering that this issue of Consulting Ecology is February 2019!).
It is equally unusual that I am the one writing it! However, I am
keeping the seat warm for Belinda Pellow, who has temporarily
stepped down from Presidential duties while she recovers from
hospital surgery and receives post-operative treatment. On behalf of
all ECA members, I wish Belinda a speedy and complete return to
good health so that she can once again be at the head of the ECA
Council table.
Annual Conference and Workshops
While you may not have heard from the ECA Council for a while,
we have been really busy organising events and liaising with the
NSW Government on your behalf.
Make sure that you register quickly for the ECA Annual
Conference, annual general meeting and workshop that will be held
at the Hunter Valley Retreat in Quorrobolong on 25-26 July 2019.
The theme of the conference is BAM Assessment and Stewardship
Site Management (25 July). We have a great line-up of speakers
from the Office of Environment and Heritage (OEH) and
Biodiversity Conservation Trust (BCT). Other OEH and BCT officers
will also be present to mingle with the crowd on the day, so it will
be a perfect opportunity for ECA members to corner a public
servant and ask those difficult questions over lunch or a tea break!
But wait, there’s more! (No, I’m not about to offer you a free set of
steak knives). Stick around after the conference because on the
following day we have a Nest Box Workshop. I’m honestly really
excited about this one because the workshop presents latest
research on nest box design and placement presented by university
researchers, government scientists and ecological consultants.
Many thanks to ECA councillors, Daniel MacDonald, Jason Berrigan
and Narawan Williams, in particular, for organising the topics and
speakers for both of these events.
There are other workshops at various stages of planning, including
one on Camera Trapping, Orchid Identification and Application of
Environmental DNA in ecological consultancy. You will hear more
about these over the coming months.
ECA COUNCIL MEETINGS
The ECA Council meet every
three months to discuss and deal
with any current business of the
association. Any member who
wishes to view the minutes from
any of the ECA council meetings
may do so by contacting the
Administration Assistant Amy
Rowles [email protected]

2
Liaison with OEH
The ECA Council has spent a considerable amount of time and resources over the last 12 months liaising with
OEH and the BCT about the Biodiversity Offsets Scheme and the administration of BAM. This has been mostly in
response to numerous concerns that ECA members have expressed to the Council about the BAM process.
Belinda Pellow took up the challenge of liaising with OEH from the start of her ECA presidency. This has
resulted in numerous email conversations and a few ad hoc meetings between representatives of the ECA and
OEH. The clear message that the ECA Council is receiving from members is one of frustration, anger and
confusion about aspects of the BAM process. The ECA now has an agreement to meet with OEH to discuss these
problems on a regular basis (quarterly in the immediate term, probably biannually in the longer-term). The first
of these regular meetings was held on 30 May when Alison Hunt, Martin Denny and I met with OEH Officers to
discuss grievances made known to the ECA Council by members who are also BAM Accredited Persons. It was a
positive meeting, but there is still a long way to go to smooth out the scheme’s teething problems. As an ECA
member you should have received an ECA Information Email in early June with a summary of the outcomes of
that meeting. The next meeting with OEH (or its new incarnation) will be in late September/early October, so
please send us topics for us to raise on your behalf.
University Student Grants
The ECA received 13 applications for student grants this year, all of which were a high standard. But at the end
of the day there could only be three winners. These were:
Conservation Grant ($2,000): Chantelle Doyle, University of NSW. Project: Ecology of the critically-endangered
Hibbertia spanantha.
Ray Williams Mammal Research Grant ($2,000): Amy Rowles, Western Sydney University. Project: Seasonal
importance of high-elevation habitat for Australian bats.
Terrestrial Ecology ($1,000): Grant Webster, Macquarie University. Project: The ecology of the newly described
and endangered frog, Uperoleia mahonyi.
Thanks to John Travers, Alison Hunt and Jason Berrigan in joining me to select the successful projects this year.
Thanks, also, to John for his generous donation of the Terrestrial Ecology Grant. We definitely wish all the
applicants the very best with their projects!
ECA Facebook Page
The ECA’s official Facebook has been up-and-running since December 2018. It’s your opportunity to share
information and techniques, seek assistance from peers and discuss the application of planning and biodiversity
legislation. Check it out at the following link: https://www.facebook.com/NSW-Ecological-Consultants-
Association-2195001584086048/?ref=py_c . Many thanks to Jason Berrigan for setting up the Facebook page and
acting in the role of page administrator.
Consulting Ecology
We need more articles!
I frequently (and I really do mean “frequently”) hear ECA members say they really look forward to receiving
their regular copy of Consulting Ecology. It is a valuable source of information, as well as containing really great
pictures and a few articles of light and collegiate entertainment. It keeps us all in touch with one another and,
more importantly, highlights some of the professional challenges and solutions that you may have thought were
relevant just to you.
3
PHOTO
COMPETITION Due to only a small number of entries, Amy Rowles
entered some photos into the competition, as one of
these was anonymously selected there is no winner
this edition.
Thank you to everyone who entered our photo
competition. All entries have been included in the
ECA Photo Gallery on the back cover
Email your favourite flora or fauna photo to
[email protected] to enter a competition and have
your photo on the cover of the next ECA newsletter.
Win your choice of one year free membership or free
entry into the next ECA annual conference. The winner
will be selected by the ECA council. Runners up will
be printed in the photo gallery
Photos entered in the competition may also be used on
the ECA website
ECA RESEARCH GRANT WINNERS 2019
Terrestrial Ecology Grant: ($1000)
Grant Webster, Macquarie University - The
ecology of the newly-described and endangered
frog, Uperoleia mahonyi
Ray Williams Mammal Research Grant: ($2000)
Amy Rowles, Western Sydney University —
Seasonal importance of high-elevation habitat for
Australian bats
ECA Conservation Grant ($2000):
Chantelle Doyle, University of NSW - Ecology
of the critically-endangered Hibbertia spanantha
If you have 2nd hand ecological equipment that you
would like to sell or would like to purchase you can place
an ad in this newsletter. Free for members or $40 for non
-members. Contact [email protected].
FOR SALE / WANTED
However, Consulting Ecology can only be compiled and despatched if we have material to put in it. You will
have noticed that this edition is slimmer and later than usual. That is because Amy Rowles (ECA Admin
Assistant) has not been receiving material from you (yes - YOU!) for inclusion in the journal. I realise that we are
all extremely busy, but please send your interesting observations, comments about the ecological industry,
photos of flora and fauna (camera trap photos are really interesting!), research articles, funny stories, in fact
anything that is relevant to ecological consultancy. If Amy doesn’t receive enough material for each issue, then
that will definitely mean slimmer issues and delayed deliveries to your mail box.
See you all at the annual conference and workshop in July. In the meantime, happy consulting!
Oh, and don’t forget to volunteer to stand for election to the ECA Council at this year’s annual general meeting.
It’s a really rewarding experience. Everyone has a lot to offer, no matter how experienced they are, or how
confident they feel about being involved. I’m sure that a few existing councillors would like a well-earned rest,
and it is always great to have a few people on board with a fresh outlook and a range of new skills.
Dr Stephen Ambrose
Acting President.
4
HUNT FOR THE COCONUT CRAB
Martin Denny
The Coconut Crab (Birgus latro) is considered to be
the largest land-living arthropod in the world,
growing up to 4.1 kg and 1 metre in size. Luckily
most are smaller, which is a relief as their pinchers
are large and can inflict considerable pain if they
latch onto an unsuspecting hand. Coconut Crabs are
found throughout the Indian Ocean and the central
Pacific Ocean, and are closely associated with
coconut palms. They were once found in Australia
but have long disappeared. The crabs range as far
west as Zanzibar and east to the Cook Islands. Not
all islands have these critters, but the Cook Islands,
along with Christmas Island, are known to support
large populations.
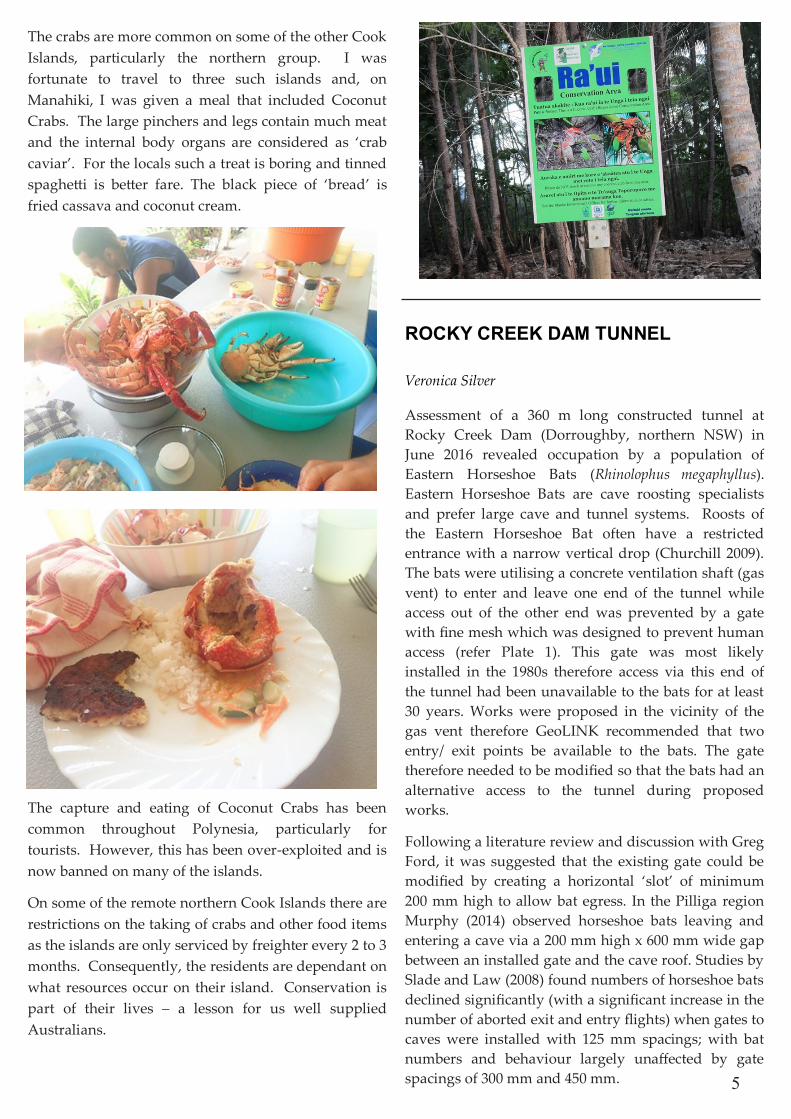
My experience of Coconut Crabs is mainly from one of
the southern Cook Islands, Mauke Island. Here, they
are known to occur, but not in large numbers. Locals
will search for them at night when the crabs exit their
day-time shelter within the rocky foreshore composed
of fossilised coral (makatea). On other islands they
burrow within the sandy soils near coconut palms. On
Mauke Island they line a hollow in the makatea with
coconut husk fibre.
Although they will eat coconuts they also forage for
many other food items and will take them back to their
rock crevices, hence the alternative name ‘robber crab’.
They have been known to kill and eat ship rats.
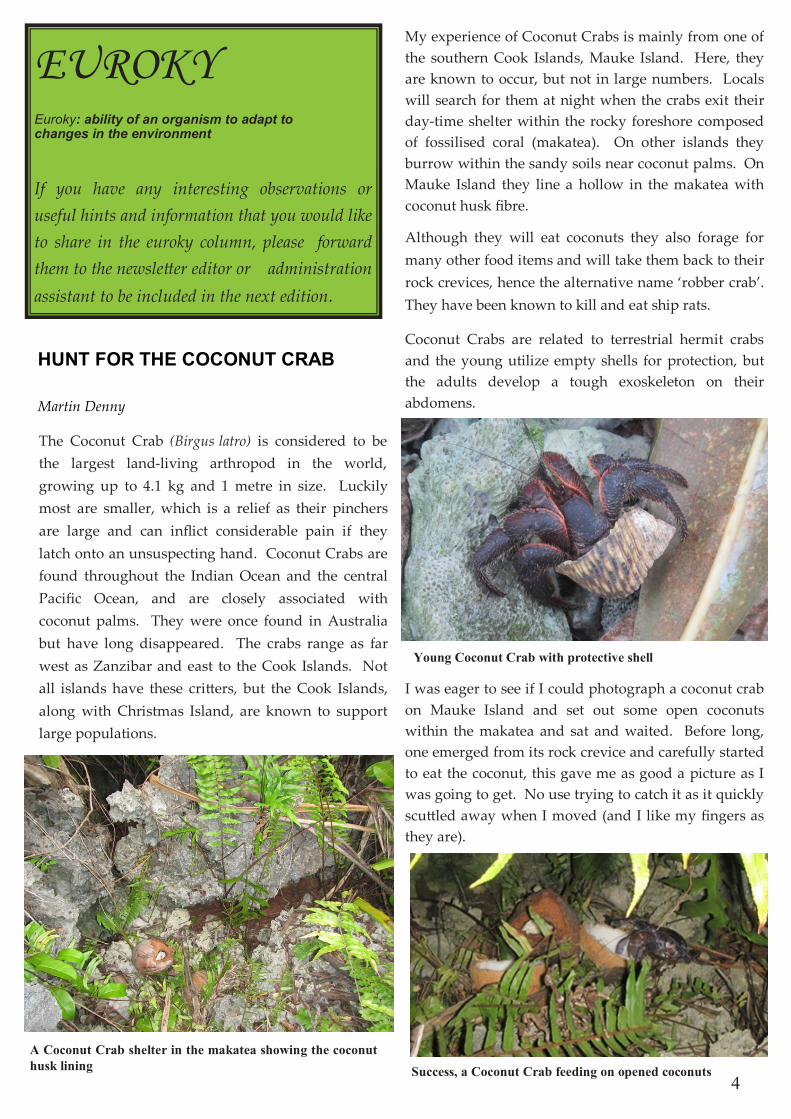
Coconut Crabs are related to terrestrial hermit crabs
and the young utilize empty shells for protection, but
the adults develop a tough exoskeleton on their
abdomens.
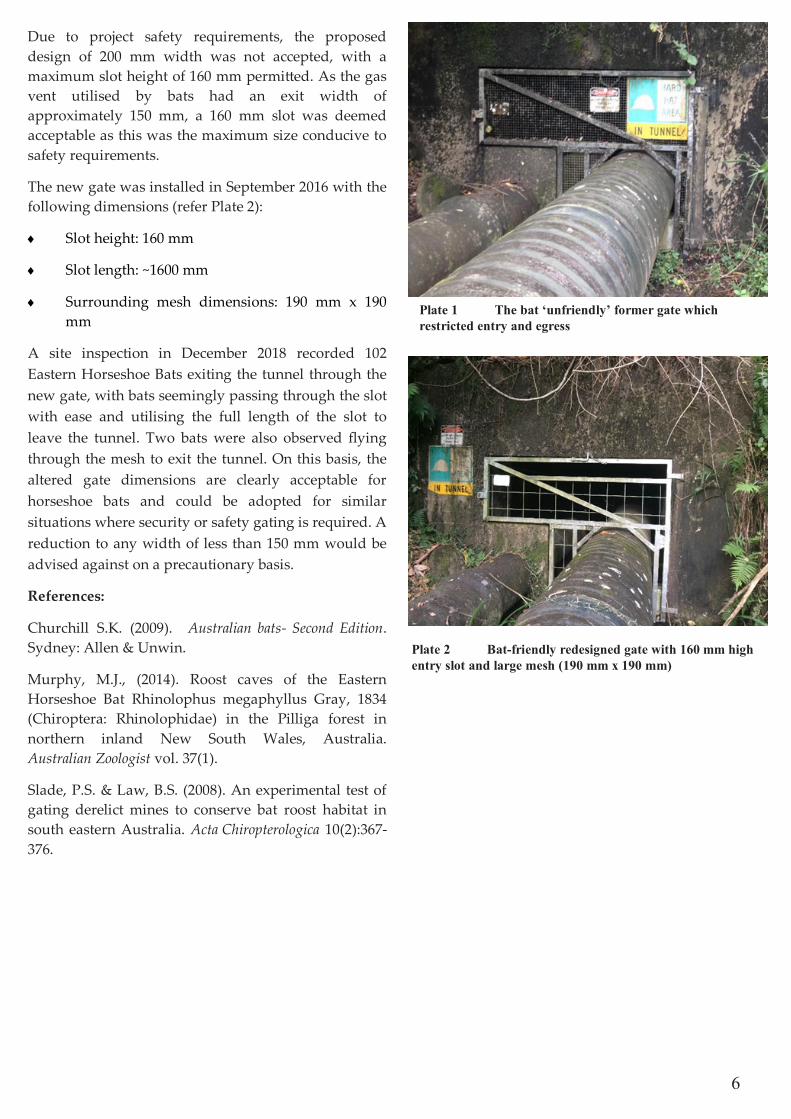
I was eager to see if I could photograph a coconut crab
on Mauke Island and set out some open coconuts
within the makatea and sat and waited. Before long,
one emerged from its rock crevice and carefully started
to eat the coconut, this gave me as good a picture as I
was going to get. No use trying to catch it as it quickly
scuttled away when I moved (and I like my fingers as
they are).
EUROKY Euroky: ability of an organism to adapt to changes in the environment
If you have any interesting observations or
useful hints and information that you would like
to share in the euroky column, please forward
them to the newsletter editor or administration
assistant to be included in the next edition.
A Coconut Crab shelter in the makatea showing the coconut
husk lining Success, a Coconut Crab feeding on opened coconuts
Young Coconut Crab with protective shell
5
The crabs are more common on some of the other Cook
Islands, particularly the northern group. I was
fortunate to travel to three such islands and, on
Manahiki, I was given a meal that included Coconut
Crabs. The large pinchers and legs contain much meat
and the internal body organs are considered as ‘crab
caviar’. For the locals such a treat is boring and tinned
spaghetti is better fare. The black piece of ‘bread’ is
fried cassava and coconut cream.
The capture and eating of Coconut Crabs has been
common throughout Polynesia, particularly for
tourists. However, this has been over-exploited and is
now banned on many of the islands.
On some of the remote northern Cook Islands there are
restrictions on the taking of crabs and other food items
as the islands are only serviced by freighter every 2 to 3
months. Consequently, the residents are dependant on
what resources occur on their island. Conservation is
part of their lives – a lesson for us well supplied
Australians.
ROCKY CREEK DAM TUNNEL
Veronica Silver
Assessment of a 360 m long constructed tunnel at
Rocky Creek Dam (Dorroughby, northern NSW) in
June 2016 revealed occupation by a population of
Eastern Horseshoe Bats (Rhinolophus megaphyllus).
Eastern Horseshoe Bats are cave roosting specialists
and prefer large cave and tunnel systems. Roosts of
the Eastern Horseshoe Bat often have a restricted
entrance with a narrow vertical drop (Churchill 2009).
The bats were utilising a concrete ventilation shaft (gas
vent) to enter and leave one end of the tunnel while
access out of the other end was prevented by a gate
with fine mesh which was designed to prevent human
access (refer Plate 1). This gate was most likely
installed in the 1980s therefore access via this end of
the tunnel had been unavailable to the bats for at least
30 years. Works were proposed in the vicinity of the
gas vent therefore GeoLINK recommended that two
entry/ exit points be available to the bats. The gate
therefore needed to be modified so that the bats had an
alternative access to the tunnel during proposed
works.
Following a literature review and discussion with Greg
Ford, it was suggested that the existing gate could be
modified by creating a horizontal ‘slot’ of minimum
200 mm high to allow bat egress. In the Pilliga region
Murphy (2014) observed horseshoe bats leaving and
entering a cave via a 200 mm high x 600 mm wide gap
between an installed gate and the cave roof. Studies by
Slade and Law (2008) found numbers of horseshoe bats
declined significantly (with a significant increase in the
number of aborted exit and entry flights) when gates to
caves were installed with 125 mm spacings; with bat
numbers and behaviour largely unaffected by gate
spacings of 300 mm and 450 mm.
6
Due to project safety requirements, the proposed
design of 200 mm width was not accepted, with a
maximum slot height of 160 mm permitted. As the gas
vent utilised by bats had an exit width of
approximately 150 mm, a 160 mm slot was deemed
acceptable as this was the maximum size conducive to
safety requirements.
The new gate was installed in September 2016 with the
following dimensions (refer Plate 2):
Slot height: 160 mm
Slot length: ~1600 mm
Surrounding mesh dimensions: 190 mm x 190
mm
A site inspection in December 2018 recorded 102
Eastern Horseshoe Bats exiting the tunnel through the
new gate, with bats seemingly passing through the slot
with ease and utilising the full length of the slot to
leave the tunnel. Two bats were also observed flying
through the mesh to exit the tunnel. On this basis, the
altered gate dimensions are clearly acceptable for
horseshoe bats and could be adopted for similar
situations where security or safety gating is required. A
reduction to any width of less than 150 mm would be
advised against on a precautionary basis.
References:
Churchill S.K. (2009). Australian bats- Second Edition.
Sydney: Allen & Unwin.
Murphy, M.J., (2014). Roost caves of the Eastern
Horseshoe Bat Rhinolophus megaphyllus Gray, 1834
(Chiroptera: Rhinolophidae) in the Pilliga forest in
northern inland New South Wales, Australia.
Australian Zoologist vol. 37(1).
Slade, P.S. & Law, B.S. (2008). An experimental test of
gating derelict mines to conserve bat roost habitat in
south eastern Australia. Acta Chiropterologica 10(2):367-
376.
Plate 1 The bat ‘unfriendly’ former gate which
restricted entry and egress
Plate 2 Bat-friendly redesigned gate with 160 mm high
entry slot and large mesh (190 mm x 190 mm)
7
ECA ANNUAL CONFERENCE
Date: 25-26 July 2019
Thursday conference: BAM Assessment and
Stewardship Site Management
Friday workshop : Nest-box workshop
Location: Hunter Valley Retreat, Quorrobolong NSW
Register: http://www.ecansw.org.au
ECA Camera Trap Workshop
Date: 6 September 2019
Presenter: Paul Meek, DPI
Location: Asquith Rugby Leagues Club, Waitara.
Register: http://www.ecansw.org.au
PROPOSED FUTURE ECA WORKSHOPS
Orchid Workshop
Date: August 2019
Location: TBA
Register your interest: [email protected]
eDNA Workshop
Date: 2019
Location: TBA
Register your interest: [email protected]
Vegetation Community Workshop—allocating
PCT’s
Date: 2019
Location: TBA
Register your interest: [email protected]
ESA19 Conference
Date: 24-29 November 2019
Location: Launceston, Tasmania
Theme: Ecology: science for practical solutions
Details: www.esa2019.org.au
EIANZ: Special forum on using eDNA for
wildlife detection
Date: 13 August 2019
Location: Maiden Theatre, Mrs Macquarie Rd, Sydney.
Details: www.eianz.org
RZS Forum: The Dingo Dilemma
Date: 7 September 2019
Location: Australian Museum, Sydney
Details: www.rzsnsw.org.au
In total we have 189 members, comprised of 141
Practising Ecological Consultants, 16 Associate
(Consultants), 19 Associate (Government Ecological/
Environment Officer), 7 Associate (Non-practising), 1
Associate (Subscriber) and 5 Students. We currently
have 11 applicants and have 11 new members and
they are introduced below:
Shawn Ryan (Associate Ecological Consultant)
Sarah Stevens (Practising Ecological Consultant)
Kylie Bridges (Associate Ecological Consultant)
Mathew Doherty Practising Ecological Consultant)
Greg Chapman (Associate Non-practising )
Emma Gray (Associate Ecological Consultant)
Addy Watson (Associate Ecological Consultant)
Angela Carpenter (Associate Ecological
Consultant)
Yogesh Nair (Associate Ecological Consultant)
Vanessa Gorecki (Student)
Roxanne Zybenko Keane (Student)
Journal Articles
The responsibilities of ecological consultants in
disseminating outcomes from threatened species surveys:
a call to arms. By Stephen Bell (Australasian Plant
Conservation 27(2): 3-6).
Abstract: Ecological consultants are often in the
enviable position of being paid to botanically explore
and seek out threatened plants. Yes, there are attractive
jobs in remote or pristine locations where few botanists
have trod before, but there are also less desirable
projects in weed-infested remnants across highly
fragmented landscapes or in heavily urbanised
environments. Both offer the potential to uncover
important information on threatened plants. But are we,
as consultants, fulfilling our responsibilities for the
cause of conservation by disseminating the outcomes of
threatened species surveys and monitoring?
ECA Membership Report
UPCOMING ECA EVENTS
NON ECA EVENTS
RECENT LITERATURE AND NEW
PUBLICATIONS
8
Habitat suitability, live abundance and their link to
road mortality of Tasmanian wildlife. Hanh K.
Nguyen , Matthew W. Fielding , Jessie C. Buettel and
Barry W. Brook (2019). Wildlife Research 46(3) 236-
246 https://doi.org/10.1071/WR18128
Attenuated post-fire fauna succession: the effects of
surrounding landscape context on post-fire
colonisation of fauna.. Angela Simms , Meaghan
Scott, Simon Watson and Steve Leonard (2019).
Wildlife Research 46(3) 247-255 https://
doi.org/10.1071/WR18131
Confirmation of little eagle (Hieraaetus
morphnoides) migration by satellite telemetry.
Renée Brawata, Stuart Rae, Bernd Gruber , Sam
Reid and David Roberts (2019) Australian Journal of
Zoology 66(4) 247-250 https://doi.org/10.1071/
ZO18060
Time budget of the squirrel glider (Petaurus
norfolcensis) in subtropical Australia. David J.
Sharpe and Ross L. Goldingay (2019). Australian
Journal of Zoology 66(4) 251-260 https://
doi.org/10.1071/ZO18049
Gut content and stable isotope analysis of tadpoles
in floodplain wetlands. J. F. Ocock, K. J. Brandis, J.
Wolfenden, K. M. Jenkins and S. Wassens (2019)
Australian Journal of Zoology 66(4) 261-271 https://
doi.org/10.1071/ZO18043
Are koalas detected more effectively by systematic
spotlighting or diurnal searches? Lachlan Wilmott,
Dympna Cullen , George Madani , Martin Krogh and
Kylie Madden (2018). Australian Mammalogy 41(1)
157-160 https://doi.org/10.1071/AM18006
Submitted: 26 June 2017 Accepted: 4 May
2018 Published: 7 June 2018
Abstract: Koalas (Phascolarctos cinereus) are difficult
to detect due to their cryptic nature, occurrence at low
densities and broad distribution. We compare the
relative effectiveness of two common, direct survey
techniques used to detect koalas: spotlighting and
diurnal searches. Seventy-six 2-ha sites were surveyed
using both spotlighting and diurnal searching. Each site
was surveyed for 0.5 person-hours, such that search
area and effort were equal. In this study, spotlighting
was found to be 3.25 times more effective at detecting
koalas than day searches. Therefore, where access and
terrain allows, spotlighting surveys offer a significant
advantage over diurnal searches in the detection of
koalas.
The role of Lantana camara in areas of bell miner
(Manorina melanophrys) associated dieback and its
implications for terrestrial mammal and
insectivorous bat populations. Penny E. Wright ,
Kathryn T. A. Lambert and Paul G. McDonald (2018)
Australian Mammalogy 41(1) 49-56 https://
doi.org/10.1071/AM17003
Movement of small mammals through a road-
underpass is facilitated by a wildlife railing. Ross L.
Goldingay, Brendan D. Taylor and Jonathan L.
Parkyn (2018). Australian Mammalogy 41(1) 142-146
https://doi.org/10.1071/AM17056
Quantitative interpretation of images of long-nosed
potoroos at baited camera-traps: defining a ‘visit’.
Peter Jarman and Michael Driessen (2018). Australian
Mammalogy 41(1) 147-149 https://doi.org/10.1071/
AM17057
Can a common snake provide conservation insights?
Ross L. Goldingay (2019). Australian Journal of
Zoology 66(4) 279-285 https://doi.org/10.1071/
ZO18079
Abstract: The small-eyed snake (Cryptophis
nigrescens) is a common non-threatened species in
eastern Australia. It coexists with the threatened broad-
headed snake (Hoplocephalus bungaroides), a species
adversely affected by habitat disturbance and subject to
poaching. The small-eyed snake is a habitat generalist
and not subject to poaching. It may prey on other
snakes, including the broad-headed snake, and, like the
broad-headed snake, may shelter under thermally
favourable loose rocks during the cooler months of the
year. This may lead to interactions between these
species due to the limited availability of such rocks, and
possibly exacerbate other threats to the broad-headed
snake, such as poaching and the loss of thermally
favourable rocks. I conducted repeat surveys for snakes
at 64 rock outcrops in Royal National Park over a 16-
year period. I predicted that site use by the small-eyed
snake would not be influenced by a disturbance
variable previously documented to influence site use by
the broad-headed snake. Observations were consistent
with this prediction, confirming the unique
vulnerability of the broad-headed snake. I used my long
-term data to analyse the co-occurrence of the two
species. The broad-headed snake was detected as
frequently at sites with and without the small-eyed
snake, suggesting that these species occupy outcrops
independently of each other. Therefore, interactions
with the small-eyed snake will not reduce the
effectiveness of habitat restoration for the broad-headed
snake in Royal National Park.
9
Recent Book Releases
Information Source: CSIRO Publishing
Website http://www.publish.csiro.au
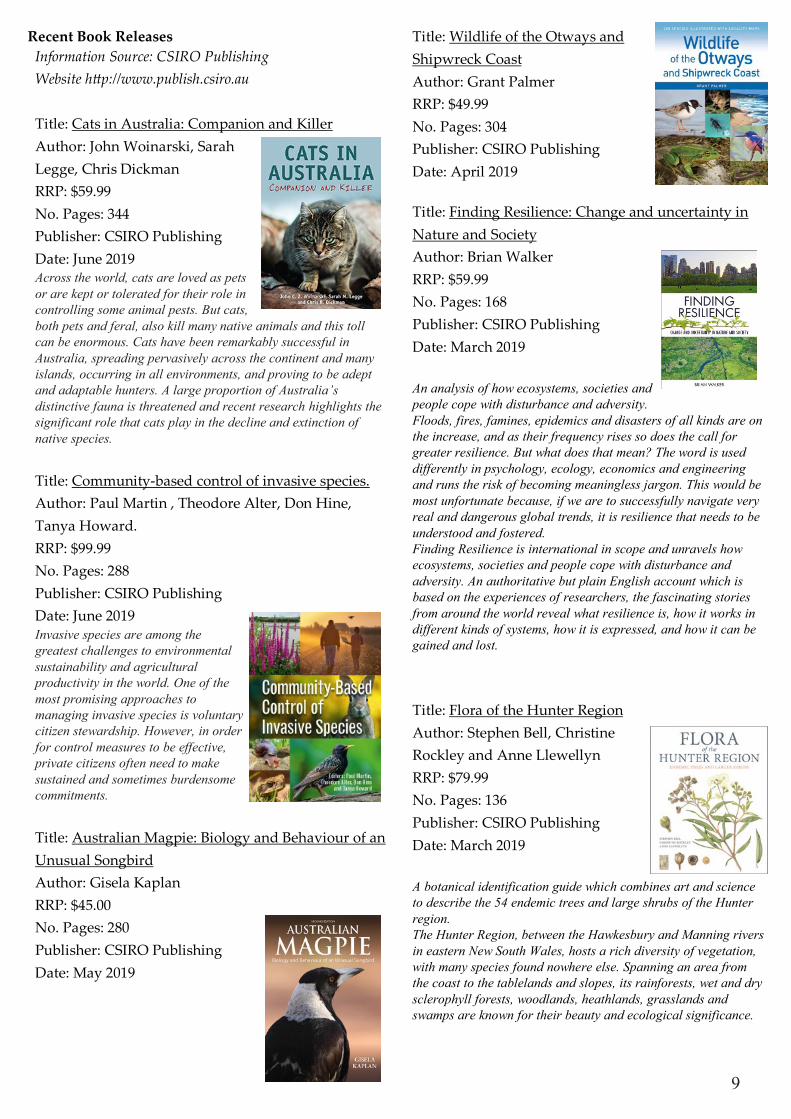
Title: Cats in Australia: Companion and Killer
Author: John Woinarski, Sarah
Legge, Chris Dickman
RRP: $59.99
No. Pages: 344
Publisher: CSIRO Publishing
Date: June 2019 Across the world, cats are loved as pets
or are kept or tolerated for their role in
controlling some animal pests. But cats,
both pets and feral, also kill many native animals and this toll
can be enormous. Cats have been remarkably successful in
Australia, spreading pervasively across the continent and many
islands, occurring in all environments, and proving to be adept
and adaptable hunters. A large proportion of Australia’s
distinctive fauna is threatened and recent research highlights the
significant role that cats play in the decline and extinction of
native species.
Title: Community-based control of invasive species.
Author: Paul Martin , Theodore Alter, Don Hine,
Tanya Howard.
RRP: $99.99
No. Pages: 288
Publisher: CSIRO Publishing
Date: June 2019 Invasive species are among the
greatest challenges to environmental
sustainability and agricultural
productivity in the world. One of the
most promising approaches to
managing invasive species is voluntary
citizen stewardship. However, in order
for control measures to be effective,
private citizens often need to make
sustained and sometimes burdensome
commitments.
Title: Australian Magpie: Biology and Behaviour of an
Unusual Songbird
Author: Gisela Kaplan
RRP: $45.00
No. Pages: 280
Publisher: CSIRO Publishing
Date: May 2019
Title: Wildlife of the Otways and
Shipwreck Coast
Author: Grant Palmer
RRP: $49.99
No. Pages: 304
Publisher: CSIRO Publishing
Date: April 2019
Title: Finding Resilience: Change and uncertainty in
Nature and Society
Author: Brian Walker
RRP: $59.99
No. Pages: 168
Publisher: CSIRO Publishing
Date: March 2019
An analysis of how ecosystems, societies and
people cope with disturbance and adversity.
Floods, fires, famines, epidemics and disasters of all kinds are on
the increase, and as their frequency rises so does the call for
greater resilience. But what does that mean? The word is used
differently in psychology, ecology, economics and engineering
and runs the risk of becoming meaningless jargon. This would be
most unfortunate because, if we are to successfully navigate very
real and dangerous global trends, it is resilience that needs to be
understood and fostered.
Finding Resilience is international in scope and unravels how
ecosystems, societies and people cope with disturbance and
adversity. An authoritative but plain English account which is
based on the experiences of researchers, the fascinating stories
from around the world reveal what resilience is, how it works in
different kinds of systems, how it is expressed, and how it can be
gained and lost.
Title: Flora of the Hunter Region
Author: Stephen Bell, Christine
Rockley and Anne Llewellyn
RRP: $79.99
No. Pages: 136
Publisher: CSIRO Publishing
Date: March 2019
A botanical identification guide which combines art and science
to describe the 54 endemic trees and large shrubs of the Hunter
region.
The Hunter Region, between the Hawkesbury and Manning rivers
in eastern New South Wales, hosts a rich diversity of vegetation,
with many species found nowhere else. Spanning an area from
the coast to the tablelands and slopes, its rainforests, wet and dry
sclerophyll forests, woodlands, heathlands, grasslands and
swamps are known for their beauty and ecological significance.
10
Amongst the many fauna monitoring tools available for biodiversity surveys, scat and hair analysis is frequently
considered a valuable technique. Most practitioners include one or both in surveys for a range of reasons, such as
to detect species, to assess species abundance or to determine predation impact (eg. Glen et al, 2006; Norton et al
2006). Survey protocols depend on the purpose but often involve systematic or incidental collection, and
identification can either occur on site or be sent to specialised consultants. As one of those consultants it seemed
appropriate to give a quick overview of best practice for collection and storage to ensure that samples are in the
best possible condition and those surveying stay as safe as possible.
When dealing with scats it’s best to treat all samples as a potential source of tapeworm eggs from the hydatid,
Echinococcus granulosus. Hydatid infection in carnivores is wide spread across Australia and eggs persist for long
periods in the environment. Infection of humans is caused through ingestion or inhalation of eggs, so use gloves
and avoid breathing in dust from and around the scat. It is best to secure samples in separate paper bags and
allow the scat to dry out, reducing the likelihood of fungal growth. Fungal growth damages the scat and its
contents, reducing the probability of a confident identification. It also allows the sample to be directly heat treated
before handling. Cooking scats at 100oC for several hours kills the eggs and allows for safe handling. We are all
familiar with the odour of predator scats and how useful it can be in scat identification but please make sure that
the scat has been heat treated before having a sniff! If you are sending off scats for analysis ensure all samples are
clearly labelled and they are safely packaged to minimise damage during transport. Also, be kind to the postman
and contain any potent smells.
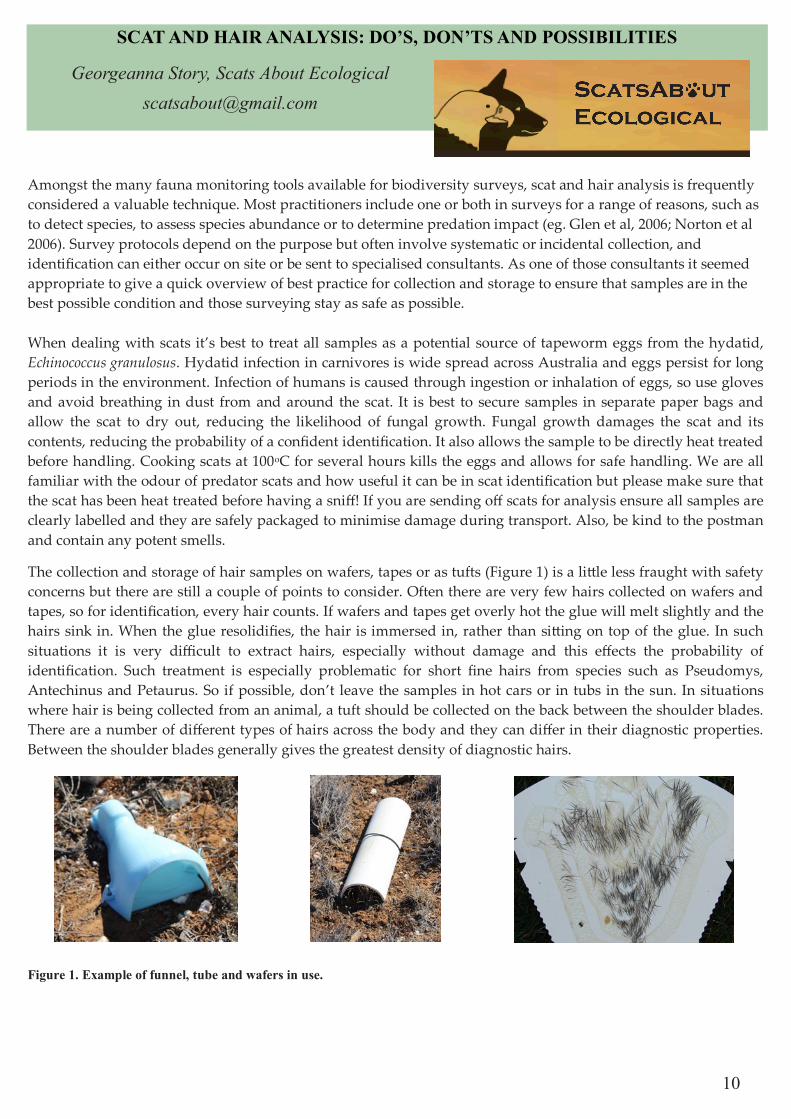
The collection and storage of hair samples on wafers, tapes or as tufts (Figure 1) is a little less fraught with safety
concerns but there are still a couple of points to consider. Often there are very few hairs collected on wafers and
tapes, so for identification, every hair counts. If wafers and tapes get overly hot the glue will melt slightly and the
hairs sink in. When the glue resolidifies, the hair is immersed in, rather than sitting on top of the glue. In such
situations it is very difficult to extract hairs, especially without damage and this effects the probability of
identification. Such treatment is especially problematic for short fine hairs from species such as Pseudomys,
Antechinus and Petaurus. So if possible, don’t leave the samples in hot cars or in tubs in the sun. In situations
where hair is being collected from an animal, a tuft should be collected on the back between the shoulder blades.
There are a number of different types of hairs across the body and they can differ in their diagnostic properties.
Between the shoulder blades generally gives the greatest density of diagnostic hairs.
SCAT AND HAIR ANALYSIS: DO’S, DON’TS AND POSSIBILITIES
Georgeanna Story, Scats About Ecological
Figure 1. Example of funnel, tube and wafers in use.
11
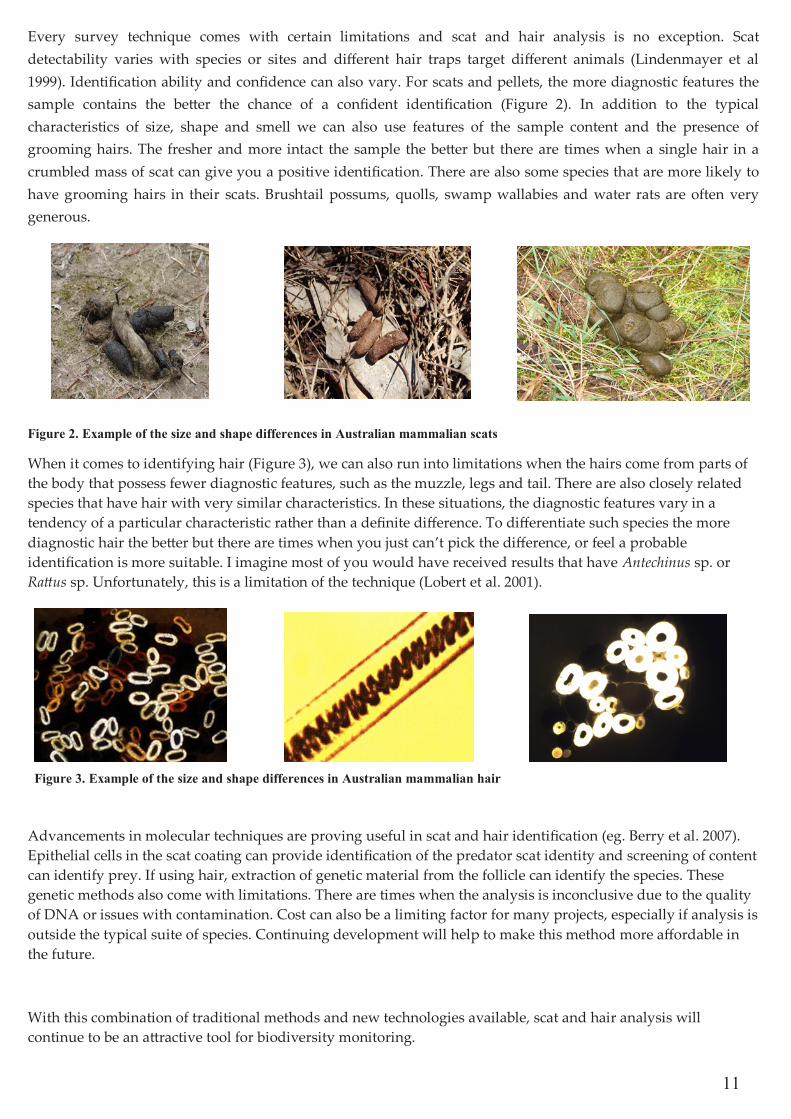
Every survey technique comes with certain limitations and scat and hair analysis is no exception. Scat
detectability varies with species or sites and different hair traps target different animals (Lindenmayer et al
1999). Identification ability and confidence can also vary. For scats and pellets, the more diagnostic features the
sample contains the better the chance of a confident identification (Figure 2). In addition to the typical
characteristics of size, shape and smell we can also use features of the sample content and the presence of
grooming hairs. The fresher and more intact the sample the better but there are times when a single hair in a
crumbled mass of scat can give you a positive identification. There are also some species that are more likely to
have grooming hairs in their scats. Brushtail possums, quolls, swamp wallabies and water rats are often very
generous.
Figure 2. Example of the size and shape differences in Australian mammalian scats
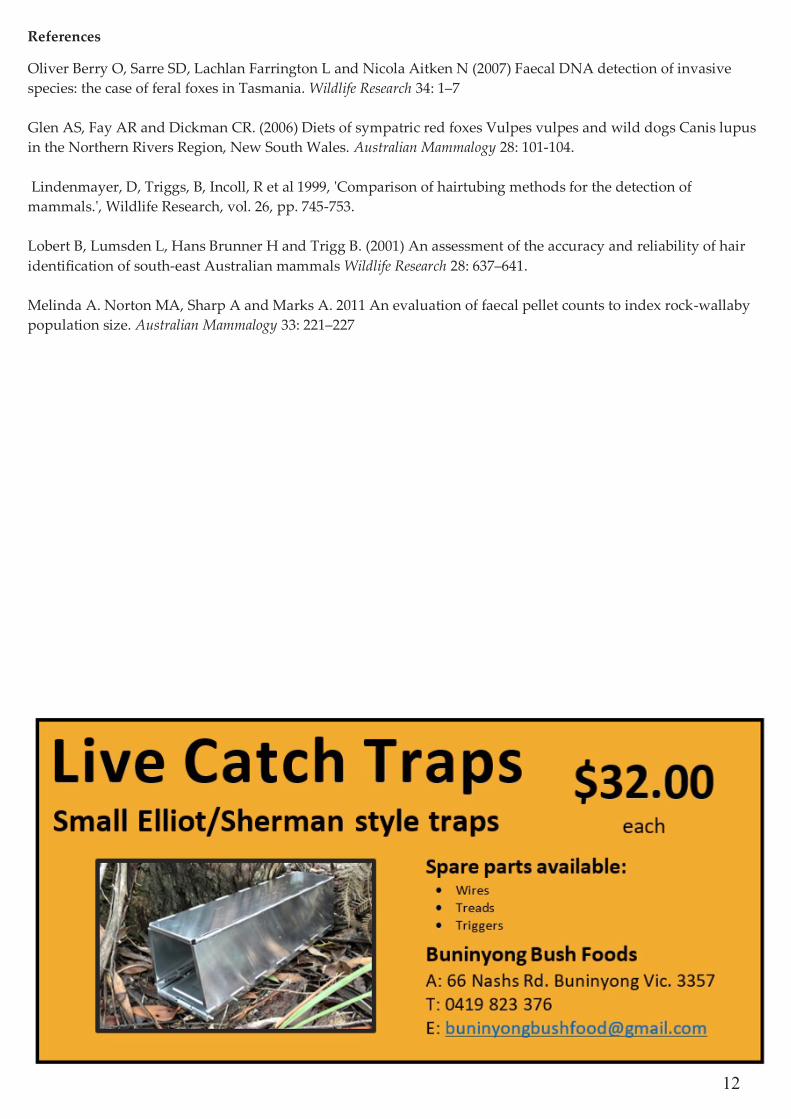
When it comes to identifying hair (Figure 3), we can also run into limitations when the hairs come from parts of
the body that possess fewer diagnostic features, such as the muzzle, legs and tail. There are also closely related
species that have hair with very similar characteristics. In these situations, the diagnostic features vary in a
tendency of a particular characteristic rather than a definite difference. To differentiate such species the more
diagnostic hair the better but there are times when you just can’t pick the difference, or feel a probable
identification is more suitable. I imagine most of you would have received results that have Antechinus sp. or
Rattus sp. Unfortunately, this is a limitation of the technique (Lobert et al. 2001).
Advancements in molecular techniques are proving useful in scat and hair identification (eg. Berry et al. 2007).
Epithelial cells in the scat coating can provide identification of the predator scat identity and screening of content
can identify prey. If using hair, extraction of genetic material from the follicle can identify the species. These
genetic methods also come with limitations. There are times when the analysis is inconclusive due to the quality
of DNA or issues with contamination. Cost can also be a limiting factor for many projects, especially if analysis is
outside the typical suite of species. Continuing development will help to make this method more affordable in
the future.
With this combination of traditional methods and new technologies available, scat and hair analysis will
continue to be an attractive tool for biodiversity monitoring.
Figure 3. Example of the size and shape differences in Australian mammalian hair
12
References
Oliver Berry O, Sarre SD, Lachlan Farrington L and Nicola Aitken N (2007) Faecal DNA detection of invasive
species: the case of feral foxes in Tasmania. Wildlife Research 34: 1–7
Glen AS, Fay AR and Dickman CR. (2006) Diets of sympatric red foxes Vulpes vulpes and wild dogs Canis lupus
in the Northern Rivers Region, New South Wales. Australian Mammalogy 28: 101-104.
Lindenmayer, D, Triggs, B, Incoll, R et al 1999, 'Comparison of hairtubing methods for the detection of
mammals.', Wildlife Research, vol. 26, pp. 745-753.
Lobert B, Lumsden L, Hans Brunner H and Trigg B. (2001) An assessment of the accuracy and reliability of hair
identification of south-east Australian mammals Wildlife Research 28: 637–641.
Melinda A. Norton MA, Sharp A and Marks A. 2011 An evaluation of faecal pellet counts to index rock-wallaby
population size. Australian Mammalogy 33: 221–227
13
Background
Urban greenspaces (e.g., cemeteries, parks, habitat corridors, urban wetlands) are constantly subjected to
development. Hence, the question often needs to be asked: how many species are in that local urban greenspace?
This seems simple. But is it? If you had to provide an estimate – with lower and upper bounds – of the number of
birds in your local park, would you be able to do so? This question is also becoming increasingly important as
researchers and society are realizing the importance of conserving urban biodiversity. So, if we don’t know how
many species are in a given park then it is difficult to prioritize these greenspaces and make cases for
preservation of their existence to the various policy-makers and stakeholders. Hence this was the motivation for
creating the Greenspace Bird Calculator: a web-app aimed at enhancing our collective knowledge of bird
diversity in urban greenspaces.
The Greenspace Bird Calculator relies on eBird data. eBird is a global citizen science project with > 600 million
observations and > 400 thousand participants. It works by enlisting birdwatchers to submit observations of birds
in the form of ‘checklists’, and they make all their data freely accessible to researchers and practitioners. Often,
these data have a bias towards urban areas – the areas where people live. This is problematic for some ecological
questions, but this can be advantageous if the focus is on ecological questions within urban areas. The web-app
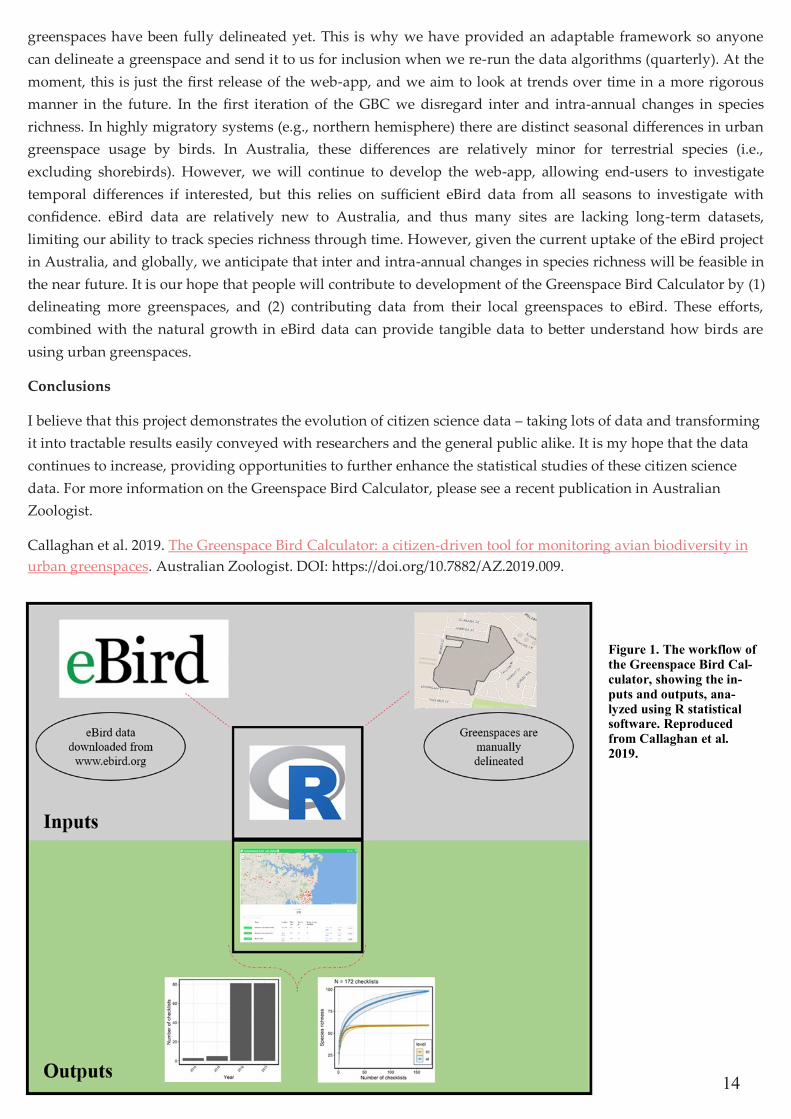
depends on two key inputs: eBird data and delineated urban greenspaces (Figure 1). It also relies on previously
published research which investigates the validity and utility of eBird data in urban greenspaces.
Providing basic information on bird communities
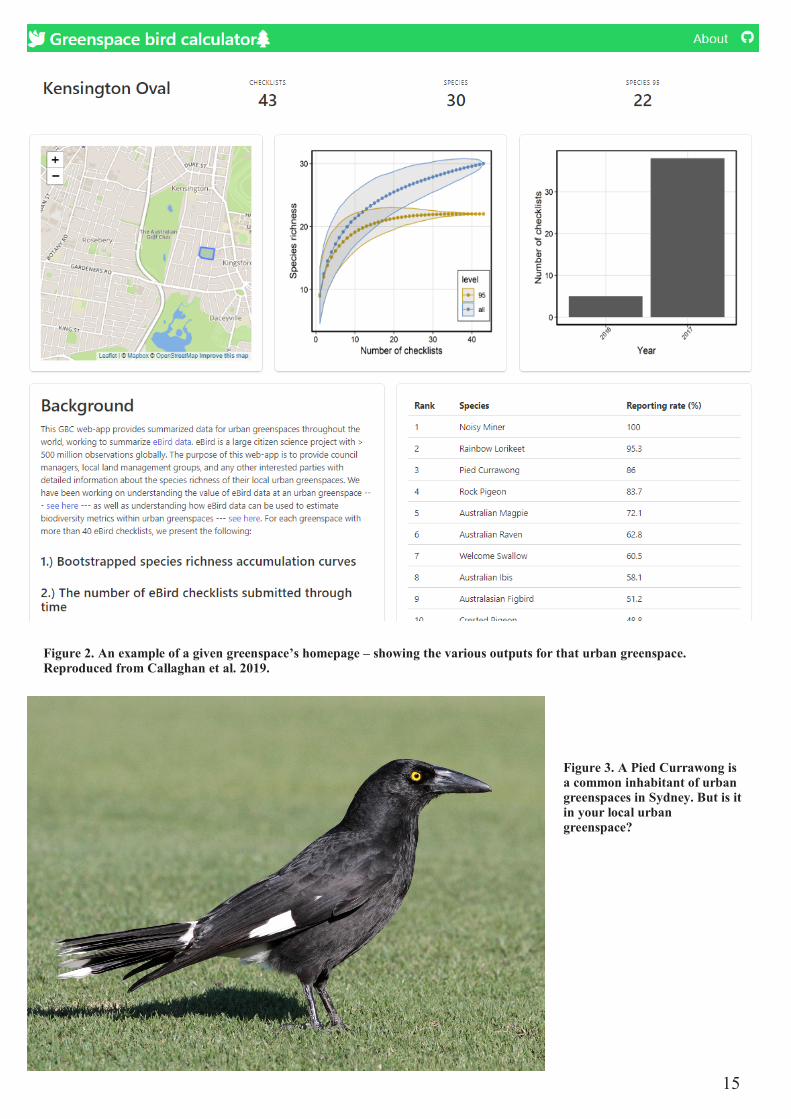
Currently, the Greenspace Bird Calculator provides (Figure 2): (1) the total species richness, shown as a species-
accumulation curve, (2) a subsetted bird community species richness, where any species on < 5% of all eBird
checklists were removed from the analysis, (3) the number of eBird checklists, shown through time, and (4) a list
of species and their reporting rate – the percentage of eBird checklists that they are reported on. We statistically
assess the available data in eBird and provide accessible interpretation for inclusion into urban greenspace
management and planning https://coreytcallaghan.github.io/urban_greenspaces/#/ Here is an example, looking
at Randwick Environment Park https://coreytcallaghan.github.io/urban_greenspaces/#/greenspace/aus-nsw-
randwick_environment_park and here is a local oval https://coreytcallaghan.github.io/urban_greenspaces/#/
greenspace/aus-nsw-kensington_oval where I frequently walk my dog.
Relevance for the consulting world
I foresee this tool being used by a number of end-users, including the public, local councils, and ecological
consultants. All of which might at some point be interested in the bird diversity in their local parks. For example,
these data can be used to (1) understand the differences in bird diversity among a handful of local parks and
greenspaces, and (2) better understand which species are likely to occur in the park for more prioritized and
targeted surveys. The information presented is also provided as ‘raw data’ so that the figures can be downloaded
and used in various reports.
Next versions
The Greenspace Bird Calculator is an iterative tool, and this is the first version. You may notice that not many
THE GREENSPACE BIRD CALCULATOR: A TOOL TO HELP MONITOR AVIAN
BIODIVERSITY IN URBAN GREENSPACES
Corey T. Callaghan
14
greenspaces have been fully delineated yet. This is why we have provided an adaptable framework so anyone
can delineate a greenspace and send it to us for inclusion when we re-run the data algorithms (quarterly). At the
moment, this is just the first release of the web-app, and we aim to look at trends over time in a more rigorous
manner in the future. In the first iteration of the GBC we disregard inter and intra-annual changes in species
richness. In highly migratory systems (e.g., northern hemisphere) there are distinct seasonal differences in urban
greenspace usage by birds. In Australia, these differences are relatively minor for terrestrial species (i.e.,
excluding shorebirds). However, we will continue to develop the web-app, allowing end-users to investigate
temporal differences if interested, but this relies on sufficient eBird data from all seasons to investigate with
confidence. eBird data are relatively new to Australia, and thus many sites are lacking long-term datasets,
limiting our ability to track species richness through time. However, given the current uptake of the eBird project
in Australia, and globally, we anticipate that inter and intra-annual changes in species richness will be feasible in
the near future. It is our hope that people will contribute to development of the Greenspace Bird Calculator by (1)
delineating more greenspaces, and (2) contributing data from their local greenspaces to eBird. These efforts,
combined with the natural growth in eBird data can provide tangible data to better understand how birds are
using urban greenspaces.
Conclusions
I believe that this project demonstrates the evolution of citizen science data – taking lots of data and transforming
it into tractable results easily conveyed with researchers and the general public alike. It is my hope that the data
continues to increase, providing opportunities to further enhance the statistical studies of these citizen science
data. For more information on the Greenspace Bird Calculator, please see a recent publication in Australian
Zoologist.
Callaghan et al. 2019. The Greenspace Bird Calculator: a citizen-driven tool for monitoring avian biodiversity in
urban greenspaces. Australian Zoologist. DOI: https://doi.org/10.7882/AZ.2019.009.
Figure 1. The workflow of
the Greenspace Bird Cal-
culator, showing the in-
puts and outputs, ana-
lyzed using R statistical software. Reproduced
from Callaghan et al.
2019.
15
Figure 2. An example of a given greenspace’s homepage – showing the various outputs for that urban greenspace.
Reproduced from Callaghan et al. 2019.
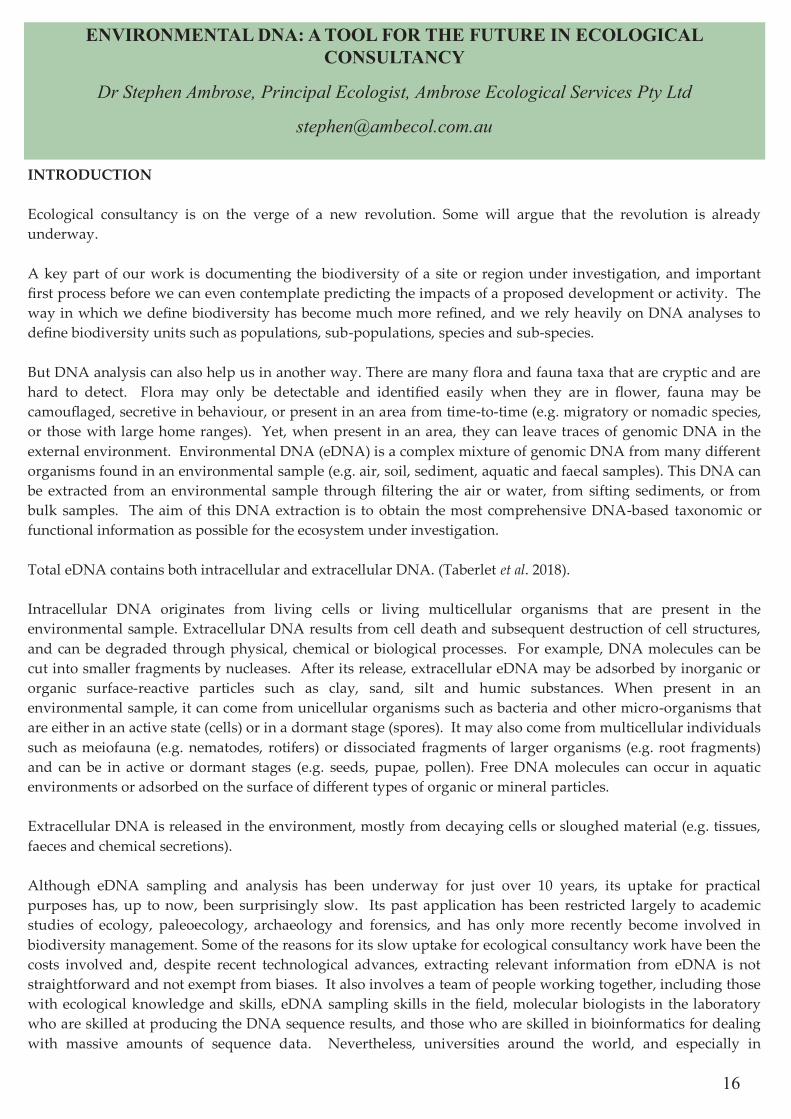
Figure 3. A Pied Currawong is
a common inhabitant of urban
greenspaces in Sydney. But is it
in your local urban
greenspace?
16
INTRODUCTION
Ecological consultancy is on the verge of a new revolution. Some will argue that the revolution is already
underway.
A key part of our work is documenting the biodiversity of a site or region under investigation, and important
first process before we can even contemplate predicting the impacts of a proposed development or activity. The
way in which we define biodiversity has become much more refined, and we rely heavily on DNA analyses to
define biodiversity units such as populations, sub-populations, species and sub-species.
But DNA analysis can also help us in another way. There are many flora and fauna taxa that are cryptic and are
hard to detect. Flora may only be detectable and identified easily when they are in flower, fauna may be
camouflaged, secretive in behaviour, or present in an area from time-to-time (e.g. migratory or nomadic species,
or those with large home ranges). Yet, when present in an area, they can leave traces of genomic DNA in the
external environment. Environmental DNA (eDNA) is a complex mixture of genomic DNA from many different
organisms found in an environmental sample (e.g. air, soil, sediment, aquatic and faecal samples). This DNA can
be extracted from an environmental sample through filtering the air or water, from sifting sediments, or from
bulk samples. The aim of this DNA extraction is to obtain the most comprehensive DNA-based taxonomic or
functional information as possible for the ecosystem under investigation.
Total eDNA contains both intracellular and extracellular DNA. (Taberlet et al. 2018).
Intracellular DNA originates from living cells or living multicellular organisms that are present in the
environmental sample. Extracellular DNA results from cell death and subsequent destruction of cell structures,
and can be degraded through physical, chemical or biological processes. For example, DNA molecules can be
cut into smaller fragments by nucleases. After its release, extracellular eDNA may be adsorbed by inorganic or
organic surface-reactive particles such as clay, sand, silt and humic substances. When present in an
environmental sample, it can come from unicellular organisms such as bacteria and other micro-organisms that
are either in an active state (cells) or in a dormant stage (spores). It may also come from multicellular individuals
such as meiofauna (e.g. nematodes, rotifers) or dissociated fragments of larger organisms (e.g. root fragments)
and can be in active or dormant stages (e.g. seeds, pupae, pollen). Free DNA molecules can occur in aquatic
environments or adsorbed on the surface of different types of organic or mineral particles.
Extracellular DNA is released in the environment, mostly from decaying cells or sloughed material (e.g. tissues,
faeces and chemical secretions).
Although eDNA sampling and analysis has been underway for just over 10 years, its uptake for practical
purposes has, up to now, been surprisingly slow. Its past application has been restricted largely to academic
studies of ecology, paleoecology, archaeology and forensics, and has only more recently become involved in
biodiversity management. Some of the reasons for its slow uptake for ecological consultancy work have been the
costs involved and, despite recent technological advances, extracting relevant information from eDNA is not
straightforward and not exempt from biases. It also involves a team of people working together, including those
with ecological knowledge and skills, eDNA sampling skills in the field, molecular biologists in the laboratory
who are skilled at producing the DNA sequence results, and those who are skilled in bioinformatics for dealing
with massive amounts of sequence data. Nevertheless, universities around the world, and especially in
ENVIRONMENTAL DNA: A TOOL FOR THE FUTURE IN ECOLOGICAL
CONSULTANCY
Dr Stephen Ambrose, Principal Ecologist, Ambrose Ecological Services Pty Ltd
17
Australia, are currently training lots of postgraduate students in these techniques, many of which will no doubt
enter the ecological consultancy industry, either as specialist ecological consultants, or as sub-contractors offering
their specialist services to ecological consultants. This has already begun to happen in parts of Europe, the
United Kingdom and the United States. It’s beginning to happen in Australia with several commercial molecular
biological companies actively advertising their services to the environmental consultancy industry. Therefore,
eDNA analysis is likely to become an increasingly important tool in ecological consultancy.
As the older (already established) generation of ecological consultants, we should strive to understand how it
works and, if applicable, embrace this new technology. So let us delve deeper into what is involved. In doing so,
I will focus my discussion on the relevance of eDNA sampling to ecological consultancy, discuss what is involved
in collecting field samples, provide examples of how this approach has been applied, and present some of the
pitfalls and biases of eDNA sampling and analysis. I have not delved into the discussion of laboratory analyses
of samples (DNA extraction, sequencing, analysis and interpretation of data) other than to give a very brief
overview of the methodology; that is something I have left for others who are qualified and experienced in this
area to do another time.
OVERVIEW OF AN eDNA INVESTIGATION
If the aim is to identify the taxa present in an eDNA sample, there are two main approaches, each based on PCR
(polymerase chain reaction) of the sample in the laboratory. One can either:
1. determine the presence or absence of a single species, using a species-specific approach based on
quantitative PCR (single-species identification); or
2. engage in shotgun sequencing, which has the potential of revealing the DNA of multiple taxa within a
sample (DNA metabarcoding).
DNA metabarcoding involves examining metabarcode sequences amplified from eDNA. A metabarcode consists
of a short and a taxonomically informative DNA segment flanked by two conserved segments on either side that
serve as primer anchors for the PCR. Shotgun sequencing involves the sequencing of random DNA fragments
from a DNA extract, generally using next-generation sequencers. However, taxa identification based on shotgun
sequencing is difficult to achieve because it requires high sequencing depths and extensive reference databases
for taxonomic assignment (Glenn 2011).
It is likely that the species-specific approach would be the most valuable approach for ecological consultants
engaged in development or activity applications, especially when attempting to confirm the presence of a
threatened species on the site under investigation. The metabarcoding approach may be of some value in
documenting the biodiversity of a site or area, but it is probable that taxonomic reference databases would not be
comprehensive enough to allow precise identification of all the DNA recorded in samples.
A third approach, which is less relevant to our main line of work is the metagenomics approach. This is based on
shotgun sequencing of eDNA without any targeted PCR, and is used to study the functional characteristics of
genomes, mostly of micro-organisms (Simon & Daniel 2011).
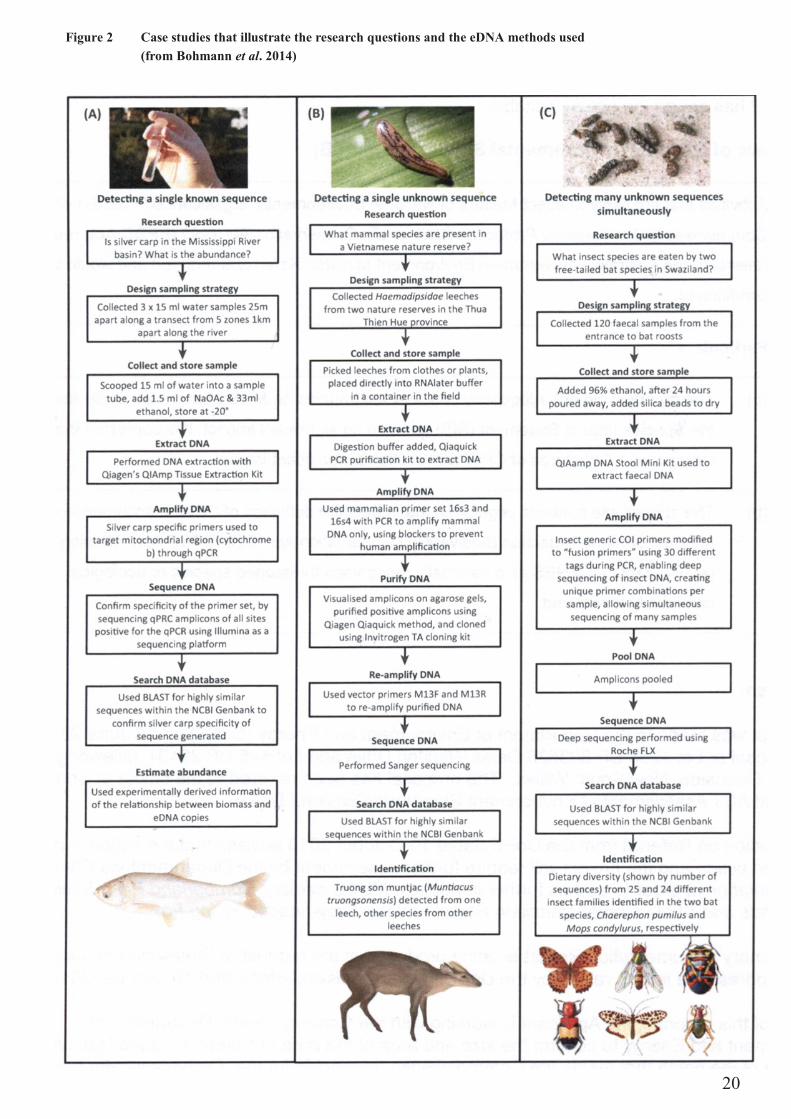
The main steps of an eDNA study, showing the three possible approaches are shown in Figure 1 and how they
have been applied to three real-life studies are shown in Figure 2. Taberlet et al. (2018) warn that each approach
can produce possible errors and artifacts, and identify the following parameters that need to be considered:
1. the different controls to be included at various steps of the process (extraction negative controls, PCR
negative controls, PCR positive controls of known composition, replicated samples, etc.);
2. the sampling strategy (how many samples, how many sample replicates, how to spatially distribute the
samples, at which time of the year, etc.);
3. the sample preservation method and the DNA extraction protocol (should the samples be preserved before
DNA extraction, or do they have to be extracted immediately in the field to avoid degradation and/or micro
18
-organism development; choice of extraction protocol according to the scientific questions; logistics,
financial constraints, etc.);
4. the protocol of DNA amplification in DNA metabarcoding [which metabarcode(s) to analyse, which
multiplexing strategy to adopt according to the number of samples and sequencing platform, etc.];
5. the sequencing strategy (should the sequencing be done in-house or outsourced); and
6. the strategy for data analysis.
ENVIRONMENTAL DNA SAMPLING
Where to Sample?
Herder et al. (2014) indicate that eDNA studies can be applied to aquatic habitats (ponds, lakes, creeks, rivers,
streams, pooled water in depressions), marine habitats, soils and sediments, animal traces (e.g. terrestrial twigs,
leaf litter, hair, faeces, shed skin) and environmental samplers (e.g. pollen and honey from bees, blood from
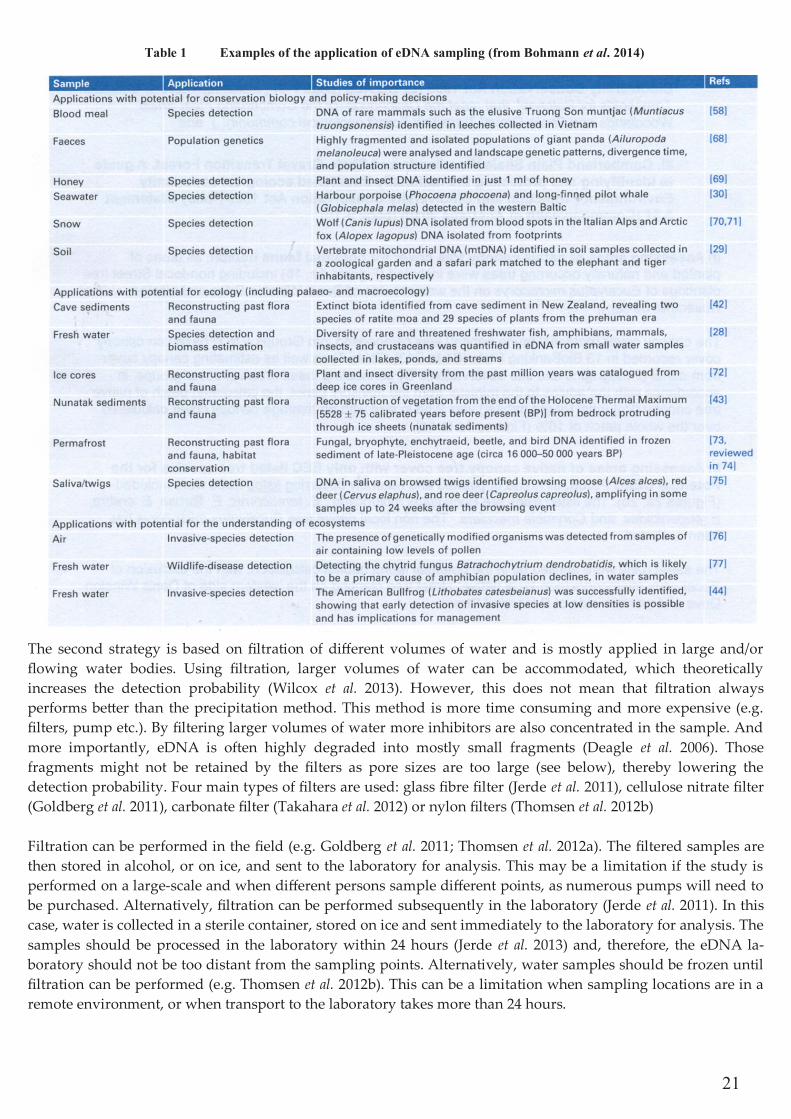
leeches and mosquitoes, owl pellets, faeces from predators). Bohmann et al. (2014) summarise a range of studies
in which eDNA sampling has been used (Table 1).
Soil Samples
When soil samples are used as a source of eDNA, several soil cores are collected separately (e.g. Yoccoz et al.
2012), or pooled together to obtain a maximum representation of the local biodiversity (e.g. Taberlet et al. 2012).
The samples are usually then frozen before DNA extraction, or are processed directly after sampling (e.g.
Taberlet et al. 2012).
Faecal Samples
When using faecal samples, the most common strategy consists of collecting the samples individually, and
dehydrating them quickly by placing the material into alcohol or into a tube filled with silica gel or a combination
of both methods.
Water Samples
The strategy for sampling water samples is much more complex. Two main sampling approaches are proposed in
the literature, both based on DNA concentration from different volumes of water.
The first method is based on DNA precipitation using ethanol and sodium acetate and/or cell remains
centrifugation (Ficetola et al. 2008). Ethanol acts as preservative of DNA, therefore samples can be stored for a few
days, or weeks, at room temperature, which can be advantageous when sampling locations are distant from
laboratory facilities. The main limitation of this technique is that the sampled volume of water is relatively low. If
a species is present at high density, the amount of DNA released in the environment is high and this method
would probably allow detection even with a low volume of water (e.g. three times 15 mL, Ficetola et al. 2008).
However, if the organisms are present at low densities, or if they have limited mobility in the environment, the
area where eDNA is present is very restricted. If the sampling points are too far from the eDNA source, the
species might not be detected. Therefore, the sampling strategy should be revised, and the number of samples per
site should be increased. An alternative sampling strategy consists of taking different sub-samples of water from
the study area. Those sub-samples are then mixed together for homogenization and a few sub-samples are taken
from this large volume of water to be transferred to tubes filled with ethanol and sodium acetate (e.g. Biggs et al.
2014; Herder et al. 2013a, 2013b; Piaggio et al. 2014). Because the eDNA is not distributed homogeneously in a
water, sampling at different points within the study area increases the chance of collecting eDNA released from
the target species.

19
Figure 1 The main steps of an eDNA study, showing the three possible approaches: single-species identification,
metabarcoding and metagenomics (from Taberlet et al. 2018).
For further reading on eDNA:
ABC News online story has useful information about artificial bat roosts and discusses how eDNA in bat faeces collected from caves is used to identify bat species and estimate the sizes of local colonies.
https://www.abc.net.au/news/2018-11-19/ghost-bat-motels-built-near-pilbara-mines/10481728
eDNA sampling is being used to research Platypus.
https://pursuit.unimelb.edu.au/articles/on-the-dna-trail-of-the-platypus
https://www.abc.net.au/news/2018-11-10/platypus-vulnerable-to-extinction-researchers-say/10477902
20
Figure 2 Case studies that illustrate the research questions and the eDNA methods used
(from Bohmann et al. 2014)
21
The second strategy is based on filtration of different volumes of water and is mostly applied in large and/or
flowing water bodies. Using filtration, larger volumes of water can be accommodated, which theoretically
increases the detection probability (Wilcox et al. 2013). However, this does not mean that filtration always
performs better than the precipitation method. This method is more time consuming and more expensive (e.g.
filters, pump etc.). By filtering larger volumes of water more inhibitors are also concentrated in the sample. And
more importantly, eDNA is often highly degraded into mostly small fragments (Deagle et al. 2006). Those
fragments might not be retained by the filters as pore sizes are too large (see below), thereby lowering the
detection probability. Four main types of filters are used: glass fibre filter (Jerde et al. 2011), cellulose nitrate filter
(Goldberg et al. 2011), carbonate filter (Takahara et al. 2012) or nylon filters (Thomsen et al. 2012b)
Filtration can be performed in the field (e.g. Goldberg et al. 2011; Thomsen et al. 2012a). The filtered samples are
then stored in alcohol, or on ice, and sent to the laboratory for analysis. This may be a limitation if the study is
performed on a large-scale and when different persons sample different points, as numerous pumps will need to
be purchased. Alternatively, filtration can be performed subsequently in the laboratory (Jerde et al. 2011). In this
case, water is collected in a sterile container, stored on ice and sent immediately to the laboratory for analysis. The
samples should be processed in the laboratory within 24 hours (Jerde et al. 2013) and, therefore, the eDNA la
boratory should not be too distant from the sampling points. Alternatively, water samples should be frozen until
filtration can be performed (e.g. Thomsen et al. 2012b). This can be a limitation when sampling locations are in a
remote environment, or when transport to the laboratory takes more than 24 hours.
Table 1 Examples of the application of eDNA sampling (from Bohmann et al. 2014)
22
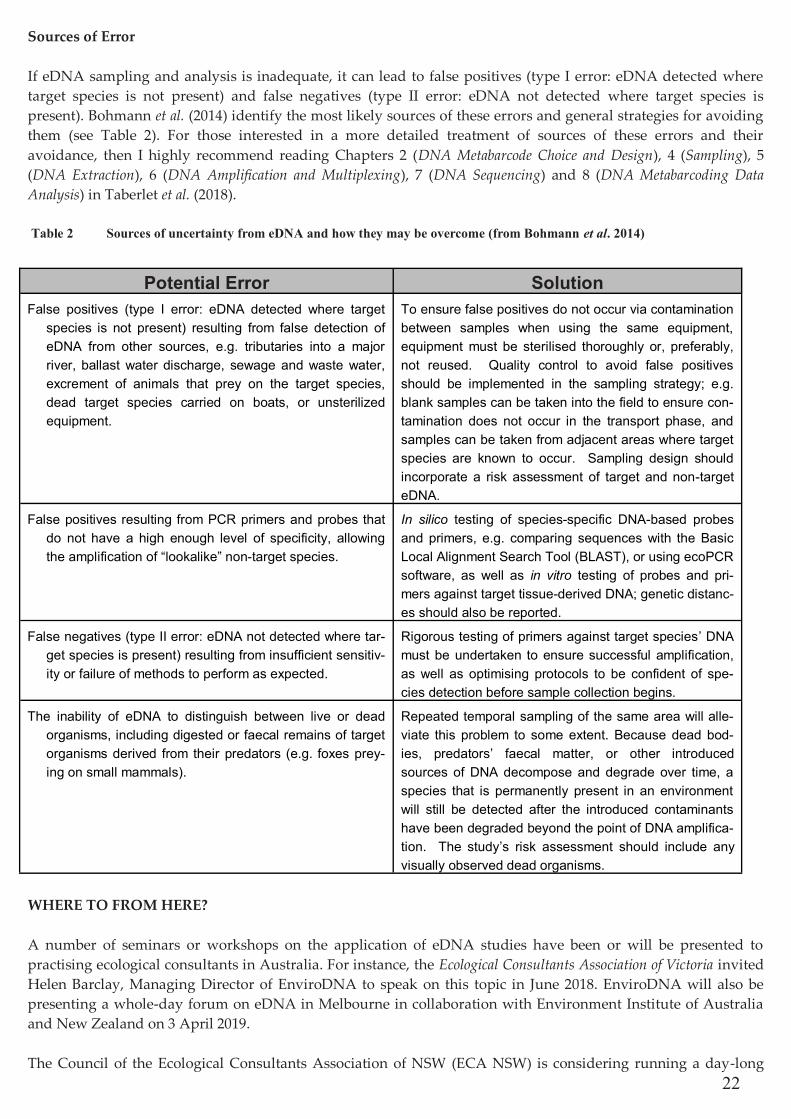
Sources of Error
If eDNA sampling and analysis is inadequate, it can lead to false positives (type I error: eDNA detected where
target species is not present) and false negatives (type II error: eDNA not detected where target species is
present). Bohmann et al. (2014) identify the most likely sources of these errors and general strategies for avoiding
them (see Table 2). For those interested in a more detailed treatment of sources of these errors and their
avoidance, then I highly recommend reading Chapters 2 (DNA Metabarcode Choice and Design), 4 (Sampling), 5
(DNA Extraction), 6 (DNA Amplification and Multiplexing), 7 (DNA Sequencing) and 8 (DNA Metabarcoding Data
Analysis) in Taberlet et al. (2018).
WHERE TO FROM HERE?
A number of seminars or workshops on the application of eDNA studies have been or will be presented to
practising ecological consultants in Australia. For instance, the Ecological Consultants Association of Victoria invited
Helen Barclay, Managing Director of EnviroDNA to speak on this topic in June 2018. EnviroDNA will also be
presenting a whole-day forum on eDNA in Melbourne in collaboration with Environment Institute of Australia
and New Zealand on 3 April 2019.
The Council of the Ecological Consultants Association of NSW (ECA NSW) is considering running a day-long
Potential Error Solution
False positives (type I error: eDNA detected where target
species is not present) resulting from false detection of
eDNA from other sources, e.g. tributaries into a major
river, ballast water discharge, sewage and waste water,
excrement of animals that prey on the target species,
dead target species carried on boats, or unsterilized
equipment.
To ensure false positives do not occur via contamination
between samples when using the same equipment,
equipment must be sterilised thoroughly or, preferably,
not reused. Quality control to avoid false positives
should be implemented in the sampling strategy; e.g.
blank samples can be taken into the field to ensure con-
tamination does not occur in the transport phase, and
samples can be taken from adjacent areas where target
species are known to occur. Sampling design should
incorporate a risk assessment of target and non-target
eDNA.
False positives resulting from PCR primers and probes that
do not have a high enough level of specificity, allowing
the amplification of “lookalike” non-target species.
In silico testing of species-specific DNA-based probes
and primers, e.g. comparing sequences with the Basic
Local Alignment Search Tool (BLAST), or using ecoPCR
software, as well as in vitro testing of probes and pri-
mers against target tissue-derived DNA; genetic distanc-
es should also be reported.
False negatives (type II error: eDNA not detected where tar-
get species is present) resulting from insufficient sensitiv-
ity or failure of methods to perform as expected.
Rigorous testing of primers against target species’ DNA
must be undertaken to ensure successful amplification,
as well as optimising protocols to be confident of spe-
cies detection before sample collection begins.
The inability of eDNA to distinguish between live or dead
organisms, including digested or faecal remains of target
organisms derived from their predators (e.g. foxes prey-
ing on small mammals).
Repeated temporal sampling of the same area will alle-
viate this problem to some extent. Because dead bod-
ies, predators’ faecal matter, or other introduced
sources of DNA decompose and degrade over time, a
species that is permanently present in an environment
will still be detected after the introduced contaminants
have been degraded beyond the point of DNA amplifica-
tion. The study’s risk assessment should include any
visually observed dead organisms.
Table 2 Sources of uncertainty from eDNA and how they may be overcome (from Bohmann et al. 2014)
23
workshop this year on the use of eDNA. But this
workshop will proceed only if our membership shows
sufficient interest in attending. I hope that this short
introduction to eDNA studies has whetted your
appetite for such a workshop!
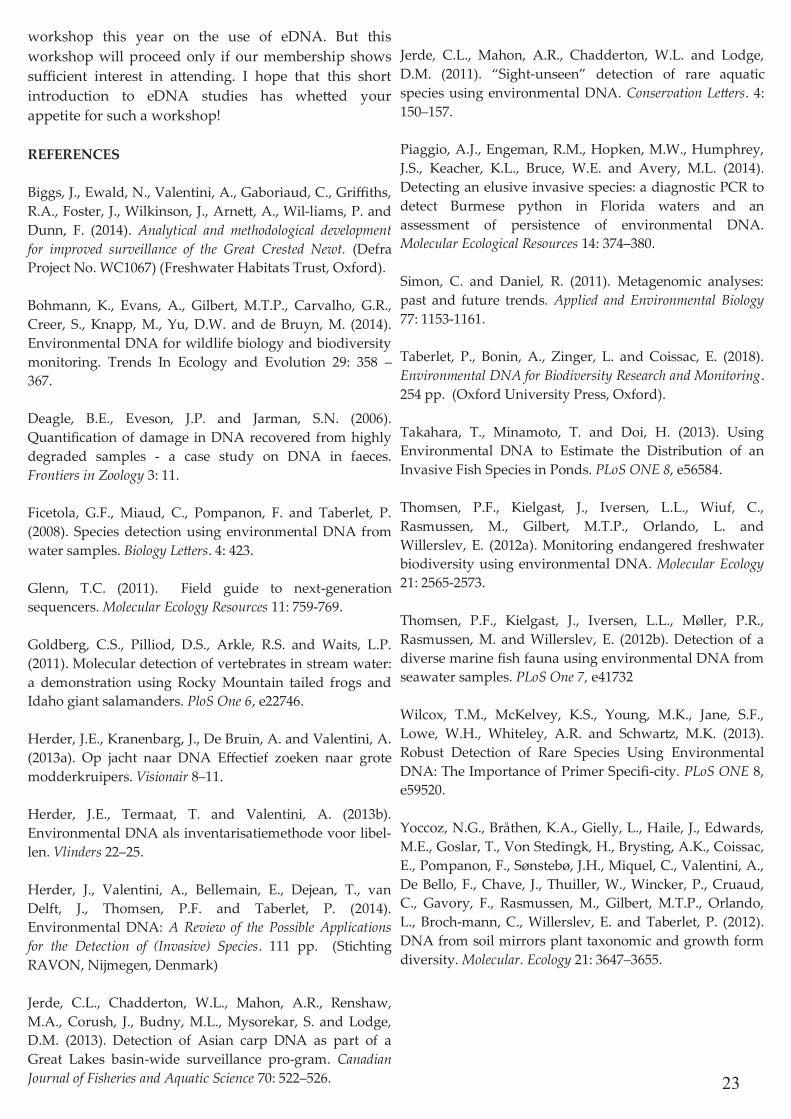
REFERENCES
Biggs, J., Ewald, N., Valentini, A., Gaboriaud, C., Griffiths,
R.A., Foster, J., Wilkinson, J., Arnett, A., Williams, P. and
Dunn, F. (2014). Analytical and methodological development
for improved surveillance of the Great Crested Newt. (Defra
Project No. WC1067) (Freshwater Habitats Trust, Oxford).
Bohmann, K., Evans, A., Gilbert, M.T.P., Carvalho, G.R.,
Creer, S., Knapp, M., Yu, D.W. and de Bruyn, M. (2014).
Environmental DNA for wildlife biology and biodiversity
monitoring. Trends In Ecology and Evolution 29: 358 –
367.
Deagle, B.E., Eveson, J.P. and Jarman, S.N. (2006).
Quantification of damage in DNA recovered from highly
degraded samples - a case study on DNA in faeces.
Frontiers in Zoology 3: 11.
Ficetola, G.F., Miaud, C., Pompanon, F. and Taberlet, P.
(2008). Species detection using environmental DNA from
water samples. Biology Letters. 4: 423.
Glenn, T.C. (2011). Field guide to next-generation
sequencers. Molecular Ecology Resources 11: 759-769.
Goldberg, C.S., Pilliod, D.S., Arkle, R.S. and Waits, L.P.
(2011). Molecular detection of vertebrates in stream water:
a demonstration using Rocky Mountain tailed frogs and
Idaho giant salamanders. PloS One 6, e22746.
Herder, J.E., Kranenbarg, J., De Bruin, A. and Valentini, A.
(2013a). Op jacht naar DNA Effectief zoeken naar grote
modderkruipers. Visionair 8–11.
Herder, J.E., Termaat, T. and Valentini, A. (2013b).
Environmental DNA als inventarisatiemethode voor libel
len. Vlinders 22–25.
Herder, J., Valentini, A., Bellemain, E., Dejean, T., van
Delft, J., Thomsen, P.F. and Taberlet, P. (2014).
Environmental DNA: A Review of the Possible Applications
for the Detection of (Invasive) Species. 111 pp. (Stichting
RAVON, Nijmegen, Denmark)
Jerde, C.L., Chadderton, W.L., Mahon, A.R., Renshaw,
M.A., Corush, J., Budny, M.L., Mysorekar, S. and Lodge,
D.M. (2013). Detection of Asian carp DNA as part of a
Great Lakes basin-wide surveillance program. Canadian
Journal of Fisheries and Aquatic Science 70: 522–526.
Jerde, C.L., Mahon, A.R., Chadderton, W.L. and Lodge,
D.M. (2011). “Sight-unseen” detection of rare aquatic
species using environmental DNA. Conservation Letters. 4:
150–157.
Piaggio, A.J., Engeman, R.M., Hopken, M.W., Humphrey,
J.S., Keacher, K.L., Bruce, W.E. and Avery, M.L. (2014).
Detecting an elusive invasive species: a diagnostic PCR to
detect Burmese python in Florida waters and an
assessment of persistence of environmental DNA.
Molecular Ecological Resources 14: 374–380.
Simon, C. and Daniel, R. (2011). Metagenomic analyses:
past and future trends. Applied and Environmental Biology
77: 1153-1161.
Taberlet, P., Bonin, A., Zinger, L. and Coissac, E. (2018).
Environmental DNA for Biodiversity Research and Monitoring.
254 pp. (Oxford University Press, Oxford).
Takahara, T., Minamoto, T. and Doi, H. (2013). Using
Environmental DNA to Estimate the Distribution of an
Invasive Fish Species in Ponds. PLoS ONE 8, e56584.
Thomsen, P.F., Kielgast, J., Iversen, L.L., Wiuf, C.,
Rasmussen, M., Gilbert, M.T.P., Orlando, L. and
Willerslev, E. (2012a). Monitoring endangered freshwater
biodiversity using environmental DNA. Molecular Ecology
21: 2565-2573.
Thomsen, P.F., Kielgast, J., Iversen, L.L., Møller, P.R.,
Rasmussen, M. and Willerslev, E. (2012b). Detection of a
diverse marine fish fauna using environmental DNA from
seawater samples. PLoS One 7, e41732
Wilcox, T.M., McKelvey, K.S., Young, M.K., Jane, S.F.,
Lowe, W.H., Whiteley, A.R. and Schwartz, M.K. (2013).
Robust Detection of Rare Species Using Environmental
DNA: The Importance of Primer Specificity. PLoS ONE 8,
e59520.
Yoccoz, N.G., Bråthen, K.A., Gielly, L., Haile, J., Edwards,
M.E., Goslar, T., Von Stedingk, H., Brysting, A.K., Coissac,
E., Pompanon, F., Sønstebø, J.H., Miquel, C., Valentini, A.,
De Bello, F., Chave, J., Thuiller, W., Wincker, P., Cruaud,
C., Gavory, F., Rasmussen, M., Gilbert, M.T.P., Orlando,
L., Brochmann, C., Willerslev, E. and Taberlet, P. (2012).
DNA from soil mirrors plant taxonomic and growth form
diversity. Molecular. Ecology 21: 3647–3655.

24
Contributions to the Newsletter, Volume 43
Contributions to the next newsletter should be forwarded to the administration assistant Amy Rowles
[email protected] by the 30th of July 2019.
• Articles may be emailed in WORD, with photos included or referenced in an attached file as a jpg.
• Please keep file size to a minimum, however there is no limit on article size (within reason)
• Ensure all photos are owned by you, or you have permission from the owner
• Ensure that any data presented is yours and you have permission from your client to refer to a specific site
(if not please generalise the location).
• All articles will be reviewed by the editorial committee, and we reserve the right to request amendments to
submitted articles or not to publish.
• Please avoid inflammatory comments about specific persons or entity
The following contributions are welcome and encouraged:
Relevant articles
Anecdotal ecological observations
Hints and information
Upcoming events
Recent literature
New publications (including reviews)
Photographs
Advertising Opportunities with the ECA Website:
$200 for a banner
$300 for company name with some detail and a link
$500 for company name within box, logo, details and
web link
All website packages run for one financial year and include a small ad
in any newsletter produced during the financial year.
Newsletter: $100 for a third of a page
$250 for a half page
$500 for a full page
$1 / insert / pamphlet
Advertising is available to service providers of the Ecological Consulting
industry. The ECA will not advertise a consultant or their consulting
business.
If you wish to advertise, please contact the ECA
administrative assistant on [email protected].
“Non-ECA promotional material presented
in the ECA Newsletter does not necessarily
represent the views of the ECA or its
members.”
25
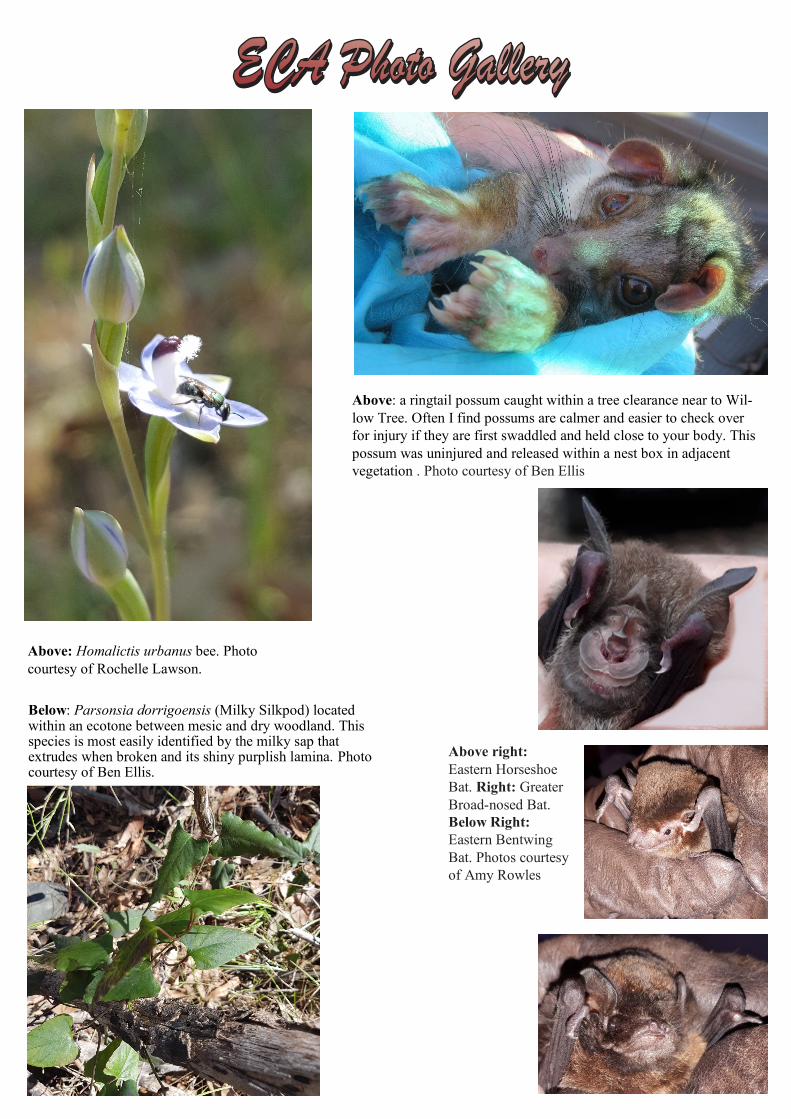
Below: Parsonsia dorrigoensis (Milky Silkpod) located within an ecotone between mesic and dry woodland. This species is most easily identified by the milky sap that extrudes when broken and its shiny purplish lamina. Photo courtesy of Ben Ellis.
Above: Diuris tricolor at Denman,
NSW. Photo courtesy of Alejandro
Barreto. Below: Grevillea acanthifolia.
Photo courtesy of Isaac Mamott
Above: Homalictis urbanus bee. Photo
courtesy of Rochelle Lawson.
Above: a ringtail possum caught within a tree clearance near to Wil-
low Tree. Often I find possums are calmer and easier to check over
for injury if they are first swaddled and held close to your body. This
possum was uninjured and released within a nest box in adjacent
vegetation . Photo courtesy of Ben Ellis
Above right:
Eastern Horseshoe
Bat. Right: Greater
Broad-nosed Bat.
Below Right:
Eastern Bentwing
Bat. Photos courtesy
of Amy Rowles
26
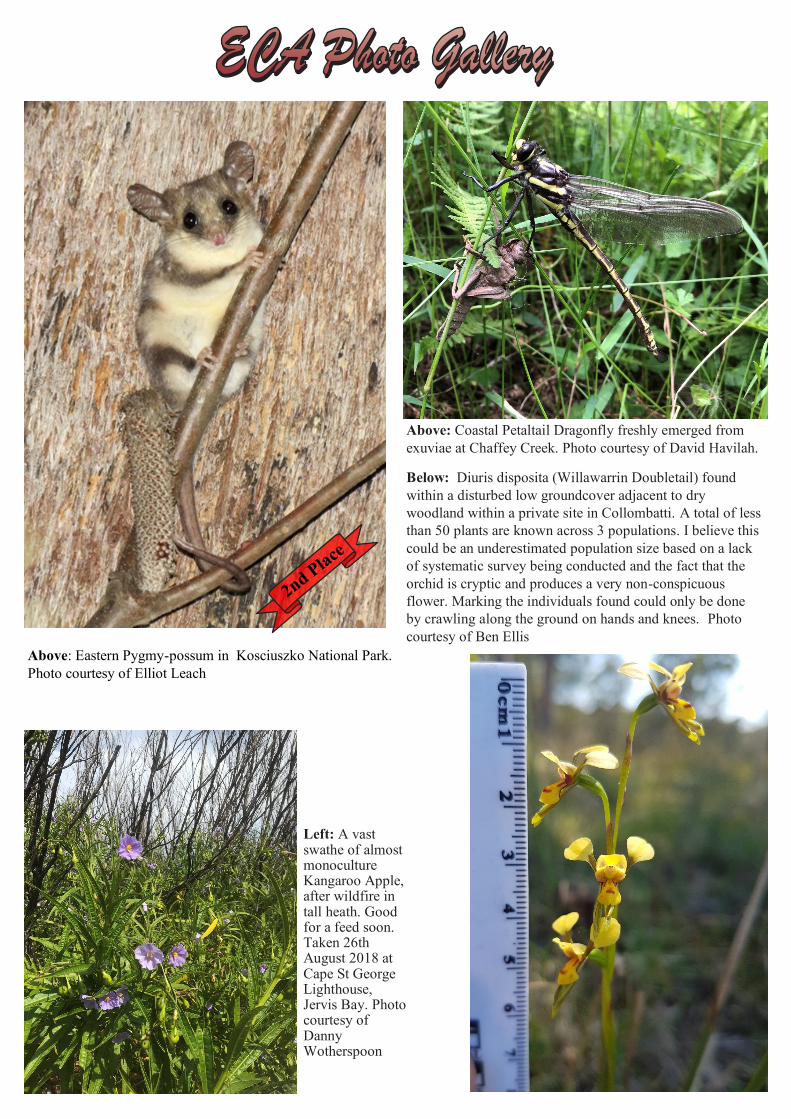
Above: Eastern Pygmy-possum in Kosciuszko National Park.
Photo courtesy of Elliot Leach
Left: A vast swathe of almost monoculture Kangaroo Apple, after wildfire in tall heath. Good for a feed soon. Taken 26th August 2018 at Cape St George Lighthouse, Jervis Bay. Photo courtesy of Danny Wotherspoon
Above: Coastal Petaltail Dragonfly freshly emerged from
exuviae at Chaffey Creek. Photo courtesy of David Havilah.
Below: Diuris disposita (Willawarrin Doubletail) found
within a disturbed low groundcover adjacent to dry
woodland within a private site in Collombatti. A total of less
than 50 plants are known across 3 populations. I believe this
could be an underestimated population size based on a lack
of systematic survey being conducted and the fact that the
orchid is cryptic and produces a very non-conspicuous
flower. Marking the individuals found could only be done
by crawling along the ground on hands and knees. Photo
courtesy of Ben Ellis