
VOLUME 41 NUMBER 2 WINTER 2015 · horizon and compound wealth accumulation ... time should be the...
12
VOLUME 41 NUMBER 2 WINTER 2015 www.iijpm.com The Voices of Influence | iijournals.com
Transcript of VOLUME 41 NUMBER 2 WINTER 2015 · horizon and compound wealth accumulation ... time should be the...
VOLUME 41 NUMBER 2 WINTER 2015www.iijpm.com
The Voices of Influence | iijournals.com
THE JOURNAL OF PORTFOLIO MANAGEMENT WINTER 2015
The Resale Value of Risk-Parity Equity PortfoliosERIC H. SORENSEN AND NICHOLAS F. ALONSO
ERIC H. SORENSEN
is president and CEO at PanAgora Asset Manage-ment in Boston, [email protected]
NICHOLAS F. ALONSO
is a portfolio manager for the Multi-Asset Group at PanAgora Asset Manage-ment in Boston, [email protected]
In this article, we examine the wealth accumulation that risk parity offers when applied to equity portfolios. Eddie Qian [2005, 2006] first introduced the
name “risk parity” in research devoted to alternative multi-asset allocation applica-tions. There is now considerable empirical evidence that multi-asset risk parity applica-tions offer return distributions that are supe-rior to traditional weighting schemes.1
The empirical tests we present con-sider a risk-parity (equal contribution to risk) weighting approach as an alternative to holding capitalization-weighted portfolios. Our work extends in two important aspects. First, we do not apply risk contribution by simply altering the stock-specif ic beta or volatility (total or idiosyncratic) of single stocks in isolation, as suggested by De Car-valho et al. [2012] or Maillard et al. [2010] and practiced by some managers. An effec-tive approach to full equity diversif ication must simultaneously consider the real-world drivers of return disparity: country effects, sector effects, and firm size.
Second, in contrasting the efficiency of alternative strategies, we focus on investment horizon and compound wealth accumulation as the benchmark for diversification benefits. In a multi-period context, researchers have focused on periodic mean and variance of return along with their typical byproducts, such as Sharpe ratio. These are relevant met-
rics, but they do not address horizon. The portfolio’s resale value at some specified future time should be the ultimate objective.
Just what is “investor horizon,” anyway? In comparing strategies, what is the appropriate horizon? If we invest with a lower-volatility technique or an alternative beta technique, how long does it take to pay off? Our lens magnifies accumulated compound wealth (as a form of stochastic dominance) over specified investment horizons. The recent interests in age-based or target-date funds in the defined- contribution (DC) arena directly address investors’ horizon biases. We term “horizon bias” as the behavioral tendency to alter one’s holding period, depending on market cir-cumstances. Unfortunately, not all investors adhere to a disciplined, specified horizon. When markets are moving up, the horizon is long. When things get ugly, the horizon shrinks. This often results in poor timing decisions and inferior wealth accumulation.
THE STANDARD
Capitalization-based security weights constitute a dominant inf luence on the decision-making of institutional and retail global equity portfolio managers. Edwards and Lazzara [2014] report that 12% of the approximate $64 tril lion professionally managed global equities are fully wedded to replicating capitalization-weighted indices.2
JPM-SORENSEN.indd 23JPM-SORENSEN.indd 23 1/20/15 9:08:02 PM1/20/15 9:08:02 PM
THE RESALE VALUE OF RISK-PARITY EQUITY PORTFOLIOS WINTER 2015
The bulk of the “active” 88% typically have a hefty index resemblance.
The origin and evolution of the cap-weighting movement were quite natural.
It dates back to the path-breaking academic work of Sharpe [1964], Treynor [1961, 1962], Lintner [1965], and Mossin [1966]. Among several key assumptions, the cap-ital asset pricing model (CAPM) required that all investors have access to the same information and have homoge-neous expectations about future security return distribu-tions (that are well behaved). In addition, it assumed that all investors have a common, single-period investment horizon. The natural consequence was that, in equilib-rium, investors would hold the market portfolio, which they saw as optimal. CAPM’s elegance, coupled with early academic arguments about market efficiency, motivated the launch of cap-weighted index funds in the 1970s.3
Capitalization-based security weights lead to vola-tility that we might call ordinary. The result is normal volatility. Normal market-portfolio volatility is therefore ubiquitous in practice. However, this market-portfolio volatility tends to offer deficient rewards over time.
THE ALTERNATIVE
Alternative (or commonly alternatives) has become a very interesting label in asset management. Some while ago (before 1970), all money management was alternative. Managers did differ from one another. In the equity world, stock-picking was an art, and as art-ists, the managers could decorate portfolios however they wanted. Then we entered the dawn of modern portfolio theory and the market portfolio. This began the subsequent secular trend in capitalization-weighted portfolios. However, it was soon after the attraction to CAPM and its applications that researchers began to critique the model. Given the ensuing evidence, it seems remarkable that the vast mass of equity exposure remains index-like.
Critique of the linearity theory between portfolio return and portfolio risk emanates from two types of examination: 1) the implications of relaxing CAPM assumptions to better approximate reality; and 2) the empirical evidence on linearity of ex post return and ex ante CAPM beta and/or volatility.
To the first point, Blitz et al. [2014] systematically review the literature on a variety of CAPM assump-tions and empirical tests. They highlight four CAPM
assumptions that have formed bases for academic investigation.
To the second point, many investment managers today offer alternative approaches that consider the insuf-ficiencies of beta to explain return. Haugen and Hines [1975] are often cited as the early evidence that ex post return is not linear in beta. Many others have published research using specific security and portfolio risk metrics to demonstrate the improved return characteristics of lower-risk strategies with higher risk-adjusted returns than their higher-risk counterparts. Simply, high-equity volatility does not pay, but low volatility does.
Fernholtz et al. [1998] published their approach to diversity-weighted portfolios. Subsequent empirical work and investment capabilities followed. Haugen and Baker [1991], Blitz and Vliet [2007], and Clarke et al. [2006] introduced and examined the notion of large-scale, minimum-variance portfolios. In the past decade, a set of practitioners has innovated and managed so-called low-volatility strategies that appear to improve on cap-weighted indices. However, it is not clear that low volatility, per se, is optimal for risk-adjusted wealth accumulation over time.
On the one hand, it may be the case that low vola-tility brings improved diversif ication as a byproduct. On the other hand, risk parity directly confronts the problem of insufficient diversification within the market portfolio by directly balancing out risk concentrations across all of the equities in the market portfolio, as opposed to holding only a subset of the equities that have low volatility.
THE MARKET BETA
The common comparison to all such alternatives is “the market”—the cap-weighted market. Perhaps the cap-weighted market is just one of several inef-f icient portfolios, in that we cannot depend on the standard definition of beta (linear elasticity of a stock with respect to index moves) to deliver commensurate returns. What is the equity market’s relative beta? It is one—right? This is not necessarily the case. Con-sider two potential problems with regression-based beta estimates. First, the market itself may not have a beta of unity. If we assume that investors can (and do) sub-stitute assets other than regular equity in and out of a portfolio, then the reference portfolio should include many types of assets (stocks, bonds, commodities, and
JPM-SORENSEN.indd 24JPM-SORENSEN.indd 24 1/20/15 9:08:02 PM1/20/15 9:08:02 PM
THE JOURNAL OF PORTFOLIO MANAGEMENT WINTER 2015
so on). John Cochrane [2001] has contributed much to this broader framework for asset pricing, to include the return to human capital as a generator of uncertain future cash f lows.
Even if we just add one alternative asset class to the otherwise all-equity portfolio, betas become very dif-ferent. Consider equities and bonds, both candidates for inclusion. These bring both equity risk and bond risk. Some equities are more bond-like than others. In fact, interest-rate risk (as opposed to equity risk premiums) may in some cases be volatility’s dominant determi-nant. Equities have a duration component, which varies greatly from stock to stock.4 In this two asset class case, the beta of the cap-weighted equity market portfolio could deviate from one.
Second, statistical stock beta estimates are likely unstable. They are likely to be mean-reverting, on average. The beta estimate with the equity market cap-tures a single security’s periodic total return, much of which is idiosyncratic. Consider a scenario. A stock is rising faster than the market during a period of normal market returns, due to specif ic fundamentals of the representative industry/sector, accompanied by posi-tive, auto-correlated performance of the industry/sec-tor.5 Over this period, linear regression will estimate the stock’s beta to be greater than one. At a later date, enthusiasm for the industry (and stock) subsides. The beta estimate will decline, other things being equal. As another example, did Japanese stocks have high global betas during their extraordinary run in the midst of the 2013 bull market for global equities? Or was it a transi-tory “Abe Effect”?6 The Abe Effect reverted in 2014, and so did the likely global beta estimates for Japanese stocks, other things being equal.
THE EQUITY RISK PARITY CHALLENGE
Our belief is that statistical beta estimates are unsat-isfactory in creating a fully diversified equity portfolio. Researchers who scale stock weights in the portfolio inversely with historical stock betas (to arrive at equal risk contributions to portfolio construction) have the advantage of simplicity in estimation. However, this comes with the cost of misspecification and less than full diversification in the resulting portfolio. Equal his-torical statistical betas do not equate with equal future risk contribution.
Our approach to full equity diversif ication and maximum reward-to-risk ratios must consider the real-world market participants and their effect on prices. Global institutional investors are inf luenced by changes in fundamentals and sentiment. There is considerable evidence for herding behavior and momentum following. Investor views adapt in aggregate and drive stocks direc-tion and volatility. In developed markets, the returns trends for specific sectors and industries often dominate diversified portfolios’ risk and performance. Country momentum is important, too. In emerging markets, the hierarchy is reversed: countries dominate sectors, but sectors also create risk, as well as specific stock risk.7
Portfolio risks arise in many different dimen-sions. The most inclusive and important dimensions to consider in any equity market are sector, country, and stock. Achieving the perfect balance across each of these dimensions is not possible, because country indices do not always include stocks that represent every sector and country combination. Given this incomplete represen-tation, we are left with the choice of how much risk balance to enforce in several dimensions. Essentially, we seek to balance the following: 1) representation from all stocks in a given universe, 2) incorporation of the funda-mentals that motivate the market players by neutralizing the portfolio’s absolute exposure to risk concentrations within investment styles, 3) selection of parsimonious modeling, and 4) application of a rigorous quantitative framework.
The algorithm for finding the weights that achieve balance in these objectives must simultaneously solve a system of non-linear equations. The algorithm inputs include estimates of each stock’s specific risk (variance) and its risk in the presence of other stocks (covariance) within the same universe, expressed as a variance/cova-riance matrix using a factor-based risk model. This is achieved algorithmically, but not with a one-pass opti-mization to maximize or minimize objective functions, which we define here as optimization results in counter-intuitive solutions that require ad-hoc constraints.
WEALTH CREATION OVER SOME HORIZON
Second-order stochastic dominance is a recognized paradigm for comparing risky gambles when partici-pants are risk averse and prefer more to less. (See Bawa [1975], Yitzhaki [2007], and Shalit [2010, 2014].) In the
JPM-SORENSEN.indd 25JPM-SORENSEN.indd 25 1/20/15 9:08:02 PM1/20/15 9:08:02 PM
THE RESALE VALUE OF RISK-PARITY EQUITY PORTFOLIOS WINTER 2015
basic application, dominance obtains when the cumula-tive distribution function of one gamble (experiment or investment) exceeds that of a second gamble in all states. The comparison of outcomes is state-based, not time-dependent in the ordering of outcomes.
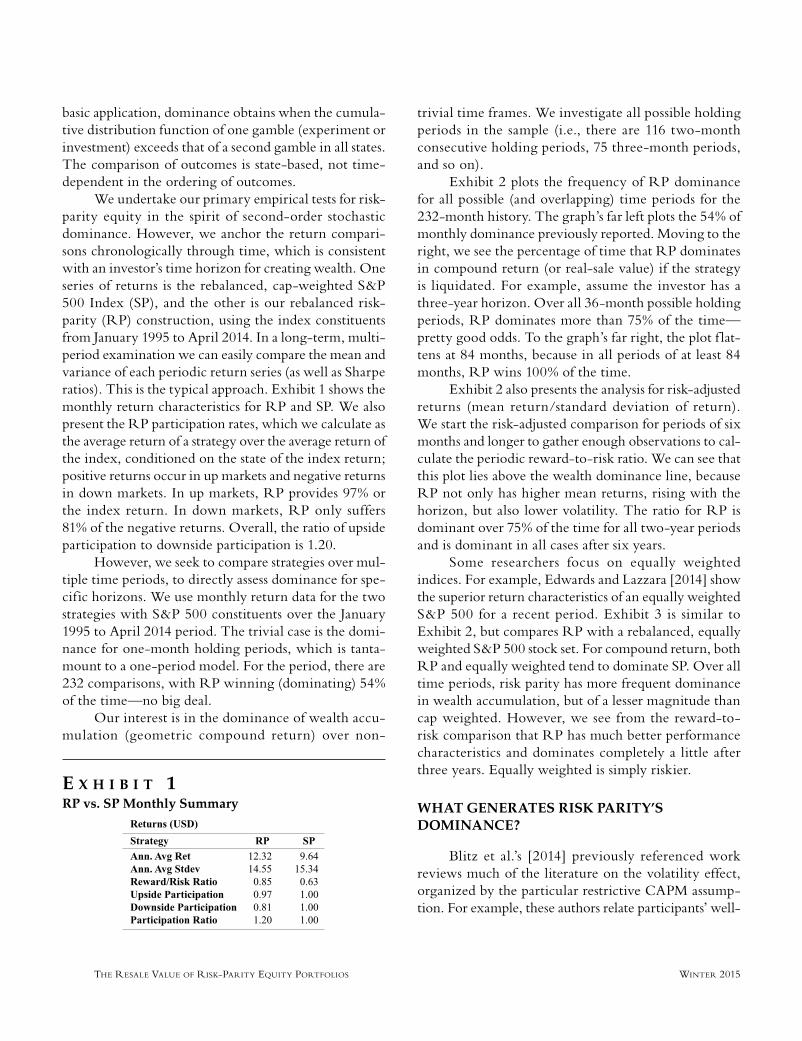
We undertake our primary empirical tests for risk-parity equity in the spirit of second-order stochastic dominance. However, we anchor the return compari-sons chronologically through time, which is consistent with an investor’s time horizon for creating wealth. One series of returns is the rebalanced, cap-weighted S&P 500 Index (SP), and the other is our rebalanced risk-parity (RP) construction, using the index constituents from January 1995 to April 2014. In a long-term, multi-period examination we can easily compare the mean and variance of each periodic return series (as well as Sharpe ratios). This is the typical approach. Exhibit 1 shows the monthly return characteristics for RP and SP. We also present the RP participation rates, which we calculate as the average return of a strategy over the average return of the index, conditioned on the state of the index return; positive returns occur in up markets and negative returns in down markets. In up markets, RP provides 97% or the index return. In down markets, RP only suffers 81% of the negative returns. Overall, the ratio of upside participation to downside participation is 1.20.
However, we seek to compare strategies over mul-tiple time periods, to directly assess dominance for spe-cific horizons. We use monthly return data for the two strategies with S&P 500 constituents over the January 1995 to April 2014 period. The trivial case is the domi-nance for one-month holding periods, which is tanta-mount to a one-period model. For the period, there are 232 comparisons, with RP winning (dominating) 54% of the time—no big deal.
Our interest is in the dominance of wealth accu-mulation (geometric compound return) over non-
trivial time frames. We investigate all possible holding periods in the sample (i.e., there are 116 two-month consecutive holding periods, 75 three-month periods, and so on).
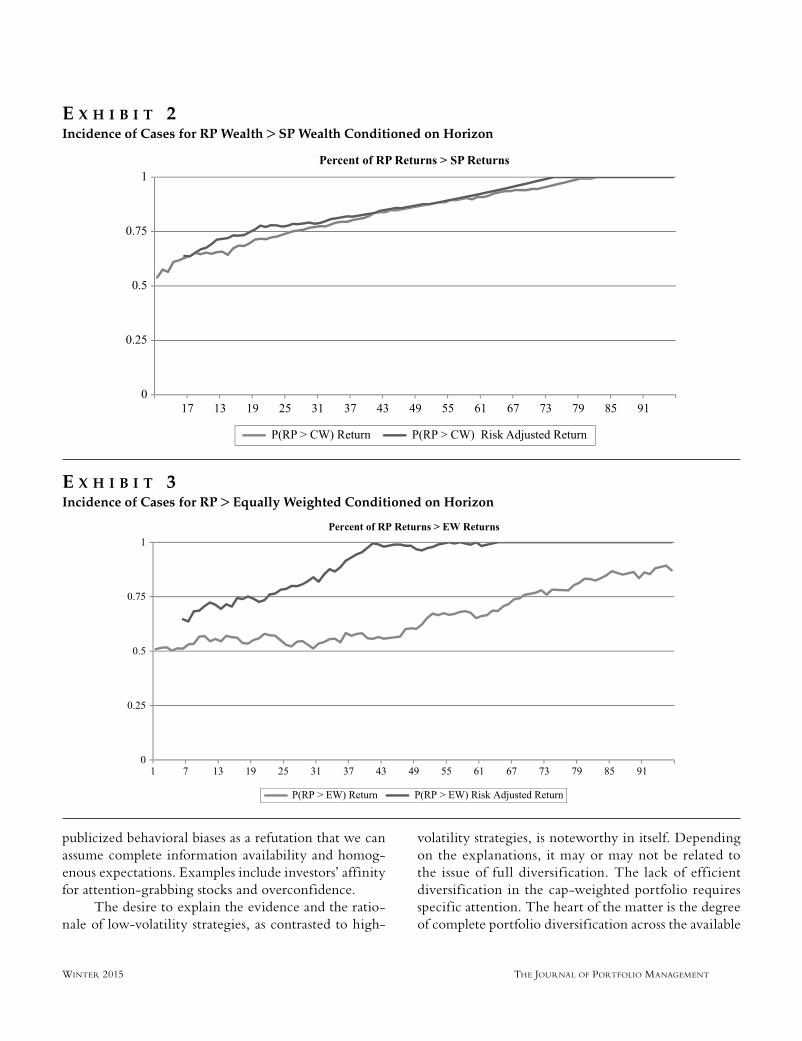
Exhibit 2 plots the frequency of RP dominance for all possible (and overlapping) time periods for the 232-month history. The graph’s far left plots the 54% of monthly dominance previously reported. Moving to the right, we see the percentage of time that RP dominates in compound return (or real-sale value) if the strategy is liquidated. For example, assume the investor has a three-year horizon. Over all 36-month possible holding periods, RP dominates more than 75% of the time—pretty good odds. To the graph’s far right, the plot f lat-tens at 84 months, because in all periods of at least 84 months, RP wins 100% of the time.
Exhibit 2 also presents the analysis for risk-adjusted returns (mean return/standard deviation of return). We start the risk-adjusted comparison for periods of six months and longer to gather enough observations to cal-culate the periodic reward-to-risk ratio. We can see that this plot lies above the wealth dominance line, because RP not only has higher mean returns, rising with the horizon, but also lower volatility. The ratio for RP is dominant over 75% of the time for all two-year periods and is dominant in all cases after six years.
Some researchers focus on equally weighted indices. For example, Edwards and Lazzara [2014] show the superior return characteristics of an equally weighted S&P 500 for a recent period. Exhibit 3 is similar to Exhibit 2, but compares RP with a rebalanced, equally weighted S&P 500 stock set. For compound return, both RP and equally weighted tend to dominate SP. Over all time periods, risk parity has more frequent dominance in wealth accumulation, but of a lesser magnitude than cap weighted. However, we see from the reward-to-risk comparison that RP has much better performance characteristics and dominates completely a little after three years. Equally weighted is simply riskier.
WHAT GENERATES RISK PARITY’S DOMINANCE?
Blitz et al.’s [2014] previously referenced work reviews much of the literature on the volatility effect, organized by the particular restrictive CAPM assump-tion. For example, these authors relate participants’ well-
E X H I B I T 1RP vs. SP Monthly Summary
JPM-SORENSEN.indd 26JPM-SORENSEN.indd 26 1/20/15 9:08:02 PM1/20/15 9:08:02 PM
THE JOURNAL OF PORTFOLIO MANAGEMENT WINTER 2015
publicized behavioral biases as a refutation that we can assume complete information availability and homog-enous expectations. Examples include investors’ affinity for attention-grabbing stocks and overconfidence.
The desire to explain the evidence and the ratio-nale of low-volatility strategies, as contrasted to high-
volatility strategies, is noteworthy in itself. Depending on the explanations, it may or may not be related to the issue of full diversif ication. The lack of eff icient diversif ication in the cap-weighted portfolio requires specific attention. The heart of the matter is the degree of complete portfolio diversification across the available
E X H I B I T 2Incidence of Cases for RP Wealth > SP Wealth Conditioned on Horizon
E X H I B I T 3Incidence of Cases for RP > Equally Weighted Conditioned on Horizon
JPM-SORENSEN.indd 27JPM-SORENSEN.indd 27 1/20/15 9:08:02 PM1/20/15 9:08:02 PM
THE RESALE VALUE OF RISK-PARITY EQUITY PORTFOLIOS WINTER 2015
set of securities. Risk parity is not an application of low volatility versus high volatility, but rather effective diversification versus the fat-tailed alternatives. Gener-ally speaking, stable, well-diversif ied portfolios have been shown to have superior cumulative returns versus capitalization-weighted alternatives, given their ability to avoid large losses during periods of market turmoil (Fernholtz et al. [1998]). Risk parity is a stable, well-diversified portfolio that, on average, has almost the full upside of the index in rising markets, but avoids a disproportionate amount of the downside in falling markets.
When we can hold any subset of stocks in an index universe and weight them according to a risk-parity solution, this controls the excess risks in a cap-weighted scheme. Risk parity is a generalized portfolio construc-tion solution that we can apply in many directions. For example, the risk parity process can apply to a subset of securities defined by below-average volatility, above-average growth, higher dividend yield, and so on.
What is wrong with the cap-weighted index and its volatility? It may be the result that “we all look the same.”8 Cap-weighted indices present many avenues to accommodate f low into and out of the market, including derivatives, exchange-traded funds, and the like. When investors increase equity asset risk, it f lows into large-cap stocks, one way or another. This can abruptly reverse as well. The beast is just too big to be stable at market extremes—and when the aggregate crowd wants more (or less) exposure, the beast moves. During the latter stages of bull markets, we can have melt-ups.9 Moreover, bear market meltdowns can even be more dramatic. The more stable, compound wealth strength of the risk-parity alternative mitigates the negative fat tails. In some sense, it appears that histori-cally, risk parity would have delivered a free lunch.
Looking closer at the history of risk-parity per-formance provides some evidence regarding the market environments that make it an interesting alternative. We offer some further perspectives by examining spe-cif ic conditions that tend to support risk parity as a long-term diversif ier.
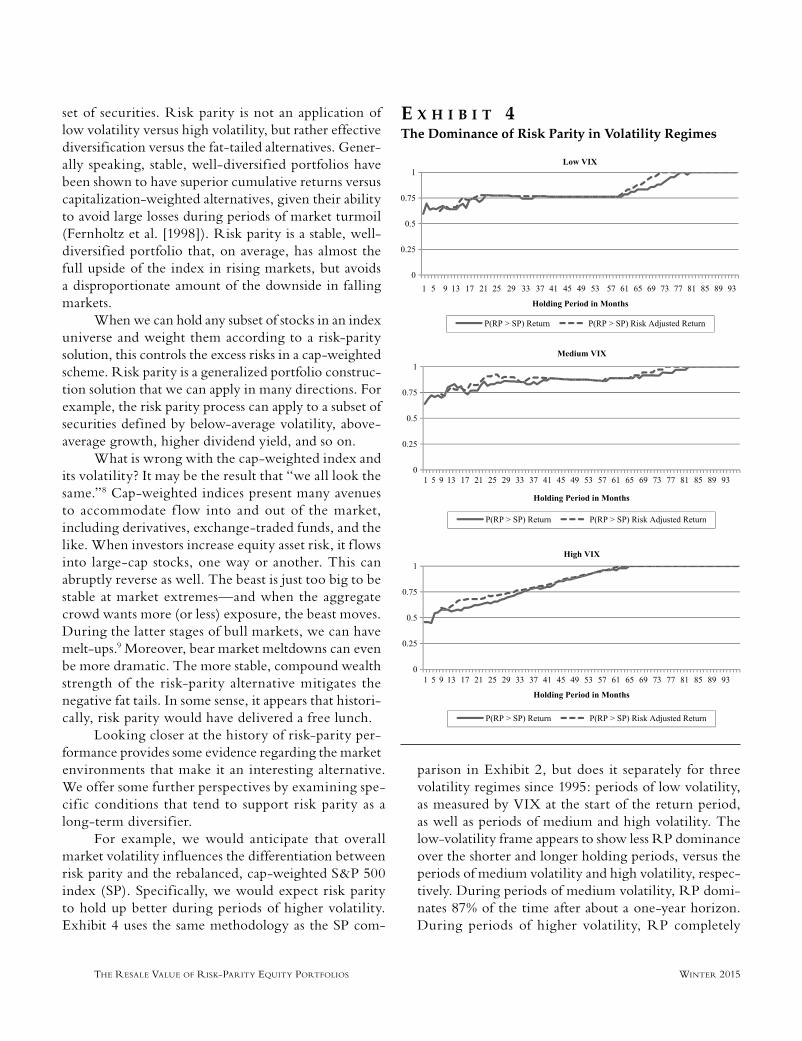
For example, we would anticipate that overall market volatility inf luences the differentiation between risk parity and the rebalanced, cap-weighted S&P 500 index (SP). Specifically, we would expect risk parity to hold up better during periods of higher volatility. Exhibit 4 uses the same methodology as the SP com-
parison in Exhibit 2, but does it separately for three volatility regimes since 1995: periods of low volatility, as measured by VIX at the start of the return period, as well as periods of medium and high volatility. The low-volatility frame appears to show less RP dominance over the shorter and longer holding periods, versus the periods of medium volatility and high volatility, respec-tively. During periods of medium volatility, RP domi-nates 87% of the time after about a one-year horizon. During periods of higher volatility, RP completely
E X H I B I T 4The Dominance of Risk Parity in Volatility Regimes
JPM-SORENSEN.indd 28JPM-SORENSEN.indd 28 1/20/15 9:08:03 PM1/20/15 9:08:03 PM
THE JOURNAL OF PORTFOLIO MANAGEMENT WINTER 2015
dominates for horizons longer than four years after strategy initiation. This perhaps indicates the defensive character of down-market protec-tion as volatility rises.
We group the VIX levels into the low, medium, and high states, using only data that would have been available at each date. All returns are forward looking from the month fol-lowing the last VIX measurement. We use return data from January 1995 to April 2014 and VIX data from February 1991.
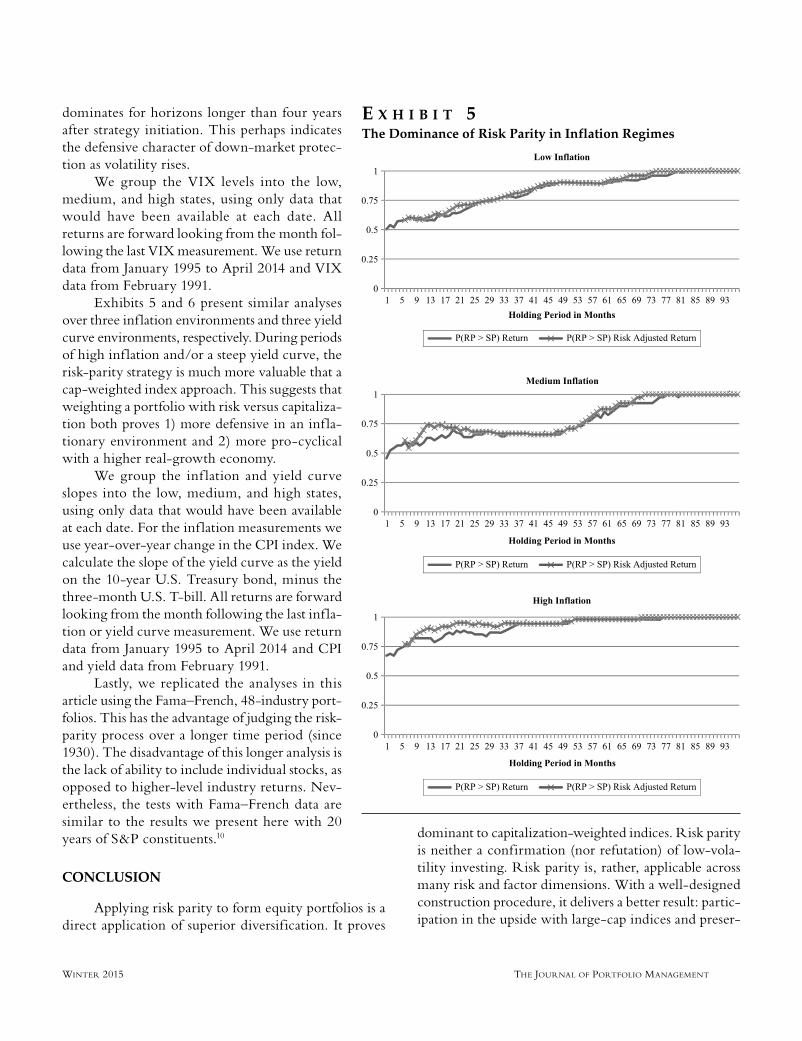
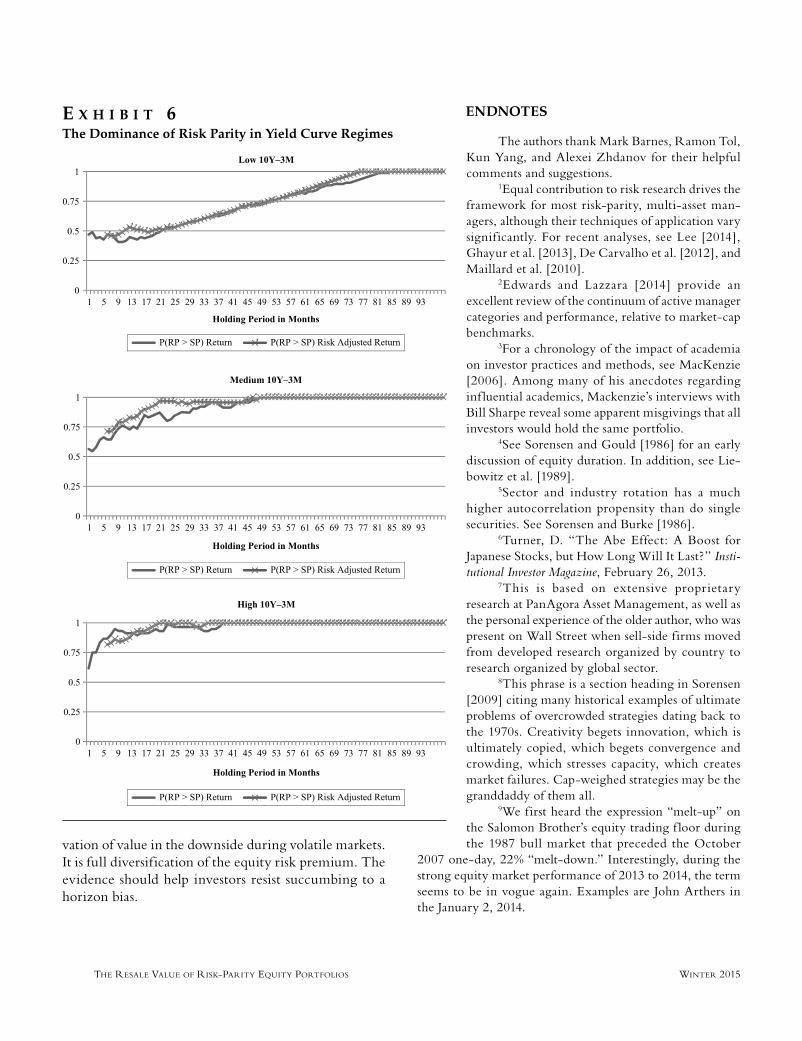
Exhibits 5 and 6 present similar analyses over three inf lation environments and three yield curve environments, respectively. During periods of high inf lation and/or a steep yield curve, the risk-parity strategy is much more valuable that a cap-weighted index approach. This suggests that weighting a portfolio with risk versus capitaliza-tion both proves 1) more defensive in an inf la-tionary environment and 2) more pro-cyclical with a higher real-growth economy.
We group the inf lation and yield curve slopes into the low, medium, and high states, using only data that would have been available at each date. For the inf lation measurements we use year-over-year change in the CPI index. We calculate the slope of the yield curve as the yield on the 10-year U.S. Treasury bond, minus the three-month U.S. T-bill. All returns are forward looking from the month following the last inf la-tion or yield curve measurement. We use return data from January 1995 to April 2014 and CPI and yield data from February 1991.
Lastly, we replicated the analyses in this article using the Fama–French, 48-industry port-folios. This has the advantage of judging the risk-parity process over a longer time period (since 1930). The disadvantage of this longer analysis is the lack of ability to include individual stocks, as opposed to higher-level industry returns. Nev-ertheless, the tests with Fama–French data are similar to the results we present here with 20 years of S&P constituents.10
CONCLUSION
Applying risk parity to form equity portfolios is a direct application of superior diversification. It proves
dominant to capitalization-weighted indices. Risk parity is neither a confirmation (nor refutation) of low-vola-tility investing. Risk parity is, rather, applicable across many risk and factor dimensions. With a well-designed construction procedure, it delivers a better result: partic-ipation in the upside with large-cap indices and preser-
E X H I B I T 5The Dominance of Risk Parity in Inflation Regimes
JPM-SORENSEN.indd 29JPM-SORENSEN.indd 29 1/20/15 9:08:04 PM1/20/15 9:08:04 PM
THE RESALE VALUE OF RISK-PARITY EQUITY PORTFOLIOS WINTER 2015
vation of value in the downside during volatile markets. It is full diversification of the equity risk premium. The evidence should help investors resist succumbing to a horizon bias.
ENDNOTES
The authors thank Mark Barnes, Ramon Tol, Kun Yang, and Alexei Zhdanov for their helpful comments and suggestions.
1Equal contribution to risk research drives the framework for most risk-parity, multi-asset man-agers, although their techniques of application vary signif icantly. For recent analyses, see Lee [2014], Ghayur et al. [2013], De Carvalho et al. [2012], and Maillard et al. [2010].
2Edwards and Lazzara [2014] provide an excellent review of the continuum of active manager categories and performance, relative to market-cap benchmarks.
3For a chronology of the impact of academia on investor practices and methods, see MacKenzie [2006]. Among many of his anecdotes regarding inf luential academics, Mackenzie’s interviews with Bill Sharpe reveal some apparent misgivings that all investors would hold the same portfolio.
4See Sorensen and Gould [1986] for an early discussion of equity duration. In addition, see Lie-bowitz et al. [1989].
5Sector and industry rotation has a much higher autocorrelation propensity than do single securities. See Sorensen and Burke [1986].
6Turner, D. “The Abe Effect: A Boost for Japanese Stocks, but How Long Will It Last?” Insti-tutional Investor Magazine, February 26, 2013.
7This is based on extensive proprietary research at PanAgora Asset Management, as well as the personal experience of the older author, who was present on Wall Street when sell-side firms moved from developed research organized by country to research organized by global sector.
8This phrase is a section heading in Sorensen [2009] citing many historical examples of ultimate problems of overcrowded strategies dating back to the 1970s. Creativity begets innovation, which is ultimately copied, which begets convergence and crowding, which stresses capacity, which creates market failures. Cap-weighed strategies may be the granddaddy of them all.
9We first heard the expression “melt-up” on the Salomon Brother’s equity trading f loor during the 1987 bull market that preceded the October
2007 one-day, 22% “melt-down.” Interestingly, during the strong equity market performance of 2013 to 2014, the term seems to be in vogue again. Examples are John Arthers in the January 2, 2014.
E X H I B I T 6The Dominance of Risk Parity in Yield Curve Regimes
JPM-SORENSEN.indd 30JPM-SORENSEN.indd 30 1/20/15 9:08:05 PM1/20/15 9:08:05 PM
THE JOURNAL OF PORTFOLIO MANAGEMENT WINTER 2015
Financial Times (“2014 Outlook: Market Melt-up”); David Berman in the July 23, 2014 Globe and Mail (“Are We in the Early Stages of a Market ‘Melt-Up’”).
10These results are available upon request.
REFERENCES
Bawa, V. “Optimal Rules for Ordering Uncertain Prospects.” Journal of Financial Economics, 2 (1975), pp. 95-121.
Blitz, D., and P. van Vliet. “The Volatility Effect: Lower Risk without Lower Return ( July 4, 2007).” The Journal of Portfolio Management, pp. 102-113, Fall 2007; ERIM Report Series Reference No. ERS-2007-044-F&A.
Blitz, D., E. Falkenstein, and P. van Vliet. “Explanations for the Volatility Effect: An Overview Based on the CAPM Assumptions.” The Journal of Portfolio Management, Vol. 40, No. 3 (Spring 2014), pp. 61-76.
Clarke, R., H. de Silva, and S. Thorley. “Minimum-Variance Portfolios in the U.S. Equity Market.” The Journal of Portfolio Management, Vol. 33, No. 1 (2006), pp. 10-24.
Cochrane, J. Asset Pricing. Princeton: Princeton University Press, 2001.
De Carvalho, R., X. Lu, and P. Moulin. “Demystifying Equity Risk-Based Strategies: A Simple Alpha Plus Beta Description.” The Journal of Portfolio Management, Vol. 38, No. 3 (Spring 2012), pp. 56-70.
Edwards, T., and C. Lazzara. “Equity-Weight Benchmarking: Raising the Monkey Bars.” S&P Dow Jones Indices Research, June 2014, pp. 1-9.
Fernholtz, R., R. Garvy, and J. Hannon. “Diversity-Weighted Indexing.” The Journal of Portfolio Management, Vol. 4, No. 2 (1998), pp. 74-82.
Ghayur, K., R. Heaney, and S. Platt. “Low-Volatility Investing: Balancing Total Risk and Active Risk Consid-erations.” The Journal of Portfolio Management, Vol. 40, No. 1 (Fall 2013), pp. 49-60.
Haugen, R., and A. Heins. “Risk and the Rate of Return on Financial Assets: Some Old Wine in New Bottles.” Journal of Financial and Quantitative Analysis, 10 (1975), pp. 775-884.
Haugen, R., and N. Baker. “The Efficient Market Ineffi-ciency of Capitalization-Weighted Stock Portfolios.” The Journal of Portfolio Management, Vol. 17, No. 3 (Spring 1991), pp. 35-40.
Lee, W. “Constraints and Innovations for Pension Investment: The Cases of Risk Parity and Risk Premia Investing.” The Journal of Portfolio Management, Vol. 40, No. 3 (Spring 2014), pp. 12-19.
Leibowitz M., E. Sorensen, N. Hanson, and R. Arnott. “A Total Differential Approach to Equity Duration.” Financial Analysts Journal, September/October 1989, Vol. 45, No. 5, pp. 30-37.
Lintner, J. “The Valuation of Risk Assets and the Selection of Risky Investments in Stock Portfolios and Capital Budgets.” Review of Economics and Statistics, 47 (1965), pp.13-37.
MacKenzie, D. An Engine, Not a Camera: How Financial Models Shape Markets. Cambridge, MA: The MIT Press, 2006.
Maillard, S., T. Roncalli, and J. Teiletche. “The Properties of Equally Weighted Risk Contribution Portfolios.” The Journal of Portfolio Management, Vol. 36, No. 4 (2010), pp. 60-70.
Mossin, J. “Equilibrium in a Capital Asset Market.” Economet-rica, Vol. 34, No. 4 ( January 1966), pp. 768-783.
Qian, E. “Risk-Parity Portfolios: Efficient Portfolios through True Diversification.” PanAgora Asset Management, 2005.
——. “On the Financial Interpretation of Risk Contribu-tions: Risk Budgets Do Add Up.” The Journal of Investment Management, Vol. 4, No. 4 (2006), pp. 41-51.
Shalit, H. “Finding Better Securities While Holding Port-folios: Is Stochastic Dominance the Answer?” The Journal of Portfolio Management, Vol. 37, No. 1 (Fall 2010), pp. 31-42.
——. “Portfolio Risk Management Using the Lorenz Curve.” The Journal of Portfolio Management, Vol. 40, No. 3 (Spring 2014), pp. 152-159.
Sharpe, W. “Capital Asset Prices: A Theory of Market Equi-librium under Conditions of Risk.” Journal of Finance, 18 (Sep-tember 1964), pp. 425-442.
JPM-SORENSEN.indd 31JPM-SORENSEN.indd 31 1/20/15 9:08:06 PM1/20/15 9:08:06 PM
THE RESALE VALUE OF RISK-PARITY EQUITY PORTFOLIOS WINTER 2015
Sorensen, E. “Active Equity Management for the Future.” The Journal of Portfolio Management, 36 (Fall 2009), pp. 60-68.
Sorensen, E., and T. Burke. “Active Portfolio Management with Group Rotation.” Financial Analysts Journal, September-October 1986, pp. 43-50.
Sorensen, E., and J. Gould. “Duration: A Factor in Equity Pricing.” The Journal of Portfolio Management, 13 (Fall 1986), pp. 38-43.
Treynor, J. “Market Value, Time, and Risk.” Unpublished manuscript, 1961.
Treynor, J. “Toward a Theory of Market Value of Risky Assets.” Unpublished manuscript, 1962. (A final version was published in 1999, in Asset Pricing and Portfolio Performance: Models, Strategy and Performance Metrics, edited by Robert A. Korajczyk, pp. 15-22. London: Risk Books, 1999.)
Yitzhaki, S. “Stochastic Dominance, Mean-Variance, and Gini’s Mean Difference.” American Economic Review, Vol. 72, No. 1 (March 1982), pp. 178-185.
To order reprints of this article, please contact Dewey Palmieri at [email protected] or 212-224-3675.
JPM-SORENSEN.indd 32JPM-SORENSEN.indd 32 1/20/15 9:08:06 PM1/20/15 9:08:06 PM
PanAgora Asset Management470 Atlantic Avenue, 8th Floor
Boston, MA 02210
The opinions expressed in this article represent the current, good faith views of the author(s) at the time of publication, are provided for limited purposes, are not definitive investment advice, and should not be relied on as such. The information presented in this article has been developed internally and/or obtained from sources believed to be reliable; however, PanAgora does not guarantee the accuracy, adequacy or completeness of such information. Predictions, opinions, and other information contained in this article are subject to change continually and without notice of any kind and may no longer be true after the date indicated. The views expressed represent the current, good faith views of the author(s) at the time of publication. Any forward-looking statements speak only as of the date they are made, and PanAgora assumes no duty to and does not undertake to update forward-looking statements. Forward-looking statements are subject to numerous assumptions, risks and uncertainties, which change over time. Actual results could differ materially from those anticipated in forward-looking statements. HYPOTHETICAL PERFORMANCE RESULTS HAVE MANY INHERENT LIMITATIONS, SOME OF WHICH ARE DESCRIBED BELOW. NO REPRESENTATION IS BEING MADE THAT ANY ACCOUNT WILL OR IS LIKELY TO ACHIEVE PROFITS OR LOSSES SIMILAR TO THOSE SHOWN. IN FACT, THERE ARE FREQUENTLY SHARP DIFFERENCES BETWEEN HYPOTHETICAL PERFORMANCE RESULTS AND THE ACTUAL RESULTS SUBSEQUENTLY ACHIEVED BY ANY PARTICULAR INVESTMENT PROGRAM. ONE OF THE LIMITATIONS OF HYPOTHETICAL PERFORMANCE RESULTS IS THAT THEY ARE GENERALLY PREPARED WITH THE BENEFIT OF HINDSIGHT. IN ADDITION, HYPOTHETICAL TRADING DOES NOT INVOLVE FINANCIAL RISK, AND NO HYPOTHETICAL TRADING RECORD CAN COMPLETELY ACCOUNT FOR THE IMPACT OF FINANCIAL RISK IN ACTUAL TRADING. FOR EXAMPLE, THE ABILITY TO WITHSTAND LOSSES OR TO ADHERE TO A PARTICULAR INVESTMENT PROGRAM IN SPITE OF TRADING LOSSES ARE MATERIAL POINTS WHICH CAN ALSO ADVERSELY AFFECT ACTUAL TRADING RESULTS. THERE ARE NUMEROUS OTHER FACTORS RELATED TO THE MARKETS IN GENERAL OR TO THE IMPLEMENTATION OF ANY SPECIFIC INVESTMENT PROGRAM WHICH CANNOT BE FULLY ACCOUNTED FOR IN THE PREPARATION OF HYPOTHETICAL PERFORMANCE RESULTS AND ALL OF WHICH CAN ADVERSELY AFFECT ACTUAL TRADING RESULTS.
The S&P 500 Index is an unmanaged list of common stocks that is frequently used as a general measure of U.S. stock market performance.
RISK CONSIDERATIONSInternational investing involves certain risks, such as currency fluctuations, economic instability, and political developments. Additional risks may be associated with emerging market securities,including illiquidity and volatility. Active currency management, like any other investment strategy, involves risk, including market risk and event risk, and the risk of loss of principal amount invested.
Derivative instruments may at times be illiquid, subject to wide swings in prices, difficult to value accurately and subject to default by the issuer. Strategies that use leverage extensively to gain exposure to various markets may not be suitable for all investors. Any use of leverage exposes the strategy to risk of loss. In some cases the risk may be substantial.
This material is directed exclusively at investment professionals. Any investments to which this material relates are available only to or will be engaged in only with investment professionals. Past performance is no guarantee of future results. PanAgora is exempt from the requirement to hold an Australian financial services license under the Corporations Act 2001 in respect of the financial services. PanAgora is regulated by the SEC under US laws, which differ from Australian laws.