
Volume 2: Update - NREL
59
Volume 2: Update & FEDERAL RESOURCE PLANNING
Transcript of Volume 2: Update - NREL

Volume 2: Update
& FEDERAL RESOURCE PLANNING


National Renewable Energy Laboratory15013 Denver West Parkway, Golden, CO 80401303-275-3000 • www.nrel.gov
Cover photo from iStock 97368519
NREL is a national laboratory of the U.S. Department of EnergyOffice of Energy Efficiency and Renewable Energy
Operated by the Alliance for Sustainable Energy, LLC
NREL/TP-6A20-72859 • May 2019
David J. Hurlbut, Megan Day, Alex Badgett, and Misty ConradNational Renewable Energy Laboratory
Navajo Generating Station & Federal Resource PlanningVolume 2: Update
NOTICE
This work was authored by the National Renewable Energy Laboratory, operated by Alliance for Sustainable Energy, LLC, for the U.S. Department of Energy (DOE) under Contract No. DE-AC36-08GO28308 with Alliance for Sustainable Energy, LLC, the operator of the National Renewable Energy Laboratory, and the U.S. Bureau of Reclamation under contract No. IA R14PG00077. The views expressed in the article do not necessarily represent the views of the DOE or the U.S. Government. The U.S. Government retains and the publisher, by accepting the article for publication, acknowledges that the U.S. Government retains a nonexclusive, paid-up, irrevocable, worldwide license to publish or reproduce the published form of this work, or allow others to do so, for U.S. Government purposes.
This report is available at no cost from the National Renewable EnergyLaboratory (NREL) at www.nrel.gov/publications.
Available electronically at SciTech Connect http:/www.osti.gov/scitechAvailable for a processing fee to U.S. Department of Energyand its contractors, in paper, from:
U.S. Department of EnergyOffice of Scientific and Technical InformationP.O. Box 62Oak Ridge, TN 37831-0062OSTI http://www.osti.govPhone: 865.576.8401Fax: 865.576.5728Email: [email protected]
Available for sale to the public, in paper, from:
U.S. Department of CommerceNational Technical Information Service5301 Shawnee RoadAlexandria, VA 22312NTIS http://www.ntis.govPhone: 800.553.6847 or 703.605.6000Fax: 703.605.6900Email: [email protected]

iii This report is available at no cost from the National Renewable Energy Laboratory (NREL) at www.nrel.gov/publications
Preface This is the second volume of Navajo Generating Station and Federal Resource Planning. The first volume, released in November 2016, provided an assessment of sectoral, technical, and economic trends that were likely to affect future operations of the Navajo Generating Station (NGS) and new energy development by Indian tribes in Arizona. The aim of Volume 1 was to provide the U.S. Bureau of Reclamation (USBR) with a thorough knowledge base that it could use in forming policies for the Central Arizona Project and other federal objectives within the Bureau’s charge. This volume updates the earlier analysis with recent market, policy and regulatory trends.
This series is part of a special collaboration between USBR and the National Renewable Energy Laboratory (NREL) on issues affecting NGS. As a national laboratory with no financial stake in the outcome, NREL is positioned to provide USBR with independent analysis on relevant market trends in the power sector. This report memorializes analysis NREL has provided directly to USBR since 2016 as circumstances affecting NGS have evolved.
The authors are grateful for feedback on the final report provided by reviewers outside NREL, including Pat Wood III, Susan Tierney, reviewers with NGS operator Salt River Project, and reviewers with USBR. We also benefitted from comments by several NREL experts, including Jeff Logan, Gian Porro, Dan Bilello, and Elizabeth Doris.
iv This report is available at no cost from the National Renewable Energy Laboratory (NREL) at www.nrel.gov/publications
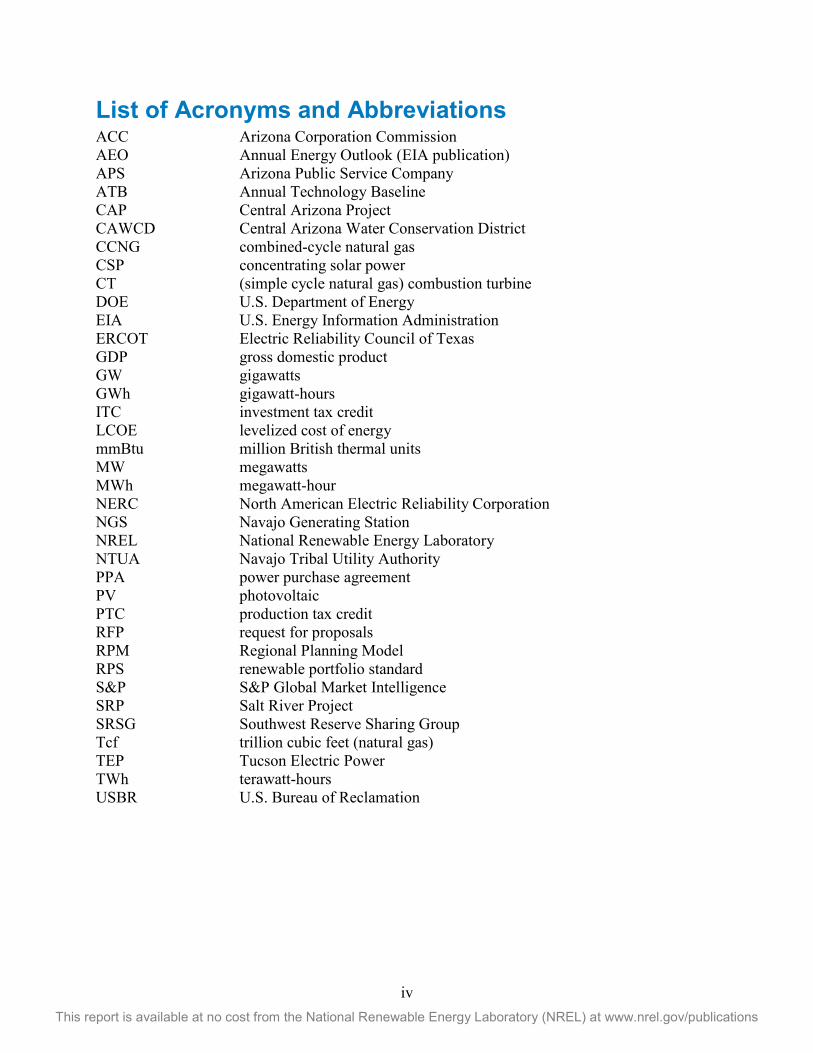
List of Acronyms and Abbreviations ACC Arizona Corporation Commission AEO Annual Energy Outlook (EIA publication) APS Arizona Public Service Company ATB Annual Technology Baseline CAP Central Arizona Project CAWCD Central Arizona Water Conservation District CCNG combined-cycle natural gas CSP concentrating solar power CT (simple cycle natural gas) combustion turbine DOE U.S. Department of Energy EIA U.S. Energy Information Administration ERCOT Electric Reliability Council of Texas GDP gross domestic product GW gigawatts GWh gigawatt-hours ITC investment tax credit LCOE levelized cost of energy mmBtu million British thermal units MW megawatts MWh megawatt-hour NERC North American Electric Reliability Corporation NGS Navajo Generating Station NREL National Renewable Energy Laboratory NTUA Navajo Tribal Utility Authority PPA power purchase agreement PV photovoltaic PTC production tax credit RFP request for proposals RPM Regional Planning Model RPS renewable portfolio standard S&P S&P Global Market Intelligence SRP Salt River Project SRSG Southwest Reserve Sharing Group Tcf trillion cubic feet (natural gas) TEP Tucson Electric Power TWh terawatt-hours USBR U.S. Bureau of Reclamation

v This report is available at no cost from the National Renewable Energy Laboratory (NREL) at www.nrel.gov/publications
Executive Summary This report is the second of two volumes on federal energy resource planning related to the Navajo Generating Station (NGS), the largest coal-fired power plant in the western United States. The first volume, published in 2016, described electricity sector baseline conditions affecting both continued operation of NGS and low-emission alternatives. This volume tracks actual market outcomes since 2016 and updates earlier analyses with recent data.
During the time between publication of the two volumes, the utility owners of NGS announced their intention to divest their positions in NGS at the end of 2019. The plant would likely retire unless a new owner takes over. One unique consequence of retiring NGS would be the need to find new sources of electricity for the Central Arizona Project (CAP), a U.S. Bureau of Reclamation project moving water from the Colorado River to central Arizona. NGS was built in the early 1970s to provide bulk power for CAP pumping, and the federal government holds a 24.3% entitlement to the plant. The Central Arizona Water Conservation District, which manages CAP, is securing other sources of electricity.
Although circumstances affecting future operations of NGS have been in a state of change over the past two years, two USBR public interest objectives have remained constant: securing cost-effective and reliable sources of power for CAP and future water development projects in the region, and continuing the agency’s working relationship with Arizona Indian tribes on issues related to water development. This update to NREL’s 2016 baseline study is intended to provide a knowledge base for both objectives.
Market Trends Affecting NGS Several sector-wide economic factors have continued to affect the economics of NGS. Key trends include the following.
• NGS, like coal plants nationwide, continues to face competition from combined-cycle natural gas (CCNG) generators.
• Wholesale power prices in the Southwest are highly correlated to natural gas prices, which continued to trend low after 2016. The accelerated use of enhanced oil and gas production techniques has increased the supply of natural gas since 2014, resulting in an extended period of low prices.
• Like several other parts of the country, the Southwest has a large supply of available capacity on already-existing CCNG generators. NREL modeling indicates that replacing NGS would require little investment in new capacity before 2030.
• The cost of electricity delivered to Arizona customers from 2015 to 2018 might have been $98 million lower if electricity from NGS had instead come from unused capacity on Arizona CCNGs that cost less to operate, based on dispatch simulations conducted by NREL. Results from these simulations indicate continued price pressure on NGS.
• Retiring NGS would likely reduce the Southwest’s reserve margin to near the region’s reliability benchmark. The reserve margin would recover or deteriorate in the years following NGS retirement, depending on growth in the region’s peak load, capacity additions, and other retirements. Growth in the use of utility-scale battery storage could provide additional relief, especially if its operational flexibility were to increase the peak load contribution of solar and wind resources.

vi This report is available at no cost from the National Renewable Energy Laboratory (NREL) at www.nrel.gov/publications
• Arizona’s energy efficiency programs have helped keep post-recession load growth to around 1% per year. At this pace, the region’s reserve margin would recover after the retirement of NGS (if nothing else changed). On the other hand, the reserve margin would deteriorate if load were to grow by more than 1.5% per year.
• Renewable energy trends appear to be independent of the economic competition between NGS and CCNG plants in the region. Integrating wind and solar resources would likely remain the same with or without NGS. Demand for wind and solar power remains a function of state renewable portfolio standard mandates and, increasingly, voluntary demand from corporate customers and municipalities, as well as competitive renewable energy prices in many applications.
• The costs of new solar and wind plants have fallen faster than was anticipated in 2016. Throughout 2018 utilities and other buyers consistently reported power purchase agreement prices for renewable energy that were significantly below $42 per megawatt-hour (MWh), the average price of peak-period wholesale power at the Mead Hub (the wholesale power trading hub closest to NGS).
• Natural gas prices remained low for most of 2018 and rose near the end of the year, consistent with seasonal trends. The U.S. Energy Information Administration expects natural gas prices to return to near or below their 2018 levels early in 2019.
• Scheduled reductions in the federal investment tax credit (ITC) and the scheduled end of the production tax credit (PTC) might cause a surge of renewable energy development in 2019 and 2020. Based on historical experience, this could be followed by a lull in new wind and solar installations shortly after that time. The reason would be the acceleration of project timelines to take advantage of the ITC and PTC.
Implications for Tribal Energy Development The sectoral conditions described above will likely affect outward-facing energy development goals of the Navajo Nation, Hopi Tribe, and other Southwest tribes. Revenue-producing utility-scale energy projects sited on tribal lands serving load elsewhere in the region will need to be bankable to happen, and indications are that the market will be highly competitive.
• NREL modeling suggests little economic demand for new CCNG plants in the Southwest, on or off Indian reservations. What little demand might exist for new natural gas combustion turbines has already been met.
• Tribes aspiring toward export-oriented renewable energy development will most likely encounter a regional “buyers’ market” that has many options for supply.
• Tribes can reasonably anticipate a surge in renewable energy development until 2019 and a lull in new activity shortly after that. Those not positioned for project development during the surge period will likely face a tougher market during the lull. Demand for new renewables might be more price-sensitive, federal subsidies could be diminished, and competition among developers might be more rigorous.
• Projects on tribal land will need to be cost-competitive in order to proceed to development, construction, and operation. One recent solar project built on the Moapa River Indian Reservation near Las Vegas is providing power at a flat rate of less than $24 per MWh. NREL modeling indicates that cost-effective options might also exist on the Navajo and Hopi Reservations.

vii This report is available at no cost from the National Renewable Energy Laboratory (NREL) at www.nrel.gov/publications
• However, even if a project is cost-competitive on paper, the risk of delay could reduce developer interest in tribal sites. Sources of risk can include uncertainty about access to the site; lack of clarity on lease rates, taxes, or other expectations about tribal revenues; and legal avenues for dispute resolution. If a tribe elects to pursue policies encouraging renewable energy development, pre-emptive risk-reduction measures could contribute significantly to its success.
• Proximity to the 500-kV NGS transmission system could be a significant competitive advantage for the Navajo and Hopi tribes with respect to development of new renewable energy generation resources.

viii This report is available at no cost from the National Renewable Energy Laboratory (NREL) at www.nrel.gov/publications
(This page intentionally left blank.)

ix This report is available at no cost from the National Renewable Energy Laboratory (NREL) at www.nrel.gov/publications
Table of Contents 1 Introduction ........................................................................................................................................... 1
1.1 Economic Phenomena Not Limited to the Southwest ................................................................... 1 1.2 Alignment of NREL’s 2016 Study with Utility Analyses ............................................................. 2 1.3 Planning Implications .................................................................................................................... 4 1.4 Structure of This Report ................................................................................................................ 5
2 Update of Electricity Market Conditions in the Southwest .............................................................. 6 2.1 Trends in Regional Supply Mix .................................................................................................... 6 2.2 Wholesale Power Prices ................................................................................................................ 7
2.2.1 Methodology for Analyzing Price Trends ........................................................................ 9 2.2.2 Natural Gas Price Trends Observed in 2018 .................................................................. 10
2.3 Growing Use of Combined Cycle Natural Gas Plants ................................................................ 13 2.3.1 Historical Analysis of Baseload-Capable Generators .................................................... 13 2.3.2 The Baseload-Capable Supply Curve............................................................................. 14 2.3.3 Simulating the Baseload-Capable Supply Curve without NGS ..................................... 16 2.3.4 Summary ........................................................................................................................ 18
2.4 Load Growth, Efficiency, and System Reserve Margins ............................................................ 18 2.4.1 Load Growth and Energy Efficiency Trends ................................................................. 19 2.4.2 Peak-Hour Reserve Margins .......................................................................................... 20
2.5 System Modeling, Flexibility, and Storage ................................................................................. 24 2.6 Renewable Energy Trends........................................................................................................... 27
2.6.1 Solar ............................................................................................................................... 28 2.6.2 Wind ............................................................................................................................... 31
3 Implications for Tribal Energy Development ................................................................................... 33 3.1 New CCNG and CT Plants .......................................................................................................... 33 3.2 New Renewables ......................................................................................................................... 34
3.2.1 Prospects for Solar Development ................................................................................... 35 3.2.2 Prospects for Wind Development................................................................................... 36
3.3 Transmission ............................................................................................................................... 37 4 Summary ............................................................................................................................................. 39 Glossary ..................................................................................................................................................... 40 References ................................................................................................................................................. 41 Appendix: Parameters Used to Simulate a PV Project Near Moenkopi Switch Substation .............. 46
x This report is available at no cost from the National Renewable Energy Laboratory (NREL) at www.nrel.gov/publications
List of Figures Figure 1. Arizona net generation by source, with September 2018 share (rolling 12-month total) .............. 6 Figure 2. Updated Mead Hub wholesale day-ahead price trends (annual average) ...................................... 7 Figure 3. Daily wholesale prices for 2018 at Mead Hub .............................................................................. 8 Figure 4. Southwest natural gas pipeline system and key trading hubs ...................................................... 11 Figure 5. Natural gas daily spot price at key Southwest, national trading hubs ......................................... 11 Figure 6. Henry Hub forward price curves, first trading day in July .......................................................... 12 Figure 7. SoCal Border forward price curves, first trading day in July ...................................................... 12 Figure 8. Monthly capacity factors of Arizona CCNGs through September 2018 ..................................... 13 Figure 9. Arizona supply curve, 2018 (baseload-capable units only) ......................................................... 15 Figure 10. Annual supply curves for Arizona, 2015–2018 (baseload-capable units only) ......................... 17 Figure 11. Noncoincident summer peak demand in the Southwest ............................................................ 19 Figure 12. Annual retail electricity sales in Arizona................................................................................... 19 Figure 13. Arizona energy productivity and efficiency trends ................................................................... 20 Figure 14. SRSG anticipated resources and peak demand .......................................................................... 21 Figure 15. SRSG reserve margins through 2027, with sensitivity cases .................................................... 23 Figure 16. Capital expense projections for an 8-hour storage device (2016 dollars) .................................. 25 Figure 17. Range of projected LCOE for high capacity factor (27%) utility-scale solar, 2015–2030 ........ 29 Figure 18. Range of projected LCOE for high capacity factor (27%), utility-scale solar considering market
factors, 2016–2030 ................................................................................................................. 30 Figure 19. Range of projected LCOE for northern Arizona wind power, 2015–2030 ............................... 31 Figure 20. Range of projected LCOE for central New Mexico wind power, 2015–2030 .......................... 32 Figure 21. Western Renewable Energy Zone resource areas, with Navajo and Hopi Reservations ........... 35 Figure 22. NGS transmission system .......................................................................................................... 37 Figure 23. Location of Site Used for PV Project Simulation ...................................................................... 47
List of Tables Table 1. EIA Forecasted Price of Natural Gas at the Henry Hub (Average for 2025-2030) ........................ 4 Table 2. Average power prices for 2018 near Mead ..................................................................................... 8 Table 3. Baseload-Capable Plants in Arizona (Reported Generation and Estimated Cost for 2018) ......... 15 Table 4. Simulated Effect on Total Variable Cost of Replacing NGS with Existing CCNG Plants .......... 18 Table 5. Recent Examples of PPA Prices for Utility-Scale PV .................................................................. 30 Table 6. Western Renewable Energy Zone Screened Renewable Energy Potential ................................... 35 Table 7. Detailed Results of Utility-Scale PV Simulation .......................................................................... 47

1 This report is available at no cost from the National Renewable Energy Laboratory (NREL) at www.nrel.gov/publications
1 Introduction Salt River Project (SRP), Arizona Public Service Company (APS), NV Energy, and Tucson Electric Power (TEP) plan to terminate their ownership of the 2,250-MW Navajo Generating Station (NGS) by the end of 2019. The decision was driven largely by economic conditions in the regional power market (SRP 2017), and these circumstances have continued to evolve since the utilities announced their decision in early 2017. The purpose of this report is to provide an update of these market factors and to track how they have continued to change the Southwest electricity sector.
NGS, located on the Navajo Reservation in northern Arizona, is the largest coal-fired power plant in the western United States. The U.S. Bureau of Reclamation (USBR), on behalf of the U.S. Department of the Interior, manages a 24.3% federal entitlement to NGS for the purpose of providing power to the Central Arizona Project (CAP). The U.S. Department of Energy’s (DOE’s) National Renewable Energy Laboratory (NREL) has been under contract with USBR since 2011 to provide technical analysis related to NGS and conditions in the Southwest regional power market (Hurlbut et al. 2012a, 2012b, and 2016). NREL’s November 2016 study (Hurlbut et al. 2016), which examined baseline conditions in the Southwest affecting future NGS operations, was coordinated with USBR’s environmental impact study of continued operation of NGS after 2019 (USBR 2016).1
Although circumstances affecting future operations of NGS have been in a state of change over the past two years, two USBR public interest objectives have remained constant: securing cost-effective and reliable sources of power for CAP and future water development projects in the region, and continuing the agency’s working relationship with Arizona Indian tribes on issues related to water development. This update to NREL’s 2016 baseline study is intended to provide a knowledge base to inform both objectives.
Especially in the arid West, the nexus between water development and electricity is often significant and complex. This is why NREL’s technical support to USBR presumes that NGS is best examined in the context of the regional electricity sector in its entirety. We provide no recommendation. Rather, NREL’s approach has been to provide USBR with objective, descriptive analysis of complex market trends in the Southwest.
1.1 Economic Phenomena Not Limited to the Southwest The market forces that are challenging coal-based power generation are by no means limited to NGS and Arizona. National data indicate that coal retirements in 2018 exceeded 15 GW, second only to 2015 when coal retirements reached 16.6 GW (EIA 2018c).2 One sign of the economic nature of this nationwide transition is that more than three-fourths of the 2018 retirements are located in organized wholesale power markets such as the Electric Reliability Council of Texas (ERCOT), where the use of day-ahead and real-time economic dispatch has resulted in less
1 The plant’s site lease with the Navajo Nation will expire in 2019. Executing a replacement lease required U.S. Department of the Interior, in this case through USBR, to conduct an environmental review under the National Environmental Policy Act. (EIS 2016). 2 Figures are for nameplate capacity.

2 This report is available at no cost from the National Renewable Energy Laboratory (NREL) at www.nrel.gov/publications
generation from coal and more generation from combined cycle natural gas (CCNG) plants as the price of natural gas has declined.
Regulatory filings by Vistra Energy, one of the largest independent power producers in the United States, highlight both the nationwide changes in the market and the business responses to those changes. Vistra decided to retire three large coal plants in ERCOT in 2018 while it acquired a CCNG plant and a solar plant. The company determined that the three coal plants were no longer economically viable, calculating that the impaired value of these assets and one other coal plant was $2.5 billion (Vistra 2018, 87).3 The company said that
[b]ecause our baseload generating units and a substantial portion of our load following generating units are nuclear-, lignite- and coal-fueled, our results of operations and operating cash flows have been negatively impacted by the effect of low natural gas prices on wholesale electricity prices without a significant decrease in our operating cost inputs. Various industry experts expect this supply/demand imbalance to persist for a number of years, thereby depressing natural gas prices for a long-term period. As a result, the financial results from, and the value of, our generation assets could remain depressed or could materially decrease in the future unless natural gas prices rebound materially (Vistra 2018).
Coal is not the only thermal technology feeling economic pressure from low natural gas prices. In some parts of the country, wholesale power prices have fallen below the operating cost of nuclear generators for several hours during the year. In 2018, for example, California’s Diablo Canyon plant had an estimated operating cost of $29.29, while hourly day-ahead prices were less than that nearly 35% of the time (S&P Global 2018).4
The national trends affecting private-sector companies like Vistra also affect the Southwest, with direct ramifications for NGS and CAP operations. They also affect USBR’s engagement with Arizona Indian tribes, especially with respect to future water development planning. This report is designed to provide USBR with current knowledge about power market trends that can materially affect its program planning.
1.2 Alignment of NREL’s 2016 Study with Utility Analyses The market phenomena quantified by NREL in its 2016 baseline study aligned independently with reasons cited by the NGS owners for divesting. The owners said they were responding to “rapidly changing economics of the energy industry, which has seen natural gas prices sink to record lows and become a viable long-term and economical alternative to coal power” (SRP 2017).
3 In accounting, impairment means “the carrying amount of a long-lived asset … is not recoverable and exceeds its fair value. The carrying amount of a long-lived asset … is not recoverable if it exceeds the sum of the undiscounted cash flows expected to result from the use and eventual disposition of the asset” (FASB 2018). Under generally accepted accounting principles, the company would reduce the impaired asset’s value on its balance sheet and record the impairment as a loss against revenues. In this case, Vistra conducted a net present value analysis of future revenues (based on forecasted natural gas prices and wholesale power prices), the plants’ operating costs, and the cost of carrying the assets on Vistra’s books. The impairment analysis resulted in a reduction of the plants’ asset value and a one-time charge to net earnings (Vistra 2018). 4 Based on day-ahead hourly LMPs for CAISO’s NP-15 zone.

3 This report is available at no cost from the National Renewable Energy Laboratory (NREL) at www.nrel.gov/publications
One difference between NREL’s study and analyses done at the same time by NGS owners was NREL’s decision to rely solely on publicly available data. As a national laboratory, NREL places a priority on producing analytical results that are independently replicable by other parties. Our 2016 report, therefore, aimed to provide transparency with respect to both the data and the methodologies applied to the analyses. Utilities, as enterprises with particular business responsibilities to customers, regulators, and shareholders, must often base their forward-looking analyses on proprietary information specific to their operations. This includes business-sensitive knowledge of NGS operations. Therefore, our 2016 baseline study and research done by the owners constitute different and independent analytical approaches to the same set of questions.
Among other things, NREL’s 2016 study measured the historical correlation between natural gas prices and wholesale power prices, the cost of operating NGS relative to wholesale market prices, and forward trends in wholesale power prices implied by the U.S. Energy Information Administration (EIA) in its forecast for natural gas prices. Our previous study found that
Electricity produced at NGS is currently more expensive than electricity purchased on the wholesale spot market. Price trends … suggest a turnaround might be years away, especially if natural gas prices remain low.
Natural gas prices have indeed remained low in the two years since that analysis was completed, as Section 2.2.2 discusses in detail. In addition, EIA’s updates to its Annual Energy Outlook (AEO) now forecast natural gas prices out to 2030 to be lower than what the agency expected in 2016.
Contrasting two AEO scenarios might explain the agency’s lower price forecasts. The AEO has a reference scenario, which incorporates the agency’s standard assumptions about technological change and its effect on supply, demand, and prices. It also includes several sensitivities, one being a “high oil and gas resource and technology” scenario. This sensitivity assumes greater oil and natural gas supply due to greater use of enhanced drilling techniques and other practices.
Table 1 compares the current (2019) AEO natural gas price forecast for 2025–2030 with what AEO2016 and AEO2018 forecasted for that same period. Over time, the AEO’s basic outlook represented by its reference scenario has moved closer to its high oil and natural gas production scenario. This suggests that higher natural gas production might now be the norm, which would be consistent with observed data. EIA reports that U.S. domestic natural gas production increased by an average of 5% per year since 2013, with an 11% increase from 2017 to 2018 (EIA 2018b).

4 This report is available at no cost from the National Renewable Energy Laboratory (NREL) at www.nrel.gov/publications
Table 1. EIA Forecasted Price of Natural Gas at the Henry Hub (Average for 2025-2030)
EIA 2018a (including 2016, 2018, and 2019 editions). All reported price data are adjusted for inflation to 2018 dollars.
Increasing supply relative to demand is a major cause of low natural gas prices. The sector’s use of enhanced recovery techniques, which have increased the production of natural gas throughout the United States, will likely affect whether abundant supplies persist into the future. On the demand side, increased exports of liquid natural gas could also add upward pressure on prices.5
1.3 Planning Implications The likelihood of obtaining low-cost purchased power on the spot market over a 5- or 10-year horizon is not the only implication of low natural gas prices, nor is it necessarily the most important. Low prices on the spot market usually enable natural gas buyers to lock in similarly low prices for future deliveries. Forward contract prices are binding, and thus can guarantee low-cost electricity production in the future from a CCNG plant controlled by the buyer. The plant’s cost of operation is assured even in the event of unforeseen spikes in the price of natural gas or wholesale power, keeping costs relatively stable against expected revenues.
Today’s trends in wholesale power prices can also inform capital decisions for new renewable generation and other technologies that have no fuel cost. Capital costs and other fixed costs make up nearly all of the total cost of a wind or solar plant, making them economically immune to spikes in the price of natural gas. Therefore, the cost stability of a renewable energy plant could provide a hedge against future natural gas price volatility. If the solar or wind plant’s annualized cost were to compare favorably with trends in wholesale power prices, supply diversification could be a cost-effective strategy for managing future wholesale price risk.
Consequently, the potential role of NGS in the Southwest’s future electricity market is not simply a matter of how spot power prices compare to NGS operational costs at any particular point in time. Current conditions and their trends shape today’s expectations about the future, which in turn shape risk management, fuel contracting, and capital investment. Utilities and large power purchasers who recognize the inherent uncertainty of future conditions often choose to manage risk by diversifying their supply portfolios.
The Central Arizona Water Conservation District (CAWCD), which operates the CAP, adopted a strategy in 2015 to diversify its energy supplies to avoid the risk of dependence on NGS (CAWCD 2017). Congress authorized NGS as a source of electricity for CAP, and for nearly all 5 The AEO includes LNG exports in its reference case, but it does not have a sensitivity for high growth in LNG export capability.

5 This report is available at no cost from the National Renewable Energy Laboratory (NREL) at www.nrel.gov/publications
of the time CAP has been in operation it has received around 92% of its power from NGS (Hurlbut 2012a). In 2018 CAWCD approved two new power procurements: a 20-year contract with a 30-MW solar plant and a 5-year contract with SRP for 35 MW of fleet capacity (CAWCD 2018b).
1.4 Structure of This Report This update applies new data to the methodology used in our 2016 study. We also include new analyses to address emergent questions that were not examined closely in the previous study.
Section 2 describes market conditions that are likely to affect the economic competitiveness of NGS, CAP power procurement, and the success of future energy development projects by Indian tribes in Arizona that are affected by NGS. It examines the evolving role of CCNG and its effect on costs and resource adequacy. The section ends with an update on trends in renewable energy technology costs and a discussion of the emerging role of storage.
Both the Navajo Nation and the Hopi Tribe are investigating opportunities for renewable energy development on their lands, with NREL and USBR providing technical assistance. Section 3 discusses how the regional market factors described in Section 2 might affect energy development projects by and for the benefit of the Navajo Nation, the Hopi Tribe, and other Arizona tribes who stand to be significantly affected by the retirement of NGS.

6 This report is available at no cost from the National Renewable Energy Laboratory (NREL) at www.nrel.gov/publications
2 Update of Electricity Market Conditions in the Southwest
2.1 Trends in Regional Supply Mix Arizona’s historical decline in generation from coal slowed in 2017 and early 2018 but did not reverse (EIA 2018b). Coal generation fell 2% in 2018 compared to 2017. Increased natural gas generation met most of the state’s demand growth in 2018.
Electricity from non-hydro renewables—mostly utility-scale solar—was up 8% in 2018. This aligns with Arizona’s expected increase in utility-scale solar generating capacity for 2018, based on data reported to EIA (EIA 2018c).
Figure 1 shows how Arizona’s fuel sources for electricity generation have changed since 2010. In 2017 a large part of Arizona’s fuel mix was about evenly distributed among coal, natural gas, and nuclear. By the end of 2018, with continued growth in natural gas and continued decline in coal, natural gas had become the largest source of generation. Palo Verde Nuclear Generating station has been a stable source of power, varying little from the 31 terawatt-hours (TWh) it generated in 2018.
Figure 1. Arizona net generation by source, with December 2018 share (rolling 12-month total)
Excludes distributed generation. EIA, 2018b

7 This report is available at no cost from the National Renewable Energy Laboratory (NREL) at www.nrel.gov/publications
2.2 Wholesale Power Prices Actual wholesale power prices at the Mead Hub for next-day delivery were lower in 2016 and 2017 than trends in NREL’s 2016 baseline study suggested. The average price for all of 2017 was $23.42 per megawatt-hour (MWh). This compares to an expected range of $29.49 to $33.40 per MWh for 2017 based on trends examined in the 2016 baseline study (S&P 2018, Hurlbut 2018a).
New data suggest the trajectory for day-ahead prices at the Mead Hub could be lower than the plausible range of future prices reported in the 2016 baseline study, with a greater likelihood of remaining below current NGS operating costs at least through 2030. Figure 2 juxtaposes the trends calculated in 2016 against a recalculation of those trends using 2018 inputs and the same methodology.
Figure 2. Updated Mead Hub wholesale day-ahead price trends (annual average)
NGS all-in operating cost of $42/MWh is the average of actual cost for 2015 and 2016, projected costs for 2017, and budgeted costs for 2018 reported by CAWCD in its biennial budget for 2018 and 2019 (CAWCD 2018). See page 9
for a discussion of differences between this number and the cost estimates used on the 2016 baseline report.
Low natural gas prices are the main reason for lower forecasted wholesale power prices. NREL’s original analysis used natural gas price forecasts from AEO2016. Market experience since 2016 has shown those forecasts to be high. For example, the 2016 forecast for 2018 prices was between $3.20 and $3.83 per mmBtu,6 but actual prices for 2018 averaged around $3.16 per mmBtu.
Comparing actual Mead Hub prices for 2018 against price trends calculated in 2016 is complicated by the fact that bilateral spot prices for off-peak hours—weekends, holidays, and weekdays from 10 p.m. to 6 a.m.—are no longer tracked by S&P Global Market Intelligence, our
6 Henry Hub prices, in current dollars; the range is based on the AEO reference case (upper bound value) and the high oil and gas technology case (lower bound value).

8 This report is available at no cost from the National Renewable Energy Laboratory (NREL) at www.nrel.gov/publications
source for market pricing data in the 2016 baseline study. To adjust for the absence of this data, we compared the average of day-ahead spot prices for all hours from 2015 through 2017 with the average of prices for peak hours during that same period. The average for round-the-clock prices was 14% less than the average for peak hours.
Figure 3 tracks bilateral peak-period prices at the Mead Hub for 2018. If the historical relationship holds—a year-round average that is 14% below the average for peak periods—the $41 per MWh average for peak hours at the Mead Hub would be equivalent to $35 for all hours of the year. This would be near the upper bound of the plausible range of prices shown in Figure 2 for 2018.
Figure 3. Daily wholesale prices for 2018 at Mead Hub (peak hour delivery only) S&P 2018. Peak operating hours exclude weekends, holidays, and hours from 10 p.m. to 6 a.m.
Table 2. Average power prices for 2018 near Mead
Year July 15–Aug. 15 Year excluding July 15–Aug. 15
Mead Hub bilateral day-ahead spot market (peak hours) $42 $125 $33
CAISO day-ahead LMPs (all hours) $50 $120 $44
S&P 2018
Annual averages include high prices occurring during the summer when demand in the Southwest is high. The period from July 15 through August 15 in 2018 experienced unusually high prices due to high temperatures and high electricity demand in California, along with reduced electricity from hydropower and natural gas storage issues related to SoCalGas’ Aliso
9 This report is available at no cost from the National Renewable Energy Laboratory (NREL) at www.nrel.gov/publications
Canyon field (EIA 2018f). Table 2 provides a detailed breakdown of average prices for 2018 showing the influence of this high-price period.
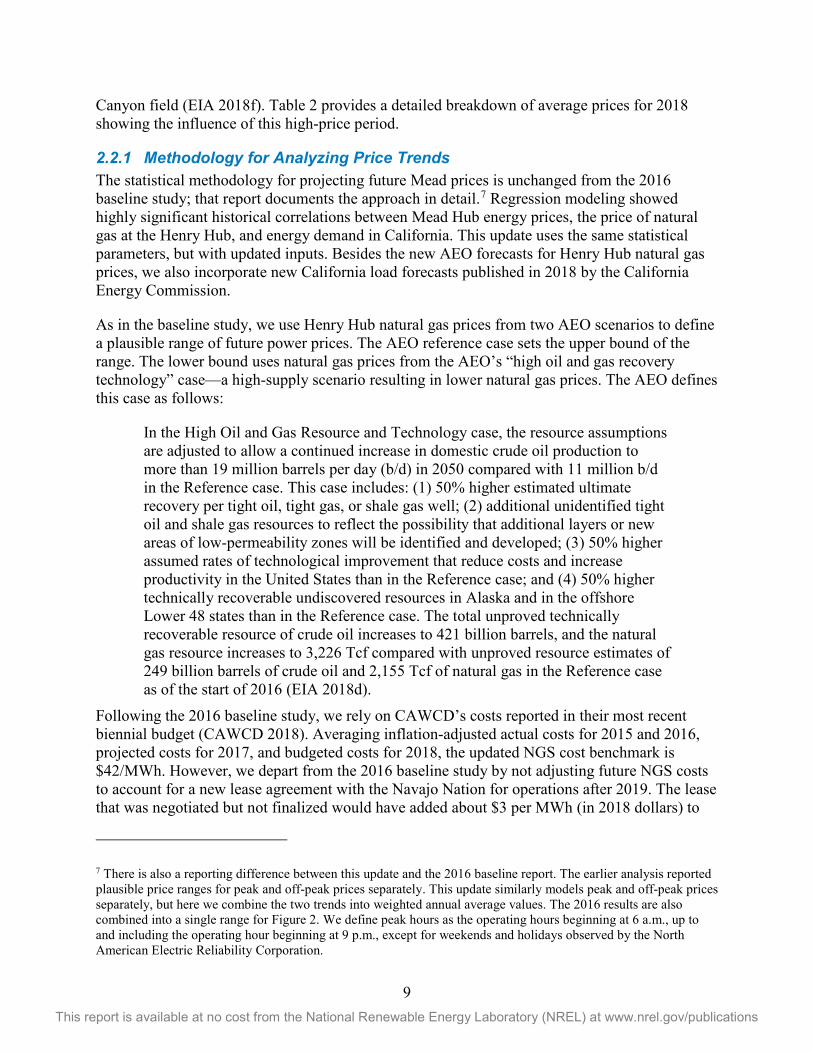
2.2.1 Methodology for Analyzing Price Trends The statistical methodology for projecting future Mead prices is unchanged from the 2016 baseline study; that report documents the approach in detail.7 Regression modeling showed highly significant historical correlations between Mead Hub energy prices, the price of natural gas at the Henry Hub, and energy demand in California. This update uses the same statistical parameters, but with updated inputs. Besides the new AEO forecasts for Henry Hub natural gas prices, we also incorporate new California load forecasts published in 2018 by the California Energy Commission.
As in the baseline study, we use Henry Hub natural gas prices from two AEO scenarios to define a plausible range of future power prices. The AEO reference case sets the upper bound of the range. The lower bound uses natural gas prices from the AEO’s “high oil and gas recovery technology” case—a high-supply scenario resulting in lower natural gas prices. The AEO defines this case as follows:
In the High Oil and Gas Resource and Technology case, the resource assumptions are adjusted to allow a continued increase in domestic crude oil production to more than 19 million barrels per day (b/d) in 2050 compared with 11 million b/d in the Reference case. This case includes: (1) 50% higher estimated ultimate recovery per tight oil, tight gas, or shale gas well; (2) additional unidentified tight oil and shale gas resources to reflect the possibility that additional layers or new areas of low-permeability zones will be identified and developed; (3) 50% higher assumed rates of technological improvement that reduce costs and increase productivity in the United States than in the Reference case; and (4) 50% higher technically recoverable undiscovered resources in Alaska and in the offshore Lower 48 states than in the Reference case. The total unproved technically recoverable resource of crude oil increases to 421 billion barrels, and the natural gas resource increases to 3,226 Tcf compared with unproved resource estimates of 249 billion barrels of crude oil and 2,155 Tcf of natural gas in the Reference case as of the start of 2016 (EIA 2018d).
Following the 2016 baseline study, we rely on CAWCD’s costs reported in their most recent biennial budget (CAWCD 2018). Averaging inflation-adjusted actual costs for 2015 and 2016, projected costs for 2017, and budgeted costs for 2018, the updated NGS cost benchmark is $42/MWh. However, we depart from the 2016 baseline study by not adjusting future NGS costs to account for a new lease agreement with the Navajo Nation for operations after 2019. The lease that was negotiated but not finalized would have added about $3 per MWh (in 2018 dollars) to
7 There is also a reporting difference between this update and the 2016 baseline report. The earlier analysis reported plausible price ranges for peak and off-peak prices separately. This update similarly models peak and off-peak prices separately, but here we combine the two trends into weighted annual average values. The 2016 results are also combined into a single range for Figure 2. We define peak hours as the operating hours beginning at 6 a.m., up to and including the operating hour beginning at 9 p.m., except for weekends and holidays observed by the North American Electric Reliability Corporation.

10 This report is available at no cost from the National Renewable Energy Laboratory (NREL) at www.nrel.gov/publications
operating costs, bringing post-2019 operating costs to more than $45 per MWh. With the lack of information about likely lease terms between the Navajo Nation and a prospective new plant owner, we carry current operating costs forward as the benchmark.
The difference between NGS operating costs and the projections reported here would amount to an average operating loss of between $1 per MWh (if prices are near the upper bound of the plausible range) and $7 per MWh (if prices are near the lower bound of the plausible range) from 2019 through 2025. Assuming a 70% capacity factor, this would amount to a loss of $4 million to $30 million per year per unit, or $12 million to $90 million per year for all three units.
2.2.2 Natural Gas Price Trends Observed in 2018 Fuel supplies for CCNG plants typically combine long-term contract purchases with purchases on the day-ahead market. When spot prices for natural gas are trending low, forward prices tend to follow. This can provide utilities with an opportunity to lock in some of their fuel supply at a low price for delivery at a later date when spot prices might not be so low.
This section tracks current price trends for both spot natural gas and forward contracts. It focuses on two natural gas trading hubs: the Henry Hub in Louisiana and the SoCal Border hub near the Arizona-California border. The Henry Hub is an industry standard benchmark for natural gas pricing, with a high volume of trading and major pipeline connections to most of the country’s largest demand centers. The SoCal Border hub is closer to Arizona but trades less volume than the Henry Hub and thus tends to see more day-to-day volatility.
As discussed in its 2016 report, NREL uses two sets of AEO natural gas price forecasts to establish a plausible range of future prices for wholesale power at the Mead Hub. Prices in 2018 were largely within the plausible range, consistent with the accelerated production scenario that assumes greater use of enhanced oil and gas recovery techniques.
Figure 4 shows the natural gas pipeline system serving the Southwest, along with two of the region’s largest natural gas trading hubs. Figure 5 shows historical natural gas prices at the SoCal Border, Permian Basin, and Henry hubs. Henry Hub prices, which are indicative of national trends apart from regional supply disturbances, averaged around $3.16 per mmBtu for 2018, with seasonal spikes in early January and at the end of the year. Supply, demand, and storage conditions suggest that prices could return to $3 per mmBtu early in 2019 (EIA 2018e), and averaged below $3 per mmBtu for the first two months of the year. SoCal Border prices reflect storage and supply issues associated with Aliso Canyon, while Permian Basin prices reflect increased production and supply.
Henry Hub forward contracts for the rest of 2018 are stable, indicating no market expectation of systematically higher natural gas prices. For the first week in July 2018, Henry Hub futures for December 2018 delivery were $3.058 per mmBtu. SoCal Border futures reveal expectations for tight winter supply, peaking at $3.44 per mmBtu for December 2018 delivery and then falling to $1.83 per mmBtu for May 2019 delivery.
Therefore, while SoCal Border prices averaged $6.92 per mmBtu on the spot market the first week in December 2018 (S&P 2018), a generator with a forward contract secured six months earlier might have paid half that price for some of the fuel it actually used that week.

11 This report is available at no cost from the National Renewable Energy Laboratory (NREL) at www.nrel.gov/publications
Henry Hub forward contracts reveal a growing market expectation that natural gas prices will remain stable. For trading at the beginning of July 2018 as well as at the beginning of July 2017, delivery prices for 2020 through 2025 tended to increase more slowly than the market expected in July 2016.
Figure 4. Southwest natural gas pipeline system and key trading hubs S&P 2018
Figure 5. Natural gas daily spot price at key Southwest, national trading hubs S&P 2018
$0
$3
$6
$9
$12
$15
S/m
mBt
u
Henry Hub (national)
SoCal Border (regional)
El Paso Permian (regional)

12 This report is available at no cost from the National Renewable Energy Laboratory (NREL) at www.nrel.gov/publications
Figure 6. Henry Hub forward price curves, first trading day in July S&P 2018
Figure 7. SoCal Border forward price curves, first trading day in July S&P 2018
13 This report is available at no cost from the National Renewable Energy Laboratory (NREL) at www.nrel.gov/publications
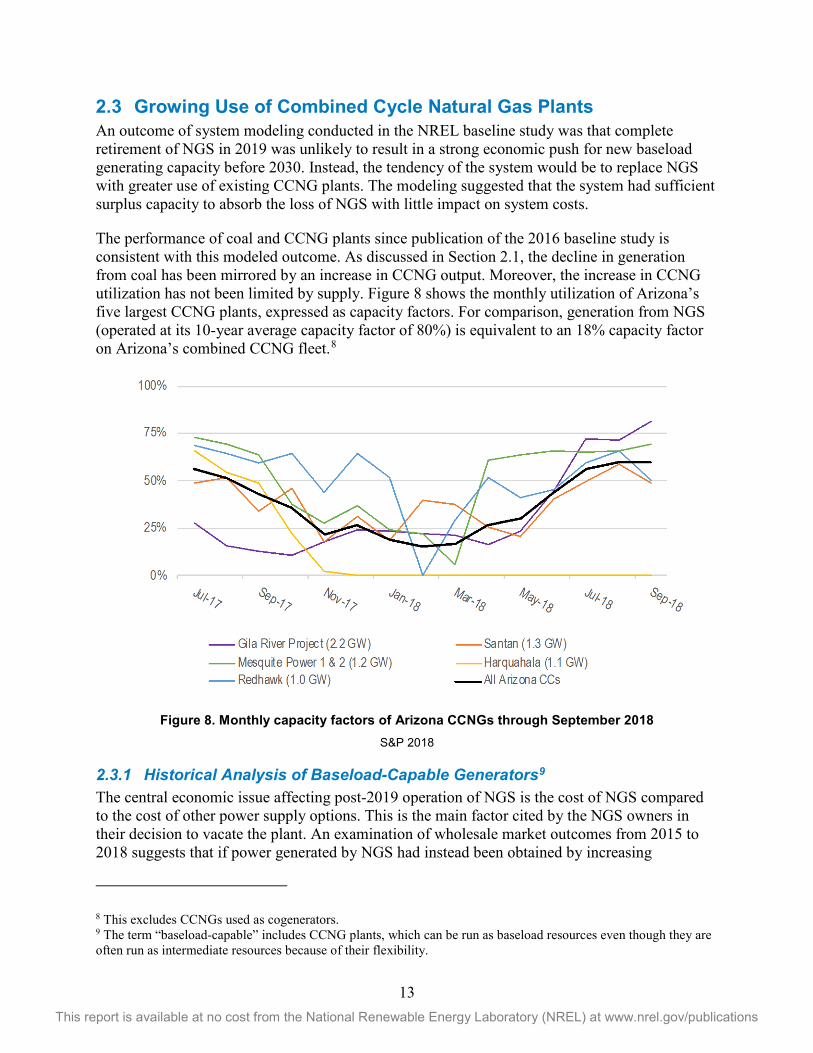
2.3 Growing Use of Combined Cycle Natural Gas Plants An outcome of system modeling conducted in the NREL baseline study was that complete retirement of NGS in 2019 was unlikely to result in a strong economic push for new baseload generating capacity before 2030. Instead, the tendency of the system would be to replace NGS with greater use of existing CCNG plants. The modeling suggested that the system had sufficient surplus capacity to absorb the loss of NGS with little impact on system costs.
The performance of coal and CCNG plants since publication of the 2016 baseline study is consistent with this modeled outcome. As discussed in Section 2.1, the decline in generation from coal has been mirrored by an increase in CCNG output. Moreover, the increase in CCNG utilization has not been limited by supply. Figure 8 shows the monthly utilization of Arizona’s five largest CCNG plants, expressed as capacity factors. For comparison, generation from NGS (operated at its 10-year average capacity factor of 80%) is equivalent to an 18% capacity factor on Arizona’s combined CCNG fleet.8
Figure 8. Monthly capacity factors of Arizona CCNGs through September 2018 S&P 2018
2.3.1 Historical Analysis of Baseload-Capable Generators9 The central economic issue affecting post-2019 operation of NGS is the cost of NGS compared to the cost of other power supply options. This is the main factor cited by the NGS owners in their decision to vacate the plant. An examination of wholesale market outcomes from 2015 to 2018 suggests that if power generated by NGS had instead been obtained by increasing
8 This excludes CCNGs used as cogenerators. 9 The term “baseload-capable” includes CCNG plants, which can be run as baseload resources even though they are often run as intermediate resources because of their flexibility.

14 This report is available at no cost from the National Renewable Energy Laboratory (NREL) at www.nrel.gov/publications
production at less expensive CCNG plants in Arizona, the statewide cost of generation might have been around $98 million less than it actually was.
NGS is a baseload power plant. Baseload-capable generators include coal-fired steam turbines such as NGS, nuclear-powered steam plants such as Palo Verde Nuclear Generating Station, CCNG plants, and natural gas steam turbines.10 If NGS closes in 2019, replacement power will most likely come from increasing the utilization of Arizona’s existing baseload-capable plants, at least in the short term. Palo Verde is already run close to full capacity; most unused capacity is available from CCNG plants.
The simulation described in this section considers only the variable operating costs of baseload-capable plants. This includes the cost of fuel plus all variable operating costs besides fuel. These costs increase or decrease along with net generation. Data for plant-specific variable operating costs come from S&P Global Market Intelligence, which compiles primary data from EIA (Form 924 and other monthly reports) and the Federal Energy Regulatory Commission (Form 1).
All fixed costs, which accrue regardless of how much electricity the plant produces, remain the same in this exercise. Therefore, this analysis tests the potential effect of idling NGS, not decommissioning it. The plant’s annual fixed production costs, which from 2015 to 2017 averaged $96 million per year, would still accrue.
Generation from all plants that are not baseload-capable is held unchanged.
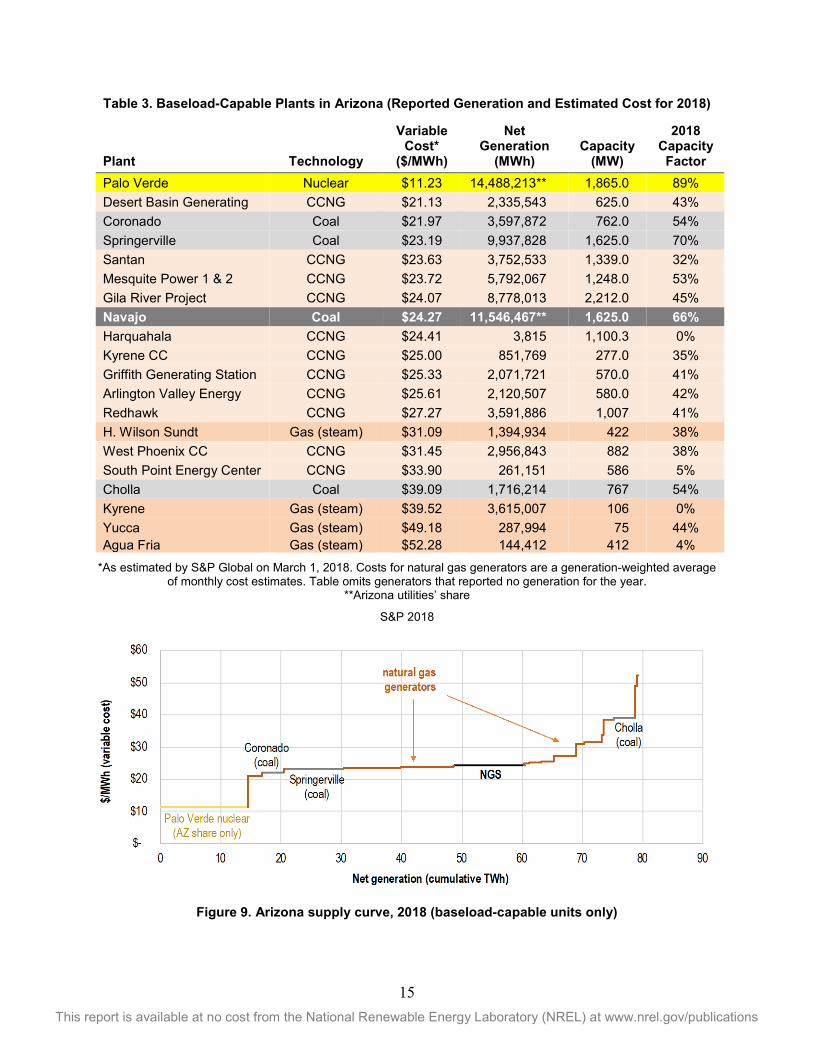
2.3.2 The Baseload-Capable Supply Curve Figure 9 shows the supply curve from baseload-capable plants in Arizona for the first three quarters of 2018—actual generation of each plant (TWh), ordered by each plant’s variable cost of production ($/MWh). Table 3 lists the individual plants in the curve, ordered by variable cost. The 50 TWh of net generation represented in Figure 9 plus about 12 TWh of exports from these plants to California and Nevada (not shown in the figure) account for 84% of the state’s total net generation for the period. Another 7% came from conventional hydropower, 6% from utility-scale renewables, with the remainder coming from natural gas peaker plants and other miscellaneous sources.
Generally, coal’s position in the supply curve is sensitive to the price of natural gas. Since 2015, when natural gas prices fell by about 40% from the previous year and remained relatively stable, NGS has often had a higher cost of generation than the largest CCNGs in Arizona. S&P Global estimates that the variable cost of NGS in 2018 is about $24 per MWh, taking into account current trends in fuel costs. Coronado, Springerville, Apache Station, and Cholla are Arizona’s other major coal plants.
10 Geothermal and biomass are also baseload-capable, but these plants are too small and not numerous enough in Arizona for inclusion in this analysis. Arizona’s largest biomass-fueled generator is 22 MW.
15 This report is available at no cost from the National Renewable Energy Laboratory (NREL) at www.nrel.gov/publications
Table 3. Baseload-Capable Plants in Arizona (Reported Generation and Estimated Cost for 2018)
Plant Technology
Variable Cost*
($/MWh)
Net Generation
(MWh) Capacity
(MW)
2018 Capacity Factor
Palo Verde Nuclear $11.23 14,488,213** 1,865.0 89% Desert Basin Generating CCNG $21.13 2,335,543 625.0 43% Coronado Coal $21.97 3,597,872 762.0 54% Springerville Coal $23.19 9,937,828 1,625.0 70% Santan CCNG $23.63 3,752,533 1,339.0 32% Mesquite Power 1 & 2 CCNG $23.72 5,792,067 1,248.0 53% Gila River Project CCNG $24.07 8,778,013 2,212.0 45% Navajo Coal $24.27 11,546,467** 1,625.0 66% Harquahala CCNG $24.41 3,815 1,100.3 0% Kyrene CC CCNG $25.00 851,769 277.0 35% Griffith Generating Station CCNG $25.33 2,071,721 570.0 41% Arlington Valley Energy CCNG $25.61 2,120,507 580.0 42% Redhawk CCNG $27.27 3,591,886 1,007 41% H. Wilson Sundt Gas (steam) $31.09 1,394,934 422 38% West Phoenix CC CCNG $31.45 2,956,843 882 38% South Point Energy Center CCNG $33.90 261,151 586 5% Cholla Coal $39.09 1,716,214 767 54% Kyrene Gas (steam) $39.52 3,615,007 106 0% Yucca Gas (steam) $49.18 287,994 75 44% Agua Fria Gas (steam) $52.28 144,412 412 4%
*As estimated by S&P Global on March 1, 2018. Costs for natural gas generators are a generation-weighted average of monthly cost estimates. Table omits generators that reported no generation for the year.
**Arizona utilities’ share
S&P 2018
Figure 9. Arizona supply curve, 2018 (baseload-capable units only)
16 This report is available at no cost from the National Renewable Energy Laboratory (NREL) at www.nrel.gov/publications
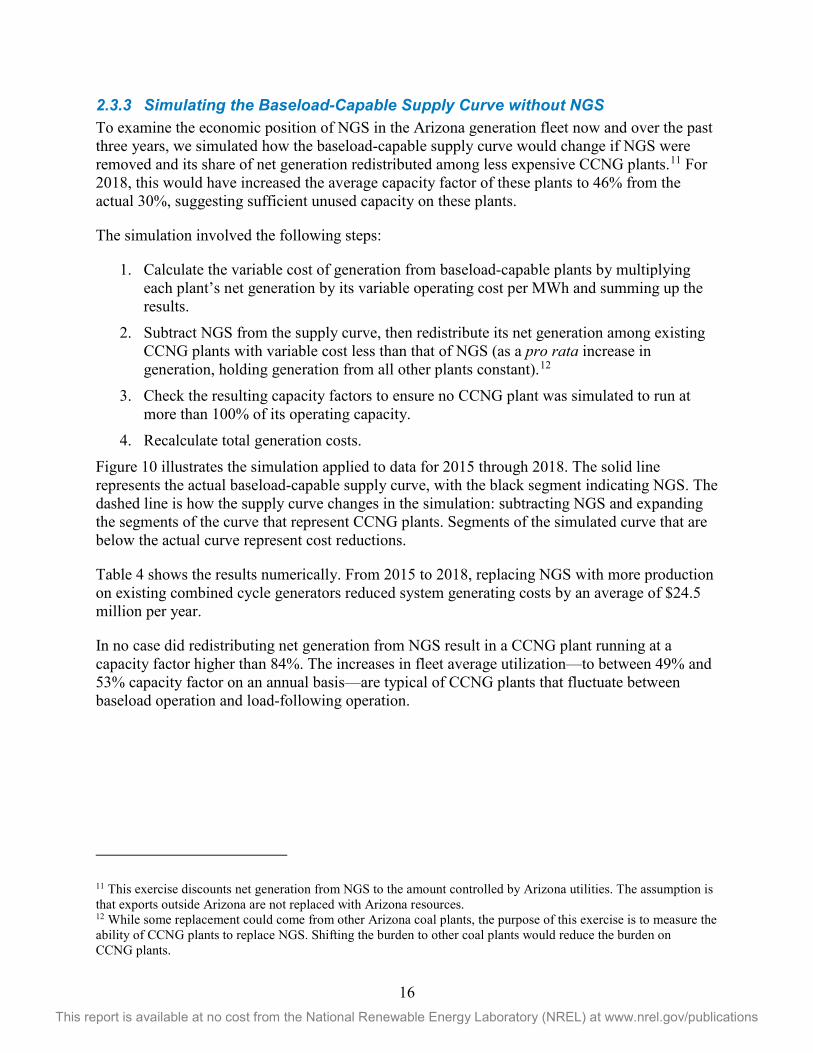
2.3.3 Simulating the Baseload-Capable Supply Curve without NGS To examine the economic position of NGS in the Arizona generation fleet now and over the past three years, we simulated how the baseload-capable supply curve would change if NGS were removed and its share of net generation redistributed among less expensive CCNG plants.11 For 2018, this would have increased the average capacity factor of these plants to 46% from the actual 30%, suggesting sufficient unused capacity on these plants.
The simulation involved the following steps:
1. Calculate the variable cost of generation from baseload-capable plants by multiplying each plant’s net generation by its variable operating cost per MWh and summing up the results.
2. Subtract NGS from the supply curve, then redistribute its net generation among existing CCNG plants with variable cost less than that of NGS (as a pro rata increase in generation, holding generation from all other plants constant).12
3. Check the resulting capacity factors to ensure no CCNG plant was simulated to run at more than 100% of its operating capacity.
4. Recalculate total generation costs. Figure 10 illustrates the simulation applied to data for 2015 through 2018. The solid line represents the actual baseload-capable supply curve, with the black segment indicating NGS. The dashed line is how the supply curve changes in the simulation: subtracting NGS and expanding the segments of the curve that represent CCNG plants. Segments of the simulated curve that are below the actual curve represent cost reductions.
Table 4 shows the results numerically. From 2015 to 2018, replacing NGS with more production on existing combined cycle generators reduced system generating costs by an average of $24.5 million per year.
In no case did redistributing net generation from NGS result in a CCNG plant running at a capacity factor higher than 84%. The increases in fleet average utilization—to between 49% and 53% capacity factor on an annual basis—are typical of CCNG plants that fluctuate between baseload operation and load-following operation.
11 This exercise discounts net generation from NGS to the amount controlled by Arizona utilities. The assumption is that exports outside Arizona are not replaced with Arizona resources. 12 While some replacement could come from other Arizona coal plants, the purpose of this exercise is to measure the ability of CCNG plants to replace NGS. Shifting the burden to other coal plants would reduce the burden on CCNG plants.

17 This report is available at no cost from the National Renewable Energy Laboratory (NREL) at www.nrel.gov/publications
2015
2016
2017
2018
Figure 10. Annual supply curves for Arizona, 2015–2018 (baseload-capable units only)

18 This report is available at no cost from the National Renewable Energy Laboratory (NREL) at www.nrel.gov/publications
Table 4. Simulated Effect on Total Variable Cost of Replacing NGS with Existing CCNG Plants
*Plants with variable cost less than that of NGS
2.3.4 Summary If the cost of generation were the primary criterion, NGS would most likely be replaced by increasing the use of existing CCNG plants in Arizona, not by building a new plant. This is what system modeling indicated in the 2016 baseline study, and actual market experience since that time has corroborated those results, at least in the near term.
Market experience has also provided a picture of the potential savings that might result from replacing NGS with greater CCNG use: around $24.5 million per year in variable operating costs if NGS were simply idled, and another $96 million per year in fixed operating costs if the plant were retired.
In 2017, CAWCD reached a similar conclusion with regard to the cost of power to operate the Central Arizona Project. CAWCD staff estimated a possible net savings of $26.5 million in 2016 had CAP replaced NGS power with less costly options available on the market.13
2.4 Load Growth, Efficiency, and System Reserve Margins One measure of the impact of retiring a large power plant is the extent to which the loss of capacity might affect the system reserve margin—the difference between peak demand and the resources available to meet that demand. The impact of retiring NGS on the Southwest’s reserve margin, however, is unclear. If regional load trends since the Great Recession continue, the Southwest will likely have enough capacity to keep the reserve margin healthy. On the other hand, accelerated load growth could push the reserve margin below the region’s reliability target.
Load has been growing slowly in the Southwest during the economic recovery following the Great Recession. Underlying trends suggest this might not be due to transient factors but could instead be driven by more persistent changes in how Arizona uses electricity. In particular, trends toward energy efficiency could have cascading implications for regional load growth, generation adequacy, the short-term reliability impacts of retiring NGS after 2019, and the opportunities for new energy development involving Navajo Nation, the Hopi Tribe, and other tribes affected by NGS.
13 The staff analysis used CAWCD’s total cost of NGS power, which included fixed costs and other costs not accounted for in the baseload-capable supply curve for variable costs.
19 This report is available at no cost from the National Renewable Energy Laboratory (NREL) at www.nrel.gov/publications
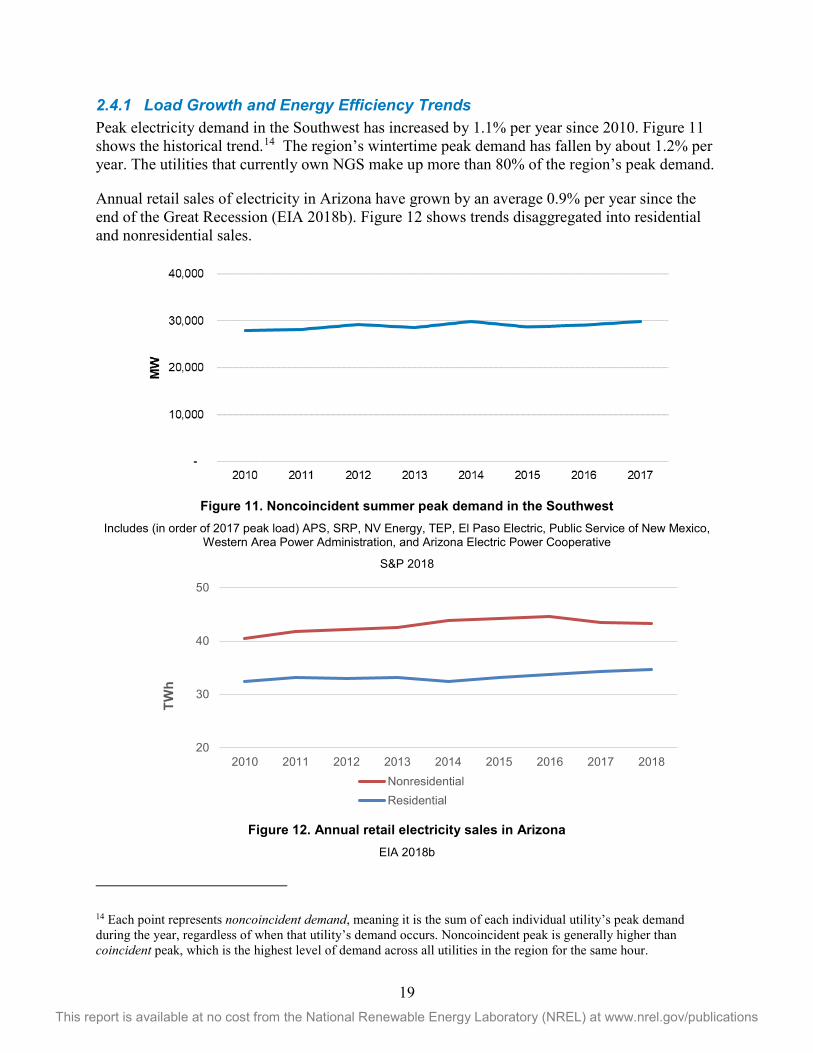
2.4.1 Load Growth and Energy Efficiency Trends Peak electricity demand in the Southwest has increased by 1.1% per year since 2010. Figure 11 shows the historical trend.14 The region’s wintertime peak demand has fallen by about 1.2% per year. The utilities that currently own NGS make up more than 80% of the region’s peak demand.
Annual retail sales of electricity in Arizona have grown by an average 0.9% per year since the end of the Great Recession (EIA 2018b). Figure 12 shows trends disaggregated into residential and nonresidential sales.
Figure 11. Noncoincident summer peak demand in the Southwest
Includes (in order of 2017 peak load) APS, SRP, NV Energy, TEP, El Paso Electric, Public Service of New Mexico, Western Area Power Administration, and Arizona Electric Power Cooperative
S&P 2018
Figure 12. Annual retail electricity sales in Arizona
EIA 2018b
14 Each point represents noncoincident demand, meaning it is the sum of each individual utility’s peak demand during the year, regardless of when that utility’s demand occurs. Noncoincident peak is generally higher than coincident peak, which is the highest level of demand across all utilities in the region for the same hour.
20
30
40
50
2010 2011 2012 2013 2014 2015 2016 2017 2018
TWh
NonresidentialResidential
20 This report is available at no cost from the National Renewable Energy Laboratory (NREL) at www.nrel.gov/publications
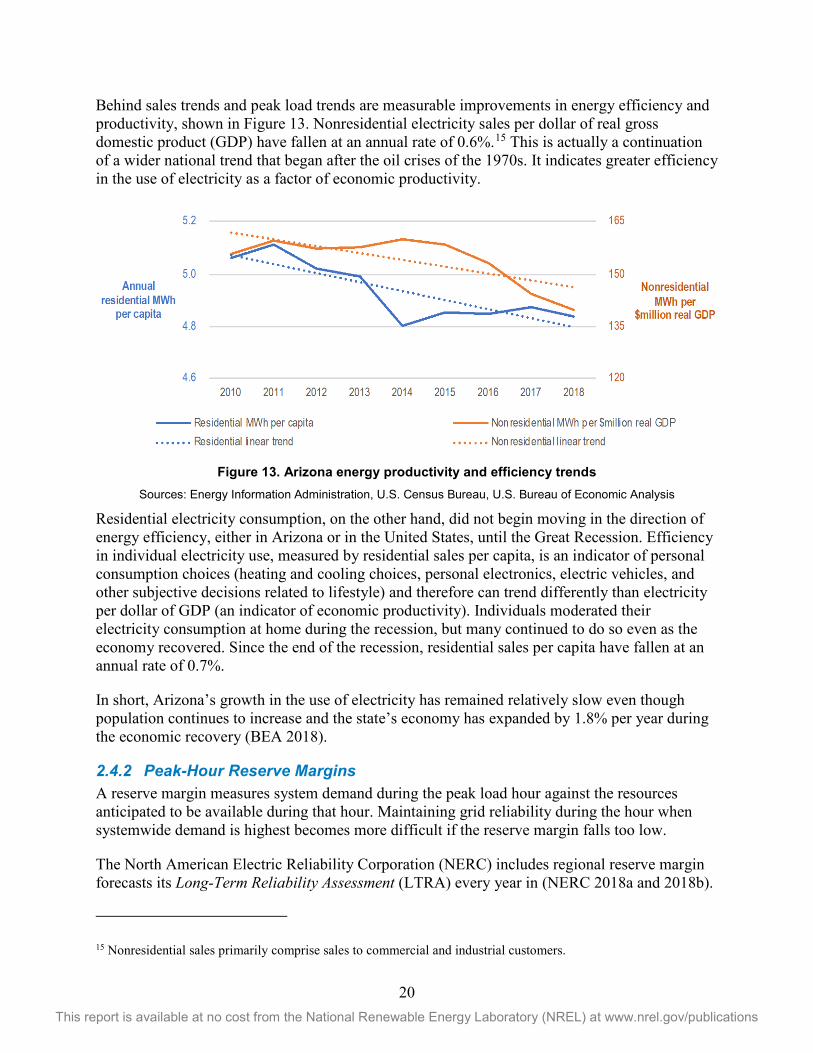
Behind sales trends and peak load trends are measurable improvements in energy efficiency and productivity, shown in Figure 13. Nonresidential electricity sales per dollar of real gross domestic product (GDP) have fallen at an annual rate of 0.6%.15 This is actually a continuation of a wider national trend that began after the oil crises of the 1970s. It indicates greater efficiency in the use of electricity as a factor of economic productivity.
Figure 13. Arizona energy productivity and efficiency trends
Sources: Energy Information Administration, U.S. Census Bureau, U.S. Bureau of Economic Analysis
Residential electricity consumption, on the other hand, did not begin moving in the direction of energy efficiency, either in Arizona or in the United States, until the Great Recession. Efficiency in individual electricity use, measured by residential sales per capita, is an indicator of personal consumption choices (heating and cooling choices, personal electronics, electric vehicles, and other subjective decisions related to lifestyle) and therefore can trend differently than electricity per dollar of GDP (an indicator of economic productivity). Individuals moderated their electricity consumption at home during the recession, but many continued to do so even as the economy recovered. Since the end of the recession, residential sales per capita have fallen at an annual rate of 0.7%.
In short, Arizona’s growth in the use of electricity has remained relatively slow even though population continues to increase and the state’s economy has expanded by 1.8% per year during the economic recovery (BEA 2018).
2.4.2 Peak-Hour Reserve Margins A reserve margin measures system demand during the peak load hour against the resources anticipated to be available during that hour. Maintaining grid reliability during the hour when systemwide demand is highest becomes more difficult if the reserve margin falls too low.
The North American Electric Reliability Corporation (NERC) includes regional reserve margin forecasts its Long-Term Reliability Assessment (LTRA) every year in (NERC 2018a and 2018b).
15 Nonresidential sales primarily comprise sales to commercial and industrial customers.

21 This report is available at no cost from the National Renewable Energy Laboratory (NREL) at www.nrel.gov/publications
The Southwest Reserve Sharing Group (SRSG) is a NERC subregion that includes all of Arizona, Las Vegas, and the surrounding areas of southern Nevada, western New Mexico, and the area around El Paso, Texas. Arizona accounts for more than 60% of SRSG peak demand and retail sales.
Figure 14. SRSG anticipated resources and peak demand
Source: NERC 2018a
Figure 14 shows the main components of the SRSG reserve margin NERC forecasted through 2027. NERC did not count retirement of NGS against the region’s anticipated resources after 2019 because the retirement had not been finalized at the time the report for 2017 was published. It nevertheless counted possible NGS retirement against prospective resources, shown by the dashed line in Figure 14.16 (See the Glossary for NERC’s definition of anticipated and prospective resources.)
One purpose of this update report is to contrast market conditions with and without NGS, which we do in this section by adjusting NERC’s baseline assumptions to highlight NGS more distinctly and to reflect plausible futures for load growth. These adjustments capture how sensitive the reserve margin is to conditions that could change over the next decade.
Load growth is one critical uncertainty. NERC anticipates that peak demand in the SRSG area will grow at an annual average of 2.2% through 2027. However, this growth rate is higher than the actual growth in peak load the region has seen since the recession, and higher than the 0.9% annual growth in retail electricity sales.
The Arizona Corporation Commission (ACC), which regulates investor-owned load-serving utilities in Arizona, emphasized the importance of load assumptions in 2018 when it rejected APS’ integrated resource plan. APS had forecasted that its peak load would grow by between 2.3% and 4.3% per year through 2032, which the ACC found was “faulty and/or unrealistic.”
16 Anticipated resources account for existing capacity, capacity under construction, firm retirements, and other factors. Prospective resources include all anticipated resources, including new capacity that has been proposed but is not through the approval process. (See the Glossary of this report for NERC’s more detailed definitions.) NERC calculates reserve margins from both anticipated resources and prospective resources.

22 This report is available at no cost from the National Renewable Energy Laboratory (NREL) at www.nrel.gov/publications
The ACC ordered APS to revise its plan and include planning scenarios with annual load growth less than 1% (ACC 2018).
In its LTRA for 2018, NERC reduced its expected annual load growth rate for the SRSG region to 1.8% from the 2.2% assumed in its 2017 LTRA. Along with the normal year-to-year uncertainty of load projections, however, is the future effect of major behavioral changes in electricity consumption such as the adoption of electric vehicles. While greater use of electric vehicles will increase electricity sales, its impact on peak load will depend on the evolution of effective demand response programs to encourage charging during off-peak hours. Both experience and analysis regarding the effect of electric vehicle adoption on peak load are limited, which makes reliable load adjustments problematic.
Instead, we applied a plausible range of peak demand growth. NERC’s 2017 LTRA forecast provided the upper bound: a 2.2% growth rate. For the lower bound, we proportionally reduced the 2017 LTRA’s year-to-year growth to achieve an annual growth rate of 0.9%, equal to the historical growth in electricity consumption since the end of the Great Recession.
In addition, we apply the retirement of NGS to anticipated resources and remove it from prospective resources.17 This makes the potential retirement of NGS more apparent in both reserve margin calculations.
Figure 15 shows four views of SRSG reserve margin trends. While retiring NGS causes the reserve margin to fall below the benchmark using NERC’s load forecast, the picture reverses when peak load growth is lower. The largest stress on the reserve margin occurs during the first year without NGS, but recovery after 2020 is highly dependent on growth in peak demand. Generally, the reserve margin trends below the NERC benchmark only if annual demand growth is greater than 1.5% (all other NERC assumptions held unchanged).18
17 We do this by adjusting NGS’ summer operating capacity of 2,250 MW by its equivalent forced outage rate (EFORd, which is measured based on the time of peak demand) of 7.05%, resulting in a reduction to 2,091 MW. For EFORd rates, see NERC 2016. We also assume NGS will be operating in 2019, and that the retirement would affect reserve margins for 2020 and later. See the Glossary for a detailed definition of EFORd. 18 Another change in the 2018 LTRA is that the benchmark declines over time, from 15.1% in 2019 to 13.8% in 2028. For ease of illustration and to make the analysis more conservative, the charts in Figure 15 use the 2017 benchmark as the measure of comparison.
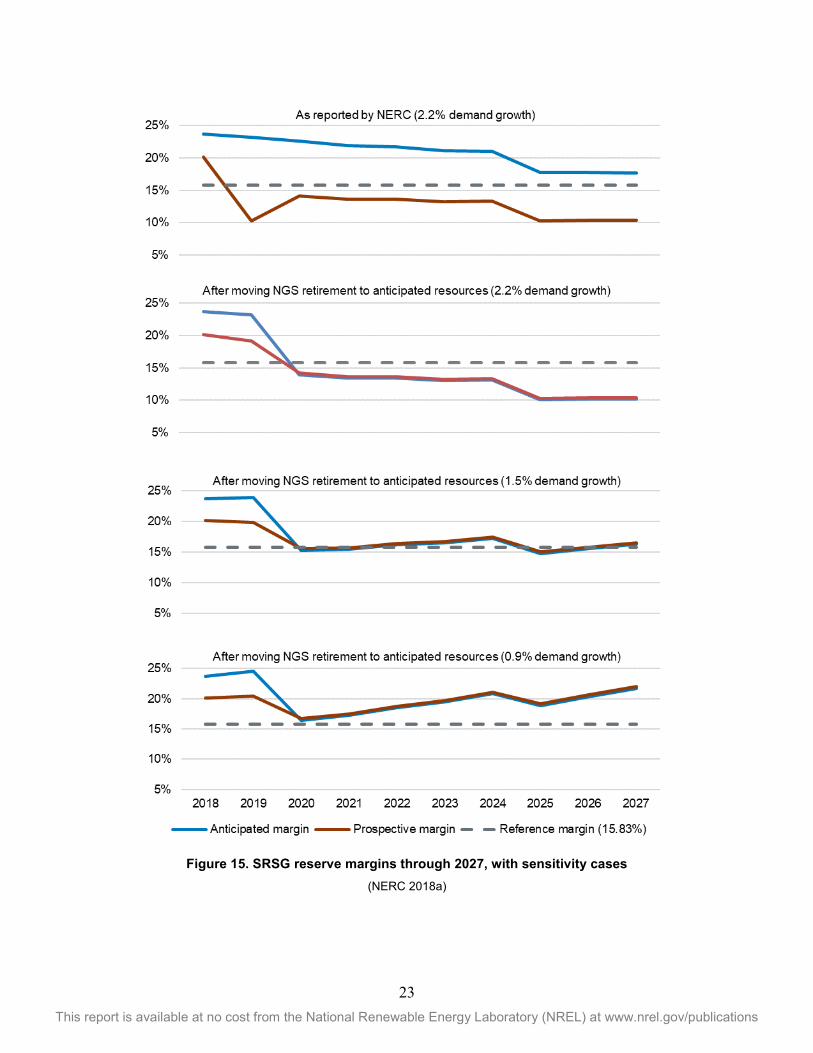
23 This report is available at no cost from the National Renewable Energy Laboratory (NREL) at www.nrel.gov/publications
Figure 15. SRSG reserve margins through 2027, with sensitivity cases
(NERC 2018a)

24 This report is available at no cost from the National Renewable Energy Laboratory (NREL) at www.nrel.gov/publications
One key observation is how much of the difference between the anticipated margin and the prospective margin is due to the treatment of NGS. At the time of its 2017 Long-Term Reliability Assessment, NERC did not count NGS as a firm retirement but did include it as a prospective retirement (NERC 2018a). Consequently, the prospective reserve margin was lower than the more stringently defined anticipated reserve margin, even though for other regions it is normally higher due to the inclusion of planned but not-yet-firm new generation.
Another observation—which becomes clear after moving NGS retirement to anticipated resources—is that NERC’s prospective resources reflect virtually no new capacity in the SRSG subregion beyond what is already under construction.19 One factor that could affect this assumption is future growth in utility-scale photovoltaic (PV) solar coupled with battery storage. NERC estimates the capacity contribution of wind and solar by measuring plant capacity factors during the hours of peak demand (NERC 2018a, 77). If peak demand occurs near sunset, the region’s utility-scale PV will contribute little to the reserve margin because the capacity factors for that hour will be small. NERC estimates that the region’s 4.4 GW of solar contributes 322 MW to peak season capacity.20
Operation with battery storage, however, could result in more output from PV during the peak hour. APS recently solicited bids for 106 MW of storage for PV plants on its system and announced plans for 500 MW of storage by 2033 (APS 2018). While this will likely increase anticipated reserves in the SRSG subregion, the lack of historical data on the storage-augmented PV makes the effect on peak-hour capacity factors—and consequently the reserve margin—difficult to quantify precisely. Whatever the effect might be, 120 MW of additional capacity (from any source) that would be available at summer peak would add about one percentage point to the SRSG reserve margin.21
2.5 System Modeling, Flexibility, and Storage One key finding of the system modeling done in the 2016 baseline study was the likely need for additional flexibility on the grid by 2030. Existing CCNG capacity appeared to be sufficient to eliminate the need for major new investments in new thermal capacity even without NGS. The modeling did, however, identify a potential need for a small amount—30 MW—of additional natural gas combustion turbines (CTs) by 2030.
At the time NREL conducted that modeling, fast-responding CTs were the most common source of system flexibility. The ability to deploy specific amounts of generation within minutes is an important part of integrating variable renewables and responding to large instantaneous deviations in demand. Since then, however, APS began upgrading its Ocotillo plant to provide 510 MW of CT flexibility; this was not among the existing or planned generators included in the
19 NERC’s 2018 LTRA, however, introduces an assumption that the region’s existing natural gas capacity will decline by more than 680 MW from 2019 to 2018. It also assumes no coal retirements and no growth in solar capacity (NERC 2018b). 20 This includes about 1 GW from concentrating solar power, which has storage built into its system. 21 This estimate is calculated from load and resource projections for 2020.

25 This report is available at no cost from the National Renewable Energy Laboratory (NREL) at www.nrel.gov/publications
modeling NREL conducted in 2016. In addition, two other sources of flexibility have grown in importance: battery storage and demand response (DR).22
In bulk energy system capacity expansion modeling, either battery storage or DR can substitute for CTs most of the time. CTs and CT alternatives have in fact increased well in excess of 30 MW in Arizona during the two years since publication of the 2016 baseline study. Battery storage, both paired with PV plants and located elsewhere on the grid, is becoming especially prevalent as solar energy generation gains market share in the Southwest.
One of the market drivers for combining PV with storage has been negative wholesale pricing in California during peak PV generation times. The high penetration of solar energy generation in California reduced the mid-day wholesale power prices, sometimes below zero. Consequently, the prices actually paid to solar generation within the CAISO energy market in 2017 were, on average, 79% of the average for all pricing periods throughout the year (Bolinger and Seel 2018). With four to ten hours of storage, PV generation at low-priced midday times can be stored and deployed closer to the evening system demand peak when prices are higher.
Costs for the lithium-ion batteries used in most grid-connected storage systems decreased by 60% between 2007 and 2014. Supply-chain modeling indicates the decline reached 73% in 2016 (Donohoo-Vallett et al. 2016). Going forward, recent studies suggest battery storage capital costs could be as low as $1 per watt by 2030 and could reach parity with CT costs shortly after that (see Figure 16). Several recent PV plus storage projects developed in Nevada suggest the all-in price adder for storage (based on four hours of storage at 25% of PV nameplate capacity) is approximately $5/MWh (Bolinger and Seel 2018).
Figure 16. Capital expense projections for an 8-hour storage device (2016 dollars)
Battery storage cost values from Cole et al. 2016, pp. 1–6, as represented in NREL’s 2018 Annual Technology Baseline. NREL 2018a.
22 The terms battery storage and storage used throughout this report specifically refer to electro-chemical battery energy storage systems and do not include other forms of energy storage such as compressed air or pumped hydro storage.

26 This report is available at no cost from the National Renewable Energy Laboratory (NREL) at www.nrel.gov/publications
Research by Denholm et al. (2017) finds that the benefit/cost ratio for utility-scale PV-plus-storage systems is greater than PV-only systems in 2020, when considering projected price reductions, higher penetrations of PV, and the investment tax credit (ITC) (Denholm et al. 2017).
Recently announced utility plans indicate a growing interest in storage. In Arizona, APS issued a request for proposals (RFP) for 106 MW of battery storage on June 29, 2018, to pair with APS-owned PV facilities to “harness mid-day solar and distribute it to customers at peak times of the day when customers need it most.”23 The utility plans to add 500 MW of storage in its 15-year forecast to integrate greater solar capacity.24
Bids for Xcel Energy’s 2017 all source solicitation for Colorado included an average solar-plus-storage cost of $36/MWh (Public Service Company of Colorado 2017). Xcel’s Colorado Energy Plan Portfolio approved by the Colorado Public Utilities Commission in September 2018 (Public Utilities Commission of the State of Colorado 2018a) includes 275 MW of storage (all embedded in solar-plus-storage projects) with combined solar generation and storage costs of $30–$32/MWh. Three of the five solar projects in Xcel’s portfolio—constituting 79% of the solar capacity—have associated battery storage (Public Utilities Commission of the State of Colorado 2018b).25
In June 2018, Pacific Gas and Electric (PG&E) proposed a purchase from four battery storage facilities to the California Public Utilities Commission (CPUC).26 PG&E Vice President Roy Kuga explained that
recent decreases in battery prices are enabling energy storage to become a competitive alternative to traditional solutions. As a result, we believe that battery energy storage will be even more significant in enhancing overall grid reliability, integrating renewables, and helping customers save energy and money.
Photovoltaic RFPs are increasingly requesting at least an option to pair storage with proposed PV facilities. A March 2018 Platte River Power Authority PV RFP stated: “The construction of complementary energy storage is not required but is preferable when evaluating potential projects” (Platte River Power Authority 2018).
These actions suggest a strong tendency for future utility-scale PV development to include storage either on-site or elsewhere on the grid. The DOE Global Energy Storage Database
23 “Request for Proposals: 2018 request for Proposals (RFP): Battery Storage,” APS, https://www.aps.com/en/ourcompany/doingbusinesswithus/rfp/Pages/home.aspx. 24 “APS Takes Big-Picture Look at Arizona's Energy Future in 15-Year Forecast,” APS, April 12, 2017 .https://www.aps.com/en/ourcompany/news/latestnews/pages/aps-takes-big-picture-look-at-arizona-energy-future-in-15-year-forecast.aspx. 25 Storage bids were modeled using four hours of storage at 40% capacity (Appendix K, Proceeding No. 16A-0396E, p. 3). 26 “PG&E Proposes Four New Cost-effective Energy Storage Projects to CPUC,” Pacific Gas and Electric Company, June 29, 2018, https://www.pge.com/en/about/newsroom/newsdetails/index.page?title=20180629_pge_proposes_four_new_cost-effective_energy_storage_projects_to_cpuc.

27 This report is available at no cost from the National Renewable Energy Laboratory (NREL) at www.nrel.gov/publications
indicates there are 455 MW of contracted electro-chemical battery storage projects currently in the U.S. pipeline.27
Much of the power system modeling done by NREL uses CTs as a source of flexibility, a service that battery storage can also provide. Results of the capacity expansion modeling conducted for NREL’s 2016 baseline study suggested a possible need for another 30 MW of CT capacity by 2030 if NGS were retired in 2020 (Hurlbut 2016). Therefore, to the extent that battery storage can substitute for CTs, some if not all of the flexible capacity that NREL’s 2016 modeling indicated might be needed by 2030 might already be available.
2.6 Renewable Energy Trends Renewable energy is following market trends that are largely independent of those affecting baseload-capable generators. As discussed in Section 2.3, other baseload-capable generators—not renewables—would most likely replace NGS if it were to retire. Renewable integrations issues would remain, except that the grid’s baseload portfolio would be weighted more towards CCNG. Similarly, demand drivers for renewable energy development are largely unrelated to NGS.
Historical trends suggest that solar and wind might currently be in the midst of a development surge, with the window of economic opportunity growing smaller shortly after 2019 because of scheduled reductions in federal incentives. Ever since the 2000s, the pace of wind development accelerated in years when the production tax credit (PTC) was scheduled to end. Project timelines were accelerated to ensure PTC eligibility, which consequently reduced the number of projects in the pipeline later when Congress extended the incentive.28 Solar development followed a similar trend in 2016 when continuation of the ITC was in doubt. As of this writing, the PTC is scheduled to expire in 2019 and the ITC will begin a three-year phased reduction in 2020.
The wind and solar industries will likely face new economic conditions after 2019, but not solely because of reduced federal incentives. State renewable portfolio standard (RPS) mandates were the primary drivers of renewable energy demand up through the mid-2010s. With wind and solar costs falling, demand is now driven by a combination of RPS mandates and voluntary procurements by utilities, businesses, municipalities, and (where the choice is possible) individual customers.
As of July 2018, 65 cities across the country, including Los Angeles, had pledged to transition to 100% renewable electricity, with the majority seeking to achieve this goal by 2035. In Arizona, both Tempe and Flagstaff have committed to using 100% renewable electricity for municipal operations (MacDonald-Evoy 2018). Flagstaff has signed a memorandum of understanding with
27 Vehicle charging stations and projects 50 kW and below are excluded. See the “DOE Global Energy Storage Database,” DOE Office of Electricity Delivery and Energy Reliability, http://www.energystorageexchange.org. 28 This trend was most evident in 2012. As the PTC reached its expiration at the end of that year, annual installations jumped to 13,400 MW, more than double the previous year’s installations and 38% above the previous record year in 2009 (when the PTC was also expiring). The PTC was extended in 2013, but new installations fell to 853 MW in 2013 and rose to just 5,326 MW in 2014.

28 This report is available at no cost from the National Renewable Energy Laboratory (NREL) at www.nrel.gov/publications
the Hopi Tribe Economic Development Council to explore the development of a 19-MW PV facility on Hopi land for that purpose (Cowan 2018).
Renewable power demand from corporations has also increased dramatically. Corporate procurement of off-site utility-scale PV accounted for 17% of installed PV capacity in early 2017 (Heeter et al. 2017; Honeyman et al. 2016). Rocky Mountain Power cited the demand from communities and businesses committing to 100% renewable electricity within their Utah service territory as the primary impetus behind its May 2018 renewable energy request for proposals (Rocky Mountain Power 2018).
Thus, demand for new renewable energy sources is unlikely to disappear after 2019. As the next sections will show, cost reductions have at least partially positioned solar and wind developers to absorb the loss of federal incentives. What is likely, however, is that competitive conditions will be tougher. Voluntary demand is more price-sensitive than mandates, and as shown in Section 2.4, load growth in the Southwest might not be a strong demand driver for new capacity. The two main factors are likely to be the price-related elasticity of clean energy preferences, and the pace of conventional generator retirements.
2.6.1 Solar Utility-scale PV solar is Arizona’s dominant opportunity for large-scale in-state renewable energy development. PV costs have fallen significantly since our 2016 baseline report, with power purchase agreements (PPAs) in 2018 reaching record lows even as new import tariffs29 placed upward pressure on PV system costs (Feldman et al. 2018). Among the lowest PPA prices awarded as of this writing was a proposed 30-MW project to serve CAWCD at a fixed price of $24.99/MWh (CAP 2018). These prices do not include battery storage.
Utility-scale solar energy generation capacity installed in the United States in 2016 nearly doubled the total amount for all years prior to 2016, driven in part by concerns that the ITC might expire at the end of the year.30 Solar energy generation was the largest source of new capacity additions in 2016 (Bolinger et al. 2017). Utility-scale solar accounted for 72% of the new solar capacity additions in 2016 and 61% of the cumulative solar capacity at the end of 2016.31
Deployment slowed in 2017 compared to 2016 levels, with 10.6 GWDC of PV installed in 2017 as compared to 14.8 GWDC in 2016 (Feldman et al. 2018). Nearly 60% of solar capacity installed in 2017 was utility-scale solar (Bolinger and Seel 2018). The United States saw 2.5 GWDC of PV installed in the first quarter of 2018, 57% of which was utility-scale.
29 Tariffs on PV modules and cells started at 30%; tariffs on steel and aluminum started at 25% and 10%. Office of the United States Trade Representative, Executive Office of the President of the United States (USTR 2018; Lynch, Dawsey, and Paletta 2018). 30 The ITC was subsequently extended through 2019, at which point it will begin a scheduled phaseout. 31 The dominance of utility-scale solar over distributed capacity additions is expected to continue through the extended ITC deadline of December 2019 and until 2023 due to IRS “safe harbor” guidance allowing for capture of the ITC benefit for projects that start construction or purchase equipment before this deadline (Bolinger et al. 2017).
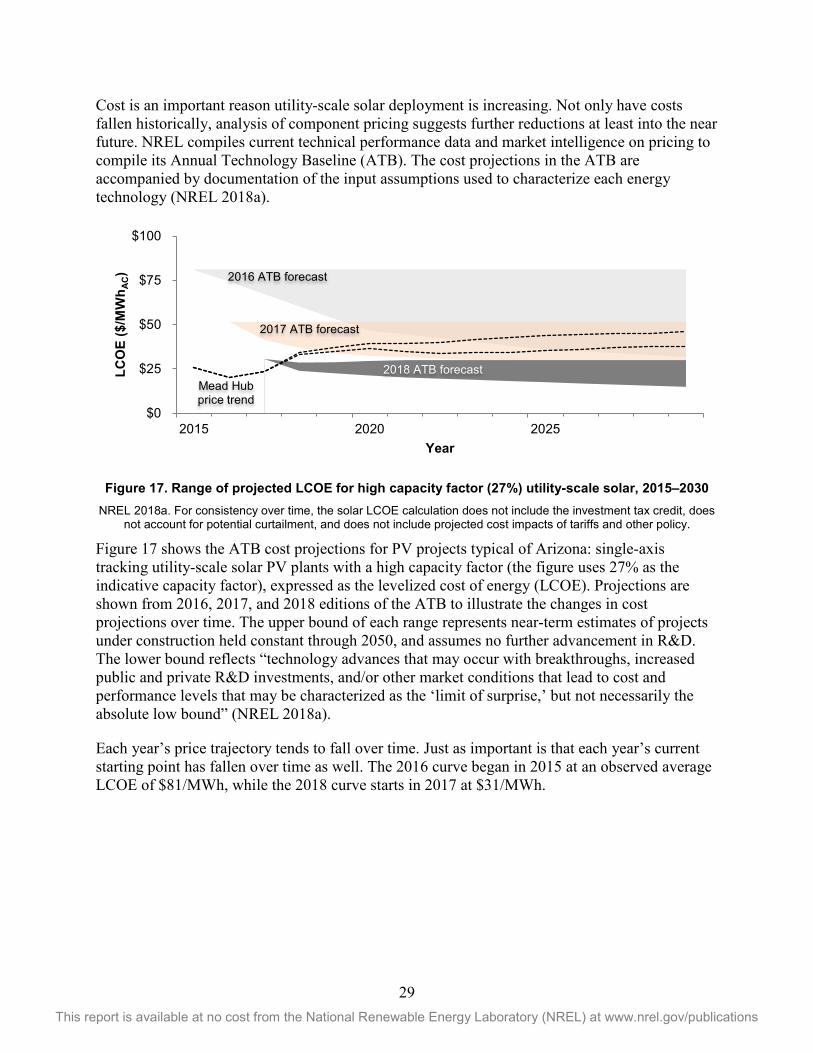
29 This report is available at no cost from the National Renewable Energy Laboratory (NREL) at www.nrel.gov/publications
Cost is an important reason utility-scale solar deployment is increasing. Not only have costs fallen historically, analysis of component pricing suggests further reductions at least into the near future. NREL compiles current technical performance data and market intelligence on pricing to compile its Annual Technology Baseline (ATB). The cost projections in the ATB are accompanied by documentation of the input assumptions used to characterize each energy technology (NREL 2018a).
Figure 17. Range of projected LCOE for high capacity factor (27%) utility-scale solar, 2015–2030
NREL 2018a. For consistency over time, the solar LCOE calculation does not include the investment tax credit, does not account for potential curtailment, and does not include projected cost impacts of tariffs and other policy.
Figure 17 shows the ATB cost projections for PV projects typical of Arizona: single-axis tracking utility-scale solar PV plants with a high capacity factor (the figure uses 27% as the indicative capacity factor), expressed as the levelized cost of energy (LCOE). Projections are shown from 2016, 2017, and 2018 editions of the ATB to illustrate the changes in cost projections over time. The upper bound of each range represents near-term estimates of projects under construction held constant through 2050, and assumes no further advancement in R&D. The lower bound reflects “technology advances that may occur with breakthroughs, increased public and private R&D investments, and/or other market conditions that lead to cost and performance levels that may be characterized as the ‘limit of surprise,’ but not necessarily the absolute low bound” (NREL 2018a).
Each year’s price trajectory tends to fall over time. Just as important is that each year’s current starting point has fallen over time as well. The 2016 curve began in 2015 at an observed average LCOE of $81/MWh, while the 2018 curve starts in 2017 at $31/MWh.
$0
$25
$50
$75
$100
2015 2020 2025
LCO
E ($
/MW
h AC)
Year
2016 ATB forecast
Mead Hub price trend
2017 ATB forecast
2018 ATB forecast

30 This report is available at no cost from the National Renewable Energy Laboratory (NREL) at www.nrel.gov/publications
Figure 18. Range of projected LCOE for high capacity factor (27%), utility-scale solar considering
market factors, 2016–2030 NREL 2018a. Includes market conditions such as the effects of R&D on technology costs, technology performance,
and policies such as tax credits and tariffs
The ATB cost projections in Figure 17 exclude policies and economic incentives such as the ITC. Figure 18 shows the projected LCOE from the 2018 ATB adjusted to estimate the influence of market factor financials such as tax credits and import tariffs. Taking these factors into account, projected utility-scale PV costs for 2020 range from $23/MWh to $31/MWh, compared to ATB’s base estimate of $21/MWh to $29/MWh.
Current PPA prices provide tangible indicators of market trends and their ultimate impact on customer bills. They also inform cost projections, as Figure 17 illustrates. PPA prices have reached record lows several times in 2018, as shown in Table 5.
Table 5. Recent Examples of PPA Prices for Utility-Scale PV
$/MWh Capacity Date Purchaser State
$23.76 300 MW June 2018 NV Energy Nevadaa
$24.99 30 MW June 2018 CAWCD Arizonab
$23–$27 72–250 MW June 2018 Xcel Energy Coloradoc
$30.96d avg. 180 MW March 2018 Xcel Energy Coloradoe
a Nevada Power Company 2018 b CAP 2018 c Public Utilities Commission of the State of Colorado 2018b d This price represents the median PV bid price, adjusted to reflect added costs from tariffs on imported solar equipment. e Public Service Company of Colorado 2017; Svaldi 2018
$-
$10
$20
$30
$40
$50
2015 2020 2025 2030
LCO
E ($
/MW
h AC)
Mead Hub price trend
2018 ATB forecast (market-adjusted)
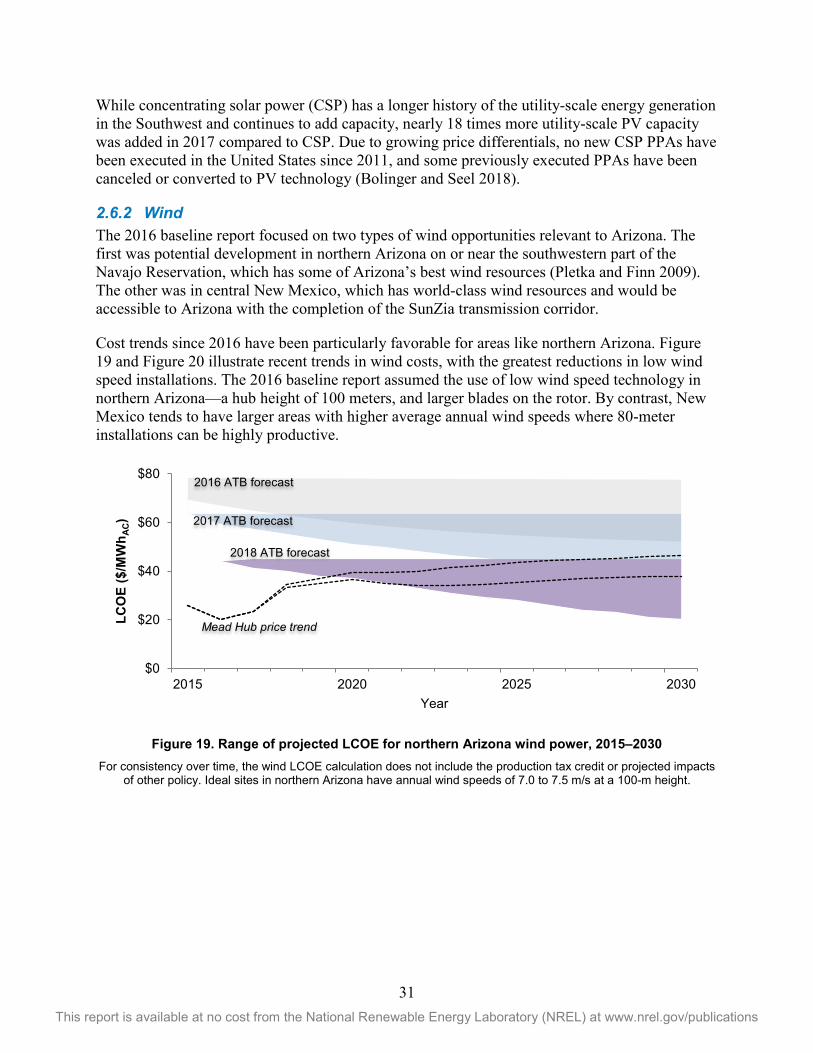
31 This report is available at no cost from the National Renewable Energy Laboratory (NREL) at www.nrel.gov/publications
While concentrating solar power (CSP) has a longer history of the utility-scale energy generation in the Southwest and continues to add capacity, nearly 18 times more utility-scale PV capacity was added in 2017 compared to CSP. Due to growing price differentials, no new CSP PPAs have been executed in the United States since 2011, and some previously executed PPAs have been canceled or converted to PV technology (Bolinger and Seel 2018).
2.6.2 Wind The 2016 baseline report focused on two types of wind opportunities relevant to Arizona. The first was potential development in northern Arizona on or near the southwestern part of the Navajo Reservation, which has some of Arizona’s best wind resources (Pletka and Finn 2009). The other was in central New Mexico, which has world-class wind resources and would be accessible to Arizona with the completion of the SunZia transmission corridor.
Cost trends since 2016 have been particularly favorable for areas like northern Arizona. Figure 19 and Figure 20 illustrate recent trends in wind costs, with the greatest reductions in low wind speed installations. The 2016 baseline report assumed the use of low wind speed technology in northern Arizona—a hub height of 100 meters, and larger blades on the rotor. By contrast, New Mexico tends to have larger areas with higher average annual wind speeds where 80-meter installations can be highly productive.
Figure 19. Range of projected LCOE for northern Arizona wind power, 2015–2030
For consistency over time, the wind LCOE calculation does not include the production tax credit or projected impacts of other policy. Ideal sites in northern Arizona have annual wind speeds of 7.0 to 7.5 m/s at a 100-m height.
$0
$20
$40
$60
$80
2015 2020 2025 2030
LCO
E ($
/MW
h AC)
Year
Mead Hub price trend
2016 ATB forecast
2017 ATB forecast
2018 ATB forecast

32 This report is available at no cost from the National Renewable Energy Laboratory (NREL) at www.nrel.gov/publications
Figure 20. Range of projected LCOE for central New Mexico wind power, 2015–2030
For consistency over time, the wind LCOE calculation does not include the production tax credit or projected impacts of other policy. Ideal sites in central New Mexico have annual wind speeds of 8.5 to 9.5 m/s at an 80-m height.
Wind developers with finite access to capital will look nationwide for opportunities with the greatest chance of high returns on investment. Technological advances since 2016 have stimulated wind development throughout the United States. Most growth from 2016 to 2018 has occurred in the country’s existing major wind markets such as Texas, Oklahoma, Kansas and Iowa. Emerging areas that have accelerated since 2016 include Indiana, Missouri, Michigan, North Carolina, West Virginia, and other states where wind development has so far been relatively limited (EIA 2018c).
Improved technology and manufacturing capabilities have sustained wind power’s continued growth. With enhanced and augmented rotor diameters, capacity factors of wind projects have increased. In addition, new wind turbines have a larger generating capacity, averaging 2.3 MW in 2017 (Wiser et al. 2018). This is 8% more than the average capacity of wind turbines installed in 2016, and more than twice the average size of turbines installed at utility-scale wind plants since 1998.
PPA prices for wind plants fell to around $20/MWh in 2017, with some contracts even lower. These prices include the effect of the PTC. Investment in new wind plants increased the nation’s total wind capacity by more than 7 GW (Wiser et al. 2018). While Texas continued to add the most wind capacity, New Mexico had the highest growth rate (AWEA 2017). Overall, wind provided 6.3% of the nation’s supply of electricity generation in 2017.
$0
$20
$40
$60
$80
2015 2020 2025 2030
LCO
E ($
/MW
h AC
)
Year
2016 ATB forecast
Mead Hub price trend
2017 ATB forecast
2018 ATB forecast

33 This report is available at no cost from the National Renewable Energy Laboratory (NREL) at www.nrel.gov/publications
3 Implications for Tribal Energy Development The sectoral trends examined in Section 2 will affect the success of energy-related economic development opportunities that Arizona Indian tribes might wish to pursue. This is especially true for the Navajo Nation and the Hopi Tribe, who are most directly affected by the future of NGS.
This section focuses solely on informing outward-facing energy plans—specifically, the development of revenue-producing utility-scale energy projects sited on tribal lands that serve load elsewhere in the region. We do not address whether or not any tribe should pursue such plans or how it might do so. Instead, our purpose is to provide the tribes with an objective assessment of the regional market conditions they would likely face.
Although the Navajo, Hopi, and other Southwest tribes have high-quality energy resources, their bankable development opportunities would most likely be tempered by competition. As potential land owners receiving lease payments, tribes would be in competition with private land owners elsewhere in the region who also wish to collect rent for hosting projects. As potential equity partners, tribal investors would be in competition with other investors who are cautious about their expected rates of return. As potential developers themselves, they would be in competition with private-sector developers throughout the region who are currently completing low-cost projects and signing PPAs at $30 per MWh and lower.
Finite demand and an abundant stock of potential supply make the Southwest a buyer’s market with respect to new natural gas and renewable generation. The success of energy efficiency efforts is reducing the need for new generation generally, even as the region’s population and economy continue to grow. In short, a tribe would need to think strategically about how to leverage any competitive advantage it has to increase the odds of success. Most important, any project would need to be price-competitive.
Risk is another factor that developers consider when prioritizing projects. Delays in permitting and other issues affecting site access and project commencement could in turn affect the application of incentives such as the ITC or PTC. Land laws on the reservation are often different from state land laws, with which developers are more familiar. Therefore, a comprehensive tribal energy strategy might address the need to clarify rules for permitting and site access before soliciting developer interest (MacCourt 2010).
Risk can include a lack of clarity for lease terms, tribal taxes, and other revenues that would flow from the project to the tribe. Financing can be problematic if the project pro forma lacks certainty around these costs. Dispute resolution can also be a source of risk, especially if the tribe requires disagreements to be arbitrated in tribal courts rather than state courts.
3.1 New CCNG and CT Plants Although generation from natural gas is usually cheaper than generation from coal in the Southwest and elsewhere, market conditions limit the immediate opportunities for building new CCNG plants—not just on the reservation but throughout Arizona. No new CCNG plant has been built in the state since 2004. Analysis presented in Section 2 and in NREL’s 2016 baseline

34 This report is available at no cost from the National Renewable Energy Laboratory (NREL) at www.nrel.gov/publications
report illustrates an important reason: Arizona is projected to have enough existing CCNG capacity to accommodate the loss of NGS and maintain its reserve margin at least through 2030.
Section 2.3 suggests substituting CCNG for coal might reduce system costs if natural gas prices remain where they have been over the past three years. One implication of this is that a new CCNG plant could face revenue pressure, with financial viability dependent on a low plant heat rate, low operating costs, and the owner’s ability to strategically manage fuel supply contracts. This would leave little room for unusually high lease payments if the plant were built on tribal lands.
The main uncertainty, explained in Section 2.4, is load growth. The region’s reserve margin could signal a near-term need for new CCNG capacity if peak demand were to grow faster than 1.5% per year. Since 2009, however, annual load growth has been around 1% per year. Measurable energy efficiency and productivity improvements have made post-recession economic expansion possible without a surge in electricity consumption that might otherwise be driven by population growth and economic growth. If Arizona’s energy-efficient economic growth continues, the region’s reserve margin would likely remain above the NERC benchmark with no strong signal for new capacity.
The need for new natural gas CTs might also be limited. Upgrades to APS’ Ocotillo plant are expected to provide 510 MW of CT flexibility. The battery storage planned for the near future is another phenomenon that has occurred since the modeling was done. These new developments far exceed the 30 MW of flexible capacity that the 2016 baseline study concluded might be needed by 2030 if NGS were to retire.
3.2 New Renewables Navajo and Hopi lands have renewable resources with the potential for high productivity, but so do other areas in the Southwest. The market for renewable energy supply is highly competitive, and indications are that it will become even more competitive after 2020.
The map in Figure 21 shows developable solar and wind resources in the Southwest identified in the Western Renewable Energy Zone analysis conducted for the Western Governors Association in 2009 (Pletka 2009). The geospatial analysis used to create the map applied several screening criteria for terrain, land use constraints, and productivity of potential wind and solar development. Potential resource areas on the Navajo and Hopi Reservations are included in the Northeast Arizona zone.
Several wind-rich and solar-rich areas exist throughout Arizona, southern Nevada, and New Mexico. Table 6 shows the solar and wind resources by state and by quality. The numbers show that northeast Arizona is one of several options for siting low-cost renewable energy development.

35 This report is available at no cost from the National Renewable Energy Laboratory (NREL) at www.nrel.gov/publications
Figure 21. Western Renewable Energy Zone resource areas, with Navajo and Hopi Reservations Size of each circle represents the relative amount of energy that could be delivered from within a 100-mile radius of
the circle’s center point. Wind and solar resource areas shown on the map were screened for developability. Adapted from Pletka 2009 by Billy Roberts, NREL.
Table 6. Western Renewable Energy Zone Screened Renewable Energy Potential
Solar (screened MW) Wind (screened MW)
DNI: 7.25-7.5 DNI: +7.5 Class 3 Class 4 Class 5
NE Arizona zone 309 0 3,305 137 57
Rest of Arizona 17,230 2,204 209 7 2
Nevada 8,724 3,268 371 42 18
New Mexico 6,042 0 – 11,195 1,989
Pletka 2009. Capacity estimates include several levels of screening for resource quality, land attributes, and other factors affecting developability. Direct normal insolation (DNI) measures the amount of solar radiation that typically
falls on an area.
3.2.1 Prospects for Solar Development Because of the phased reduction in the ITC scheduled to begin in 2020, solar projects developed sooner tend to have an economic advantage over projects that would take more time. Tribal projects would therefore need a clearly defined development path, all the way from negotiating site access to the distribution of project revenues such as lease payments or tax receipts. Uncertainty over any step in the development path creates risk that could delay the project, which in turn might lessen the economic benefit of the ITC.
Two projects on the Moapa River Indian Reservation in Nevada provide examples of low-cost PV deployment and tribal economic development. The 300-MW Eagle Shadow Mountain Solar Farm, developed by 8minutenergy, has a PPA with NV Energy at a flat rate of $23.76 per MWh over 25 years (Robinson 2018). The PV project is anticipated to create more than 600 jobs in the county during the development and construction phase. The other project is the 250-MW Moapa Southern Paiute Solar Project, which was developed and built by First Solar in 2017 and is

36 This report is available at no cost from the National Renewable Energy Laboratory (NREL) at www.nrel.gov/publications
selling power to the Los Angeles Department of Water and Power (LADWP) under a 25-year PPA. Both projects connect at the nearby Crystal Substation on the 500-kV line running west from NGS.
Economic simulations of hypothetical PV projects conducted by NREL indicate that comparable projects on the Navajo and Hopi reservations could be financially feasible under normal cost assumptions. NREL modeled a hypothetical 100 MW PV system with battery storage (10 MW for four hours) connecting to the NGS transmission system at the Moenkopi Switch substation, near Navajo’s Cameron Chapter and about 15 miles from Hopi’s Lower Moencopi village. The results indicate that a project could be developed at a levelized cost of around $32 per MWh, which is within the range of prices noted in Section 2.5.32
Ultimate feasibility depends, of course, on many risk-related factors described at the beginning of this section. Nevertheless, the simulations demonstrate is that if the tribes can resolve matters such as site access, permitting, local taxation, and other uncertainties in a way that does not create extraordinary costs, it would be possible for projects located on the Navajo and Hopi reservations to come in at prices low enough to compete in a highly competitive regional market.
The Navajo Tribal Utility Authority (NTUA) developed the 27.3-MW Kayenta Solar Facility in 2017. NTUA and SRP announced plans for a 28-MW expansion in August 2018 (SRP 2018). The Kayenta projects will help NTUA extend electricity service to underserved areas of the reservation, but NTUA and SRP also hope to use the projects as a springboard for developing larger renewable projects.
3.2.2 Prospects for Wind Development Northeast Arizona has most of the state’s wind potential. However, New Mexico’s wind resources are both more plentiful and more productive than resources in northeast Arizona. The relative competitiveness of a wind project on the Navajo Reservation could, therefore, depend on reducing development risk and leveraging access to existing transmission.
To date, there has been no major wind development on Navajo lands. Two prospects that have been studied in recent years (but not developed) are the Big Boquillas Ranch Wind Project and the Gray Mountain Wind Project. Both sites are near NextEra’s 99-MW Perrin Ranch Wind Energy Center, which provides power for APS and in 2017 reported a capacity factor of 27% (S&P 2018).
The PTC is scheduled to be phased out at the end of 2019.33 Although industry analysts expect continued demand for wind power after that time, they also anticipate that immediate efforts will 32 Adding storage increased capital cost by approximately 24% and levelized cost by approximately 26%. NREL simulated project financials with and without storage using its System Advisor Model, which is publicly available and can be configured with other user-defined financial assumptions (NREL 2018b). Appendix A lists the assumptions used in this simulation, which are based on NREL’s most recent knowledge of supply-chain costs, taxes, and other financial inputs. 33 Current law reduces the PTC by 40% in 2018 and by 60% in 2019, with complete phase-out at the end of 2019. Developers may elect to forego the PTC and apply the ITC instead. A project may receive the PTC or ITC in effect at the time construction begins so long as: (a) the project is placed in service before 2024; and (b) costs for that year are no less than 5% of total project costs.

37 This report is available at no cost from the National Renewable Energy Laboratory (NREL) at www.nrel.gov/publications
focus on wind projects that can be started in time to take advantage of the PTC before it disappears. Turbines that are currently in the national supply chain will most likely be used primarily in projects with favorable economics that can be developed expeditiously.
3.3 Transmission Proximity to the 500-kV NGS transmission system is perhaps the most significant competitive advantage that the Navajo Nation and the Hopi Tribe have for development of new generation resources. As Figure 22 illustrates, these transmission lines provide a superhighway from the western Navajo Reservation to Phoenix, Las Vegas, and Southern California. The two PV projects on the Moapa River Indian Reservation connect to the NGS transmission system north of Las Vegas to supply NV Energy and LADWP.
Figure 22. NGS transmission system
The current owners of NGS, along with LADWP (which transferred its share of NGS to SRP in 2016), have retained their ownership of the transmission system. SRP, APS, NV Energy, and TEP serve about 80% of the load in the Southwest. Therefore, the utilities most likely to be interested in a PPA with a new generation project built near the NGS transmission system will be those that already have transmission rights.
When the current NGS owners negotiated a short-term lease extension with the Navajo Nation to accommodate plant decommissioning, they included a provision to allocate 500 MW of capacity on the NGS transmission system to the tribe. The Navajo Nation can sell this capacity to projects serving utilities other than the ones that have their own transmission rights, or they can sell it as supplemental capacity if any of the current owners fully utilize their own shares.
LADWP line from Mead to Adelanto
PHOENIX
LAS VEGAS
LOS ANGELES
NGS
Mead hub

38 This report is available at no cost from the National Renewable Energy Laboratory (NREL) at www.nrel.gov/publications
Proximity to existing transmission is not a unique competitive advantage, however. The 500-kV SunZia transmission project, which is still obtaining permits, would provide Arizona with access to 2.2 GW of high-quality wind resources in central New Mexico. In addition, the scheduled 2027 retirement of the 1.8-GW Intermountain coal plant in Utah could open up capacity on an existing 500-kV DC line from central Utah to Los Angeles.

39 This report is available at no cost from the National Renewable Energy Laboratory (NREL) at www.nrel.gov/publications
4 Summary The Southwest power sector has continued its movement from coal to natural gas and renewables in the two years since publication of NREL’s baseline NGS study. Low natural gas prices appear to exert a continuing influence on wholesale power prices; thus, a key conclusion from the 2016 baseline study—that electricity produced at NGS will generally be more expensive than electricity purchased on the wholesale spot market—appears to remain robust.
As a baseload generator, NGS would most likely be replaced in the Southwest supply pool by other baseload-capable capacity. Modeling conducted in the 2016 baseline study indicated that existing CCNG plants could make up for the loss without the need for new capacity. Simulations conducted for this study, based on market outcomes since 2016, suggest that the replacement could also reduce costs to electricity customers in the region, assuming that natural gas prices remain in their recent historical ranges.
Demand for new renewable energy generation in the western United States appears likely to continue after 2019. There is no evidence that this demand will be affected by whether or not NGS continues to operate after 2019, however. State RPS mandates, along with growing voluntary demand from corporations, municipalities, and individuals, are independent of what might happen with a specific thermal plant.
For the Navajo, Hopi, and other Southwest tribes with high-quality energy resources, the most bankable development opportunities are likely to be in renewables. But these opportunities are likely to be tempered by competition. This will require the tribes to think strategically about outward-facing energy development. Finite demand and an abundant stock of potential supply make the Southwest a buyer’s market with respect to new natural gas and renewable generation. A tribal project will need to be cost effective to compete.
Low risk can be as important as a low price in a buyer’s market. A project pro forma might suggest a theoretically competitive price point, but uncertainty about permitting and site access could cause a developer to put more effort into low-risk opportunities that get to the same price point. Thus, the success of a tribe’s development strategy could depend on what it can do to reduce uncertainties affecting site access, tribal taxes, and other issues that could delay a project or create unforeseen costs.

40 This report is available at no cost from the National Renewable Energy Laboratory (NREL) at www.nrel.gov/publications
Glossary Term Definition
Anticipated resources
Operable capacity expected to be available to serve load during the peak hour with firm transmission, plus capacity that is either under construction or has received approved planning requirements, plus firm capacity transfers (imports minus exports, transfers with firm contracts), minus confirmed retirements (formally announced)
Prospective resources
Anticipated resources, plus operable capacity that could be available to serve load during the peak hour but lacks firm transmission (and could be unavailable during the peak for several reasons), plus capacity that has been requested but not received approval for planning requirements, plus transfers without firm contracts, but a high probability of future implementation, minus unconfirmed retirements (from generator survey or analysis not otherwise counted as confirmed retirements)
Equivalent forced outage rate demand (EFORd)
The probability that a unit will not meet its demand periods for generating requirements because of forced outages or deratings. The EFORd applicable to coal units such as NGS (individual units with a nameplate capacity 800 MW or larger but less than 1 GW) is 7.05%, based on NERC’s 2016 Generating Availability Data System.

41 This report is available at no cost from the National Renewable Energy Laboratory (NREL) at www.nrel.gov/publications
References American Wind Energy Association (AWEA). 2017. U.S. Wind Industry Annual Market Report 2017. Washington, D.C.: AWEA.
Arizona Corporation Commission (ACC). 2018. Resource Planning and Procurement in 2015 and 2016, Docket No. E-00000V-15-0094. Commission Order. (March 29, 2018).
Arizona Public Service Company (APS), “APS seeks partners to bring customers more clean energy using batteries,” news release, June 28, 2018, https://www.aps.com/en/ourcompany/news/latestnews/Pages/aps-seeks-partners-to-bring-customers-more-clean-energy-using-batteries.aspx.
Bolinger, Mark, and Joachim Seel. 2018. Utility-Scale Solar: Empirical Trends in Project Technology, Cost, Performance, and PPA Pricing in the United States, 2018 Edition. Berkeley, CA: Lawrence Berkeley National Laboratory. https://emp.lbl.gov/sites/default/files/lbnl_utility_scale_solar_2018_edition_report.pdf.
Bolinger, Mark, Joachim Seel, and Kristina Hamachi LaCommare. 2017. Utility-Scale Solar 2016: An Empirical Analysis of Project Cost, Performance, and Pricing Trends in the United States. Berkeley, CA: Lawrence Berkeley National Laboratory. http://eta-publications.lbl.gov/sites/default/files/utility-scale_solar_2016_report.pdf.
Central Arizona Project (CAP). 2018. Board of Directors Action Brief. “Agenda Number 8b: Discussion and Consideration of Action to Approve a 20-Year Purchase Power Agreement with AZ Solar 1, LLC. Tucson, AZ: Central Arizona Project.” June 7, 2018. http://www.cap-az.com/documents/meetings/2018-06-07/1704-8b-WEB-Action-Brief-Power-Portfolio---060718--solar--rev.pdf.
Central Arizona Water Conservation District (CAWCD). 2017. “Impact of NGS Closure on CAP.” Staff presentation to CAWCD Board’s Power Task Force, Phoenix, AZ, February 16, 2005.
Central Arizona Water Conservation District (CAWCD). 2018a. Central Arizona Project 2018–2019 Biennial Budget. Phoenix, AZ: CAWCD. http://www.cap-az.com/documents/departments/finance/2018-2019%20Biennial%20Budget.pdf.
Central Arizona Water Conservation District (CAWCD). 2018b. “Meeting of the Board of Directors.” Minutes, June 7, 2018. http://www.cap-az.com/documents/meetings/2018-06-07/1704-CAWCD-Final-Signed-Meeting-Minutes-060718.pdf.
Cole, Wesley, Bethany Frew, Pieter Gagnon, James Richards, Yinong Sun, Jarett Zuboy, Michael Woodhouse, and Robert Margolis. 2017. SunShot 2030 for Photovoltaics (PV): Envisioning a Low-cost PV Future. NREL/TP-6A20-68105. Golden, CO: National Renewable Energy Laboratory. https://www.nrel.gov/docs/fy17osti/68105.pdf.
Cole, Wesley, Cara Marcy, Venkat K. Krishnan, and Robert Margolis. 2016. “Utility-Scale Lithium-Ion Storage Cost Projections for Use in Capacity Expansion Models.” In Proceedings of the 2016 IEEE North America Power System Meeting, Denver, CO, pp. 1-6, represented in the NREL 2018 Annual Technology Baseline (ATB), http://atb.nrel.gov.

42 This report is available at no cost from the National Renewable Energy Laboratory (NREL) at www.nrel.gov/publications
Cole, Wesley, Trieu Mai, Paul Donohoo-Vallett, James Richards, and Paritosh Das. 2017. 2017 Standard Scenarios Report: A U.S. Electricity Sector Outlook. NREL/TP-6A20-68548. Golden, CO: National Renewable Energy Laboratory. https://www.nrel.gov/docs/fy18osti/68548.pdf.
Cowan, Emery. 2018. “City of Flagstaff and Hopi Tribe Partner on Renewable Energy Project.” Arizona Daily Sun, March 17. https://azdailysun.com/news/local/city-of-flagstaff-and-hopi-tribe-partner-on-renewable-energy/article_303b0c8b-38ba-515a-af97-b26a027a85b3.html.
Denholm, Paul, Josh Eichman, and Robert Margolis. 2017. Evaluating the Technical and Economic Performance of PV Plus Storage Power Plants. NREL/TP-6A20-68737. Golden, CO: National Renewable Energy Laboratory. https://www.nrel.gov/docs/fy17osti/68737.pdf.
Donohoo-Vallett, Paul, Patrick Gilman, David Feldman, James Brodrick, David Gohlke, Roland Gravel, Amy Jiron, Carol Schutte, Sunita Satyapal, Tien Nguyen, Paul Scheihing, Blake Marshall, and Sarah Harman. 2016. Revolution…Now: The Future Arrives for Five Clean Energy Technologies – 2016 Update. DOE/EE-1478. Washington, D.C.: U.S. Department of Energy. https://www.energy.gov/sites/prod/files/2016/09/f33/Revolutiona%CC%82%E2%82%ACNow%202016%20Report_2.pdf.
David Feldman, Jack Hoskins, and Robert Margolis. 2018. Q4 2017/Q1 2018 Solar Industry Update. NREL/PR-6A20-71493. Golden, CO: National Renewable Energy Laboratory. https://www.nrel.gov/docs/fy18osti/71493.pdf.
Financial Accounting Standards Board (FASB). 2018. Accounting Standards Codification Section 360. https://asc.fasb.org/section&trid=2155842.
Heeter, Jenny, Jeffrey J. Cook, and Lori Bird. 2017. Charting the Emergence of Corporate Procurement of Utility-Scale PV. NREL/TP6A20-69080. Golden, CO: National Renewable Energy Laboratory. https://www.nrel.gov/docs/fy17osti/69080.pdf.
Honeyman, Cory, Austin Perea, Shayle Kann, MJ Shiano, Jade Jones, Colin Smith, Benjamin Gallagher, Scott Moskowitz, Allison Mond, Shawn Rumery, Aaron Holm, Katie O’Brien, and Justin Baca. 2016. U.S. Solar Market Insight Full Report 2016 Q4. Washington, D.C.: GTM Research and Solar Energy Industries Association. http://www.seia.org/research-resources/solar-market-insight-report-2016-q4.
Hurlbut, David, Scott Haase, Greg Brinkman, Kip Funk, Rachel Gelman, Eric Lantz, Christina Larney, David Peterson, Chris Worley, and Edward Liebsch. 2012a. Navajo Generating Station and Air Visibility Regulatios: Alternatives and Impacts (Revised). NREL/TP-6A20-53024. Golden, CO: National Renewable Energy Laboratory. https://www.nrel.gov/docs/fy12osti/ 53024.pdf.
Hurlbut, David, Scott Haase, Craig S. Turchi, and Kerry Burman. 2012b. Navajo Generating Station and Clean-Energy Alternatives: Options for Renewables. NREL/TP-6A20-54706. Golden, CO: National Renewable Energy Laboratory. https://www.nrel.gov/docs/fy12osti/ 54706.pdf.

43 This report is available at no cost from the National Renewable Energy Laboratory (NREL) at www.nrel.gov/publications
Hurlbut, David, Scott Haase, Clayton Barrows, Lori Bird, Greg Brinkman, Jeff Cook, Megan Day, Victor Diakov, Elaine Hale, David Keyser, Anthony Lopez, Trieu Mai, Joyce McLaren, Emerson Reiter, Brady Stoll, Tian Tian, Harvey Cutler, Dominique Bain, and Tom Acker. 2016. Navajo Generating Station & Federal Resource Planning Volume 1: Sectoral, Technical, and Economic Trends. NREL/TP-6A20-66506. Golden, CO: National Renewable Energy Laboratory. https://www.nrel.gov/docs/fy17osti/66506.pdf.
Lynch, David J., Josh Dawsey, and Damian Paletta. 2018. “Trump Imposes Steel and Aluminum Tariffs on the E.U., Canada and Mexico.” The Washington Post, May 31, 2018. https://www.washingtonpost.com/business/economy/trump-imposes-steel-and-aluminum-tariffs-on-the-european-union-canada-and-mexico/2018/05/31/891bb452-64d3-11e8-a69c-b944de66d9e7_story.html?utm_term=.ae4120129041.
MacCourt, Douglas C. 2010. Renewable Energy Development in Indian Country: A Handbook for Tribes. NREL/SR-7A4-48078. Golden, CO: National Renewable Energy Laboratory. https://www.nrel.gov/docs/fy10osti/48078.pdf.
MacDonald-Evoy, Jerod. 2018. “Tempe Ramps Up Sustainability Goals, Aims to Use 100 Percent Renewable Energy by 2035.” The Republic, March 9, 2018. https://www.azcentral.com/story/news/local/tempe/2018/03/09/tempe-sustainability-goals-100-percent-renewable-energy-2035-carbon-neutral/411149002/.
National Renewable Energy Laboratory (NREL). 2018a. “Annual Technology Baseline.” Reports and spreadsheets for 2016, 2017, and 2018. https://atb.nrel.gov/.
National Renewable Energy Laboratory (NREL). 2018b. “System Advisor Model.” Modeling application and supporting documentation. https://sam.nrel.gov/.
Nevada Power Company. 2018. Joint Supply Side Plan, Transmission Plan, Economic Analysis, Distribution Planning, and Financial Plan. Public Utilities Commission of Nevada Electronic Filing. http://pucweb1.state.nv.us/PDF/AxImages/DOCKETS_2015_THRU_PRESENT/2018-6/30452.pdf.
North American Electricity Reliability Corporation (NERC). 2016. Generating Availability Data System, Generating Unit Statistical Brochure (spreadsheet). https://www.nerc.com/pa/RAPA/gads/Reports/Generating%20Unit%20Statistical%20Brochure%202%202016%20-%20All%20Units%20Reporting.xlsx.
North American Electricity Reliability Corporation (NERC). 2018a. 2017 Long-Term Reliability Assessment. March 1, 2018. https://www.nerc.com/pa/RAPA/ra/Reliability%20Assessments%20DL/NERC_LTRA_12132017_Final.pdf.
North American Electricity Reliability Corporation (NERC). 2018b. 2018 Long-Term Reliability Assessment. December 20, 2018. https://www.nerc.com/pa/RAPA/ra/Reliability%20Assessments%20DL/NERC_LTRA_12132017_Final.pdf.

44 This report is available at no cost from the National Renewable Energy Laboratory (NREL) at www.nrel.gov/publications
Platte River Power Authority. 2018. Request for Proposals: Platte River Power Authority 2018 Renewable Energy Supply – Photovoltaic Solar Generation or Photovoltaic Solar Generation with Storage Complement. Specification Number HQ18-1788. Fort Collins, CO: Platte River Power Authority. https://www.prpa.org/wp-content/uploads/2018/02/Platte-River-Power-Authority-HQ18-1788-2018-Solar-RFP-V7.pdf.
Pletka, R. and J. Finn. 2009. Western Renewable Energy Zones, Phase 1: QRA Identification Technical Report. NREL/SR-6A2-46877. Golden, CO: National Renewable Energy Laboratory. https://www.nrel.gov/docs/fy10osti/46877.pdf
Public Service Company of Colorado (PSCo). 2017. 2016 Electric Resource Plan: 2017 All Source Solicitation 30-Day Report (Public Version). CPUC Proceeding No. 16A-0396E, pp. 48, 51. Denver, CO: Xcel Energy. https://assets.documentcloud.org/documents/4340162/Xcel-Solicitation-Report.pdf.
Public Utilities Commission of the State of Colorado. 2018a. Phase II Decision Approving Retirement of Comanche Units 1 AND 2; Approving Resource Selection in Colorado Energy Plan Portfolio; Setting Requirements for Applications for Certificates of Public Convenience and Necessity; and Setting Requirements for the Next Electric Resource Plan Filing. Decision No. C18-0761. Proceeding No. 16A-0396E. https://www.xcelenergy.com/staticfiles/xe-responsive/Company/Rates%20&%20Regulations/Resource%20Plans/16A-0396E-Phase-II-Decision.pdf.
Public Utilities Commission of the State of Colorado. 2018b. Electric Resource Plan 120-Day Report: Public Version. CPUC Proceeding No. 16A-0396E. June 6, 2018. https://www.dora.state.co.us/pls/efi/efi_p2_v2_demo.show_document?p_dms_document_id=887185&p_session_id=
Robinson, Vernon. 2018. “NV Energy Announcement Includes Moapa Paiute Solar Plant.” Moapa Valley Progress, June 6. http://mvprogress.com/2018/06/06/nv-energy-announcement-includes-moapa-paiute-solar-plant/.
Rocky Mountain Power. 2018. “Rocky Mountain Power Opens RFP for Solar and Other Renewable Energy Projects in Utah,” news release, May 29, 2018. https://www.rockymountainpower.net/about/nr/nr2018/solar-renewable-energy-rfp.html.
S&P Global Market Intelligence (S&P). 2018. Price data for wholesale power and natural gas.
Salt River Project (SRP). 2017. “Owners Vote on Navajo Coal Plant Lease,” news release, February 13, 2017.
Salt River Project (SRP). 2018. “NTUA, SRP and Navajo Nation Leaders Celebrate Groundbreaking Ceremony for Kayenta II to Celebrate Commitment to Develop Renewable Energy Projects on Navajo Nation,” news release, August 27, 2017. https://www.srpnet.com/newsroom/releases/082718.aspx.

45 This report is available at no cost from the National Renewable Energy Laboratory (NREL) at www.nrel.gov/publications
Svaldi, Aldo. 2018. “Xcel Energy Receives Shockingly Low Bids for Colorado Electricity from Renewable Sources.” Denver Post, January 16, 2018. https://www.denverpost.com/2018/01/16/xcel-energy-low-bids-for-colorado-electricity/.
U.S. Department of the Interior Bureau of Reclamation (USBR). 2016. Draft Environmental Impact Statement: Navajo Generating Station–Kayenta Mine Complex Project. Glendale, AZ: U.S. Bureau of Reclamation Lower Colorado Region, Phoenix Area Office. https://www.usbr.gov/ngs/docs/NGS-KMC-DEIS-Text.pdf.
U.S. Energy Information Administration (EIA). 2018a. Annual Energy Outlook 2018. #AEO2018. Washington, D.C.: U.S. Energy Information Administration Office of Energy Analysis. https://www.eia.gov/outlooks/aeo/pdf/AEO2018.pdf
U.S. Energy Information Administration (EIA). 2018b. Electricity Data Browser, “Net Generation, United States, all sectors, monthly” and “Retail Sales of Electricity, Arizona, all sectors, annual.” https://www.eia.gov/electricity/data/browser/.
U.S. Energy Information Administration (EIA). 2018c. Electricity, “Form EIA-860.” https://www.eia.gov/electricity/data/eia860/.
U.S. Energy Information Administration (EIA). 2018d. Assumptions to the Annual Energy Outlook 2018: Oil and Gas Supply Module. https://www.eia.gov/outlooks/aeo/assumptions/.
U.S. Energy Information Administration (EIA). 2018e. “November U.S. natural gas prices increased beyond previous market expectations.” December 7. https://www.eia.gov/ todayinenergy/detail.php?id=37713#.
U.S. Energy Information Administration (EIA). 2018f. “Natural Gas Weekly Update.” July 26. https://www.eia.gov/naturalgas/weekly/archivenew_ngwu/2018/07_26/.
USTR (Office of the United States Trade Representative). 2018. “President Trump Approves Relief for U.S. Washing Machine and Solar Cell Manufacturers,” news release, January 2018. https://ustr.gov/about-us/policy-offices/press-office/press-releases/2018/january/president-trump-approves-relief-us.
Vistra Energy. 2018. Annual Report and Form 10-K for the year ending December 31, 2017. Brooklyn, NY: Vistra Energy. https://www.last10k.com/sec-filings/vst.
Wiser, Ryan, Mark Bolinger, Galen Barbose, Naim Darghouth, Ben Hoen, Andrew Mills, Joe Rand and Dev Millstein, (Lawrence Berkeley National Laboratory); Kevin Porter, Katherine Fisher, and Nicholas Disanti (Exeter Associates); and Frank Oteri (NREL). 2018. 2017 Wind Technologies Market Report. Washington, D.C.: U.S. Department of Energy Office of Energy Efficiency and Renewable Energy. https://www.energy.gov/sites/prod/files/2018/08/f54/2017_wind_technologies_market_report_8.15.18.v2.pdf.

46 This report is available at no cost from the National Renewable Energy Laboratory (NREL) at www.nrel.gov/publications
Appendix: Parameters Used to Simulate a PV Project Near Moenkopi Switch Substation NREL included the following parameters in its financial modeling of a hypothetical 100-MW PV plant located on the Navajo or Hopi reservation. All other cost parameters not specified here were based on NREL’s knowledge of supply chain costs as of the publication of this report. Alternative project cost assumptions may be tested using NREL’s System Advisor Model, available for download at https://sam.nrel.gov/.
• Coordinates: 35.89° N, 111.42° W, elevation 1,300 m. (Figure 23). Weather file from National Solar Resource Database, which indicates a direct normal irradiance of 7.21 kWh/m2/day.
• Module: $0.275 per WDC for a high efficiency, multi-c-Si module with a nominal efficiency of 20% and a maximum system voltage of 1,500 V.
• Inverter: $0.04 per WDC for a high efficiency, California Energy Commission 2018-listed, central inverter with a weighted efficiency of 98.8%.
• DC to AC ratio: 1.3.
• Land preparation and transmission: $0.02 per WDC, with the assumption that the facility will be located near the Moenkopi Switch substation.
• Operation and maintenance costs: $7 per kW-yr in 2022.
• Internal rate of return: 8%. at 25 years.
• Site cost based on a $400 per acre flat rate lease, 25-year term, and 700 acres, for a total project cost of $7 million or $0.07 per WDC. (While comparable with other projects, these numbers are not official policy of the Navajo Nation or the Hopi Tribe.)
• Tribal revenues: a tribal sales tax rate of 6%, a 5% tribal business activity tax, and a tribal possessory interest tax of 3% of market value based on an annual valuation with an annual decline of 4% in property value.34
Table 7 shows the detailed results of the simulation.
34 As of this writing, neither the Navajo Nation nor the Hopi Tribe has an official policy regarding the full taxation of renewable energy projects. The sales tax rate is based on discussion with Martin Ashley of the Office of the Navajo Tax Commission. The 5% business activity tax is based on the Navajo Tax Commission Business Activity Tax. According to the Office of the Navajo Tax Commission, a Possessory Interest Tax of 3% of market value is based on an annual valuation conducted by the office, with an annual decline of 4% in property value. State income tax is modeled at the Arizona state income corporate tax rate of 4.9%.

47 This report is available at no cost from the National Renewable Energy Laboratory (NREL) at www.nrel.gov/publications
Table 7. Detailed Results of Utility-Scale PV Simulation
With storage Without storage
Figure 23. Location of Site Used for PV Project Simulation


![Imperial Armour [Volume 1] Update 1.1](https://static.fdocuments.us/doc/165x107/54780350b4af9f52108b4b62/imperial-armour-volume-1-update-11.jpg)