Volume 2: Test Development - Florida Department of...
35
Florida Standards Assessments 2016–2017 Volume 2 Test Development
Transcript of Volume 2: Test Development - Florida Department of...
Florida Standards Assessments
2016–2017
Volume 2 Test Development
FSA 2016–2017 Technical Report: Volume 2
Test Development ii Florida Department of Education
ACKNOWLEDGMENTS
This technical report was produced on behalf of the Florida Department of Education. Requests for additional information concerning this technical report or the associated appendices should be directed to Dr. Salih Binici at the Florida Department of Education ([email protected]).
Major contributors to this technical report include the following staff from the American Institutes for Research (AIR): Dr. Harold Doran, Dr. Elizabeth Ayers-Wright, Dr. Dipendra Subedi, Dr. MinJeong Shin, Dr. Ah-Young Shin, Patrick Kozak, Mayumi Rezwan, Kathryn Conway, and Emily Rubenstein. The major contributors from the Florida Department of Education are as follows: Dr. Salih Binici, Dr. Qian Liu, Vince Verges, Susie Lee, Jenny Black, Zhongtian Lin, Susan Taylor, Sally Rhodes, and Travis Barton.
FSA 2016–2017 Technical Report: Volume 2
Test Development iii Florida Department of Education
TABLE OF CONTENTS
1. INTRODUCTION ................................................................................................ 12. TEST SPECIFICATIONS .................................................................................... 2
2.1 Blueprint Development Process 2............................................................................................ 2.2 Target Blueprints 3................................................................................................................... 2.3 Content-Level and Psychometric Considerations ...............................................................11
3. ITEM DEVELOPMENT PROCEDURES ......................................................... 133.1 Summary of Item Sources ...................................................................................................14 3.2 Item Types 14........................................................................................................................... 3.3 Development and Review Process for New Items ..............................................................16
3.3.1 Development of New Items........................................................................................16 3.3.2 Rubric Validation ......................................................................................................19
3.4 Development and Maintenance of the Item Pool ................................................................20 3.5 Alignment Process for Existing Items and Results from Alignment Studies ......................21
4. TEST CONSTRUCTION ................................................................................... 224.1 Overview .............................................................................................................................22
4.1.1 Roles and Responsibilities of Participants ...............................................................22 4.2 Test Construction Process ...................................................................................................23
4.2.1 Offsite Test Construction ..........................................................................................24 4.2.2 Onsite Meetings ........................................................................................................24
4.3 Test Construction Summary Materials ................................................................................25 4.3.1 Item Cards .................................................................................................................25 4.3.2 Bookmaps ..................................................................................................................26 4.3.3 Graphical Summaries ...............................................................................................26
4.4 Paper Accommodation Form Construction .........................................................................28
5. REFERENCES ................................................................................................... 31
LIST OF APPENDICES
Appendix A: ELA Blueprints Appendix B: Mathematics and EOC Blueprints Appendix C: Example Item Types Appendix D: Sample Verification Log Appendix E: Test Construction Targets Appendix F: 2017 FSA Test Construction Specs
FSA 2016–2017 Technical Report: Volume 2
Test Development iv Florida Department of Education
LIST OF TABLES
Table 1: Blueprint Test Length by Grade and Subject or Course ................................................4 Table 2: Observed Spring 2017 Test Length by Grade and Subject or Course ...........................4 Table 3: Blueprint Percentage of Test Items Assessing Each Reporting Category in Reading ..5 Table 4: Observed Spring 2017 Percentage of Test Items Assessing Each Reporting Category
in Reading ..............................................................................................................................5 Table 5: Observed Spring 2017 Percentage of Test Items Assessing Each Reporting Category
in Reading—Accommodated Forms .....................................................................................6 Table 6: Blueprint Percentage of Test Items Assessing Each Reporting Category in
Mathematics ..........................................................................................................................6 Table 7: Observed Spring 2017 Percentage of Test Items Assessing Each Reporting Category
in Mathematics ......................................................................................................................6 Table 8: Observed Spring 2017 Percentage of Test Items Assessing Each Reporting Category
in Mathematics—Accommodated Forms ..............................................................................7 Table 9: Reporting Categories Used in Mathematics ..................................................................7 Table 10: Blueprint Percentage of Test Items Assessing Each Reporting Category in EOC ......8 Table 11: Observed Spring 2017 Percentage of Test Items Assessing Each Reporting Category
in EOC ...................................................................................................................................8 Table 12: Observed Spring 2017 Percentage of Test Items Assessing Each Reporting Category
in EOC—Accommodated Forms ..........................................................................................8 Table 13: Reporting Categories Used in EOC .............................................................................8 Table 14: Blueprint Percentage of Items by Depth of Knowledge ..............................................9 Table 15: Observed Spring 2017 Percentage of Items by Depth of Knowledge .........................9 Table 16: Blueprint Percentage of Reading Passage Types by Grade .......................................10 Table 17: Observed Spring 2017 Percentage of Reading Passage Types by Grade ..................10 Table 18: Reading Item Types and Descriptions .......................................................................15 Table 19: Mathematics and EOC Item Types and Descriptions ................................................15 Table 20: Word Counts and Readabilities of Reading Passages in FSA Reading ....................17 Table 21: Number of Reading Field Test Items by Type ..........................................................20 Table 22: Number of Mathematics and EOC Field Test Items by Type ...................................20 Table 23: Number of Item Replacements for Paper Accommodated Forms .............................29 Table 24: Test Summary Comparison for Grade 6 Mathematics Online and Paper Forms ......30
LIST OF FIGURES Figure 1: Example Item Card .....................................................................................................25 Figure 2: TCC Comparisons of Grade 6 Mathematics Online and Paper Forms ......................27 Figure 3: CSEM Comparison of Grade 6 Mathematics Online and Paper Forms .....................28
FSA 2016–2017 Technical Report: Volume 2
Annual Technical Report 1 Florida Department of Education
1. INTRODUCTION
The Florida Standards Assessments (FSA) were first administered to students during Spring 2015, replacing the Florida Comprehensive Assessment Test 2.0 (FCAT 2.0) in English Language Arts and Mathematics. The FSA was primarily delivered as an online, fixed-form assessment, making use of several technology-enhanced item types. In Spring 2017, for the English Language Arts (ELA) Reading component, paper forms were administered to students in grade 3. Paper accommodated versions were available to students in grades 4 through 10 Reading, grades 3 through 8 Mathematics, and End of Course (EOC) assessments only if such a need was indicated on a student’s Individual Education Plan (IEP) or Section 504 Plan. For the ELA Writing component, the forms were administered on paper for students in grades 4 through 7 and online for students in grades 8 through 10, with paper-based accommodations offered to students whose IEP or Section 504 Plans stipulated the need. Additional detail on the implementation of the assessments can be found in Volume 1 of this technical report.
The interpretation, usage, and validity of test scores rely heavily upon the process of developing the test itself. This volume provides details on the test development process of the FSA that contributes to the validity of the test scores. Specifically, this volume provides evidence to support the following:
• The Test Design Summary/Blueprint stipulated the range of operational items from each reporting category that were required on each form. This document guided item selection and test construction for Mathematics and ELA. The test design summaries for both Mathematics and ELA were updated during the 2015–16 school year in order to add clarifying language. The most substantial update to the test design summaries was a clarification added to the ELA Test Design Summary to better explain the scoring of the ELA assessment; the design summary now specifically states that the ELA Reading and ELA Writing components are combined to generate one single ELA scale score.
• The Test Item Specifications provided detailed guidance for item writers and reviewers to ensure that FSA items were aligned to the standards they were intended to measure. The test item specifications for both ELA and Mathematics were updated during the 2015–16 school year in order to add clarifying language. A description of the specific changes made can be found on the last page of each document.
• The item development procedures employed for FSA tests were consistent with industry standards.
• The development and maintenance of the FSA item pool plan established an item bank, in which test items cover the range of measured standards, grade-level difficulties, and cognitive complexity (e.g., depth of knowledge [DOK]) through the use of both selected-response (SR) keyed items and constructed-response (CR) machine- or hand-scored item types.
• The thorough test development process contributed to the comparability of the online tests and the paper-pencil tests.
FSA 2016–2017 Technical Report: Volume 2
Annual Technical Report 2 Florida Department of Education
2. TEST SPECIFICATIONS
Following the adoption and integration of the Florida Standards into the school curriculum, items and Test Item Specifications were developed to ensure that the tests and their items were aligned to the Standards and grade-level expectations they were intended to measure. Test Item Specifications were developed by the Florida Department of Education and content specialists.
The FSA Test Item Specifications are based on the Florida Standards and the Florida course descriptions. The Specifications are a resource that defines the content and format for the test and test items for item writers and reviewers. Each grade-level and course specifications document indicates the alignment of items with the Florida Standards and also serves to provide all stakeholders with information about the scope and function of the FSA. In addition to these general guidelines, specifications for FSA ELA Reading and Writing components also include guidelines for developing reading and writing passages and prompts, such as length, type, and complexity. In addition to the Specifications, a Test Design Summary/Blueprint for each assessment identifies the number of items, item types, item distribution across depth of knowledge, and reporting categories.
2.1 BLUEPRINT DEVELOPMENT PROCESS
The construction of the blueprints for Florida Standards Assessments (FSA) in English Language Arts (ELA) and Mathematics is evidenced by the ELA and Mathematics Test Design Summary documents found at http://www.fsassessments.org/about-the-fsas/. These documents were created using Florida’s course descriptions as the basis for the design. The course descriptions can be found on the CPALMS website at: http://www.cpalms.org/Public/search/Course.
The ELA and Mathematics content experts at the Test Development Center (TDC) conferred with content experts in the Florida Department of Education’s Bureau of Standards and Instructional Support and Just Read, Florida! office to solidify the content of the blueprints. These meetings and calls occurred in May and June 2014.
The reporting categories for the ELA Reading component were derived from the applicable “Cluster” naming convention in the Florida Standards, and the percentages of the Reporting Categories within the tests were derived from considering the number, complexity, and breadth of the Standards to be assessed. Speaking and Listening standards were folded into the Integration of Knowledge and Ideas reporting category; applicable Language standards were folded into the Craft and Structure reporting category. Guidelines for the weight of each reporting category for the FSA ELA Reading component were determined by Florida’s Technical Advisory Committee (TAC). TAC advised that to avoid “statistical noise” generated from the items scored in a small reporting category, a minimum of 15% of the total raw score points should be derived from each reporting category.
The reporting categories for Mathematics were also derived from the “domain” naming convention in the Florida Standards. Like ELA, if a Mathematics domain had too few standards, two or more domains might be combined to make the reporting category 15% of the raw score points of that grade’s assessment.
FSA 2016–2017 Technical Report: Volume 2
Annual Technical Report 3 Florida Department of Education
2.2 TARGET BLUEPRINTS
Test blueprints provided the following guidelines:
• Length of the test (duration and number of items)• Content areas to be covered and the acceptable range of items within each content area or
reporting category• Acceptable range of item difficulty for the specified grade level• Approximate number of field test items, if applicable• Descriptions of test item types
This section provides only a summary of the blueprints. Detailed blueprints for each content level are presented in Appendix A for ELA and Appendix B for Mathematics and EOCs.
In all grades and subjects, the assessments were administered as fixed-form assessments. The Grade 3 ELA Reading component was administered on paper, while the grades 4 through 10 ELA Reading component, grades 3 through 8 Mathematics, and End of Course (EOC) assessments (Algebra 1, Algebra 2, and Geometry) were administered online. Additionally, ELA Writing was administered on paper for grades 4 through 7, and online for grades 8 through 10. For grades and subjects testing online, paper-based accommodations were provided if indicated by a student’s IEP or Section 504 Plan.
In grades 4 through 10, the FSA ELA test includes two components, which are combined to provide a whole-test FSA ELA scale score:
1. A text-based Writing component in which students respond to one writing task
2. A reading, language, and listening component in which students respond to texts andmultimedia content
Writing and Reading component item responses were combined such that the data were calibrated concurrently and subsequently to form an overall English Language Arts (ELA) score. In this document, the term ELA is used when referring to the combined Reading and Writing assessments; Reading is used when referring to only the Reading test form or items; and Writing is used when referring only to the text-based Writing task.
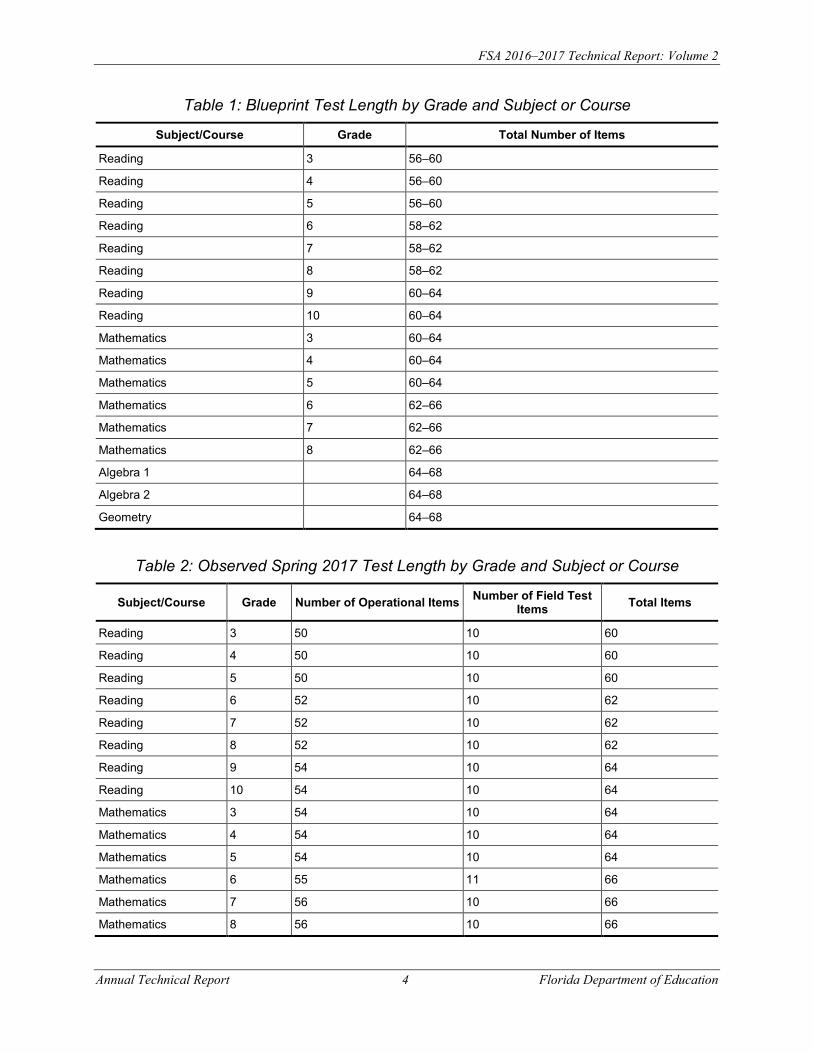
Table 1 displays the blueprint for total test length by grade and subject or course. Each year, approximately six to 10 items on all tests are field test items and are not used to calculate a student’s score. Table 2 displays the number of operational and field test items on the spring 2017 forms. Writing items are not included in the item counts listed for ELA tests.
FSA 2016–2017 Technical Report: Volume 2
Annual Technical Report 4 Florida Department of Education
Table 1: Blueprint Test Length by Grade and Subject or Course
Subject/Course Grade Total Number of Items
Reading 3 56–60
Reading 4 56–60
Reading 5 56–60
Reading 6 58–62
Reading 7 58–62
Reading 8 58–62
Reading 9 60–64
Reading 10 60–64
Mathematics 3 60–64
Mathematics 4 60–64
Mathematics 5 60–64
Mathematics 6 62–66
Mathematics 7 62–66
Mathematics 8 62–66
Algebra 1 blank 64–68
Algebra 2 blank 64–68
Geometry blank 64–68
Table 2: Observed Spring 2017 Test Length by Grade and Subject or Course
Subject/Course Grade Number of Operational Items Number of Field Test Items Total Items
Reading 3 50 10 60
Reading 4 50 10 60
Reading 5 50 10 60
Reading 6 52 10 62
Reading 7 52 10 62
Reading 8 52 10 62
Reading 9 54 10 64
Reading 10 54 10 64
Mathematics 3 54 10 64
Mathematics 4 54 10 64
Mathematics 5 54 10 64
Mathematics 6 55 11 66
Mathematics 7 56 10 66
Mathematics 8 56 10 66
FSA 2016–2017 Technical Report: Volume 2
Annual Technical Report 5 Florida Department of Education
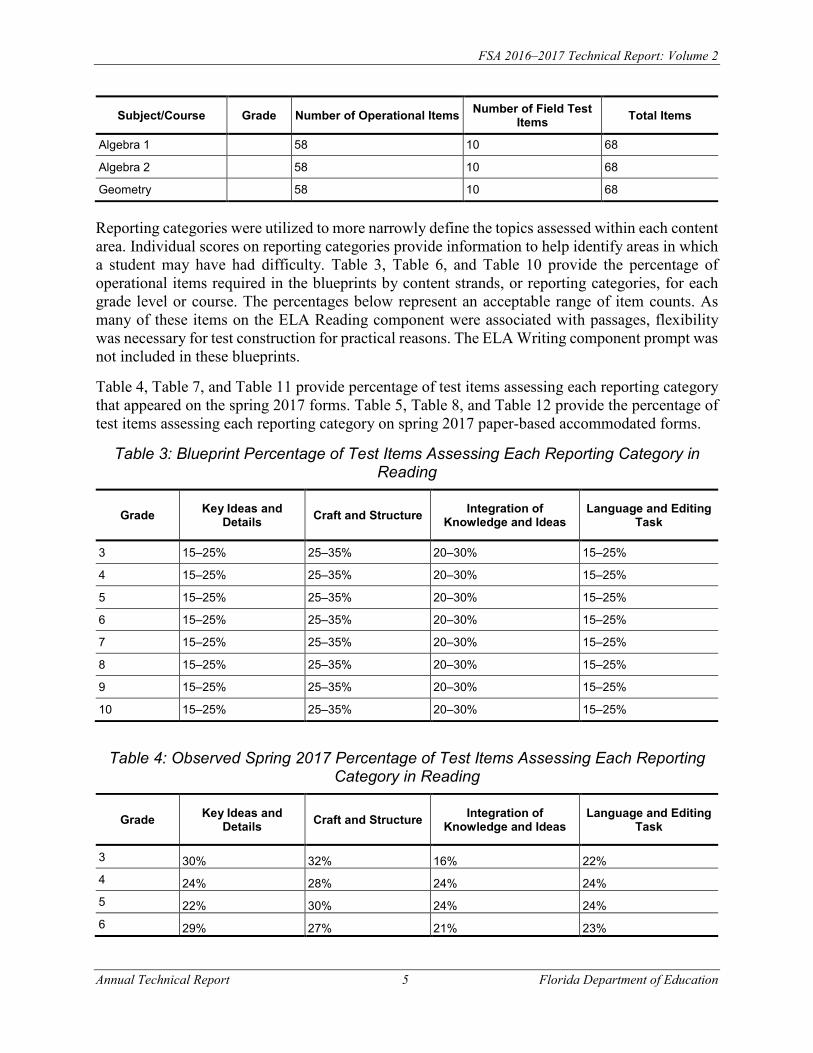
Subject/Course Grade Number of Operational Items Number of Field Test Items Total Items
Algebra 1 58 10 68
Algebra 2 58 10 68
Geometry 58 10 68
Reporting categories were utilized to more narrowly define the topics assessed within each content area. Individual scores on reporting categories provide information to help identify areas in which a student may have had difficulty. Table 3, Table 6, and Table 10 provide the percentage of operational items required in the blueprints by content strands, or reporting categories, for each grade level or course. The percentages below represent an acceptable range of item counts. As many of these items on the ELA Reading component were associated with passages, flexibility was necessary for test construction for practical reasons. The ELA Writing component prompt was not included in these blueprints.
Table 4, Table 7, and Table 11 provide percentage of test items assessing each reporting category that appeared on the spring 2017 forms. Table 5, Table 8, and Table 12 provide the percentage of test items assessing each reporting category on spring 2017 paper-based accommodated forms.
Table 3: Blueprint Percentage of Test Items Assessing Each Reporting Category in Reading
Grade Key Ideas and Details Craft and Structure Integration of
Knowledge and Ideas Language and Editing
Task
3 15–25% 25–35% 20–30% 15–25%
4 15–25% 25–35% 20–30% 15–25%
5 15–25% 25–35% 20–30% 15–25%
6 15–25% 25–35% 20–30% 15–25%
7 15–25% 25–35% 20–30% 15–25%
8 15–25% 25–35% 20–30% 15–25%
9 15–25% 25–35% 20–30% 15–25%
10 15–25% 25–35% 20–30% 15–25%
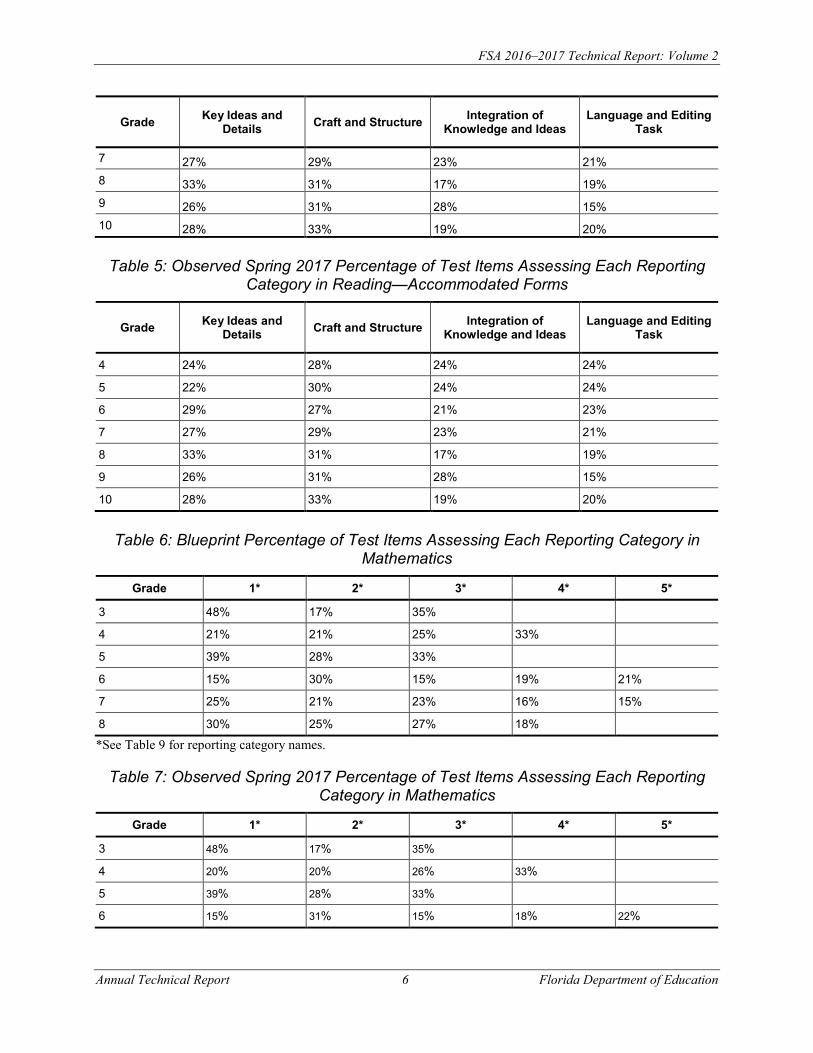
Table 4: Observed Spring 2017 Percentage of Test Items Assessing Each Reporting Category in Reading
Grade Key Ideas and Details Craft and Structure Integration of
Knowledge and Ideas Language and Editing
Task
3 30% 32% 16% 22% 4 24% 28% 24% 24% 5 22% 30% 24% 24% 6 29% 27% 21% 23%
blank
blank
blank
FSA 2016–2017 Technical Report: Volume 2
Annual Technical Report 6 Florida Department of Education
Grade Key Ideas and Details Craft and Structure Integration of
Knowledge and Ideas Language and Editing
Task
7 27% 29% 23% 21% 8 33% 31% 17% 19% 9 26% 31% 28% 15% 10 28% 33% 19% 20%
Table 5: Observed Spring 2017 Percentage of Test Items Assessing Each Reporting Category in Reading—Accommodated Forms
Grade Key Ideas and Details Craft and Structure Integration of
Knowledge and Ideas Language and Editing
Task
4 24% 28% 24% 24%
5 22% 30% 24% 24%
6 29% 27% 21% 23%
7 27% 29% 23% 21%
8 33% 31% 17% 19%
9 26% 31% 28% 15%
10 28% 33% 19% 20%
Table 6: Blueprint Percentage of Test Items Assessing Each Reporting Category in Mathematics
Grade 1* 2* 3* 4* 5*
3 48% 17% 35% blank blank
4 21% 21% 25% 33% Blank
5 39% 28% 33% blank blank
6 15% 30% 15% 19% 21%
7 25% 21% 23% 16% 15%
8 30% 25% 27% 18% blank
*See Table 9 for reporting category names.
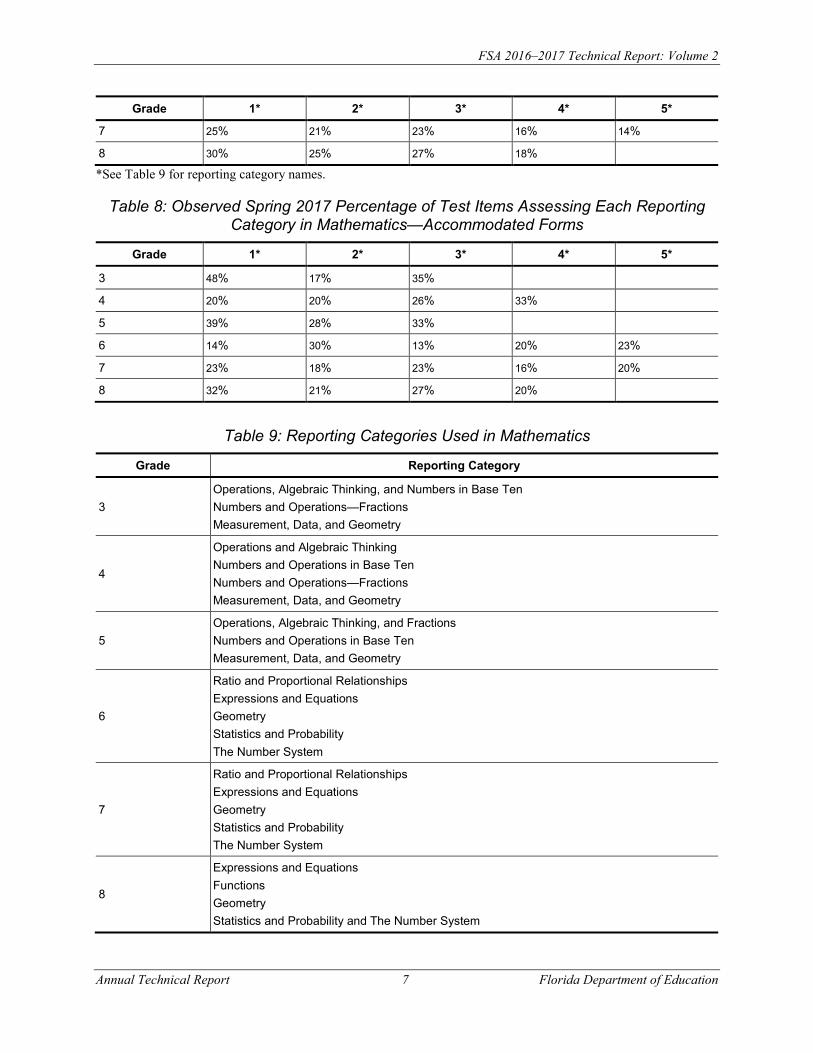
Table 7: Observed Spring 2017 Percentage of Test Items Assessing Each ReportingCategory in Mathematics
Grade 1* 2* 3* 4* 5*
3 48% 17% 35% blank blank
4 20% 20% 26% 33% blank
5 39% 28% 33% blank blank
6 15% 31% 15% 18% 22%
FSA 2016–2017 Technical Report: Volume 2
Annual Technical Report 7 Florida Department of Education
Grade 1* 2* 3* 4* 5*
7 25% 21% 23% 16% 14%
8 30% 25% 27% 18% blank
*See Table 9 for reporting category names.
Table 8: Observed Spring 2017 Percentage of Test Items Assessing Each ReportingCategory in Mathematics—Accommodated Forms
Grade 1* 2* 3* 4* 5*
3 48% 17% 35% blank blank
4 20% 20% 26% 33% blank
5 39% 28% 33% blank blank
6 14% 30% 13% 20% 23%
7 23% 18% 23% 16% 20%
8 32% 21% 27% 20% blank
Table 9: Reporting Categories Used in Mathematics
Grade Reporting Category
3 Operations, Algebraic Thinking, and Numbers in Base Ten Numbers and Operations—Fractions Measurement, Data, and Geometry
4
Operations and Algebraic Thinking Numbers and Operations in Base Ten Numbers and Operations—Fractions Measurement, Data, and Geometry
5 Operations, Algebraic Thinking, and Fractions Numbers and Operations in Base Ten Measurement, Data, and Geometry
6
Ratio and Proportional Relationships Expressions and Equations Geometry Statistics and Probability The Number System
7
Ratio and Proportional Relationships Expressions and Equations Geometry Statistics and Probability The Number System
8
Expressions and Equations Functions Geometry Statistics and Probability and The Number System
FSA 2016–2017 Technical Report: Volume 2
Annual Technical Report 8 Florida Department of Education
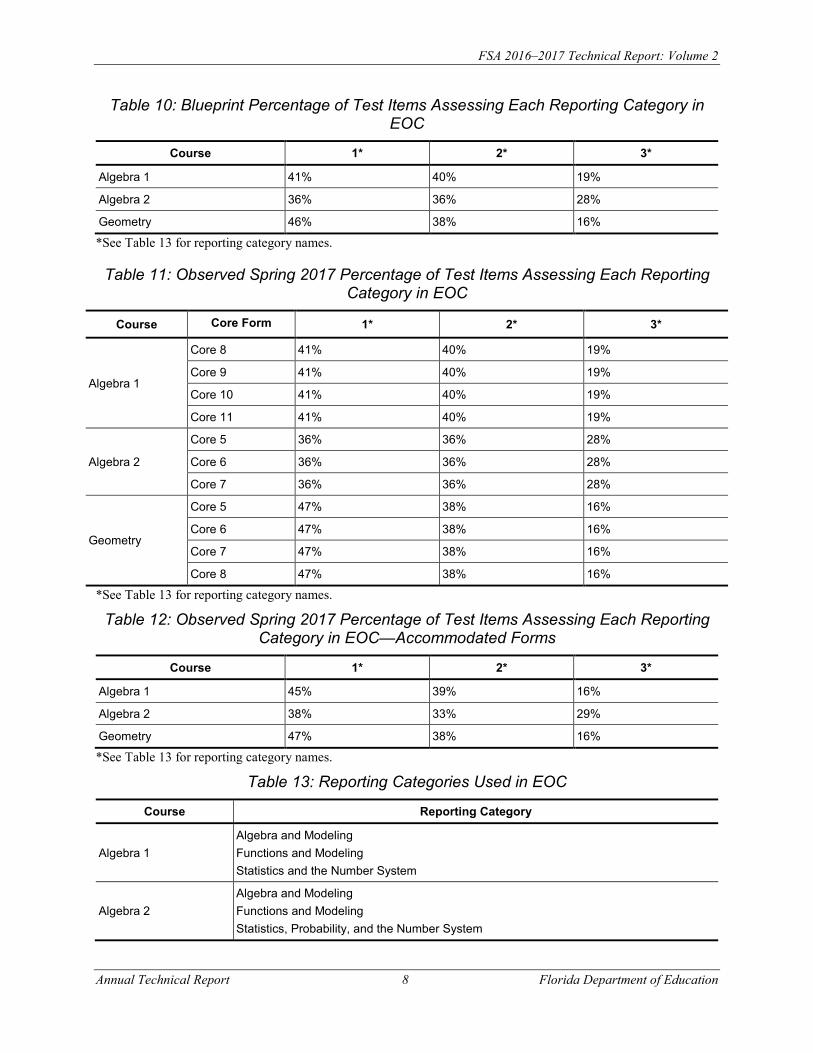
Table 10: Blueprint Percentage of Test Items Assessing Each Reporting Category in EOC
Course 1* 2* 3*
Algebra 1 41% 40% 19%
Algebra 2 36% 36% 28%
Geometry 46% 38% 16%
*See Table 13 for reporting category names.
Table 11: Observed Spring 2017 Percentage of Test Items Assessing Each ReportingCategory in EOC
Course Core Form 1* 2* 3*
Algebra 1
Core 8 41% 40% 19%
Core 9 41% 40% 19%
Core 10 41% 40% 19%
Core 11 41% 40% 19%
Algebra 2
Core 5 36% 36% 28%
Core 6 36% 36% 28%
Core 7 36% 36% 28%
Geometry
Core 5 47% 38% 16%
Core 6 47% 38% 16%
Core 7 47% 38% 16%
Core 8 47% 38% 16%
*See Table 13 for reporting category names.
Table 12: Observed Spring 2017 Percentage of Test Items Assessing Each ReportingCategory in EOC—Accommodated Forms
Course 1* 2* 3*
Algebra 1 45% 39% 16%
Algebra 2 38% 33% 29%
Geometry 47% 38% 16%
*See Table 13 for reporting category names.
Table 13: Reporting Categories Used in EOC
Course Reporting Category
Algebra 1 Algebra and Modeling Functions and Modeling Statistics and the Number System
Algebra 2 Algebra and Modeling Functions and Modeling Statistics, Probability, and the Number System
FSA 2016–2017 Technical Report: Volume 2
Annual Technical Report 9 Florida Department of Education
Course Reporting Category
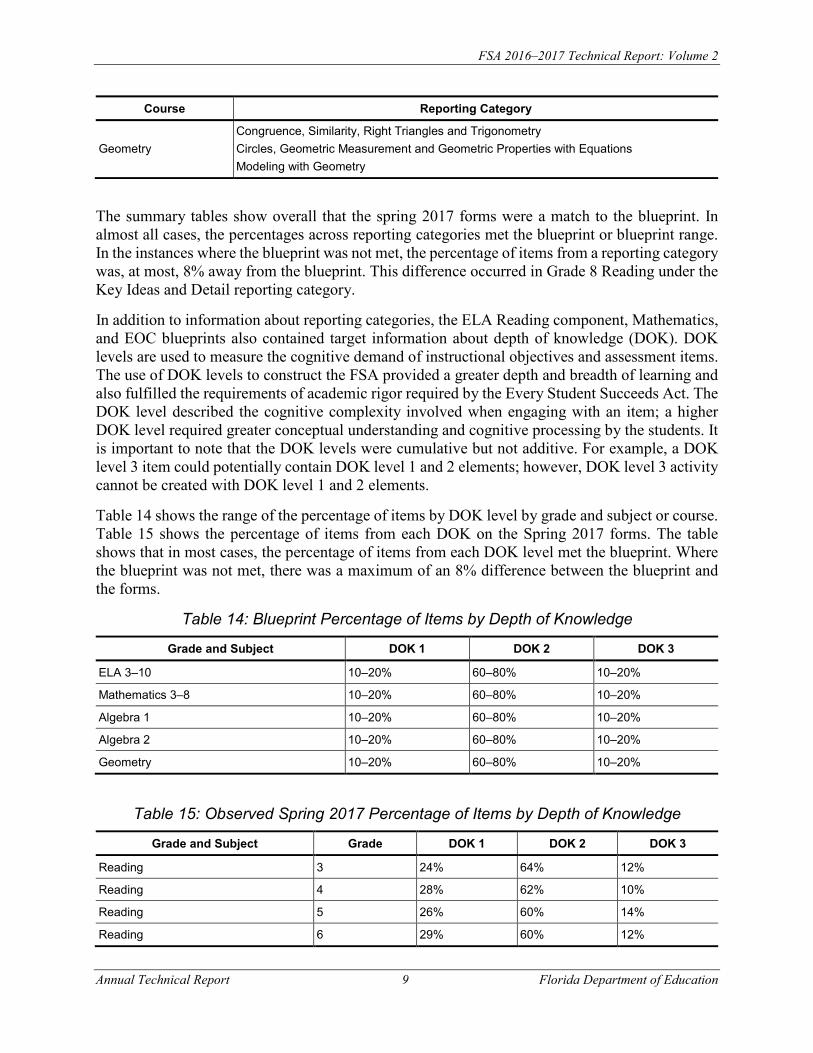
Geometry Congruence, Similarity, Right Triangles and Trigonometry Circles, Geometric Measurement and Geometric Properties with Equations Modeling with Geometry
The summary tables show overall that the spring 2017 forms were a match to the blueprint. In almost all cases, the percentages across reporting categories met the blueprint or blueprint range. In the instances where the blueprint was not met, the percentage of items from a reporting category was, at most, 8% away from the blueprint. This difference occurred in Grade 8 Reading under the Key Ideas and Detail reporting category.
In addition to information about reporting categories, the ELA Reading component, Mathematics, and EOC blueprints also contained target information about depth of knowledge (DOK). DOK levels are used to measure the cognitive demand of instructional objectives and assessment items. The use of DOK levels to construct the FSA provided a greater depth and breadth of learning and also fulfilled the requirements of academic rigor required by the Every Student Succeeds Act. The DOK level described the cognitive complexity involved when engaging with an item; a higher DOK level required greater conceptual understanding and cognitive processing by the students. It is important to note that the DOK levels were cumulative but not additive. For example, a DOK level 3 item could potentially contain DOK level 1 and 2 elements; however, DOK level 3 activity cannot be created with DOK level 1 and 2 elements.
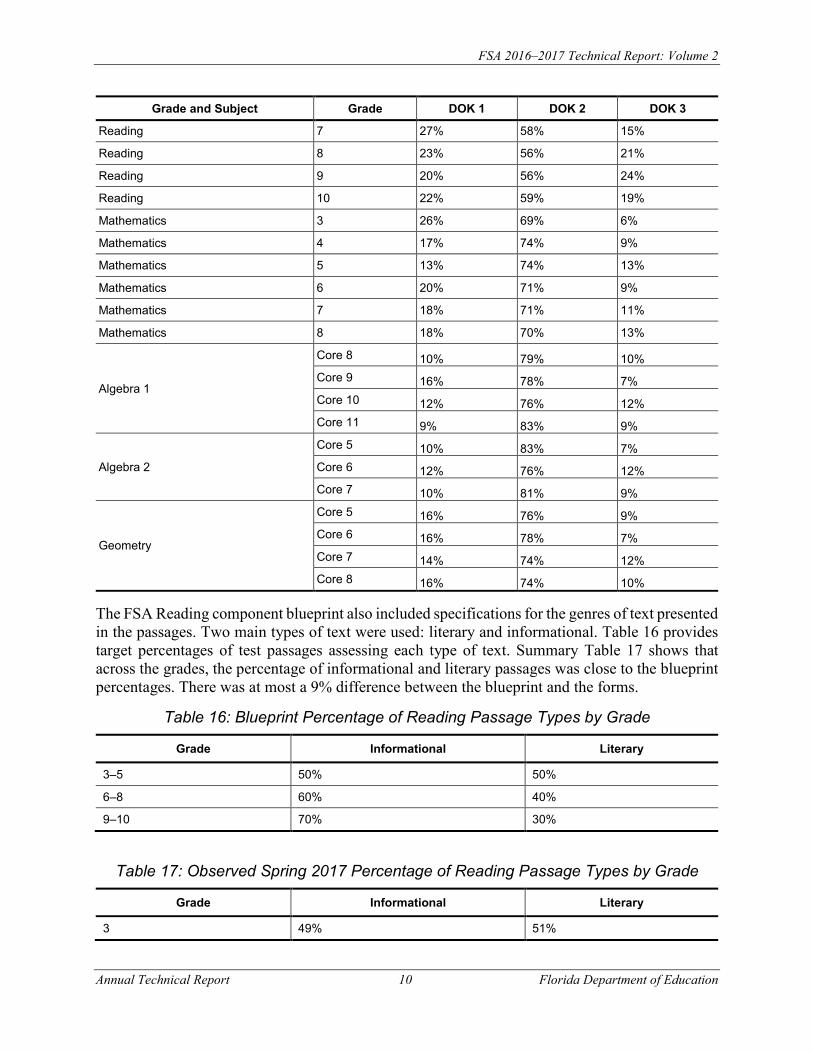
Table 14 shows the range of the percentage of items by DOK level by grade and subject or course. Table 15 shows the percentage of items from each DOK on the Spring 2017 forms. The table shows that in most cases, the percentage of items from each DOK level met the blueprint. Where the blueprint was not met, there was a maximum of an 8% difference between the blueprint and the forms.
Table 14: Blueprint Percentage of Items by Depth of Knowledge
Grade and Subject DOK 1 DOK 2 DOK 3
ELA 3–10 10–20% 60–80% 10–20%
Mathematics 3–8 10–20% 60–80% 10–20%
Algebra 1 10–20% 60–80% 10–20%
Algebra 2 10–20% 60–80% 10–20%
Geometry 10–20% 60–80% 10–20%
Table 15: Observed Spring 2017 Percentage of Items by Depth of Knowledge Grade and Subject Grade DOK 1 DOK 2 DOK 3
Reading 3 24% 64% 12%
Reading 4 28% 62% 10%
Reading 5 26% 60% 14%
Reading 6 29% 60% 12%
FSA 2016–2017 Technical Report: Volume 2
Annual Technical Report 10 Florida Department of Education
Grade and Subject Grade DOK 1 DOK 2 DOK 3
Reading 7 27% 58% 15%
Reading 8 23% 56% 21%
Reading 9 20% 56% 24%
Reading 10 22% 59% 19%
Mathematics 3 26% 69% 6%
Mathematics 4 17% 74% 9%
Mathematics 5 13% 74% 13%
Mathematics 6 20% 71% 9%
Mathematics 7 18% 71% 11%
Mathematics 8 18% 70% 13%
Algebra 1
Core 8 10% 79% 10% Core 9 16% 78% 7% Core 10 12% 76% 12% Core 11 9% 83% 9%
Algebra 2
Core 5 10% 83% 7% Core 6 12% 76% 12% Core 7 10% 81% 9%
Geometry
Core 5 16% 76% 9% Core 6 16% 78% 7% Core 7 14% 74% 12% Core 8 16% 74% 10%
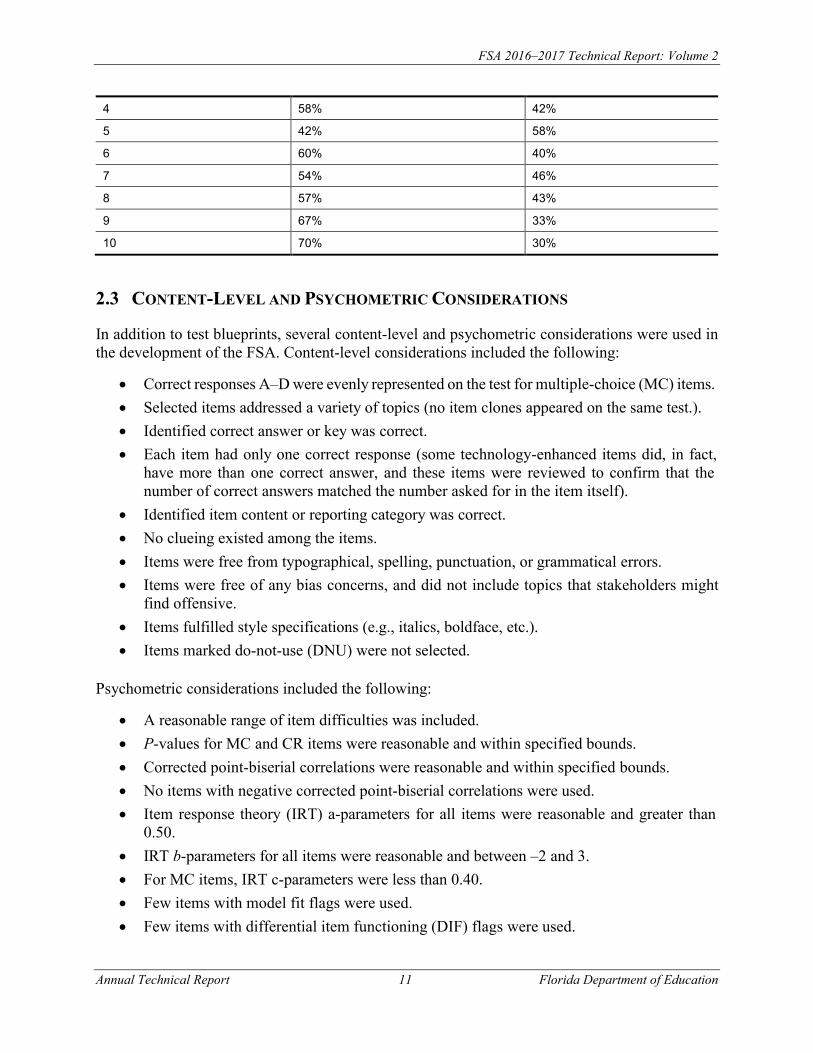
The FSA Reading component blueprint also included specifications for the genres of text presented in the passages. Two main types of text were used: literary and informational. Table 16 provides target percentages of test passages assessing each type of text. Summary Table 17 shows that across the grades, the percentage of informational and literary passages was close to the blueprint percentages. There was at most a 9% difference between the blueprint and the forms.
Table 16: Blueprint Percentage of Reading Passage Types by Grade
Grade Informational Literary
3–5 50% 50%
6–8 60% 40%
9–10 70% 30%
Table 17: Observed Spring 2017 Percentage of Reading Passage Types by Grade
Grade Informational Literary
3 49% 51%
FSA 2016–2017 Technical Report: Volume 2
Annual Technical Report 11 Florida Department of Education
4 58% 42%
5 42% 58%
6 60% 40%
7 54% 46%
8 57% 43%
9 67% 33%
10 70% 30%
2.3 CONTENT-LEVEL AND PSYCHOMETRIC CONSIDERATIONS
In addition to test blueprints, several content-level and psychometric considerations were used in the development of the FSA. Content-level considerations included the following:
• Correct responses A–D were evenly represented on the test for multiple-choice (MC) items.• Selected items addressed a variety of topics (no item clones appeared on the same test.).• Identified correct answer or key was correct.• Each item had only one correct response (some technology-enhanced items did, in fact,
have more than one correct answer, and these items were reviewed to confirm that the number of correct answers matched the number asked for in the item itself).
• Identified item content or reporting category was correct.• No clueing existed among the items.• Items were free from typographical, spelling, punctuation, or grammatical errors.• Items were free of any bias concerns, and did not include topics that stakeholders might
find offensive.• Items fulfilled style specifications (e.g., italics, boldface, etc.).• Items marked do-not-use (DNU) were not selected.
Psychometric considerations included the following:
• A reasonable range of item difficulties was included.• P-values for MC and CR items were reasonable and within specified bounds.• Corrected point-biserial correlations were reasonable and within specified bounds.• No items with negative corrected point-biserial correlations were used.• Item response theory (IRT) a-parameters for all items were reasonable and greater than
0.50.• IRT b-parameters for all items were reasonable and between –2 and 3.• For MC items, IRT c-parameters were less than 0.40.• Few items with model fit flags were used.• Few items with differential item functioning (DIF) flags were used.
FSA 2016–2017 Technical Report: Volume 2
Annual Technical Report 12 Florida Department of Education
More information about p-values, corrected point-biserial correlations, IRT parameters, and DIF calculations can be found in Volume 1. The Spring 2017 FSA was calibrated and equated to the Spring 2015 baseline scale. More details about calibration, equating, and scoring can be found in Volume 1.
FSA 2016–2017 Technical Report: Volume 2
Annual Technical Report 13 Florida Department of Education
3. ITEM DEVELOPMENT PROCEDURES
The item development procedures employed by AIR for the FSA tests were consistent with industry practice. Just as the development of Florida’s content and performance standards was an open, consensus-driven process, the development of test items and stimuli to measure those constructs was grounded in a similar philosophy.
Item development began with the following guidelines: the FSA item specifications; the Florida Standards; language accessibility, bias, and sensitivity guidelines; editorial style guidelines; and the principles of universal design. These guidelines ensured that each aspect of a Florida item was relevant to the measured construct and was unlikely to distract or confuse examinees. In addition, these guidelines helped ensure that the wording, required background knowledge, and other aspects of the item were familiar across identifiable groups.
The principles of universal design of assessments mandate that tests are designed to minimize the impact of construct-irrelevant factors in the assessment of student achievement, removing barriers to access for the widest range of students possible. The following seven principles of universal design, as clearly defined by Thompson, Johnstone, and Thurlow (2002), were applied to the FSA development:
• Inclusive assessment population• Precisely defined constructs• Accessible, non-biased items• Amenable to accommodations• Simple, clear, and intuitive instructions and procedures• Maximum readability and comprehensibility• Maximum legibility
AIR applied these universal design principles in the development of all test materials, including tasks, items, and manipulatives. Test development specialists receive extensive training in item development. At every step of the review process, adherence to the principles of universal design was confirmed.
In terms of software that supports the item development process, AIR’s Item Tracking System (ITS) served as the technology platform to efficiently carry out any item and test development process. ITS facilitated the creation of the item banks, item writing and revision, cataloging of changes and comments, and exporting of accurate documents (items and passages). ITS enforced a structured review process, ensuring that every item that was written or imported underwent the appropriate sequence of reviews and signoffs; ITS archived every version of each item along with reviewer comments throughout the process. ITS also provided sophisticated pool management features that increased item quality by providing real-time, detailed item inventories and item use histories. Because ITS had the capabilities to be configured to import items in multiple formats (e.g., Word, Excel, XML), AIR was able to import items from multiple sources. To support online test delivery, ITS had a unique web preview module that displayed items exactly as they were also presented to students, using exactly the same program code used in the AIR’s test delivery system
FSA 2016–2017 Technical Report: Volume 2
Annual Technical Report 14 Florida Department of Education
(TDS). An online test does not have a blueline (print approval) process like a paper test, and this feature provided an item-by-item blueline capability.
The next section describes the item sources for FSA, and the subsequent sections outline the procedure used for the development and review of new items and the alignment of existing items.
3.1 SUMMARY OF ITEM SOURCES
Items for the spring 2017 FSA came from multiple sources as outlined below.
Student Assessment of Growth and Excellence (SAGE)
AIR, on behalf of the Florida Department of Education (FDOE), negotiated a contract with the State of Utah to use test items from its Student Assessment of Growth and Excellence (SAGE) bank provisionally until a Florida-specific item bank could be developed. Compared to Spring 2015, the use of SAGE items on Spring 2017 forms was significantly less. For all of grade 3 Reading and Grades 3 and 4 Mathematics tests, SAGE items were used as core operational items and as anchor items to equate back to the Spring 2015 baseline scale. For grade 4 Reading, SAGE items were only used as anchor items to equate back to the Spring 2015 baseline scale, and these items were not used to calculate student scores. Only those items that aligned to the FSA reporting categories and that met statistical criteria were used. More information about SAGE item selection can be found in Section 4 of this volume.
New Items Written by AIR
New field test items were also included in spring 2017 forms, and these items will be used on future FSA test forms. Field test items came from two sources: Items were written either for the Florida-specific item bank (denoted as FSA bank items) or for an AIR item bank to be shared with other states (denoted as AIR Core items). Items were written by AIR content experts or by trained partners. All items undergo a rigorous process of preliminary, editorial, and senior review by AIR and by FDOE’s Test Development Center (TDC) content experts, who followed appropriate alignment, content, and style specifications. All of these items were also reviewed by panels of Florida educators and citizens for content accuracy, and to ensure that the test items were fair, unbiased, and included topics acceptable to the Florida public. This review is described in more detail in Section 3.3.1.
Next-Generation Sunshine State Standards (NGSSS) Assessment Items
On a limited basis, NGSSS items that align to the Florida Standards were used on Algebra 1 and Geometry forms. These items were previously tested in Florida, and their item statistics were updated based on 2017 performance before being used in scoring.
3.2 ITEM TYPES
One of the important features of online FSA is the administration of technology-enhanced items. Generally referred to as Machine-Scored Constructed Response (MSCR), this includes a wide range of item types. MSCR items require students to interact with the test content to select, construct, and/or support their answers.
FSA 2016–2017 Technical Report: Volume 2
Annual Technical Report 15 Florida Department of Education
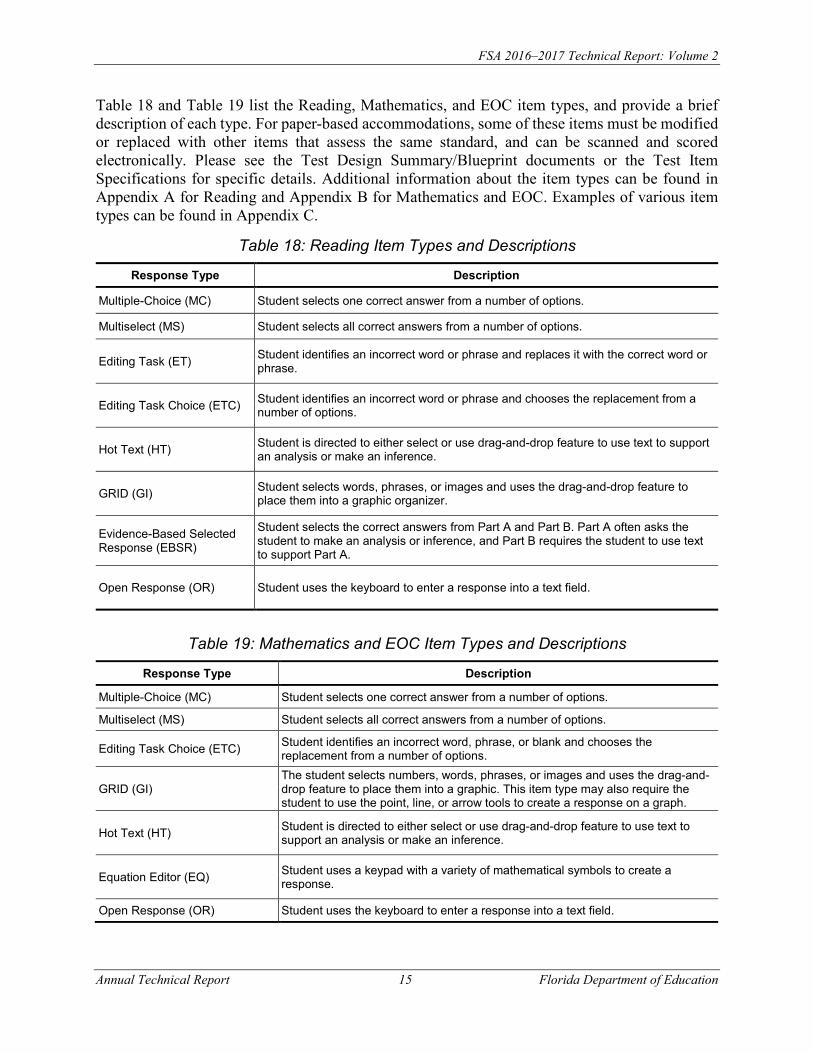
Table 18 and Table 19 list the Reading, Mathematics, and EOC item types, and provide a brief description of each type. For paper-based accommodations, some of these items must be modified or replaced with other items that assess the same standard, and can be scanned and scored electronically. Please see the Test Design Summary/Blueprint documents or the Test Item Specifications for specific details. Additional information about the item types can be found in Appendix A for Reading and Appendix B for Mathematics and EOC. Examples of various item types can be found in Appendix C.
Table 18: Reading Item Types and Descriptions
Response Type Description
Multiple-Choice (MC) Student selects one correct answer from a number of options.
Multiselect (MS) Student selects all correct answers from a number of options.
Editing Task (ET) Student identifies an incorrect word or phrase and replaces it with the correct word or phrase.
Editing Task Choice (ETC) Student identifies an incorrect word or phrase and chooses the replacement from a number of options.
Hot Text (HT) Student is directed to either select or use drag-and-drop feature to use text to support an analysis or make an inference.
GRID (GI) Student selects words, phrases, or images and uses the drag-and-drop feature to place them into a graphic organizer.
Evidence-Based Selected Response (EBSR)
Student selects the correct answers from Part A and Part B. Part A often asks the student to make an analysis or inference, and Part B requires the student to use text to support Part A.
Open Response (OR) Student uses the keyboard to enter a response into a text field.
Table 19: Mathematics and EOC Item Types and Descriptions
Response Type Description
Multiple-Choice (MC) Student selects one correct answer from a number of options.
Multiselect (MS) Student selects all correct answers from a number of options.
Editing Task Choice (ETC) Student identifies an incorrect word, phrase, or blank and chooses the replacement from a number of options.
GRID (GI) The student selects numbers, words, phrases, or images and uses the drag-and-drop feature to place them into a graphic. This item type may also require the student to use the point, line, or arrow tools to create a response on a graph.
Hot Text (HT) Student is directed to either select or use drag-and-drop feature to use text to support an analysis or make an inference.
Equation Editor (EQ) Student uses a keypad with a variety of mathematical symbols to create a response.
Open Response (OR) Student uses the keyboard to enter a response into a text field.
FSA 2016–2017 Technical Report: Volume 2
Annual Technical Report 16 Florida Department of Education
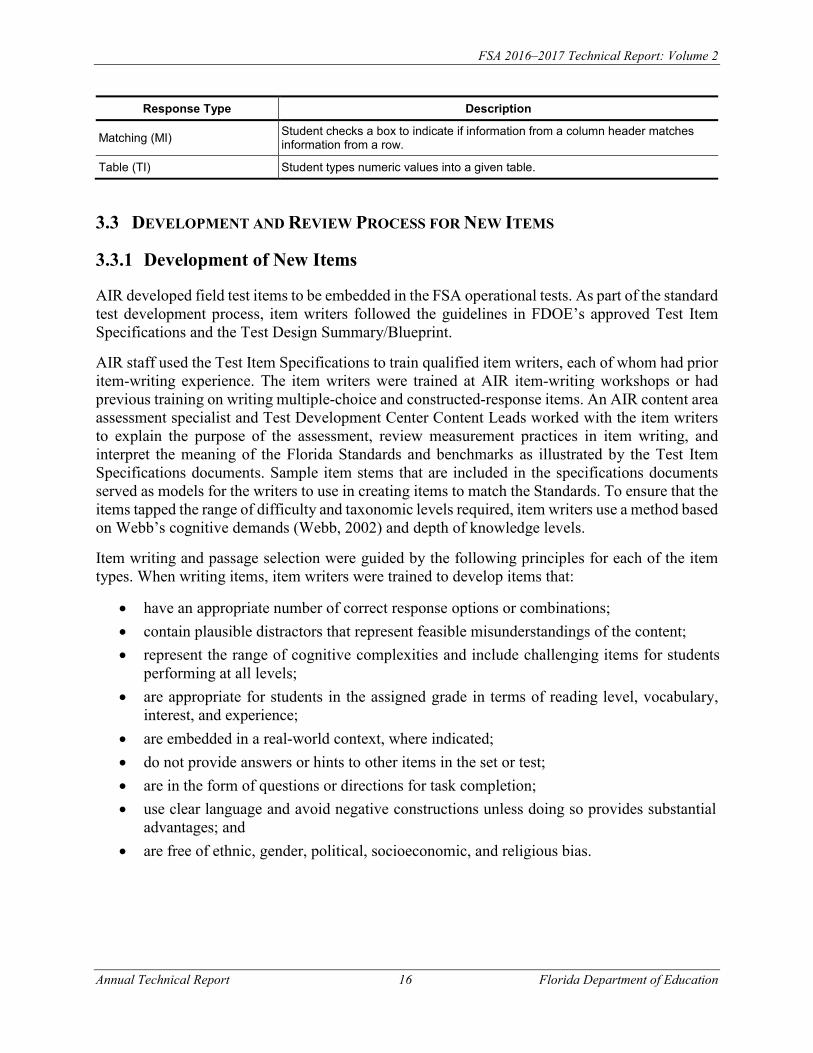
Response Type Description
Matching (MI) Student checks a box to indicate if information from a column header matches information from a row.
Table (TI) Student types numeric values into a given table.
3.3 DEVELOPMENT AND REVIEW PROCESS FOR NEW ITEMS
3.3.1 Development of New Items
AIR developed field test items to be embedded in the FSA operational tests. As part of the standard test development process, item writers followed the guidelines in FDOE’s approved Test Item Specifications and the Test Design Summary/Blueprint.
AIR staff used the Test Item Specifications to train qualified item writers, each of whom had prior item-writing experience. The item writers were trained at AIR item-writing workshops or had previous training on writing multiple-choice and constructed-response items. An AIR content area assessment specialist and Test Development Center Content Leads worked with the item writers to explain the purpose of the assessment, review measurement practices in item writing, and interpret the meaning of the Florida Standards and benchmarks as illustrated by the Test Item Specifications documents. Sample item stems that are included in the specifications documents served as models for the writers to use in creating items to match the Standards. To ensure that the items tapped the range of difficulty and taxonomic levels required, item writers use a method based on Webb’s cognitive demands (Webb, 2002) and depth of knowledge levels.
Item writing and passage selection were guided by the following principles for each of the item types. When writing items, item writers were trained to develop items that:
• have an appropriate number of correct response options or combinations;• contain plausible distractors that represent feasible misunderstandings of the content;• represent the range of cognitive complexities and include challenging items for students
performing at all levels;• are appropriate for students in the assigned grade in terms of reading level, vocabulary,
interest, and experience;• are embedded in a real-world context, where indicated;• do not provide answers or hints to other items in the set or test;• are in the form of questions or directions for task completion;• use clear language and avoid negative constructions unless doing so provides substantial
advantages; and • are free of ethnic, gender, political, socioeconomic, and religious bias.
FSA 2016–2017 Technical Report: Volume 2
Annual Technical Report 17 Florida Department of Education
Similarly, Reading passages should:
• represent literary (fiction), informational (nonfiction), multimedia (audio and audio-visual), and practical selections (e.g., nontraditional pieces, including tables, charts,glossaries, indexes);
• provide students with the opportunity to interact with complex, authentic texts that mayemploy a variety of different structures;
• include multimedia and audio elements when appropriate;
• be of high interest and appropriate readability for the grade level;
• be of appropriate length for the grade level;
• include topics that are in alignment with sensitivity guidelines;
• be free of ethnic, gender, political, and religious bias;
• not provide answers or hints to other items in the test; and
• include real-world texts (consumer or workplace documents, public documents such asletters to the editor, newspaper and magazine articles, thesaurus entries) to the extentpossible.
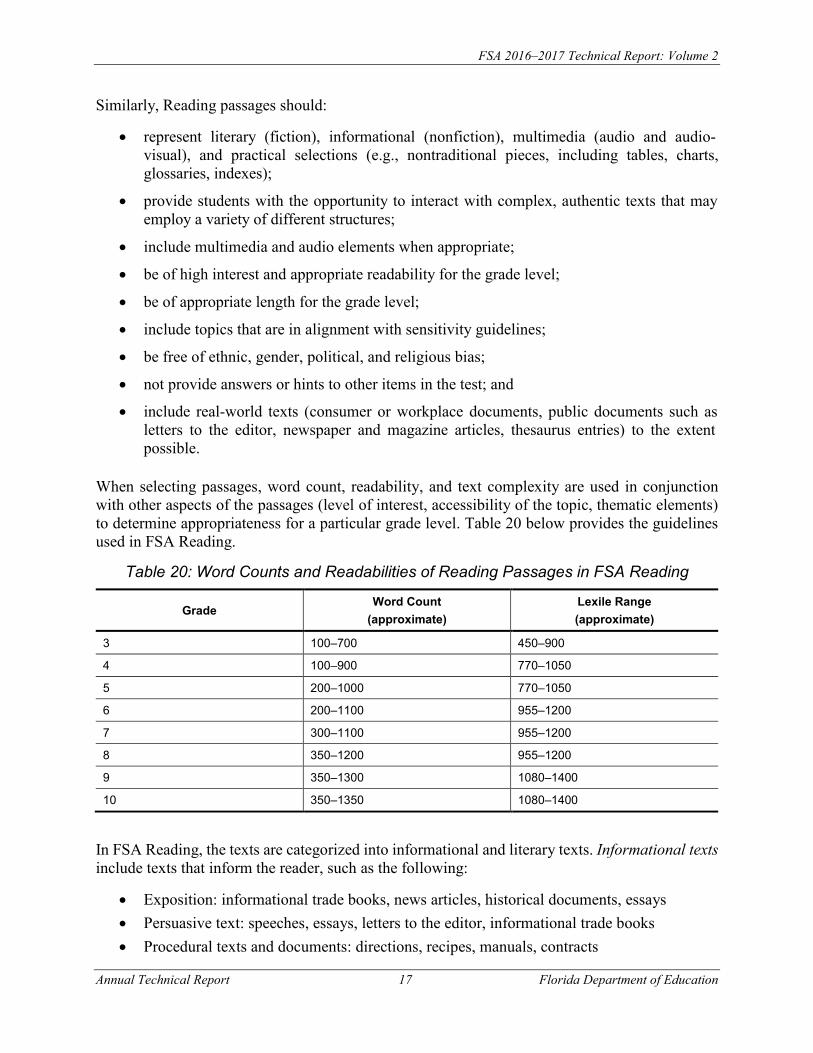
When selecting passages, word count, readability, and text complexity are used in conjunction with other aspects of the passages (level of interest, accessibility of the topic, thematic elements) to determine appropriateness for a particular grade level. Table 20 below provides the guidelines used in FSA Reading.
Table 20: Word Counts and Readabilities of Reading Passages in FSA Reading
Grade Word Count
(approximate) Lexile Range (approximate)
3 100–700 450–900
4 100–900 770–1050
5 200–1000 770–1050
6 200–1100 955–1200
7 300–1100 955–1200
8 350–1200 955–1200
9 350–1300 1080–1400
10 350–1350 1080–1400
In FSA Reading, the texts are categorized into informational and literary texts. Informational texts include texts that inform the reader, such as the following:
• Exposition: informational trade books, news articles, historical documents, essays• Persuasive text: speeches, essays, letters to the editor, informational trade books• Procedural texts and documents: directions, recipes, manuals, contracts
FSA 2016–2017 Technical Report: Volume 2
Annual Technical Report 18 Florida Department of Education
Literary texts include texts that enable the reader to explore other people’s experiences or to simply read for pleasure, such as the following:
• Narrative fiction: historical and contemporary fiction, science fiction, folktales, legends,and myths and fables
• Literary nonfiction: personal essay, biography/autobiography, memoir, and speeches
• Poetry: lyrical, narrative, and epic works; sonnets, odes, and ballads
Department Item Review and Approval
After internal review, the sets of items were reviewed by content specialists at the TDC. If needed, AIR and TDC content staff discussed requested revisions, ensuring that all items appropriately measured the Florida Standards. The items were then revised by AIR and brought to Florida bias, sensitivity, and content committees for review. After any final adjustments were made to the items, the TDC provided a decision for each item: Accept as Appears, Accept as Revised, or Reject. Items that were approved by the TDC were subsequently web-approved and placed on field test forms.
Committee Review of New Items
All items generated for use on Florida statewide assessments were required to pass a series of rigorous reviews before they could appear as field test items on operational test forms. The items were reviewed by two committees—the Bias and Sensitivity Committee and the Content Item Review Committee.
The Bias and Sensitivity Committee reviewed items for potential bias and controversial content. This committee consisted of Florida reviewers who were selected to ensure geographic and ethnic diversity. The committee ensured that items:
• present racial, ethnic, and cultural groups in a positive light;• do not contain controversial, offensive, or potentially upsetting content;• avoid content familiar only to specific groups of students because of race or ethnicity, class,
or geographic location;• aid in the elimination of stereotypes; and• avoid words or phrases that have multiple meanings.
TDC and AIR reviewed the Bias and Sensitivity Committee feedback and conveyed any issues to the attention of the Content Item Review Committee.
The Content Item Review Committee consisted of Florida classroom teachers or content specialists by grade for each subject area. The primary responsibility of the committee members was to review all new items to ensure that they were free from such flaws as (a) inappropriate readability level, (b) ambiguity, (c) incorrect or multiple answer keys, (d) unclear instructions, and (e) factualinaccuracy. These items were approved, approved with modifications, revised, or rejected. Onlyapproved items were added to the item pool for the field test stage.
FSA 2016–2017 Technical Report: Volume 2
Annual Technical Report 19 Florida Department of Education
After items were field tested, members of the rubric validation committee reviewed the responses provided to MSCR items and either approved the scoring rubric or suggested a revised score based on their interpretation of the item task and the rubric.
3.3.2 Rubric Validation
The rubric used for scoring MSCR items was validated by a team of grade-level Florida educators. These individuals reviewed the machine-assigned scores for constructed-response items based on the scoring rubrics, and either approved the rubric or suggested a revision.
Prior to the meeting, AIR staff selected a sample of 45 student responses for each item. The sample consisted of the following:
• Fifteen responses from students who performed as expected on the item given their overall performance
• Fifteen responses from students who were predicted to perform well on the item given their overall performance, but instead performed poorly on the item
• Fifteen responses from students who were predicted to perform poorly on the item given their overall performance, but instead performed well on the item
The rubric validation committee reviewed 45 responses for every item, having the option to approve the score or suggest a different score based on the committee’s understanding of the rubric. FDOE and AIR staff ensured that the committee was scoring consistently. The committee meetings used the following procedures:
• Committee members were provided with their own binder that contained a PDF version of each item. Materials were collected and shredded at the conclusion of rubric validation for item security.
• Each item was displayed with a projector.• The committee discussed how to answer the item and how each point was earned.• Each of the 45 student response papers and machine-assigned scores were displayed with
a projector.• If the committee members reached a consensus that a score was incorrect, the committee
proposed modifications to the rubric.• AIR rescored the responses using the revised rubric.• AIR reviewed the responses that received changed scores to determine if they were
correctly scored.• FDOE reviewed the rescored responses and approved the rubric.
If any scores changed based on the rubric validation committee review, AIR staff revised the machine rubric and rescored the item. After the item was rescored, AIR staff reviewed at least 10% of responses for which the score changed. This review ensured that committee suggestions were honored, that the item was scored consistently, and that no unintended changes in scoring occurred
FSA 2016–2017 Technical Report: Volume 2
Annual Technical Report 20 Florida Department of Education
as a result of the revision to the machine rubric. AIR staff reviewed changes with TDC staff, and TDC staff had one final opportunity to revise the rubric or approve or reject the item.
The approved items were embedded into the spring 2017 operational test forms. At the end of the testing window, AIR conducted classical item analysis on these field test items to ensure that the items functioned as intended with respect to the underlying scales. AIR’s analysis program computed the required item and test statistics for each multiple-choice and constructed-response item to check the integrity of the item and to verify the appropriateness of the difficulty level of the item. Key statistical analyses included item discrimination, distractor analysis, item difficulty analysis, and fit analysis. Details of these analyses are presented in Section 5 of Volume 1.
3.4 DEVELOPMENT AND MAINTENANCE OF THE ITEM POOL
As described above, new items are developed each year to be added to the operational item pool after being field tested. Several factors determine the development of new items. The item development team conducts a gap analysis for distributions of items across multiple dimensions, such as item counts, item types, item difficulty, depth of knowledge (DOK) levels, and numbers in each reporting category.
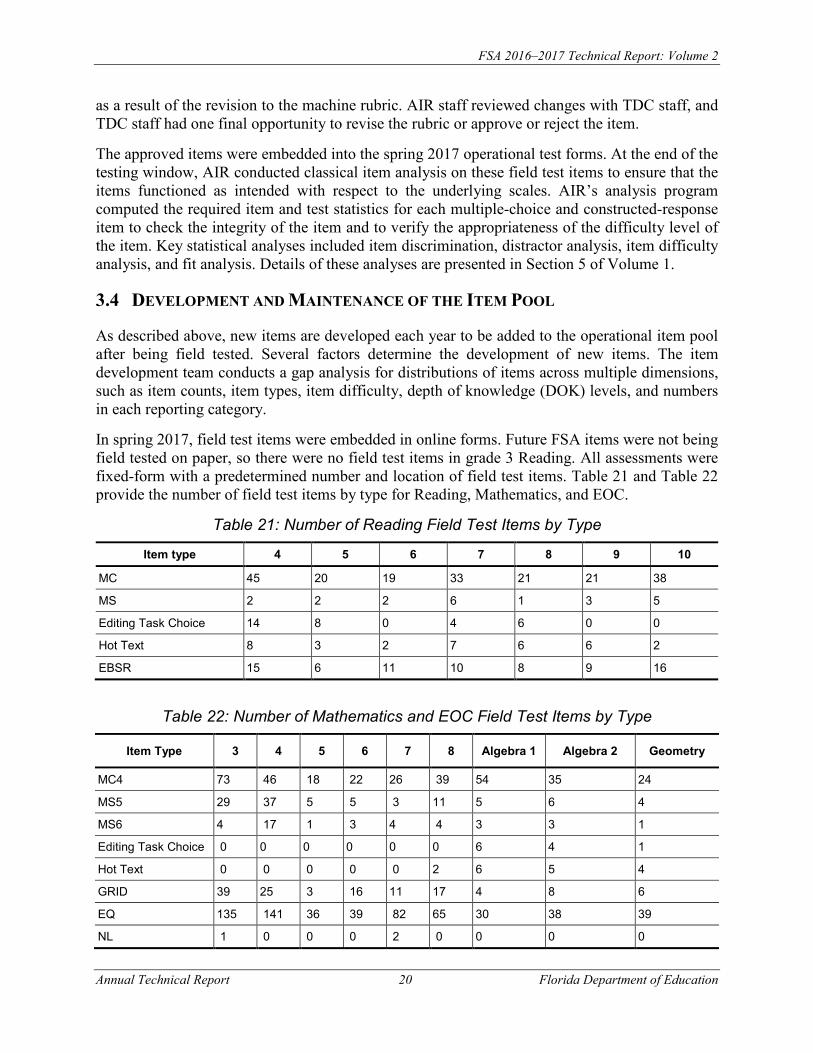
In spring 2017, field test items were embedded in online forms. Future FSA items were not being field tested on paper, so there were no field test items in grade 3 Reading. All assessments were fixed-form with a predetermined number and location of field test items. Table 21 and Table 22 provide the number of field test items by type for Reading, Mathematics, and EOC.
Table 21: Number of Reading Field Test Items by Type
Item type 4 5 6 7 8 9 10
MC 45 20 19 33 21 21 38
MS 2 2 2 6 1 3 5
Editing Task Choice 14 8 0 4 6 0 0
Hot Text 8 3 2 7 6 6 2
EBSR 15 6 11 10 8 9 16
Table 22: Number of Mathematics and EOC Field Test Items by Type
Item Type 3 4 5 6 7 8 Algebra 1 Algebra 2 Geometry
MC4 73 46 18 22 26 39 54 35 24
MS5 29 37 5 5 3 11 5 6 4
MS6 4 17 1 3 4 4 3 3 1
Editing Task Choice 0 0 0 0 0 0 6 4 1
Hot Text 0 0 0 0 0 2 6 5 4
GRID 39 25 3 16 11 17 4 8 6
EQ 135 141 36 39 82 65 30 38 39
NL 1 0 0 0 2 0 0 0 0
FSA 2016–2017 Technical Report: Volume 2
Annual Technical Report 21 Florida Department of Education
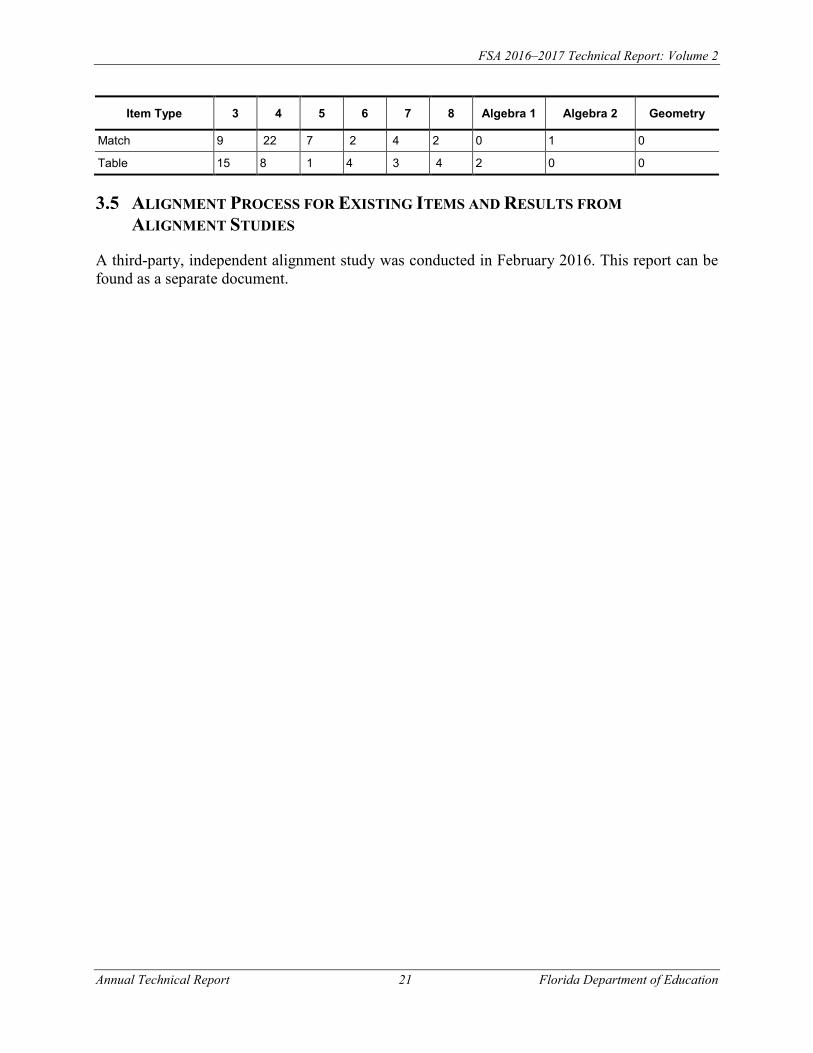
Item Type 3 4 5 6 7 8 Algebra 1 Algebra 2 Geometry
Match 9 22 7 2 4 2 0 1 0
Table 15 8 1 4 3 4 2 0 0
3.5 ALIGNMENT PROCESS FOR EXISTING ITEMS AND RESULTS FROMALIGNMENT STUDIES
A third-party, independent alignment study was conducted in February 2016. This report can be found as a separate document.
FSA 2016–2017 Technical Report: Volume 2
Annual Technical Report 22 Florida Department of Education
4. TEST CONSTRUCTION
4.1 OVERVIEW
During summer 2016, psychometricians and content experts from FDOE, TDC, and AIR convened for two weeks, to build forms for the spring 2017 administration. FSA test construction utilized a structured test construction plan, explicit blueprints, and active collaborative participation from all parties.
Beginning in spring 2016, anchor items were included for all grades. Anchor items may be either internal or external. Internal anchor items are operational and count towards a student’s score. In grades and subjects that use internal anchor items, internal anchor items appear on all forms. External anchor items are located in embedded slots and do not count towards a student’s score. Anchor items, whether internal or external, will be used to link the current year’s calibrations to the baseline spring 2015 scale.
Anchor items were selected first, and the set of anchor items in any given grade represented the blueprint for that grade to the greatest extent possible. Since anchor items can be considered a mini-test form, the targets for the set of anchor items were the same as the set of operational items.
4.1.1 Roles and Responsibilities of Participants
AIR Content Team
AIR ELA and Mathematics content teams were responsible for the initial form construction and subsequent revisions. These initial forms were pivotal to the test construction activities during the preparation period and during onsite test construction. AIR content teams performed the following tasks:
• Selection of the initial set of anchor items• Selection of the initial set of operational items• Revision of the anchor and operational item sets according to feedback from senior AIR
content staff • Revision of the anchor and operational item sets according to feedback from AIR
psychometricians • Assistance in the generation of materials for TDC and FDOE review• Revision of the forms to incorporate feedback from TDC and FDOE
AIR Technical Team
The AIR technical team, which included psychometricians and statistical support associates, prepared the item bank by updating the ITS with current item statistics and provided test construction training to the internal content team. During onsite test construction, at least one psychometrician was facilitating with each content area. The technical team performed the following tasks:
FSA 2016–2017 Technical Report: Volume 2
Annual Technical Report 23 Florida Department of Education
• Preparing item bank statistics and updating of AIR’s ITS• Creating the master data sheets (MDS) for each grade and subject• Providing feedback on the statistical properties of initial item pulls• Providing explanations surrounding the item bank• Providing feedback on the statistical properties of each subsequent item selection• Creating materials for FDOE psychometrician and leadership review
TDC Content Specialists and Leads
TDC content specialists collaborated with AIR content specialists to revise forms and select replacement items. Both parties selected items with respect to the statistical guidelines and the FSA content and blueprint guidelines. Content specialists communicated with content leads and psychometricians if they had concerns about either blueprints or statistical summaries.
TDC content leads reviewed the test forms and provided either approval or feedback to AIR content specialists. Once a form was approved, content leads completed verification logs for FDOE psychometricians to review. Once a form was approved from both a content and psychometric perspective, the reports were given to FDOE leadership.
FDOE Psychometrics
The FDOE psychometrics team evaluated the statistical properties of the constructed forms against statistical targets. These targets are outlined in the verification log in Appendix D. The proposed forms were either returned to TDC and AIR content teams for additional edits, or approved and forwarded to FDOE and TDC leadership for final review.
FDOE and TDC Leadership
All proposed forms were reviewed by the FDOE leadership team to determine the overall suitability of the proposed forms. When evaluating any given form, leadership considered the diversity of topics, projected level of difficulty, statistical summaries, adherence to blueprint, overall challenge to the examinees, and acceptability of test content to the Florida public. The leadership team was given the opportunity to approve proposed forms or return them with comments to AIR’s content team for further revision.
4.2 TEST CONSTRUCTION PROCESS
The FSA test construction process began in early summer with the following tasks:
1. Confirmation of test construction checklists and blueprints
2. Identification of key dates for each activity
3. Preparation for onsite meetings, including room reservations and agendas
4. Update of verification logs
After the test construction checklists and blueprints were approved, offsite test construction began.
FSA 2016–2017 Technical Report: Volume 2
Annual Technical Report 24 Florida Department of Education
4.2.1 Offsite Test Construction
Once item calibrations were complete, AIR’s technical team updated the item bank with all possible items for test construction. AIR’s Item Tracking System (ITS) was updated with the most current item statistics for any given item. Master data sheets (MDS) were also created to assist FDOE psychometricians in their form review. For each grade and subject, the MDS lists all items from each administration and provides item characteristics, classical statistics, and item response theory statistics. Items that have been administered multiple times have multiple listings in the MDS.
AIR’s content team created initial anchor item lists according to test construction checklists and blueprints. These preliminary versions of the anchor sets were given to AIR’s technical team for review. AIR psychometricians compiled statistical summaries and provided feedback. The selection of anchor items was updated to incorporate this feedback. There were often several iterations of the proposed preliminary anchor sets between AIR’s teams before final approval of initial anchor item lists. This communication and interaction ensured that the initial anchor item sets delivered to FDOE and TDC were of high quality and representative in terms of both content and item statistics.
At least one week before the onsite meetings, initial anchor item lists and summaries were provided to FDOE and TDC. This allowed for review before onsite face-to-face meetings.
4.2.2 Onsite Meetings
Onsite meetings occurred at the AIR offices. All parties, including program management, were actively involved in onsite test construction. On the morning of the first day, a commencement meeting was held to introduce all team members, explain any changes to test specifications or blueprints, discuss proposed forms, and prioritize upcoming activities. ELA, Mathematics, and EOC content specialists proceeded to their respective rooms to discuss proposed forms. For each grade and subject, there was at least one AIR content specialist and one TDC content specialist present for deliberations; at least one AIR psychometrician was available in each room.
Content specialists discussed proposed anchor item sets considering each item individually, ensuring that the composition of the items satisfied the blueprint and content-level considerations. For spring 2017 test forms, anchor items were selected from previous anchor, core, or Florida field-tested items. In only a small number of instances, SAGE items were used. Each item was carefully reviewed to confirm that it aligned with Florida Standards and fulfilled statistical criteria. If content experts had questions about item statistics, psychometricians were available to provide clarification.
Once anchor item sets were judged to be satisfactory from a content perspective, item sets were again reviewed by AIR psychometricians to ensure that they met the psychometric considerations. If any particular item did not meet the statistical criteria, content specialists were asked to submit a replacement item. Once all items satisfied both content and statistical considerations, the verification log was completed and summary materials were prepared. An example of the verification log can be found in Appendix D. Summary materials are discussed in Section 4.3.
FSA 2016–2017 Technical Report: Volume 2
Annual Technical Report 25 Florida Department of Education
FDOE psychometricians were given the verification log and summary materials to perform their own item-by-item review. If questions about content level or statistical criteria arose, discussions were held with all parties. Anchor item sets were either returned to content specialists with feedback to replace problematic items or approved and passed on to FDOE leadership.
FDOE leadership reviewed the verification log, summary materials, and comments from the FDOE psychometricians. Anchor item sets were once again either approved or returned to content specialists with feedback to replace problematic items, as necessary.
Once an anchor item set was approved, the same process was used to select operational items. Once both anchor item sets and operational items were approved, forms were entered into ITS, where they were evaluated for a final time to confirm that the intended items were placed on the individual forms. Final verification of approval from FDOE was obtained, and the necessary steps were taken to prepare the form for use in AIR’s test delivery system (TDS).
4.3 TEST CONSTRUCTION SUMMARY MATERIALS
4.3.1 Item Cards
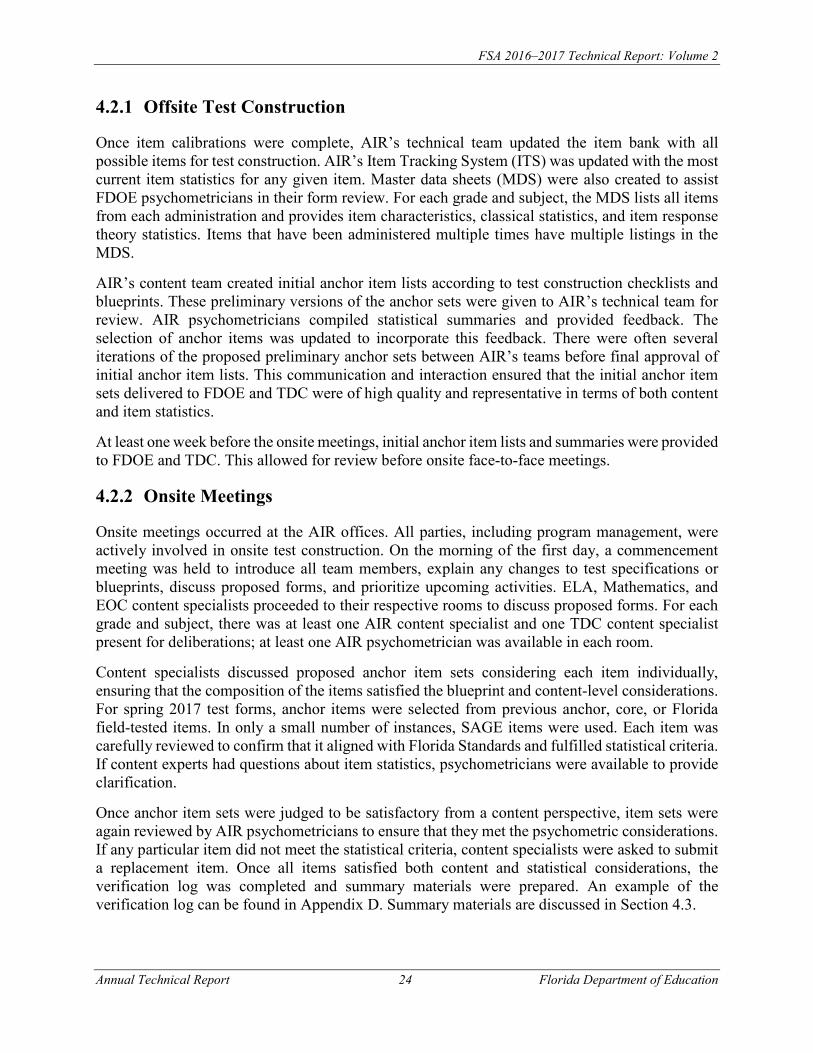
Item cards, generated within ITS, contained statistical information about an individual item. Item cards contained classical item statistics, IRT statistics, and DIF statistics. When possible, item cards also contained a screenshot of the item. This was not possible in the case of some technology-enhanced items. In these instances, the items were viewed directly in ITS. Item cards were typically used to determine the viability of an individual field test item for operational use in the next administration. Figure 1 provides an example item card.
Figure 1: Example Item Card
FSA 2016–2017 Technical Report: Volume 2
Annual Technical Report 26 Florida Department of Education
4.3.2 Bookmaps
A bookmap is a spreadsheet that lists characteristics of all items on a form. Bookmaps contain information such as:
• Item ID• Item position• Form• Grade• Role (e.g., operational or field test)• Item format (e.g., multiple choice)• Point value• Answer key• Reporting category• DOK
Bookmaps were used as an accessible resource to both content specialists and psychometricians to find information about a test form. Bookmaps differed from item cards in that there were no statistical summaries in a bookmap.
4.3.3 Graphical Summaries
In addition to numerical summaries and spreadsheets, it was often useful to create graphical summaries for visualization.
Test Characteristic Curve
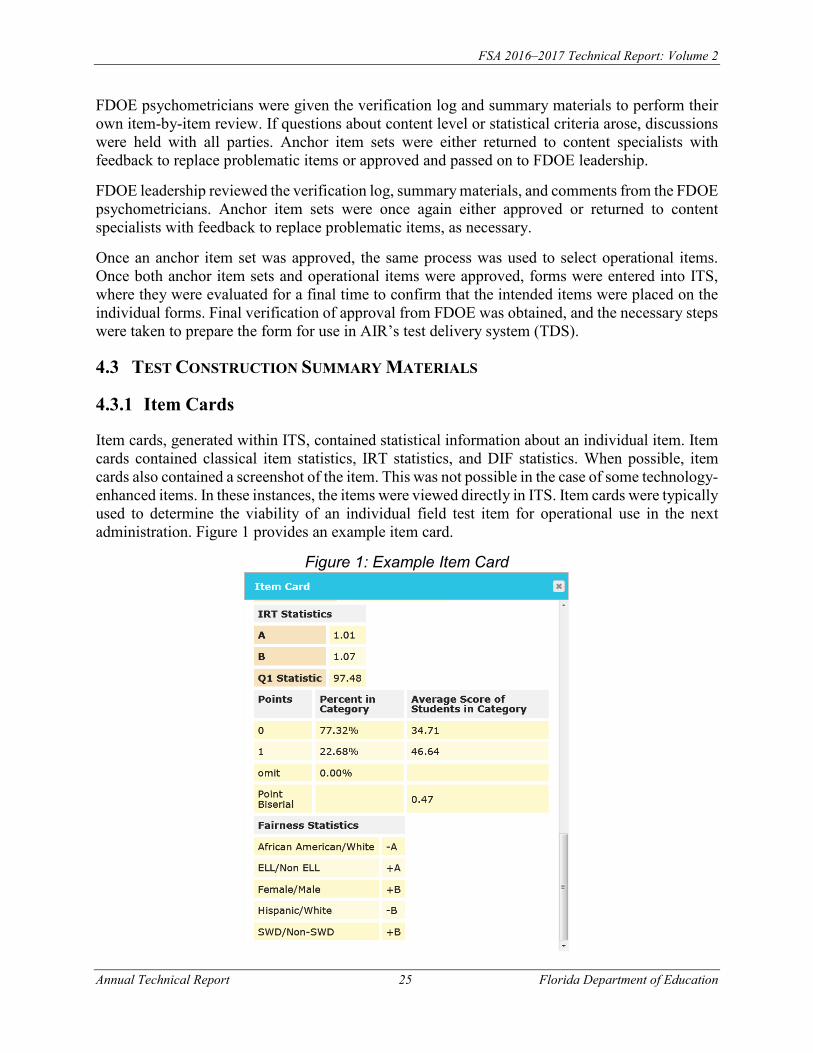
An item characteristic curve (ICC) shows the probability of a correct response as a function of ability, given an item’s parameters. Test characteristic curves (TCCs) can be constructed as the sum of ICCs for the items included on any given test. The TCC can be used to determine examinee raw scores or percent-correct scores that are expected at a given ability level. When two tests are developed to measure the same ability, their scores can be equated through the use of TCCs.
The spring 2015 and 2016 online form TCCs were the target for the spring 2017 forms. The spring 2017 online TCC was used as a target while building the spring 2017 paper accommodated forms. Items were selected for the paper form so that the paper form TCC matched the online form TCC as closely as possible. Figure 2 compares the TCCs for both online and paper forms of grade 6 Mathematics.
FSA 2016–2017 Technical Report: Volume 2
Annual Technical Report 27 Florida Department of Education
Figure 2: TCC Comparisons of Grade 6 Mathematics Online and Paper Forms
Target points based on previous experience were provided by FDOE psychometricians. Efforts were made to maximize information at the targets. These general targets were used for guidance, but not as a definitive rule.
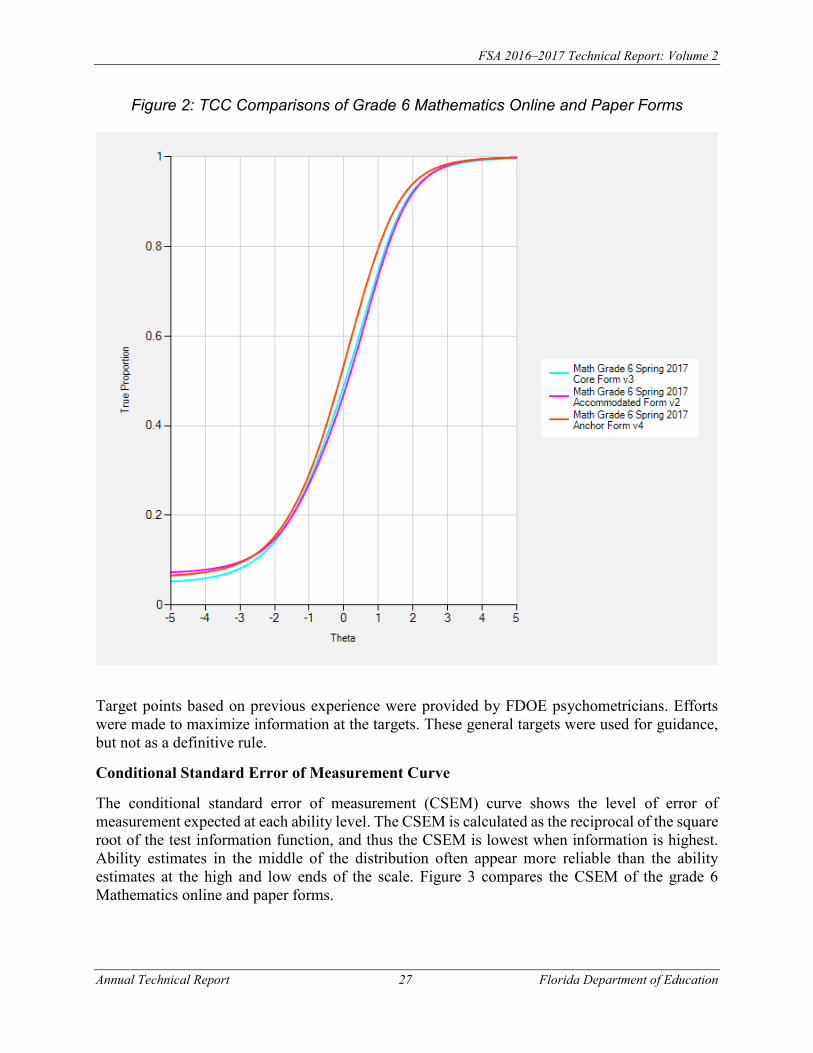
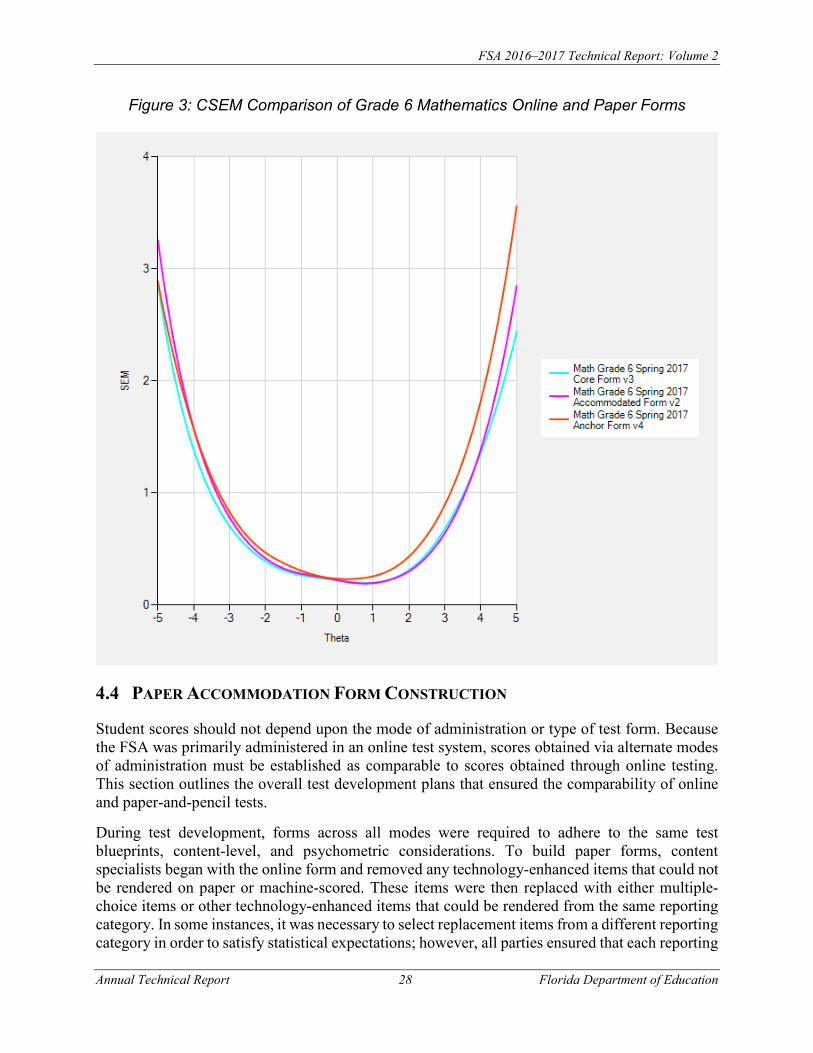
Conditional Standard Error of Measurement Curve
The conditional standard error of measurement (CSEM) curve shows the level of error of measurement expected at each ability level. The CSEM is calculated as the reciprocal of the square root of the test information function, and thus the CSEM is lowest when information is highest. Ability estimates in the middle of the distribution often appear more reliable than the ability estimates at the high and low ends of the scale. Figure 3 compares the CSEM of the grade 6 Mathematics online and paper forms.
FSA 2016–2017 Technical Report: Volume 2
Annual Technical Report 28 Florida Department of Education
Figure 3: CSEM Comparison of Grade 6 Mathematics Online and Paper Forms
4.4 PAPER ACCOMMODATION FORM CONSTRUCTION
Student scores should not depend upon the mode of administration or type of test form. Because the FSA was primarily administered in an online test system, scores obtained via alternate modes of administration must be established as comparable to scores obtained through online testing. This section outlines the overall test development plans that ensured the comparability of online and paper-and-pencil tests.
During test development, forms across all modes were required to adhere to the same test blueprints, content-level, and psychometric considerations. To build paper forms, content specialists began with the online form and removed any technology-enhanced items that could not be rendered on paper or machine-scored. These items were then replaced with either multiple-choice items or other technology-enhanced items that could be rendered from the same reporting category. In some instances, it was necessary to select replacement items from a different reporting category in order to satisfy statistical expectations; however, all parties ensured that each reporting
FSA 2016–2017 Technical Report: Volume 2
Annual Technical Report 29 Florida Department of Education
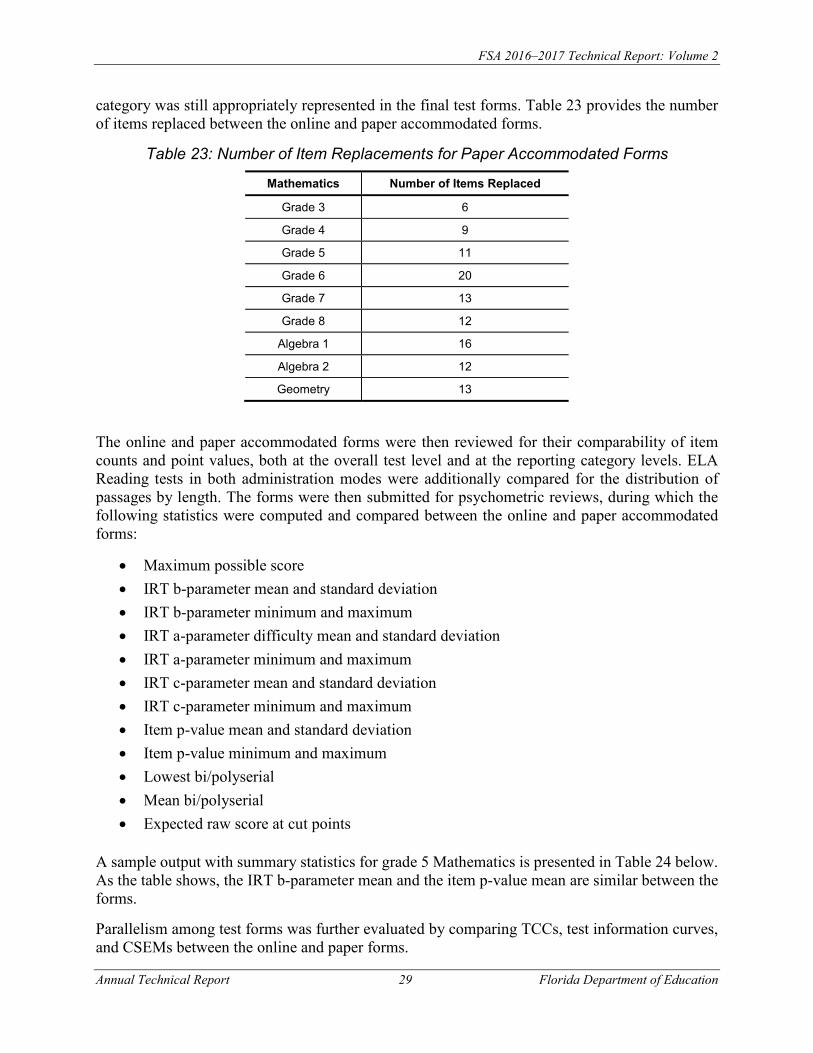
category was still appropriately represented in the final test forms. Table 23 provides the number of items replaced between the online and paper accommodated forms.
Table 23: Number of Item Replacements for Paper Accommodated Forms
Mathematics Number of Items Replaced
Grade 3 6
Grade 4 9
Grade 5 11
Grade 6 20
Grade 7 13
Grade 8 12
Algebra 1 16
Algebra 2 12
Geometry 13
The online and paper accommodated forms were then reviewed for their comparability of item counts and point values, both at the overall test level and at the reporting category levels. ELA Reading tests in both administration modes were additionally compared for the distribution of passages by length. The forms were then submitted for psychometric reviews, during which the following statistics were computed and compared between the online and paper accommodated forms:
• Maximum possible score• IRT b-parameter mean and standard deviation• IRT b-parameter minimum and maximum• IRT a-parameter difficulty mean and standard deviation• IRT a-parameter minimum and maximum• IRT c-parameter mean and standard deviation• IRT c-parameter minimum and maximum• Item p-value mean and standard deviation• Item p-value minimum and maximum• Lowest bi/polyserial• Mean bi/polyserial• Expected raw score at cut points
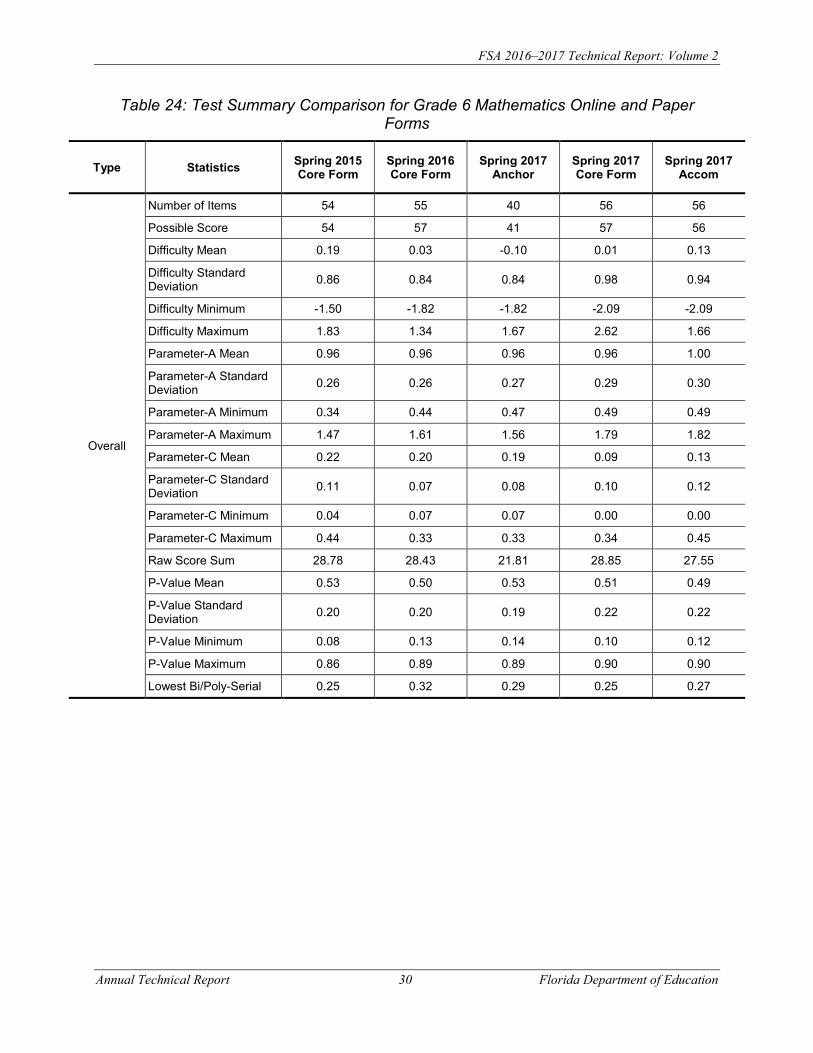
A sample output with summary statistics for grade 5 Mathematics is presented in Table 24 below. As the table shows, the IRT b-parameter mean and the item p-value mean are similar between the forms.
Parallelism among test forms was further evaluated by comparing TCCs, test information curves, and CSEMs between the online and paper forms.
FSA 2016–2017 Technical Report: Volume 2
Annual Technical Report 30 Florida Department of Education
Table 24: Test Summary Comparison for Grade 6 Mathematics Online and Paper Forms
Type Statistics Spring 2015 Core Form
Spring 2016 Core Form
Spring 2017 Anchor
Spring 2017 Core Form
Spring 2017 Accom
Overall
Number of Items 54 55 40 56 56
Possible Score 54 57 41 57 56
Difficulty Mean 0.19 0.03 -0.10 0.01 0.13
Difficulty Standard Deviation 0.86 0.84 0.84 0.98 0.94
Difficulty Minimum -1.50 -1.82 -1.82 -2.09 -2.09
Difficulty Maximum 1.83 1.34 1.67 2.62 1.66
Parameter-A Mean 0.96 0.96 0.96 0.96 1.00
Parameter-A Standard Deviation 0.26 0.26 0.27 0.29 0.30
Parameter-A Minimum 0.34 0.44 0.47 0.49 0.49
Parameter-A Maximum 1.47 1.61 1.56 1.79 1.82
Parameter-C Mean 0.22 0.20 0.19 0.09 0.13
Parameter-C Standard Deviation 0.11 0.07 0.08 0.10 0.12
Parameter-C Minimum 0.04 0.07 0.07 0.00 0.00
Parameter-C Maximum 0.44 0.33 0.33 0.34 0.45
Raw Score Sum 28.78 28.43 21.81 28.85 27.55
P-Value Mean 0.53 0.50 0.53 0.51 0.49
P-Value StandardDeviation 0.20 0.20 0.19 0.22 0.22
P-Value Minimum 0.08 0.13 0.14 0.10 0.12
P-Value Maximum 0.86 0.89 0.89 0.90 0.90
Lowest Bi/Poly-Serial 0.25 0.32 0.29 0.25 0.27
FSA 2016–2017 Technical Report: Volume 2
Annual Technical Report 31 Florida Department of Education
5. REFERENCES
Thompson, S. J., Johnstone, C. J., & Thurlow, M. L. (2002). Universal design applied to large scale assessments (Synthesis Report 44). Minneapolis, MN: University of Minnesota, National Center on Educational Outcomes. Retrieved 02-15-2012, from http://www.cehd.umn.edu/NCEO/onlinepubs/Synthesis44.html.
Webb, N. L. (2002). Alignment study in language arts, mathematics, science, and social studies of state standards and assessments for four states. Washington, DC: Council of Chief State School Officers.