VOLUME 17 NUMBER 3 DECEMBER 2008 TRANSNATIONAL...
152
VOLUME 17 NUMBER 3 DECEMBER 2008 United Nations New York and Geneva, 2008 United Nations Conference on Trade and Development Division on Investment and Enterprise TRANSNATIONAL CORPORATIONS
Transcript of VOLUME 17 NUMBER 3 DECEMBER 2008 TRANSNATIONAL...

VOLUME 17 NUMBER 3 DECEMBER 2008
United NationsNew York and Geneva, 2008
United Nations Conference on Trade and Development
Division on Investment and Enterprise
TRANSNATIONALCORPORATIONS
Editorial statement
Transnational Corporations (formerly The CTC Reporter) is a refereed journal published three times a year by UNCTAD. In the past, the Programme on Transnational Corporations was carried out by the United Nations Centre on Transnational Corporations (1975-1992) and by the Transnational Corporations and Management Division of the United Nations Department of Economic and Social Development (1992-1993). The basic objective of this journal is to publish articles and research notes that provide insights into the economic, legal, social and cultural impacts of transnational corporations in an increasingly global economy and the policy implications that arise therefrom. It focuses especially on political and economic issues related to transnational corporations. In addition, Transnational Corporations features book reviews. The journal welcomes contributions from the academic community, policy makers and staff members of research institutions and international organizations. Guidelines for contributors are given at the end of this issue.
Editor: Anne MirouxDeputy Editor
Managing Editor: Shin OhinataProduction Manager: Tess Ventura
home page: http://www.unctad.org/TNC
Subscriptions
A subscription to Transnational Corporations for one year is US$ 45 (single issues are US$ 20). See p. 143 for details of how to subscribe, or contact any distribu-tor of United Nations publications. United Nations, Sales Section, Room DC2-853, 2 UN Plaza, New York, NY 10017, United States – tel.: 1 212 963 3552; fax: 1 212 963 3062; e-mail: [email protected]; or Palais des Nations, 1211 Geneva 10, Switzerland – tel.: 41 22 917 1234; fax: 41 22 917 0123; e-mail: [email protected].
Note
The opinions expressed in this publication are those of the authors and do not
in this journal also refers, as appropriate, to territories or areas; the designations employed and the presentation of the material do not imply the expression of any opinion whatsoever on the part of the Secretariat of the United Nations concerning the legal status of any country, territory, city or area or of its authorities, or concern-ing the delimitation of its frontiers or boundaries. In addition, the designations of country groups are intended solely for statistical or analytical convenience and do not necessarily express a judgement about the stage of development reached by a particular country or area in the development process.
Unless stated otherwise, all references to dollars ($) are to United States dol-lars.
ISBN 978-92-1-112762-1ISSN 1014-9562
Copyright United Nations, 2008All rights reserved
Printed in Switzerland
ii

Board of Advisers
CHAIRPERSON
John H. Dunning, Emeritus Esmee Fairbairn Professor of International Investment and Business Studies, University of Reading, United Kingdom, and Emeritus State of New Jersey Professor of International Business, Rutgers University, United States
MEMBERS
V.N. Balasubramanyam, Professor of Development Economics, Lancaster Univer-sity, United Kingdom
Edward K. Y. Chen, Former President, Lingnan University, Hong Kong, Special Administrative Region of China
Farok J. Contractor, Professor of Management and Global Business, Graduate School of Management, Rutgers University, Newark, New Jersey, United States
Arghyrios A. Fatouros, Professor of International Law, Faculty of Political Science, University of Athens, Greece
Xian Guoming, Professor of Economics and International Business, Director, Center for Transnationals Studies, Dean, Teda College of Nankai University, Tianjin, China.
Kamal Hossain, Senior Advocate, Supreme Court of Bangladesh, Bangladesh
Celso Lafer, Professor, University of Sao Paulo, Brazil
James R. Markusen, Professor of Economics, University of Colorado at Boulder, Colorado, United States.
Theodore H. Moran, Karl F. Landegger Professor, and Director, Program in Inter-national Business Diplomacy, School of Foreign Service, Georgetown University, Washington, D.C., United States
Sylvia Ostry, Distinguished Research Fellow and China/WTO Project Chair , Centre for International Studies, University of Toronto, Toronto, Canada
Terutomo Ozawa, Professor of Economics, Colorado State University, Fort Collins, Colorado, United States
, Radcliffe Killam Distinguished Professor of International Business, and Director, Ph.D. Program in International Business Administration, College of Business Administration, Texas A&M International University, Texas, United States
Mihály Simai, Professor Emeritus, Institute for World Economics, Budapest, Hun-gary
John M. Stopford, Professor Emeritus, London Business School, London, United Kingdom
Osvaldo Sunkel, Professor and Director, Center for Public Policy Analysis, University of Chile, Santiago, Chile
Head, Centre of International Relations, Faculty of Social Sciences, University of Ljubljana, Slovenia
Daniel Van Den Bulcke, Professor of International Management and Development, University of Antwerp, Belgium
iii


Transnational CorporationsVolume 17, Number 3, December 2008
Contents
ARTICLES
Editorial Preface: Article Stream in Honour of Sanjaya Lall vii
John H. Dunning Foreign direct investment and the 1and Feng Zhang locational competitiveness of countries
Dieter Ernst Asia’s “upgrading through innovation” 31strategies and global innovation networks: an extension of Sanjaya Lall’s research agenda
John A. Mathews Energizing industrial development 59
RESEARCH NOTES
Andrea Goldstein Emerging Economies’ Multinationals: 85Explaining the Case of Tata
UNCTAD World Investment Report 2008: 109Transnational Corporations and the Infrastructure Challenge (Overview)
v

Editorial Preface: Article Stream
in Honour of Sanjaya Lall
The late Professor Sanjaya Lall, was one of the world’s leading authorities on issues related to industrialization, technological change and development. He contributed extensively to the work of UNCTAD over many years, including the Division on Investment and Enterprise (DIAE) and, among others, his intellectual footprint can be seen in a number of World Investment Reports, the Technology for Development Series, and other publications and activities of the Division. In his honour and at the initiative of Khalil Hamdani - a former Director of DIAE - a
convened by UNCTAD in Geneva on March 2007, in collaboration with Queen Elizabeth House, Oxford University. Papers were presented by prominent academics on topics related to the wide-ranging issues on which Sanjaya Lall had worked and played a part
developing country TNCs to the role of technology and innovation in development.
Among the many outcomes of the Expert Meeting were a special issue of Oxford Development Studies and a stream of articles to be published in Transnational Corporations in honour of the work of Sanjaya Lall. Some of these articles are referred versions of papers presented at the Meeting, but others were received subsequently from academics that were unable to participate. The large number of papers received is a tribute to the esteem in which Sanjaya Lall was held by colleagues and peers; and this situation necessitated a stream of articles to be published over a
stream, by Ganesh Wignaraja, appeared in the August 2008 issue of Transnational Corporations. The three main articles in this issue, by Dunning and Zhang, Ernst and Mathews, are also part of this stream of articles; and others will follow in later issues.
transnational corporations (TNCs) and developing economies. However, because aspects of economic development interlock and
vii
viii Transnational Corporations, Vol. 16, No. 1 (April 2007)
research and publish (in collaboration with other scholars) on trade and competition, globalization and its economic consequences, industrial policy and industrialization, and innovation and technological capabilities. In consequence, the stream of articles
analysis, as he made incisive inroads into measuring technological capabilities, distinguishing between different levels of corporate
negotiate the daunting currents of competition to move from price-based to product-based competitiveness. In a sense, his research began and ended with developing country TNCs - but Sanjaya Lall made sure that the black box of devilish detail, inherent in the development process, was opened and subjected to meaningful, policy-orientated analysis.
Anne Miroux, Rajah Rasiah1
1 Professor Rajah Rasiah of the Faculty of Economics and Administration, University of Malaya has assisted in bringing the article stream in honour of the work of Sanjaya Lall to fruition.
Foreign direct investment and
the locational competitiveness of
countries
John H. Dunning and Feng Zhang*
The paper first examines the current state of thinking on the role of The paper first examines the current state of thinking on the role of resources, capabilities and markets (RCM) and institutions (I) as theresources, capabilities and markets (RCM) and institutions (I) as themain ingredients of the competitiveness of national economies. Themain ingredients of the competitiveness of national economies. Thepaper then empirically investigates how the extent, content and qualitypaper then empirically investigates how the extent, content and qualityof each are associated with the level of foreign direct investment (FDI)of each are associated with the level of foreign direct investment (FDI)to and from the country. Data are primarily drawn from the World to and from the country. Data are primarily drawn from the World Investment Report (UNCTAD) and the Global Competitiveness Report Investment Report (UNCTAD) and the Global Competitiveness Report (World Economic Forum). We find that the level of competitiveness(World Economic Forum). We find that the level of competitivenessdoes, in general, encourage both inward and outward FDI. Moreover,does, in general, encourage both inward and outward FDI. Moreover,the I of a country has stronger positive effects on FDI than its RCM.the I of a country has stronger positive effects on FDI than its RCM.Further investigation shows that the effects of I are particularly strongFurther investigation shows that the effects of I are particularly strongin countries at the advanced stage of development. The findings of thein countries at the advanced stage of development. The findings of thepaper suggest that more detailed future work focusing on countries’paper suggest that more detailed future work focusing on countries’institutional advantages promises to yield dividends in terms of insight institutional advantages promises to yield dividends in terms of insight into the determinants of national competitiveness and FDI.into the determinants of national competitiveness and FDI.
Keywords: FDI, Institutions, Country Competitiveness, EconomicDevelopment
1. Introduction
One of the several research interests the first author shared with SanjayaLall was on the determinants of the competitiveness of countries. In 2001,Sanjaya wrote a trenchant criticism of the quality and relevance of some of theindices used to identify and assess the competitiveness of developing countriesby the Global Competitiveness Report (t GCR)1. While endorsing many of hisconcerns, we believe that, in one respect at least, the GCR does help us to better appreciate the role played by two distinctive, yet interrelated, components of competitiveness, which are often treated as one in the literature.
* John H. Dunning is Emeritus Professor of International Business at the University of Reading, United Kingdom, and Rutgers University, United States. Feng Zhang is a PhD student at Rutgers University.
Jeremy Clegg, Jean Monnet Professor, University of Leeds, United Kingdom.1 The 2005 edition of the annual publication of the World Economic Forum, which sets
out 142 separate indices for 117 countries.

These are first, the resources, capabilities and markets (RCM) which make up the physical2ll environment in which firms and other organizations create economic well-being; and second, the institutions(together with the values and belief systems underpinning them) (I) whichprovide the incentive structures to make up the human environment, and which set the rules of the game for, and determine the cognition and motivation of, firms and other wealth creating entities.
All too frequently in the past, in assessing nationalcompetitiveness, the RCM and I determinants of economic activity havebeen treated separately. Partly this reflects the different disciplinaryand methodological approaches to evaluating each. While mainstreameconomists, borrowing from the causal and functional analytical toolsof the physical and/or biological sciences have favoured the “if-then”approach to measuring competitiveness, other social scientists, notablysociologists, have focused more on the intentionality of human decisiontakers, and on the institutional and other elements determining themotivation and conduct of individuals.
This dichotomy is now starting to change. The first bridges weremade by institutional scholars from a variety of disciplines in the 1930sand 1940s. Perhaps the most influential of these were John Commons and Herbert Simon. Later, the contributions of Oliver Williamson,Harold Demsetz and Douglass North helped bring the subject centrestage among economists and organizational theorists. Each, in their particular ways, has attempted to unite the RCM (or physical) withllthe I (or human) approach to understanding the strategy of firms and the policies of governments in the wealth creating process. However,from an International Business perspective, notwithstanding the work of the internalization school (Buckley and Casson, 1976, 1985; Hennart,1982), institutions have been incorporated into mainstream theory onlyvery recently.3
Outside International Business, an understanding of institutionshas traditionally been the domain of sociologists, whose interest in this subject dates back to the writings of Emile Durkheim in the mid-nineteenth century; while, latterly, organizational, internationalrelations and legal scholars have contributed to the debate.4 And once
2 We use these terms as does Douglass North in his various writings. See, for example, North (2005).
3 See e.g. the works of Oliver (1997), Henisz (2000, 2003), Mudambi and Navarra(2002), Peng (2003), Peng, Lee and Wang (2005), and Lu (2006).
4 See e.g. several essays in Ghoshal and Westney (1993), and Williamson (2000)
2 Transnational Corporations, Vol. 17, No. 3 (December2008)
one trespasses into the arena of values, cognitive science and belief systems, social psychologists, anthropologists and theologians havetheir contribution to make, while a branch of economics called “neuroeconomics” is beginning to link these behavioural elements together (Katz, 2005).
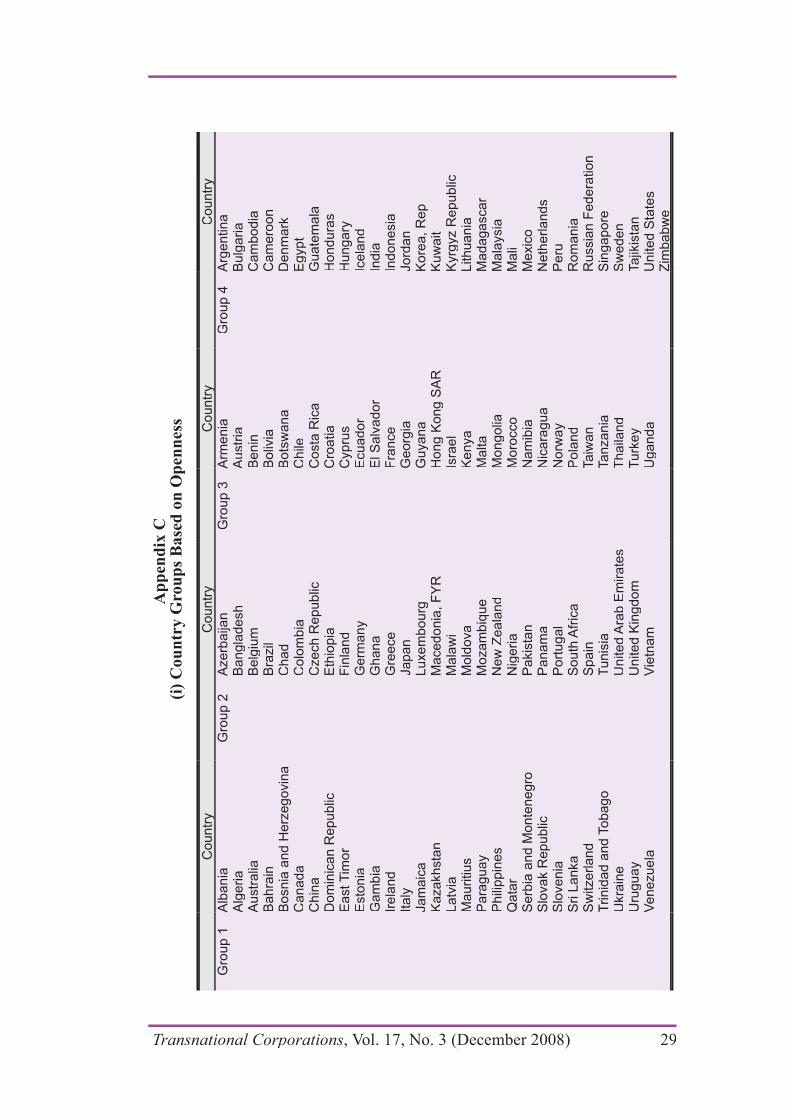
The purpose of this contribution is to examine the present stateof thinking on the role of RCM and I as the main ingredients of the competitiveness of national economies; and, more particularly, of howthe extent, content and quality of each are associated with the valueof inward foreign direct investment (FDI) by foreign companies and the outward FDI of their own transnational corporations (TNCs). Indoing so, data constraints force us to take a cross sectional approach,although, ideally, we would like to have established how the respectivecontributions of RCM and I may have changed over time, and at different stages of economic development. As a proxy for this, we will attempt to classify the 117 national economies (about which GCR provides data) into three main groups according to their GDP per head. We will also offer further breakdowns according to the economic structure and degree of openness of the economy. In particular, we shall remove someprimary product-based economies from the 117 countries, as we believethat much of FDI into these economies has little to do with their overallcompetitiveness. Further details about our methodology of approachand data sources are set out in section 3 of this paper.
The following section sets out the theoretical justification for RCM and I as competitive influencing variables comprising the GlobalCompetitiveness Index (GCI) identified by GCR.5 Here, we would simply observe that although some commentators have argued that thecompetitiveness (as opposed to the comparative advantages) of countriesis a meaningless concept (Krugman, 1994), we believe that whenevaluated from the viewpoint of investing or potentially investing firms,it is by no means so.6 TNCs, in particular, regularly compare the relativelocation specific (competitive) advantages of particular countries and of the indigenous firms in those countries, when deciding where to sitetheir various value-adding activities. In this sense, firms do consider countries (and/or regions in countries) in terms of their ability to offer the RCMs and Is that they need to make their investments (or other forms of economic involvement) worthwhile.
5 To quote from the 2005/6 report The Global CI aims to measure the set of institutions, policies and factors that set current and medium term levels of economicprosperity, (WEF 2005, p.22).
6 See, for example, my riposte to Krugman (Dunning 1995)
Transnational Corporations, Vol. 17, No. 3 (December 2008) 3
2. Resources, capabilities and markets (RCM)
Both traditional economic theory and management related studies primarily focus their attention on the availability and quality of RCMs asthe key determinant of economic welfare. The resource based theory of the firm (Wernerfelt, 1984; Barney, 1991), Michael Porter’s diamond of competitive advantage (Porter, 1990) and most Western based textbookson economics dwell almost exclusively on the physical environment lin which firms operate7, and on their technical efficiency in convertingscarce resources into more valued goods and services, as dictated, bythe market or other means. Such received wisdom has generally played down the role of the human environment and the intentionality of its constituents in the wealth creating process, and of its institutions, whichhelp fashion such intentionality. Or, perhaps, it would be more accurateto describe the incentive structures assumed by neoclassical economistsas being static and single dimensional, – the maximization of profits (inthe case of firms), of utility (in the case of consumers) and of GDP or GDP per head of the community (in the case of governments).
Although, as we have said, in the last two or more decades, asthe global economic arena has become more uncertain, volatile and complex, and as more players from widely different cultures haveentered the world economic stage, the acceptance of multiple and changing intentions, and that of non-ergodic uncertainty (North, 2005)has gained scholarly credence. Most theories of competitiveness and economic well being, however, still remain firmly entrenched in theRCM tradition. Nowhere is this better illustrated than on the focus of knowledge as the competitive enhancing asset of the late twentieth and early twenty-first century.8
In table 1, we summarize the main components of RCM, which,it is generally agreed, firms consider when making their locationalchoices. Clearly the importance of these “inputs” to competitiveness willbe context specific. In particular, they will vary according to the purposeof the FDI – be it inward or outward. Technology-seeking TNCs are
7 One exception is Christine Oliver’s incorporation of institutional elements into the resource based theory (Oliver, 1997).
8
ingredient of economic growth and competitiveness.
4 Transnational Corporations, Vol. 17, No. 3 (December2008)
likely to place particular value on accessing scientific manpower and R&D facilities. Firms seeking to offshore service call centres will bemost strongly influenced by labour costs, and the efficiency of cross-border communication systems. Natural resource-based assets seekerswill most obviously be attracted by the availability and quality of theprimary products sought. Firms which need to be in close proximity toa range of suppliers, to common inputs or to their competitors will seek out locations which favour a clustering of the related activities.
Another possible way of classifying RCM of countries (as viewed by firms) is between those owned by them and those which they maytap into, e.g. via alliances and subcontracting ventures. In their internaldeployment, much will depend on the functions performed. In the caseof foreign affiliates, these might vary from simple assembling to highlycomplex innovatory activities. This also applies to gaining access tothe RCM of other firms; e.g. buying into specialized high value-addingactivities (e.g. R&D) at the one end of the value chain (UNCTAD, 2005)and call centres services at the other (UNCTAD, 2004).
Finally, given the desire of companies to access or own particular RCMs, the preferred mode of entry (greenfield v merger and acquisition)might both be influenced by, and influence, their locational choice. Thisparticularly applies in the case of asset augmenting investment, wherethe country specific competitiveness sought by the investing TNC mayalready be internalized by a domestic firm (or another foreign affiliate). Inother cases, as we have already indicated, the search for complementarytechnologies, managerial and organizational capabilities and market opportunities, might best be accomplished by the conclusion of alliancesor by participating in networks.
In our empirical study, we shall seek to classify some of the moresignificant RCMs identified by GCR, (and other sources)9 into a number of groups, and to examine how far inbound and outbound FDI appear tobe influenced by their values. In both cases, our purpose is to identifythe kind of RCMs from the optimum location which will best promotethe (presumed) objectives of the investing firms – and especially their own competitiveness, profitability and growth.
9 For example, UNDP (2004) and World Bank (2004).
Transnational Corporations, Vol. 17, No. 3 (December 2008) 5
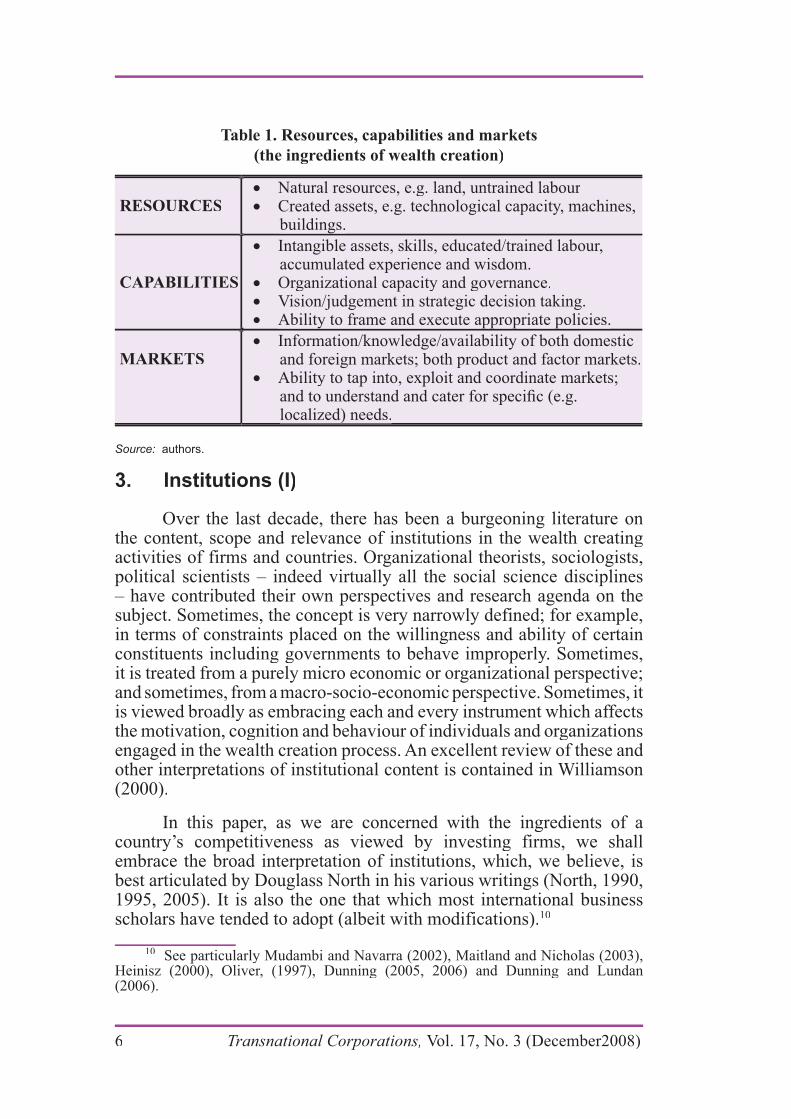
Table 1. Resources, capabilities and markets
(the ingredients of wealth creation)
RESOURCESRESOURCESNatural resources, e.g. land, untrained labourNatural resources, e.g. land, untrained labourCreated assets, e.g. technological capacity, machines, Created assets, e.g. technological capacity, machines, buildings.buildings.
CAPABILITIESCAPABILITIES
Intangible assets, skills, educated/trained labour,Intangible assets, skills, educated/trained labour,accumulated experience and wisdom.accumulated experience and wisdom.Organizational capacity and governance.Organizational capacity and governance.Vision/judgement in strategic decision taking.Vision/judgement in strategic decision taking.Ability to frame and execute appropriate policies.Ability to frame and execute appropriate policies.
MARKETSMARKETSInformation/knowledge/availability of both domesticInformation/knowledge/availability of both domesticand foreign markets; both product and factor markets.and foreign markets; both product and factor markets.Ability to tap into, exploit and coordinate markets;Ability to tap into, exploit and coordinate markets;
localized) needs.localized) needs.))
Source: authors.
3. Institutions (I)
Over the last decade, there has been a burgeoning literature onthe content, scope and relevance of institutions in the wealth creatingactivities of firms and countries. Organizational theorists, sociologists,political scientists – indeed virtually all the social science disciplines– have contributed their own perspectives and research agenda on thesubject. Sometimes, the concept is very narrowly defined; for example,in terms of constraints placed on the willingness and ability of certainconstituents including governments to behave improperly. Sometimes,it is treated from a purely micro economic or organizational perspective;and sometimes, from a macro-socio-economic perspective. Sometimes, it is viewed broadly as embracing each and every instrument which affectsthe motivation, cognition and behaviour of individuals and organizationsengaged in the wealth creation process. An excellent review of these and other interpretations of institutional content is contained in Williamson(2000).
In this paper, as we are concerned with the ingredients of acountry’s competitiveness as viewed by investing firms, we shallembrace the broad interpretation of institutions, which, we believe, isbest articulated by Douglass North in his various writings (North, 1990,1995, 2005). It is also the one that which most international businessscholars have tended to adopt (albeit with modifications).10
10 See particularly Mudambi and Navarra (2002), Maitland and Nicholas (2003),Heinisz (2000), Oliver, (1997), Dunning (2005, 2006) and Dunning and Lundan(2006).
6 Transnational Corporations, Vol. 17, No. 3 (December2008)
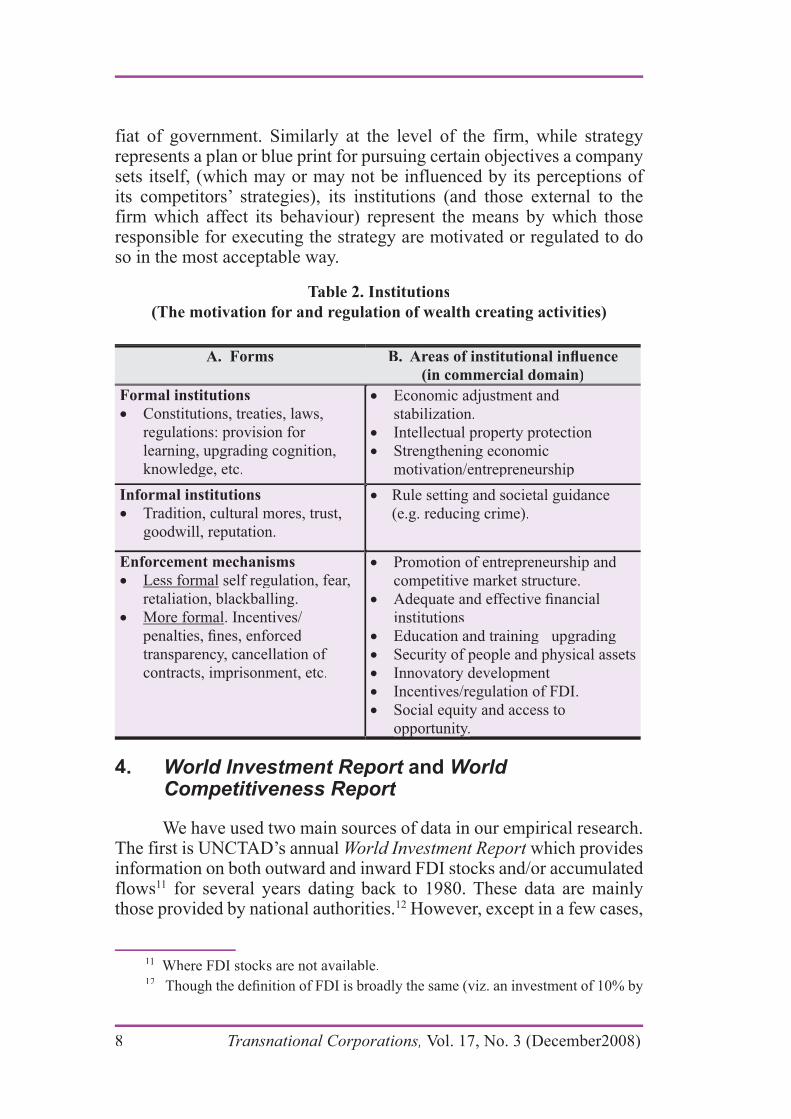
Like RCM, I comprises a galaxy of ingredients. Some of these arereproduced in table 2. The left hand column of the table sets out somedifferent governance structures. These range from coercive and topdown laws and regulations, to spontaneous and bottom up behavioural norms or customs (Dunning. 2003). In the right hand column, we identifysome of the economic and social functions which, depending on their institutional content and form, might affect the cognition, motivationand behaviour of firms in their decisions on whether and r how to createand efficiently utilize the RCM owned, leased or accessed by them.
Once again, the likely drawing power of such institutions toinward foreign investors, and/or their influence in determining thewillingness and ability of domestic firms to engage in outward FDI is likely to be highly contextual. For example, the content and quality of domestic innovatory systems and the protection of intellectual propertyrights is likely to be particularly relevant for (knowledge augmenting)FDI: while fiscal incentive might tip the balance of countries seekingto attract efficiency-seeking FDI. Within a developing region, thequality and content of indigenous social capital and the extent of crimeand corruption and social disfunction might be one of the decisiveinfluences on locational choice. Institutions affecting M&A strategies and/or the performance constraints placed on foreign affiliates might also be expected to have a major influence on the ownership strategiesof foreign TNCs.
Analogous to the influences exerted by RCM on the location-specific attractiveness of countries, we shall group the I variables intoa number of broad categories. These are described in section 5. Our main objective is, we repeat, to identify the relative importance of theselargely immobile characteristics of countries in influencing the locationdecisions of firms.
We would make one final point at this stage of our analysis. That concerns the distinction between the institutions and policies of nationalgovernments, and the institutions and strategies of firms. We definepolicies as decisions taken by governments to pursue particular coursesof action to achieve certain economic, social and political objectives.We define institutions as instruments (or groups of instruments) whichmight both influence these actions and be influenced by them. Thus,it may be a policy decision of a government to switch its economicsystem, for which it is responsible, from one of central planning to that which accepts the merits of capitalism. But the (macro) institutionalsystem which implements that new policy is the market, albeit with the
Transnational Corporations, Vol. 17, No. 3 (December 2008) 7
fiat of government. Similarly at the level of the firm, while strategyrepresents a plan or blue print for pursuing certain objectives a companysets itself, (which may or may not be influenced by its perceptions of its competitors’ strategies), its institutions (and those external to thefirm which affect its behaviour) represent the means by which thoseresponsible for executing the strategy are motivated or regulated to doso in the most acceptable way.
Table 2. Institutions
(The motivation for and regulation of wealth creating activities)
A. Forms
(in commercial domain)
Formal institutionsFormal institutions
Constitutions, treaties, laws, Constitutions, treaties, laws, regulations: provision for regulations: provision for learning, upgrading cognition, learning, upgrading cognition, knowledge, etc.knowledge, etc.
Economic adjustment and Economic adjustment and stabilization.stabilization.Intellectual property protectionIntellectual property protectionStrengthening economic Strengthening economic motivation/entrepreneurshipmotivation/entrepreneurship
Informal institutionsInformal institutions
Tradition, cultural mores, trust, Tradition, cultural mores, trust, goodwill, reputation.goodwill, reputation.
Rule setting and societal guidance Rule setting and societal guidance (e.g. reducing crime).(e.g. reducing crime).
Enforcement mechanismsEnforcement mechanisms
Less formalLess formal self regulation, fear, self regulation, fear, retaliation, blackballing.retaliation, blackballing.More formalMore formal. Incentives/. Incentives/
transparency, cancellation of transparency, cancellation of contracts, imprisonment, etc.contracts, imprisonment, etc.
Promotion of entrepreneurship and Promotion of entrepreneurship and competitive market structure.competitive market structure.
institutionsinstitutionsEducation and trainingEducation and training upgradingupgradingSecurity of people and physical assetsSecurity of people and physical assetsInnovatory developmentInnovatory developmentIncentives/regulation of FDI.Incentives/regulation of FDI.Social equity and access to Social equity and access to opportunity.opportunity.pp ypp y
4. World Investment Report andt World Competitiveness Report
We have used two main sources of data in our empirical research.The first is UNCTAD’s annual World Investment Report which provides information on both outward and inward FDI stocks and/or accumulated flows11 for several years dating back to 1980. These data are mainlythose provided by national authorities.12 However, except in a few cases,
11 Where FDI stocks are not available.12
8 Transnational Corporations, Vol. 17, No. 3 (December2008)
inward FDI flows or stocks are not classified by country of origin;neither is outward FDI delineated by country of destination. All valuesare expressed in United States dollars and converted (usually at the end of the calendar year) at current exchange rates. Our basic propositionsof this paper are fourfold.
Proposition 1: the more pronounced the locational attractions or competitive advantages of a country are, the greater its share of theworld FDI stock will be.
Proposition 2: the content and quality of the institutions of a countryare an important influence on the extent of its inward FDI.
Proposition 3: the competitive advantages of firms in countries (but possibly different to those of the first kind) will be positively associated with the extent of outward FDI.II
Proposition 4: I advantages are an important, and possibly anincreasingly important, determinant of the extent of outward FDI.
As far as the explanatory variables are concerned, the data onRCM and I, and most of their ingredients, were obtained from GCR(World Economic Forum, 2005). The 2005/6 version of this publicationprovides data on 142 separate performance indicators, 90 of whichare grouped into nine pillars of competitiveness.13 Data on these areprovided for some 117 countries. Some of these indices were derived directly from national statistics (e.g. expenditure on R&D, interest rates,labour costs). Others came from the opinions of a group of some 10,993executives from these countries14, who were asked to rank on a Likert scale of 1-7 how far they believed in the validity of particular statements,and/or of how important they perceived a particular locational variablemight be. All the data were collected or provided for the years between2003 and 2005.
In our exercise, and taking our definitions of RCM and I, wereclassified some of the individual performance indicators to form twomain groups – an RCM group comprising 72 indices, and an I group
one company in that of another, but in a different country).13 These pillars are respectively institutions, infrastructure, macro economy, health
and technological readiness, business sophistication and innovation. See Chapter 1.1 of World Economic Forum (2005, pp. 22 24).
14
respondents are given in chapter 4.1 of World Economic Forum (2005).
Transnational Corporations, Vol. 17, No. 3 (December 2008) 9
made up of 70 indices. We further divided these two groups into threefurther subgroups. Market characteristics (Mc), technological capacity(T), and infrastructure and support services (Is) made up the RCMgroup; institutions (Ip), market efficiency (Me), and innovation Systems(In) constituted the I group.
5. The models
5.1 Inward FDI
In our empirical study, we distinguished between two alternativevariants of Proposition 115 on the likely impact of locational competitiveness on inward FDI. The first is that such competitivenessshould attract the exploitation or augmentation of the ownership specificadvantages of the investing firms (i.e. by adding further value). Thesecond is that since such competitiveness, at least partly, reflects theownership advantages of established firms – both domestically and foreign owned, it could be that the unique ownership advantages of foreign TNCs do not match up to those of the domestic sector, and thusthere would be less FDI. Such, for example, was very much the casein the 1950s and 1960s, when there was little FDI in the United Statesbecause, among other reasons, the locational competitiveness of thecountry reflected the superior competitive advantages of its indigenousfirms, and its institutions, vis-à-vis those of foreign competitors.16
When considering the relative locational attractions of RCMand I (and/or the individual components of each), which is the morelikely to act as a deterrent in the second scenario described above? It is our proposition that, within a particular location, I is less likely tobe O specific than is RCM; in other words, that the components of I (e.g. market efficiency, incentive structures and innovation systems) arelikely to have a broadly similar affect on the competitive prowess of both foreign owned and domestic firms. Therefore, of the two, I is less likely to deter inward FDI.
15 These alternatives propositions are: alternative 1 – locational competitiveness
16 In the language of the eclectic paradigm, if the competitiveness of RCM and
10 Transnational Corporations, Vol. 17, No. 3 (December2008)

Finally, we would reiterate an earlier point, viz. that other factors – notably the quality, availability and price of indigenous primary products– e.g. oil, hard minerals and agricultural goods – are less likely to beshown up in competitive indices than their counterparts in the secondaryor tertiary sectors.17 We then have two alternative hypotheses to test.The first is a generalized hypothesis which examines the significanceof each host country, relative to all other countries of the two groups of variables. This suggests a positive relationship between the dependent and explanatory variables (see proposition 1).18 Therefore we postulatethe following relationship:
IFDI = f1
ff (RCM, I), (1.1)
where IFDI denotes inward FDI. The second attempts to assess thesignificance of the components of RCM and I viz. for each countryrelative to that of all other countries (see proposition 2). Thus, wehave:
IFDI = f2
ff (Mc,T,Is) (Ip,Me
,In), (1.2)
where Mc denotes market characteristics; T denotes technologicalcapacity; and I
S denotes infrastructure and support services; Ip denotes
extra market public and private institutions; Me denotes market efficiency; and In denotes quality of (macro) innovation systems. Asalready indicated, we acknowledge that these variables do not embraceall the possible determinants of inward FDI. Several plausible factors,lsuch as the strategies of competing firms and the FDI policies of homegovernments, are excluded. We also accept that inward FDI might bedeterred by the competitiveness of indigenous firms, while outward FDIof an asset augmenting kind might reflect a weakness rather of a strengthof the investing firms. However, the data for those variables included are obtained from the same source, and their method of calculation isreasonably well standardized.
In testing the relationship 1.1, we have added three “other” countryspecific variables, not covered by the global competitiveness index, ascontrol variables. These are: (1) population (P) to represent the size of country; (2) the proportion of exports accounted for by primary products(E
p) to represent the endowments of natural resources; and (3) the ratio
17
in the GCI.18 Though we accept that in some circumstances and in the case of RCM the
relationship could be a negative one.
Transnational Corporations, Vol. 17, No. 3 (December 2008) 11
between the value of privatization and inbound FDI (Pr) as a proxy for
the drawing power of such schemes particularly in transition economies.We hypothesize each of these variables to be positively related to inward FDI (propositions 1 and 2). For P, we take data for 2004 from GCR.For E
p,our data source is UNDP (2004); and for P
r we assign a dummy
r
variable of 0p,p,
5. The full specification of equation 1.1, which againhypothesizes that each of the independent variables positively affectsinward FDI, then becomes:
IFDI = f3
ff (RCM, I, P, Ep, Pr). (1.3)
5.2 Outward FDI
The received international business literature suggests that firmswill engage in outward FDI when (a) their unique competitive, or Ospecific, advantages make it possible for them to effectively competewith indigenous firms in the markets they are intending to serve; (b) that it is better to locate at least some of their value added activities in thesemarkets (or elsewhere outside the home country) rather than export to thecountry in question and (c) that the ownership of the foreign productivefacilities is preferred to selling (e.g. by licensing or other contractualmeans) the rights to exploit the O advantages to a foreign based firm.
More recently (since the early 1990s), an alternative explanationof outward FDI has been increasingly emphasized. In contrast to theobjective of more effectively exploiting their existing ownership gadvantages (via market, natural resource and efficiency seeking FDI),some firms may wish to engage in FDI in order to augment their townership advantages; and to do so by acquiring or tapping into foreignbased RCM and Is. As with inward FDI, the competitiveness of homebased TNCs and their countries of origin might be seen as either astrength or a weakness for going abroad.19 Again, the question arises asto whether such FDI is likely to be of an RCM or an I kind, and whether the ownership advantages (or disadvantages) of the investing firms arecommon among the firms in their home country (or in the countries inwhich they operate) or they are specific to a particular firm or group of firms.20
19 And, indeed in many cases, a combination of the two.20
(Rugman, 2006)
12 Transnational Corporations, Vol. 17, No. 3 (December2008)
This having been said, the content of the variables explainingoutward FDI are postulated to be similar to those explaining inward FDIviz. for each home country, relative to all other countries competing for the same investment. So the relevant equations used to test propositions3 and 4 set out on page 12 are:
OFDI = g1(RCM, I), (2.1)
for the generalized proposition and
OFDI = g2
g (Mc, T, Is) (Ip, Me, In), (2.2)
for the components for RCM and I, where OFDI denote outward FDI.As in the case of 1.1, we also include the three control variables. Thus,the complete equation for 2.1 becomes:
OFDI = g3(RCM, I, P, Ep
, Pr). (2.3)
6. The data
We define the dependent variables in each set of equations asthe ratio between a country’s share of global FDI stock and its sharein global gross domestic product (GDP) (as measured in dollars at thecurrent exchange rate in 2006). We normalize for size of country asis also done for each of the independent variables. We use FDI stock (accumulated flows) figures. We believe the stock data better reflectsthe long term intentions of foreign investors, and their response to L specific attractions than FDI flows because over the last decade, theannual flow data have been greatly influenced by the volatility of M&Asand privatization deals. For the independent and competitive related variables, we use the rankings of the 117 countries contained in GCR.For the control variables we extract data from World Economic Forum(2005), UNIDO (2004) and WIR (2002).
In some cases, our rankings are based on hard data, e.g. most market-based and several technology-related variables. In others,they reflect the ranking (on a scale 1 7) assigned by 10,993 business executives from the 117 countries.21 The survey was conducted by theWorld Economic Forum between January and May 2005.
21
of the way in which the Executive Opinion Survey was conducted is set out in World Economic Forum (2005), chapter 4.1, p. 213.
Transnational Corporations, Vol. 17, No. 3 (December 2008) 13
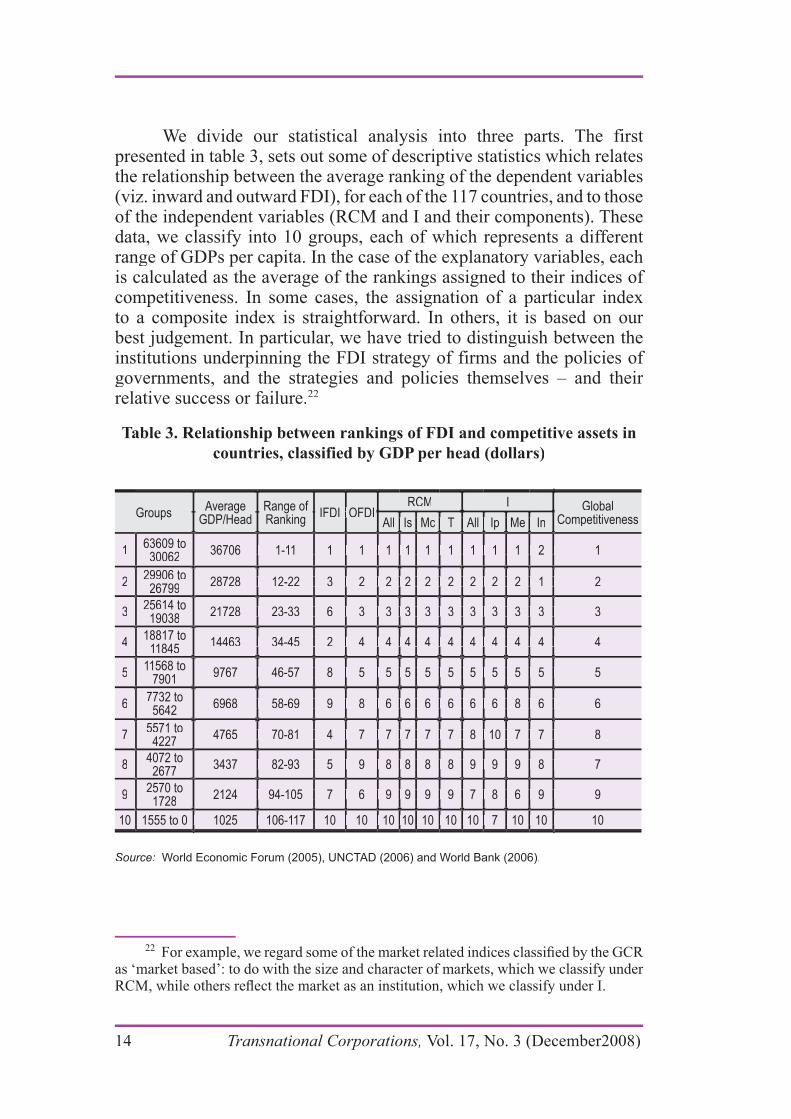
We divide our statistical analysis into three parts. The first presented in table 3, sets out some of descriptive statistics which relatesthe relationship between the average ranking of the dependent variables(viz. inward and outward FDI), for each of the 117 countries, and to thoseof the independent variables (RCM and I and their components). Thesedata, we classify into 10 groups, each of which represents a different range of GDPs per capita. In the case of the explanatory variables, eachis calculated as the average of the rankings assigned to their indices of competitiveness. In some cases, the assignation of a particular indexto a composite index is straightforward. In others, it is based on our best judgement. In particular, we have tried to distinguish between theinstitutions underpinning the FDI strategy of firms and the policies of governments, and the strategies and policies themselves – and their relative success or failure.22
Table 3. Relationship between rankings of FDI and competitive assets in
countries, classified by GDP per head (dollars)
GroupsAverage
GDP/HeadRange of Ranking
IFDI OFDIRCM I Global
CompetitivenessAll Is Mc T All Ip Me In
1163609 to63609 to3006230062
36706 1-11 1 1 1 1 1 1 1 1 1 2 1 36706 1-11 1 1 1 1 1 1 1 1 1 2 1
2229906 to29906 to2679926799
28728 12-22 3 2 2 2 2 2 2 2 2 1 2 28728 12-22 3 2 2 2 2 2 2 2 2 1 2
3325614 to25614 to1903819038
21728 23-33 6 3 3 3 3 3 3 3 3 3 321728 23-33 6 3 3 3 3 3 3 3 3 3 3
4418817 to18817 to
118451184514463 34-45 2 4 4 4 4 4 4 4 4 4 414463 34-45 2 4 4 4 4 4 4 4 4 4 4
5511568 to 11568 to
790179019767 46-57 8 5 5 5 5 5 5 5 5 5 59767 46-57 8 5 5 5 5 5 5 5 5 5 5
667732 to7732 to56425642
6968 58-69 9 8 6 6 6 6 6 6 8 6 66968 58-69 9 8 6 6 6 6 6 6 8 6 6
775571 to5571 to42274227
4765 70-81 4 7 7 7 7 7 8 10 7 7 84765 70-81 4 7 7 7 7 7 8 10 7 7 8
884072 to4072 to26772677
3437 82-93 5 9 8 8 8 8 9 9 9 8 73437 82-93 5 9 8 8 8 8 9 9 9 8 7
992570 to2570 to17281728
2124 94-105 7 6 9 9 9 9 7 8 6 9 9 2124 94-105 7 6 9 9 9 9 7 8 6 9 9
1025 106-117 10 10 10 10 10 10 10 7 10 10 101025 106-117 10 10 10 10 10 10 10 7 10 10 1010 1555 to 010 1555 to 0
Source: World Economic Forum (2005), UNCTAD (2006) and World Bank (2006).
22
as ‘market based’: to do with the size and character of markets, which we classify under
14 Transnational Corporations, Vol. 17, No. 3 (December2008)
The second exercise is a straightforward econometric one, and consists of investigating the propositions presented above. We earlier set out some thoughts about both of the possible directions of therelationship between FDI and the explanatory variables; and also of therelative significance of each of the two or six indices identified. Table 4exhibits the regression equations, correlation coefficients and degrees of significance in respect of the four propositions.
Lastly, table 5 displays these equations for three groups of countries – viz. (i) lower income countries (groups 1–4 in table 3), (ii)the medium income countries (groups 5 7), and (iii) the upper incomecountries (groups 8–10).
7. The results
7.1 Descriptive statistics
In table 3, it can be seen that both RCM and I (as well as most of their components) correspond well to our ranking of competitiveness,viz. GDP per head, and to outward FDI. Indeed, outward FDI and market efficiency (Me) – one of the I variables – are perfectly matched.However, the correspondence between RCM and I to inward FDI ismore mixed. For inward FDI, the most misaligned groups are groups5, 6, 7 and 8. However, among these groups, we might identify severaloutlier countries, which may explain the irregular rankings. In group 5,for example, as column 4 shows, whereas the rankings of GDP per head for countries in this group are between 46 and 57, the ranking of inward FDI for Russian Federation is 91, for Uruguay 92, and for Botswana104. Similarly, in group 6, while the ranking of GDP per head rangesfrom 58 to 69, the ranking of inward FDI for Turkey is 103 and Algeria108. Besides, historical, cultural and political reasons that may explainthese exceptions, market size seems a critical factor influencing theinward FDI.
While groups 5 and 6 have competitive indices which tend to lag inward FDI, exceptions in groups 7 and 8 suggest an oppositephenomenon. In group 7, column 4 shows whereas the ranking of GDP per head in this group is between 70 and 81, the ranking of inward FDI for Guyana, Jamaica, Morocco and Jordan are 5, 13, 31 and 36,respectively. Each of these countries displays a relatively high inward FDI compared to their GDP per head. Similarly, Azerbaijan, Nicaragua,Bolivia, Ecuador, Georgia and Honduras in group 8 reveal above averagerankings in respect of their inward FDI stock compared with their GDP
Transnational Corporations, Vol. 17, No. 3 (December 2008) 15
per head. It can be seen that most of the exceptions in groups 7 and 8are from Latin America and Africa. Here, we may speculate that FDIdirected to resource-seeking (either natural resource or labour) activitiesexplains most of the apparently irregular patterns.
In general, the rankings of our RCM and I variables, as well astheir components, correspond relatively well to those of inward and outward FDI, and competitiveness. Therefore, we (tentatively) concludeour first proposition (set out on page 12) viz. – the more pronounced the competitive advantages of a country, the more its share of the world inward & outward FDI stock – is supported.k
7.2 Econometric tests
The results presented in table 4 confirm proposition 3 and givesome support to propositions 2 and 4; they also suggest that inward FDI is mainly market oriented (the highly significant variable Me).We also find that outward FDI is influenced by the quality of homecountry institutions (the highly significant I variable). In other words,the O advantages of the outward investing firms strongly reflect theinstitutional environment of their home country.
Table 4 reports the coefficients for the aggregate RCM and Ivariables, and for the breakdown of these aggregate variables into their component variables. Table 4(a) presents the complete set of results for the equations run to determine the IFDI and OFDI variables, and thoserelevant to Proposition 1. For ease of discussion, tables 4(b) and 4(c)group results selected from table 4(a) according to their relevance topropositions 3, 2 and 4, respectively.23
Relevant to Proposition 1, two of the RCM component variables intable 4(a) – viz. infrastructure and support service (Is) and technologicalcapability (T) – are significant determinants of inward FDI (equation1.2). However, T is found to have a significant negative effect uponinward FDI, which suggests that the competitive strengths of local firmsact as a deterrent. This supports the second of our alternative versions of proposition 1, viz. locational competitiveness, at least partly, reflects theownership advantages of established indigenous firms. This reasoningsuggests that the unique O advantages of foreign TNCs are inferior within the context of the host domestic sector, thus inducing a negative
23
from transformation into logarithmic form.
16 Transnational Corporations, Vol. 17, No. 3 (December2008)
relationship between host country strengths and inward FDI. In the samevein, when we break down the RCM variable in the outward FDI studyrelevant to Proposition 3, in equation 2.2 of table 4(b), the results showinfrastructure and support service (Is) to be positively and significantlyrelated to outward FDI by TNCs, which supports our third propositionthat the competitive advantages of firms in home countries will be apositive determinant of outward FDI.
For propositions 2 and 4 on the role of institutional based characteristics (I), the aggregate I variable in table 4(c) shows a positiverelationship with both inward FDI and outward FDI (equations 1.1and 2.1), although this variable loses significance in equation 1.3 (for inward FDI, relevant to proposition 2) when control variables are added.In the breakdown analysis for the I variable (equations 1.2 and 2.2)market efficiency (Me) shows a strong positive correlation with bothinward FDI and outward FDI. In equation 2.2, extra-market public and
significant level. The quality of the indigenous innovation system (In)demonstrates a significant contrary negative relationship in equation2.2 for outward FDI, which suggests further investigation is required.Collectively, the results presented in table 4(c) offer some support for propositions 2 and 4. In particular, support for Proposition 2 is given bythe finding that the content and quality of the institutions of a country arean important influence on the extent of its inward FDI. For Proposition3; the finding that I advantages are an important, and possibly anincreasingly important, determinant of the extent of outward FDI. Inother words, the aggregate institutional variable I, and its components,play an important role in determining both inward and outward FDI.Further results relevant to propositions 2 and 4 are presented in table5, and are discussed in the following section. To conclude the present section we briefly discuss the control variables and report the results of a supplementary stepwise regression procedure.
Of the control variables, privatization schemes (Pr), when run withthe RCM variable, appears to be significantly associated with outward FDI. The role of this variable is to control for the fact that privatizationencourages the development of entrepreneurship. However, population(P) is negatively related to inward FDI, in table 4, which is controllingeffectively for the fact that global FDI is predominantly directed towardsthe less populous industrialized countries.
Transnational Corporations, Vol. 17, No. 3 (December 2008) 17
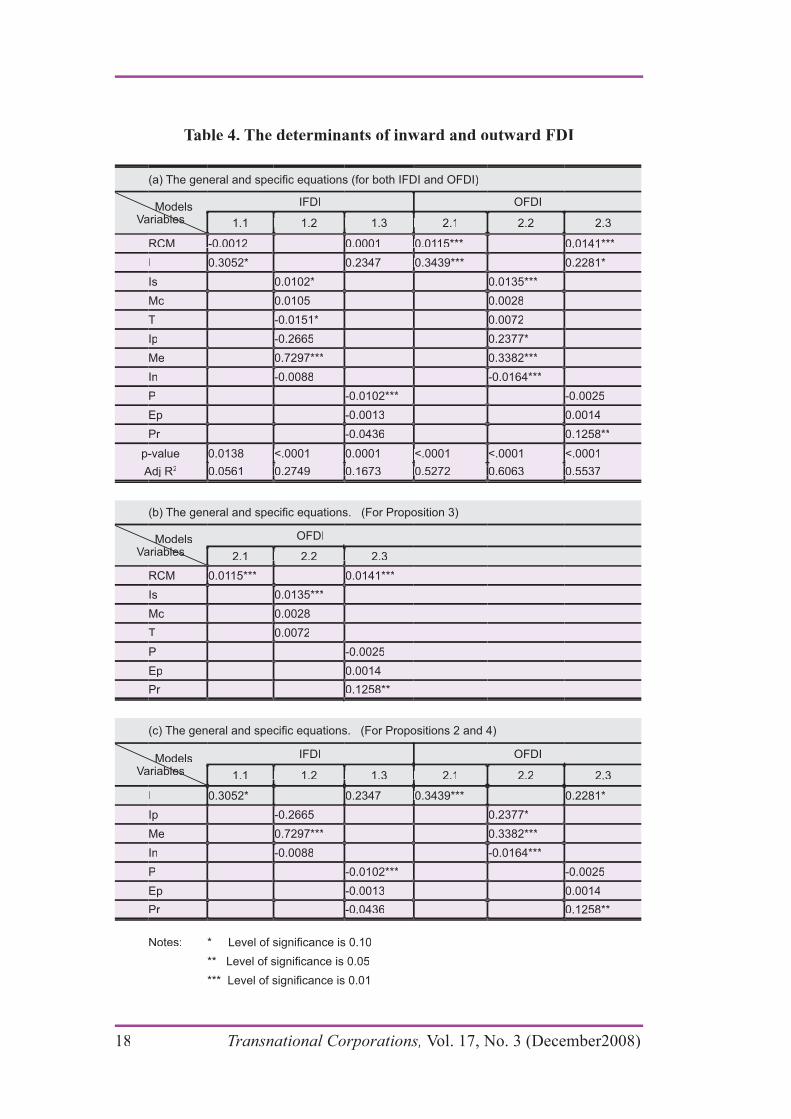
Table 4. The determinants of inward and outward FDI
Models
1.1 1.2 1.3 2.1 2.2 2.3
RCM -0.0012RCM -0.0012 0.0001 0.0115***0.0001 0.0115*** 0.0141***0.0141***
0.3052*0.3052* 0.2347 0.3439***0.2347 0.3439*** 0.2281*0.2281*
0.0102*0.0102* 0.0135***0.0135***
McMc 0.01050.0105 0.00280.0028
TT -0.0151*-0.0151* 0.00720.0072
-0.2665-0.2665 0.2377*0.2377*
MeMe 0.7297***0.7297*** 0.3382***0.3382***
-0.0088-0.0088 -0.0164***-0.0164***
PP -0.0102***-0.0102*** -0.0025-0.0025
EpEp -0.0013-0.0013 0.00140.0014
PrPr -0.0436-0.0436 0.1258**0.1258**
p-value 0.0138 <.0001 0.0001 <.0001 <.0001 <.0001p-value 0.0138 <.0001 0.0001 <.0001 <.0001 <.0001
Adj RAdj R22 0.0561 0.2749 0.1673 0.5272 0.6063 0.55370.0561 0.2749 0.1673 0.5272 0.6063 0.5537
Models
2.1 2.2 2.3
RCM 0.0115***RCM 0.0115*** 0.0141***0.0141***
0.0135***0.0135***
McMc 0.00280.0028
TT 0.00720.0072
PP -0.0025-0.0025
EpEp 0.00140.0014
PrPr 0.1258**0.1258**
Models
1.1 1.2 1.3 2.1 2.2 2.3
0.3052* 0.2347 0.3439*** 0.2281*
-0.2665-0.2665 0.2377*0.2377*
MeMe 0.7297***0.7297*** 0.3382***0.3382***
-0.0088-0.0088 -0.0164***-0.0164***
PP -0.0102***-0.0102*** -0.0025-0.0025
EpEp -0.0013-0.0013 0.00140.0014
PrPr -0.0436-0.0436 0.1258**0.1258**
Notes:
18 Transnational Corporations, Vol. 17, No. 3 (December2008)
To identify those RCM and I variables that correlate most closely with FDI stocks (propositions 3 and 4), we executed a stepwise test for all variables, and examined the isolated effects of each variable (theresults are presented in appendix A). The order of entry of the variablesis determined by the results from SAS stepwise procedures. For inward FDI, an adjusted R2 of 0.0718 is obtained using the aggregate I variable alone, while adding the aggregate RCM variable improves it by only0.0006. Therefore, we conclude that the I advantages of the host countrieswould appear to be the major determinants of inward FDI in equations1.1 and 1.2 in table 4. However, when including the control variables, in1.3, we can note that population (P) becomes the key variable for inward FDI (it adds 0.1260 to equation R2). This is not a surprising result for control variables, as their role is already established; it is to be expected that the main variables, by virtue of their experimental nature, willrecord less predictable results. In order of explanatory contribution, of the components of RCM and I, market efficiency (Me) is shown to havethe most important positive impact, followed by Ip, T, Is, In, and Mc.
For outward FDI, RCM alone obtains an adjusted R2 of 0.4998 in explaining outward FDI, while adding I only improves the equation’sexplanatory power by 0.0356. This would then suggest that RCM is themore important of the two generic variables in determining outward FDI.Among the control variables, population (P) and privatization schemes(Pr) have the strongest effect. Of the components of the main variables,the following order in terms of explanatory contribution is obtained: Ip,Is, Me, T, In, and Mc. The supplementary stepwise analysis supports theresults in table 4, and our findings.
7.3 Economic development and FDI
We now turn to consider the possibility that the results so far described might be related to the stage of development of a country.To test the relationship between the stage of economic development of a country and the interaction between its competitiveness & RCM/Iand FDI, we divided the 117 countries identified by the GCR into threegroups, based on their GDP per head, with Group 1 being the lowest income group (for details, see Appendix B). The results are set out intable 5. In the third (high income) group, which includes all the richest countries around the world, RCM is significantly correlated withoutward FDI, and supports Proposition 3 (see table 5 (b)). But contrary toexpectations, the variable I in this group is not significant in determininginward FDI and outward FDI (see table 5 (c)); indeed it appears to be
Transnational Corporations, Vol. 17, No. 3 (December 2008) 19

negatively associated with both inward FDI (when run in conjunctionwith the control variables) and outward FDI. Again we can invoke thedeterrent effects of strong firms within advanced host economies toexplain the negative relationship between I and inward FDI. To account for the negative relation between I and outward FDI it is possible toargue that a reduced incentive to invest abroad might apply when theinstitutional environment at home is superior to foreign locations. Weshould also bear in mind that a large proportion the inward and outward FDI associated with advanced economies results from intra-Triad M&As; and these are primarily explained by firm- or industry-specificvariables not captured in our research design. For income groups 2 and 3, neither RCM nor I are significantly related to inward FDI in the first two stages. The fact that the adjusted R2 of most equations are low is anindication that the use of aggregate variables, while intended to capturedeterminants that are general to all countries, may suffer from theoreticallimitations. In other words, the approach is still too much influenced bythe experience of the highest income countries of the world.
The incorporation of the component variables provides deeper insights into relationships between FDI and level of development.For inward FDI, at low development levels, extra market public and private institutions (Ip) and technological capacity (T) are positively and significantly related to inward FDI, while T has a negative coefficient.In middle development group, Ip records a significant negativerelationship with inward FDI, while market efficiency (Me) becomesthe most important positive determinant of inward FDI. In the third (high income) group, along with the similar effects of Ip and Me tothose in group 2, infrastructure and support services (Is) become one of the major elements effecting inward FDI. This is clearly one of the most important locational attractions of developed countries.
We should note that, for the component study of outward FDI, onlyequation 4.2 for the high income group of countries achieves an adequateR2. Here, infrastructure and support services (Is) and market efficiency(Me) of such countries are found to be positive and significant, whilethe coefficient of the quality of the home country’s innovation system(In) is negative. Additionally, the coefficients of the variable In in eachof the outward FDI equations, as well as in the last two groups of theinward FDI equations, are negative. This may suggest the existence, or legacy from, some form of techno-nationalism associated with economicdevelopment for some countries.
20 Transnational Corporations, Vol. 17, No. 3 (December2008)
Therefore, from the above analysis in table 5, we can concludethat there is some support for our propositions 2 and 4. With the levelof economic development, aggregate variables RCM and I display anincreasing importance for inward FDI and outward FDI, although this isless apparent for inward FDI. Some of the components of RCM (especiallyIs) and I (especially Me) individually reveal a stronger relationship withinward FDI and outward FDI as the level of development rises.
For the control variables, population (P) once again manifests astrong influence on inward FDI in all three groups. As we expected, theproportion of exports accounted FDI by a country (Ep) is positively related
in the second group, whereas it turns to be negatively related to inward FDI in the third group comprising the advanced economies. In other words, at least some inward FDI to primary producing, or developingeconomies are resource-seeking kinds of investments, correspondingto our earlier conjecture that firms seeking natural resources will bemost be attracted by the availability and quality of the relevant primaryproducts.
Finally, we looked at the key variables identified in the stepwisestudy, which provided further information of determinants of inward and outward FDI under different development stages. Shifts in thedeterminants of inward FDI is demonstrated by the coefficients and the significance levels of variables. This follows an order, from Ip inthe low income group, to Me in the more developed levels (the second and third groups). As Ip and Me are both institutional variables, thisprogression corresponds with the results in table 4 and supports our Proposition 2. Furthermore, for outward FDI, RCM component (Is) and I component (Me) become significant in the third group, which not onlydemonstrates a balancing of the determinants among RCM and I factors,but also indicates the increasingly important role played by institutionaladvantages in determining outward FDI, along with the economicdevelopment of countries (as suggested by Proposition 4).
Transnational Corporations, Vol. 17, No. 3 (December 2008) 21
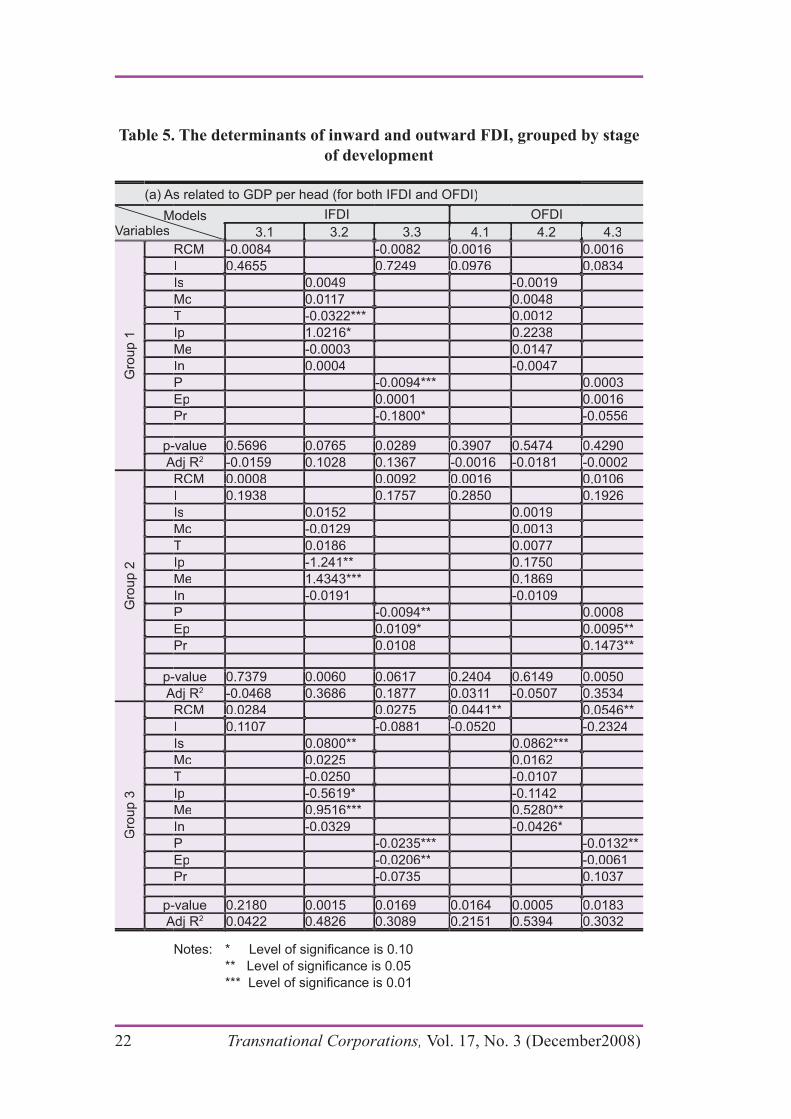
Table 5. The determinants of inward and outward FDI, grouped by stage
of development
Models 3.1 3.2 3.3 4.1 4.2 4.3
Gro
up 1
Gro
up 1
RCM -0.0084RCM -0.0084 -0.0082 0.0016-0.0082 0.0016 0.00160.0016
0.46550.4655 0.7249 0.09760.7249 0.0976 0.08340.0834
0.00490.0049 -0.0019-0.0019
McMc 0.01170.0117 0.00480.0048
TT -0.0322***-0.0322*** 0.00120.0012
1.0216*1.0216* 0.22380.2238
MeMe -0.0003-0.0003 0.01470.0147
0.00040.0004 -0.0047-0.0047
PP -0.0094***-0.0094*** 0.00030.0003
EpEppp 0.00010.0001 0.00160.0016
PrPr -0.1800*-0.1800* -0.0556-0.0556
0.5696 0.0765 0.0289 0.3907 0.5474 0.42900.5696 0.0765 0.0289 0.3907 0.5474 0.4290p-valuep-valueppAdj RAdj Rjj 22 -0.0159 0.1028 0.1367 -0.0016 -0.0181 -0.0002-0.0159 0.1028 0.1367 -0.0016 -0.0181 -0.0002
Gro
up 2
Gro
up 2
RCM 0.0008RCM 0.0008 0.0092 0.00160.0092 0.0016 0.01060.0106
0.19380.1938 0.1757 0.28500.1757 0.2850 0.19260.1926
0.01520.0152 0.00190.0019
McMc -0.0129-0.0129 0.00130.0013
TT 0.01860.0186 0.00770.0077
-1.241**-1.241** 0.17500.1750
MeMe 1.4343***1.4343*** 0.18690.1869
-0.0191-0.0191 -0.0109-0.0109
PP -0.0094**-0.0094** 0.00080.0008
EpEppp 0.0109*0.0109* 0.0095**0.0095**
PrPr 0.01080.0108 0.1473**0.1473**
0.00500.00500.7379 0.0060 0.0617 0.2404 0.61490.7379 0.0060 0.0617 0.2404 0.6149p-valuep-valueppAdj RAdj Rjj 22 -0.0468 0.3686 0.1877 0.0311 -0.0507 0.3534-0.0468 0.3686 0.1877 0.0311 -0.0507 0.3534
Gro
up 3
Gro
up 3
RCM 0.0284RCM 0.0284 0.0275 0.0441**0.0275 0.0441** 0.0546**0.0546**
0.11070.1107 -0.0881 -0.0520-0.0881 -0.0520 -0.2324-0.2324
0.0800**0.0800** 0.0862***0.0862***
McMc 0.02250.0225 0.01620.0162
TT -0.0250-0.0250 -0.0107-0.0107
-0.5619*-0.5619* -0.1142-0.1142
MeMe 0.9516***0.9516*** 0.5280**0.5280**
-0.0329-0.0329 -0.0426*-0.0426*
PP -0.0235***-0.0235*** -0.0132**-0.0132**
EpEppp -0.0206**-0.0206** -0.0061-0.0061
PrPr -0.0735-0.0735 0.10370.1037
0.01830.01830.2180 0.0015 0.0169 0.0164 0.00050.2180 0.0015 0.0169 0.0164 0.0005p-valuep-valueppAdj RAdj Rjj 22 0.0422 0.4826 0.3089 0.2151 0.5394 0.30320.0422 0.4826 0.3089 0.2151 0.5394 0.3032
Notes:
22 Transnational Corporations, Vol. 17, No. 3 (December2008)
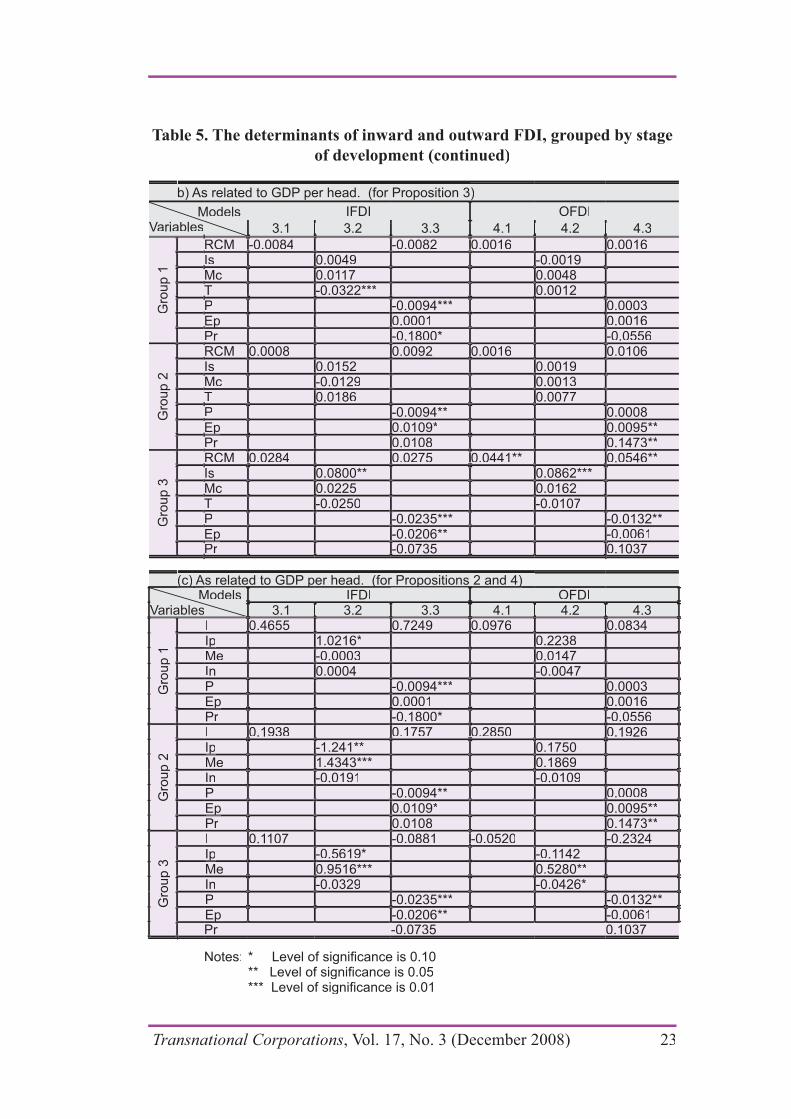
Table 5. The determinants of inward and outward FDI, grouped by stage
of development (continued)
Models 3.1 3.2 3.3 4.1 4.2 4.3
Gro
up 1
Gro
up 1
RCM -0.0084RCM -0.0084 -0.0082 0.0016-0.0082 0.0016 0.00160.00160.00490.0049 -0.0019-0.0019
McMc 0.01170.0117 0.00480.0048TT -0.0322***-0.0322*** 0.00120.0012PP -0.0094***-0.0094*** 0.00030.0003EpEppp 0.00010.0001 0.00160.0016PrPr -0.1800*-0.1800* -0.0556-0.0556
Gro
up 2
Gro
up 2
RCM 0.0008RCM 0.0008 0.0092 0.00160.0092 0.0016 0.01060.01060.01520.0152 0.00190.0019
McMc -0.0129-0.0129 0.00130.0013TT 0.01860.0186 0.00770.0077PP -0.0094**-0.0094** 0.00080.0008EpEppp 0.0109*0.0109* 0.0095**0.0095**PrPr 0.01080.0108 0.1473**0.1473**
Gro
up 3
Gro
up 3
RCM 0.0284RCM 0.0284 0.0275 0.0441**0.0275 0.0441** 0.0546**0.0546**0.0800**0.0800** 0.0862***0.0862***
McMc 0.02250.0225 0.01620.0162TT -0.0250-0.0250 -0.0107-0.0107PP -0.0235***-0.0235*** -0.0132**-0.0132**EpEppp -0.0206**-0.0206** -0.0061-0.0061PrPr -0.0735-0.0735 0.10370.1037
Models 3.1 3.2 3.3 4.1 4.2 4.3
Gro
up 1
Gro
up 1
0.46550.4655 0.7249 0.09760.7249 0.0976 0.08340.08341.0216*1.0216* 0.22380.2238
MeMe -0.0003-0.0003 0.01470.01470.00040.0004 -0.0047-0.0047
PP -0.0094***-0.0094*** 0.00030.0003EpEppp 0.00010.0001 0.00160.0016PrPr -0.1800*-0.1800* -0.0556-0.0556
Gro
up 2
Gro
up 2
0.19380.1938 0.1757 0.28500.1757 0.2850 0.19260.1926-1.241**-1.241** 0.17500.1750
MeMe 1.4343***1.4343*** 0.18690.1869-0.0191-0.0191 -0.0109-0.0109
PP -0.0094**-0.0094** 0.00080.0008EpEppp 0.0109*0.0109* 0.0095**0.0095**PrPr 0.01080.0108 0.1473**0.1473**
Gro
up 3
Gro
up 3
0.11070.1107 -0.0881 -0.0520-0.0881 -0.0520 -0.2324-0.2324-0.5619*-0.5619* -0.1142-0.1142
MeMe 0.9516***0.9516*** 0.5280**0.5280**-0.0329-0.0329 -0.0426*-0.0426*
PP -0.0235***-0.0235*** -0.0132**-0.0132**EpEppp -0.0206**-0.0206** -0.0061-0.0061PrPr -0.0735-0.0735 0.10370.1037
Notes:
Transnational Corporations, Vol. 17, No. 3 (December 2008) 23
8. Conclusions
This paper has investigated the relationship between inward and outward FDI and the locational competitive advantages of some 117 countries. In doing so, it has made use of data for 2005 (or the nearest date) primarily obtained from UNCTAD (2006) and World EconomicForum (2005). We fully recognize the limitations of our data; neither would we presume to have established any causal relationships betweenFDI and host or home country competitiveness. To do this, we would need to relate FDI in time t to competitiveness in an earlier time period t–1,…n, or to undertake a time series exercise. Unfortunately the GCR data, although quite comprehensive for 2003/5, do not allow us to dothis.
The best we can do then is to indicate whether the relationshipsestablished are at least consistent with the analytical framework set out in section 3 of the paper. In general, we think this framework is arobust and useful one. The level of competitiveness does, in general,encourage both inward and outward direct investment, though there aresome exceptions to this general statement – especially with respect toasset-augmenting FDI. This it not to deny or minimize the considerabledata problems relating to the definition and interpretation of both FDIand the explanatory variables. In particular, it is difficult to isolatethe impact of the locational attractions of countries that are availableto indigenous firms and foreign investors on an equal basis, and thosewhich are largely “internalized” – i.e. primarily taken advantage of byindigenous firms – to separate the competitiveness of related variablesfrom the other determinants of inward and outward FDI. A third challenge is to distinguish between the ways in which asset-augmentingand asset-exploiting FDI respond to different kinds of country specificcompetitiveness.
But, at the very least, we hope this contribution takes the debateon competitiveness and FDI – a topic so dear to Sanjaya’s heart – a stagefurther.
References
Buckley, P.J. and M.C. Casson (1975). The Economic Theory of the Multinational Enterprise. London: Macmillan.
Buckley, P.J. and M.C. Casson (1976). The Future of the Multinational Enterprise.London: Macmillan.
24 Transnational Corporations, Vol. 17, No. 3 (December2008)

Dunning, J.H. (1995). “Think again Professor Krugman: competitiveness does matter”,International Executive, 37(4), pp. 315 24.
Dunning, J.H. (2003). Making Globalization Good. Oxford, Oxford University Press.dd
Dunning, J.H. (2005). “Institutional reform, foreign direct investment and Europeantransition economies”, in R. Gross (ed.), International Business and Government Relations in the 21st Centuryt , Cambridge: Cambridge University Press.
Dunning, J.H. (2006). “Towards a new paradigm of development”, Transnational Corporations, 15(1), pp. 173 227
Dunning, J.H. and S. Lundan (2006). “The MNE as a Creator, Fashioner and Respondent to Institutional change”, Reading and Rutgers Universities, mimeo.
Ghoshal, S. and D.E. Westney (eds.) (1993) Organisation theory and the multinational corporation. London: MacMillan.
Glaeser, E.L., R. La Porta, F. Lopez-de-Silanes and A. Schorfer (2004). “Do institutionscause growth?”, National Bureau of Economic Research Working Paper, No.10468. Cambridge, MA: NBER.
Henisz, W.J. (2000). “The institutional environment for multinational investment”,Journal of Law, Economics, and Organization, 16(2), pp. 334 364.
Henisz, W. J. (2003). “The power of the Buckley and Casson thesis: the ability to manageinstitutional idiosyncrasies”, Journal of International Business Studies, 34(2), pp. 173–184.
Hennart, J. (1982). A Theory of the Multinational Enterprise. Ann Arbor, MI: University of Michigan Press.
Krugman, P. (1994). “Competitiveness. a dangerous obsession”, Foreign Affairs, March/April.
Lall, S. (2001). “Competitiveness indices and developing countries. An economicevaluation of the global competitiveness report”, World Development, 29(9), pp. 1501 1525.
Lall, S. (2002). “Linking FDI and technology development for capacity building and strategic competitiveness”, Transnational Corporations, 11(3), pp. 40–88.
Lu, Z. (2006). “Institutional related new strategic assets and performance variation of
Maitland, E. and S. Nicholas (2003). “New institutional economics: an organisingframework for OLI”, in J.C. Cantwell and R. Narula (eds.), International Business and the Eclectic Paradigm. London and New York: Routledge.
Mudambi, R and P. Navarra (2002). “Institutions and international business: a theoreticaloverview”, International Business Review, 11(6), pp. 635 646.
North, D.C. (1990). Institutions, Institutional Change and Economic Performance.Cambridge: Cambridge University Press.
Transnational Corporations, Vol. 17, No. 3 (December 2008) 25
North, D.C. (1994). “Economic performance through time”, American EconomicReview, 84(3), pp. 359 368.
North, D.C. (2005). Understanding the Process of Economic Change. Princeton, NJ:Princeton University Press.
Oliver, C. (1997). “Sustainable competitive advantage: combining institutional and resource based views”, Strategic Management Journal, 18(9), pp. 697 713.
Peng, M.W. (2003). “Institutional transitions and strategic choices”, Academy of Management Review, 28, pp. 275–296.
time? A focus on institutional relatedness”, Academy of Management Review, 30(3),pp. 622 633.
Rondinelli, D.A. (2005). “Assessing government policies for business competitivenessin emerging market economies; an institutional approach” in R. Gross (ed.),International Business and Government Relations in 21st Centuryt . Cambridge: Cambridge University Press.
Rugman, A.M. (2006). “Multinational enterprise strategy for developing countries”, inSubhash C. Jain and Sushil Vachani (eds.), Multinational Corporations and Global Poverty. Cheltenham: Edward Elgar.
UNCTAD (2000). World Investment Report 2000: Cross-Border Mergers, Acquisitions and Development. New York and Geneva: United Nations.
UNCTAD (2004). World Investment Report 2004: The Shift Towards Services. New York and Geneva: United Nations.
UNCTAD (2005). World Investment Report 2005: Transnational Corporations and the Internationalization of R&D. New York and Geneva: United Nations.
UNCTAD (2006). World Investment Report 2006: FDI from Developing and Transition Economies: Implications for Development. New York and Geneva: United Nations.
UNDP (2004) Human Development Report 2004. New York: UNDP.
Williamson, O. (2000). “The New Institutional Economics: taking stock, looking ahead”,Journal of Economic Literature, 38(3), pp. 595–613.
World Bank (2004). World Development Report: A better Investment Climate for Everyone. New York: Oxford University Press.
World Bank (2006) World Development Indicators Database, http://devdata.worldbank.org/data-query/
World Economic Forum(2005). The Global Competitiveness Report 2005/6. Basingstoke: Palgrave.
26 Transnational Corporations, Vol. 17, No. 3 (December2008)

Appendix A: Stepwise test
Model Variablesa aab es
IFDI
1 2 3 4 5 6 7 8 9 10 11 Corr
I 0.2680*** 0.3052* 0.2034 0.2326 0.2347I 0.2680*** 0.3052* 0.2034 0.2326 0.2347 0.10.1
RCM -0.0012 0.0012 0.0007 0.0001RCM -0.0012 0.0012 0.0007 0.0001 0.00.0
PP -0.0099*** -0.0101*** -0.0102***-0.0099*** -0.0101*** -0.0102*** 0.10.1
PrPr -0.0455 -0.0436-0.0455 -0.0436 0.00.0
EpEp -0.0013-0.0013 -0.0-0.0
MeMe 0.4375*** 0.7577*** 0.7566*** 0.6972*** 0.7405*** 0.7297*** 0.20.4375*** 0.7577*** 0.7566*** 0.6972*** 0.7405*** 0.7297*** 0.2
IpIp -0.4017*** -0.4029*** -0.2311 -0.2969* -0.2665 0.1 -0.4017*** -0.4029*** -0.2311 -0.2969* -0.2665 0.1
McMc 0.0001 0.0127** 0.0101 0.0105 0.00.0001 0.0127** 0.0101 0.0105 0.0
TT -0.0163** -0.0212*** -0.0151* 0.0-0.0163** -0.0212*** -0.0151* 0.0
IsIs 0.0087 0.0102* 0.0 0.0087 0.0102* 0.0
InIn -0.0088 0.0-0.0088 0.0
p-value 0.0035 0.0138 <.0001 <.0001 0.0001 0.0367 <.0001 <.0001 <.0001 <.0001 <.0001p-value 0.0035 0.0138 <.0001 <.0001 0.0001 0.0367 <.0001 <.0001 <.0001 <.0001 <.0001
RR22 0.0718 0.0724 0.1984 0.2014 0.2007 0.1914 0.2502 0.2502 0.2904 0.3045 0.31240.0718 0.0724 0.1984 0.2014 0.2007 0.1914 0.2502 0.2502 0.2904 0.3045 0.3124
Model VariablesVariaables
OFDI
1 2 3 4 5 6 7 8 9 10 11 Corr
RCM 0.0194*** 0.0115*** 0.0130*** 0.0135*** 0.0141***RCM 0.0194*** 0.0115*** 0.0130*** 0.0135*** 0.0141*** 0.50.5
II 0.3439*** 0.2510** 0.2305* 0.2281*0.3439*** 0.2510** 0.2305* 0.2281* 0.00.0
PrPr 0.1367*** 0.1279** 0.1258**0.1367*** 0.1279** 0.1258** 0.00.0
PP -0.0026 -0.0025-0.0026 -0.0025 0.00.0
EpEp 0.00140.0014 0.00.0
IpIp 0.7040*** 0.3918*** 0.3325** 0.2289* 0.2248* 0.2377* 0.50.7040*** 0.3918*** 0.3325** 0.2289* 0.2248* 0.2377* 0.5
MeMe 0.3917*** 0.3795*** 0.3892*** 0.3622*** 0.3382*** 0.1 0.3917*** 0.3795*** 0.3892*** 0.3622*** 0.3382*** 0.1
InIn 0.0023 -0.0105** -0.0162*** -0.0164*** 0.00.0023 -0.0105** -0.0162*** -0.0164*** 0.0
IsIs 0.0164*** 0.0142*** 0.0135*** 0.10.0164*** 0.0142*** 0.0135*** 0.1
TT 0.0088 0.0072 0.0 0.0088 0.0072 0.0
McMc 0.0028 0.0 0.0028 0.0
p-value <.0001p-value <.0001<.0001<.0001
<.0001 <.0001 <.0001 <.0001 <.0001 <.0001 <.0001 <.0001 <.0001<.0001 <.0001 <.0001 <.0001 <.0001 <.0001 <.0001 <.0001 <.0001
RR22 0.49980.49980.53540.5354
0.5621 0.5707 0.5730 0.5001 0.5565 0.5590 0.6183 0.6255 0.62670.5621 0.5707 0.5730 0.5001 0.5565 0.5590 0.6183 0.6255 0.6267
Notes:Notes:
Transnational Corporations, Vol. 17, No. 3 (December 2008) 27
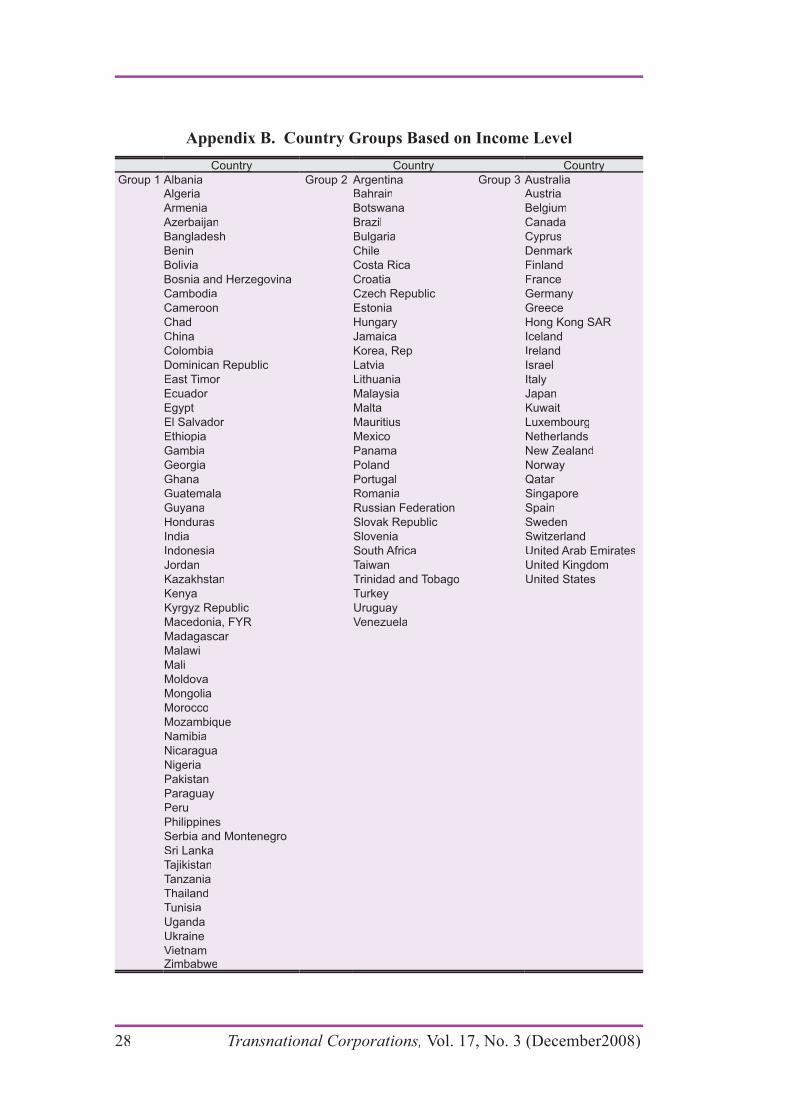
Appendix B. Country Groups Based on Income Level
Countryyyy Countryyyy CountryyyyGroup 1 AlbaniaGroup 1 Albania Group 2 ArgentinaGroup 2 Argentina Group 3 AustraliaGroup 3 Australia
AlgeriaAlgeria BahrainBahrain AustriaAustriaArmeniaArmenia BotswanaBotswana BelgiumBelgiumAzerbaijanAzerbaijan BrazilBrazil CanadaCanadaBangladeshBangladesh BulgariaBulgaria CyprusCyprusBeninBenin ChileChile DenmarkDenmarkBoliviaBolivia Costa RicaCosta Rica FinlandFinlandBosnia and HerzegovinaBosnia and Herzegovina CroatiaCroatia FranceFranceCambodiaCambodia Czech RepublicCzech Republic GermanyGermanyCameroonCameroon EstoniaEstonia GreeceGreeceChadChad HungaryHungary Hong Kong SARHong Kong SARChinaChina JamaicaJamaica IcelandIcelandColombiaColombia Korea, RepKorea, Rep IrelandIrelandDominican RepublicDominican Republic LatviaLatvia IsraelIsraelEast TimorEast Timor LithuaniaLithuania ItalyItalyEcuadorEcuador MalaysiaMalaysia JapanJapanEgyptEgypt MaltaMalta KuwaitKuwaitEl SalvadorEl Salvador MauritiusMauritius LuxembourgLuxembourgEthiopiaEthiopia MexicoMexico NetherlandsNetherlandsGambiaGambia PanamaPanama New ZealandNew ZealandGeorgiaGeorgia PolandPoland NorwayNorwayGhanaGhana PortugalPortugal QatarQatarGuatemalaGuatemala RomaniaRomania SingaporeSingaporeGuyanaGuyana Russian FederationRussian Federation SpainSpainHondurasHonduras Slovak RepublicSlovak Republic SwedenSwedenIndiaIndia SloveniaSlovenia SwitzerlandSwitzerlandIndonesiaIndonesia South AfricaSouth Africa United Arab EmiratesUnited Arab EmiratesJordanJordan TaiwanTaiwan United KingdomUnited KingdomKazakhstanKazakhstan Trinidad and TobagoTrinidad and Tobago United StatesUnited StatesKenyaKenya TurkeyTurkeyKyrgyz RepublicKyrgyz Republic UruguayUruguayMacedonia, FYRMacedonia, FYR VenezuelaVenezuelaMadagascarMadagascarMalawiMalawiMaliMaliMoldovaMoldovaMongoliaMongoliaMoroccoMoroccoMozambiqueMozambiqueNamibiaNamibiaNicaraguaNicaraguaNigeriaNigeriaPakistanPakistanParaguayParaguayPeruPeruPhilippinesPhilippinesSerbia and MontenegroSerbia and MontenegroSri LankaSri LankaTajikistanTajikistanTanzaniaTanzaniaThailandThailandTunisiaTunisiaUgandaUgandaUkraineUkraineVietnamVietnamZimbabweZimbabwe
28 Transnational Corporations, Vol. 17, No. 3 (December2008)
Ap
pen
dix
C (
i) C
ou
ntr
y G
rou
ps
Ba
sed
on
Op
enn
ess
Countr
yyC
ountr
yyC
ountr
yyC
ountr
yyG
roup 1
Alb
ania
Gro
up 1
Alb
ania
Gro
up 2
Azerb
aija
nG
roup 2
Azerb
aija
nG
roup 3
Arm
enia
Gro
up 3
Arm
enia
Gro
up 4
Arg
entina
Gro
up 4
Arg
entina
Alg
eria
Alg
eria
Bangla
desh
Bangla
desh
Austr
iaA
ustr
iaB
ulg
aria
Bulg
aria
Austr
alia
Austr
alia
Belg
ium
Belg
ium
Benin
Benin
Cam
bodia
Cam
bodia
Bahra
inB
ahra
inB
razil
Bra
zil
Boliv
iaB
oliv
iaC
am
ero
on
Cam
ero
on
Bosnia
and H
erz
egovin
aB
osnia
and H
erz
egovin
aC
had
Chad
Bots
wana
Bots
wana
Denm
ark
Denm
ark
Canada
Canada
Colo
mbia
Colo
mbia
Chile
Chile
Egypt
Egypt
Chin
aC
hin
aC
zech R
epublic
Czech R
epublic
Costa
Ric
aC
osta
Ric
aG
uate
mala
Guate
mala
Dom
inic
an R
epublic
Dom
inic
an R
epublic
Eth
iopia
Eth
iopia
Cro
atia
Cro
atia
Hondura
sH
ondura
sE
ast T
imor
East T
imor
Fin
land
Fin
land
Cypru
sC
ypru
sH
ungary
Hungary
Esto
nia
Esto
nia
Germ
any
Germ
any
Ecuador
Ecuador
Icela
nd
Icela
nd
Gam
bia
Gam
bia
Ghana
Ghana
El S
alv
ado
rE
l S
alv
ado
rIn
dia
India
Irela
nd
Irela
nd
Gre
ece
Gre
ece
Fra
nce
Fra
nce
Indonesia
Indonesia
Italy
Italy
Japan
Japan
Georg
iaG
eorg
iaJord
an
Jord
an
Jam
aic
aJam
aic
aLuxem
bourg
Luxem
bourg
Guyana
Guyana
Kore
a,
Rep
Kore
a,
Rep
Kazakhsta
nK
azakhsta
nM
acedonia
, F
YR
Macedonia
, F
YR
Hong K
ong S
AR
Hong K
ong S
AR
Kuw
ait
Kuw
ait
Latv
iaLatv
iaM
ala
wi
Mala
wi
Isra
el
Isra
el
Kyrg
yz R
epublic
Kyrg
yz R
epublic
Mauritius
Mauritius
Mold
ova
Mold
ova
Kenya
Kenya
Lithuania
Lithuania
Para
guay
Para
guay
Mozam
biq
ue
Mozam
biq
ue
Malta
Malta
Madagascar
Madagascar
Phili
ppin
es
Phili
ppin
es
New
Zeala
nd
New
Zeala
nd
Mongolia
Mongolia
Mala
ysia
Mala
ysia
Qata
rQ
ata
rN
igeria
Nig
eria
Moro
cco
Moro
cco
Mali
Mali
Serb
ia a
nd M
onte
negro
Serb
ia a
nd M
onte
negro
Pakis
tan
Pakis
tan
Nam
ibia
Nam
ibia
Mexic
oM
exic
oS
lovak R
epublic
Slo
vak R
epublic
Panam
aP
anam
aN
icara
gua
Nic
ara
gua
Neth
erlands
Neth
erlands
Slo
venia
Slo
venia
Port
ugal
Port
ugal
Norw
ay
Norw
ay
Peru
Peru
Sri L
anka
Sri L
anka
South
Afr
ica
South
Afr
ica
Pola
nd
Pola
nd
Rom
an
iaR
om
an
iaS
witzerland
Sw
itzerland
Spain
Spain
Taiw
an
Taiw
an
Russia
n F
edera
tion
Russia
n F
edera
tion
Trinid
ad a
nd T
obago
Trinid
ad a
nd T
obago
Tunis
iaT
unis
iaTanzan
iaTanzan
iaS
ingapore
Sin
gapore
Ukra
ine
Ukra
ine
United A
rab E
mirate
sU
nited A
rab E
mirate
sT
haila
nd
Thaila
nd
Sw
ede
nS
wede
nU
ruguay
Uru
guay
United K
ingdom
United K
ingdom
Turk
ey
Turk
ey
Tajik
ista
nTajik
ista
nV
enezue
laV
enezue
laV
ietn
am
Vie
tnam
Uganda
Uganda
United S
tate
sU
nited S
tate
sZ
imbabw
eZ
imbabw
e
Transnational Corporations, Vol. 17, No. 3 (December 2008) 29
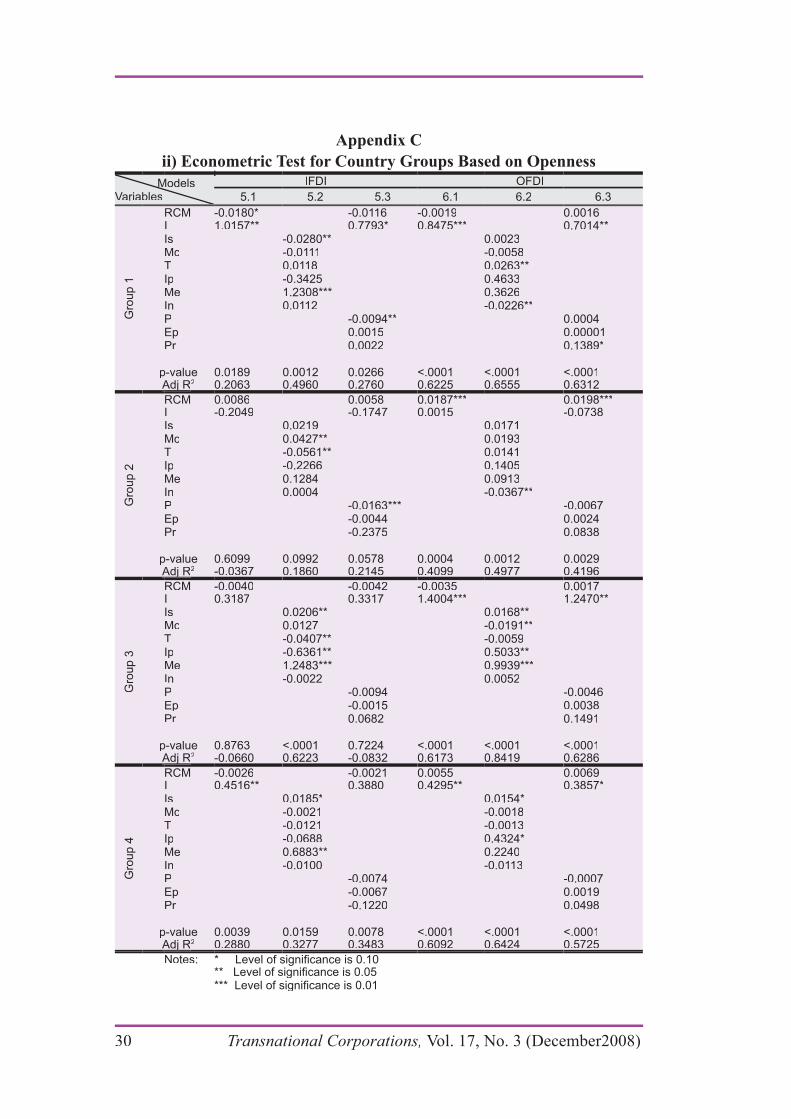
Appendix C
ii) Econometric Test for Country Groups Based on Openness
Models Variables
IFDI OFDI
5.1 5.2 5.3 6.1 6.2 6.3
Gro
up 1
Gro
up 1
RCM -0.0180*RCM -0.0180* -0.0116 -0.0019-0.0116 -0.0019 0.00160.0016I 1.0157**I 1.0157** 0.7793* 0.8475***0.7793* 0.8475*** 0.7014**0.7014**IsIs -0.0280**-0.0280** 0.00230.0023McMc -0.0111-0.0111 -0.0058-0.0058TT 0.01180.0118 0.0263**0.0263**IpIp -0.3425-0.3425 0.46330.4633MeMe 1.2308***1.2308*** 0.36260.3626InIn 0.01120.0112 -0.0226**-0.0226**PP -0.0094**-0.0094** 0.00040.0004EpEp 0.00150.0015 0.000010.00001PrPr 0.00220.0022 0.1389*0.1389*
p-value 0.0189 0.0012 0.0266 <.0001 <.0001 <.0001p-value 0.0189 0.0012 0.0266 <.0001 <.0001 <.0001Adj RAdj Rjj 22 0.2063 0.4960 0.2760 0.6225 0.6555 0.63120.2063 0.4960 0.2760 0.6225 0.6555 0.6312
Gro
up 2
Gro
up 2
RCM 0.0086RCM 0.0086 0.0058 0.0187***0.0058 0.0187*** 0.0198***0.0198***I -0.2049I -0.2049 -0.1747 0.0015-0.1747 0.0015 -0.0738-0.0738IsIs 0.02190.0219 0.01710.0171McMc 0.0427**0.0427** 0.01930.0193TT -0.0561**-0.0561** 0.01410.0141IpIp -0.2266-0.2266 0.14050.1405MeMe 0.12840.1284 0.09130.0913InIn 0.00040.0004 -0.0367**-0.0367**PP -0.0163***-0.0163*** -0.0067-0.0067EpEp -0.0044-0.0044 0.00240.0024PrPr -0.2375-0.2375 0.08380.0838
p-value 0.6099 0.0992 0.0578 0.0004 0.0012 0.0029p-value 0.6099 0.0992 0.0578 0.0004 0.0012 0.0029Adj RAdj Rjj 22 -0.0367 0.1860 0.2145 0.4099 0.4977 0.4196-0.0367 0.1860 0.2145 0.4099 0.4977 0.4196
Gro
up 3
Gro
up 3
RCM -0.0040RCM -0.0040 -0.0042 -0.0035-0.0042 -0.0035 0.00170.0017I 0.3187I 0.3187 0.3317 1.4004***0.3317 1.4004*** 1.2470**1.2470**IsIs 0.0206**0.0206** 0.0168**0.0168**McMc 0.01270.0127 -0.0191**-0.0191**TT -0.0407**-0.0407** -0.0059-0.0059IpIp -0.6361**-0.6361** 0.5033**0.5033**MeMe 1.2483***1.2483*** 0.9939***0.9939***InIn -0.0022-0.0022 0.00520.0052PP -0.0094-0.0094 -0.0046-0.0046EpEp -0.0015-0.0015 0.00380.0038PrPr 0.06820.0682 0.14910.1491
p-value 0.8763 <.0001 0.7224 <.0001 <.0001 <.0001p-value 0.8763 <.0001 0.7224 <.0001 <.0001 <.0001Adj RAdj Rjj 22 -0.0660 0.6223 -0.0832 0.6173 0.8419 0.6286-0.0660 0.6223 -0.0832 0.6173 0.8419 0.6286
Gro
up 4
Gro
up 4
RCM -0.0026RCM -0.0026 -0.0021 0.0055-0.0021 0.0055 0.00690.0069I 0.4516**I 0.4516** 0.3880 0.4295**0.3880 0.4295** 0.3857*0.3857*IsIs 0.0185*0.0185* 0.0154*0.0154*McMc -0.0021-0.0021 -0.0018-0.0018TT -0.0121-0.0121 -0.0013-0.0013IpIp -0.0688-0.0688 0.4324*0.4324*MeMe 0.6883**0.6883** 0.22400.2240InIn -0.0100-0.0100 -0.0113-0.0113PP -0.0074-0.0074 -0.0007-0.0007EpEp -0.0067-0.0067 0.00190.0019PrPr -0.1220-0.1220 0.04980.0498
p-value 0.0039 0.0159 0.0078 <.0001 <.0001 <.0001p-value 0.0039 0.0159 0.0078 <.0001 <.0001 <.0001Adj RAdj Rjj 22 0.2880 0.3277 0.3483 0.6092 0.6424 0.57250.2880 0.3277 0.3483 0.6092 0.6424 0.5725
Notes:
30 Transnational Corporations, Vol. 17, No. 3 (December2008)

Asia’s “upgrading through innovation”
strategies and global innovation
networks: an extension of
Sanjaya Lall’s research agenda
Dieter Ernst *
This paper demonstrates that the late Professor Sanjaya Lall’s framework This paper demonstrates that the late Professor Sanjaya Lall’s framework for analysing Asian pathways to development remains valid today.for analysing Asian pathways to development remains valid today.This is done by extending the framework to apply in circumstancesThis is done by extending the framework to apply in circumstanceswhere globalization of markets has moved beyonds goods and financewhere globalization of markets has moved beyonds goods and financeto technology and knowledge workers. The concept of “industrialto technology and knowledge workers. The concept of “industrialupgrading” is used to identify conditions under which Asian countriesupgrading” is used to identify conditions under which Asian countriescould reap the benefits of innovation offshoring. The analysis shows that could reap the benefits of innovation offshoring. The analysis shows that Lall was right to emphasize a divergence between the private interestsLall was right to emphasize a divergence between the private interestsof the TNCs and the social interests of the host economy in terms of of the TNCs and the social interests of the host economy in terms of long-term technology development. His plea for industrial policy islong-term technology development. His plea for industrial policy iseven more relevant today, since the stakes and risks have become mucheven more relevant today, since the stakes and risks have become muchgreater, as countries seek to move beyond the “global factory” model togreater, as countries seek to move beyond the “global factory” model to“upgrading through innovation” strategies.“upgrading through innovation” strategies.
Keywords: innovation, industrial upgrading, global innovationnetworks, global production networks, learning, innovation policies,capabilities, TNCs, Asian development strategies
1. Introduction
I first met Sanjaya Lall in the late 1970s, when we were both consultantsfor Surendra J. Patel’s Technology Division at UNCTAD. Since then, hiswritings have had a lasting impact on my research.
This essay is a very personal homage to Lall’s work on technologicalchange and industrialization, in particular his pioneering study on technologicalcapabilities, prepared for the OECD Development Centre (Lall, 1990). I will not seek to add yet another review of Lall’s work. Instead, I will sketch a roadmapfor extending Lall’s research agenda to explore the challenges resulting fromthe rise of global innovation networks (GIN) for Asian attempts to upgradeits industries through innovation. I will demonstrate that Lall’s framework remains valid as globalization now extends beyond markets for goods and
1* Dieter Ernst is a Senior Fellow at the East-West Center, Honolulu, Hawaii. Contact:[email protected]
32 Transnational Corporations, Vol. 17, No. 3 (December2008)
finance to include markets for technology and knowledge workers1. As aresult of such transformations, Asia’s integration into global productionnetworks is now complemented by its integration into GINs, whichadds a new dimension to the research agenda pursued by Lall. If not mentioned otherwise, the evidence used to support my arguments in thispaper draws on a unique data base of GINs for a sample of now almost 150 companies in the information and communications technologyindustry (Ernst, 2008b).2
In the next section of this essay, I will introduce what I consider to be the essence of Lall’s work, summarized in five propositions. Inthe rest of the paper, I will use these propositions to study the link between “upgrading through innovation” strategies and GINs. In section3, I introduce a conceptual framework to examine how specialization,learning and innovation enhance the potential for industrial upgrading.Section 4 addresses the international dimension of industrial upgrading,and discusses the characteristics and drivers of GINs and exploreimplications for learning and knowledge diffusion. Section 5 presentspolicy suggestions.
2. Important lessons from Lall’s research
For me, a defining characteristic of Lall’s work is his assertionthat industrialization in Asia has been shaped by the interplay of globalforces (embodied in international trade and investment flows) and localstrategies (pursued by host country firms and governments).
Specifically, Lall’s research taught me the following important lessons. First, integration into the global economy and foreign direct investment (FDI) can act as important catalysts for change, but thereis likely to be a “divergence between the private interests of the multinational company and the social interests of the host economy interms of long-term technology development” (Lall and Urata, 2003,p. 4). Policies need to be based on a thorough understanding of these
1
personnel, as well as managers and specialized professionals (in areas like marketing, legal services and industrial design) that provide essential support services to research, development and engineering.
2 The sample includes large global brand leaders from Asia, Europe and NorthAmerica, as well as specialized suppliers of technology, core components and product development services. We have also collected information on mini-GINs for small trans-
Province of China that are headquartered in Silicon Valley.

Transnational Corporations, Vol. 17, No. 3 (December 2008) 33
divergent interests, and they need to adjust to changes in the strategies of transnational corporations (TNCs).
Second, liberalization of trade and investment should not be equalized with the retreat of the state: “[a] consideration of thetechnology development process at the micro-level provides a strongand valid economic case for industrial policy, and the East Asian caseprovides the empirical backing” (Lall, 2000, pp. 13, 14).
Third, as a country becomes more exposed to globalization, thisincreases the importance of local capabilities and innovation, because“technical efficiency in each location becomes the final determinant of success (Lall, 2003, p.46). The more a country depends on exports and financial markets, the more it is vulnerable to boom-and-bust cyclesof global product and financial markets. To cope with this challenge,both firms and governments need to develop sophisticated management approaches and policies. Lall was one of the first to argue that the morea country moved up the industrial ladder, the more important advanced capabilities and innovation became. Specifically, Lall emphasized that while FDI could facilitate the development of basic operationalcapabilities required for the production and use of foreign technology,they might be “less efficient means of deepening capabilities, particularlyinto design and innovation” (Lall, 2003, p. 13).
Fourth, the key to success is generating a virtuous circle of buildinginstitutions and firm-level capabilities. Lall highlighted the followingrequirements for successful industrial upgrading: “skill development,industrial specialization, enterprise learning and institutional change areneeded to create cumulative and self-reinforcing processes to promote further learning” (ibid, p. 47).
Fifth, Lall’s writings consistently emphasize that host countriesstrategies to foster industrial upgrading need to be context-specificand are hence likely to differ from country to country. Lall’s extensiveresearch on Asian industrial policies showed that different policies were“successful in its own way in boosting export competitiveness, thougheach faces different… (risks and)… strategic challenges” (Lall, 2003, p.4). There are no “one best way” solutions. Instead, policies and strategiesneed to be continuously adjusted to the vagaries of business cycles and,even more importantly, to the structural transformations of markets and technology.
Asia’s rise as the global factory provides a fascinating examplefor Lall’s proposition that industrialization in this region has been shaped
34 Transnational Corporations, Vol. 17, No. 3 (December2008)
by the interplay of global forces and l local strategies. But this framework lcan also be used to analyze how integration into GINs affects Asia’s“upgrading through innovation” strategies.
3. Conceptual framework
3.1 Industrial upgrading
The concept of “industrial upgrading” can serve as a focusing device for Asia’s attempts to move beyond the “global factory” modeland to unlock new sources of economic growth. The main objective isto exploit the productivity-enhancing potential of innovation in order toavoid a “race to the bottom” that is driven solely by cost competition.Hence, in general terms, industrial upgrading must focus on improvementsin specialization, local value-added, productivity and linkages, all of which necessitate a broad base of knowledge and innovation (Ernst and Lundvall, 2004).
I distinguish two aspects of industrial upgrading that are of greatest policy relevance: “firm-level upgrading” from low to higher end products and value chain stages, and “industry-level linkages”with support industries, universities and research institutes.3 Firm-level upgrading is the key dimension – Asian firms must develop thecapabilities, tools and business models that will allow them to cope withthe new challenges from integration into GINs.
But for firm-level upgrading to succeed, upgrading must takeplace simultaneously with the formation of “industry linkages”. As
3 Three other forms of “industrial upgrading” discussed in the literature are: (i)inter-industry upgrading from low value-added industries (e.g. light industries) tohigher value-added industries (e.g. heavy and higher-tech industries); (ii) inter-factor upgrading from endowed assets (i.e. natural resources and unskilled labour) to created assets (physical capital, skilled labour, social capital); and (iii) upgrading of demand within a hierarchy of consumption, from necessities to conveniences to luxury goods. See Ozawa (2000) for discussion of upgrading taxonomies. Most research has focused
between low-wage, low-skill “sun-set” industries and high-wage, high-skill “sunrise” industries. Such simple dichotomies, however, have failed to produce convincing empirical results for two reasons (Ernst, 2001b). First, there are low-wage, low-skillvalue stages in even the most high-tech industry, and high-wage, high-skill activities exist even in so-called traditional industries like textiles. Second, both the capability requirements and the boundaries of a particular “industry” keep changing over time. Anexample is the transformation of the personal computer industry from an R&D-intensivehigh tech industry to a “commodity” where success depends on the optimization of supply chain management.
Transnational Corporations, Vol. 17, No. 3 (December 2008) 35
Powell and Grodal observed, “collaboration across multiple boundariesand institutional forms” is the norm today, and innovation networks “arenow core components of corporate strategy” (Powell and Grodal, 2004,pp. 57, 58). This reflects the growing geographic mobility of knowledge(Ernst, 2003) and the emergence of information technology (IT)-enabled governance mechanisms to coordinate dispersed knowledge units (Ernst,2005c).
To broaden the pool of firms that are capable of sustained firm-level upgrading, strong support industries and linkages with universitiesand research institutes are required. The challenge is to enable firm-levelupgrading and industry-level linkage formation to interact in a mutuallyreinforcing way so as to create a “virtuous circle”.
Asia’s industrial upgrading efforts also face a second challenge. Asits companies are integrated into multiple global networks of corporateproduction and innovation and informal knowledge communities, it isobvious that international linkages are critical for industrial upgrading.Hence, we need to distinguish the domestic (local) and international(global) elements.
Finding the right balance between firm-level upgrading and industry-level linkage formation, and between domestic and internationalaspects poses a continuous challenge for policy makers and corporateplanners. The “right balance” is a moving target, it is context-specific and requires continual adjustments to changes in markets and technology. Iargue that all four elements support each other; a strategy that neglectsone element at the detriment of the others is unlikely to create sustainablegains. The stronger the links between those four elements and the better they interact, the greater are the chances that Asian firms shape markets,prices and technology road maps.
The international dimension of industrial upgrading will be addressed in section 4. Our focus in this section is on the domesticelements. I first explore how learning and innovation support one another. I will then turn to the role of specialization in products and types of production.
3.2 Learning and innovation
A fundamental insight of innovation theory is that learningand innovation are “the two faces of R&D” (Cohen and Levinthal,1989, p. 569). Learning-by-doing establishes the routines – “the firmbecomes more practiced, and, hence, more efficient, at doing what it
36 Transnational Corporations, Vol. 17, No. 3 (December2008)
is already doing”(ibid, p. 570). But a firm’s growth depends on thefirm’s capacity to engage in a second type of learning, namely acquiringexternal knowledge “that will permit it to do something quite different”(“absorptive capacity”).
For effective knowledge conversion to productive learning,two important elements are required: an existing knowledge base or competence and the intensity of effort or commitment (Ernst and Kim,2002, p. 1425). In fact, a critical prerequisite for absorptive capacity isthat a firm conducts in-house basic research. This is in contrast with thecurrent fashion of “open innovation” (e.g. Chesbrough, 2003), whichdownplays the importance of a decline in corporate basic research. Cohenand Levinthal argued that that a firm needed to sustain a critical massof internal basic research, “to be able to identify and exploit potentiallyuseful scientific and technological knowledge generated by universitiesor government laboratories, and thereby gain a first-mover advantage inexploiting new technologies” (Cohen and Levinthal, 1989, p. 593). Thesame reasoning applies with regard to benefiting from spillovers fromcompetitors’ innovation.
What exactly then is innovation? Schumpeter’s distinctionbetween invention and innovation and his focus on “new combinationsof existing resources” are a good starting-point. To capture the essenceof innovation, I suggest a broad definition: innovation converts ideas,inventions and discoveries into “new combinations of existing resources”that lead to new products, services, processes and business models. It is important to emphasize that innovation is more than research and product development; users must perceive an advantage worth payingfor the innovation. It is also worth emphasizing that “entrepreneurs”are not limited to just the founders of internet start-ups, but they vary interms of size, business model and organization of their operations.
Innovations differ with regard to opportunities and barriers tolearning. They also differ in the capabilities required from the firms.Four types of innovations may be distinguished: incremental, modular, architectural and radicald innovations (Ernst, 2008a, drawing onlHenderson and Clark, 1990).
(i) Incremental innovations
“Incremental” innovations adopt existing component designsand architectures, but improve on cost, time-to-market and performance.Their purpose is to exploit as much as possible the potential of a given
Transnational Corporations, Vol. 17, No. 3 (December 2008) 37
“design”, by introducing relatively minor changes to an existing product or process (Nelson and Winter, 1982). These innovations do not requiresubstantial input from science, but they do require considerable skill,especially “soft” entrepreneurial and management capabilities, asdefined in Ernst (2007a).4
(ii) Modular innovations
“Modular” innovations introduce a new component technologyand plug it into fundamentally unchanged system architecture.5 They havebeen made possible by the division of labour in product development:“[m]odularity is a particular design structure, in which parametersand tasks are interdependent within units (modules) and independent across them” (Baldwin and Clark, 2000, p. 88). One consequence of modularization has been the fragmentation of the innovation value chainas well as its dispersion across firm and geographic boundaries, givingrise to “innovation offshoring” through GINs (Ernst, 2006a).
It is important to emphasize that, although modularity has created opportunities for industrial latecomers, the barriers to successfullyundertaking modular innovations are substantial. High technological complexity requires top scientists and experienced engineers in different fields. In addition, investment requirements can be very substantial (e.g.up to $4.5 billion for a state-of-the-art semiconductor fabrication plant),as are risks of failure.
(iii) Architectural innovations
“Architectural” innovations are “innovations that change thearchitecture of a product without changing its components” (Henderson
4 Examples of incremental innovations are improvements in the organization of manufacturing, distribution and support services, like Dell’s “direct sales” model and its integration of factory automation and supply chain management. Other examples
from the Taiwan Province of China, like original design manufacturing (ODM),foundry services (for integrated circuit fabrication) and design implementation services.Incremental innovations may also involve continuous improvements in industrial designthat help attract the attention of customers and that enhance the user-friendliness of aproduct and its performance.
5
each generation of the Wintel architecture (combining Microsoft’s Windows operatingsystem and Intel’s processor architecture), specialized suppliers have introduced newcomponent technology, for instance for memory, storage and display devices.
38 Transnational Corporations, Vol. 17, No. 3 (December2008)
and Clark, 1990, p. 9). They use existing component technologies but change the way they work together. Architectural innovations tend tohave far-reaching implications for market shares and profitability of innovating firms. As highlighted by Henderson and Clark (1990, p. 9),architectural innovations can threaten incumbent market leaders – they“destroy the usefulness of the architectural knowledge of established firms, and since architectural knowledge tends to become embedded in the structure and information-processing procedures of established organizations, this destruction is difficult for firms to recognize and hard to correct”.6
(iv) Radical innovations
Finally, “radical” innovations involve both new component technology and changes in architectural design. They requirebreakthroughs in both architectural and component technology.7 Radicalinnovations require profuse interaction with leading-edge science – topscientists and engineers are needed who work at the frontier of basicand applied research in a broad range of disciplines. In addition, toimplement radical innovations requires a broad set of complementaryassets (as defined by Teece, 1986) and investment thresholds tend to behigh.
In short, such innovations are costly and risky, and failurecan destroy even large companies. They are beyond the reach of most companies in Asia (outside of Japan and the Republic of Korea), althoughthey may be undertaken by public-private consortia coordinated by thegovernment.
3.3 Innovative capabilities
To determine what kind of capabilities are required to foster innovation, we can draw on the growing literature that has followed Lall’spioneering study on technological capabilities (Lall, 1990). Particularlyuseful for our purposes are studies that have developed operational datasets for measuring firm-level innovatory and R&D capabilities, based on questionnaire surveys and structured firm interviews (e.g. Ernst and O’Connor, 1992; Hobday, 1995; Ernst, Mytelka and Ganiatsos, 1998;Jefferson and Kaifeng, 2004; Ernst, 2005d).
6 Henderson and Clark (1990) use the decline of Xerox and RCA to illustrative thedestructive power of architectural innovations.
7 Examples include the discovery of new drugs, or the invention of the Internet.
Transnational Corporations, Vol. 17, No. 3 (December 2008) 39
Building on this literature, I propose to use a broad definitionof “innovative capabilities” to emphasize that, in addition to R&Dcapabilities, complementary “soft” entrepreneurial, management and system integration capabilities are of critical importance. Idefine “innovative capabilities” to include the skills, knowledgeand management techniques needed to create, change, improve and commercialize successfully “artefacts”, such as products, services,equipment, processes and business models (Ernst, 2007a).
Innovations require R&D capabilities, especially in high-techindustries. Yet, research on successful IT innovations demonstrates that technology is the easy part to change. The difficulty is in social,organizational and cultural aspects. In order to create products and services that customers are willing to pay for, the following “soft”innovative capabilities are critical:
(“entrepreneurship”);
who are carriers of new ideas;
inventions and discoveries;
organization and routines) in order to improve efficiency and time-to-market;
cultural innovation projects;
and
3.4 Specialization and upgrading potential
Specialization is an important indicator of the degree of industrial upgrading that a country or region can realistically expect to achieve. Specialization patterns reflect differences in product mix
40 Transnational Corporations, Vol. 17, No. 3 (December2008)
(e.g. homogeneous versus differentiated products) and in the type of production, i.e. “routine” and “complex” production.8 These differences in specialization, in turn, give rise to divergence in the complexity of technology, demand patterns and market structures. Most importantly,differences in specialization shape a country’s (a region’s) upgradingpotential, in terms of learning opportunities, capability requirements,value-added and linkages.
A critical policy issue is how to identify conditions under whichspecialization and upgrading potential are linked by a virtuous circle. Infact, a narrow specialization on homogenous products or on “modular”production may well make sense at an earlier stage of development.Yet, this very same specialization may later on hinder a transition todifferentiated products or “integrated” production.
(i) Product specialization
Homogenous products (“commodities”) have only a limited upgrading potential, in terms of learning opportunities, capability requirements, value-added and linkages. The opposite is true for differentiated products.
For our purposes, it is useful to establish a link between product specialization and the product life cycle (PLC) theory. FollowingVernon (1966), differentiated products are typically associated with theearly stage of the PLC, while homogenous products are most likely tobe found in the later stages. Take the PC industry, a typical example of a “late-stage” industry, which is an important part of the IT industries inChina and Taiwan Province of China. As a “commodity”, the PC has verylimited upgrading potential. The root cause is that Intel and Microsoft are in almost complete control of the standards and technologies, with aresult that expected returns on innovation for PC manufacturers is low,while the cost of innovation is high.
In contrast, the scope for differentiation is broader for high-end handsets (especially smart phones) and for the mobile network industry.Both are examples of “early PLC stage” industries that are important for China, the Republic of Korea and Taiwan Province of China. Whileentry barriers in terms of investment and technology are high in both
8 I use these distinctions to move the research agenda beyond the popular, but somewhat schematic dichotomy of “Fordist mass production” versus the “Post-FordismFlexible Specialization”. For a detailed theoretical discussion based on evidence fromchip design, see Ernst (2005b).
Transnational Corporations, Vol. 17, No. 3 (December 2008) 41
industries, there are ample opportunities for new entrants to upgradethrough innovation.
(ii) Routine versus complex production
The potential for industrial upgrading also differs for different types of production. For “routine” production, the upgrading potential isobviously lower than for “complex” production that needs to combinediverse technologies and may require customization, quick responses to changes in market and technology, and the provision of integrated solutions. The reward for upgrading to “complex” production can behigh. If firm successfully implements complex processes, it may benefit from greater profit margins, which in turn could be used to financefurther R&D. The downside, of course, is that a successful entry requiressubstantially higher costs and efforts.
Take, for instance, chip designing, where “routine” functions(“design implementation”) are distinguished from “complex” stages of design that centre on conceptualization, circuit architecture and systemspecification. The requirements for making the transition from designimplementation to conceptualization are quite demanding. Entry barriersare extremely high, as design costs at the 90 nano-meter technology (thecurrent best-practice) can be as high as $20–30 million (Ernst, 2005a).
These new challenges are likely to impose far-reaching changeson industry structure, business models and firm organization, illustratingagain how closely inter-related firm-level upgrading and industry-levellinkage formation are.
4. The International dimension
As Asia’s production and innovation systems are increasinglyintegrated into complex global network arrangements, it is obvious that industrial upgrading does not end at the national border. Nor should oneassume that industrial upgrading occurs only if improved specializationleads to the formation of linkages within a particular region or withinthe national economy. Hence, international linkages are critical for theregion’s industrial upgrading efforts.
4.1. Global production and innovation networks
A “closed economy” assumption became unrealistic, onceliberalization and information technology (IT) drastically increased

the international mobility of goods and services as well as finance and investment, giving rise to geographically dispersed (“fragmented”)global production networks (Venables, 2006; Jones and Kierzskowski,2000; Borrus, Ernst and Haggard, 2000; Ernst, 1997, 2002b). Asia’sintegration into these networks has created cross-border linkages that need to be exploited by its industrial upgrading strategies.9
Recent shifts in the global innovation system have further increased the importance of international linkages for industrialupgrading. As globalization has extended beyond markets for goods and finance into markets for technology and knowledge workers, this hasincreased the organizational and geographical mobility of innovation.10
Global corporations are at the forefront of these developments.Profound changes are transforming their innovation management, and an increasing vertical specialization (“fragmentation”) of innovation isgiving rise to GINs.
According to the United States National Science Board, “thespeed, complexity, and multidisciplinary nature of scientific research,coupled with the increased relevance of science and the demands of aglobally competitive environment, have … encouraged an innovationsystem increasingly characterized by networking and feedback amongR&D performers, technology users, and their suppliers and acrossindustries and national boundaries” (National Science Board, 2004,pp. IV–36). As a result, global corporations are increasingly relying on“innovation offshoring” through GINs (Ernst, 2006).
4.2 How important is Asia?
Since the turn of the century, GINs have been extended well beyond the traditional high tech regions in the United States, EU and Japan. Global corporations construct such networks to improve theproductivity of R&D by recruiting knowledge workers from cheaper,non-traditional locations.
Asia’s role in these networks is increasing fast (albeit from a low base) and the resurgence of China and India obviously plays animportant role. Take Intel as an example of an intra-firm innovationnetwork that is expanding most rapidly in China and India. Its labs in
9 Empirical research on Asia’s leading export economies documents that progressive integration into global production networks has typically increased intra-industry trade, giving rise to growing “input imports’, i.e. purchases of components and machinery from overseas sources, primarily in Japan and the United States (e.g., Ng and Yeats, 2003; Ernst and Guerrieri, 1998).
10 The following draws on Ernst (2006a, 2005 a, 2005b, 2003 and 2002a).
42 Transnational Corporations, Vol. 17, No. 3 (December2008)
Santa Clara, Folsom and Austin in the United States remain the primarylocations for core technology development and applied research,while the lab in Haifa, Israel, (established as early as 1974) focuses onprocessor research and the lab in Nishny Novgorod, Russia, on softwaredevelopment. Intel has established seven R&D labs in Asia (outsideJapan), and it is planning to expand rapidly both the number of labs and their headcounts. Bangalore has Intel’s largest lab outside of the United States. With a workforce of around 3,000, the Bangalore lab conductsleading-edge dual processor development. Intel’s management plansa substantial expansion in India, most likely in second-tier cities that have lower labour costs than Bangalore. In Shanghai, Intel has recentlyexpanded its R&D team to focus on applied research to identify newapplications for China and other emerging markets.
The Bangalore labs of Texas Instruments (TI) illustrate thespeed and depth of innovation offshoring to Asia. Established in 1985,Bangalore is Texas Instruments’ largest lab outside the United States,with a workforce of more than 2,800. Since 1998, this lab has conducted integrated development projects for highly complex system-on-chipdesign. It now has the global mandate for co-developing 3G wirelesschipsets. Since 2003, TI Bangalore has been assigned the global product development mandate for leading-edge single-chip modems. As a result,TI Bangalore has successfully completed more than 500 patent filingsat both the United States Patent and Trademark Office and the EuropeanPatent Office.
Global firms also outsource some stages of innovation, especiallythose related to product development, to specialized offshore suppliersas part of complex inter-firm GINs. For instance, global brand leaders for laptops (like HP, Dell, Acer and Lenovo) use design services provided byso-called original design manufacturers (ODMs), mostly from TaiwanProvince of China, for new product development.11 In addition, global system companies (like IBM) and integrated device manufacturers (like Intel) are outsourcing to Asian design houses the development of specific design building blocks and design implementation services(Ernst, 2005a, 2005b).
11
by the global brand leader. Or they provide their proprietary integrated “turnkey”solution to basic performance parameters requested by the global brand leaders. ODMservice providers from the Taiwan Province of China now account for 95% of the global
It is important to emphasize that tier-3 suppliers, especially for power supply (Delta and
development of their innovative capabilities.
Transnational Corporations, Vol. 17, No. 3 (December 2008) 43
Over time, GINs have become increasingly diverse, bringing together R&D teams from companies that drastically differ in size,business model, market power, location and nationality. The flagshipcompanies that control key resources and core technologies – and henceshape these networks – are still overwhelmingly from EU, Japan and the United States. However, there are also now network flagships fromAsia (outside Japan). New Asian players develop their own networksand unique (“hybrid”) networking strategies.
Huawei, China’s leading telecommunications equipment producer, provides an example of a highly sophisticated GIN. The company has pursued a two-pronged strategy (Ernst and Naughton, 2007). It isbuilding a range of linkages and alliances with leading global industryplayers and universities, while concurrently establishing its own GIN.In fact, Huawei has developed a web of project-specific collaborationarrangements with major suppliers of core components, such as Siemens(as part of China’s TD-SCDMA project), 3Com (with a focus on sales
Huawei’s own GIN now includes, in addition to six R&D centres in China, five major overseas R&D centres in the United States (Plano/Texas and San Jose/California), Sweden (Kista/Stockholm), the RussianFederation (Moscow) and the United Kingdom (as part of BritishTelecom’s list of eight preferred suppliers for the overhaul of its United Kingdom fixed-line phone network).
4.3 Driving forces and enabling factors
Corporate strategies shape the pace and contents of the globalknowledge economy; they increase the mobility of innovation by constructing GINs. Global corporations construct these networks tocope with increasing pressures to internationalize innovation. Our research through interviewing global corporations suggests that GINsare expected:
complexity and uncertainty of R&D;
demand growth in core OECD countries;
cycles;
44 Transnational Corporations, Vol. 17, No. 3 (December2008)
economies and new innovation hubs; and
It is important to emphasize the systemic nature of the drivingforces. We find that global firms are attracted by supply-related factors,especially the lower cost of employing a chip design engineer in Asia,which is typically 10–30% of the cost in Silicon Valley. However, demand-related factors are equally important. Global firms emphasize the need to relocate R&D to be close to the rapidly growing and increasinglysophisticated Asian markets for communications, computing and digitalconsumer equipment and to be able to interact with Asia’s lead users of novel or enhanced products or services. The main prize is the Chinesemarket which provides: the largest market for telecom equipment (wired & wireless) and may become a test bed for next generation (4G)mobile systems; the largest market for semiconductors and handsets;the second-largest market for cars and digital consumer electronics; amajor export market for Japan, the Republic of Korea, Taiwan Provinceof China and the United States; and “bottom of the pyramid” marketsfor less over-engineered products and services with substantially lower costs of acquisition and operation.
Furthermore, some firms in Asia, especially in China and India,that are accumulating resources and innovative capabilities that areattractive to global corporations. For instance, it is projected that, by2010, China will produce more science and engineering doctorates thanthe United States (National Science Board, 2008).12 In addition, China’s areas of scientific excellence now include materials science, especiallynano-science, where China ranks third (after Japan and the United States) in the number of nanotech publications, and where the ChineseAcademy of Science is ranked fourth for nano-science citations, after UC Berkeley, MIT and IBM. China’s researchers also excel in areas likevoice and image recognition, computer graphics, analytical chemistry,rice genomics and stem cell biology.
At the same time, a powerful mix of enabling factors has facilitated the construction of these networks by reducing uncertainty and the cost of transaction and coordination. The result has been a rebalancing of
12 According to the National Science Board (2008), 64% of China’s 23,446
entrants in science and engineering Ph.D. programmes in China increased six-fold, from8,139 to 48,740.
Transnational Corporations, Vol. 17, No. 3 (December 2008) 45

the “centripetal” forces that keep innovation tied to specific locationsand the “centrifugal” forces that reward geographical dispersion. Thelatter have become more powerful, although the former have hardlydisappeared.
There are two root causes of this rebalancing and the resultant increase in the mobility of knowledge: (1) the improvement of theinformation and communication infrastructure and its extension around the world, and (2) the liberalization of international economic policiesthat allows this technological change to be exploited more fully by firmsand organizational networks.13
Institutional change through liberalization has played an important role in reducing constraints on the organizational and geographical mobility of knowledge. Hence, liberalization has acted as a powerfulcatalyst for the expansion of GINs.
The overall effect of liberalization has been to reduce the cost and risks of international transactions. Global corporations have been theprimary beneficiaries. Liberalization provides them with:
subcontracting, franchising (locational specialization);
to complement their core competencies (outsourcing); and
(spatial mobility).
Technological development, especially the rapid improvement and diffusion of information and communication technology, hasalso increased the mobility of knowledge. The high cost and risk of developing IT has forced companies to search for lower-cost locationsfor R&D. Equally important is that IT and related organizationalinnovations provide effective mechanisms for constructing flexiblenetwork arrangements that can link together and coordinate economictransactions among geographically dispersed locations. IT-enabled network management reduces the cost of communication, helps tocodify knowledge through software tools and data bases, and facilitatesexchange of tacit knowledge through audio-visual media.
13 Additional powerful enabling factors are the progressive globalization of IP protection (through TRIPS and TRIPS-Plus agreements) and standards (through formalbut especially through informal standard-setting bodies). See Ernst (2008c).
46 Transnational Corporations, Vol. 17, No. 3 (December2008)
In essence, IT has fostered the development of leaner and moreagile production and innovation networks that cut across firm boundariesand national borders. IT-enabled network management has facilitated the exchange of knowledge among diverse knowledge communities at distant locations that work together on an innovatory project.
It is now possible to create and connect teams of knowledgeworkers in distant locations. This is true even for innovative activitiesthat require complex knowledge. To the extent that the diversity of network players, locations, business models and network arrangements is increasing, this provides opportunities for knowledge diffusion,enabling Asian network participants to enhance learning, absorptivecapacity and innovative capabilities.
4.4 Will network integration foster innovation?
The result, however, is by no means a flatter world. There is clear evidence that Europe, Japan and the United States retain their dominancein science and in high-impact intellectual property. In 2002, for instance,all 15 leading companies with the best record on patent citations were based in the United States, with nine of them in the IT sector (CHI/MIT, 2003). The 700 largest R&D spenders (mostly large United Statesfirms) account for 50% of the world’s total R&D expenditures and morethan two-thirds of the world’s business R&D (UNCTAD, 2005a). And,more than 80% of the 700 largest R&D spenders come from only fivecountries (United States dominates, followed by Japan, Germany, United Kingdom, and France).
Nevertheless, non-OECD countries account for a growing shareof the world’s R&D (OECD, 2008, p. 56). In 2005, the non-OECDcountries accounted for 21.4% of global R&D expenditures (expressed in current United States dollars, PPP), up from 17% four years earlier.China made by far the largest contribution, accounting for 55% of thenon-OECD share. China’s R&D intensity (i.e. the ratio of R&D to GDP)has grown much faster than in Japan, the United States or any Europeancountry.14 However, at 1.5%, China’s R&D intensity is still way behind the global leaders (e.g. 2.6% for the United States).
Probably the most telling indicator of the persistent highconcentration of innovative capabilities is the unequal control over resources and decision-making in standard-setting consortia in the IT
14 Between 1999 and 2004, an average annual growth rate of more than 12% has been recorded for China’s R&D intensity, compared to -0.2% for the United States.
Transnational Corporations, Vol. 17, No. 3 (December 2008) 47
industry (Ernst, 2008c). In many of these consortia, standards are highly“impure public goods” that are used by incumbent industry leaders toblock competitors and to deter new entrants.
Clearly, the new geography of knowledge has dispersed innovativecapabilities to new players, but overall, the spread of innovatory activitiesremains highly concentrated. For Asia, our data show that integrationinto GINs has created a handful of new, yet very diverse and competitiveinnovation offshoring hubs.15
There are concerns, however, that integration into GINs may be apoisoned chalice. It is feared that, apart from a few prestige projects that might provide limited short-term benefits, R&D by global corporationsmay not provide the means for upgrading the host country’s industry tohigher value-added and more knowledge-intensive activities.
The findings from our research confirm some of these concerns.We have found that Asian emerging economies face massive challengesbefore they can reap the benefits of network integration. Nothing isautomatic about these processes, and they cannot be left to market forces. To cope with market failures identified a long time ago by Kenneth J. Arrow16, appropriate policies need to be in place to developabsorptive capacity and innovative capabilities both at the firm and industry levels.
For instance, foreign R&D centres often intensify competitionfor the limited domestic talent, giving rise to bouts of localized wageinflation for knowledge workers (especially for experienced project managers). Inward R&D by global industry leaders may also give riseto a reverse “boomerang effect”, providing global firms with valuableinsights into business models and technologies developed by domesticfirms.17 Furthermore, foreign R&D centres typically show limited interest in sharing knowledge with domestic firms and R&D labs.
15 Take chip design. In addition to the established global centres of excellence(like Silicon Valley), there are now a handful of rapidly expanding new clusters emergingin Asia, such as Hsinchu, Taipei, Tainan in Taiwan Province of China; Shanghai, Suzhou,Hangzhou, Beijing, Shenzhen, Xián in China; Seoul, Incheon, Daedok Science Town inthe Republic of Korea; Bangalore, Noida, Chennai, Hyderabad, Mumbai, Puneh and Ahmedabad in India; Penang, Kuala Lumpur in Malaysia; and Singapore.
16 Arrow (1962) argued that markets were weak in generating learning and knowledge, as both were subject to externalities, creating a gap between private and social rates of return on investment.
17 Examples are attempts by IBM and Accenture to copy the successful businessmodel of Indian IT service providers like Tata Consulting Services or Infosys.
48 Transnational Corporations, Vol. 17, No. 3 (December2008)

Vigorous policies must be in place to reduce the potentially highopportunity costs of inward R&D investment that may result from“brain drain” (both domestic and international), when global firms arecrowding out the local market for scarce skills. Other costs discussed in the literature include a possible deterrence effect of global labs on localR&D; acquisition by global firms of innovative local companies; and thelarge benefits that may accrue to a foreign parent company (UNCTAD,2005a).
Support policies for local firms are required. As emphasized by Tassey (2007), substantial investment is needed in “human science and engineering capital” and “innovation infrastructure”. An important objective is to improve the efficiency of a nation’s innovation systemsand to reduce the risks of innovation through “more comprehensivegrowth policies implemented with considerably more resources and based on substantive policy analysis capabilities” (Tassey, 2008, p. 2).
5. Generic policy suggestions
In short, Asia’s progressive integration into GINs may well act as a catalyst for accelerating the development and the diffusion of innovative capabilities, provided, of course, that appropriate policiesand firm strategies are in place to enhance local innovative capabilities.
There is no doubt that the innovative capabilities of Asian firmscontinue to lag substantially behind global industry leaders. Reducing thegap will take time. Hence, host country policies in Asia must continue tocajole and assist local firms by signalling opportunities, reducing risks,engaging in R&D and providing critical public goods. Liberalizationand WTO regulations have reduced the scope for such policies. Thechallenge is to design new policies and institutions that help reduce the“divergence between the private interests of the multinational companyand the social interests of the host economy in terms of long-termtechnology development” (Lall and Urata, 2003, p. 4).
Asia’s emerging knowledge economies face a strategic dilemma. If they choose to compete as low-cost R&D contractors, this would result in a “commodity price trap”, squeezing their profit margins and hencetheir ability to finance further innovatory activities. This implies that there is not much choice but to pursue “upgrading through innovation”strategies. Asian firms need to create unique products and solutions,addressing user and social needs that global firms have neglected.
Transnational Corporations, Vol. 17, No. 3 (December 2008) 49
However, deeply entrenched structural weaknesses and persistent inequality constrain the push for innovation.
The key to success is leveraging on integration into GINs tocatalyze, not to replace, domestic innovation efforts. In other words,innovation offshoring can only produce sustainable long-term economicbenefits for Asian countries if policies exist to develop strong localcompanies that can act as countervailing forces to the accumulated strengths of global firms. This is in line with the findings of Lall’s research.But for Asia to cope with the complex challenges and opportunities of innovation offshoring, new policies are required that are very different from earlier top-down, “command economy”-type industrial.
To reap the benefits of integration into GINs requires the activeinvolvement of the state, i.e. local, regional and central government agencies, as well as a variety of intermediate institutions (Ernst, 2005b).Policies associated with the traditional East Asian development modelare too rigid to cope with the complex challenges and opportunities of today’s global network economy that have been explored in this study.Nor can the old policies cope with the conflicting needs of multipleand increasingly vocal domestic actors. In addition, command-economytype industrial policies are unable to deal with the high uncertainty and rapid changes in technology and markets that are typical for the newgeography of knowledge.
In order to facilitate a continuous upgrading of local innovativecapabilities through participation in GINs, new policy approaches arerequired that:
training and education);
the need to protect intellectual property rights;
them to leading-edge innovation management approaches;
(local and foreign) in production and innovation networks;
50 Transnational Corporations, Vol. 17, No. 3 (December2008)
out from economic transformation; and
networks, institutional collaboration and diverse social networks(global knowledge communities and expatriates).
There is, of course, no one best optimum formula for such policies.Their instruments and institutions need to differ from sector to sector, in scope, in kind, and in impact, as documented in Mowery and Nelson(1999, p. 377).18
Policies also need to differ across countries. A critical prerequisiteto find out more about such policy variations is the construction of relevant country classifications. But most such classifications remainproblematic.19 Drawing on Lall (1990), Ernst, Mytelka and Ganiatsos(1998) and Ernst and O’Connor (1989), it is possible to suggest a broader country classification scheme that focuses on the following criteria:
versus external markets;
extent of inter-industry linkages, and “core industries”;
innovative capabilities;
18 Ernst (2005a) provides a case study of chip design that highlights characteristic
development of local innovative capabilities. Future research needs to conduct similar case studies for sectors that are of particular importance for developing countries, such as textiles, footwear, food processing, chemicals, pharmaceuticals, transportationequipment, mechanical engineering, as well as software and information technologyservices. For each of these sectors, there are likely to be substantial differences in host country policy responses to innovation offshoring.
19 For instance, the World Bank’s research on strategic approaches to science and technology in development uses the RAND Corporation’s matrix of science and technology capacity in the developing world that distinguishes three categories: 24
Transnational Corporations, Vol. 17, No. 3 (December 2008) 51
and financial markets and education systems); and
and sector-specific innovation systems.
Future research needs to examine realistic options for “upgradingthrough innovation” strategies in different groupings of Asian countries,and how each of these policies can maximize benefits from participatingin GINs. For instance, Ernst (2005b) introduces a taxonomy of four strategies (i.e. “catching-up”, “fast-follower”, “technologydiversification”, and “technology leader”) and explores capabilitieslocal companies need to master in order to implement each of these four different strategies. Drawing on this taxonomy, the UN MillenniumProject Report on Science, Technology and Innovation (UN MillenniumProject, 2005, p. 127) recommends “technological diversification” as aparticularly attractive policy to upgrade industries through innovation.
6. Conclusions
In this paper, I have demonstrated that Lall’s framework for analyzing Asian pathways to development remains valid for today’sglobal economy where globalization has extended beyond marketsfor goods and finance to reach markets for technology and knowledgeworkers. As offshoring has moved beyond industrial manufacturing intoservices, engineering and research, new opportunities and challengesarise for Asian economies.
To examine what this implies for Asia’s “upgrading through innovation” strategies, I have introduced a concept of “industrial upgrading” that links specialization with firm-level and industry-levelupgrading and integration into global networks. This concept allowsus to identify conditions under which Asian countries could reap thebenefits of innovation offshoring.
Our analysis shows that Lall was right to emphasize a divergencebetween the private interests of the TNCs and the social interests of the host economy in terms of long-term technology development. Hisplea for industrial policy is even more valid today, as the stakes and risks have become much greater, as countries seek to move beyond the“global factory” model to “upgrading through innovation” strategies.
Lall was also right to emphasize that, the more a country movesup the industrial ladder, the more important advanced capabilities and
52 Transnational Corporations, Vol. 17, No. 3 (December2008)

innovation become. I argue that there is room for cautious optimism that a host country’s progressive integration into GINs could facilitate itsefforts to push ahead with industrial upgrading.
Most importantly, we have seen that, in line with Lall’s research,the key to success is to generate a virtuous circle of accumulatinginstitutions and firm-level capabilities.
Finally, the paper also supports Lall’s argument that there is no “one best way” solution. Instead, policies and strategies need tobe continuously adjusted to the vagaries of technological change and business cycles, and to the structural transformations of global product and financial markets.
References
Arrow, K.J. (1962). “The Economic Implications of Learning by Doing”, Review of Economic Studies, 29(3), pp.155 173.
Baldwin, C.W. and K.B. Clark (2000). Design Rules: The Power of Modularity.Cambridge, MA: MIT Press.
Borrus, M., D. Ernst and S. Haggard (eds.) (2000). International Production Networksin Asia: Rivalry or Riches? London: Routledge.
Chesbrough, H.W. (2003). Open Innovation: The New Imperative for Creating and . Boston, MA: Harvard Business School Press.
CHI/MIT (2003). 2003 Innovation Scores Survey. Available at www.CHI.com.
Cohen, W.M. and D.A. Levinthal (1989). “Innovation and Learning: The Two faces of R&D”, Economic Journal, September, 99, pp. 569 596
Cohen, W.M. and D.A. Levinthal (1990). “Absorptive capacity: A New Perspective onLearning and Innovation”, Administrative Science Quarterly, 35, pp. 128 152.
Ernst, D. (1997). “From partial to systemic globalisation. International productionnetworks in the electronics industry”. Report to Sloan Foundation, published asThe Data Storage Industry Globalisation Project Report 97-02. Graduate School of
Ernst, D. (2001a). “Small Firms Competing in Globalized High Tech Industries: TheCo-Evolution of Domestic and International Knowledge Linkages in Taiwan’sComputer Industry”, in P. Guerrieri, S. Iammarino and C. Pietrobelli (eds.), TheGlobal Challenge to Industrial Districts. Small and Medium-Sized Enterprises inItaly and Taiwan. Aldershot: Edward Elgar.
Ernst, D. (2001b). “Responses to the Crisis: Constraints to Rapid Trade Adjustment in East Asia’s Electronics Industry”, in H.J. Chang, G. Palma and D.H. Whittaker (eds.), Financial Liberalization and the Asian Crisis. Basingstoke: Palgrave.
Transnational Corporations, Vol. 17, No. 3 (December 2008) 53
Ernst, D. (2002a). “Global Production Networks and the Changing Geography of Innovation Systems. Implications for Developing Countries”, Economics of Innovation and New Technologies, XI(6), pp. 497–523.
Ernst, D. (2002b). “The economics of electronics industry: competitive dynamics and industrial organisation”, in William Lazonick (ed.), The International Encyclopediaof Business and Management (IEBM),t Handbook of Economics. London:International Thomson Business Press.
Ernst, D. (2003). “Digital Information Systems and Global Flagship Networks: HowMobile is Knowledge in the Global Network Economy?”, in J.F. Christensen (ed.),The Industrial Dynamics of the New Digital Economy. Cheltenham: Edward Elgar.
Ernst, D. (2004). “Global production networks in East Asia’s electronics industry and upgrading perspectives in Malaysia”, in S. Yusuf, M.A. Altaf and K. Nabeshima(eds.), Global Production Networking and Technological Change in East Asia,Washington, D.C.: World Bank and Oxford University Press.
Ernst, Dieter (2005a). “Complexity and internationalisation of innovation: why is chipdesign moving to Asia?”, International Journal of Innovation Management [specialtissue in honour of Keith Pavitt], 9(1), pp. 47–73.
design”, Industry and Innovation, 12(3), pp. 303–335.
Ernst, D. (2005c). “The New mobility of knowledge: digital information systems and Digital Formations.
IT and New Architectures in the Global Realm. Princeton and Oxford: PrincetonUniversity Press for the US Social Science Research Council.
Ernst, D. (2005d). “Pathways to innovation in Asia’s leading electronics-exportingcountries: a framework for exploring drivers and policy implications”, InternationalJournal of Technology Management, 29(1/2), pp. 6–20.
Ernst, D. (2006a). Innovation Offshoring: Asia’s Emerging Role in Global InnovationNetworks, a special report prepared for the East-West Center and the U.S.-Asia-
Ernst, D. (2006b). “Searching for a New Role in East Asian Regionalization—JapaneseProduction Networks in the Electronics Industry”, in P. Katzenstein, J. Katzensteinand T. Shiraishi (eds.), Remaking East Asia: Beyond Americanization and Japanization. Cornell: Cornell University Press.
Ernst, D. (2007a). “Innovation Offshoring - Root Causes of Asia’s Rise and PolicyImplications”, in Juan J. Palacios, (ed.), Multinational Corporations and the
. London: Routledge. Co-published
Ernst, D. (2007b). Beyond the “Global Factory” Model: Innovative Capabilitiesfor Upgrading China’s IT Industry, International Journal of Technology and Globalization, 3(4), pp. 437 460.
knowledge networks?”, in Marguerite Gong Hancock, Henry S. Rowen and William
54 Transnational Corporations, Vol. 17, No. 3 (December2008)

F. Miller (eds.), China’s Quest for Independent InnovationResearch Center and Brookings Institution Press.
Ernst, D. (2008b). “A new geography of knowledge? Asia’s role in global innovationnetworks”. Paper presented at the EEM Conference, “Emerging Economies Multinationals”, Beijing, 27--28 November.
Ernst, D. (2008c). “Governing impure public goods in the global knowledge economy:intellectual property rights and standards in the ICT Industry”, unpublished manuscript. Honolulu: East-West Center, downloadable from http://www.eastwestcenter.org/ggke
Ernst, Dieter and David O’Connor (1989). Technology and Global Competition. The Challenge for Newly Industrialising Economies, OECD Development Centre Studies. Paris: OECD.
Ernst, D. and David O’Connor (1992). Competing in the Electronics Industry: The Experience of Newly Industrialising Economies, Development Centre Studies. Paris: OECD.
Ernst, Dieter and Paolo Guerrieri (1998). “International Production Networks and
Changing Trade Patterns in East Asia: The Case of the Electronics Industry”, Oxford Development Studies, 26(2), June.
Ernst, D., L. Mytelka and T. Ganiatsos (1998). “Export performance and technologicalcapabilities: a conceptual framework”, in D. Ernst, T. Ganiatsos and L. Mytelka (eds.), Technological Capabilities and Export Success: Lessons from East Asia.London: Routledge.
Ernst, D. and Linsu Kim (2002). “Global production networks, knowledge diffusion and local capability formation”, Research Policy, 31(8/9), pp. 1417–1429.
Ernst, D. and B.A. Lundvall (2004). “Information technology in the learning economy:challenges for developing countries”, in E.S. Reinert (ed.), Globalization, Economic Development and Inequality: An Alternative Perspective. Cheltenham: Edward Elgar.
Ernst, D. and B. Naughton (2007). “China’s Emerging Industrial Economy – Insightsfrom the IT Industry”, in C. McNally (ed.), China’s Emergent Political Economy – Capitalism in the Dragon’s Lair. New York: Routledge.
of Existing Systems and the Failure of Established Firms”, Administrative ScienceQuarterly, March: 9-30.
Hobday, M. (1995). Innovation in East Asia: The Challenge to Japan. Aldershot: Edward Elgar.
Jefferson, G.H. and Z. Kaifeng (2004). “An Investigation of Firm-Level R&D Capabilities in East Asia”, in S. Yusuf, M.A. Altaf, and K. Nabeshima (eds.), Global production Networking and Technological Change In East Asia. Washington, D.C.: World Bank and Oxford University Press.
Transnational Corporations, Vol. 17, No. 3 (December 2008) 55
Jones, R. and H. Kierzskowski (2001). “Horizontal Aspects of VerticalFragmentation”, in L.K. Cheng, and H. Kierzkowski (eds.), GlobalProduction and Trade in East Asia, Boston, MA: Kluwer.
Lall, S. (1990). Building Industrial Competitiveness in Developing Countries. Paris:OECD.
Lall, S. (2000). “Technological Change and Industrialization in the Asian NewlyIndustrializing Economies: Achievements and Challenges”, in Linsu Kim and Richard R. Nelson (eds.), Technology, Learning and Innovation. Experience of Newly Industrializing Economies: Cambridge: Cambridge University Press.
Lall, S. (2003). “Foreign Direct Investment, Technology Development and Competitiveness: Issues and Evidence”, in S. Lall and S. Urata (eds.),Competitiveness,FDI and Technological Activity in East Asia. Cheltenham: Edward Elgar.
Lall, S. and S. Urata (2003). “Introduction and Overview”, in S. Lall and S. Urata (eds.),Competitiveness, FDI and Technological Activity in East Asia. Cheltenham: Edward Elgar.
Mowery, D.C. and R.R. Nelson (eds.) (1999). Sources of Industrial Leadership. Studiesin Seven Industries. Cambridge: Cambridge University Press.
National Science Board (2004). Science and Engineering Indicators 2004, volume I.Arlington, VA: National Science Foundation
National Science Board (2008). Science and Engineering Indicators 2006, volume I.Arlington, VA: National Science Foundation.
Nelson, R. R. and S. G. Winter (1982). An Evolutionary Theory of Economic Change,Cambridge, MA: The Belknap Press.
Ng, Francis and Alexander Yeats (2003). “Major Trade Trends in East Asia: What aretheir Implications for Regional Cooperation and Growth?”, World Bank PolicyResearch Working Paper, No. 3084, Washington, D.C.: World Bank.
OECD (2008). The Internationalisation of Business R&D: Evidence, Impacts and Implications. Paris: OECD.
Ozawa, T. (2000). “The ‘Flying-Geese Paradigm’: Toward a Co-evolutionary Theory of MNC-Assisted Growth”, in K. Fatemi (ed.), The New World Order: Internationalism,Regionalism and the Multinational Corporations. Amsterdam and New York:Pergamon.
Powell, W.W. and S. Grodal (2004). “Networks of Innovators”, in J. Fagerberg, D.C.Mowery and R.R. Nelson (eds.), The Oxford Handbook of Innovation. Oxford and New York: Oxford University Press.
Rasiah, R. (1995). Foreign Capital and Industrialisation in Malaysia. Basingstoke:Macmillan.
Schumpeter, J.A. (1939). Business Cycles: A Theoretical, Historical, and Statistical Analysis of the Capitalist Process. New York: McGraw-Hill.
Tassey, G. (2007). The Technology Imperative. Cheltenham: Edward Elgar.
56 Transnational Corporations, Vol. 17, No. 3 (December2008)

Tassey, G. (2008). “Globalization of technology-based Growth: the Policy Imperative”,Journal for Technology Transfer, December
collaboration, licensing and public policy”, Research Policy, 15(6), pp. 285 305.
UNCTAD (2005a). World Investment Report 2005: Transnational Corporations and theInternationalization of R&D. New York and Geneva: United Nations.
UNCTAD (2005b). UNCTAD Survey on the Internationalisation of R&D. OccasionalNote, UNCTAD/WEB/ITE/IIA/2005/12, 12 December
UN Millennium Project (2005). Innovation: Applying Knowledge in Development.Task Force on Science, Technology and Innovation. New York: United NationsDevelopment Programme and London: Earthscan.
Venables, Anthony J. (2006). “Shifts in Economic Geography and their Causes”. Paper prepared at 2006 Jackson Hole Symposium, 25 August.
Vernon, R. (1966). “International Investment and International Trade in the Product Cycle”, Quarterly Journal of Economics, 80(2), pp. 190 207.
Watson, R.M. and S. Farley (2003): “Strategic approaches to science and technology indevelopment”, World Bank Policy Research Paper, No. 3026.
Transnational Corporations, Vol. 17, No. 3 (December 2008) 57

58 Transnational Corporations, Vol. 17, No. 3 (December2008)
Energizing industrial development
John A. Mathews *
The role of energy sources in the choice of industrial development The role of energy sources in the choice of industrial development pathways has not been widely acknowledged outside the energypathways has not been widely acknowledged outside the energyliterature. Indeed, as oil prices rise, traditional fossil fuel-intensiveliterature. Indeed, as oil prices rise, traditional fossil fuel-intensiveindustrial development pathways now imperil development prospectsindustrial development pathways now imperil development prospectsaround the world. As energy security becomes a major issue, developingaround the world. As energy security becomes a major issue, developingcountries have everything to lose by simply following fossil-fuel based countries have everything to lose by simply following fossil-fuel based industrialization, and everything to gain by recasting their development industrialization, and everything to gain by recasting their development strategies around the prospects for renewable energies and biofuels. Thisstrategies around the prospects for renewable energies and biofuels. Thispaper argues that the time is therefore ripe for developing countries topaper argues that the time is therefore ripe for developing countries tore-evaluate their stance on renewable energy sources generally, and onre-evaluate their stance on renewable energy sources generally, and onbiofuels in particular.biofuels in particular.
Key words: energy choices, renewable energies, biofuels, peak oil,industrial development, latecomer strategies
1. Introduction
Ever since David French offered his “Ten Commandments” on renewableenergy use in developing countries, over 25 years ago, the issue of the roleto be played in industrial development by energy choices has been largelyneglected. However, recent years have seen convulsions in the world of energy,with a new realization that greenhouse gas emissions from burning fossil fuelsis causing potentially irreparable climate changes, and that global supplies of oil as the principal fossil fuel are peaking. At the same time, large developingcountries including Brazil, China and India are now becoming major driversof the uptake of renewable energy technologies. These developments suggest that the role of renewable energy sources, and energy options more generally,should be seen as having greater salience in discussions of world industrialdevelopment.
While many economists and policy specialists have addressed thisissue, most see the developing world blindly following in the footsteps of thepolluting developed countries; few, if any, see developing countries as part of the solution (e.g. Stiglitz, 2006). Herein lies the attractiveness of supportingbiofuels and renewable energies for developing countries and development
* John A. Mathews is Professor of Strategic Management at Macquarie Graduate Schoolof Management, Sydney, Australia. Tel: 612 9850 6082, email: [email protected].

60 Transnational Corporations, Vol. 17, No. 3 (December2008)
agencies like the World Bank. By doing so, they take the lead in movingthe world to its destined future independence from fossil fuels, asenvisaged by numerous scholars and captured most effectively by theIIASA/WEC study, Global Energy Perspectives, published in 1998, asshown in figure 1.
Figure 1. Changes in primary energy shares, 1850 to 2100
Source: Nakicenovic et al (1998) Fig 5.7 Scenario C1
As a way of illustrating the issues involved, consider the case of oil dependence in China, India and Brazil. China lost oil independencein 1993, when domestic consumption overtook production.1 Since then, as shown in figure 2, the rise in China’s oil imports has been alarminglyfast and has driven the country’s frantic search for oil supplies around the world. The situation in India is even worse: the country has never enjoyed oil independence, and oil imports currently account for 75% of total oil consumed (figure 3). Rising oil prices make it unthinkable for both China and India to continue their industrialization based on fossilfuel imports. By contrast, Brazil has recently made itself oil independent,with its state-owned oil company, Petrobras, now producing more thanthe country consumes. Petrobras is also leading the country into a newera of biofuels, both in terms of ethanol blends for cars and biodieselderived from vegetable oils for trucks, buses and heavy equipment.
1 The same thing had happened to the United States over 20 years earlier in 1970.

Transnational Corporations, Vol. 17, No. 3 (December 2008) 61
Figure 2. China’s oil production and consumption, 1977-2005
Source: Based on BP Amoco, BP Statistical Review of World Energy © Euromonitor International2006.
Figure 3. India’s oil production and consumption, 1977-2005
Source: Based on BP Amoco, BP Statistical Review of World Energy © Euromonitor International2006.
The report by Goldman Sachs, Dreaming with BRICS: The pathto 2050, made the widely noted prediction that by 2050, China would become the world’s largest economy, India the third largest, and Brazilthe fifth largest (Goldman Sachs, 2003). This report was a wake-up call

62 Transnational Corporations, Vol. 17, No. 3 (December2008)
for many, showing that economic growth was likely to take today’sdeveloping countries to world leadership by halfway through the century.Yet curiously, the Goldman Sachs report made no mention of energy – not of fossil fuels, nor of biofuels, nor of any other renewable energyresource. But with the double influence of peaking of global oil suppliesand of the rising apprehensions related to emissions of greenhouse gasemissions, such neglect of fundamental energy questions is no longer feasible.
This paper canvasses the issues involved, probing the likelyimplications for the industrial development process of the peaking of global oil supplies and of the rise of concerns over global warming,and also the prospects for developing countries to move towards (and indeed take leadership in) the application of renewable energy options.The purpose of the paper is to ask explicitly what effects the choiceof energy options would entail on countries’ industrial development prospects. This is a typical question posed by Sanjaya Lall in his manydiscussions of technological capabilities and the sources of advanceon the part of developing countries. In one of his later contributions,made together with Carlo Pietrobelli, Sanjaya examined the prospectsfor development in Sub-Saharan Africa and the role to be played in theprocess by institutions of technology transfer and indigenous R&D, and concluded on a pessimistic note (Lall and Pietrobelli, 2005). Yet, withthe rise of renewable energies as options for such developing countries,and in particular the grasping of opportunities in the field of biofuels, it is precisely the role of technology transfer institutions that is vital to theeventual success of such projects. Sanjaya himself would no doubt agree,were he to be able to witness these new and arresting developments inthe fields of renewable energies and biofuels.
2. Energy choices and development
Until recently, it was the conventional wisdom that renewable energies would be a marginal and costly alternative, that might makesome headway over a century or more as technologies improved. But thecase of Brazil, China and India shows that renewables – led by biofuelsand in particular ethanol – are competitive here and now, and moreover represent an exceedingly attractive option for developing countries.
The advantages for developing countries of ethanol and biodiesel over their fossil fuel counterparts as transport fuels are many,and include the points that:

Transnational Corporations, Vol. 17, No. 3 (December 2008) 63
they are currently cheaper than oil;they provide energy security as opposed to dependence onimports from unstable oil regimes;they burn more cleanly;they generate fewer greenhouse gases;they promote rural development;they can generate new export industries for developingcountries; andeven countries with a less advanced level of science and technology can get a start with biofuels.
Strategizing around renewable energy options, it will be argued, isfundamentally different from securing strategic supplies of fossil fuels,in particular oil. To engage in global strategic games (with their deadlyconsequences in the form of resource wars) in pursuit of security of oilsupplies is one thing – and Brazil, China and India are all playing that game, with increasing sophistication and success, to the consternation of the United States and its western allies. The key issues here are militarystrength, international political and military alliances, and diplomaticmanoeuvring.
But to strategize around renewable energy sources calls for calculations of a quite different kind. It calls for interventionist industry policies to kick-start new renewable energy industries, suchas those based on growing and distilling biofuels; on capturing solar energy (e.g. manufacturing PV solar cells); or on building wind farms(e.g. manufacturing wind turbines). But more than this, it calls for asophisticated design of the institutional settings in which a transitionto utilization of renewable energy may be effected – from mandatingthe use of ethanol-petrol blends in motor vehicles, and extending suchmandates to diesel-powered machines; to mandating rising proportionsof electric power generation from renewable sources; to implementingtax measures that offer incentives to move towards energy conservationand efficient fuel usage and disincentives to inefficient fuel use (suchas indiscriminate use of SUVs in cities); and to creating incentivesto encourage firms to become active in the supply chains that feed renewable energy supply systems.
Brazil has taken an early lead in biofuels, driven by its hugedomestic ethanol programme that has seen its use as a blended fuelmandated by the federal government, backed by subsidies to sugar producers to enable them to produce ethanol as well as sugar. NowBrazil has a thriving export industry for biofuels, with firms operating
64 Transnational Corporations, Vol. 17, No. 3 (December2008)
bioreactors at its core. In these reactors, the decision to produce sugar or ethanol can be taken on a daily basis at the flick of a switch, dependingon the prevailing world prices. In 2005, Brazil started to replicate itssuccess with bioethanol through a biodiesel programme. Already by late2006, this programme had generated 100,000 jobs in the northeast of the country, producing biodiesel from oil crops such as castor oil and palm oil. The Brazilian national energy company, Petrobras, introduced a new biodiesel product, dubbed H-Bio, in 2006, the first in the world to do so.
China and India are Brazil’s largest export markets for ethanol,and are themselves rising fast as producers: they are now third and fourth largest ethanol producers in the world. They are also rising fast in the biodiesel stakes as well. Many other tropical developing countriesin Asia and in Central America are also becoming active in biofuels.In promoting renewable energy, in their own interests, developingcountries can thereby create a new agenda for solving the wider problemof global warming. China is developing a range of alternative energies,including wind energy, solar thermal and photovoltaics and biogasdigesters, which represent the seeds of a new low-carbon economy.India, too, is developing renewable energy industries, with firms likeSuzlon becoming a world leader in wind turbines manufacture, and with institutional innovations such as a Ministry of Non-ConventionalEnergy Sources to coordinate developments.
The pattern of development of renewable energy sources indeveloping countries is likely to follow its own “latecomer effect” logic.While in the developed world, dependence on biofuels is an expensiveoption (because of intensive land use and need for fertilizers for fuelcrops) in the developing world, such as Brazil and Africa, biofuels canbe produced at much lower costs. And, many developing countries havemuch larger land resources to devote to generating energy – from crops,from sun (PV cells) and from wind. The developing world can adapt an“agricultural model” to cultivating renewable energy sources – or what might be called an ergocultural model. The twenty-first century is likelyto see major scientific and technical advances in the use of land for food (agriculture) and for energy (ergoculture), with the developing world taking the lead in both.
Thus, the era when industrial development strategies could beformulated without reference to energy sources looks to be over (Asif and Muneer, 2007; Barnwal and Sharma, 2005; Wright, 2006). Whenwe look just at developing countries, of the world’s 47 poorest countries,
Transnational Corporations, Vol. 17, No. 3 (December 2008) 65
no fewer than 38 are net oil importers, and 25 are completely dependent on oil imports – victims of commitments made during the times whenthe price of oil was seen as low forever (Ren21, 2006). Yet, these arethe countries that have generally favourable conditions for producingenergy from renewable sources.
If the argument of this paper is sound, then it means that renewableenergies – starting with biofuels – represent a unique opportunity for developing countries, and one that has the potential to change theterms of world trade in energy and tip the balance favourably towardsindustrial development in tropical countries around the world. The keyto their success is mastery of the technologies involved, many of whichwill have to be imported from developed countries, through licensing,FDI or through movement of human capital – exactly as described bySanjaya Lall in his numerous studies on this process.
3. Arguments in favour of a fossil fuel-independentstrategy
The conventional development wisdom has it that developing countries will have to follow the energy steps of the developed world,emulating their pathways to development. But what the conventionalwisdom failed to foresee was that some developing countries would find an alternative pathway – one based not just on fossil fuels and extremedependence on oil imports, but on a different trajectory, namely one of energy independence and in particular independence from fossil fuels.2
Unlike Russia, which is playing strategic games with its vast oil and gasreserves, Brazil, China and India are strategizing so as to build energy independence through a variety of renewable fuels and energy sources,starting with liquid biofuels, partly in order to reduce their vulnerabilityto balance of payments difficulties due to rising oil import bills. In thisway, the debates over renewable energy, which rose to prominence indeveloped countries during the 1970s but died away as oil prices fell,
2 It has to be recognized that China and India will remain large-scale users of coal for many decades to come, just as the European countries and the United States inthe 19th century used coal as the primary energy source. The point being made is that alongside their use of coal these countries are demonstrating that they can “energize”their development with renewable sources as well, and actually utilize them as seeds of new industries that can compete with those of the advanced world, and capture latecomer advantages in so doing. At the same time, they can deploy advanced technologies suchas combined cycle power generation to reduce greenhouse gas emissions from their useof coal – as China is planning to do, in advance of the developed world.

66 Transnational Corporations, Vol. 17, No. 3 (December2008)
are now being replayed in the developing world – and this time with realprospects of success.
The issues to be considered as developing countries movevigorously towards promotion of renewable energy and biofuelsindustries may be rehearsed under the following ten headings, to emulatethe approach of French (1982):
Energy security and the peaking of oil supplies globally;Biofuels as tested substitutes for fossil fuels;Abundance of land for producing energy crops in tropicalcountries;Biofuels’ potential to reduce fuel import bills and fossil fueldependence;Biofuels production is a rural industry and can promote socialinclusion;Countries with even low levels of science and technology can get a start in biofuels, and they can create thereby a “development bloc” that can drive industrial development;Biofuels are potentially greenhouse gas neutral and can earncountries carbon credits;Developing countries can develop their own distinctive
development trajectory; andA Biopact between countries of the South exporting sustainably
importing them could resolve concerns over biofuels and break the world trade logjam.
4.1 Energy security and the peaking of oil suppliesglobally
The relentlessly rising long-term costs of oil pose a major brakeon industrializing efforts by developing countries. Looking at theglobal picture, the data reveal a relentless build-up of consumption,with production trying to keep up; but the discovery of new fields is insteep decline. Indeed, new discoveries peaked in the 1960s. Productionmust fall following these declines eventually. Just when this occurs iscurrently the subject of intense debate (Kerr and Service, 2005). Thegraphic utilized by the Association for the Study of Peak Oil and Gas isshown in figure 4.
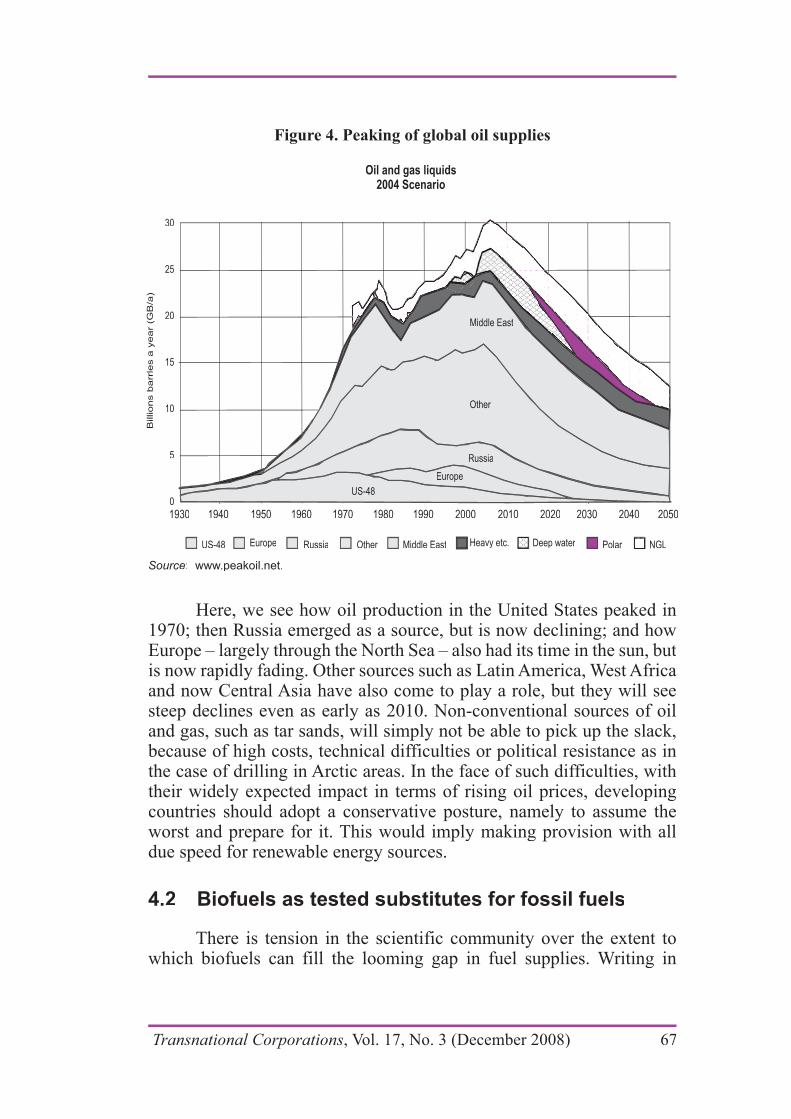
Transnational Corporations, Vol. 17, No. 3 (December 2008) 67
Figure 4. Peaking of global oil supplies
Source: www.peakoil.net.
Here, we see how oil production in the United States peaked in1970; then Russia emerged as a source, but is now declining; and howEurope – largely through the North Sea – also had its time in the sun, but is now rapidly fading. Other sources such as Latin America, West Africaand now Central Asia have also come to play a role, but they will seesteep declines even as early as 2010. Non-conventional sources of oiland gas, such as tar sands, will simply not be able to pick up the slack,because of high costs, technical difficulties or political resistance as inthe case of drilling in Arctic areas. In the face of such difficulties, withtheir widely expected impact in terms of rising oil prices, developingcountries should adopt a conservative posture, namely to assume the worst and prepare for it. This would imply making provision with alldue speed for renewable energy sources.
4.2 Biofuels as tested substitutes for fossil fuels
There is tension in the scientific community over the extent towhich biofuels can fill the looming gap in fuel supplies. Writing in

68 Transnational Corporations, Vol. 17, No. 3 (December2008)
Science in 2006, Professor Hoffert and his colleagues offer the viewthat “All renewables suffer from low areal densities”. They go on tocomment, “… photosynthesis has too low a power density (~0.6 W/m2) for biofuels to contribute significantly to climate stabilization”(Hoffert et al., 2002, p. 984). But it turns out that they are consideringthe case only for developed countries. Against this, Steven Kooninstates unequivocally in the same journal that “with plausible technologydevelopments, biofuels could supply some 30% of global demand in anenvironmentally responsible manner without affecting food production”(Koonin, 2006, p. 435).
The reality is that for developing countries where sunshine and desolate landscapes are not in short supply, there is vast scope for producing biofuels, particularly from degraded and abandoned land.3 In India, for example, there are now several major investment programmesunderway in ethanol and biodiesel production, utilizing vast areas of degraded or under-utilized land, and planting under-utilized crops suchas Jatropha curcus. These projects can also capture latecomer advantagesthrough utilizing the latest in biorefinery technology – as described in arecent article in Science (Ragauskas et al., 2006).
There is a huge literature hostile to biofuels, accusing them of being energy-intensive in cultivation; taking land from food crops; and encouraging monoculture. But these are largely arguments stemmingfrom developed countries and describing developed country conditions– particularly in the United States and northern Europe. But the situationin developing countries is quite different. Brazil produces ethanol fromsugar cane (the fastest growing crop on the planet) with an energy gainof up to 8:1, because of the favourable conditions in which the fuel isproduced.4
3
such degraded lands in countries of the South, in opposition to the common claim that biofuels are being driven by deforestation.
4 On the experience with biofuels in Brazil, see Goldemberg et al (2004) for a
energetics of Brazilian ethanol production based on sugar cane, including the estimate of energy yield of 8:1. The most recent estimates for the sugar cane crop of 2005/06,by Macedo, Seabra and Silva (2008), raise the energy gain to 9.3:1, while GHG savingswere 2181 kg CO2eq per cubic metre of E100 ethanol, compared with release of GHGemissions from ethanol production of 436 kg CO2eq per cubic metre – a gain of 1745 kgCO2eq per cubic metre of ethanol.
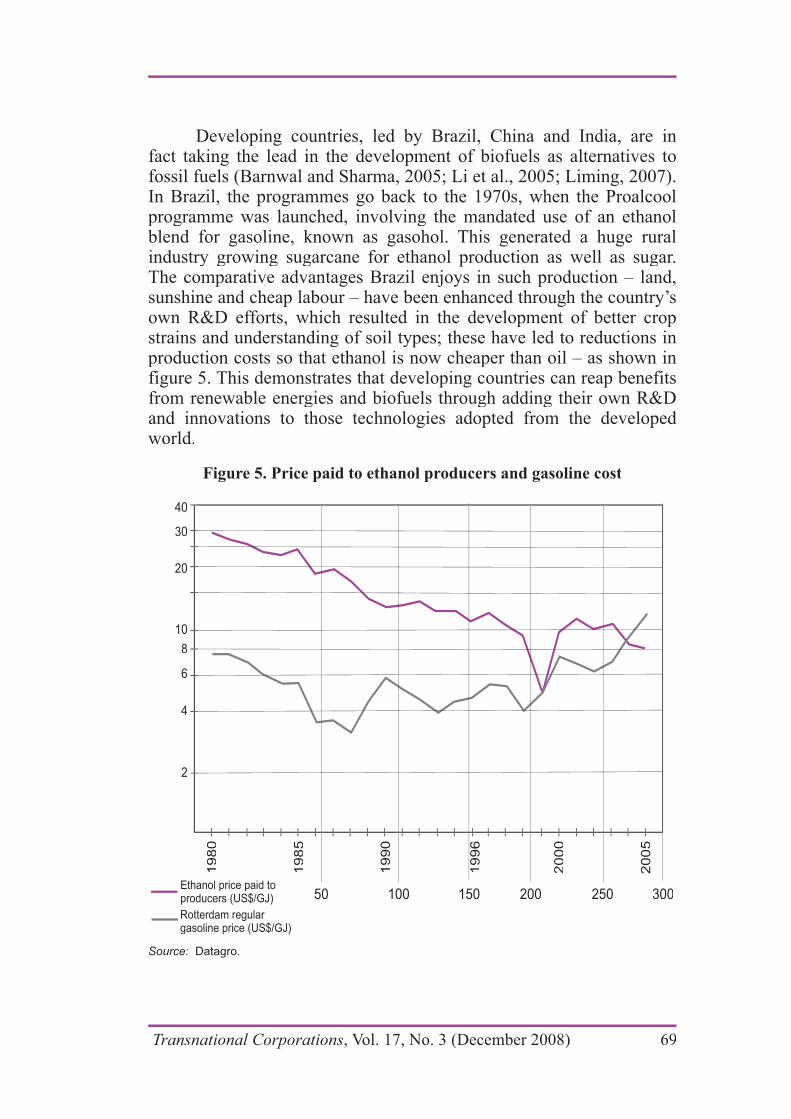
Transnational Corporations, Vol. 17, No. 3 (December 2008) 69
Developing countries, led by Brazil, China and India, are infact taking the lead in the development of biofuels as alternatives tofossil fuels (Barnwal and Sharma, 2005; Li et al., 2005; Liming, 2007).In Brazil, the programmes go back to the 1970s, when the Proalcoolprogramme was launched, involving the mandated use of an ethanolblend for gasoline, known as gasohol. This generated a huge ruralindustry growing sugarcane for ethanol production as well as sugar.The comparative advantages Brazil enjoys in such production – land,sunshine and cheap labour – have been enhanced through the country’sown R&D efforts, which resulted in the development of better cropstrains and understanding of soil types; these have led to reductions inproduction costs so that ethanol is now cheaper than oil – as shown infigure 5. This demonstrates that developing countries can reap benefitsfrom renewable energies and biofuels through adding their own R&Dand innovations to those technologies adopted from the developed world.
Figure 5. Price paid to ethanol producers and gasoline cost
Source: Datagro.
70 Transnational Corporations, Vol. 17, No. 3 (December2008)
4.3 Abundance of land for producing energy crops intropical countries
Tropical developing countries are not as limited in their choice of feedstock as temperate, developed countries. They have the options of using sugar cane itself, as well as a variety of starchy inputs such as cassavaand, for biodiesel, any of a variety of oilseeds that have traditionallybeen viewed purely as foodstuffs. In fact, many of the oilseeds nowbeing cultivated for biodiesel are inedible – such as castor oil. In India,the wonder oilseed, Jatropha curcus, which is also being investigated in Brazil, grows in hostile conditions on degraded land. As such, thereis little question of the cultivation of these crops competing with food supplies or with land that is potentially cultivable for food. Indeed, onearea where intensive R&D efforts are needed is the investigation of thepotential of existing and little known plants for biofuel production indeveloping countries. These options are being explored by Brazilian,Chinese and Indian ethanol and energy producers in tropical countries.
But, of course, land can be misused in the pursuit of biofuel crops,and clearances of rain forest in the Amazon and in South-East Asia(e.g. in Borneo and Sarawak) represent the front line of such concerns.Countries that allow unchecked clearances of forests are defeating thevery conditions that give them a developmental advantage – and givingrise to global campaigns such as those concerned with the threat to thehabitat of the orang-utan (FoE, 2005). If developed countries can begiven an excuse to block imports of biodiesel from tropical countrieson the grounds that it is derived from mass clearance of rainforest, thenclearly the whole biodiesel enterprise is imperilled. That is why countriesof the South have every reason to seek the most stringent certification processes for their biofuel production as meeting sustainability targets,and can best do so through negotiation of a global Biopact – as discussed in subsection 4.10 below.
4.4 Biofuels’ potential to reduce fuel import bills andfossil fuel dependence
For a developing country, it is all the more perverse to neglect thebiofuel option while imports of oil are placing an ever-increasing burdenon the country’s balance of payments. Brazil has estimated the savingson its fuel import bills since the launch of the Proalcool programmeto be of the order of $50 billion per year – which is far larger than thecountry has spent in promoting ethanol. Likewise, the savings for China
Transnational Corporations, Vol. 17, No. 3 (December 2008) 71
and India in foregone oil imports will be of the order of hundreds of billions of dollars – the difference between success and catastrophe intheir development efforts. Since the lack of foreign exchange is a major barrier to industrialization, displacement of fossil fuel imports representsa major strategic advantage.
This issue also has the developmental advantage in that the country is forced to consider its energy production as an industrialissue calling for business and developmental strategy, and not just asan issue of importing “stuff” from abroad. To “grow” industries is thecore of the development process – and it can start with energy as withany other branch of production, as discussed in the context of seeding“development blocs” in subsection 4.6 below.
4.5 Biofuels production as a rural industry andpromotion of social inclusion
Brazil sees biofuels production as a way to promote rural industry and to curb the migration to the cities from the countryside.Biodiesel produced from castor beans in Brazil’s arid northeast sertao,for example, is promoted not just for the biodiesel but also for the fact that it creates thousands of jobs in this otherwise impoverished region.Promotion is through fiscal incentives, such as tax breaks offered tofamilies producing the raw materials needed for biodiesel production.The more the production of castor beans for biodiesel and sugar cane for ethanol production spreads, the greater the rural employment generatingpossibilities are, which help to curb migration to the big cities. In India,the production of biodiesel from Jatropha is also explicitly promoted asa rural industry capable of generating village-based enterprises and localemployment. Indian national firms, like Reliance Industries, already aplayer in the oil business, are now moving into production of biodieselfrom plantations established in Andhra Pradesh.
4.6 Biofuel development strategies for countries withlow levels of science and technology
Biofuels in tropical countries can be grown with scarcelymore input than seed, land, sunshine and labour. If the country has acomparative advantage in labour-intensive activities, then it can start with production activities with a low level of technical sophistication – and move up from there. Brazil is demonstrating how this can bedone, through its ethanol programme involving sugar cane, and now its

72 Transnational Corporations, Vol. 17, No. 3 (December2008)
biodiesel programme involving vegetable oil seeds such as castor and soybean crops. In the words of the country’s president, Luiz Inacio Lulada Silva, this programme had, by July 2006, already generated 100,000new jobs in growing soybeans and other oil crops in the northeast of Brazil. The biodiesel programme has been designed as much withsocial goals as with fuel supply goals. The point is that a country inAfrica can emulate this example and devote large tracts of land to fuelcrop production. Domestic consumption can provide an initial market,since the fuel produced can substitute for expensive oil imports. Astechnical sophistication is acquired, export markets may be opened up.As the industry develops, advanced distillation systems installed, and technological know-how in the country can be enhanced. This will thenhave spillover effects in other sectors.
As a biofuel industry becomes established, it is likely to driveindustrial development through linkages and complementarities. Biofuelsand other renewable energies promise to play the role of a critical“development bloc” for Brazil, China and India in the first instance,and for wider swathes of developing countries through the tropics moregenerally. The concept of development bloc was introduced and defined by the Swedish development economist, Erik Dahmén in 1950, based on his studies of entrepreneurship in the Swedish economy (Dahmén,1950/1970, 1989). He defined it as “sequences of complementaritieswhich by way of a series of structural tensions, i.e. disequilibria, mayresult in a balanced situation” (Dahmén, 1989, p. 111). Such a suprafirmsystem provides a striking description of how firms may collectivelystrategize in the context of a disequilibrium economy, and build oneach others’ efforts to improve their own prospects. J. P. Carlsson and Eliasson (2003) have taken up the concept and renamed it competencebloc to emphasize that such a collective capability is needed to support and sustain technological innovation. If the technological systemrepresents the supply side of industrial dynamics, then the development bloc or competence bloc represents the demand side. The competencebloc captures the notion that if new technologies are to be taken up, or absorbed, then firms must have the requisite capabilities, and the product ranges, to be able to make use of the technologies. It is the blockagesdue to such inadequacies and bottlenecks that accounts for poor uptakeof new technologies, rather than unwillingness or conservatism on thepart of managements. Thus a development bloc represents the systemiccounterpart to the consideration of market demand as well as supplier competence in the microdynamics of technological trajectories. It generates the forward and backward linkages that can drive industrial

Transnational Corporations, Vol. 17, No. 3 (December 2008) 73
development. Development blocs formed around value chainsinvolved in renewable energy production and bioenergy are preciselythe kinds of industrial templates needed for development today. And renewable energies are already providing the business around whichtransnational corporations (TNCs) from the South are already forming– as demonstrated by such firms as Petrobras and Bunge from Brazil(in biofuels); Suzlon from India (in wind turbines manufacturing); and Suntech Power from China (for photovoltaics production).
4.7 Biofuels are potentially greenhouse gas neutraland can earn countries carbon credits
Biofuels like ethanol are potentially greenhouse gas neutral, inthe sense that every carbon atom burned is simply replacing a carbonatom taken by the plant during photosynthesis. This is by far their most appealing feature from a long-term environmental perspective. Of course, this neutrality has to be qualified by the fact that fossil fuels areconsumed along the value chain producing the ethanol – but again muchof the concern voiced on this issue emanates from a developed countryperspective and is much less relevant in a developing country. For example The Washington Post ran a story in July 2006 captioned “Thetfalse hope of biofuels” in which the main charge was that the energygain is little after deducting amounts involved in fertilizer, harvesting,transport, processing, etc. These considerations change dramatically when considered in the context of a low-cost developing country, whereinput resources including land and sunshine are abundant, and processingtakes place close to where the crops are grown. The greenhouse gasemission abatements can then serve to generate carbon credits under theKyoto protocol.
Again indiscriminate clearance of forest to plant energy cropsdefeats the gains in greenhouse gas emissions that are potentially therefor the taking. It is to curb such behaviour and hold governments toa standard of accountability that is one of the principal arguments for global institutions like the World Bank to become more directly involved in promotion (and to some extent regulation) of the development of biofuels.
Developing countries have the opportunity to take a fresh initiativeon this matter, and channel part of their biomass into production of biochar (produced through slow pyrolysis) which can then be put back into the soil as a fertilizer substitute. Biochar was actually invented by

74 Transnational Corporations, Vol. 17, No. 3 (December2008)
pre-Columbian civilizations of the Amazon, where it created fertile soilpatches named by the Portuguese as terra preta. Its reintroduction intobiofuel production by tropical developing countries would thus be ameans of reclaiming this ancient invention, and provide the basis for producing biofuels that are demonstrably carbon-negative – in the sense that they sequester more carbon from the atmosphere than is put back through burning of the fuel. Biochar amendment of the soil is a way of drastically enhancing fertility while conserving soil, avoiding run-off,enhancing water retention, reducing nitrogen emissions and providingthe opportunity for production of carbon-negative bioenergy.5
4.8 Biofuels and renewable energies as a first step ona clean technology development trajectory
Biofuels and renewable energy options are not an end in themselves, and it will be necessary to lead a country along a trajectorythat will involve many more biofuel innovations and clean technologies.Brazil for example started with ethanol, and, since 2005, it has launched a biodiesel programme that promises to rapidly take the country to world leadership in biodiesel. All developing countries can expect to passthrough the same two phases, probably in an accelerated manner. Withinthe next decade, a third phase can be expected to become significant,namely the use of biomass generally (such as through forest plantations,or municipal waste) as feedstock for general bioreactors (Somerville,2006). This phase will depend on the development of enzyme packagesthat are currently in the test stage in R&D companies such as Iogen. But it is highly likely that this stage will be accelerated through innovationsdeveloped in Brazil, China and India, given their track record.
Countries do not need to see biofuels or any other source of renewable energy as a total solution or substitute for fossil fuels. They all contribute to a portfolio of renewable energy options that will vary depending on the comparative advantages of the country concerned. Even the simplest kinds of renewable energy options, suchas biodigesters producing gas, electricity, heat and light from biomass or village waste, represent powerful ways of enhancing energy per capitausage in advance of electrification grids and without promoting heavyfossil fuel-dependent industrialization.
5 See Mathews (2008a) for a discussion of carbon-negative biofuels, utilizingbiochar amendment of soil, and Lehmann (2007a, 2007b) as a representative sample
Transnational Corporations, Vol. 17, No. 3 (December 2008) 75
4.9 Developing countries distinctive latecomer institutional innovations in biofuels
Brazil, having accomplished a successful biofuels industry, shows other countries how it can be done. In the 1970s, it suffered under a dictatorship, but out of that experience came an understanding as tohow the country could benefit from its comparative advantages in sugar cane growing and processing, turning these into competitive advantages.In the most recent period, Brazil has seen its use of biofuels leap ahead under the twin impact of flex-fuel vehicles (FFVs) and the mandated provision by fuel companies of ethanol blends (from E25 to E85) allacross the country.
Other developing countries can learn from this example, without having to go through all the painful episodes of Brazil’s history of thepast 40 years. They can accelerate their uptake of biofuels, with all theadvantages that this can bring (in terms of energy security, savings fromreduction in oil imports, rural development and cleaner city air) to createnew and vibrant export industries, simply through the double measuresconsisting of:
1)automotive industry); andmandating provision of ethanol-petrol blends (starting2) withE10 and moving to E25) within a few years.
So much of the discussion of the past decade on renewable fuels has beendriven by supply-side considerations, namely costs and technologies.But the key to getting these new industries off the ground – as in everysuccessful case of deliberate industry creation – is to influence demand;in this case, the demand from the automotive industry for cars that run onethanol blends, and demand from the motoring public for such ethanolblends.
So any developing country today can benefit from this experience,and move to establish a biofuel industry with relative certainty as to theoutcomes. The key is to start with ethanol blends (“gasohol”) rather thanseeking to jump straight into pure ethanol or other biofuels, and to do soat a measured pace, building demand for the ethanol blend by drawingthe automotive sector and oil sector along with the programme.
The institutions established to drive the uptake of biofuels arelikely to have a knock-on effect, facilitating the development of other industrial sectors, formed initially as support sectors for the biofuel
76 Transnational Corporations, Vol. 17, No. 3 (December2008)
industry. Good institutions develop during an economic activity. Whena committed government engages in a partnership with a proactiveprivate sector, they jointly begin to design and implement appropriateinstitutions. So while institutions are the key, the causation may befrom the start of an activity in response to a government trigger (taxbreak for example), to the unfolding of institutions that help to troubleshoot as the process rolls along. Of course, the process will be highlyinefficient in the beginning, as countries learn to make these institutionswork more effectively. This is best illustrated in Brazil’s own follow-upto the ethanol programme, namely its Biodiesel programme.
Brazil’s biodiesel programme – a successful latecomer strategy
This latest biofuel initiative from Brazil shows just what canbe achieved by a developing country that focuses its institutionalinnovations on capturing its latecomer effects. The Brazilian biodieselprogramme, which was launched in January 2005, has been well crafted and executed. We can identify at least four latecomer institutionalfeatures to the programme that have not been widely recognized.
First, it is a carefully managed incremental programme, movingthrough three phases that have been widely discussed in Brazil. Thefirst, voluntary phase, brings the country up to a level of 2% biodiesel,following the example of the Proalcool programme. By 2008, this 2%minimum becomes mandatory, and rises to 5% minimum blend by 2013,athough the success of the programme in its first 18 months means that it is widely anticipated that the mandatory 5% blend (B5) will takeeffect at an earlier date, possibly as early as 2010. Thus, the country as awhole is being brought to a position where it produces 5% of all dieselrequirements from vegetable oils by 2013 at the latest (and possibly asearly as 2010), bringing it abreast of world leaders. The programme isoverseen by the Ministry of Mines and Energy.
Secondly, the capacity of the country is being ramped up inthe initial, voluntary stage, by means of staging national auctions for biodiesel. Ten such auctions had been staged by the end of 2008, bythe National Petroleum Agency (ANP), the motor fuel standards agency(now renamed the National Agency for Petroleum, Natural Gas and Biofuels). These auctions have encouraged bids from potential supplierswho are thereby induced into the market. The state-owned oil company,Petrobras, acts as the buyer of last resort, thereby ensuring that theauctions bear some relationship to market reality.
Transnational Corporations, Vol. 17, No. 3 (December 2008) 77
Third, there is a distinct and explicit social goal to the biodieselprogramme again, learning from the experience of the Proalcoholprogramme. The Ministry of Agrarian Development (MDA), which ispro-small farmers, has shaped the biodiesel programme with its “sealof social responsibility” meaning that small farmers have to contributeover 50% to a large trader's or distributor's biodiesel. It is only withsuch a seal that large companies receive tax credits and are allowed to bid at the auctions. The impact has been dramatic, President Lula, whobacks this programme as the central initiative of his presidency, claims that 100,000 jobs have been created in Brazil's impoverished northeast region through growing oilseeds (mainly castor oil).This is backed bydata from the MDA showing that since the launch of the programme, just over 200,000 small family-owned farms have been induced into growingoilseeds. Moreover the favoured oilseeds are castor oilseed and palm oil (from a variety of native Brazilian species), rather than soybeans that are grown in the centre and southeast of the country. This is in additionto the 500,000 rural jobs maintained by the Proalcool program, plus the500,000 jobs indirectly linked to rural alcohol production.
Fourth, Brazil is backing a wide variety of oilseeds in these earlystages of the programme to see which ones turn out to be best in a tropicalcountry (and bearing in mind that European experience is confined exclusively to rapeseed and United States experience to soybean).Certainly, output is currently dominated by soybean and palm-oil, but cottonseed and castor oil are also picking up, under the influence of the MDA's social inclusion or rural smallholder development strategies.New candidates are coming on to the scene, such as the wonder oilseed,Jatropha curcus, widely utilized for biodiesel in India.6 There are as wellconventional but under-utilized sources such as beef tallow, obtained from slaughterhouses. The broader Brazil’s scope of oilseed culture is,the more it is able to take advantage of changes in world prices for thesevegetable oil commodities, switching between them. Thus, it is a smart latecomer strategy to invest in variety at this early stage of the biodieselindustry. The oilseed varieties in use in Brazil are shown in table 1.
Note that these four central features of the programme aredriven by four Ministries, all in the pursuit of highly creative latecomer strategies: the Ministry of Mines and Energy, backing renewable energiesgenerally; the ANP, safeguarding standards and conduct the auctions;the MDA, launching a new land reform programme with the biodiesel
6 Jatropha curcus grows under harsh conditions; it is a perennial that can beharvested regularly; and above all it is inedible, meaning that its cultivation will never be seen as a threat to food supplies.

78 Transnational Corporations, Vol. 17, No. 3 (December2008)
projects, in its direct appeal to “social inclusion” as a national goal of theprogramme; and the Ministry of Agriculture, promoting a wide varietyof oilseed crops and not just soybean. The success of the programme todate indicates successful collaboration between these four ministries.
This Brazilian strategy stands in marked contrast with thecautious approach to biofuels and bioenergy development advocated byNGOs such as Oxfam (2008), which continue to see biofuels as agentsof lopsided development or even of under-development. As Oxfam putsit:
For poor countries that tend to have comparative advantagesin the production of feedstocks, biofuels may offer somegenuine development opportunities, but the potentialeconomic, social, and environmental costs are severe.
Oxfam recommends that developing countries move with cautionand give priority to poor people in rural areas when developing their bioenergy strategies (Oxfam, 2008, p. 4).
This is of course precisely what Brazil has done. But Brazil does not assume that merely allocating land and identifying “rural groups” isenough to grow a new industry – as is apparently assumed by Oxfam.Instead, it requires careful nurturing and the building of institutionalsupport. This is the best defence that countries of the South can mount tothe threat of invasion into their nascent renewable energy and bioenergy
Table 1. Biodiesel and Brazilian vegetable oil sources
Castor oil Soy Palm Cottonseedyy
Crop yield Crop yield
(kg/ha)(kg/ha)1,500 1,500 3,000 20,000 3,0001,500 1,500 3,000 20,000 3,000
Oil contentsOil contents
(Per cent)(Per cent)47% 42% 18% 20% 15%47% 42% 18% 20% 15%
Oil yieldOil yield
(kg/ha)(kg/ha)705 630 540 4,000 450705 630 540 4,000 450
2005 production 2005 production
in Brazil (‘000in Brazil (‘000
cubic meter per cubic meter per
year)year)y )y )
90 23 5,600 151 31590 23 5,600 151 315
Source: Petrobras.

Transnational Corporations, Vol. 17, No. 3 (December 2008) 79
industries by TNCs from the North. There is no magic formula bywhich such companies can be utilized without letting them dominate anindustry – as successful cases of development such as Singapore, and now increasingly China itself, can demonstrate.
The fact that biofuels attract a hostile press in the advanced countries of the North should be seen as an opportunity for the countriesof the South – provided they can secure some form of recognition, or certification of the sustainability of their bioenergy efforts (Van Dam et al., 2008). One way to move towards such certification in the North for biofuels grown in the South is through a Biopact.
4.10 A Biopact between South and North could breakthe world trade logjam
Will biofuels unleash a new round of protectionism on thepart of the developed world, to rival the trade barriers already erected against foodstuffs? Already, there is substantial momentum behind theenactment of subsidies to encourage production of ethanol in northerntemperate climates – from corn in the United States and from sugar beet in Northern Europe – where the costs of producing the final product arefar higher (two to three times) than in Brazil or India. It would make somuch more sense for the developed world to produce ethanol on a smallscale for their own energy security, and import the bulk of their suppliesfrom tropical countries in Africa, Asia and Latin America. The United States, for example, operates a tariff of $0.54 per gallon against ethanolimports, at the behest of corn-belt ethanol producers, in addition to thesubstantial subsidies paid by state and federal government programmesand tax breaks offered to these producers (dominated by giants suchas Cargill and ADM). If countries of the North were persuaded to end subsidies to their own domestic producers of bioenergy feedstocks (such as corn), then the major source for the inflation of food prices worldwidewould be addressed.7
It is trade between the South as producer of biofuels and the countries of the North (i.e. the OECD) as consumers of biofuels that will finally make the difference. There is an historic opportunity toachieve a global trade agreement, that would open the markets of theNorth to products from the South, subject to tropical countries agreeing
7 Again, the debate over the impact of biofuels production on food prices
balanced presentation of the issues, see the report by DEFRA (2008).

80 Transnational Corporations, Vol. 17, No. 3 (December2008)
to Codes of Practice that ensure that biofuels be produced sustainablyand responsibly. Such a comprehensive agreement might be termed aBiopact (Mathews, 2007). It is the countries of the South that need totake the determined diplomatic initiative to propose such a Biopact tothe countries of the North (e.g. those grouped in the OECD) and to do soquite consciously as a step towards resolving the long-standing impassein world trade issues where the markets of the North have been closed to primary commodity exports from the South.8 Here, the WTO has an enormously important role to play, in ensuring that the coming biofuelscentury is not wrecked at the outset by short-sighted protectionist measures enacted by the developed world to obstruct global trade inbiofuels.9
5. Conclusion: energizing industrial development
Energy options are now an essential component of a country’sdevelopment strategy. Building a development pathway around renewableenergies and biofuels has the potential to unlock a chain reaction of favourable activities: creating a successful national and export industry;promoting a space for local entrepreneurship and particularly ruralentrepreneurship; creating an advanced science and technology-based industry that will create an incentive to stay abreast of technologicaldevelopments in biofuels and bioreactors generally; demonstrating thesignificance of government policy in creating the right conditions for theindustry to develop; and breaking down resistance to other renewableenergy industries, like solar and wind, thus putting a country onto adevelopment trajectory less dependent of fossil fuels.
Developing countries, in addition to all these advantages, cankick-start their own process of industrial development by focusing seriously and urgently on the building of a biofuels industry and on allits concomitants, such as the promotion of entrepreneurship, exports and
8 See the letter from John Mathews to the Financial Times, “Biopact could end deadlock on Doha”, 23 April 2008.
9 A group of energy and biofuel experts met at the Rockefeller Foundation’sBellagio conference site on Lake Como in March 2008 to discuss these issues, and drafted a Consensus document calling for such a Biopact between countries of the South and of the North. The Sustainable Biofuels Consensus placed emphasis on a Biopact
biofuels being produced. For the text of the Consensus, see: energybulletin.net/43021.html
Transnational Corporations, Vol. 17, No. 3 (December 2008) 81
cluster development. But the opportunity opened up by past ditheringon the part of developed countries over whether to get behind renewableenergies and biofuels in a big way is likely to close soon. If the World Bank were to promote biofuels industries for developing countries as amajor priority, and if this commitment were matched by initiatives indeveloping countries themselves to build renewable energy industries,then the results could be dramatic. Not only would there emergeunexpected solutions to peak oil and greenhouse gas emission problems,but the countries concerned could energize their own development strategies.
The success of developing country programmes to harness renewable energies and biofuels for industrial development efforts as well as energy security, depends on their capacity to mobilize thetechnological capabilities involved – exactly as foreseen by SanjayaLall. In his numerous studies on this theme, such as the work conducted with UNCTAD and with UNIDO where I collaborated with him, thekey to progress was always seen to be the building of technologicalcapabilities that would enable countries to become players in the industrial dynamics of the time. The time now calls for the building of technological capabilities in renewable energies and biofuels, as keys tonon-fossil fuelled development. Sanjaya would no doubt be fascinated to see these developments, and would be gratified by the role that hisinsights will play in bringing them to a successful conclusion.
References
Asif, M. and T. Muneer (2007). “Energy supply, its demand and security issues for developed and emerging economies”, Renewable & Sustainable Energy Reviews,11(7), pp. 1388 1433.
Barnwal, B.K. and M.P. Sharma (2005). “Prospects of biodiesel production from vegetableoils in India”, Renewable and Sustainable Energy Reviews, 9, pp. 363 378.
Campbell, J.E., D.B. Lobell, R.C. Genova and C.B. Field (2008). “The global potential of bioenergy on abandoned agriculture lands”, Environmental Science and Technology,42 (15), pp. 5791-5794.
Carlsson, B. and G. Eliasson (2003). “Industrial dynamics and endogenous growth”,Industry and Innovation, 10(4), pp. 435 455.
Dahmén, E. (1950/1970). Entrepreneurial Activity and the Development of SwedishIndustry, 1919-1939 (Swedish original published 1950; English translation by AxelLeijonhufvud). Homewood, IL: Richard D. Irwin.

82 Transnational Corporations, Vol. 17, No. 3 (December2008)
Dahmén, E. (1989). “Development blocks in industrial economics”, in B. Carlsson (ed.),Industrial Dynamics. Boston/Dordrecht: Kluwer Academic.
DEFRA (2008). The impact of biofuels on commodity prices. London: Department for Environment, Food and Rural Affairs.
French, D. (1982). “The ten commandments of renewable energy analysis”, World Development, 10(1), pp. 71 79.
FoE (2005). The oil for ape scandal: How palm oil is threatening orang-utan survival.Friends of the Earth, Sep 2005: http://www.foe.co.uk/resource/reports/oil_for_ape_full.pdf
Goldemberg, J., S.T. Coelho, P.M. Nastari and O. Lucon (2004). “Ethanol learningcurve: the Brazilian experience”, Biomass and Bioenergy, 26(3), pp. 301 304.
Goldman Sachs (2003). “Dreaming with BRICs: the path to 2050”, Global EconomicsPaper, No. 99. New York: Goldman Sachs.
Greeley, M. (1986). “Rural energy technology assessment: a Sri Lankan case study”,World Development, 14(12), pp. 1411 1421.
Hoffert, M.I. et al. (2002). “Advances technology paths to global climate stability:energy for a greenhouse planet”, Science, 298, pp. 981 987.
Kerr, R.A. and R.F. Service (2005). “What can replace cheap oil – and when?”, Science,309, p. 101.
Koonin, S.E. (2006). “Getting serious about biofuels”, Science, 311, p. 435.
Lall, S. and C. Pietrobelli (2005). “National technology systems in Sub-Saharan Africa”,International Journal of Technology and Globalisation, 1(3/4), pp. 311 342.
Lehmann, J. (2007a). “A handful of carbon”, Nature, 447, pp. 143-144.
Lehmann, J. (2007b). “Bio-energy in the black”, Frontiers in Ecology and theEnvironment, 5(7), pp. 381 387.
Li, J.F. et al. (2005). “Assessment of sustainable energy potential of non-plantationbiomass resources in China”, Biomass and Bioenergy, 29, pp. 167 177
Renewable and Sustainable Energy Reviews, 11 (8), pp. 1739-1757.
Macedo, I.C. (ed.) (2005). Sugar Cane’s Energy: Twelve Studies On Brazilian Sugar Cane Agribusiness And Its Sustainability. UNICA, Sao Paulo.
Macedo, I.C., J.C.A. Seabra and J.C.E.A. Silva (2008). “Greenhouse gases emissions inthe production and use of ethanol from sugar cane in Brazil: the 2005/06 averagesand a prediction for 2020”, Biomass and Bioenergy, 32 (7), pp. 582-595.
Mathews, J.A. (2007). “Biofuels: What a Biopact between North and South could achieve”, Energy Policy, 35, pp. 3550 3570.

Transnational Corporations, Vol. 17, No. 3 (December 2008) 83
Mathews, J.A. (2008a). “Carbon-negative biofuels”, Energy Policy, 36, pp. 940 945.
Mathews, J.A. (2008b). “Biofuels, climate change and industrial development: Can theBiofuels, Bioproducts
, 2 (2), pp. 103-125.
Global Energy Perspectives.Study completed under auspices of International Institute for Applied SystemsAnalysis (IIASDA) and World Energy Council (WEC). Cambridge: CambridgeUniversity Press.
Oxfam (2008). Another Inconvenient Truth: How Biofuel Policies Are Deepening Poverty And Accelerating Climate Change. Oxford: Oxfam International.
Ragauskas, A.J. et al. (2006). “The path forward for biofuels and biomaterials”, Science,311, pp. 484 489.
Ren21 (2006). Status Report 2006. Renewable Energy Policy Network for the 21st century t
(Ren21): http://www.ren21.net/globalstatusreport/download/RE_GSR_2006_Update.pdf
Somerville, C. (2006). “The billion-ton biofuels vision”, Science, 312, 1277.
Stiglitz, J. (2006). A new agenda for global warming, Economists Voice, July 2006, available at www.bepress.com/ev
Tokgoz, S. and A. Elobeid (2006). “Policy and competitiveness of U.S. and Brazilianethanol”, Iowa Agricultural Review, 12(2), pp. 6 7; 11.
Van Dam, J., M. Junginger, A. Faaij, I. Juergens, G. Best and U. Fritsche (2008).Biomass and Bioenergy,
32 (8), pp. 749-780.
Wright, L. (2006). “Worldwide commercial development of bioenergy with a focus onenergy crop-based projects”, Biomass and Bioenergy, 30(8/9), pp. 706 714.

84 Transnational Corporations, Vol. 17, No. 3 (December2008)
RESEARCH NOTES
Emerging economies’ transnational
corporations: the case of Tata*
Andrea Goldstein**
The Tata Group plays a central role in the Indian economy and isThe Tata Group plays a central role in the Indian economy and iscurrently at the fore of the internationalization efforts by its companies.currently at the fore of the internationalization efforts by its companies.This paper assembles available evidence on the internationalizationThis paper assembles available evidence on the internationalizationof Tata firms and considers the relative importance of underlying of Tata firms and considers the relative importance of underlying factors driving the process: market access for exports, sourcing of rawfactors driving the process: market access for exports, sourcing of rawmaterials, and horizontal or vertical integration. It then analyses howmaterials, and horizontal or vertical integration. It then analyses howinternationalization is changing the nature and corporate culture of Tata,internationalization is changing the nature and corporate culture of Tata,and the implications of some of the conglomerate’s specific features,and the implications of some of the conglomerate’s specific features,including the role played by Tata Sons and Tata Industries in coordinatingincluding the role played by Tata Sons and Tata Industries in coordinatingfinancial and managerial activities and managing the Tata brand, as wellfinancial and managerial activities and managing the Tata brand, as wellas the strong emphasis on corporate social responsibility, mainly, thoughas the strong emphasis on corporate social responsibility, mainly, thoughnot exclusively, through the Tata trusts.not exclusively, through the Tata trusts.
Keywords: globalization, India, emerging multinationals, businessgroups, post-merger integration
1. Setting the stage
The international expansion of large companies from emerging marketsis a new and dynamic feature of the global investment landscape.1 The Indiancorporate sector has been an active participant in this phenomenon. The totalvalue of outward foreign direct investment (FDI) from India, which stood at $2.3 billion in the 2004/05 fiscal year, is projected to reach $26.5 billion in2008/09 (Economic Advisory Council to the Prime Minister, 2008). AmongIndian companies expecting to engage in M&A in the next few years, 94%of them consider it likely to be a cross-border acquisition (Grant Thornton,2006).
* This paper is a much-condensed and updated version of Goldstein (2008). I acknowledgethe assistance of A. Vishwanath at Tata Sons and RIS in Delhi. For helpful comments and suggestions on earlier drafts, I also thank Suma Athreye, Dilek Aykut, Neil Gregory, DeveshKapur, Sandeep Kapur, John Mathews, Ravi Ramamurti, Alan Rosling, Jayati Sarkar, and MiraWilkins, as well as Masahiro Kawai, Arvind Panagariya and other participants at the 2007TCFGS conference in Tokyo and the 2008 MERIT workshop in Maastricht. The author is solelyresponsible for the content. The views expressed do not represent those of the OECD or itsMembers.
** At the time of writing, Andrea Goldstein was Senior Economist at the OECDDevelopment Centre, Paris.
1 See, for example, Goldstein (2007) and UNCTAD (2006).
While this is not the first extended period of internationalization for large Indian businesses2, the geography and the circumstances of outward FDI differ from earlier periods. Most investment deals are directed at more advanced markets, reflecting the increasing competitivness of Indian companies arising from cost advantages, production efficiency,managers’ willingness to take on risk, and exposure of domesticcompanies and their management to Western and Japanese competitors.Following the progressive relaxation of foreign exchange controls,Indian companies can now invest up to 300% of their adjusted net worthwithout prior permission. Government is also playing its role, providingpolitical support to Indian companies and managing the economy and the rupee in a way that is conducive to outward FDI.
A number of recent studies have tried to shed light on theintriguing phenomenon of the rise of transnational corporations(TNCs) from what is still one of the world’s poorest countries. Kumar (2007) finds that Indian enterprises draw their ownership advantagesfrom accumulated production experience, cost effectiveness of their production processes and other adaptations to imported technologiesmade with their technological effort, and sometimes with their abilityto differentiate product. Ramamurti and Singh (2009) identify four “generic internationalization strategies”, each based on a different set of competitive advantages, governed by a specific logic, and resultingin a different choice of target markets and modes of entry. Elangoand Pattnaik (2007) find that Indian firms draw on the internationalexperience of their family and overseas networks to build capabilities tooperate in international markets.
In this paper, I focus on one of India’s two largest conglomerates, theTata group.3 Which Tata firms are at the forefront of internationalization,and why? How do they internationalize, and in which countries? Doesthe business group structure of Tata impact on the way the affiliatesinternationalize? Finally, what impact is internationalization having onTata firms’ values and culture?
The methodology for answering these questions is narrative and inductive. The analytics is embedded in the eclectic literature that hasanalyzed big businesses in emerging economies like India. In particular,insights are sought from the work of Tarun Khanna, who has shown – inhis writing with Krishna Palepu (Khanna and Palepu, 2005) and Yishay
2
less developed than India (Lall, 1983).3 Reliance (Mukesh Ambani) is at present the largest business group.
86 Transnational Corporations, Vol. 17, No. 3 (December 2008)
Yafeh (Khanna and Yafeh, 2007) – that in a typical medium-developingcountry, the lack of capital and other markets has spurred the formationof conglomerates as a proxy for such missing institutions. From thisperspective, concentrated ownership plays a socially useful role,contrary to the views that it serves to perpetuate the domination of fewbusiness entities and stifle competition. Another study that is relevant for studying a group like Tata is Amsden (2001), which observed that,partly because of the weak development of such markets in emergingeconomies, the state has played (and may still play) an important rolein nurturing successful domestic enterprises, which have often takenthe form of conglomerates in order to diversify widely into unrelated activities.
Section 2 presents a short summary of Tata history, before turning,in section 3, to three features that make it distinctive: the conglomeratenature; the role of the two different “financial heads” at the top of thepyramid in providing a broad range of services to the business units; and the strong emphasis on corporate social responsibility and philanthropy.Section 4 then reviews Tata’s internationalization process and theimplications, especially in terms of the sustainability of these threedistinctive features.
2. A brief history of Tata4
The Tata Group is almost 150 years old. It currently comprises96 operating companies,5 which together employed some 330,000people and had revenues of $28.8 billion in 2006–2007, the equivalent of about 3.2% of India’s GDP. Tata is active in seven major businesslines: information systems and communications, engineering, materials,services, energy, consumer products and chemicals. At the end of June 2008, its 27 publicly listed companies had a combined market capitalization of $49.6 billion, which is the largest among Indian businessgroups in the private sector, and a shareholder base of almost 3 million.The Group has operations in more than 54 countries and its companiesexport products and services to 120 countries.
4 In preparing this section, I accessed the Tata Group websites in July–September 2007 and July 2008. Tata provides an unusually large amount of information on itssite, including independent media reports which are not necessarily favourable to itsmanagement.
5 The number of companies controlled by the group peaked at 150 in 1969 (Tripathiand Jumani 2007, p. 160).
Transnational Corporations, Vol. 17, No. 3 (December 2008) 87
Founded by Jamsetji Tata in 1868, the group has always been controlled by the Tatas, a Parsee family of the close-knit Zoroastriancommunity, and the Tata Trusts.6 Prior to independence, the Tata Group pioneered several “firsts” in India’s industry, including the first privatesector steel mill, the first private sector power utility, the first luxuryhotel chain, the first production of ammonium sulphate, and the first international airline. Table 1 describes the diversification pattern of thegroup. In 1938, the group had 14 companies (Piramal 1998, p. 432).After 1947, the Nehru government awarded several projects to J.R.D.Tata (who had been elevated to the top post in the Tata Group in 1938) aspart of the nation-building effort. For example, Telco collaborated withthe government and Hindalco to set up Hindustan Aeronautics.
Tata also helped revolutionize business practices in India.From instituting the eight-hour work day and paid leave to providinga retirement gratuity, it created a standard by which other companiesmeasured themselves. J.R.D. Tata blended humane business practiceswith political savvy and a pioneering spirit; he is remembered asIndia’s most important and influential business leader. Nonetheless, therelationship with the government soured, notwithstanding the financialsupport that Tata kept providing to the Congress government (Das, 2002).Other groups – most notably Birla and Reliance – rapidly built political,social, and reputational capital in the 1970s and began to challenge Tata’sprominence. Still, when the coal mines were nationalized in 1971, minesowned by Tata Iron and Steel Company were left untouched “on theground that [they] ‘would provide a model for the nationalized mines’”(Piramal, 1998, p. 557).
Strong connections with foreign groups and a well-built brand value enabled the Tatas to enter into new sectors in the 1980s, whena limited liberalization process started. Nonetheless, the conglomeratebecame unwieldy, as some of the operating companies independentlydiversified into new businesses, sometimes with little coordination. Asexplained in more deteail in the following section, the governance of the group traditionally left considerable leeway to individual operating
6 Despite the fact that “the Tatas are not a fecund family” (Piramal 1996, p. 367),the sole non-Tata chairman was Sir Nowroji Saklatvala in 1932–1938. Constructionmagnate Shapoorji Mistry and his son Pallonji S. have owned a 17.45% (later increased to 18.37%) stake since the late 1930s, making them the single largest shareholder of Tata Sons. The Mistrys bought out a 12.5% stake in Tata Sons from the estate of solicitor F.E. Dinshaw sometime in the 1930s. They increased their stake later in the decade from some members of the Tata family.
88 Transnational Corporations, Vol. 17, No. 3 (December 2008)
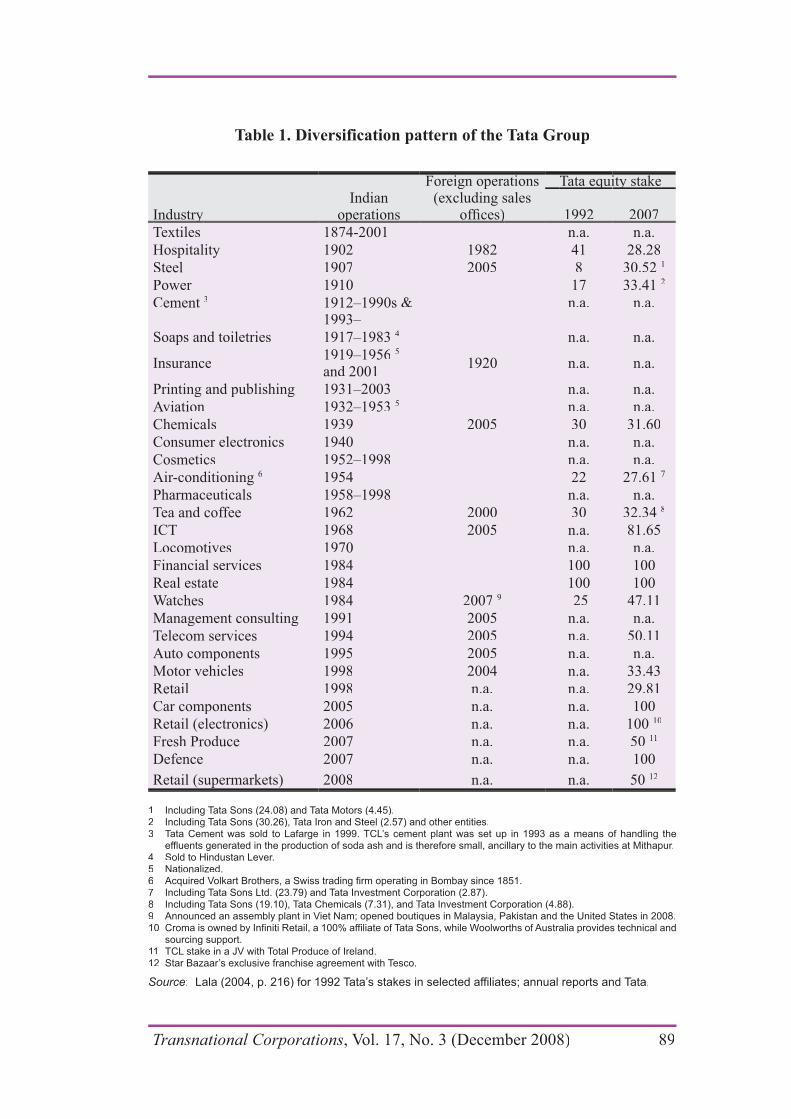
Table 1. Diversification pattern of the Tata Group
IndustryyyyyyIndian
operationsppppp
Foreign operations (excluding sales
Tata equity stakeq y
1992 2007TextilesTextiles 1874-20011874-2001 n.a. n.a.n.a. n.a.HospitalityHospitality 19021902 1982 41 28.281982 41 28.28SteelSteel 19071907 20052005 8 30.52 8 30.52 11
PowerPower 19101910 17 33.41 17 33.41 22
CementCement 33 1912–1990s &1912–1990s &1993–1993–
n.a. n.a.n.a. n.a.
Soaps and toiletries 1917–1983Soaps and toiletries 1917–1983 44 n.a. n.a.n.a. n.a.
InsuranceInsurance1919–19561919–1956 55
and 2001and 20011920 n.a. n.a.1920 n.a. n.a.
Printing and publishing 1931–2003Printing and publishing 1931–2003 n.a. n.a.n.a. n.a.AviationAviation 1932–19531932–1953 55 n.a. n.a.n.a. n.a.ChemicalsChemicals 19391939 2005 30 31.602005 30 31.60Consumer electronics 1940Consumer electronics 1940 n.a. n.a.n.a. n.a.CosmeticsCosmetics 1952–19981952–1998 n.a. n.a.n.a. n.a.Air-conditioningAir-conditioning 66 19541954 22 27.6122 27.61 77
Pharmaceuticals 1958–1998Pharmaceuticals 1958–1998 n.a. n.a.n.a. n.a.Tea and coffeeTea and coffee 19621962 2000 30 32.34 2000 30 32.34 88
ICT ICT 19681968 2005 n.a. 81.652005 n.a. 81.65LocomotivesLocomotives 19701970 n.a. n.a.n.a. n.a.Financial services 1984Financial services 1984 100 100100 100Real estateReal estate 19841984 100 100100 100WatchesWatches 19841984 20072007 99 25 47.11 25 47.11Management consulting 1991Management consulting 1991 2005 n.a. n.a.2005 n.a. n.a.Telecom services 1994Telecom services 1994 2005 n.a. 50.112005 n.a. 50.11Auto components 1995Auto components 1995 2005 n.a. n.a.2005 n.a. n.a.Motor vehiclesMotor vehicles 19981998 2004 n.a. 33.432004 n.a. 33.43RetailRetail 19981998 n.a. n.a. 29.81n.a. n.a. 29.81Car components 2005Car components 2005 n.a. n.a. 100n.a. n.a. 100Retail (electronics) 2006Retail (electronics) 2006 n.a. n.a. 100n.a. n.a. 100 1010
Fresh ProduceFresh Produce 20072007 n.a. n.a. 50 n.a. n.a. 50 1111
DefenceDefence 20072007 n.a. n.a. 100n.a. n.a. 100
Retail (supermarkets) 2008Retail (supermarkets) 2008 n.a. n.a. 50 n.a. n.a. 50 1212
1 Including Tata Sons (24.08) and Tata Motors (4.45).2 Including Tata Sons (30.26), Tata Iron and Steel (2.57) and other entities.3 Tata Cement was sold to Lafarge in 1999. TCL’s cement plant was set up in 1993 as a means of handling the
effluents generated in the production of soda ash and is therefore small, ancillary to the main activities at Mithapur.4 Sold to Hindustan Lever.5 Nationalized.6 Acquired Volkart Brothers, a Swiss trading firm operating in Bombay since 1851.7 Including Tata Sons Ltd. (23.79) and Tata Investment Corporation (2.87).8 Including Tata Sons (19.10), Tata Chemicals (7.31), and Tata Investment Corporation (4.88).9 Announced an assembly plant in Viet Nam; opened boutiques in Malaysia, Pakistan and the United States in 2008.10 Croma is owned by Infiniti Retail, a 100% affiliate of Tata Sons, while Woolworths of Australia provides technical and
sourcing support. 11 TCL stake in a JV with Total Produce of Ireland.12 Star Bazaar’s exclusive franchise agreement with Tesco.
Source: Lala (2004, p. 216) for 1992 Tata’s stakes in selected affiliates; annual reports and Tata.
Transnational Corporations, Vol. 17, No. 3 (December 2008) 89

affiliates.7 In 1996, Tata Sons held a minority stake in these companiesvarying from 3% to 13%; the Tata companies together owned almost 13% of Tata Sons. According to Jaipuria (2002), “the professionalmanagement of each of the Tata companies in operation had total controlon the companies and ran it as their fiefdom. However, they still fellback on the Tata name when it suited their purpose like raising fundsor asking the central Tata management for a bail-out” (p. 4). In fact, theparadox is that, despite being a confederation of loose entities, there wasa lot of activity among Tata companies in the form of intra-group loans,cross-shareholdings, and interlocking directorates.
This lack of central control was the fundamental problem facingRatan Tata in 1993, when he took the helm following the death of J.R.D.Tata.8 Tata had then sales of approximately $2 billion, although thisnumber is misleading when it comes to appreciating the complexity of the conglomerate. It comprised 84 companies of which 39 were listed.Trucks (i.e. Tata Motors, previously Tata Engineering and LocomotiveCompany, Telco) made up for 30% of sales, steel (i.e. Tata Iron and Steel Company, Tisco) 23%, and chemicals (i.e. Tata Chemicals) 16%(Piramal, 1996, p. 368). The number of employees were 242,000 in1993, comparable to General Electric, which had 222,000 employees inthe same year (Khanna and Palepu, 2000, p. 871). In 1998, Tata trimmed the lines of businesses from 25 to 12 and reduced the number of group-affiliated firms from 80 to 30 (Naik, 2001).
To tackle the problem of limited central control, Tata Sonsmade a rights issue, to which operating companies more or less had to subscribe. Even now, the group would like to increase the stakesin its major holdings to 51% over time to give it even firmer control.9
Ratan Tata created a corporate office of directors with enough clout toenforce discipline on the operating units.10 In addition, he gave up somecompanies in traditional industries, such as textiles, and focused on other areas, such as automobiles. Under Ratan Tata, the group has entered a
7 In fact, it is doubtful whether the practice of holding minority – often very
corporate control is gained with a 26% stake.8 Ratan had chaired Tata Industries since 1981. In 1982, he had drawn up a master
plan for restructuring the group that was largely ignored (“Transforming Tata”, BusinessWeek, 21 March 1994).
9 “Magna Tata”, CFO Asia, December 2005/January 2006.10 “Reinventing Tata”, The Economist, 17 February 2001.
90 Transnational Corporations, Vol. 17, No. 3 (December 2008)
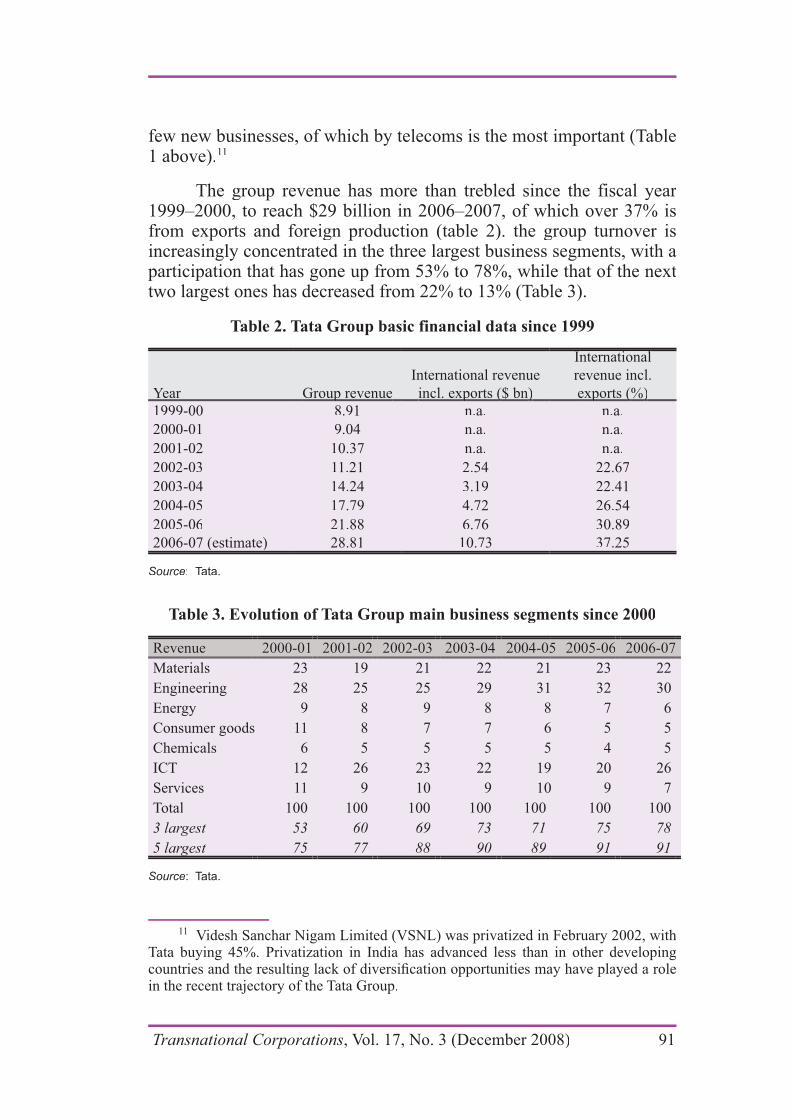
few new businesses, of which by telecoms is the most important (Table1 above).11
The group revenue has more than trebled since the fiscal year 1999–2000, to reach $29 billion in 2006–2007, of which over 37% isfrom exports and foreign production (table 2). the group turnover isincreasingly concentrated in the three largest business segments, with aparticipation that has gone up from 53% to 78%, while that of the next two largest ones has decreased from 22% to 13% (Table 3).
Table 2. Tata Group basic financial data since 1999
Year Group revenueppppp
International revenue
incl. exports ($ bn)p ( )p ( )p ( )p ( )p ( )
Internationali l
revenue incl.
exports (%)p ( )p ( )p ( )p ( )p ( )1999-001999-00 8.918.91 n.a.n.a. n.a.n.a.
2000-012000-01 9.049.04 n.a.n.a. n.a.n.a.
2001-022001-02 10.3710.37 n.a.n.a. n.a.n.a.
2002-032002-03 11.2111.21 2.542.54 22.6722.67
2003-042003-04 14.2414.24 3.193.19 22.4122.41
2004-052004-05 17.7917.79 4.724.72 26.5426.54
2005-062005-06 21.8821.88 6.766.76 30.8930.89
2006-07 (estimate) 28.812006-07 (estimate) 28.81 10.7310.73 37.2537.25
Source: Tata.
Table 3. Evolution of Tata Group main business segments since 2000
Revenue 2000-01 2001-02 2002-03 2003-04Revenue 2000-01 2001-02 2002-03 2003-04 2004-052004-05 2005-062005-06 2006-072006-07
Materials 23 19 21 22 21 23 22Materials 23 19 21 22 21 23 22
Engineering 28 25 25 29 31 32 30Engineering 28 25 25 29 31 32 30
Energy 9 8 9 8 8 7 6Energy 9 8 9 8 8 7 6
Consumer goods 11 8 7 7 6 5 5Consumer goods 11 8 7 7 6 5 5
Chemicals 6 5 5 5 5 4 5Chemicals 6 5 5 5 5 4 5
ICTICT 12 26 23 22 19 20 26 12 26 23 22 19 20 26
Services 11 9 10 9 10 9 7Services 11 9 10 9 10 9 7
TotalTotal 100 100 100 100 100 100 100 100 100 100 100 100 100 100
3 largest3 largest 53 60 69 73 71 75 7853 60 69 73 71 75 78
5 largest5 largestgg 75 77 88 90 89 91 9175 77 88 90 89 91 91
Source: Tata.
11 Videsh Sanchar Nigam Limited (VSNL) was privatized in February 2002, withTata buying 45%. Privatization in India has advanced less than in other developing
in the recent trajectory of the Tata Group.
Transnational Corporations, Vol. 17, No. 3 (December 2008) 91

Engineering is the principal area of operations. In the 1990s, Tata Motors was the first car maker in a developing country to engineer and produce cars from the ground up. The pioneering use of concurrent engineering initiatives helped Tata Motors to reduce the product development cycle time (Bowonder, 2004). The time needed to changea die on the passenger car assembly line went from two hours in 2000to between 12 and 15 minutes. Thanks in part to making dies for Jaguar,Ford, General Motors and Toyota and allowing Mercedes to run made-in-India vehicles through its paint shop, Tata Motors’s break-even point for capacity utilization is one of the best in the industry worldwide. TataMotors was listed on the New York Stock Exchange in 2004. It exports11% of output, mostly to South Africa.12
Materials, and steel in particular, is the second core area. In the early 2000s, Tata Steel improved management of raw materials and halved its workforce, from 75,000 to 40,000, to become one of theworld’s most efficient producers.13 In 2005, Moody’s assigned Tata Steel the Baa2 fundamental rating – one notch above the sovereign rating for India at the time – and World Steel Dynamics named it “the best steelcompany in the world”.
Finally, information and communication technology (ICT) serviceshave emerged over the past 15 years as the fastest-growing large-scalebusiness segment. Tata Consultancy Services (TCS), established in 1968,is the oldest and largest of India’s outsourcing specialists. TCS first championed the “global delivery model”, whereby cheap but highly-educated workers in the subcontinent are put to work writing softwareand managing computer systems and business processes for clientsin the West. Its ambition is to be among the top-ten biggest businessconsulting and ICT services groups in the world by 2010. In 2004, TataSons floated TCS, selling 19% of the company and raising $1.2bn inIndia’s biggest ever initial public offering.
3. Tata’s current structure
Tata is a conglomerate like many others in the developing world,although each of its two “financial heads” performs a different role.
12 Nonetheless, truck and bus sales plunged by 40% in 2000 and the company lost $110 million. Between 2000 and 2006, nearly 6,000 workers were made redundant withearly-retirement deals (“The Next People’s Car”, Forbes, 16 April 2007).
13 For details of relative cost for different categories, see “Tata Shows the Way”,Far Eastern Economic Review, 12 February 2004 and “Unusual steel link-up that could make sense”, Financial Times, 11 October 2006.
92 Transnational Corporations, Vol. 17, No. 3 (December 2008)

What makes the group peculiar, if not unique, is the fact that one of thesetwo heads is more than a simple financial holding, as it also centrallymanages the Tata brand and provides high-level training. Moreover, thevalue of the brand itself is associated with the philanthropy activitiesperformed by the trusts that control the two promoter companies.
3.1 Conglomerate
Tata Sons and Tata Industries (TIL) are the two promoter companies. Tata Sons was established as a trading enterprise in 1868and continued to promote and manage all major Tata companies until1970 when the managing agency system was abolished. Tata Sons is the owner of the Tata name and the Tata trademark, which are registered inIndia and several other countries. Although the group is no longer a legalconstruct, it still holds the bulk of shareholding in these companies. Thechairman of Tata Sons has traditionally been the chairman of the TataGroup. TIL was set up by Tata Sons in 1945 as a managing agency for businesses it promoted. TIL’s mandate was recast in the early 1980s topromote the entry into new and high-tech areas. These ventures are oftenpartly financed by Tata Sons and the main Tata Group companies, withTIL generally maintaining a 10–20% stake.
The Tata Group is currently headed by Ratan Tata. The GroupExecutive Office (GEO) and the Group Corporate Centre (GCC) are thetwo decision-making bodies that define and direct the business operationsof the Tata Group. Created in 1998, the GEO defines and reviews thebusiness activities of the Tata Group, to make it more synergistic and create a shared understanding of a Tata company’s current activities,its strengths and its weaknesses. The mandate of the GCC is to guidethe future strategy and direction of the Tata Group and to work in closecoordination with the GEO.
3.2 Coordination mechanisms
Tata Group companies have various mechanisms of coordination.Tata Administrative Services, now known as TAS, ensures the recruitment of talented managers. In the 1950s, J.R.D. Tata conceived TAS to select and groom some of the best young Indians, provide themopportunities for professional growth, and use that pool of talent as agroup resource. The importance of TAS as a form to mould and socializeTata managers, however, has declined over the years – nowadays onlyone of the 14 (all male) CEOs is a TAS graduate, although two CEOsalso joined the group as trainees and one is a family member (Goldstein 2008, Table D).
Transnational Corporations, Vol. 17, No. 3 (December 2008) 93

In 1996, Tata Sons introduced a “Brand Equity and BusinessPromotion Agreement”. All companies wishing to use the Tata nameand brand must sign the agreement, pledging to pay an annual royaltyto Tata Sons equal to between 0.1% and 0.2% of their revenues. Theagreement also forces companies to adhere to the Tata Code of Conduct and to adopt the Tata Business Excellence Model (TBEM), a qualitymanagement system based on the Malcolm Baldridge Model.
From a strictly legal point of view, in terms of governance theTata companies does not outshine the rest of corporate India. The fact of being “associated with a large family business group […] compensated for this institutional void, particularly through the availability of an internal market for capital and labour” (Udayasankar and Das 2007, p.265). The situation has changed rather rapidly in recent years – TCSnow boasts six independent directors out of eight on the company’sboard, while at Tata Motors, the four independent directors comprise more than one third of the total on the board.14
3.3 Philanthropy and social engagement
Another special aspect of Tata is the fact that nearly two-thirdsof the equity of Tata Sons is held by philanthropic trusts. In a short note on Jamsetji Tata, N.S.B. Gras (who held the first chair in businesshistory at Harvard’s Graduate School of Business) wrote that “he sawclearly that the business man was in effect but a trustee of wealth; that,since he could not take all his wealth with him, he should during his lifeprovide for its use on behalf of the Indian people” (Gras, 1949, p. 150).The Sir Ratan Tata Trust was established in 1918 following the death of Sir Ratan Tata, Jamsetji’s younger son, and it operates to further “the advancement of education, learning and industry in all its branches”.The Sir Dorabji Tata Trust was established in 1932 by Sir Dorab Tata,Jamsetji’s elder son, who bequeathed all his wealth, including the famed 245-carat Jubilee diamond, just before his death. The Trust is known for promoting pioneering institutions of national importance. The “allied trusts” component of the Sir Dorabji Tata Trust comprises the TataSocial Welfare, RD Tata, Tata Education, JRD Tata, JRD and Thelma
14 In family-controlled groups, intergenerational transfer is an additional issue. TataSons averted a succession crisis in July 2005 by temporarily extending the retirement age of non-executive directors from 70 to 75, allowing Ratan to stay on until 2012.Pallonji Mistry’s son-in-law Noel Tata is Ratan’s half-brother and Managing Director
he may become Tata Sons’ chairman (“Missing the action”, Businessworld, 16 October dd2006).
94 Transnational Corporations, Vol. 17, No. 3 (December 2008)
Tata, Jamsetji Tata, JN Tata Endowment, Lady Meherbai Tata Memorial,and Lady Meherbai Tata Education Trust. The Tata Social Welfare Trust and the Tata Education Trust were founded in 1990. The Trusts’ trusteesmostly belong to the family, although selected executives from outsidethe family are also appointed.
In 2007, Tata Trusts’ total grants amounted to $58 million and the Tata companies’ “contribution to social welfare” was $61 million.Individual companies’ examples are illustrative of the scale and scope of this engagement. In 2001, Jamshedpur Utilities and Services CompanyLimited (JUSCO), a wholly owned affiliate of Tata Steel, was running 23schools with 22,474 pupils and a hospital with a capacity of 1,200 beds.15
Tata Motors’ code of conduct is formulated around the ILO Declarationon Fundamental Principles and Rights at Work. The company requiresits SME vendor companies to guarantee freedom of association and compliance with national labour legislation, including the minimum wage. Dagaur (1997) found that Telco provided apprenticeship trainingto more than the prescribed number of apprentices. Tata-AIG hasdeveloped an innovative micro-insurance delivery model. Building around TBEM, the Tata Council for Community Initiatives (TCCI) helpsTata companies in streamlining social development, environmentalmanagement, biodiversity restoration and employee volunteeringobjectives into corporate processes. TCCI is headed by Kishor Chaukar,a member of the Tata GCC, and counts 43 chief executive officers of Tata companies among its members. TCCI is also involved in assisting Tata companies address the sustainability subject through the United Nations’ Global Reporting Initiative.
4. Internationalization by the Tata group
4.1 Main trends
The Tatas’ outlook has been outward-oriented from the verybeginning. Tata Limited was established in London in 1907 as the TataGroup’s representative in Europe. During the Second World War, theTatanagar, a light armoured car, “was used extensively by the BritishArmy engaged on the North African front” (Tripathi and Jumani 2007,p. 129). Immediately after the Second World War, Tata Incorporated wasestablished in New York as the representative office of the Tata Groupin the Americas.
15 “Galvanised by freedom from social duty”, Financial Times, 10 July 2001.
Transnational Corporations, Vol. 17, No. 3 (December 2008) 95
The Tatas’ personal backgrounds have also been very international. Sir Ratan owned York House in Twickenham, London, and many Tatas are buried overseas. J.R.D. Tata was educated in France, Japan and England before being drafted into the French army for a mandatoryperiod of one year. A fascination with planes led J.R.D. Tata to createAir-India through befriending the son of Louis Bleriot, the Frenchflying pioneer. Finally, social engagement has also transcended nationalborders. Between November 1909 and August 1912, Sir Ratan donated £5,000 to assist Mahatma Gandhi’s fight for the rights of the Indians inSouth Africa. In 1912, the Sir Ratan Tata Foundation gave seed researchfunds to Sidney and Beatrice Webb, the founders of the London Schoolof Economics.
In the 1950s, various Tata companies cooperated with foreign partners, such as Daimler Benz and the World Bank. As developing countries gained independence, the group implemented many donor-funded turnkey projects in Africa and West Asia. Tata Internationalwas established in 1962 to offer value-added services in internationaltrading focused on leather and engineering. It also managed customer support facilities for Tata vehicles and design studios for leather products. Established in 1972, Singapore-based Tata Precision Industriesspecializes in high-precision machining, precision fine blanking,engineering plastic moulded parts and tool design.16 Nonetheless, the Tatas’ international reach at the time was much smaller than other largeIndian conglomerates such as the Birlas, the Thapars or the Kirloskars(Tripathi and Jumani 2007).
In the 1990s, globalization led to new institutional innovations.A wholly-owned affiliate of Tata International, Tata Africa Holdings,was established in Johannesburg in 1994. Tata Limited in London became an agent for the global procurement of goods and services for the entire Tata Group. Switzerland-incorporated Tata International AGand its trading affiliates promote and invest in various enterprises and projects overseas. All these milestone notwithstanding, the Tata Group’soperations were mostly India-focused until recently. Even in the caseof tea, possibly the most outward-looking business, international salesaccounted for only 12% of total sales (Chattopadhyay and Lege, 2005).Similarly, while Titan is one of the world’s top six watch manufacturers,its overseas operations are limited to a commercial presence.
16 The Tata Government Training Centre (TGTC), supported by the Government of
96 Transnational Corporations, Vol. 17, No. 3 (December 2008)

In a 2004 interview, Ratan Tata “visualize[d] in the next few yearsthe following companies to be the international face of the group: TCS,Tata Motors, Indian Hotels Co., and to some extent, one which won’t be that visible, is Tata Power”.17 He has been preaching the need to internationalize in giants strides, not in token, incremental steps.18 Asit turned out, two other companies in the stable have made the largest acquisitions. In 2000, Tata Tea acquired Tetley in a £271 million ($432million) leveraged buyout that was the largest takeover of a foreigncompany by an Indian one to that date. (A short analysis of the post-merger trajectory is presented in the following section.) In early 2007,Tata Steel acquired Anglo-Dutch firm Corus for $11 billion – the largest acquisition by an Indian firm and the fourth-largest ever in the steelindustry – and secured the largest loan ever for an Indian company.Then in June 2008, Tata Motors completed the acquisition of the Jaguar and Land Rover (JLR) businesses from Ford, in an all-cash $2.3 billiontransaction.
Notwithstanding these notable exceptions, most other acquisitionshave been relatively small – in the sense that the target company is muchsmaller in size than the Tata company making the bid.19 The total sum of the acquisitions for which the value of transation is available is just over $18 billion, of which 65% corresponds to the Corus takeover and 68% toTata Steel in general. In terms of the host country, the United Kingdomaccounts for 82% – largely due to the Corus deal. Finally, operationsconcluded in 2007 alone account for 67% of the post-2000 total.
The extent of corporate internationalization can be gauged through different indicators, including the proportion of assets, sales and employment outside one company’s home country. Unfortunately, suchdata are not available for Tata companies in a way that would be consistent with the UNCTAD methodology for computing a transnationality index.Table 4 provides (incomplete) information on the importance of foreignoperations for Tata affiliates. It shows that sales (by location of customer)are very internationalized for TCS and Tata Tea, but also for pre-CorusTata Steel (by location of affiliate). While the very high figure for TCSclearly reflects the fact that the majority of the business is export of services performed in India, the share of non-Indian employees is also
17 “Ratan Tata’s trials and triumphs”, Business Week, 26 July 2004.18 “Ratan Tata’s Global Quest”, Businessworld, 9 October 2006.dd19 This is different from the pharmaceutical industry, where Indian companies have
grown by large acquisitions in OECD markets.
Transnational Corporations, Vol. 17, No. 3 (December 2008) 97

very substantial (with no fewer than 67 nationalities represented in thepayroll).20
Table 4. Tata companies’ internationalization profile
Company Motivation
Main mode of
outward investment
Regions of outward
investmentForeign
assets (% of
total assets)
Foreign
sales (% of
total sales)
Foreign
employment
(% of total) DirectorsA1 EMs2 ICs3
Indian Hotels Indian Hotels
CompanyCompany
Market-seekingMarket-seeking
(serve Indian (serve Indian
travellers)travellers)
managementmanagement
contracts (failed contracts (failed
attempt to acquireattempt to acquire
Orient Express)Orient Express)
22.8522.8544 n.a. n.a. 1/9n.a. n.a. 1/9
Tata Chemicals Resource-seeking Tata Chemicals Resource-seeking
(source natural(source natural
soda ash) soda ash)
AcquisitionsAcquisitions n.a. n.a. n.a. 0/10n.a. n.a. n.a. 0/10
Tata MotorsTata Motors AcquisitionsAcquisitions n.a. 9.54 n.a. 0/11n.a. 9.54 n.a. 0/11
Tata Steel Market-seeking AcquisitionsTata Steel Market-seeking Acquisitions n.a. 41.01 n.a. 4/14n.a. 41.01 n.a. 4/14
Tata Tea Market- and Tata Tea Market- and
(brands)(brands)
AcquisitionsAcquisitions n.a. 74.95 n.a. 2/10n.a. 74.95 n.a. 2/10
TCS Market-seekingTCS Market-seeking n.a. 91.00 9.6n.a. 91.00 9.655 5/85/866
Titan Industries n.a.Titan Industries n.a. n.a.n.a. n.a. 5.54 n.a. 0/10n.a. 5.54 n.a. 0/10
Voltas n.a.Voltas n.a. n.a.n.a. n.a. n.a. n.a. 0/8n.a. n.a. n.a. 0/8
VSNL Market-seekingVSNL Market-seeking n.a. n.a. n.a. 0/11n.a. n.a. n.a. 0/11
Notes: (1) Asian emerging markets, excluding Korea; (2) non-Asian emerging markets, includingCentral and Eastern Europe; (3), industrial countries, including Korea; (4) number of properties weighted per stars (Luxury Hotel = 5, Business Hotel = 4, Leisure Hotel = 3, andGinger Hotel = 2); (5) refers to non-Indian employees, regardless of location; (6) includingnon-resident Indians Aman Mehta and Venkatraman Thyagarajan.
Sources: companies’ annual reports, 2007.
Directorship and management composition constitute another dimension of internationalization. At Tata Sons, besides Group chairmanRatan Tata, the GEO comprises five Indian nationals and one foreigner.The same six individuals sit on the GCC, which also comprises threeadditional Indian nationals. Out of the 11 Tata Sons directors – all of them male – five have received foreign degrees, although only four seem to have worked abroad prior to joining the Tata Group (Goldstein2008, Table F).21
Each company has its own management, which is moreinternational, with two Americans among the Group’s top 13 executives.22
20 An interesting anecdote is that TCS has more than 600 Uruguayan employeeseven though India has no embassy in Montevideo!
21 Alan Rosling worked with Jardine Matheson Group in Hong Kong. In 1996Jardine Matheson bought 20% of TIL and Rosling represented the Hong Kong hong on gthe boards of TIL and Tata Automotive Components. He was also managing director of Concorde Motors, a Jardine-Tata joint venture.
22 At this level there is one interlocking directorate (Tata Motor managing director Ravi Kant is also on the Voltas board) and only one top executive has worked for
98 Transnational Corporations, Vol. 17, No. 3 (December 2008)
Among the operating affiliates, non-Indian residents account for a largepercentage of directors for TCS and post-Corus Tata Steel only (Table4). With the appointment of Andrew Robb as non-executive independent director and Deputy Managing Director in November 2007, there arenow five Corus directors in the 14-member board of Tata Steel. TCS isthe only Tata company with multiple Indian directors based overseas – apractice that other Indian corporates such as Infosys have also adopted to raise their global profile (Khanna and Palepu, 2004).
4.2 Drivers and determinants
With so many large companies and so many M&A deals, it isfair to say that Tata’s overseas expansion fits into all of Dunning’sstandard categories for explaining internationalization. A textbook caseof resource-seeking internationalization is Tata Chemicals, the world’sthird-largest manufacturer of soda ash after the acquisition of Brunner Mond’s three plants, the second-largest producer in Europe, in December 2005. Strategically, Tata Chemicals can complement its stake in IndoMaroc Phosphore (IMACID) with a cheaper source of natural soda ashfrom Magadi, Kenya. The operation is unique in that the soda ash at that site is naturally produced and replenished, making it one of the lowest cost producers in the world.23 Similarly, Tata Power has purchased a30% equity stake each in two major Indonesian thermal coal producersand a related trading company. The companies are together among thetop three largest exporting thermal coal mines in the world.
In the case of acquisitions in more developed markets, a combination of efficiency-, market-, and asset-augmenting motivescan be detected. TCS acquired Switzerland-based TKS-Teknosoft topossess marketing and distribution rights to the QUARTZ® platform for wholesale banks, to add new products in the private banking and wealthmanagement space, and for its track record of successful implementationof large and complex key technology projects in Europe. In the caseof Tata Steel, the acquisitions of Singapore’s NatSteel and Thailand’s Millennium Steel in 2005 strengthened its position in higher valuefinished products in growing Asian markets. The acquisition of Corusbrought access to the markets in the EU, especially in higher-valuequality steel products. More generally, the aim of Tata Steel is to avoid the tariffs on imported finished steel products by producing in major steel consumer economies. In the case of Tata Motors, the purchaseof Daewoo’s commercial truck operation in 2004 served to combine
23 The cost of producing natural soda ash is roughly 50% of synthetic soda ash.
Transnational Corporations, Vol. 17, No. 3 (December 2008) 99

Korean skills in end-uses for trucks, such as cement mixers and tippers,with the Indians’ expertise for manufacturing chassis.24 The acquisitionof Incat, also by Tata Motors, in 2005 aimed at integrating engineeringand design services skills into the auto business.
For Videsh Sanchar Nigam Limited (VSNL), competition at home has been the main driver.25 VSNL’s monopoly on international longdistance voice – which accounted for nearly 90% of its revenue – cameto an end two months after Tata took it over. In the period 2003–2005,three overseas acquisitions enabled VSNL to access advanced voice,data and signalling capabilities and more than 200 direct and bilateralagreements with leading voice carriers. VSNL has recently purchased a small French virtual network operator to target the European SMEmarket and learn lessons applicable to India.26
While most Tata companies are growing by acquisition, TCShas invested more in greenfield projects. It opened a software centre inHungary in 2001, reckoning that while outsourcing business processesto India may not be difficult for American and British companies, in non-English speaking countries India seemed remote. In China, operationsstarted off as a back-up site staffed by Indians serving United Statesclients worried about what might happen in the event of an Indo-Pakistanwar. Now TCS operation in the country is focused on the domestic market and employs 1,200 Chinese staff. TCS was the first Indian BPOcompany to invest across Latin America to provide near-shore servicesfor United States clients and plans to open a facility in Cincinnati toqualify for IT outsourcing work that can only be done onshore, such asgovernment contracts.
Finally, Indian Hotels, best known for its Taj luxury hotel chain,provides an interesting model of aggressive growth in different businessand regional segments. The hotelier has earmarked $1.5 billion for international expansion to open new luxury properties in countrieswhere it expects most of the customers to be Indian. In other venues, Tajhas bought existing properties. In September 2007, it paid $211 millionfor a 10% stake in Orient-Express Hotels, the owner of iconic brandssuch as the Hotel Cipriani in Venice, and hinted at a deeper “possible
24 “Giant stung into singing its praises”, Financial Times, 22 March 2005. Tata Motors has also become the second-largest shareholder of Hispano Carrocera after theMúgica brothers.
25 VSNL was renamed as Tata Communications on 31 October 2007.26 “L’indien Tata se lance à l’assaut des télécommunications européennes”, Le
Monde, 18 January 2007.
100 Transnational Corporations, Vol. 17, No. 3 (December 2008)
association”, though the United States-based chain turned down theoffer.
4.3 Challenges
Possibly the biggest challenge may be that the accumulation of acquisitions has undermined the focus on the core business. The case of Tata Motors is telling. Five years after Ratan first mentioned his dreamof building a one-lakh (about $2,500) car, the Nano went on sale in2008. In emerging markets, making cheap goods for customers at the“bottom of the pyramid” makes business sense. At the same time, insummer 2007, Tata Motors joined in the bidding for two of the world’smost luxurious brands, Jaguar and Land Rover. The question has beenraised as to whether winning trophy brands is a correct strategy whenthe ultimate objective is to gain the appropriate production scale and technology to be the world’s lowest-cost car producer. More broadly,Tata as a group remains interested in promoting new businesses (Table1), with some accompanying risks, e.g. launching a full-service bank may bring expose Tata to the complexity and pitfalls of intra-grouplending.27
Second, integration issues are responsible for the relatively highfailure rate of international M&As (Søderberg and Eero, 2003).28 Tata companies have tried to develop an ability to understand the cultureand business environment of the host country as a strategic tool for handling post-merger issues. In the Tata-Corus combine, a Strategicand Integration Committee chaired by Ratan Tata has been formed to facilitate integration and create a virtual organization across thecombined businesses.
Although it is impossible to generalize on the basis of only onecase, a study of Tetley suggests that Tata Tea has overcome some of the problems in post-merger integration.29 As the acquisition was agreed by the Tetley’s Board, employee resistance was reduced. The TetleyGroup CEO became a Non-Executive Director of Tata Tea Limited inJune 2000. In January 2002, Boston Consulting Group was appointed
27
extent to which Tata group behaves like a proxy capital market (as per Khanna and Kalepu, 2005) is not available. At any rate, so far it is unlikely that this has happened ina scale comparable to South Korea, for instance (Sarkar, forthcoming).
28 While not an acquisition, Tata Motors’ partnership with MG Rover of the United Kingdom, signed in 2003, soon proved problematic and was terminated in 2004.
29 Goldstein (2008) for more details.
Transnational Corporations, Vol. 17, No. 3 (December 2008) 101

to work out an integration agenda.30 Two taskforces were created toidentify specific areas where integration could be beneficial.31 Tata Tetley became an affiliate of Tata Tea in December 2005. The Tata Teaand Tetley R&D teams have been integrated, as has been the IT, financeand communication infrastructure in order to fulfil stringent reportingand governance requirements.
The paradox is that the emphasis on collaboration rather thancontrolling as the adaptive model may make it more difficult to keep the distinctiveness of the Tata Equity Brand. In fact a crucial issue being debated within Tata is to what extent a group strategy, including a country-specific one, is needed to maintain coherence. In South Africa and, toa lesser extent, Bangladesh, Tata seems to be looking at opportunitiesfor diversification into seemingly unrelated businesses along the linesof the home country trajectory (Goldstein, 2008, Table G). In contrast,no such strategy has been followed in the United Kingdom, although nofewer than 18 Tata companies operate there and generate $1.6 billion insales in 2006–2007.32 Although not explicitly stated as such, the reason may in fact be that operating as a conglomerate has advantages in adeveloping country context and not in an industrial one – despite thedifficulties that Tata faces in Bangladesh for political reasons.
In keeping with the commitment to societal responsibilities, TataGroup has been actively involved in initiatives that promote the socialand economic development of host countries. All the ten principles of the United Nations’ Global Compact are incorporated in the Tata Code of Conduct.33 Tata Steel is a founder member of the Global Compact and itsManaging Director sits on the 20-member board of the Global Compact.The city of Jamshedpur is one among six in the world to be chosen toparticipate in the UN Global Compact Cities Pilot Programme.
The Adult Literacy Project in South Africa is of particular interest as the community development programme is adapted from TCS’scomputer-based functional literacy initiative that was implemented in India. The project was replicated in the North Sortho (Sepedi)
30 Arun Maira, chairman of The Boston Consulting Group in India since 2000,held senior positions at Tata Administrative Services between 1964 and 1989.
31 “Tata Tea, Tetley integration process to start next month”, Business Line, 11 January 2002.
32 “Ratan Tata’s Global Quest”, cit. In June 2007, the Jamsetji Tata Trust haspledged £1.8 million to the London School of Economics and Political Science tosupport research collaboration with the Tata Institute of Social Sciences.
33 Tata Metaliks and Tata Tea were suspended from the Global Compact in 2005.
102 Transnational Corporations, Vol. 17, No. 3 (December 2008)
language in partnership with the WDB Trust, an organization that worksin the areas of micro finance, entrepreneur training and education of impoverished rural women. Other synergies have been created in askills-development program in rural South Africa that allowed traineesto be trained in jewellery making at the Titan plant in Bangalore and indecorating ceramic ware at Tata Ceramics in Kochi.
An additional issue is lack of recognition and the ever-lingering risk that an Indian company is treated as a sub-standard entity.34 Again various Tata companies have started post-merger integration by bringing the board of the acquired foreign companies to India to show them the new owners’ facilities.35 As part of the drive to get the group’s message across, the group is also opening offices in key countries.36
5. Conclusion
This paper has offered a first modest contribution in analyzingthe time and geographic dimensions of Tata’s internationalization. Sincethe opening-up of the Indian economy in 1991, Tata has been subjected to global competition, making it imperative for the group to becomecompetitive in India against the new entrants. To gain scale, to reducetheir exposure to the cyclicality of India’s economy and to achieve asustainable competitive position in industries that are globalizing, most Tata companies then looked overseas, primarily through acquisitions. Three companies have been at the forefront of this process – Tata Steel,Tata Motors, and TCS. As it pertains to challengers from formerlyperipheral areas that internationalize in order to access resources(Mathews 2002), multiple factors have been at play, including theneed to access new markets (i.e., in BPO services), the opportunity to integrate the value chain and increase vertical integration (i.e., in steel),and the quest for brand control and resource leverage strategies (i.e., intea and cars).
34 “Corus workers are nervous. The boys were asking if we would have to wear safety turbans now” (“A passage to India for Corus”, The Sunday Times, 22 October 2006). The general secretary of the steel industry trade unions, Community, later praised
“modern, clean and extremely well-maintained” mills (Leahy, 2007). 35 “Making It Work”, Businessworld, 9 October 2006.dd36 “Tata parent seeks to head off barriers to bid for Corus”, Financial Times, 7
October 2006. In the run-off to the 2008 Presidential campaign, TCS and other Indian
to their country destroys jobs in the United States. “Lobbying in U.S., Indian FirmsPresent an American Face”, The New York Times, 4 September 2007.
Transnational Corporations, Vol. 17, No. 3 (December 2008) 103
The process of growth has consequences for the nature of corporations, their internal characteristics, and their relationship withstakeholders. Such dynamics is likely to be more complex in the case of a business group that is undergoing a rapid transformation. This strategyhas proved feasible because Tata as a group possesses strong leadership.It successfully exploited the increasingly developed financial markets inIndia, a large domestic market and the surplus of global liquidity. Tatahas not blindly embraced ready-made recipes to face the challenges of multinational management, preferring instead organizational solutionsaimed at fostering mutual recognition and knowledge exchange withinthe multinational conglomerate. Standard & Poor’s praised this way of managing the group in December 2006, writing that the “policy [of Tata]to support its companies and the improved financial profile of its entitiesalso enhances the overall financial flexibility of Tata Motors.” In the case of VSNL, a strategic link with TCS has given the advantage of offering customers a single partner option that can deliver a combined IT and telecom solution. Jaguar and Land Rover envisage to make use of Tata’s extensive IT resources, including TCS.
Operating across borders and time zones and integrating diverse management teams and corporate governance practices do not seem tohave modified the Tata imprinting. Tata, with its strong corporate culture(as defined in Hirota et al. 2007) and unique business model, is a good example of a company that has turned good corporate citizenship intogood business. Ratan Tata has also said that the Tata group is not infavour of any hostile takeovers. This gentle approach and the credibilitythat Tata has managed to build and maintain may distinguish Tata fromcompetitors. For instance, in 2007, the auto workers’ union in the United Kingdom, Unite, said that Tata would be its preferred buyer for Jaguar and Land Rover.37 In this context, another Tata advantage is the fact of being run by a very successful minority, the Parsees, without stirringanger amid the majority of the population (as is tragically common inother countries, see Chua 2002).
The questions addressed in this paper are of more than just academic interest. In today’s world, employers have responsibilitiesnot just to their own shareholders and employees, but also to thecitizens in the communities in which they are located, wherever in theworld that might be (e.g., Locke, 2003). Corporations eager to pursue
37 Jaguar and Land Rover’s new permanent chief executive considers Tata “a veryprincipled organisation” and expects integration to be faster than with Ford, “where
freedom to cruise”, Financial Times, 4 August 2008).
104 Transnational Corporations, Vol. 17, No. 3 (December 2008)
international opportunities have to take a hard look at the short- and long-term impact of their presence in a wider world where stakeholdersare diverse, globally distributed, and no agreed-upon rules exist. Futureresearch needs to analyze a broad variety of issues, from management practices and industrial relations, to the organization of R&D functionand innovation.
References
Amsden, Alice (2001). The Rise of “The Rest”: Challenges to the West From Late-Industrializing Economies. Oxford: Oxford University Press.
experience of Tata Motors”, International Journal of Manufacturing Technologyand Management, 6(3-4), pp. 291–314.
Chattopadhyay, Amitava and Ulrike Lege (2005). “Tata Tea Limited: How to GoGlobal?”, International Journal of Marketing Education, 1(1), pp. 3–6.
Chua, Amy (2002). World on Fire: How Exporting Free Market Democracy BreedsEthnic Hatred and Global Instability. New York, NY: Doubleday.
Dagaur, ER D.S. (1997). “India: Enterprise participation in training”, ILO, Training Partnership Papers.
Das, Gurcharan (2002). India Unbound: From Independence to the Global InformationAge, Delhi: Penguin.
Economic Advisory Council to the Prime Minister (2008). Economic Outlook for 2008/09, New Delhi.
Elango, B and Chinmay Pattnaik (2007). “Building capabilities for internationalJournal of International
Business Studies, 38(4), pp. 541–555.
Goldstein, Andrea (2007). Multinational Companies from Emerging Economies:Composition, Conceptualization and Direction in the Global Economy. Basingstoke:Palgrave.
Goldstein, Andrea (2008). “The Internationalization of Indian Companies: The Caseof Tata”, Center for the Advanced Study of India, Working Paper Series, Number 08-02.
Grant Thornton (2006). Corporate India’s voice on the M&A and Private EquityScenario 2006, Mumbai.
Gras, N.S.B. (1949). “A Great Indian Industrialist: Jamsetji Nusserwanji Tata, 1839-1904”, Bulletin of the Business Historical Society, 23(3), pp. 149–151.
Hirota, Shinichi, Katsuyuki Kubo, and Hideaki Miyajima (2007). “Does CorporateCulture Matter? An Empirical Study on Japanese Firms”, RIETI, Discussion Paper Series, No. 07-E -030.
Transnational Corporations, Vol. 17, No. 3 (December 2008) 105

Jaipuria, Jyotivardhan (2002). “Restructuring in India – The Tata Group”, Merrill Lynch,In-depth Report, 17 April.
Jones, Geoff and Peter Miskell (2007). “Acquisitions and Firm Growth: CreatingUnilever’s Ice Cream and Tea Business”, Business History, 49(1), pp. 8–28.
Khanna, Tarun (2007). “Tata-Corus: India’s New Steel Giant”, The Economic Times, 14February.
Khanna, Tarun and Krishna Palepu (2005). “The Evolution of Concentrated Ownershipin India: Broad Patterns and a History of the Indian Software Industry”, in RandallMorck (ed.), The History of Corporate Governance around the World: FamilyBusiness Groups to Professional Managers, Chicago: University of Chicago Press.
Khanna, Tarun and Yishay Yafeh (2007). “Business Groups in Emerging Markets:Paragons or Parasites?” Journal of Economic Literature, 45(2), pp. 331–372.
Kumar, Nagesh (2007). “Emerging TNCs: trends, patterns and determinants of outward FDI by Indian enterprises”, Transnational Corporations, 16(1), pp. 1–26.
Lala, R M (2004). The Creation of Wealth: The Tatas from the 19th to the 21st Century.Delhi: Penguin India.
Leahy, Michael J. (2007). “The Role of Manufacturing in the Modern UK and WelshEconomy”, presented at the Institute of Welsh Affairs, Cardiff, 15 June.
Locke, Richard (2003). “The Promise and Perils of Globalization: The Case of Nike”, inThomas A. Kochan and Richard Schmalensee (eds.), Management: Inventing and Delivering Its Future. Cambridge, MA: MIT Press.
Piramal, Gita (1996). Business Maharajas. Delhi: Penguin India.
Piramal, Gita (1998). Business Legends. Delhi: Penguin India.
Ramamurti, Ravi and Jitendra V. Singh (2009). “Indian multinationals: genericinternationalization strategies”, in Ramamurti and Singh (eds.), Emerging Multinationals in Emerging Markets. Cambridge: Cambridge University Press.
Sarkar, Jayati (forthcoming). “Business Groups in India”, in Asli M. Colpan, TakashiHikino, and James R. Lincoln (eds.), Oxford Handbook of Business Groups, Oxford:Oxford University Press.
Søderberg, Anne-Marie and Vaara Eero (eds.) (2003). Merging Across Borders. People,Cultures and Politics, Copenhagen: CBS Press.
Tripathi, Dwijendra and Jyoti Jumani (2007). The Concise Oxford History of IndianBusiness, Oxford UP.
Udayasankar, Krishna and Shobha S. Das (2007). “Corporate Governance and FirmPerformance: the effects of regulation and competitiveness”, Corporate Governance,Vol. 15, No. 2: 262-271.
UNCTAD (2006). World Investment Report. FDI from Developing and TransitionEconomies: Implications for Development.
106 Transnational Corporations, Vol. 17, No. 3 (December 2008)
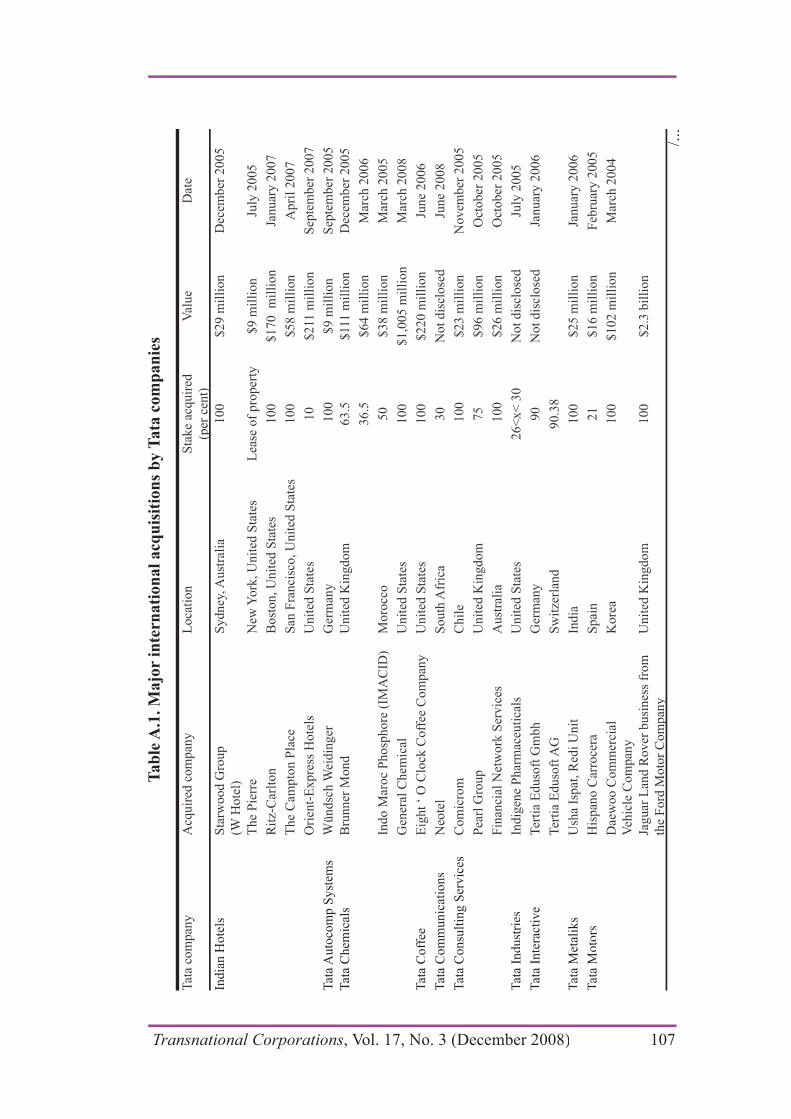
Ta
ble
A.1
. M
ajo
r in
tern
ati
on
al
acq
uis
itio
ns
by
Ta
ta c
om
pa
nie
s
Tat
a co
mpan
yA
cquir
ed c
om
pan
yL
oca
tion
Sta
ke
acquir
ed
(per
cen
t)
Val
ue
Dat
e
India
n H
ote
lsS
tarw
ood G
roup
(W H
ote
l)
Sydney
, Aust
rali
a100
$29 m
illi
on
Dec
ember
2005
The
Pie
rre
New
York
, U
nit
ed S
tate
sL
ease
of
pro
per
ty
$9 m
illi
on
July
2005
Rit
z-C
arlt
on
Bost
on, U
nit
ed S
tate
s100
$170 m
illi
on
Januar
y 2
007
The
Cam
pto
n P
lace
San
Fra
nci
sco, U
nit
ed S
tate
s100
$58 m
illi
on
Apri
l 2007
Ori
ent-
Expre
ss H
ote
lsU
nit
ed S
tate
s10
$211
mil
lion
Sep
tem
ber
2007
Tat
a A
uto
com
p S
yst
ems
Wündsc
h W
eidin
ger
Ger
man
y100
$9 m
illi
on
Sep
tem
ber
2005
Tat
a C
hem
ical
sB
runner
Mond
Unit
ed K
ingdom
63.5
$11
1 m
illi
on
Dec
ember
2005
36.5
$64 m
illi
on
Mar
ch 2
006
Indo M
aroc
Phosp
hore
(IM
AC
ID)
Moro
cco
50
$38 m
illi
on
Mar
ch 2
005
Gen
eral
Chem
ical
U
nit
ed S
tate
s100
$1,0
05 m
illi
on
Mar
ch 2
008
Tat
a C
off
eeE
ight
‘ O
Clo
ck C
off
ee C
om
pan
yU
nit
ed S
tate
s100
$220 m
illi
on
June
2006
Tat
a C
om
mun
icat
ion
sN
eote
lS
outh
Afr
ica
30
Not
dis
close
dJu
ne
2008
Tat
a C
onsu
ltin
g S
ervic
esC
om
icro
mC
hil
e100
$23 m
illi
on
Novem
ber
2005
Pea
rl G
roup
Unit
ed K
ingdom
75
$96 m
illi
on
Oct
ober
2005
Fin
anci
al N
etw
ork
Ser
vic
esA
ust
rali
a100
$26 m
illi
on
Oct
ober
2005
Tat
a In
dust
ries
Indig
ene
Phar
mac
euti
cals
U
nit
ed S
tate
s26<
x<
30
Not
dis
close
dJu
ly 2
005
Tat
a In
tera
ctiv
eT
erti
a E
duso
ft G
mbh
Ger
man
y90
Not
dis
close
dJa
nuar
y 2
006
Ter
tia
Eduso
ft A
G
Sw
itze
rlan
d90.3
8
Tat
a M
etal
iks
Ush
a Is
pat
, R
edi
Unit
India
100
$25 m
illi
on
Januar
y 2
006
Tat
a M
oto
rsH
ispan
o C
arro
cera
Spai
n21
$16 m
illi
on
Feb
ruar
y 2
005
Dae
woo C
om
mer
cial
Veh
icle
Com
pan
y
Kore
a100
$102 m
illi
on
Mar
ch 2
004
Jaguar
Lan
d R
over
busi
nes
s fr
om
the
Ford
Moto
r C
om
pan
y
Unit
ed K
ingdom
100
$2.3
bil
lion
/...
Transnational Corporations, Vol. 17, No. 3 (December 2008) 107
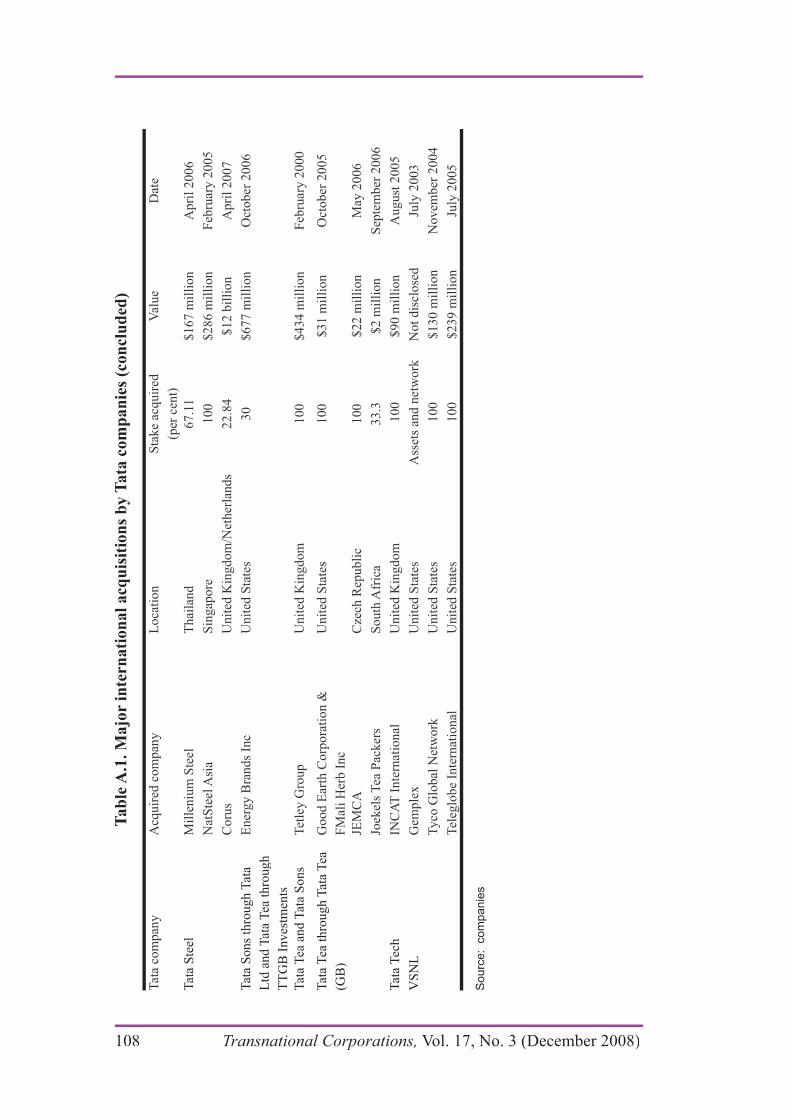
Ta
ble
A.1
. M
ajo
r in
tern
ati
on
al
acq
uis
itio
ns
by
Ta
ta c
om
pa
nie
s (c
on
clu
ded
)
Tat
a co
mpan
yA
cquir
ed c
om
pan
yL
oca
tion
Sta
ke
acquir
ed
(per
cen
t)
Val
ue
Dat
e
Tat
a S
teel
Mil
leniu
m S
teel
Thai
land
67.1
1
$167 m
illi
on
Apri
l 2006
Nat
Ste
el A
sia
Sin
gap
ore
100
$286 m
illi
on
Feb
ruar
y 2
005
Coru
sU
nit
ed K
ingdom
/Net
her
lands
22.8
4$12 b
illi
on
Apri
l 2007
Tat
a S
ons
thro
ug
h T
ata
Ltd
an
d T
ata
Tea
th
rou
gh
TT
GB
Inves
tmen
ts
Ener
gy B
rands
Inc
Unit
ed S
tate
s30
$677 m
illi
on
Oct
ober
2006
Tat
a T
ea a
nd
Tat
a S
on
sT
etle
y G
roup
Unit
ed K
ingdom
100
$434 m
illi
on
Feb
ruar
y 2
000
Tat
a T
ea t
hro
ugh
Tat
a T
ea
(GB
)
Good E
arth
Corp
ora
tion &
FM
ali
Her
b I
nc
Unit
ed S
tate
s100
$31 m
illi
on
Oct
ober
2005
JEM
CA
Cze
ch R
epubli
c100
$22 m
illi
on
May
2006
Joek
els
Tea
Pac
ker
sS
outh
Afr
ica
33.3
$2 m
illi
on
Sep
tem
ber
2006
Tat
a T
ech
INC
AT
Inte
rnat
ional
Unit
ed K
ingdom
100
$90 m
illi
on
August
2005
VS
NL
Gem
ple
xU
nit
ed S
tate
sA
sset
s an
d n
etw
ork
Not
dis
close
dJu
ly 2
003
Tyco
Glo
bal
Net
work
Unit
ed S
tate
s100
$130 m
illi
on
Novem
ber
2004
Tel
eglo
be
Inte
rnat
ional
Unit
ed S
tate
s100
$239 m
illi
on
July
2005
Sourc
e:
com
panie
s
108 Transnational Corporations, Vol. 17, No. 3 (December 2008)

World Investment Report 2008
Transnational Corporations and the
Infrastructure Challenge
OVERVIEW
RECORD FLOWS IN 2007,
BUT SET TO DECLINE
Global FDI flows surpassed the peak of 2000…
After four consecutive years of growth, global FDI inflows rose in 2007 by 30% to reach $1,833 billion, well above the previous all-time high set in 2000. Despite the financial and credit crises, which began in the second half of 2007, all the three major economic groupings – developed countries, developing countries and the transition economies of South-East Europe and the Commonwealth of Independent States (CIS) – saw continued growth in their inflows (table 1). The increase in FDI largely reflected relatively high economic growth and strong corporate performance in many parts of the world. Reinvested earnings accounted for about 30% of total FDI inflows as a result of increased profits of foreign affiliates, notably in developing countries. To some extent, the record FDI levels in dollar terms also reflected the significant depreciation of the dollar against other major currencies. However, even measured in local currencies, the average growth rate of global FDI flows was still 23% in 2007.
FDI inflows into developed countries reached $1,248 billion. The United States maintained its position as the largest recipient country, followed by the United Kingdom, France, Canada and the Netherlands (figure 1). The European Union (EU) was the largest host region, attracting almost two thirds of total FDI inflows into developed countries.
In developing countries, FDI inflows reached their highest level ever ($500 billion) – a 21% increase over 2006. The least developed countries (LDCs) attracted $13 billion worth of FDI in 2007 – also a record high. At the same time, developing countries continued to gain in importance as sources of FDI, with outflows rising to a new record level of $253 billion, mainly as a result of outward expansion by Asian TNCs. FDI inflows into South-East Europe and the CIS also surged, increasing by 50%, to reach $86 billion in 2007. The region has thus seen seven years of uninterrupted growth. Outflows from this region similarly soared, to $51 billion, more than twice the 2006 level. Among developing and transition economies, the three largest recipients were China, Hong Kong (China) and the Russian Federation.
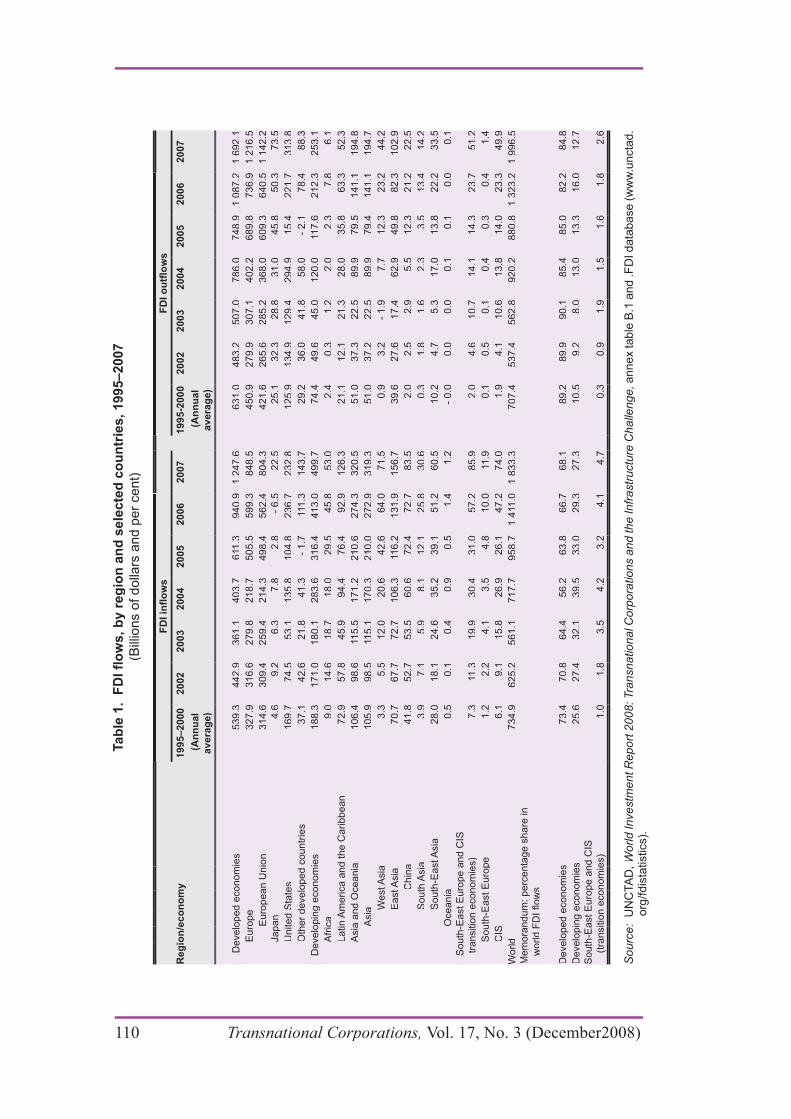
Tab
le 1
. F
DI fl
ow
s, b
y r
eg
ion
an
d s
ele
cte
d c
ou
ntr
ies, 1995–200
7
(Bill
ions o
f dolla
rs a
nd p
er
cent)
Reg
ion
/eco
no
my
1995–2000
2002
2003
2004
2005
2006
2007
1995-2
000
2002
2003
2004
2005
2006
2007
(A
nn
ual
avera
ge)
(A
nn
ual
avera
ge)
D
evelo
ped e
conom
ies
D
evelo
ped e
conom
ies
539.3
442.9
361.1
403.7
611
.3 9
40.9
1 2
47.6
631.0
483.2
507.0
786.0
748.9
1 0
87.2
1 6
92.1
539.3
442.9
361.1
403.7
611
.3 9
40.9
1 2
47.6
631.0
483.2
507.0
786.0
748.9
1 0
87.2
1 6
92.1
Euro
pe
Euro
pe
327.9
316.6
279.8
218.7
505.5
599.3
848.5
450.9
279.9
307.1
402.2
689.8
736.9
1 2
16.5
327.9
316.6
279.8
218.7
505.5
599.3
848.5
450.9
279.9
307.1
402.2
689.8
736.9
1 2
16.5
Euro
pean U
nio
nE
uro
pean U
nio
n 3
14.6
309.4
259.4
214.3
498.4
562.4
804.3
421.6
265.6
285.2
368.0
609.3
640.5
1 1
42.2
314.6
309.4
259.4
214.3
498.4
562.4
804.3
421.6
265.6
285.2
368.0
609.3
640.5
1 1
42.2
Japan
Japan
4.6
9.2
6.3
7.8
2.8
- 6.5
22.5
25.1
32.3
28.8
31.0
45.8
50.3
73.5
4.6
9.2
6.3
7.8
2.8
- 6.5
22.5
25.1
32.3
28.8
31.0
45.8
50.3
73.5
United S
tate
sU
nited S
tate
s 1
69.7
74.5
53.1
135.8
104.8
236.7
232.8
125.9
134.9
129.4
294.9
15.4
221.7
313.8
169.7
74.5
53.1
135.8
104.8
236.7
232.8
125.9
134.9
129.4
294.9
15.4
221.7
313.8
Oth
er
develo
ped c
ountr
ies
Oth
er
develo
ped c
ountr
ies
37.1
42.6
21.8
41.3
- 1.7
111
.3 1
43.7
29.2
36.0
41.8
58.0
- 2.1
78.4
88.3
37.1
42.6
21.8
41.3
- 1.7
111
.3 1
43.7
29.2
36.0
41.8
58.0
- 2.1
78.4
88.3
D
evelo
pin
g e
conom
ies
D
evelo
pin
g e
conom
ies
188.3
171.0
180.1
283.6
316.4
413.0
499.7
74.4
49.6
45.0
120.0
117.6
212.3
253.1
188.3
171.0
180.1
283.6
316.4
413.0
499.7
74.4
49.6
45.0
120.0
117.6
212.3
253.1
Afr
ica
Afr
ica
9.0
14.6
18.7
18.0
29.5
45.8
53.0
2.4
0.3
1.2
2.0
2.3
7.8
6.1
9.0
14.6
18.7
18.0
29.5
45.8
53.0
2.4
0.3
1.2
2.0
2.3
7.8
6.1
Latin A
merica a
nd the C
aribbean
Latin A
merica a
nd the C
aribbean
72.9
57.8
45.9
94.4
76.4
92.9
126.3
21.1
12.1
21.3
28.0
35.8
63.3
52.3
72.9
57.8
45.9
94.4
76.4
92.9
126.3
21.1
12.1
21.3
28.0
35.8
63.3
52.3
Asia
and O
ceania
Asia
and O
ceania
106.4
98.6
115.5
171.2
210.6
274.3
320.5
51.0
37.3
22.5
89.9
79.5
141.1
194.8
106.4
98.6
115.5
171.2
210.6
274.3
320.5
51.0
37.3
22.5
89.9
79.5
141.1
194.8
Asia
Asia
105.9
98.5
115.1
170.3
210.0
272.9
319.3
51.0
37.2
22.5
89.9
79.4
141.1
194.7
105.9
98.5
115.1
170.3
210.0
272.9
319.3
51.0
37.2
22.5
89.9
79.4
141.1
194.7
West A
sia
West A
sia
3.3
5.5
12.0
20.6
42.6
64.0
71.5
0.9
3.2
- 1.9
7.7
12.3
23.2
44.2
3.3
5.5
12.0
20.6
42.6
64.0
71.5
0.9
3.2
- 1.9
7.7
12.3
23.2
44.2
East A
sia
East A
sia
70.7
67.7
72.7
106.3
116.2
131.9
156.7
39.6
27.6
17.4
62.9
49.8
82.3
102.9
70.7
67.7
72.7
106.3
116.2
131.9
156.7
39.6
27.6
17.4
62.9
49.8
82.3
102.9
Chin
aC
hin
a41.8
52.7
53.5
60.6
72.4
72.7
83.5
2.0
2.5
2.9
5.5
12.3
21.2
22.5
41.8
52.7
53.5
60.6
72.4
72.7
83.5
2.0
2.5
2.9
5.5
12.3
21.2
22.5
South
Asia
South
Asia
3.9
7.1
5.9
8.1
12.1
25.8
30.6
0.3
1.8
1.6
2.3
3.5
13.4
14.2
3.9
7.1
5.9
8.1
12.1
25.8
30.6
0.3
1.8
1.6
2.3
3.5
13.4
14.2
South
-East A
sia
South
-East A
sia
28.0
18.1
24.6
35.2
39.1
51.2
60.5
10.2
4.7
5.3
17.0
13.8
22.2
33.5
28.0
18.1
24.6
35.2
39.1
51.2
60.5
10.2
4.7
5.3
17.0
13.8
22.2
33.5
Oceania
Oceania
0.5
0.1
0.4
0.9
0.5
1.4
1.2
- 0.0
0.0
0.0
0.1
0.1
0.0
0.1
0.5
0.1
0.4
0.9
0.5
1.4
1.2
- 0.0
0.0
0.0
0.1
0.1
0.0
0.1
S
outh
-East E
uro
pe a
nd C
IS S
outh
-East E
uro
pe a
nd C
IS tr
ansitio
n e
conom
ies)
tr
ansitio
n e
conom
ies)
7.3
11.3
19.9
30.4
31.0
57.2
85.9
2.0
4.6
10.7
14.1
14.3
23.7
51.2
7.3
11.3
19.9
30.4
31.0
57.2
85.9
2.0
4.6
10.7
14.1
14.3
23.7
51.2
South
-East E
uro
pe
South
-East E
uro
pe
1.2
2.2
4.1
3.5
4.8
10.0
11.9
0.1
0.5
0.1
0.4
0.3
0.4
1.4
1.2
2.2
4.1
3.5
4.8
10.0
11.9
0.1
0.5
0.1
0.4
0.3
0.4
1.4
CIS
CIS
6.1
9.1
15.8
26.9
26.1
47.2
74.0
1.9
4.1
10.6
13.8
14.0
23.3
49.9
6.1
9.1
15.8
26.9
26.1
47.2
74.0
1.9
4.1
10.6
13.8
14.0
23.3
49.9
World
World
734.9
625.2
561.1
717.7
958.7
1 4
11.0
1 8
33.3
707.4
537.4
562.8
920.2
880.8
1 3
23.2
1 9
96.5
734.9
625.2
561.1
717.7
958.7
1 4
11.0
1 8
33.3
707.4
537.4
562.8
920.2
880.8
1 3
23.2
1 9
96.5
Mem
ora
ndum
: perc
enta
ge s
hare
in
Mem
ora
ndum
: perc
enta
ge s
hare
in
Develo
ped e
conom
ies
Develo
ped e
conom
ies
73.4
70.8
64.4
56.2
63.8
66.7
68.1
89.2
89.9
90.1
85.4
85.0
82.2
84.8
73.4
70.8
64.4
56.2
63.8
66.7
68.1
89.2
89.9
90.1
85.4
85.0
82.2
84.8
Develo
pin
g e
conom
ies
Develo
pin
g e
conom
ies
25.6
27.4
32.1
39.5
33.0
29.3
27.3
10.5
9.2
8.0
13.0
13.3
16.0
12.7
25.6
27.4
32.1
39.5
33.0
29.3
27.3
10.5
9.2
8.0
13.0
13.3
16.0
12.7
South
-East E
uro
pe a
nd C
ISS
outh
-East E
uro
pe a
nd C
IS (t
ransitio
n e
conom
ies)
(t
ransitio
n e
conom
ies)
1.0
1.8
3.5
4.2
3.2
4.1
4.7
0.3
0.9
1.9
1.5
1.6
1.8
2.6
1.0
1.8
3.5
4.2
3.2
4.1
4.7
0.3
0.9
1.9
1.5
1.6
1.8
2.6
Sourc
e:
UN
CTA
D, W
orld Investm
ent R
eport
2008: Tra
nsnational C
orp
ora
tions a
nd the Infr
astr
uctu
re C
halle
nge,annex table
B.1
and .F
DI data
base (
ww
w.u
ncta
d.
org
/fdis
tatistics).
110 Transnational Corporations, Vol. 17, No. 3 (December2008)

Figure 1. Global FDI flows, top 20 economies, 2006, 2007a
(Billions of dollars)
Source: UNCTAD, World Investment Report 2008: Transnational Corporations and the InfrastructureChallenge, annex table B.1 and based on FDI/TNC database (www.unctad.org/fdistatistics).
a Ranked by the magnitude of 2007 FDI flows.
...driven by record values of cross-border M&As.
Continued consolidation through cross-border mergers and acquisitions (M&As) contributed substantially to the global surge in FDI. In 2007, the value of such transactions amounted to $1,637 billion, 21% higher than the previous record in 2000. Thus, overall, the financial crisis, starting with the sub-prime mortgage crisis in the United States, did not have a visible dampening effect on global cross-border M&As in 2007. On the contrary, in the latter half of 2007 some very large deals took place, including the $98 billion acquisition of ABN-AMRO Holding NV by the consortium of Royal Bank of Scotland, Fortis and Santander – the largest deal in banking history – and the acquisition of Alcan (Canada) by Rio Tinto (United Kingdom).
The largest TNCs pursued further expansion abroad…
The production of goods and services by an estimated 79,000 TNCs and their 790,000 foreign affiliates continues to expand, and their FDI stock exceeded $15 trillion in 2007. UNCTAD estimates that total sales of TNCs amounted to $31 trillion – a 21% increase over 2006. The value added (gross product) of foreign affiliates worldwide represented an estimated 11% of global GDP in 2007, and the number of employees rose to some 82 million (table 2).
The universe of TNCs is expanding. Manufacturing and petroleum companies, such as General Electric, British Petroleum, Shell, Toyota and Ford Motor, retain some of the top positions in UNCTAD’s ranking of the 25 largest non-financial TNCs in the world (table 3). However, TNCs in services, including in
Transnational Corporations, Vol. 17, No. 3 (December 2008) 111
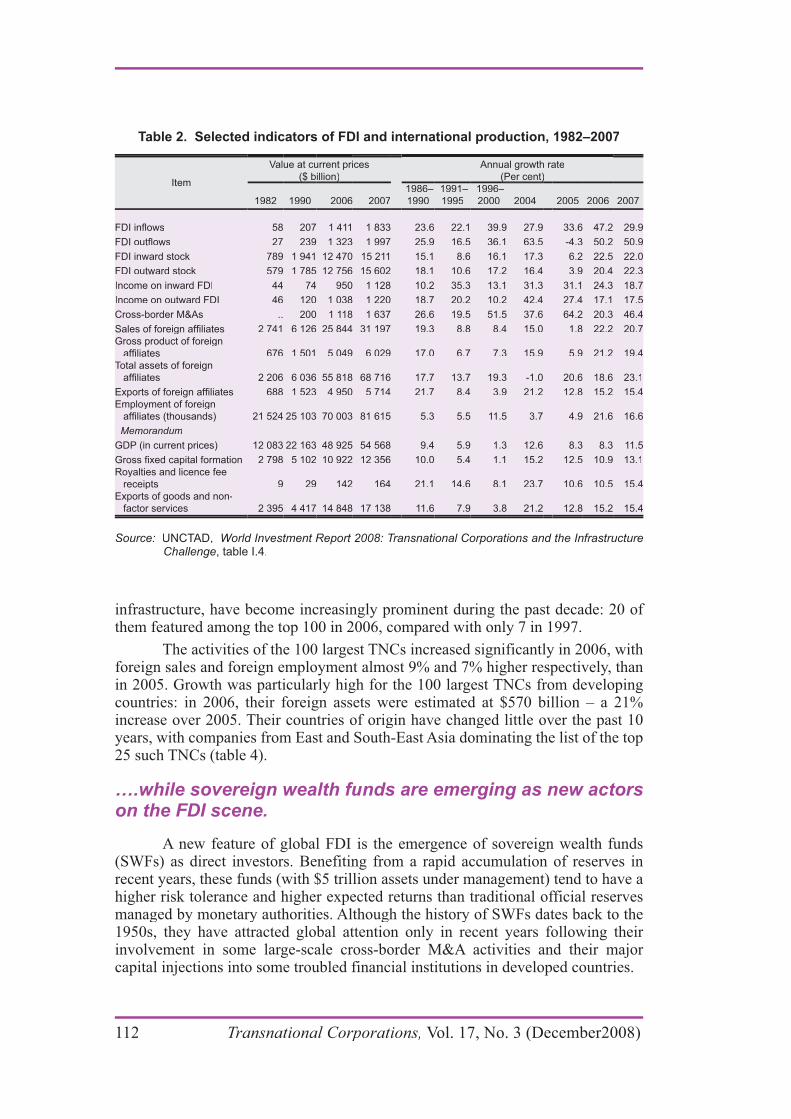
Table 2. Selected indicators of FDI and international production, 1982–2007
Item
Value at current prices($ billion)( )
Annual growth rate(Per cent)( ))
1982 1990 2006 2007 1986–1990
1991–1995
1996–2000 2004 2005 2006 2007
58 207 1 411 1 833 23.6 22.1 39.9 27.9 33.6 47.2 29.958 207 1 411 1 833 23.6 22.1 39.9 27.9 33.6 47.2 29.9
27 239 1 323 1 997 25.9 16.5 36.1 63.5 -4.3 50.2 50.927 239 1 323 1 997 25.9 16.5 36.1 63.5 -4.3 50.2 50.9
FDI inward stockFDI inward stock 789 1 941 12 470 15 211 15.1 8.6 16.1 17.3 6.2 22.5 22.0 789 1 941 12 470 15 211 15.1 8.6 16.1 17.3 6.2 22.5 22.0
FDI outward stockFDI outward stock 579 1 785 12 756 15 602 18.1 10.6 17.2 16.4 3.9 20.4 22.3 579 1 785 12 756 15 602 18.1 10.6 17.2 16.4 3.9 20.4 22.3
Income on inward FDIIncome on inward FDI 44 74 950 1 128 10.2 35.3 13.1 31.3 31.1 24.3 18.744 74 950 1 128 10.2 35.3 13.1 31.3 31.1 24.3 18.7
Income on outward FDI 46 120 1 038 1 220 18.7 20.2 10.2 42.4 27.4 17.1 17.5Income on outward FDI 46 120 1 038 1 220 18.7 20.2 10.2 42.4 27.4 17.1 17.5
Cross-border M&AsCross-border M&As .. 200 1 118 1 637 26.6 19.5 51.5 37.6 64.2 20.3 46.4.. 200 1 118 1 637 26.6 19.5 51.5 37.6 64.2 20.3 46.4
2 741 6 126 25 844 31 197 19.3 8.8 8.4 15.0 1.8 22.2 20.72 741 6 126 25 844 31 197 19.3 8.8 8.4 15.0 1.8 22.2 20.7Gross product of foreign Gross product of foreign
676 1 501 5 049 6 029 17.0 6.7 7.3 15.9 5.9 21.2 19.4676 1 501 5 049 6 029 17.0 6.7 7.3 15.9 5.9 21.2 19.4Total assets of foreignTotal assets of foreign
2 206 6 036 55 818 68 716 17.7 13.7 19.3 -1.0 20.6 18.6 23.12 206 6 036 55 818 68 716 17.7 13.7 19.3 -1.0 20.6 18.6 23.1
688 1 523 4 950 5 714 21.7 8.4 3.9 21.2 12.8 15.2 15.4 688 1 523 4 950 5 714 21.7 8.4 3.9 21.2 12.8 15.2 15.4Employment of foreignEmployment of foreign
21 524 25 103 70 003 81 615 5.3 5.5 11.5 3.7 4.9 21.6 16.621 524 25 103 70 003 81 615 5.3 5.5 11.5 3.7 4.9 21.6 16.6
Memorandum Memorandum
GDP (in current prices) 12 083 22 163 48 925 54 568 9.4 5.9 1.3 12.6 8.3 8.3 11.5GDP (in current prices) 12 083 22 163 48 925 54 568 9.4 5.9 1.3 12.6 8.3 8.3 11.5
2 798 5 102 10 922 12 356 10.0 5.4 1.1 15.2 12.5 10.9 13.12 798 5 102 10 922 12 356 10.0 5.4 1.1 15.2 12.5 10.9 13.1Royalties and licence feeRoyalties and licence fee
receiptsreceipts 9 29 142 164 21.1 14.6 8.1 23.7 10.6 10.5 15.4 9 29 142 164 21.1 14.6 8.1 23.7 10.6 10.5 15.4Exports of goods and non-Exports of goods and non-
factor servicesfactor services 2 395 4 417 14 848 17 138 11.6 7.9 3.8 21.2 12.8 15.2 15.42 395 4 417 14 848 17 138 11.6 7.9 3.8 21.2 12.8 15.2 15.4
Source: UNCTAD, World Investment Report 2008: Transnational Corporations and the InfrastructureChallenge, table I.4.
infrastructure, have become increasingly prominent during the past decade: 20 of them featured among the top 100 in 2006, compared with only 7 in 1997.
The activities of the 100 largest TNCs increased significantly in 2006, with foreign sales and foreign employment almost 9% and 7% higher respectively, than in 2005. Growth was particularly high for the 100 largest TNCs from developing countries: in 2006, their foreign assets were estimated at $570 billion – a 21% increase over 2005. Their countries of origin have changed little over the past 10 years, with companies from East and South-East Asia dominating the list of the top 25 such TNCs (table 4).
….while sovereign wealth funds are emerging as new actors on the FDI scene.
A new feature of global FDI is the emergence of sovereign wealth funds (SWFs) as direct investors. Benefiting from a rapid accumulation of reserves in recent years, these funds (with $5 trillion assets under management) tend to have a higher risk tolerance and higher expected returns than traditional official reserves managed by monetary authorities. Although the history of SWFs dates back to the 1950s, they have attracted global attention only in recent years following their involvement in some large-scale cross-border M&A activities and their major capital injections into some troubled financial institutions in developed countries.
112 Transnational Corporations, Vol. 17, No. 3 (December2008)
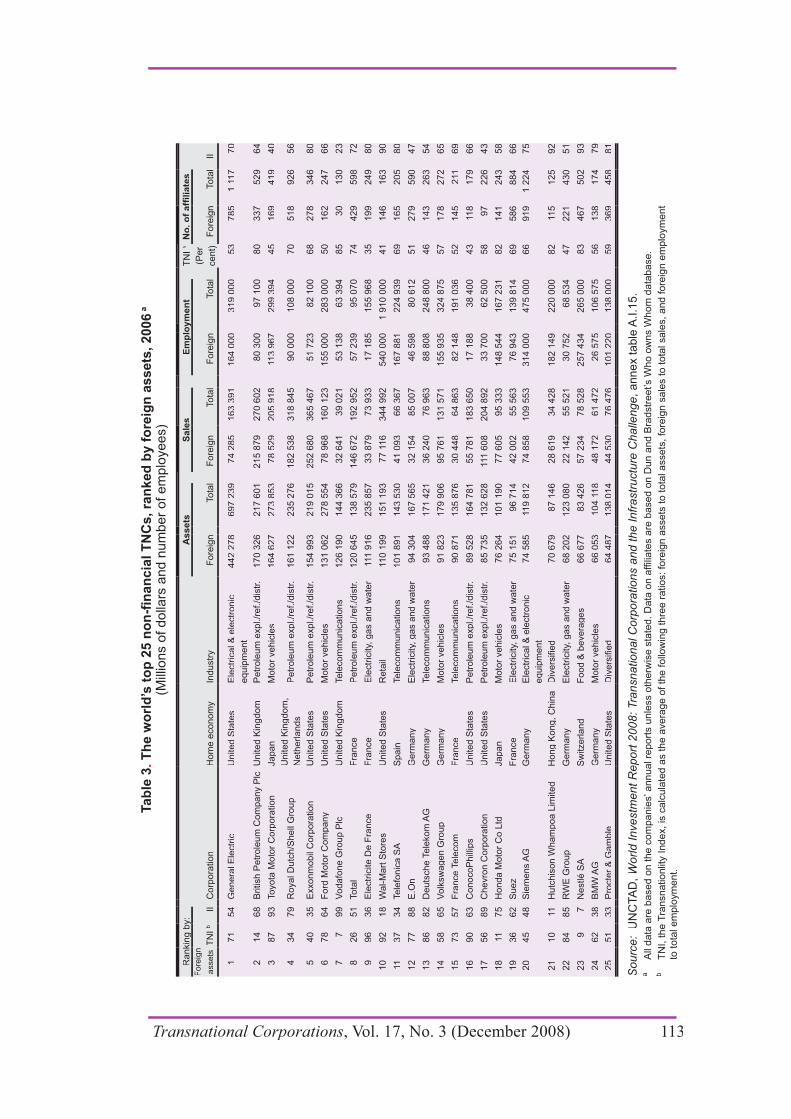
Tab
le 3
. T
he w
orl
d’s
to
p 2
5 n
on
-fin
an
cia
l T
NC
s, ra
nked
by f
ore
ign
assets
, 200
6 a
(Mill
ions o
f dolla
rs a
nd n
um
ber
of em
plo
yees)
Rankin
g b
y:
gyy
Assets
Sale
sE
mp
loym
en
tyy
TN
Ib
(Per )
Fore
ign
assets
TN
Ib
II
Corp
ora
tion
Hom
e e
conom
yIn
dustr
yF
ore
ign
Tota
lF
ore
ign
Tota
lF
ore
ign
Tota
lF
ore
ign
Tota
lII
cent)
1
71
54
Genera
l E
lectr
ic 1
71
54
Genera
l E
lectr
icU
nited S
tate
sE
lectr
ical &
ele
ctr
onic
U
nited S
tate
sE
lectr
ical &
ele
ctr
onic
equip
ment
equip
ment
442 2
78
697 2
39
74 2
85
163 3
91
164 0
00
319 0
00
53
785
1 1
17
70
442 2
78
697 2
39
74 2
85
163 3
91
164 0
00
319 0
00
53
785
1 1
17
70
2 14
68
British P
etr
ole
um
Com
pany P
lcU
nited K
ingdom
Petr
ole
um
expl./r
ef./d
istr.
170 3
26
217 6
01
215 8
79
270 6
02
80 3
00
97 1
00
80
337
529
64
2 14
68
British P
etr
ole
um
Com
pany P
lcU
nited K
ingdom
Petr
ole
um
expl./r
ef./d
istr.
170 3
26
217 6
01
215 8
79
270 6
02
80 3
00
97 1
00
80
337
529
64
3 87
93
Toyota
Moto
r C
orp
ora
tion
Japan
3 87
93
Toyota
Moto
r C
orp
ora
tion
Japan
Moto
r vehic
les
Moto
r vehic
les
164 6
27
273 8
53
78 5
29
205 9
18
113 9
67
299 3
94
45
169
419
40
164 6
27
273 8
53
78 5
29
205 9
18
113 9
67
299 3
94
45
169
419
40
4 34
79
Royal D
utc
h/S
hell
Gro
up
4 34
79
Royal D
utc
h/S
hell
Gro
up
United K
ingdom
,U
nited K
ingdom
,
Neth
erlands
Neth
erlands
Petr
ole
um
expl./r
ef./d
istr.
161 1
22
235 2
76
182 5
38
318 8
45
90 0
00
108 0
00
70
518
926
56
Petr
ole
um
expl./r
ef./d
istr.
161 1
22
235 2
76
182 5
38
318 8
45
90 0
00
108 0
00
70
518
926
56
5 40
35
Exxonm
obil
Corp
ora
tion
United S
tate
sP
etr
ole
um
expl./r
ef./d
istr.
154 9
93
219 0
15
252 6
80
365 4
67
51 7
23
82 1
00
68
278
346
80
5 40
35
Exxonm
obil
Corp
ora
tion
United S
tate
sP
etr
ole
um
expl./r
ef./d
istr.
154 9
93
219 0
15
252 6
80
365 4
67
51 7
23
82 1
00
68
278
346
80
6 78
64
Ford
Moto
r C
om
pany
United S
tate
sM
oto
r vehic
les
6 78
64
Ford
Moto
r C
om
pany
United S
tate
sM
oto
r vehic
les
131 0
62
278 5
54
78 9
68
160 1
23
155 0
00
283 0
00
50
162
247
66
131 0
62
278 5
54
78 9
68
160 1
23
155 0
00
283 0
00
50
162
247
66
7
7
99
Vodafo
ne G
roup P
lc 7
7
99
Vodafo
ne G
roup P
lcU
nited K
ingdom
Tele
com
munic
ations
126 1
90
144 3
66
32 6
41
39 0
21
53 1
38
63 3
94
85
30
130
23
United K
ingdom
Tele
com
munic
ations
126 1
90
144 3
66
32 6
41
39 0
21
53 1
38
63 3
94
85
30
130
23
8 26
51
Tota
l 8
26
51
Tota
lF
rance
Fra
nce
Petr
ole
um
expl./r
ef./d
istr.
120 6
45
138 5
79
146 6
72
192 9
52
57 2
39
95 0
70
74
429
598
72
Petr
ole
um
expl./r
ef./d
istr.
120 6
45
138 5
79
146 6
72
192 9
52
57 2
39
95 0
70
74
429
598
72
9 96
36
Ele
ctr
icite D
e F
rance
9 96
36
Ele
ctr
icite D
e F
rance
Fra
nce
Fra
nce
Ele
ctr
icity,
gas a
nd w
ate
r 1
11 9
16
235 8
57
33 8
79
73 9
33
17 1
85
155 9
68
35
199
249
80
Ele
ctr
icity,
gas a
nd w
ate
r 1
11 9
16
235 8
57
33 8
79
73 9
33
17 1
85
155 9
68
35
199
249
80
10
92
18
Wal-M
art
Sto
res
10
92
18
Wal-M
art
Sto
res
United S
tate
sR
eta
ilU
nited S
tate
sR
eta
il11
0 1
99
151 1
93
77 1
16
344 9
92
540 0
00
1 9
10 0
00
41
146
163
90
110 1
99
151 1
93
77 1
16
344 9
92
540 0
00
1 9
10 0
00
41
146
163
90
11
37
34
Tele
fonic
a S
A 11
37
34
Tele
fonic
a S
AS
pain
Spain
Tele
com
munic
ations
101 8
91
143 5
30
41 0
93
66 3
67
167 8
81
224 9
39
69
165
205
80
Tele
com
munic
ations
101 8
91
143 5
30
41 0
93
66 3
67
167 8
81
224 9
39
69
165
205
80
12
77
88
E.O
n 1
2 77
88
E.O
nG
erm
any
Ele
ctr
icity,
gas a
nd w
ate
r 9
4 3
04
167 5
65
32 1
54
85 0
07
46 5
98
80 6
12
51
279
590
47
Germ
any
Ele
ctr
icity,
gas a
nd w
ate
r 9
4 3
04
167 5
65
32 1
54
85 0
07
46 5
98
80 6
12
51
279
590
47
13
86
82
Deuts
che T
ele
kom
AG
Germ
any
Tele
com
munic
ations
93 4
88
171 4
21
36 2
40
76 9
63
88 8
08
248 8
00
46
143
263
54
13
86
82
Deuts
che T
ele
kom
AG
Germ
any
Tele
com
munic
ations
93 4
88
171 4
21
36 2
40
76 9
63
88 8
08
248 8
00
46
143
263
54
14
58
65
Volk
sw
agen G
roup
14
58
65
Volk
sw
agen G
roup
Germ
any
Moto
r vehic
les
Germ
any
Moto
r vehic
les
91 8
23
179 9
06
95 7
61
131 5
71
155 9
35
324 8
75
57
178
272
65
91 8
23
179 9
06
95 7
61
131 5
71
155 9
35
324 8
75
57
178
272
65
15
73
57
Fra
nce T
ele
com
15
73
57
Fra
nce T
ele
com
Fra
nce
Fra
nce
Tele
com
munic
ations
90 8
71
135 8
76
30 4
48
64 8
63
82 1
48
191 0
36
52
145
211
69
Tele
com
munic
ations
90 8
71
135 8
76
30 4
48
64 8
63
82 1
48
191 0
36
52
145
211
69
16
90
63
ConocoP
hill
ips
16
90
63
ConocoP
hill
ips
United S
tate
sP
etr
ole
um
expl./r
ef./d
istr.
89 5
28
164 7
81
55 7
81
183 6
50
17 1
88
38 4
00
43
11
8 179
66
United S
tate
sP
etr
ole
um
expl./r
ef./d
istr.
89 5
28
164 7
81
55 7
81
183 6
50
17 1
88
38 4
00
43
11
8 179
66
17
56
89
Chevro
n C
orp
ora
tion
17
56
89
Chevro
n C
orp
ora
tion
United S
tate
sP
etr
ole
um
expl./r
ef./d
istr.
85 7
35
132 6
28
111
608
204 8
92
33 7
00
62 5
00
58
97
226
43
United S
tate
sP
etr
ole
um
expl./r
ef./d
istr.
85 7
35
132 6
28
111
608
204 8
92
33 7
00
62 5
00
58
97
226
43
18
11
75
Honda M
oto
r C
o L
td 18
11
75
Honda M
oto
r C
o L
tdJapan
Japan
Moto
r vehic
les
Moto
r vehic
les
76 2
64
101 1
90
77 6
05
95 3
33
148 5
44
167 2
31
82
141
243
58
76 2
64
101 1
90
77 6
05
95 3
33
148 5
44
167 2
31
82
141
243
58
19
36
62
Suez
19
36
62
Suez
Fra
nce
Fra
nce
Ele
ctr
icity,
gas a
nd w
ate
r 7
5 1
51
96 7
14
42 0
02
55 5
63
76 9
43
139 8
14
69
586
884
66
Ele
ctr
icity,
gas a
nd w
ate
r 7
5 1
51
96 7
14
42 0
02
55 5
63
76 9
43
139 8
14
69
586
884
66
20
45
48
Sie
mens A
G 2
0 45
48
Sie
mens A
GG
erm
any
Ele
ctr
ical &
ele
ctr
onic
G
erm
any
Ele
ctr
ical &
ele
ctr
onic
equip
ment
equip
ment
74 5
85
119 8
12
74 8
58
109 5
53
314 0
00
475 0
00
66
919
1 2
24
75
74 5
85
119 8
12
74 8
58
109 5
53
314 0
00
475 0
00
66
919
1 2
24
75
21
10
11
Hutc
his
on W
ham
poa L
imited
Hong K
ong, C
hin
a 2
1 10
11
Hutc
his
on W
ham
poa L
imited
Hong K
ong, C
hin
a 7
0 6
79
87 1
46
28 6
19
34 4
28
182 1
49
220 0
00
82
11
5 125
92
70 6
79
87 1
46
28 6
19
34 4
28
182 1
49
220 0
00
82
11
5 125
92
22
84
85
RW
E G
roup
22
84
85
RW
E G
roup
Germ
any
Ele
ctr
icity,
gas a
nd w
ate
r 6
8 2
02
123 0
80
22 1
42
55 5
21
30 7
52
68 5
34
47
221
430
51
Germ
any
Ele
ctr
icity,
gas a
nd w
ate
r 6
8 2
02
123 0
80
22 1
42
55 5
21
30 7
52
68 5
34
47
221
430
51
23
9
7
Nestlé S
A 2
3 9
7
Nestlé S
AS
witzerland
Food &
bevera
ges
66 6
77
83 4
26
57 2
34
78 5
28
257 4
34
265 0
00
Sw
itzerland
Food &
bevera
ges
66 6
77
83 4
26
57 2
34
78 5
28
257 4
34
265 0
00
83
467
502
93
83
467
502
93
24
62
38
BM
W 24
62
38
BM
WA
GA
GG
erm
any
Moto
r vehic
les
Germ
any
Moto
r vehic
les
66 0
53
104 1
18
48 1
72
61 4
72
26 5
75
106 5
75
56
138
174
79
66 0
53
104 1
18
48 1
72
61 4
72
26 5
75
106 5
75
56
138
174
79
25
51
33
Pro
cte
r &
Gam
ble
25
51
33
Pro
cte
r &
Gam
ble
United S
tate
sU
nited S
tate
s 6
4 4
87
138 0
14
44 5
30
76 4
76
101 2
20
138 0
00
59
369
458
81
64 4
87
138 0
14
44 5
30
76 4
76
101 2
20
138 0
00
59
369
458
81
Sourc
e:
UN
CTA
D,W
orld Investm
ent R
eport
2008: Tra
nsnational C
orp
ora
tions a
nd the Infr
astr
uctu
re C
halle
nge
, annex table
A.I.1
5.
aA
ll data
are
based o
n the c
om
panie
s’ a
nnual re
port
s u
nle
ss o
therw
ise s
tate
d. D
ata
on a
ffili
ate
s a
re b
ased o
n D
un a
nd B
radstr
eet’s
Who o
wns W
hom
data
base
.b
TN
I, t
he T
ransnationlit
y I
ndex,
is c
alc
ula
ted a
s t
he a
vera
ge o
f th
e f
ollo
win
g t
hre
e r
atios:
fore
ign a
ssets
to t
ota
l assets
, fo
reig
n s
ale
s t
o t
ota
l sale
s,
and f
ore
ign e
mplo
ym
ent
to tota
l em
plo
ym
ent.
Transnational Corporations, Vol. 17, No. 3 (December 2008) 113
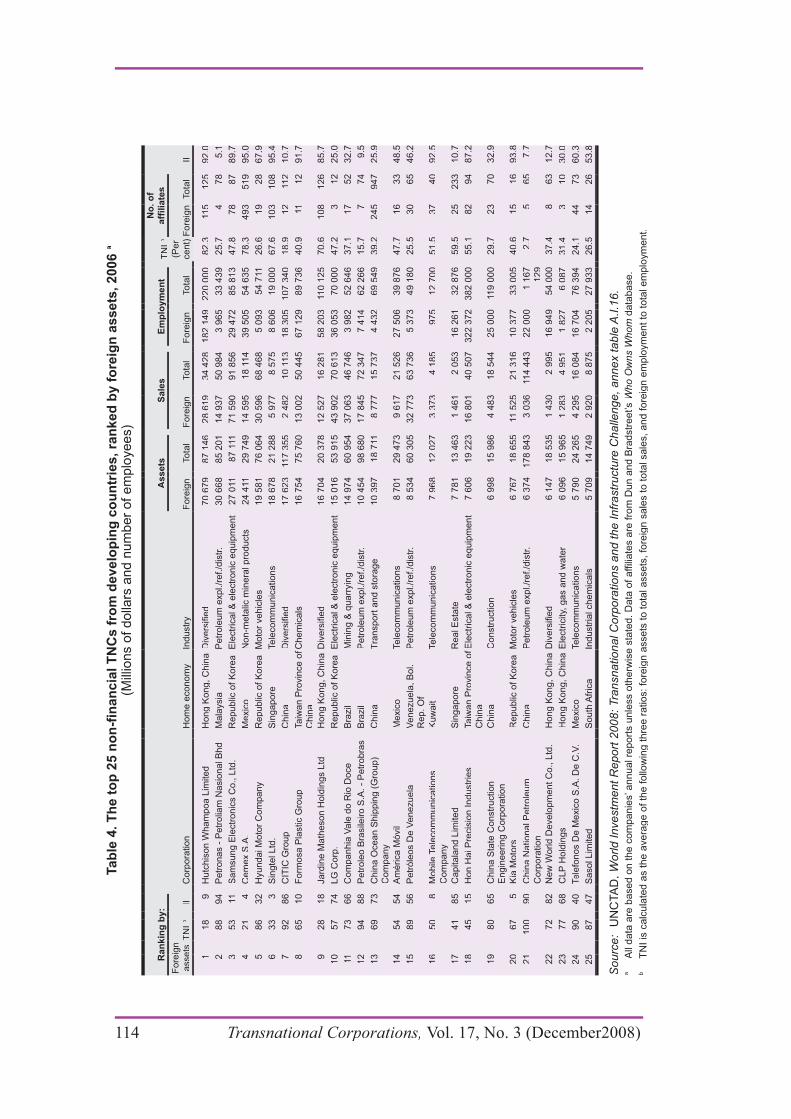
Tab
le 4
. T
he t
op
25 n
on
-fin
an
cia
l T
NC
s f
rom
develo
pin
g c
ou
ntr
ies, ra
nked
by f
ore
ign
assets
, 2006
a
(Mill
ions o
f dolla
rs a
nd n
um
ber
of em
plo
yees)
Ran
kin
g b
y:
Assets
Sale
sE
mp
loym
en
tT
NI
b
(Per )
No
. o
f
Fore
ign
assets
TN
I b
II
Corp
ora
tion
Hom
e e
conom
yIn
dustr
y
Fore
ign
Tota
lF
ore
ign
Tota
lF
ore
ign
Tota
lF
ore
ign
Tota
lII
cent)
118
9H
utc
his
on W
ham
poa L
imited
Hong K
ong, C
hin
a1
18
9H
utc
his
on W
ham
poa L
imited
Hong K
ong, C
hin
a70 6
79
87 1
46
28 6
19
34 4
28
182 1
49
220 0
00
82.3
115
125
92.0
70 6
79
87 1
46
28 6
19
34 4
28
182 1
49
220 0
00
82.3
115
125
92.0
288
94
Petr
onas -
Petr
olia
m N
asio
nal B
hd
Mala
ysia
Petr
ole
um
expl./r
ef./d
istr.
30 6
68
85 2
01
14 9
37
50 9
84
3 9
65
33 4
39
25.7
478
5.1
288
94
Petr
onas -
Petr
olia
m N
asio
nal B
hd
Mala
ysia
Petr
ole
um
expl./r
ef./d
istr.
30 6
68
85 2
01
14 9
37
50 9
84
3 9
65
33 4
39
25.7
478
5.1
353
353
1111S
am
sung E
lectr
onic
s C
o., L
td.
Republic
of K
ore
aE
lectr
ical &
ele
ctr
onic
equip
ment
27 0
11 8
7 1
11 7
1 5
90
91 8
56
29 4
72
85 8
13
47.8
78
87
89.7
Sam
sung E
lectr
onic
s C
o., L
td.
Republic
of K
ore
aE
lectr
ical &
ele
ctr
onic
equip
ment
27 0
11 8
7 1
11 7
1 5
90
91 8
56
29 4
72
85 8
13
47.8
78
87
89.7
421
4C
em
ex S
.A.
421
4C
em
ex S
.A.
Mexic
oM
exic
oN
on-m
eta
lic m
inera
l pro
ducts
24 4
11 2
9 7
49
14 5
95
18 1
14
39 5
05
54 6
35
78.3
493
519
95.0
Non-m
eta
lic m
inera
l pro
ducts
24 4
11 2
9 7
49
14 5
95
18 1
14
39 5
05
54 6
35
78.3
493
519
95.0
586
32
Hyundai M
oto
r C
om
pany
586
32
Hyundai M
oto
r C
om
pany
Republic
of K
ore
aM
oto
r vehic
les
Republic
of K
ore
aM
oto
r vehic
les
19 5
81
76 0
64
30 5
96
68 4
68
5 0
93
54 7
1126.6
19
28
67.9
19 5
81
76 0
64
30 5
96
68 4
68
5 0
93
54 7
1126.6
19
28
67.9
633
3S
ingte
l Ltd
.6
33
3S
ingte
l Ltd
.S
ingapore
Tele
com
munic
ations
Sin
gapore
Tele
com
munic
ations
18 6
78
21 2
88
5 9
77
8 5
75
8 6
06
19 0
00
67.6
103
108
95.4
18 6
78
21 2
88
5 9
77
8 5
75
8 6
06
19 0
00
67.6
103
108
95.4
792
86
CIT
IC G
roup
792
86
CIT
IC G
roup
Chin
aC
hin
a 1
7 6
23
117 3
55
2 4
82
10 1
13
18 3
05
107 3
40
18.9
12
112
10.7
17 6
23
117 3
55
2 4
82
10 1
13
18 3
05
107 3
40
18.9
12
112
10.7
865
10
Form
osa P
lastic G
roup
865
10
Form
osa P
lastic G
roup
Taiw
an P
rovin
ce o
f Taiw
an P
rovin
ce o
f C
hin
aC
hin
aC
hem
icals
Chem
icals
16 7
54
75 7
60
13 0
02
50 4
45
67 1
29
89 7
36
40.9
16 7
54
75 7
60
13 0
02
50 4
45
67 1
29
89 7
36
40.9
111112
91.7
12
91.7
928
18
Jard
ine M
ath
eson H
old
ings L
tdH
ong K
ong, C
hin
a9
28
18
Jard
ine M
ath
eson H
old
ings L
tdH
ong K
ong, C
hin
a 1
6 7
04
20 3
78
12 5
27
16 2
81
58 2
03
110 1
25
70.6
108
126
85.7
16 7
04
20 3
78
12 5
27
16 2
81
58 2
03
110 1
25
70.6
108
126
85.7
10
57
74
LG
Corp
.10
57
74
LG
Corp
.R
epublic
of K
ore
aE
lectr
ical &
ele
ctr
onic
equip
ment
15 0
16
53 9
15
43 9
02
70 6
13
36 0
53
70 0
00
47.2
312
25.0
Republic
of K
ore
aE
lectr
ical &
ele
ctr
onic
equip
ment
15 0
16
53 9
15
43 9
02
70 6
13
36 0
53
70 0
00
47.2
312
25.0
111173
66
Com
panhia
Vale
do R
io D
oce
Bra
zil
73
66
Com
panhia
Vale
do R
io D
oce
Bra
zil
Min
ing &
quarr
yin
gM
inin
g &
quarr
yin
g 1
4 9
74
60 9
54
37 0
63
46 7
46
3 9
82
52 6
46
37.1
17
52
32.7
14 9
74
60 9
54
37 0
63
46 7
46
3 9
82
52 6
46
37.1
17
52
32.7
12
94
88
Petr
ole
o B
rasile
iro S
.A. -
Petr
obra
sB
razil
12
94
88
Petr
ole
o B
rasile
iro S
.A. -
Petr
obra
sB
razil
Petr
ole
um
expl./r
ef./d
istr.
10 4
54
98 6
80
17 8
45
72 3
47
7 4
14
62 2
66
15.7
774
9.5
Petr
ole
um
expl./r
ef./d
istr.
10 4
54
98 6
80
17 8
45
72 3
47
7 4
14
62 2
66
15.7
774
9.5
13
69
73
Chin
a O
cean S
hip
pin
g (
Gro
up)
13
69
73
Chin
a O
cean S
hip
pin
g (
Gro
up)
Com
pany
Com
pany
Chin
aC
hin
aT
ransport
and s
tora
ge
Tra
nsport
and s
tora
ge
10 3
97
18 7
11 8
777
15 7
37
4 4
32
69 5
49
39.2
245
947
25.9
10 3
97
18 7
11 8
777
15 7
37
4 4
32
69 5
49
39.2
245
947
25.9
14
54
54
Am
érica M
óvil
14
54
54
Am
érica M
óvil
Mexic
oM
exic
oTele
com
munic
ations
Tele
com
munic
ations
8 7
01
29 4
73
9 6
17
21 5
26
27 5
06
39 8
76
47.7
16
33
48.5
8 7
01
29 4
73
9 6
17
21 5
26
27 5
06
39 8
76
47.7
16
33
48.5
15
89
56
Petr
óle
os D
e V
enezuela
15
89
56
Petr
óle
os D
e V
enezuela
Venezuela
, B
ol.
Venezuela
, B
ol.
Rep. O
fR
ep. O
fP
etr
ole
um
expl./r
ef./d
istr.
8 5
34
60 3
05
32 7
73
63 7
36
5 3
73
49 1
80
25.5
30
65
46.2
Petr
ole
um
expl./r
ef./d
istr.
8 5
34
60 3
05
32 7
73
63 7
36
5 3
73
49 1
80
25.5
30
65
46.2
16
50
8M
obile
Tele
com
munic
ations
16
50
8M
obile
Tele
com
munic
ations
Com
pany
Com
pany
Kuw
ait
Kuw
ait
Tele
com
munic
ations
Tele
com
munic
ations
7 9
68
12 0
27
3 3
73
4 1
85
975
12 7
00
51.5
37
40
92.5
7 9
68
12 0
27
3 3
73
4 1
85
975
12 7
00
51.5
37
40
92.5
17
41
85
Capitala
nd L
imited
17
41
85
Capitala
nd L
imited
Sin
gapore
Real E
sta
teS
ingapore
Real E
sta
te7 7
81
13 4
63
1 4
61
2 0
53
16 2
61
32 8
76
59.5
25
233
10.7
7 7
81
13 4
63
1 4
61
2 0
53
16 2
61
32 8
76
59.5
25
233
10.7
18
45
15
Hon H
ai P
recis
ion Industr
ies
Taiw
an P
rovin
ce o
f 18
45
15
Hon H
ai P
recis
ion Industr
ies
Taiw
an P
rovin
ce o
f C
hin
aC
hin
aE
lectr
ical &
ele
ctr
onic
equip
ment
7 6
06
19 2
23
16 8
01
40 5
07
322 3
72
382 0
00
55.1
82
94
87.2
Ele
ctr
ical &
ele
ctr
onic
equip
ment
7 6
06
19 2
23
16 8
01
40 5
07
322 3
72
382 0
00
55.1
82
94
87.2
19
80
65
Chin
a S
tate
Constr
uction
19
80
65
Chin
a S
tate
Constr
uction
Engin
eering C
orp
ora
tion
Engin
eering C
orp
ora
tion
Chin
aC
hin
aC
onstr
uction
Constr
uction
6 9
98
15 9
86
4 4
83
18 5
44
25 0
00
119 0
00
29.7
23
70
32.9
6 9
98
15 9
86
4 4
83
18 5
44
25 0
00
119 0
00
29.7
23
70
32.9
20
67
5K
ia M
oto
rs20
67
5K
ia M
oto
rsR
epublic
of K
ore
aM
oto
r vehic
les
Republic
of K
ore
aM
oto
r vehic
les
6 7
67
18 6
55
11 5
25
21 3
16
10 3
77
33 0
05
40.6
15
16
93.8
6 7
67
18 6
55
11 5
25
21 3
16
10 3
77
33 0
05
40.6
15
16
93.8
21
100
90
Chin
a N
ational P
etr
ole
um
21
100
90
Chin
a N
ational P
etr
ole
um
C
orp
ora
tion
Corp
ora
tion
Chin
aC
hin
aP
etr
ole
um
expl./r
ef./d
istr.
6 3
74
178 8
43
3 0
36
114 4
43
22 0
00
1 1
67
Petr
ole
um
expl./r
ef./d
istr.
6 3
74
178 8
43
3 0
36
114 4
43
22 0
00
1 1
67
129
129
2.7
565
7.7
2.7
565
7.7
22
72
82
New
World D
evelo
pm
ent C
o., L
td.
Hong K
ong, C
hin
a22
72
82
New
World D
evelo
pm
ent C
o., L
td.
Hong K
ong, C
hin
a 6
147
18 5
35
1 4
30
2 9
95
16 9
49
54 0
00
37.4
863
12.7
6 1
47
18 5
35
1 4
30
2 9
95
16 9
49
54 0
00
37.4
863
12.7
23
77
68
CLP
Hold
ings
23
77
68
CLP
Hold
ings
Hong K
ong, C
hin
aE
lectr
icity,
gas a
nd w
ate
r 6
096
15 9
65
Hong K
ong, C
hin
aE
lectr
icity,
gas a
nd w
ate
r 6
096
15 9
65
1 2
83
4 9
51
1 8
27
6 0
87
31.4
310
30.0
1 2
83
4 9
51
1 8
27
6 0
87
31.4
310
30.0
24
90
40
T24
90
40
Tele
fonos D
e M
exic
o S
.A. D
e C
.V.
Mexic
oele
fonos D
e M
exic
o S
.A. D
e C
.V.
Mexic
oTTTT
Tele
com
munic
ations
Tele
com
munic
ations
5 7
90
24 2
65
4 2
95
16 0
84
16 7
04
76 3
94
24.1
44
73
60.3
5 7
90
24 2
65
4 2
95
16 0
84
16 7
04
76 3
94
24.1
44
73
60.3
25
87
47
Sasol Lim
ited
25
87
47
Sasol Lim
ited
South
Afr
ica
Industr
ial chem
icals
South
Afr
ica
Industr
ial chem
icals
5 7
09
14 7
49
2 9
20
8 8
75
2 2
05
27 9
33
26.5
14
26
53.8
5 7
09
14 7
49
2 9
20
8 8
75
2 2
05
27 9
33
26.5
14
26
53.8
Sourc
e:
UN
CTA
D, W
orld Investm
ent R
eport
2008: Tra
nsnational C
orp
ora
tio
ns a
nd
th
e I
nfr
astr
uctu
re C
halle
nge, annex table
A.I.1
6.
aA
ll data
are
based o
n the c
om
panie
s’ a
nnual re
port
s u
nle
ss o
therw
ise s
tate
d. D
ata
of affili
ate
s a
re f
rom
Dun a
nd B
radstr
eet’s
Who O
wns W
hom
data
base.
bT
NI is
calc
ula
ted a
s the a
vera
ge o
f th
e follo
win
g thre
e r
atios:
fore
ign a
ssets
to tota
l assets
, fo
reig
n s
ale
s to tota
l sale
s, and f
ore
ign e
mplo
ym
ent to
tota
l em
plo
ym
ent.
114 Transnational Corporations, Vol. 17, No. 3 (December2008)
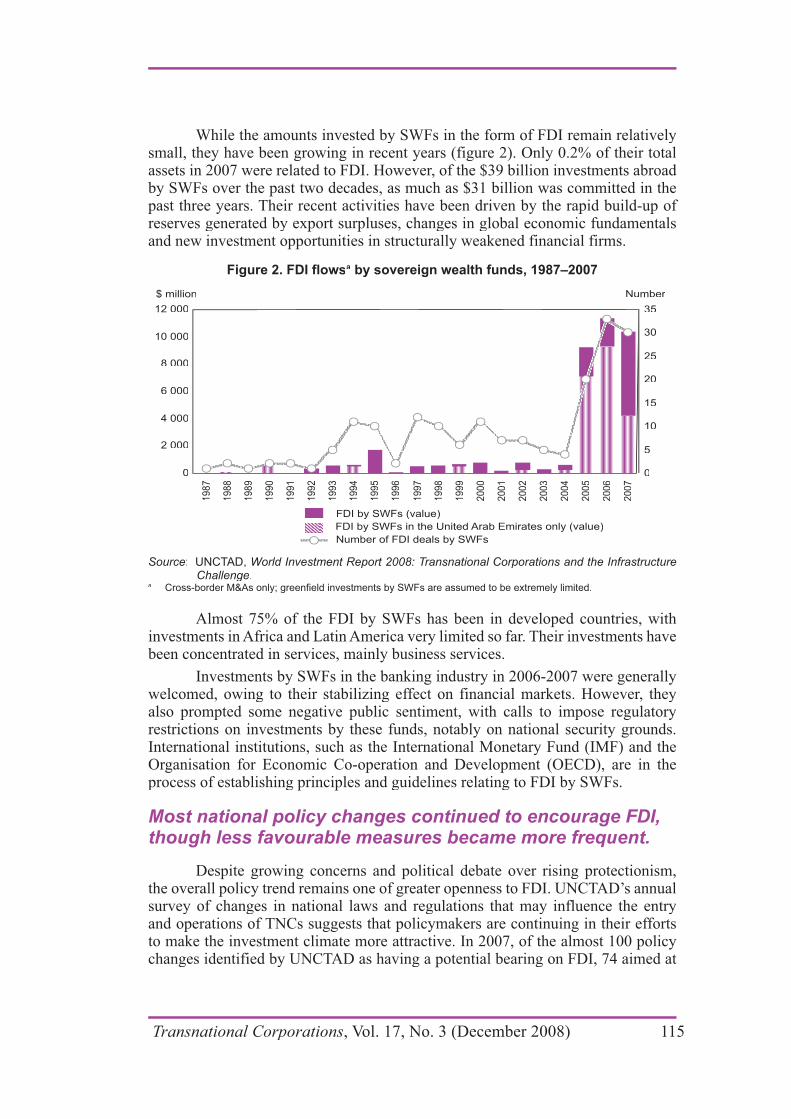
While the amounts invested by SWFs in the form of FDI remain relatively small, they have been growing in recent years (figure 2). Only 0.2% of their total assets in 2007 were related to FDI. However, of the $39 billion investments abroad by SWFs over the past two decades, as much as $31 billion was committed in the past three years. Their recent activities have been driven by the rapid build-up of reserves generated by export surpluses, changes in global economic fundamentals and new investment opportunities in structurally weakened financial firms.
Figure 2. FDI flowsa by sovereign wealth funds, 1987–2007
Source: UNCTAD, World Investment Report 2008: Transnational Corporations and the InfrastructureChallenge.
a Cross-border M&As only; greenfield investments by SWFs are assumed to be extremely limited.
Almost 75% of the FDI by SWFs has been in developed countries, with investments in Africa and Latin America very limited so far. Their investments have been concentrated in services, mainly business services.
Investments by SWFs in the banking industry in 2006-2007 were generally welcomed, owing to their stabilizing effect on financial markets. However, they also prompted some negative public sentiment, with calls to impose regulatory restrictions on investments by these funds, notably on national security grounds. International institutions, such as the International Monetary Fund (IMF) and the Organisation for Economic Co-operation and Development (OECD), are in the process of establishing principles and guidelines relating to FDI by SWFs.
Most national policy changes continued to encourage FDI, though less favourable measures became more frequent.
Despite growing concerns and political debate over rising protectionism, the overall policy trend remains one of greater openness to FDI. UNCTAD’s annual survey of changes in national laws and regulations that may influence the entry and operations of TNCs suggests that policymakers are continuing in their efforts to make the investment climate more attractive. In 2007, of the almost 100 policy changes identified by UNCTAD as having a potential bearing on FDI, 74 aimed at
Transnational Corporations, Vol. 17, No. 3 (December 2008) 115

making the host country environment more favourable to FDI (table 5). However, the proportion of changes that were less favourable to FDI has been increasing over the past few years.
As in 2006, most of the new restrictions introduced were concentrated in the extractive industries, particularly in Latin America (e.g. Bolivia, Ecuador and the Bolivarian Republic of Venezuela), but they were also apparent in other countries as well. Several governments, including those of the United States and the Russian Federation, adopted stricter regulations with regard to investments in projects that have potential implications for national security. Government concerns also appear to be directed towards investments in certain infrastructure areas and those undertaken by State-owned entities.
The number of international investment agreements (IIAs) continued to grow, reaching a total of almost 5,600 at the end of 2007. There were 2,608 bilateral investment treaties (BITs), 2,730 double taxation treaties (DTTs) and 254 free trade agreements (FTAs) and economic cooperation arrangements containing investment provisions. The shift in treaty-making activity from BITs towards FTAs continued, as did the trend towards renegotiation of existing BITs.
The global financial crisis had a limited impact on FDI flows in 2007, but will begin to bite in 2008.
The sub-prime mortgage crisis that erupted in the United States in 2007 has affected financial markets and created liquidity problems in many countries, leading to higher costs of credit. However, both micro- and macroeconomic impacts affecting the capacity of firms to invest abroad appear to have been relatively limited so far. As TNCs in most industries had ample liquidity to finance their investments, reflected in high corporate profits, the impact was smaller than expected. At the macroeconomic level, developed-country economies could be affected both by the slowdown of the United States economy and the impact of the turmoil in the financial markets on liquidity. As a result, both inflows to and outflows from these countries may decline. On the other hand, relatively resilient economic growth in developing economies may counteract this risk.
In addition to the credit crunch in the United States, the global economy was also affected by the significant depreciation of the dollar. While it is difficult to isolate the effects of exchange rate changes from other determinants of FDI flows, the sharp weakening of the dollar helped to stimulate FDI to the United States. European FDI to the United States was spurred by the increased relative wealth of
Table 5. National regulatory changes, 1992–2007
Item 1992 1993 1994 1995 1996 1997 1998 1999 2000 2001 2002 2003 2004 2005 2006 2007
Number of countries thatNumber of countries thatgintroduced changeintroduced change
43 56 49 63 66 76 60 65 70 71 72 82 103 92 91 5843 56 49 63 66 76 60 65 70 71 72 82 103 92 91 58
Number of regulatory changes 77 100 110 112 114 150 145 139 150 207 246 242 270 203 177 98Number of regulatory changes 77 100 110 112 114 150 145 139 150 207 246 242 270 203 177 98
More favourable 77 99 108 106 98 134 136 130 147 193 234 218 234 162 142 74More favourable 77 99 108 106 98 134 136 130 147 193 234 218 234 162 142 74
Less favourable 0 1 2 6 16 16 9 9 3 14 12 24 36 41 35 24Less favourable 0 1 2 6 16 16 9 9 3 14 12 24 36 41 35 24
Source: UNCTAD database on national laws and regulations.
116 Transnational Corporations, Vol. 17, No. 3 (December2008)

European investors and reduced investment costs in the United States. Moreover, companies exporting to the United States have suffered from the exchange rate changes, which have induced them to expand local production in the United States. This is illustrated by changes in the strategy of several European TNCs, particularly carmakers, that plan to build new or expand existing production facilities in that country.
The slowdown in the world economy and the financial turmoil have led to a liquidity crisis in money and debt markets in many developed countries. As a result, M&A activity has decelerated markedly. In the first half of 2008, the value of such transactions was 29% lower than that in the second half of 2007. Corporate profits and syndicated bank loans are also declining. Based on available data, estimated annualized FDI flows for the whole of 2008 are expected to be about $1,600 billion, representing a 10% decline from 2007. Meanwhile, FDI flows to developing countries are likely to be less affected. UNCTAD’s World Investment Prospects Survey, 2008–2010, while also suggesting a rising trend in the medium term, points to a lower level of optimism than was expressed in the previous survey, and to more caution in TNCs’ investment expenditure plans than in 2007.
In Africa, high commodity prices and rising profitability attracted FDI.
In Africa, FDI inflows grew to $53 billion in 2007 – a new record. Booming commodity markets, rising profitability of investments – the highest among developing regions in 2006-2007 – and improved policy environments fuelled inflows. LDCs in Africa also registered another year of growth in their FDI inflows. A large proportion of the FDI projects launched in the region in 2007 were linked to the extraction of natural resources. The commodity price boom also helped Africa to maintain a relatively high level of outward FDI, which amounted to $6 billion in 2007.
Despite higher inflows, Africa’s share in global FDI remained at about 3%. TNCs from the United States and Europe were the main investors in the region, followed by African investors, particularly from South Africa. TNCs from Asia concentrated mainly on oil and gas extraction and infrastructure. Prospects for increased FDI inflows in 2008 are promising in light of the continuing high prices of commodities, large projects already announced for that year and forthcoming payments from previously concluded cross-border M&As. This will signify a fourth consecutive year of FDI growth. The UNCTAD survey shows that almost all TNCs have maintained or even increased their current levels of investment in Africa.
In South, East and South-East Asia and Oceania, both inward and outward FDI flows rose to their highest levels ever.
FDI flows to South, East and South-East Asia and Oceania were also higher than ever before, reaching $249 billion in 2007. Most subregions and economies, except Oceania, received higher inflows. A combination of favourable business perceptions, progress towards further regional economic integration, improved investment environments and country-specific factors contributed to the region’s
Transnational Corporations, Vol. 17, No. 3 (December 2008) 117

performance. China and Hong Kong (China) remained the two top destinations within the region as well as among all developing economies. Meanwhile, India – the largest recipient in South Asia – and most member countries of the Association of Southeast Asian Nations (ASEAN) also attracted larger inflows, as did post-conflict countries and Asian LDCs, such as Afghanistan, Cambodia, Sri Lanka and Timor-Leste.
Overall, prospects for new FDI to the region remain very promising. Sustained economic growth, demographic changes, favourable business sentiments and new investment opportunities were among the main factors contributing to the region’s good performance in 2007, and they should continue to attract FDI in the near future.
FDI outflows from South, East and South-East Asia also reached a new high, amounting to $150 billion, reflecting the growing importance of developing countries as outward investors. Intra- and inter-regional flows are a particularly important feature. But firms are investing in developed countries as well, not least through cross-border M&As. SWFs from the region have emerged as significant investors, contributing to the region’s rapidly growing outward FDI stock: this jumped from $1.1 trillion in 2006 to $1.6 trillion in 2007.
West Asia also saw record flows in both directions…
FDI in West Asia rose by 12% to $71 billion, marking a new record and a fifth consecutive year of growth. More than four fifths of the inflows were concentrated in three countries: Saudi Arabia, Turkey and the United Arab Emirates, in that order. A growing number of energy and construction projects, as well as a notable improvement in the business environment in 2007, attracted FDI into members of the Gulf Cooperation Council (GCC). For example, Qatar experienced a significant rise in inflows – more than seven times higher than in 2006.
FDI outflows from the region in 2007 increased for the fourth consecutive year, to $44 billion – nearly six times its level in 2004. The GCC countries (Kuwait, Saudi Arabia, the United Arab Emirates, Qatar, Bahrain and Oman, in that order) accounted for 94% of these outflows, reflecting in part their desire to diversify away from oil and gas production through investments by SWFs. Intraregional FDI was significant, particularly from oil-rich countries, as confirmed by a growing number of greenfield projects and the increasing value of cross-border M&As.
FDI inflows into West Asia are expected to rise in 2008, as countries in the region have remained largely unaffected by the sub-prime mortgage crisis, and a significant number of intraregional investment projects are in the pipeline.
… while the surge of FDI into Latin America and the Caribbean was mainly driven by the demand for natural resources.
Latin America and the Caribbean saw inflows rise by 36% to a historic high of $126 billion. The increase was the highest in South America (66%), where most of the $72 billion worth of inflows targeted the extractive industries and natural-resource-based manufacturing. Inflows to countries in Central America and the Caribbean (excluding offshore financial centres) increased by 30% to $34 billion,
118 Transnational Corporations, Vol. 17, No. 3 (December2008)
despite the economic slowdown in the United States. This resilience was partly explained by the dynamism of FDI in mining, steel and banking, which are not oriented primarily towards the United States market.
FDI outflows from the region fell by 17% to $52 billion, mainly reflecting a return to more “normal” levels of outward investment from Brazil. Latin American TNCs, mainly from Mexico and Brazil, continued to internationalize, competing for leadership in such industries as oil and gas, metal mining, cement, steel, and food and beverages. In addition, many new Latin American companies began emerging in new sectors such as software, petrochemicals and biofuels.
In the extractive industries, in which FDI increased as a result of the high commodity prices, the picture differed between oil and gas and metal mining. In metal mining, the scope for inward FDI is greater, as there are no major State-owned companies in the region, except Codelco in Chile. In oil and gas, by contrast, the dominant position, or even exclusive presence, of State-owned oil and gas companies limits the opportunities for foreign investors. This situation was accentuated in 2007, as a number of countries, including Bolivia, the Bolivarian Republic of Venezuela and Ecuador, adopted policy changes to increase taxation and further restrict or prohibit foreign investment in oil and gas.
FDI to and from Latin America and the Caribbean is expected to increase further in 2008. Inflows would be driven mainly by South America, where high commodity prices and strong subregional economic growth should continue to boost TNCs’ profits. However, the level of future inflows into Central America and the Caribbean is uncertain, as the slowdown of the United States economy and a weak dollar could adversely affect their export-oriented manufacturing activities. Outflows are expected to be boosted by TNCs in Brazil and Mexico, which have already announced ambitious investment plans for 2008.
FDI to and from South-East Europe and the Commonwealth of Independent States maintained an upward trend and set new records.
As in most other regions, FDI flows to and from South-East Europe and the CIS reached unprecedentedly high levels. Inward FDI rose for a seventh consecutive year, to reach $86 billion – 50% more than in 2006. In the CIS, these inflows were mainly attracted to fast growing consumer markets and natural resources, while those to South-East Europe were associated with privatizations. Inward FDI in the Russian Federation increased by 62%, to $52 billion.
Outward FDI from South-East Europe and the CIS amounted to $51 billion, more than double its 2006 level. FDI from the Russian Federation – the main source country in the region – soared to $46 billion in 2007. Russian TNCs have extended their reach to Africa with the aim of increasing their raw material supplies and their access to strategic commodities. These are needed to support their efforts to increase their downstream presence in the energy industry and their value-added production activities in the metals industry of developed countries.
Whereas most of the national policy changes of the transition economies in 2007 were in the direction of greater openness to FDI, some CIS countries continued to introduce restrictions in the extractive industries and some other
Transnational Corporations, Vol. 17, No. 3 (December 2008) 119
strategic industries. The Russian Federation approved the long-discussed Strategic Sector Law, which specifies industries in which foreign investors are allowed only minority participation. In Kazakhstan, a newly approved natural resources law allows the Government to change existing contracts unilaterally if they adversely affect the country’s economic interests in the oil, metal and mineral industries. Nevertheless, FDI flows are expected to be buoyant in these two countries as well as Ukraine.
In developed countries FDI inflows and outflows appear to have peaked.
Despite concerns over the economic uncertainty faced by some developed economies, FDI inflows to developed countries as a whole surged by 33% in 2007, to reach $1,248 – yet another record. The rise was mainly driven by cross-border M&As, but also by reinvested earnings as a result of high profitability of foreign affiliates. The United States retained its position as the world’s largest FDI recipient country. The restructuring and concentration process in the enlarged common market of the EU countries led to a renewed wave of cross-border acquisitions. Large FDI flows to the United Kingdom, France, the Netherlands and Spain drove overall FDI inflows to the EU to $804 billion – a 43% increase. Japan’s FDI inflows grew strongly for the first time since the end of the 1990s.
Developed countries maintained their position as the largest net outward investors, as outflows soared to a record $1,692 billion – $445 billion. The largest outward investors – the United States, the United Kingdom, France, Germany and Spain (in that order) – accounted for 64% of the total outward FDI of the group.
The policy environment for FDI in a number of developed countries continues to be one of greater openness, with some exceptions. There are, however, growing concerns over the possible negative effects of cross-border investments by SWFs, as well as private equity and hedge funds.
FDI to and from developed countries is expected to fall because of the dampening effects of the financial market crisis, combined with weaker economic growth in these economies. The value of cross-border M&As in developed countries fell considerably in the first half of 2008, compared with the second half of 2007. In UNCTAD’s World Investment Prospects Survey 2008–2010, 39% of the responding TNCs anticipated an increase in FDI inflows into developed countries compared with more than 50% in last year’s survey.
120 Transnational Corporations, Vol. 17, No. 3 (December2008)
TRANSNATIONAL CORPORATIONS AND THE
INFRASTRUCTURE CHALLENGE
There are huge unmet investment needs for infrastructure in developing countries.
The provision of good quality infrastructure is a prerequisite for economic and social development. Indeed, it is considered one of the main preconditions for enabling developing countries to accelerate or sustain the pace of their development and achieve the Millennium Development Goals (MDGs) set by the United Nations.
Moreover, the future investment needs of developing countries in infrastructure far exceed the amounts being invested by governments, the private sector and other stakeholders, resulting in a significant financing gap. On average, according to World Bank estimates, developing countries currently invest annually 3–4% of their GDP in infrastructure; yet they would need to invest an estimated 7–9% to achieve broader economic growth and poverty reduction goals.
Partly because of the scale of investment required in infrastructure, there has been a fundamental change in the role of the State around the world. Governments have opened infrastructure industries and services up to much greater involvement by the private sector – including TNCs. After the Second World War, and until the 1980s, infrastructure industries were by and large the purview of the State, sometimes through corporatized forms, such as State-owned enterprises (SOEs). Since then they have been gradually liberalized, though the pace and degree have varied by industry and country. As a result, the relationship between the State and the private sector has evolved, with the State increasingly assuming the role of regulator of activities performed by private, and often foreign, companies. This new relationship will continue to change in response to technological progress, growing experience with private sector involvement and shifting political priorities.
In addition to developing-country TNCs in infrastructure (mentioned below), “new players” in infrastructure have emerged, including a heterogeneous set of institutions belonging to two broad groups: private equity investors, and State-owned or government-linked entities such as sovereign wealth funds.
WIR08 focuses on economic infrastructure, including electricity, telecommunications, water and sewage, airports, roads, railways and seaports (the last four collectively referred to as transport). Analyses of TNC activities, development effects and policy recommendations need to take into account the main features of these industries. First, infrastructure investments are typically very capital-intensive and complex. Second, infrastructure services often involve (physical) networks, and are frequently oligopolistic or monopolistic in nature. Third, many societies regard access to infrastructure services as a social and political issue. Such services may be considered public goods, in the sense that they should be available to all users, and some, such as water supply, are considered a human right. Fourth, infrastructure industries are a major determinant of the competitiveness of an economy as a whole, and the quality of infrastructure is an important determinant of FDI. Fifth, infrastructure is key to economic development and integration into the world economy.
Transnational Corporations, Vol. 17, No. 3 (December 2008) 121
TNC participation in infrastructure has increased substantially, including in developing and transition economies.
Infrastructure industries account for a rapidly expanding share of the stock of inward FDI. Over the period 1990–2006, the value of FDI in infrastructure worldwide increased 31-fold, to $786 billion, and that in developing countries increased 29-fold, to an estimated $199 billion. Throughout the period it continued to grow in most infrastructure industries: the most significantly in electricity and telecommunications, and much less in transport and water. As a whole, the share of infrastructure in total FDI stock globally currently hovers at close to 10%, compared to only 2% in 1990.
Another measure, foreign investment commitments in private participation in infrastructure (PPI) projects (which include FDI, but also other investments that are an element of concessions), also indicates that TNCs have invested significantly in developing countries. During the period 1996–2006, such commitments amounted to about $246 billion, with a concentration in Latin America and the Caribbean between 1996 and 2000 (the region accounted for 67% of commitments); but since the turn of the century TNCs’ share participation in PPI projects has grown relatively faster in Africa and Asia.
The group of LDCs has remained by and large marginalized in the process of globalization of infrastructure investment, accounting for about 2% of the stock of infrastructure FDI in developing countries in 2006. Their share in the foreign investment commitments in infrastructure industries of developing economies in the period 1996–2006 (of $246 billion) was a little over 5%.
The form of TNC involvement varies considerably by industry. Telecommunications is the only infrastructure industry in which FDI has been the dominant form of TNC entry in developing and transition economies (figure 3). In electricity, concessions were the most frequent modes of entry (62% of the cases), followed by privatizations and greenfield projects (36%) (figure 3). Concessions were also the predominant form of foreign participation in transport infrastructure (more than 80%), and in water (70% of the projects). In addition, the water industry used management and lease contracts relatively frequently (25%) (figure 3).
Developing countries have significant infrastructure TNCs and are becoming prominent investors in other developing countries.
Although developed-country TNCs still dominate in infrastructure industries internationally, there has been a marked rise in involvement by developing-country TNCs. In some industries, such as telecommunications, they have emerged as major players, and in others, such as transport, they have even become world leaders (table 6). Of the top 100 infrastructure TNCs in the world in 2006, 14 were from the United States, 10 from Spain, and 8 each from France and the United Kingdom. However, of the top 100 infrastructure TNCs, no less than 22 were headquartered in a developing or transition economy. The largest number of such firms was from Hong Kong (China) with 5 firms, and Malaysia and Singapore with 3 each.
122 Transnational Corporations, Vol. 17, No. 3 (December2008)
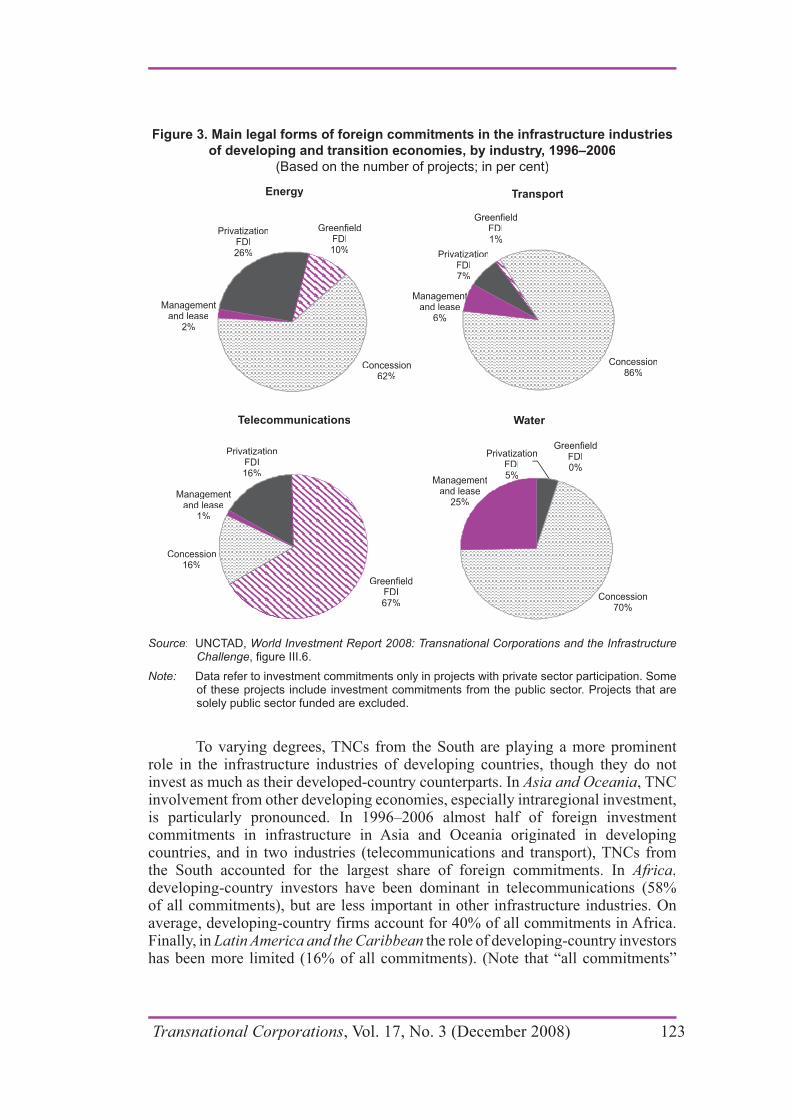
Figure 3. Main legal forms of foreign commitments in the infrastructure industries
of developing and transition economies, by industry, 1996–2006
(Based on the number of projects; in per cent)
Source: UNCTAD, World Investment Report 2008: Transnational Corporations and the InfrastructureChallenge, figure III.6.
Note: Data refer to investment commitments only in projects with private sector participation. Someof these projects include investment commitments from the public sector. Projects that aresolely public sector funded are excluded.
To varying degrees, TNCs from the South are playing a more prominent role in the infrastructure industries of developing countries, though they do not invest as much as their developed-country counterparts. In Asia and Oceania, TNC involvement from other developing economies, especially intraregional investment, is particularly pronounced. In 1996–2006 almost half of foreign investment commitments in infrastructure in Asia and Oceania originated in developing countries, and in two industries (telecommunications and transport), TNCs from the South accounted for the largest share of foreign commitments. In Africa,developing-country investors have been dominant in telecommunications (58% of all commitments), but are less important in other infrastructure industries. On average, developing-country firms account for 40% of all commitments in Africa. Finally, in Latin America and the Caribbean the role of developing-country investors has been more limited (16% of all commitments). (Note that “all commitments”
Transnational Corporations, Vol. 17, No. 3 (December 2008) 123
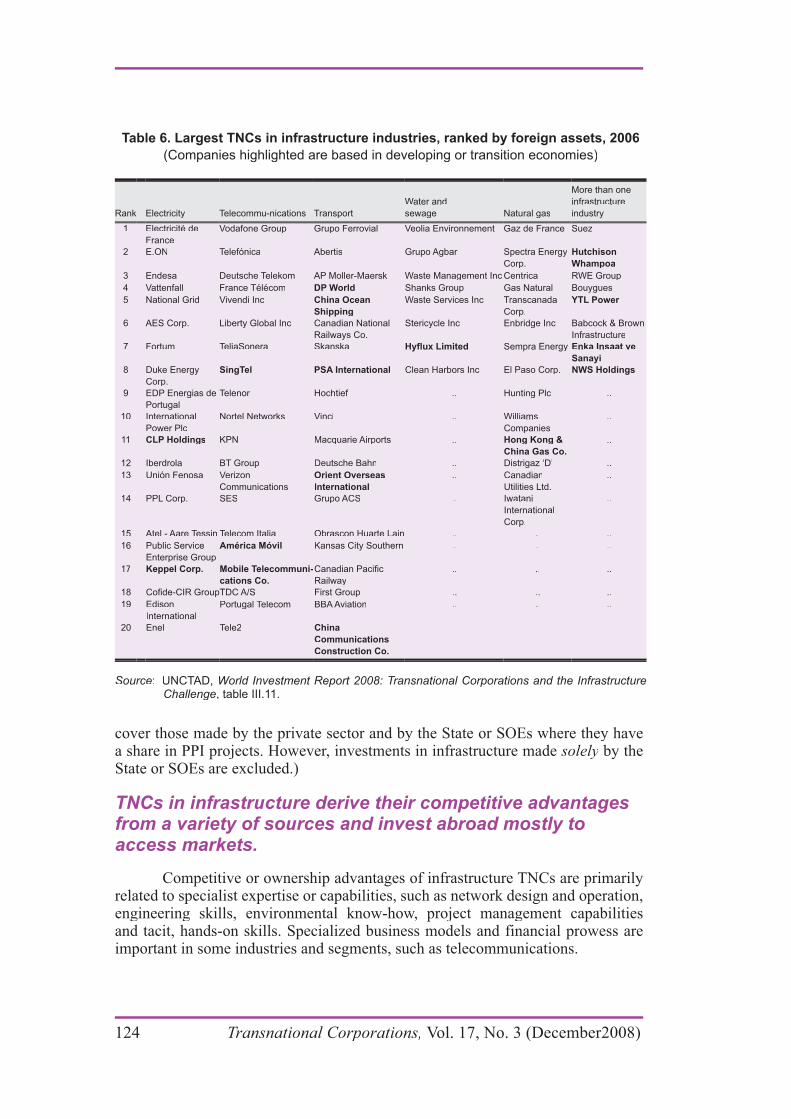
cover those made by the private sector and by the State or SOEs where they have a share in PPI projects. However, investments in infrastructure made solely by theState or SOEs are excluded.)
TNCs in infrastructure derive their competitive advantages from a variety of sources and invest abroad mostly to access markets.
Competitive or ownership advantages of infrastructure TNCs are primarily related to specialist expertise or capabilities, such as network design and operation, engineering skills, environmental know-how, project management capabilities and tacit, hands-on skills. Specialized business models and financial prowess are important in some industries and segments, such as telecommunications.
Table 6. Largest TNCs in infrastructure industries, ranked by foreign assets, 2006
(Companies highlighted are based in developing or transition economies)
Rank Electricity Telecommu-nications Transport
Water and
sewage Natural gas
More than one
infrastructure
industry
1 Electricité de 1 Electricité de
FranceFrance
Vodafone Group Grupo Ferrovial Veolia Environnement Gaz de France SuezVodafone Group Grupo Ferrovial Veolia Environnement Gaz de France Suez
2 E.ON2 E.ON TelefónicaTelefónica AbertisAbertis Grupo AgbarGrupo Agbar Spectra EnergySpectra Energy
Corp.Corp.
HutchisonHutchison
WhampoaWhampoa
3 Endesa Deutsche Telekom AP Moller-Maersk Waste Management Inc Centrica RWE Group3 Endesa Deutsche Telekom AP Moller-Maersk Waste Management Inc Centrica RWE Group
4 Vattenfall France Télécom4 Vattenfall France Télécom DP WorldDP World Shanks Group Gas Natural BouyguesShanks Group Gas Natural Bouygues
5 National Grid Vivendi Inc5 National Grid Vivendi Inc China OceanChina Ocean
ShippingShipping
Waste Services Inc Transcanada Waste Services Inc Transcanada
Corp.Corp.
YTL Power YTL Power
6 AES Corp. Liberty Global Inc Canadian National 6 AES Corp. Liberty Global Inc Canadian National
Railways Co.Railways Co.
Stericycle Inc Enbridge Inc Babcock & Brown Stericycle Inc Enbridge Inc Babcock & Brown
InfrastructureInfrastructure
7 Fortum TeliaSonera Skanska7 Fortum TeliaSonera Skanska Hyflux LimitedHyflux Limited Sempra EnergySempra Energy Enka Insaat veEnka Insaat ve
SanayiSanayi
8 Duke Energy 8 Duke Energy
Corp.Corp.
SingTelSingTel PSA InternationalPSA International Clean Harbors Inc El Paso Corp.Clean Harbors Inc El Paso Corp. NWS HoldingsNWS Holdings
9 EDP Energias de 9 EDP Energias de
PortugalPortugal
TelenorTelenor HochtiefHochtief .... Hunting PlcHunting Plc ....
10 International 10 International
Power PlcPower Plc
Nortel Networks VinciNortel Networks Vinci .... WilliamsWilliams
CompaniesCompanies
....
1111 CLP HoldingsCLP Holdings KPNKPN Macquarie AirportsMacquarie Airports .... Hong Kong &Hong Kong &
China Gas Co.China Gas Co.
....
12 Iberdrola BT Group12 Iberdrola BT Group Deutsche BahnDeutsche Bahn .... Distrigaz ‘D’Distrigaz ‘D’ ....
13 Unión Fenosa Verizon 13 Unión Fenosa Verizon
CommunicationsCommunications
Orient Overseas Orient Overseas
InternationalInternational
.... CanadianCanadian
Utilities Ltd.Utilities Ltd.
....
14 PPL Corp. SES14 PPL Corp. SES Grupo ACSGrupo ACS .... IwataniIwatani
InternationalInternational
Corp.Corp.
....
15 Atel - Aare Tessin Telecom Italia Obrascon Huarte Lain15 Atel - Aare Tessin Telecom Italia Obrascon Huarte Lain .... .... ....
16 Public Service 16 Public Service
Enterprise GroupEnterprise Group
América MóvilAmérica Móvil Kansas City SouthernKansas City Southern .... .... ....
1717 Keppel Corp. Mobile Telecommuni-Keppel Corp. Mobile Telecommuni-
cations Co.cations Co.
Canadian Pacific Canadian Pacific
RailwayRailway
.... .... ....
18 Cofide-CIR GroupTDC A/S18 Cofide-CIR GroupTDC A/S First GroupFirst Group .... .... ....
19 Edison19 Edison
InternationalInternational
Portugal Telecom BBA AviationPortugal Telecom BBA Aviation .... .... ....
20 Enel20 Enel Tele2 Tele2 ChinaChina
CommunicationsCommunications
Construction Co.Construction Co.
.... .... ....
Source: UNCTAD, World Investment Report 2008: Transnational Corporations and the InfrastructureChallenge, table III.11.
124 Transnational Corporations, Vol. 17, No. 3 (December2008)
The majority of infrastructure TNCs invest abroad in order to access the markets of host economies. They aim at benefiting from market opportunities arising from a number of measures, including liberalization and deregulation in host economies, invitations to tender for infrastructure projects, and the opening up of host countries to foreign acquisition of local firms (including privatization and acquisition of private firms). Additional motivations for investment can include following clients in the infrastructure business, searching for economies of scale and taking advantage of regional growth opportunities. The primacy of the host country market as a motive for infrastructure TNC involvement in developing economies places LDCs at a disadvantage in attracting their investment, as they have small markets in general and in infrastructure industries more specifically.
Mobilization of financial resources for infrastructure investment by TNCs is rising, but a vast gap remains.
Financial constraints faced by governments were a major reason for an increasing number of developing countries to open up to FDI and TNC participation in infrastructure industries in the 1990s. Indeed, TNC participation in infrastructure in developing countries has resulted in the inflow of substantial financial resources. As mentioned earlier, the stock of infrastructure FDI in developing countries, an indicator of the extent to which TNC participation mobilizes financial resources, surged after 1990.
In addition, the $246 billion foreign investment commitments in infrastructure in developing countries in the period 1996–2006 represented an average of 29% of all PPI investment commitments. This reflects the importance of TNCs contribution to these industries in developing countries, with the highest share in Africa (36%) (figure 4).
Despite significant levels of TNC investment in developing-country infrastructure, more of it is required to bridge the vast financing gap: there isneed for substantial amounts of additional investment, irrespective of source. For instance, in Africa, total TNC investment commitments in infrastructure during the decade spanning 1996–2006 were $45 billion – an amount (even if fully realized) that is barely equivalent to the region’s current annual infrastructure investment needs of $40 billion.
Across much of Latin America, in a similar vein, investment in infrastructure by foreign companies in the 1990s was connected with a decline in public investment in the sector. In expectation of a large-scale increase in private sector investment, many governments in the region cut back on public expenditure in infrastructure, but the increase in investment by TNCs (and the domestic private sector) did not fully compensate for this decline. An important lesson from this experience is that TNC participation should not be expected to meet a country’s entire investment needs in infrastructure industries; rather, it should be viewed as an important supplement and complement to domestic investments.
Transnational Corporations, Vol. 17, No. 3 (December 2008) 125
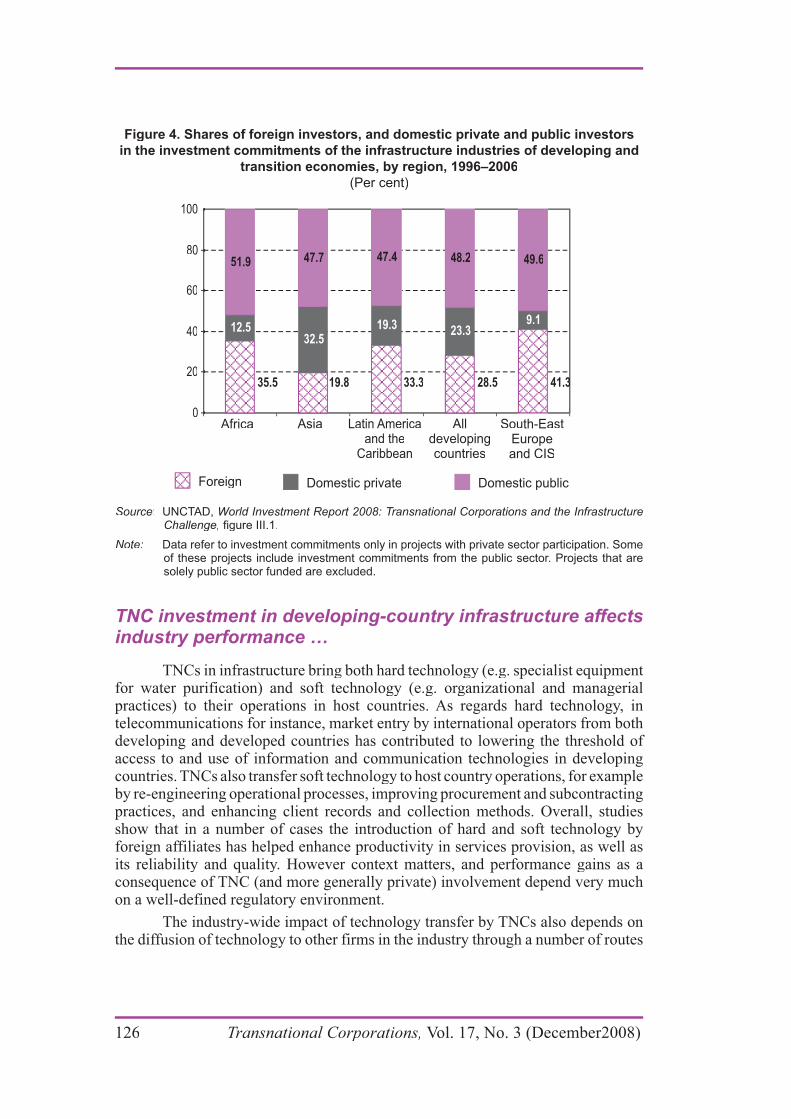
TNC investment in developing-country infrastructure affects industry performance …
TNCs in infrastructure bring both hard technology (e.g. specialist equipment for water purification) and soft technology (e.g. organizational and managerial practices) to their operations in host countries. As regards hard technology, in telecommunications for instance, market entry by international operators from both developing and developed countries has contributed to lowering the threshold of access to and use of information and communication technologies in developing countries. TNCs also transfer soft technology to host country operations, for example by re-engineering operational processes, improving procurement and subcontracting practices, and enhancing client records and collection methods. Overall, studies show that in a number of cases the introduction of hard and soft technology by foreign affiliates has helped enhance productivity in services provision, as well as its reliability and quality. However context matters, and performance gains as a consequence of TNC (and more generally private) involvement depend very much on a well-defined regulatory environment.
The industry-wide impact of technology transfer by TNCs also depends on the diffusion of technology to other firms in the industry through a number of routes
Figure 4. Shares of foreign investors, and domestic private and public investors
in the investment commitments of the infrastructure industries of developing and
transition economies, by region, 1996–2006
(Per cent)
Source: UNCTAD, World Investment Report 2008: Transnational Corporations and the InfrastructureChallenge, figure III.1.
Note: Data refer to investment commitments only in projects with private sector participation. Someof these projects include investment commitments from the public sector. Projects that aresolely public sector funded are excluded.
126 Transnational Corporations, Vol. 17, No. 3 (December2008)

of transmission, including joint ventures, mobility of personnel and demonstration effects. For instance, in China’s electricity generation industry, TNC participation in large joint-venture projects has involved systematic and comprehensive project management cooperation between foreign investors and their Chinese counterparts. This has enabled the latter to enhance their expertise and efficiency. For the effective diffusion of technology from infrastructure TNCs, the existence of capable domestic enterprises is essential.
The higher the contestability of an infrastructure industry, the more likely it is that TNC participation will contribute to enhanced efficiency through increased competition. For example, in many countries, a competitive market structure has been established in telecommunications as a consequence of technological change and industry reforms. In Uganda, for instance, competition between the national provider and TNCs led to price reductions and a rapid increase in penetration of mobile telephony. Cross-country studies have shown the complementarities between privatization and competition: competition increases the gains from privatization, and vice versa.
On the other hand, in water supply, which is an example of an industry that is still essentially a natural monopoly, the entry of TNCs can result in State monopolies being turned into private, foreign-owned monopolies. This limits competition and thus the scope for efficiency enhancement. In other services, while the entry of TNCs can increase competition and thus efficiency, it may also pre-empt the entry of domestic players or crowd out existing ones. In electricity and telecommunications – both relatively contestable industries – the experience of a number of developing countries indicates that infrastructure TNCs in some cases can be associated with anti-competitive behaviour.
In some developing countries where domestic capabilities exist, local private participants can enhance their competitiveness and efficiency by collaborating with TNCs in a variety of ways. For example, partial privatization with minority ownership by TNCs has been implemented by developing countries such as Morocco in telecommunications, with favourable results for competition. As an alternative to TNC involvement, some developing countries have also been able to improve the performance of public utilities through corporatization reforms, without direct TNC participation. However, successful cases are mainly in relatively high-income or large developing economies.
…with implications for the provision of infrastructure services and universal access.
The participation of TNCs has generally increased the supply and improved the quality of infrastructure services in host countries, but their impact on prices has varied. In some instances this has caused concern over services being priced beyond the reach of the poor. In particular, the affordability of services is jointly determined by the price of services and the disposable income of consumers in an economy. The impact of TNC participation on access to services can thus differ among segments of a society: improvements in industry performance do not necessarily translate into increased availability and affordability of services for all members of a society,
Transnational Corporations, Vol. 17, No. 3 (December 2008) 127

especially the poor and people living in rural, remote and economically deprived areas.
Improvements in supply, coverage of services, price and access as a result of TNC participation in developing countries are more pronounced in telecommunications than in any other infrastructure industry, especially in mobile telephony. Many developing countries have experienced a “mobile revolution”: new business models introduced by TNCs have enabled the expansion of mobile services into low-income segments. TNC entry into the transport industry of developingcountries is far more varied than in other areas. International terminal operators, for instance, have considerably improved the quality of services in major ports, and thereby increased developing-country connectivity to the global economy.
In contrast to telecommunications, and to a lesser extent transport, the impact in electricity and water has been mixed. The impact of TNC participation on prices, and thus access to electricity and water, depends on political, social and contractual issues, as well as productivity and efficiency gains. In the absence of government subsidies to users, additions to supply capacity, productivity and efficiency improvements may be insufficient to maintain low prices while covering costs. Prices can continue to be subsidized after entry by the private sector, although countries sometimes raise tariffs both to attract companies and to reduce subsidies.
Evidence from a number of developing countries suggests that greater private sector investment – often with TNC involvement – has in many cases led to increased supply capacity and network connections in electricity, and thereby tosteady improvements in the reliability and quality of service in the industry. Given the many factors involved, electricity prices have sometimes fallen after TNC entry, but overall there has been no definite trend in prices, up or down. The impact of TNC participation on users’ access to water has been disappointing in many instances, rthough there is some evidence that well-designed schemes for TNC participation have led to significant service expansion. Partly because TNC participation has sometimes not met expectations of improved access, there have been cancellations of water concessions in countries such as Argentina, Bolivia and the Philippines.
In summary, in the telecommunications and transport industries, the TNCs have contributed substantially to making services more affordable and accessible. For those services that are considered essential, such as drinking water, if the efficiency improvements achieved by TNCs cannot allow them to maintain pricestat low levels while covering costs, and the government does not provide subsidies to users, access for the poor is affected. Government policies are critical for all infrastructure industries, but, from a social perspective, more so in the case of electricity and water.
Leveraging TNC participation is a complex policy challenge.
Host countries need to consider when it is appropriate to draw TNCs into the development and management of infrastructure. They also need to find ways of ensuring that projects with TNC involvement lead to the expected development effects. This is a complex policy challenge.
As policy priorities and options vary between countries, so too does the optimal mix of public and private (including TNC) investment. Designing and implementing
128 Transnational Corporations, Vol. 17, No. 3 (December2008)
appropriate policies to harness the potential role of TNCs in infrastructure require adequate skills and capabilities. Governments need to prioritize among competing demands for different projects, establish clear and realistic objectives for the projects chosen, and integrate them into broader development strategies. This means that government agencies have to possess the necessary institutional capacity and skills to guide, negotiate, regulate and monitor the projects. This applies not only at the central level, but also at the provincial and municipal levels.
While many developing countries seek foreign investment to develop their physical infrastructure, convincing foreign companies to invest has become even more challenging. Growing demand in the developed world and in large emerging economies is leading potential investors to expect higher returns for a given level of risk. This poses a particular problem where large-scale capital investments are needed up-front, where cost-recovery is difficult to achieve and where social concerns are considerable. Furthermore, project failures and multiple investment disputes have contributed to a more cautious attitude towards infrastructure projects among overseas investors.
Countries seek greater TNC involvement in infrastructure, but openness varies by industry.
The trend towards opening up has been more widespread among developed countries and the relatively advanced developing and transition economies. While the nature of liberalization has varied, all groups of countries are now more welcoming to TNC activities in infrastructure than they were two decades ago.
However, there are significant variations by industry. Openness is the highest in mobile telecommunications, and the lowest in water. Countries are generally more open to TNC involvement in industry segments that are relatively easy to unbundle and expose to competition. Openness also appears to be greater in countries with more developed institutional and regulatory capabilities. At the same time, some governments are becoming more careful about allowing foreign companies to take control of certain infrastructure, including power generation and distribution, port operations and telecommunications. New restrictions have been proposed based on national security or public interest concerns.
These concerns notwithstanding, many countries have moved beyond the removal of barriers to TNC involvement, and are actively promoting it in some areas of infrastructure. Many investment promotion agencies (IPAs) are targeting infrastructure industries. In a survey conducted by UNCTAD and the World Association of Investment Promotion Agencies, about 70% of the IPA respondents stated that they were actively seeking such investment, while only 24% were not. Almost three quarters of the IPAs stated that infrastructure is a more important priority than it was five years ago.
Confirming the broad patterns of openness to TNC involvement, the infrastructure industries most often targeted by IPAs are electricity generation, Internet services and airports. By contrast, the lowest number of IPAs targeted electricity distribution and transmission (table 7). Judging from the patterns of investment in LDCs, there may be a case for low-income countries to target TNCs from other developing countries, especially in transport infrastructure.
Transnational Corporations, Vol. 17, No. 3 (December 2008) 129
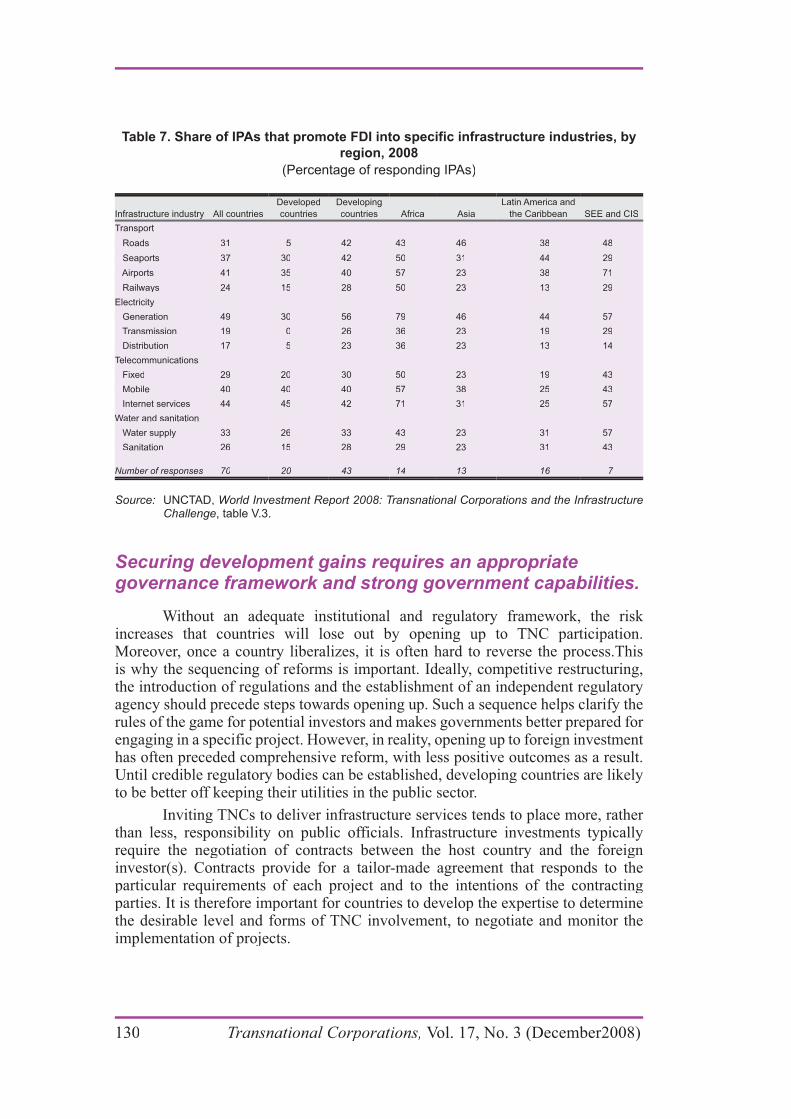
Securing development gains requires an appropriate governance framework and strong government capabilities.
Without an adequate institutional and regulatory framework, the risk increases that countries will lose out by opening up to TNC participation. Moreover, once a country liberalizes, it is often hard to reverse the process.This is why the sequencing of reforms is important. Ideally, competitive restructuring, the introduction of regulations and the establishment of an independent regulatory agency should precede steps towards opening up. Such a sequence helps clarify the rules of the game for potential investors and makes governments better prepared for engaging in a specific project. However, in reality, opening up to foreign investment has often preceded comprehensive reform, with less positive outcomes as a result. Until credible regulatory bodies can be established, developing countries are likely to be better off keeping their utilities in the public sector.
Inviting TNCs to deliver infrastructure services tends to place more, rather than less, responsibility on public officials. Infrastructure investments typically require the negotiation of contracts between the host country and the foreign investor(s). Contracts provide for a tailor-made agreement that responds to the particular requirements of each project and to the intentions of the contracting parties. It is therefore important for countries to develop the expertise to determine the desirable level and forms of TNC involvement, to negotiate and monitor the implementation of projects.
Table 7. Share of IPAs that promote FDI into specific infrastructure industries, by
region, 2008
(Percentage of responding IPAs)
Infrastructure industry All countries
Developed
countries
Developing
countries Africa Asia
Latin America and
the Caribbean SEE and CIS
TransportTransport
Roads Roads 3131 55 42 4342 43 4646 3838 4848
Seaports Seaports 3737 3030 42 5042 50 3131 4444 2929
Airports Airports 4141 3535 40 5740 57 2323 3838 7171
Railways Railways 2424 1515 28 5028 50 2323 1313 2929
ElectricityElectricity
Generation Generation 4949 3030 56 7956 79 4646 4444 5757
Transmission 19 Transmission 19 00 26 3626 36 2323 1919 2929
Distribution Distribution 1717 55 23 3623 36 2323 1313 1414
TelecommunicationsTelecommunications
Fixed Fixed 2929 2020 30 5030 50 2323 1919 4343
Mobile Mobile 4040 4040 40 5740 57 3838 2525 4343
Internet services 44 Internet services 44 4545 42 7142 71 3131 2525 5757
Water and sanitationWater and sanitation
Water supply 33 Water supply 33 2626 33 4333 43 2323 3131 5757
Sanitation Sanitation 2626 1515 28 2928 29 2323 3131 4343
Number of responses 70Number of responses 70 2020 43 1443 14 1313 1616 77
Source: UNCTAD, World Investment Report 2008: Transnational Corporations and the InfrastructureChallenge, table V.3.
130 Transnational Corporations, Vol. 17, No. 3 (December2008)
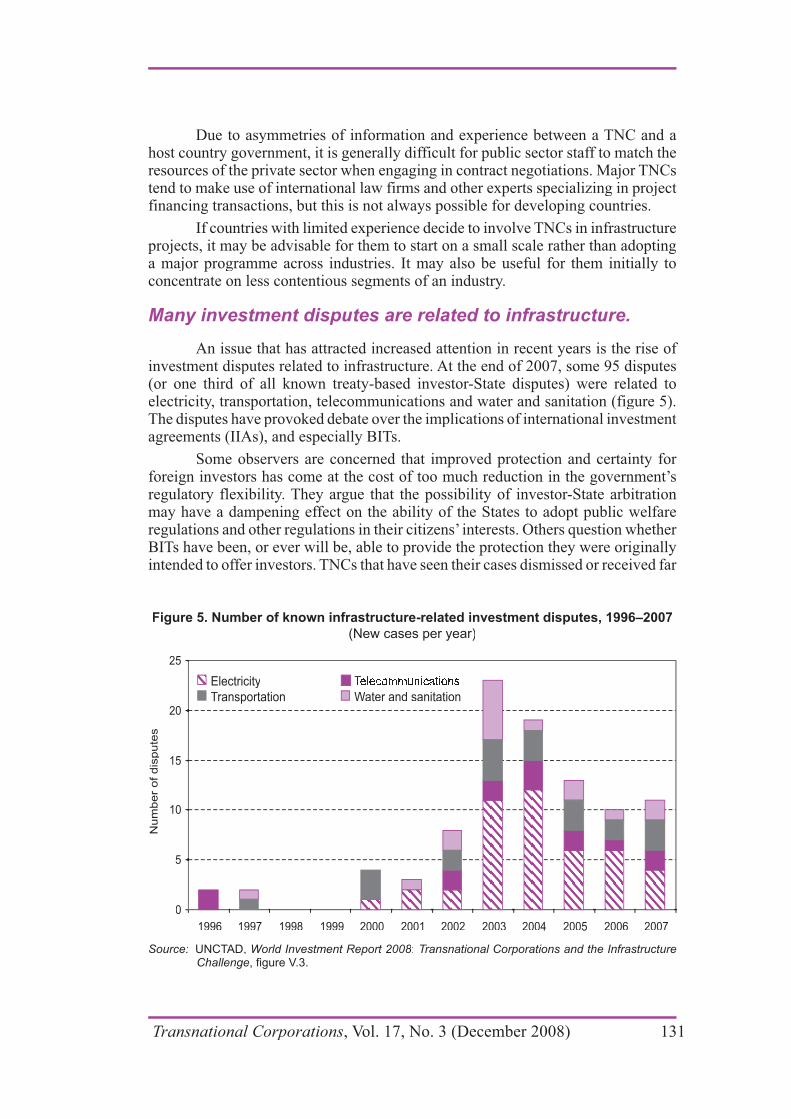
Due to asymmetries of information and experience between a TNC and a host country government, it is generally difficult for public sector staff to match the resources of the private sector when engaging in contract negotiations. Major TNCs tend to make use of international law firms and other experts specializing in project financing transactions, but this is not always possible for developing countries.
If countries with limited experience decide to involve TNCs in infrastructure projects, it may be advisable for them to start on a small scale rather than adopting a major programme across industries. It may also be useful for them initially to concentrate on less contentious segments of an industry.
Many investment disputes are related to infrastructure.
An issue that has attracted increased attention in recent years is the rise of investment disputes related to infrastructure. At the end of 2007, some 95 disputes (or one third of all known treaty-based investor-State disputes) were related to electricity, transportation, telecommunications and water and sanitation (figure 5). The disputes have provoked debate over the implications of international investment agreements (IIAs), and especially BITs.
Some observers are concerned that improved protection and certainty for foreign investors has come at the cost of too much reduction in the government’s regulatory flexibility. They argue that the possibility of investor-State arbitration may have a dampening effect on the ability of the States to adopt public welfare regulations and other regulations in their citizens’ interests. Others question whether BITs have been, or ever will be, able to provide the protection they were originally intended to offer investors. TNCs that have seen their cases dismissed or received far
Figure 5. Number of known infrastructure-related investment disputes, 1996–2007
(New cases per year)
Source: UNCTAD, World Investment Report 2008: Transnational Corporations and the Infrastructure Challenge, figure V.3.
Transnational Corporations, Vol. 17, No. 3 (December 2008) 131
lower compensation than what they had claimed will have found that the protection offered through the BITs was less comprehensive than expected.
A review of arbitration decisions shows that less than half of the awards rendered favoured the claimant, and that damages awarded were considerably smaller than the total claims made by investors. The fact that more than 90 known disputes concerned infrastructure shows that concluding IIAs (and the coexistence of IIAs and State contracts) can have significant implications for host States. At the same time, the number of disputes should be seen in the light of the several thousands of IIAs, and a huge number of investment projects in infrastructure. In addition, if renegotiations of contracts are successful, they do not reach the stage of dispute and arbitration. The complexity of related issues, together with the dynamic evolution of the IIA universe and the international case law, underline the importance of capacity-building to ensure that developing-country governments understand the implications of concluding IIAs. They also need to be better equipped to handle potential investment disputes.
Greater commitments from the international community are needed…
It is important to consider the potential role of home countries and the international community in facilitating more foreign investments into countries that seek such inflows. This is particularly relevant from the perspective of low-income countries, which lack domestic capabilities and have generally failed to attract significant TNC involvement in infrastructure.
Without some form of subsidies, it is difficult to attract TNC investment into economies, communities and industry segments that are characterized by weak purchasing power and poor records of payment. In these cases, development finance institutions can act as catalytic financiers. Especially in such industries as electricity, water and transport, there is significant potential for synergies between foreign investment and overseas development assistance (ODA). By making more funds available, development partners and the home countries of the investing firms could play a major role in helping to “crowd in” foreign investment into infrastructure projects in developing countries.
While development partners have recently scaled up their ODA commitments for infrastructure development, current levels of support have not recovered from the earlier period of declining lending by multilateral banks, and they have not reached the levels promised in various international forums. Moreover, while development partners are yet to provide all the funds pledged to scale up infrastructure investments in low-income countries, existing funds are not being fully used – a situation that can sometimes be referred to as the “infrastructure paradox”. Recent assessments show that the liquidity of development finance institutions is very high.
Development partners should honour their commitments related to ODA for infrastructure. Institutions that provide bilateral or multilateral development finance also need to become more willing to take risk and to allocate a greater share of their activities to the needs of low-income countries. In addition, they should keep all options open. While a strong case can often be made for facilitating greater involvement of the private sector, including TNCs, other approaches should not be
132 Transnational Corporations, Vol. 17, No. 3 (December2008)
ruled out. In some projects, notably in water and some electricity segments, there may be strong arguments for keeping the operation of the services in public hands. But also in other industries, weak institutional capabilities may make private sector involvement too risky. In such situations, international efforts focused on supporting existing public sector producers may be more appropriate. Development partners should therefore give sufficient attention to financing infrastructure projects for which it may not be possible to mobilize private sector involvement.
…including to mitigate risk and build capacity in low-income countries.
Risk-mitigation measures by home countries and international organizations can help in the short term to mobilize private financing of infrastructure projects in developing and transition economies. Special attention may have to be given to measures aimed at mitigating three broad types of risk: political risk (including sub-sovereign and contractual and regulatory risks), credit risk and exchange-rate risks.
Despite the plethora of risk-mitigation instruments available, current programmes are insufficiently tailored to the situation of low-income countries. For example, local currency financing by development finance institutions typically requires a well-established currency swap market. Where such a market exists, intervention by development finance institutions is less likely to be needed. At the same time, risk-mitigation instruments should not be seen as a panacea. Too much risk mitigation may lead to problems of moral hazard and encourage reckless risk-taking on the part of investors and lenders. While risk-mitigation tools can facilitate the mobilization of private debt and equity, they do not make poorly structured projects more viable. This underscores the importance of capacity-building efforts.
Such efforts are especially important in LDCs. Depending on the specific circumstances of each country, assistance may need to be provided for developing legal and regulatory frameworks, assessing different policy and contractual options, preparing project proposals, and monitoring and enforcing laws, regulations and contracts. Considering the nature of the projects, governments at all levels – national, provincial and municipal – are in urgent need of assistance. While positive steps have been taken to meet these needs, current efforts remain vastly insufficient. Disturbingly, funds available for capacity-building are not always fully used.
Advisory services should be geared to providing advice not only on how to encourage investment, but also on how infrastructure can be made to fit into larger development plans and objectives. Most capacity-building support is currently provided by different financing institutions that often have a direct stake in the different projects. It would be worth exploring a more active role for the United Nations in this context. As a neutral party, the organization could complement existing players by, for example, helping developing-country governments in evaluating infrastructure contracts and developing negotiating skills. Improving the ability of governments in these areas should help secure greater development gains from investment inflows.
* * *
Transnational Corporations, Vol. 17, No. 3 (December 2008) 133
The development of physical infrastructure remains one of the most urgent areas for policymakers to address. The needs are huge, and meeting them will require greater use of the private sector, including TNCs. This applies particularly to LDCs, where infrastructure improvements are critical to their attainment of the MDGs. At the same time, low-income countries are often poorly equipped to both attract TNCs into infrastructure and maximize the benefits from TNC involvement. Whatever mix of private and public sector involvement is chosen, adequate institutions and enforcement mechanisms are essential to ensure efficient and equitable delivery of infrastructure services. Meeting the infrastructure challenge requires a concerted effort by all relevant parties. This implies an appropriate combination of improved governance and capabilities in host countries, greater support from the international community and responsible behaviour on the part of the investors.
Geneva, July 2008 Supachai Panitchpakdi
Secretary-General of UNCTAD
134 Transnational Corporations, Vol. 17, No. 3 (December2008)

Transnational Corporations, Vol. 17, No. 3 (December 2008) 135
GUIDELINES FOR CONTRIBUTORS
I. Manuscript preparation
Papers for publication must be in English.
Authors are requested to submit their manuscript by email to [email protected]. The manuscript should be prepared with Microsoft Word (or an application compatible with Word), accompanied by a statement that the text (or parts thereof) has not been published or submitted for publication elsewhere.
If authors prefer to send by post, please send three copies of their manuscripts to: :
The Editor, Transnational CorporationsUNCTADDivision on Investment and Enterprise Palais des NationsCH-1211 Geneva 10Switzerland
Articles should not normally exceed 12,000 words (30 double-spaced pages). All articles should have an abstract not exceeding 150 words. Research notes should be between 4,000 and 6,000 words. Book reviews should be around 1,500 words, unless they are review essays, in which case they may be the length of an article. Footnotes should be placed at the bottom of the page they refer to. An alphabetical list of references should appear at the end of the manuscript. Appendices, tables and figures should be on separate sheets of paper and placed at the end of the manuscript.
Manuscripts should be double-spaced (including references) with wide margins. Pages should be numbered consecutively. The first page of the manuscript should contain: (i) title; (ii) name(s) and institutional affiliation(s) of the author(s); and (iii) mailing address, e-mail address, telephone and facsimile numbers of the author (or primary author, if more than one).
Transnational Corporations has the copyright for all published articles. Authors may reuse published manuscripts with due acknowledgement.

136 Transnational Corporations, Vol. 17, No. 3 (December 2008)
II. Style guide
A. Quotations should be accompanied by the page number(s) from the original source.
B. Footnotes should be numbered consecutively throughout the text with Arabic-numeral superscripts. Important substantive comments should be integrated in the text itself rather than placed in footnotes.
C. Figures (charts, graphs, illustrations, etc.) should have headers, subheaders, labels and full sources. Footnotes to figures should be preceded by lowercase letters and should appear after the sources. Figures should be numbered consecutively. The position of figures in the text should be indicated as follows:
Put figure 1 here
D. Tables should have headers, subheaders, column headers and full sources. Table headers should indicate the year(s) of the data, if applicable. The unavailability of data should be indicated by two dots (..). If data are zero or negligible, this should be indicated by a dash (–). Footnotes to tables should be preceded by lowercase letters and should appear after the sources. Tables should be numbered consecutively. The position of tables in the text should be indicated as follows:
Put table 1 here
E. Abbreviations should be avoided whenever possible, except for FDI (foreign direct investment) and TNCs (transnational corporations).
F. Bibliographical references in the text should appear as: “John Dunning (1979) reported that ...”, or “This finding has been widely supported in the literature (Cantwell, 1991, p. 19)”. The author(s) should ensure that there is a strict correspondence between names and years appearing in the text and those appearing in the list of references. All citations in the list of references should be complete. Names of journals should not be abbreviated. The following are examples for most citations:
Transnational Corporations, Vol. 17, No. 3 (December 2008) 137
Bhagwati, Jagdish (1988). Protectionism (Cambridge, MA: MIT Press).
Cantwell, John (1991). “A survey of theories of international production”, in Christos N. Pitelis and Roger Sugden, eds., The Nature of the Transnational Firm (London: Routledge), pp. 16-63.
Dunning, John H. (1979). “Explaining changing patterns of international production: in defence of the eclectic theory”, Oxford Bulletin of Economics and Statistics, 41 (November), pp. 269-295.
All manuscripts accepted for publication will be edited to ensure conformity with United Nations practice.


Transnational Corporations, Vol. 17, No. 3 (December 2008) 139
READERSHIP SURVEY
Dear Reader,
We believe that Transnational Corporations, already in its fourteenth year of publication, has established itself as an important channel for policy-oriented academic research on issues relating to transnational corporations (TNCs) and foreign direct investment (FDI). But we would like to know what you think of the journal. To this end, we are carrying out a readership survey. And, as a special incentive, every respondent will receive an UNCTAD publication on TNCs! Please fill in the attached questionnaire and send it to:
Readership Survey: Transnational Corporations
The EditorUNCTAD, Room E-9121Palais des NationsCH-1211 Geneva 10SwitzerlandFax: (41) 22 907 0194(E-mail: [email protected])
Please do take the time to complete the questionnaire and return it to the above-mentioned address. Your comments are important to us and will help us to improve the quality of Transnational Corporations. We look forward to hearing from you.
Sincerely yours,
Anne Miroux Editor Transnational Corporations


Transnational Corporations, Vol. 17, No. 3 (December 2008) 141
TRANSNATIONAL CORPORATIONS
Questionnaire
1. Name and address of respondent (optional):
2. In which country are you based?
3. Which of the following best describes your area of work?
Government Public enterprise
Private enterprise Academic or research
Media Other (specify)
4. What is your overall assessment of the contents of Transnational Corporations?
Excellent Adequate
Good Poor
5. How useful is Transnational Corporations to your work?
Very useful Of some use Irrelevant
6. Please indicate the three things you liked most about Transnational Corporations:

142 Transnational Corporations, Vol. 17, No. 3 (December 2008)
7. Please indicate the three things you liked least about Transnational Corporations:
8. Please suggest areas for improvement:
9. Are you a subscriber? Yes No
If not, would you like to become one ($45 per year)? Yes No Please use the subscription form on p. 143).

Transnational Corporations, Vol. 17, No. 3 (December 2008) 143
I wish to subscribe to Transnational Corporations
Name
Title
Organization
Address
Country
Subscription rates for Transnational Corporations (3 issues per year)
1 year US$45 (single issue: US$20)
Payment enclosed
Charge my Visa Master Card American Express
Account No. Expiry Date
United Nations Publications
Sales Section Sales Section
2 UN Plaza Palais des NationsNew York, N.Y. 10017 CH-1211 Geneva 10United States SwitzerlandTel: +1 212 963 8302 Tel: +41 22 917 2615Fax: +1 212 963 3484 Fax: +41 22 917 0027
E-mail: [email protected] E-mail: [email protected]
Is our mailing information correct?
Let us know of any changes that might affect your receipt of Transnational
Corporations
Name
Title
Organization
Address
Country

144 Transnational Corporations, Vol. 17, No. 3 (December 2008)
Printed at United Nations, Geneva United Nations publication
GE.09- – April 2009 – 2,890
ISBN 978-92-1-112762-1
UNCTAD/DIAE/IA/2008/7 (Vol. 17, No. 3) ISSN 1014-9562
For further information on UNCTAD’s work on investment, technology and enterprise development, please visit:
Division on Investment and Enterprise, DIAEhttp://www.unctad.org/diae
Transnational Corporations Journalwww.unctad.org/tnc
FDI Statistics online
World Investment Report www.unctad.org/wir
Advisory Services on Investment and Trainingwww.unctad.org/asit
International Investment Agreementswww.unctad.org/iia
Investment Policy Reviews www.unctad.org/en/investpolicy.en.htm
LDCs Investment Guides www.unctad.org/en/investguide.en.htm
World Association of Investment Promotion Agencies (WAIPA)www.waipa.org
United Nations Conference on Trade and Development, UNCTADwww.unctad.org