VOLUME 15 THE IRISH MARITIME TRANSPORT … IMDO... · 5 Introduction The Irish economy remains...
44
THE IRISH MARITIME TRANSPORT ECONOMIST VOLUME 15
Transcript of VOLUME 15 THE IRISH MARITIME TRANSPORT … IMDO... · 5 Introduction The Irish economy remains...

THE IRISH MARITIME TRANSPORT ECONOMIST
VOLUME 15
The Irish Maritime Development Office
The Irish Maritime Development Office (IMDO) is Ireland’s national dedicated development, promotional and marketing agency for the shipping and shipping services sector.
The IMDO is the Irish government agency which provides support to national and international maritime businesses in Ireland. It is the aim of the IMDO to be the focal point for maritime business in Ireland. The IMDO provides government and industry with a range of information and reporting across the sector and works with international businesses to help them set-up or expand in Ireland. The IMDO is also Ireland’s designated Shortsea Shipping Agency and provides independent advice and guidance on EU funding initiatives.
The IMDO was established by the Fisheries (Amendment) Act 1999, as part of the Marine Institute, under an amendment to the Marine Institute Act 1991 in December 1999. The IMDO commenced operations in July 2000. After subsequent amendment in the Harbours (Amendment) Act 2009 its legislative mandate includes the following functions:
1. To promote and assist the development of Irish shipping and Irish shipping services and seafarer training.
2. To liaise with, support and market the shipping and shipping services sector.
3. To advise the Minister for Transport on the development and co-ordination of policy in the shipping and shipping services sector so as to protect and create employment.
4. To carry out policy as may be specified by the Minister for Transport relating to the shipping and shipping services sector and seafarer training.
5. To advise the Minister for Transport on the development and co-ordination of policy and to carry out policy, as may be specified by that Minister, relating to ports and the ports services sector, and;
6. any additional functions relating to the shipping and shipping services sector conferred on the Institute under section 4(4) of this Act.
Shipping services is defined as: sea routes, ship management, technical management, commercial management, crew management, ship finance and mortgages, marine insurance, maritime legal services, shipbroking and ship chartering.
Editorial Team: Liam Lacey, Ciarán O’ Driscoll, Éamonn O’ Connor, Holly Faulkner, Philip Stephens
IMDOIreland
irishmaritimedevelopment
Published by:
Irish Maritime Development Office Wilton Park House Wilton Place Dublin 2 D02 NT99 Ireland
Tel: +353 1 775 3900 www.imdo.ie [email protected]
DisclaimerThis report has been produced by the Irish Maritime Development Office, a state agency under the auspices of the Department of Transport, Tourism and Sport (DTTAS). Whereas every effort has been made to ensure that information provided in this report is accurate, the IMDO and DTTAS accept no liability whatsoever for loss or damage occasioned, or claimed to have been occasioned, in part or in full as a consequence of any person or corporation acting or refraining from acting, as a result of a matter contained in this publication. All or part of this publication may be reproduced without further permission, provided the source is acknowledged.
The Irish Maritime Transport Economist
Volume 15April, 2018ISSN 1649-5225
2
Ministerial Foreword 3
Introduction 4
Economic ReviewNational Accounts 8Inflation 9Interest Rates 10Exchange Rates 11Oil & Bunker Prices 12
Trade Review (All Modes) External Merchandise Trade: Value 14External Merchandise Trade: Volume 15External Merchandise Trade: Country 16
Irish Ports & Shipping Index - iShip 18
Irish Market ReviewIrish Port Traffic: Total Bulk Volumes 22Dry Bulk 23Liquid Bulk 24Break Bulk 25Lift-On/Lift-Off Market: Ports 26Lift-On/Lift-Off Market: Operators 27Roll-On/Roll-Off Market: Ports 28Roll-On/Roll-Off Market: Operators 29Passenger Traffic 30Cruise Sector 31 Forecasting 32
Global Market ReviewTanker Market 34Dry Bulk Market 35Containership Charter Market 36Deep Sea Container Trades and Freight Rates 37Newbuilding and Demolition Market 38
Glossary of Terms and Sources of Data 39
Technical Note 40
Cont
ents
3
As Minister for Transport, Tourism and Sport, I am pleased to provide the foreword for the 15th edition of the Irish Maritime Transport Economist (IMTE), which charts the development of our strategically important maritime industry.
The value of this publication increases in uncertain times. We rely on its analysis to unravel the implications of the United Kingdom’s decision to leave the European Union. My Department has paid particular attention to investigating how trading patterns between Ireland and the United Kingdom will be affected by customs controls and the follow-on impacts on port operations. The information contained in the IMTE has assisted our deliberations enormously. The IMTE continues to provide policy makers and industry practitioners with accurate and timely information, on which decisions can be made. I would like to thank the staff of the Irish Maritime Development Office, who produce this important reference text.
In 2017, traffic through Irish ports grew by 6% in overall terms, with the iShip Index, an aggregate measure of trade through our ports, returning to levels last recorded in 2007. Our port companies have navigated their way through challenging waters over the past ten years and are emerging stronger and more efficient than ever. There are major development projects underway in Dublin, Cork and Shannon Foynes that will deliver the capacity needed to meet future demand and sustain economic growth. These are high quality projects, supported by the EU through the European Investment Bank and the Ten-T Programme, that will improve efficiency and service standards for port users and position our ports to meet future challenges. Our ports companies are to be commended for the foresight and leadership shown in bringing these projects forward.
Our ports also serve as gateways for tourism and, working closely with shipping companies, offer modern and efficient connections to passengers travelling to and from Ireland. This market is served by national and international shipping companies and in 2017 amounted to more than 4.3 million passengers. In addition, 324 cruise vessels, carrying more than 415,000 passengers, called at Irish ports in 2017, bringing important incremental business to the ports and to hinterland businesses.
Ireland remains highly dependent on maritime transport with more than 90% of our external trade moving through the ports network. Again and again, our ports have demonstrated their resilience in the face of external challenges and the cyclicality of international trade. They will continue to serve the Irish economy by meeting the challenges and availing of the opportunities associated with Brexit. Working closely with officials in my Department, I am confident that our ports will provide an appropriate response, informed by reliable and accurate analysis, such as that provided by the IMTE.
I would like to conclude by recognising the efforts of those involved in the maritime industry in 2017 and by congratulating all concerned on how our national interests have been protected through the careful management and development of the maritime industry.
Shane Ross T.D.Minister for Transport, Tourism and Sport
Min
iste
rial
For
ewor
d
4In
trod
ucti
on Welcome to the 15th edition of the Irish Maritime Transport Economist (IMTE), which tracks the development of Ireland’s maritime industry and highlights the issues that influence the performance of this important industry sector.
As a global industry, shipping is exposed to a range of international factors including fluctuations in world trade, oil prices, charter rates, and the vagaries of economic cycles. Monitoring movements in these variables allows us to place the performance of our national maritime industry in the context of the external forces that impact on our relatively small and open economy. It also allows us to comment on and contextualise the performance of our port and shipping companies and assess how network capacity aligns with forecasted economic growth. The basis for our analysis is a clear understanding of our indigenous maritime sector, which has been facilitated for more than 15 years by the data and analysis presented in the IMTE. The IMTE is a collaborative effort, undertaken jointly by the Irish Maritime Development Office (IMDO) and industry. I would like to take this opportunity to thank the shipping service providers and port companies that contribute so willingly to the collection of our data and as a result, to the publication of the IMTE.
The performance of the Irish maritime industry was influenced by a number of external factors in 2017. The implications of the United Kingdom leaving the EU continue to be felt through exchange rate fluctuations and the uncertainty surrounding the eventual trading relationship that will exist between the UK and EU Member States. Notwithstanding these influences, trade volumes between Ireland and the UK grew by 4.4% in 2017, as reflected in the increase in Roll-on/Roll-off traffic moving through Irish ports. Irish importers and exporters are responding to current uncertainties by examining
the potential of other markets and the logistical and supply chain ramifications that will arise. Concerns have been raised about the likely impacts of Brexit on landbridge traffic and the flexibility that exists within the maritime industry to deal with significant modal shifts. The IMDO has undertaken research to address these concerns, the results of which will be delivered in 2018. Initial indications suggest that Ireland’s maritime industry has sufficient flexibility and resilience to deal with likely outcomes. The impact that Brexit will have on the routing of time-sensitive or cost-sensitive landbridge traffic, needs further examination because of the potential to create disadvantages in certain industry sectors.
The openness of the Irish economy makes its maritime industry susceptible to macro-economic influences, including changes in the general patterns of world trade, charter rates, bunker prices, exchange rates and interest rates. As these factors have stabilised or shown signs of recovery in recent years, geo-political uncertainty has had a more significant effect on the international shipping industry. Protectionist economic policies in the United States, the threat of trade wars, and growing tension in conflict areas, such as the Korean Peninsula, the Middle East and Russia, have contributed to growing concerns about the sustainability of the current recovery. However, the general sentiment in the market is one of conservative optimism that the current growth in world trade can continue. Ireland’s maritime industry stands to benefit from this relatively optimistic outlook.
Key Indicators 2017: GDP: +7.8%GNP: +6.6%
Inflation: 0.3%Merchandise Exports: +4%
Merchandise Imports: -10%Trade Surplus: +4%

5
Intr
oduc
tionThe Irish economy remains heavily dependent on
seaborne transport, with more that 90% of our merchandise trade moving by sea. Our maritime industry has shown itself to be responsive to changing market conditions and capable of flexing capacity to meet demand. It is noteworthy that there are major redevelopment projects underway in our Tier 1 ports. Dublin Port is currently constructing approximately 3km of quay walls and deepening the harbour basin and channel to accommodate larger vessels. The Port of Cork is working towards the relocation of much of the port’s traffic to a purpose built facility in Ringaskiddy that will accommodate larger vessels and increase capacity to meet the growing demands of the region. Shannon Foynes Port Company (SFPC) has, through its Master Planning Exercise, identified opportunities to increase the port’s capacity, particularly in relation bulk cargo flows and recognises the potential that exists within the Shannon Estuary to service the needs of the agricultural and energy sectors amongst others, building on the potential that deep water and available development land can offer various industrial users. Together, Irish ports are preparing for the future and meeting the objectives set out in National Ports Policy (2013) by leading the development of port capacity to facilitate economic growth. For the first time since 2007, the iShip index reached 1,042 points, indicating that our ports are now handling higher volumes than ever before. To meet the growing needs of the economy, our ports have identified commercial opportunities for further expansion and remain open to approaches from industry to examine other projects, including projects not directly related to trade, in areas such as energy generation and general industrial development.
I would like to thank practitioners in the maritime industry for supporting our work and for their broader support for the role that the IMDO plays in realising the ambitions set out in the Government’s integrated plan for the marine industry, Harnessing Our Ocean Wealth. Ireland’s maritime industry faces many challenges, but has established a very good track record in meeting the demands of our growing economy and in capitalising on commercial opportunities that both increase capacity and add to the competitiveness and efficiency of maritime transport. Our ports and shipping companies are to be congratulated on their responsiveness and professionalism.
Finally, I would like to thank our editorial team, Ciarán O’Driscoll, Éamonn O’Connor, Holly Faulkner and Philip Stephens for their professionalism and application in compiling the data and in bringing the 15th edition of this publication to fruition.
Liam Lacey Director Irish Maritime Development Office
5
Key Indicators 2017: LoLo Traffic: +4%RoRo Traffic: +4%
Passenger Traffic: <1%iShip Index: +6%Bulk Traffic: 0%

ECONOMIC REVIEW
8Ec
onom
ic
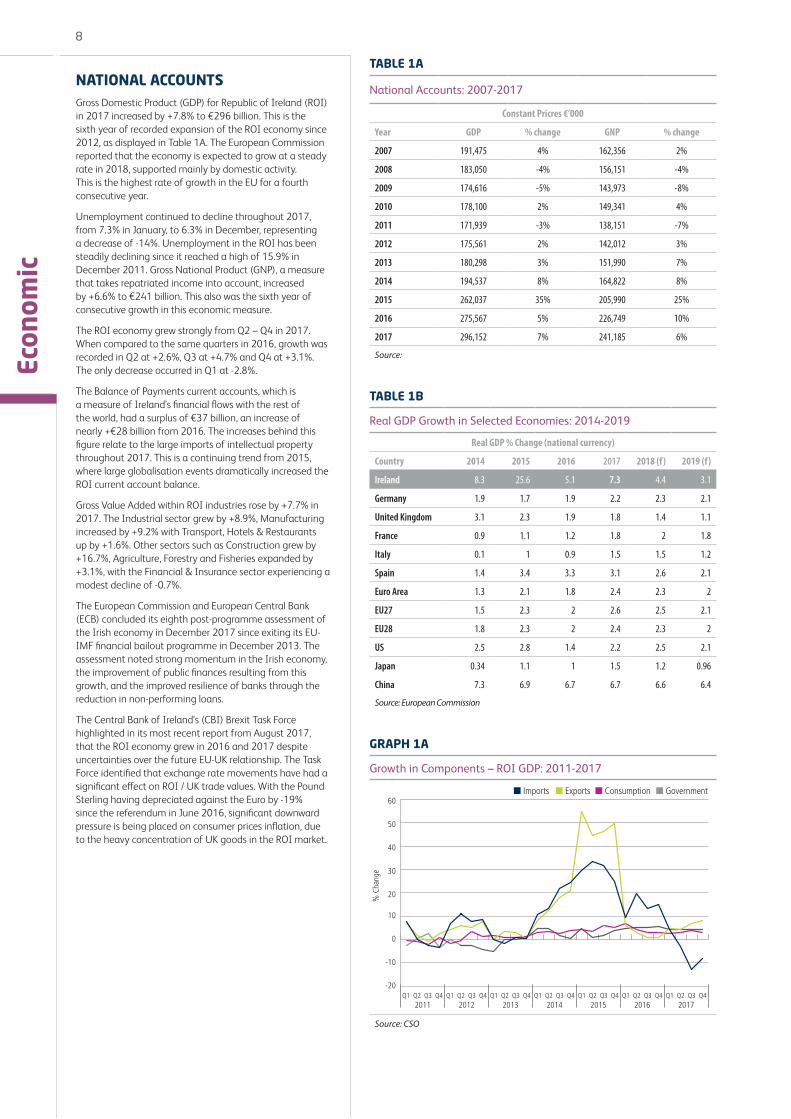
NATIONAL ACCOUNTSGross Domestic Product (GDP) for Republic of Ireland (ROI) in 2017 increased by +7.8% to €296 billion. This is the sixth year of recorded expansion of the ROI economy since 2012, as displayed in Table 1A. The European Commission reported that the economy is expected to grow at a steady rate in 2018, supported mainly by domestic activity. This is the highest rate of growth in the EU for a fourth consecutive year.
Unemployment continued to decline throughout 2017, from 7.3% in January, to 6.3% in December, representing a decrease of -14%. Unemployment in the ROI has been steadily declining since it reached a high of 15.9% in December 2011. Gross National Product (GNP), a measure that takes repatriated income into account, increased by +6.6% to €241 billion. This also was the sixth year of consecutive growth in this economic measure.
The ROI economy grew strongly from Q2 – Q4 in 2017. When compared to the same quarters in 2016, growth was recorded in Q2 at +2.6%, Q3 at +4.7% and Q4 at +3.1%. The only decrease occurred in Q1 at -2.8%.
The Balance of Payments current accounts, which is a measure of Ireland’s financial flows with the rest of the world, had a surplus of €37 billion, an increase of nearly +€28 billion from 2016. The increases behind this figure relate to the large imports of intellectual property throughout 2017. This is a continuing trend from 2015, where large globalisation events dramatically increased the ROI current account balance.
Gross Value Added within ROI industries rose by +7.7% in 2017. The Industrial sector grew by +8.9%, Manufacturing increased by +9.2% with Transport, Hotels & Restaurants up by +1.6%. Other sectors such as Construction grew by +16.7%, Agriculture, Forestry and Fisheries expanded by +3.1%, with the Financial & Insurance sector experiencing a modest decline of -0.7%.
The European Commission and European Central Bank (ECB) concluded its eighth post-programme assessment of the Irish economy in December 2017 since exiting its EU-IMF financial bailout programme in December 2013. The assessment noted strong momentum in the Irish economy, the improvement of public finances resulting from this growth, and the improved resilience of banks through the reduction in non-performing loans.
The Central Bank of Ireland’s (CBI) Brexit Task Force highlighted in its most recent report from August 2017, that the ROI economy grew in 2016 and 2017 despite uncertainties over the future EU-UK relationship. The Task Force identified that exchange rate movements have had a significant effect on ROI / UK trade values. With the Pound Sterling having depreciated against the Euro by -19% since the referendum in June 2016, significant downward pressure is being placed on consumer prices inflation, due to the heavy concentration of UK goods in the ROI market.
TABLE 1A
National Accounts: 2007-2017
Constant Pricres €’000
Year GDP % change GNP % change
2007 191,475 4% 162,356 2%
2008 183,050 -4% 156,151 -4%
2009 174,616 -5% 143,973 -8%
2010 178,100 2% 149,341 4%
2011 171,939 -3% 138,151 -7%
2012 175,561 2% 142,012 3%
2013 180,298 3% 151,990 7%
2014 194,537 8% 164,822 8%
2015 262,037 35% 205,990 25%
2016 275,567 5% 226,749 10%
2017 296,152 7% 241,185 6%
Source:
TABLE 1B
Real GDP Growth in Selected Economies: 2014-2019
Real GDP % Change (national currency)
Country 2014 2015 2016 2017 2018 (f) 2019 (f)
Ireland 8.3 25.6 5.1 7.3 4.4 3.1
Germany 1.9 1.7 1.9 2.2 2.3 2.1
United Kingdom 3.1 2.3 1.9 1.8 1.4 1.1
France 0.9 1.1 1.2 1.8 2 1.8
Italy 0.1 1 0.9 1.5 1.5 1.2
Spain 1.4 3.4 3.3 3.1 2.6 2.1
Euro Area 1.3 2.1 1.8 2.4 2.3 2
EU27 1.5 2.3 2 2.6 2.5 2.1
EU28 1.8 2.3 2 2.4 2.3 2
US 2.5 2.8 1.4 2.2 2.5 2.1
Japan 0.34 1.1 1 1.5 1.2 0.96
China 7.3 6.9 6.7 6.7 6.6 6.4
Source: European Commission
GRAPH 1A
Growth in Components – ROI GDP: 2011-2017
-20
-10
0
10
20
30
40
50
60
Q4Q3Q2Q1Q4Q3Q2Q1Q4Q3Q2Q1Q4Q3Q2Q1Q4Q3Q2Q1Q4Q3Q2Q1Q4Q3Q2Q1
Imports ConsumptionExports Government
% C
hang
e
201320122011 2014 2015 20172016
Source: CSO
9
Econ
omic
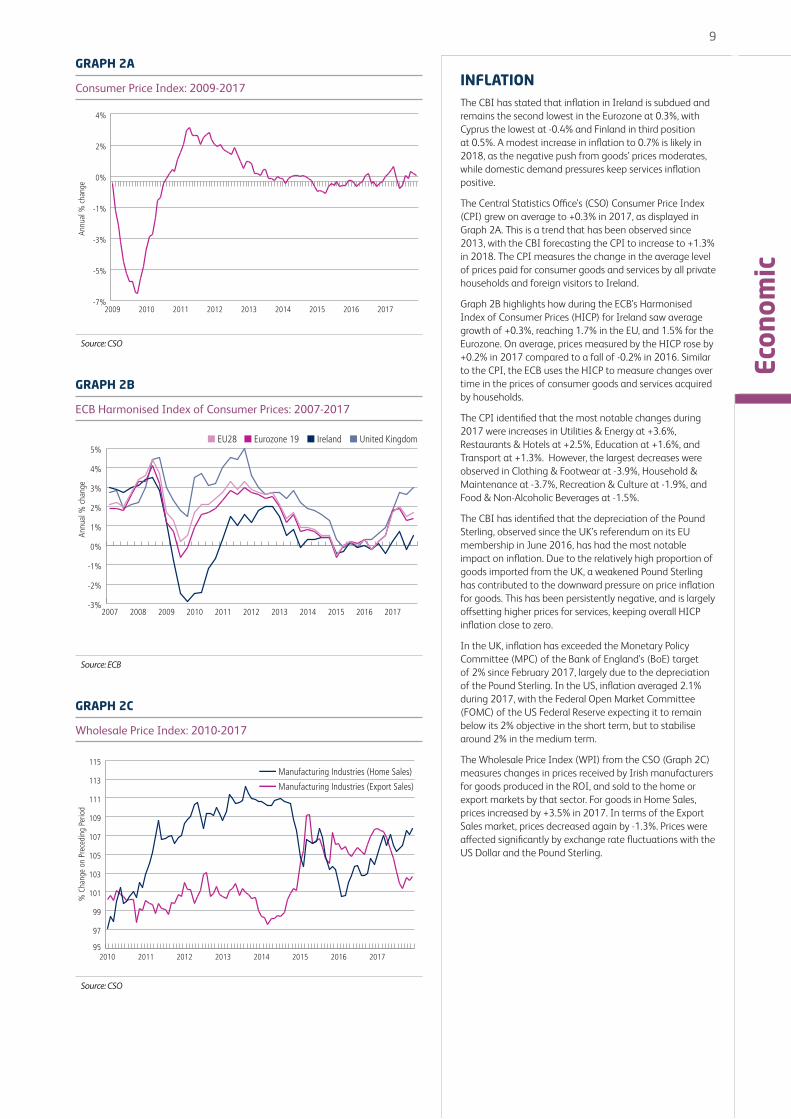
INFLATIONThe CBI has stated that inflation in Ireland is subdued and remains the second lowest in the Eurozone at 0.3%, with Cyprus the lowest at -0.4% and Finland in third position at 0.5%. A modest increase in inflation to 0.7% is likely in 2018, as the negative push from goods’ prices moderates, while domestic demand pressures keep services inflation positive.
The Central Statistics Office’s (CSO) Consumer Price Index (CPI) grew on average to +0.3% in 2017, as displayed in Graph 2A. This is a trend that has been observed since 2013, with the CBI forecasting the CPI to increase to +1.3% in 2018. The CPI measures the change in the average level of prices paid for consumer goods and services by all private households and foreign visitors to Ireland.
Graph 2B highlights how during the ECB’s Harmonised Index of Consumer Prices (HICP) for Ireland saw average growth of +0.3%, reaching 1.7% in the EU, and 1.5% for the Eurozone. On average, prices measured by the HICP rose by +0.2% in 2017 compared to a fall of -0.2% in 2016. Similar to the CPI, the ECB uses the HICP to measure changes over time in the prices of consumer goods and services acquired by households.
The CPI identified that the most notable changes during 2017 were increases in Utilities & Energy at +3.6%, Restaurants & Hotels at +2.5%, Education at +1.6%, and Transport at +1.3%. However, the largest decreases were observed in Clothing & Footwear at -3.9%, Household & Maintenance at -3.7%, Recreation & Culture at -1.9%, and Food & Non-Alcoholic Beverages at -1.5%.
The CBI has identified that the depreciation of the Pound Sterling, observed since the UK’s referendum on its EU membership in June 2016, has had the most notable impact on inflation. Due to the relatively high proportion of goods imported from the UK, a weakened Pound Sterling has contributed to the downward pressure on price inflation for goods. This has been persistently negative, and is largely offsetting higher prices for services, keeping overall HICP inflation close to zero.
In the UK, inflation has exceeded the Monetary Policy Committee (MPC) of the Bank of England’s (BoE) target of 2% since February 2017, largely due to the depreciation of the Pound Sterling. In the US, inflation averaged 2.1% during 2017, with the Federal Open Market Committee (FOMC) of the US Federal Reserve expecting it to remain below its 2% objective in the short term, but to stabilise around 2% in the medium term.
The Wholesale Price Index (WPI) from the CSO (Graph 2C) measures changes in prices received by Irish manufacturers for goods produced in the ROI, and sold to the home or export markets by that sector. For goods in Home Sales, prices increased by +3.5% in 2017. In terms of the Export Sales market, prices decreased again by -1.3%. Prices were affected significantly by exchange rate fluctuations with the US Dollar and the Pound Sterling.
GRAPH 2A
Consumer Price Index: 2009-2017
-7%
-5%
-3%
-1%
0%
2%
4%
201720162015201420132012201120102009
Annu
al %
cha
nge
Source: CSO
GRAPH 2B
ECB Harmonised Index of Consumer Prices: 2007-2017
Annu
al %
cha
nge
-3%
-2%
-1%
0%
1%
2%
3%
4%
5%
20172016201520142013201220112010200920082007
Eurozone 19 Ireland United KingdomEU28EU28
Source: ECB
GRAPH 2C
Wholesale Price Index: 2010-2017
Manufacturing Industries (Home Sales)
Manufacturing Industries (Export Sales)
95
97
99
101
103
105
107
109
111
113
115
20172016201520142013201220112010
% C
hang
e on
Pre
cedi
ng P
erio
d
Source: CSO
10Ec
onom
ic
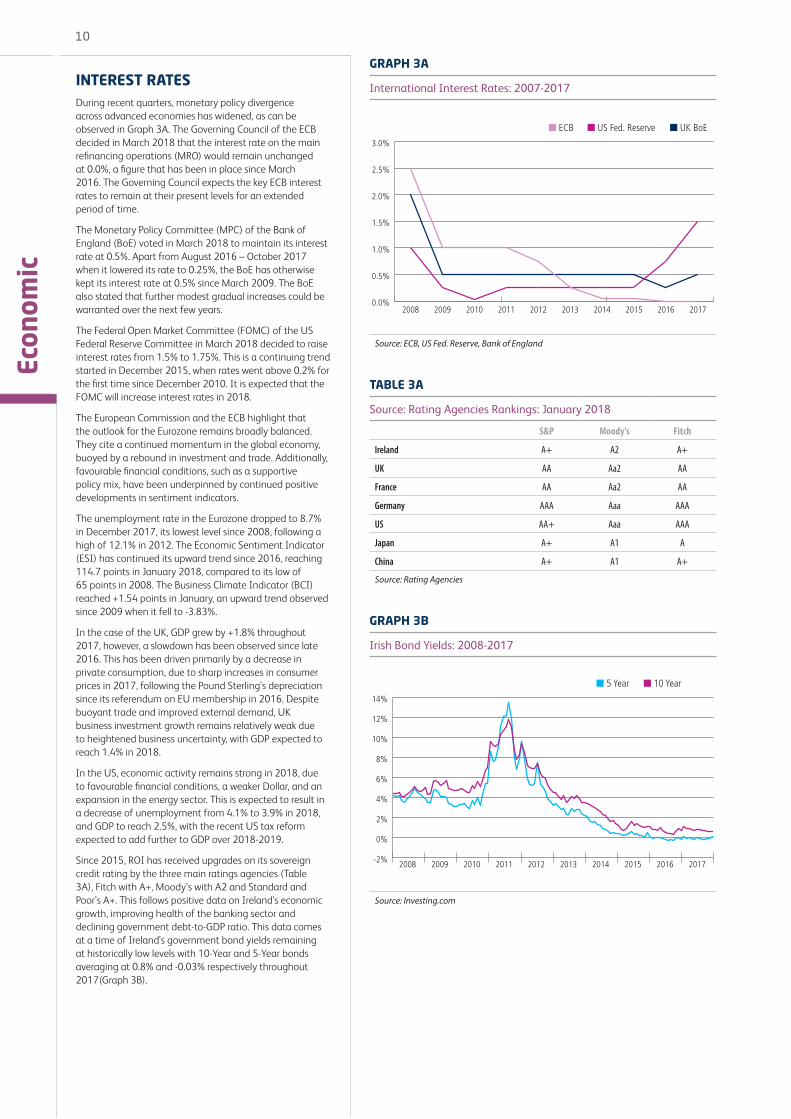
INTEREST RATESDuring recent quarters, monetary policy divergence across advanced economies has widened, as can be observed in Graph 3A. The Governing Council of the ECB decided in March 2018 that the interest rate on the main refinancing operations (MRO) would remain unchanged at 0.0%, a figure that has been in place since March 2016. The Governing Council expects the key ECB interest rates to remain at their present levels for an extended period of time.
The Monetary Policy Committee (MPC) of the Bank of England (BoE) voted in March 2018 to maintain its interest rate at 0.5%. Apart from August 2016 – October 2017 when it lowered its rate to 0.25%, the BoE has otherwise kept its interest rate at 0.5% since March 2009. The BoE also stated that further modest gradual increases could be warranted over the next few years.
The Federal Open Market Committee (FOMC) of the US Federal Reserve Committee in March 2018 decided to raise interest rates from 1.5% to 1.75%. This is a continuing trend started in December 2015, when rates went above 0.2% for the first time since December 2010. It is expected that the FOMC will increase interest rates in 2018.
The European Commission and the ECB highlight that the outlook for the Eurozone remains broadly balanced. They cite a continued momentum in the global economy, buoyed by a rebound in investment and trade. Additionally, favourable financial conditions, such as a supportive policy mix, have been underpinned by continued positive developments in sentiment indicators.
The unemployment rate in the Eurozone dropped to 8.7% in December 2017, its lowest level since 2008, following a high of 12.1% in 2012. The Economic Sentiment Indicator (ESI) has continued its upward trend since 2016, reaching 114.7 points in January 2018, compared to its low of 65 points in 2008. The Business Climate Indicator (BCI) reached +1.54 points in January, an upward trend observed since 2009 when it fell to -3.83%.
In the case of the UK, GDP grew by +1.8% throughout 2017, however, a slowdown has been observed since late 2016. This has been driven primarily by a decrease in private consumption, due to sharp increases in consumer prices in 2017, following the Pound Sterling’s depreciation since its referendum on EU membership in 2016. Despite buoyant trade and improved external demand, UK business investment growth remains relatively weak due to heightened business uncertainty, with GDP expected to reach 1.4% in 2018.
In the US, economic activity remains strong in 2018, due to favourable financial conditions, a weaker Dollar, and an expansion in the energy sector. This is expected to result in a decrease of unemployment from 4.1% to 3.9% in 2018, and GDP to reach 2.5%, with the recent US tax reform expected to add further to GDP over 2018-2019.
Since 2015, ROI has received upgrades on its sovereign credit rating by the three main ratings agencies (Table 3A), Fitch with A+, Moody’s with A2 and Standard and Poor’s A+. This follows positive data on Ireland’s economic growth, improving health of the banking sector and declining government debt-to-GDP ratio. This data comes at a time of Ireland’s government bond yields remaining at historically low levels with 10-Year and 5-Year bonds averaging at 0.8% and -0.03% respectively throughout 2017(Graph 3B).
GRAPH 3A
International Interest Rates: 2007-2017
0.0%
0.5%
1.0%
1.5%
2.0%
2.5%
3.0%
2017201620152014201320122011201020092008
US Fed. Reserve UK BoEECBECB
Source: ECB, US Fed. Reserve, Bank of England
TABLE 3A
Source: Rating Agencies Rankings: January 2018
S&P Moody's Fitch
Ireland A+ A2 A+
UK AA Aa2 AA
France AA Aa2 AA
Germany AAA Aaa AAA
US AA+ Aaa AAA
Japan A+ A1 A
China A+ A1 A+
Source: Rating Agencies
GRAPH 3B
Irish Bond Yields: 2008-2017
-2%
0%
2%
4%
6%
8%
10%
12%
14%
10 Year5 Year5 Year
201320122011201020092008 2014 2015 20172016
Source: Investing.com

11
Econ
omic
EXCHANGE RATESFollowing downward trends in the wake of the global financial crisis in 2008, the Euro posted gains across leading currencies in 2017, as can be observed in Table 4A. On average, the value of the Euro grew +1.8% against both the US Dollar and Swiss Franc, to $1.12 and CHF1.11 respectively, by +3.6% against the Chinese Yuan at ¥7.62, and +5.4% aganist the Japanese Yen at ¥126.71.
However, the biggest increase for the value of the Euro within the main global currencies was against the Pound Sterling, where the Euro grew by +7.4% to £0.87 on average throughout 2017. This builds on the +12.5% increase recorded since the UK voted to end its membership of the EU in June 2016.
In August, the Euro broke through the $1.20 barrier against the US Dollar for the first time since January 2015. It also reflects doubts that the new US Administration would be able to push through its pro-growth and pro-inflation policies, which had initially allowed the US Dollar to strengthen earlier in 2017.
The latest Harmonised Competitiveness Index (HCI - Graph 4B) data for November 2017, from the CBI, show that the nominal HCI increased by +3.5% on an annual basis. Figures for the HCI are trade weighted exchange figures that provide comparable measures of the price and cost competitiveness of Eurozone countries. These developments suggest a decline in competitiveness in Ireland, linked to the exchange rate movements, although weakness in consumer price inflation is offsetting some of this fall.
The Euro has appreciated by more than +2% in nominal effective terms since November 2016 against the Pound Sterling (Graph 4A), driven by stronger-than-expected economic growth, lower political uncertainty, and expectations of a faster pace of monetary policy normalisation. At the same time, the euro has appreciated by about 7% against the US dollar.
However, the ECB has found that risks to the Eurozone’s economic recovery are most likely to arise from the external environment. The US might decide to tighten its monetary policy, due to stimulus-driven inflation surprises, the uncertain outcome to Brexit negotiations, or risks related to geopolitical tensions in the Middle East and the Korean peninsula, which appear to have increased.
TABLE 4A
Selected Exchange Rates: Annual Averages (Units per Euro)
Annual Averages
Year USD GBP CNY CHF JPY
2007 1.37 0.68 10.41 1.64 161.25
2008 1.47 0.79 10.22 1.58 152.46
2009 1.39 0.89 9.52 1.51 130.34
2010 1.32 0.85 8.97 1.38 116.24
2011 1.39 0.86 8.99 1.23 110.96
2012 1.28 0.81 8.1 1.2 102.49
2013 1.32 0.84 8.16 1.23 129.66
2014 1.32 0.8 8.18 1.21 140.31
2015 1.1 0.72 6.97 1.06 134.31
2016 1.1 0.81 7.35 1.09 120.2
2017 1.12 0.87 7.62 1.11 126.71
Source: Central Bank of Ireland
GRAPH 4A
Euro Exchange Rates: 2007-2017
0.6
0.8
1.0
1.2
1.4
1.6US Dollar ($) Pound Sterling (£)
2013201220112010200920082007 2014 2015 20172016
Source: Central Bank of Ireland
GRAPH 4B
HCI – Ireland: 2007-2017
60.00
70.00
80.00
90.00
100.00
110.00
120.00
130.00
140.00
20172016201520142013201220112010200920082007
Real HCI - Deflated by GDPReal HCI - Deflated by whole economy Unit Labout Costs
Source: Central Bank of Ireland

12Ec
onom
ic
OIL AND BUNKER PRICESAfter five years of price decreases Brent crude increased by +22% in 2017, averaging $55.60 per barrel (/bbl). From a high of $111.30 /bbl in 2008, by 2016 Brent crude oil had declined -59% to $45.43 /bbl. However, in May the Organisation of the Petroleum Exporting Countries (OPEC) decided to limit production in order to reduce oil inventory and promote price growth. Furthermore, in November, OPEC agreed to cut 1.8 million barrels from the global market through to the end of 2018.
This was achieved despite a considerable drop in Venezuela’s oil production, to its lowest levels since 2003, due to the ongoing political and economic instability there. Disruption to the North Sea’s Forties crude oil pipeline system, one of the primary distribution networks for Brent crude delivery in the North Sea, saw supply curtailed, driving price increases.
A survey by Reuters News Agency in December 2017 from leading economists and analysts, stated that Brent crude oil will reach an average of $59.88 /bbl throughout 2018. This matches similar forecasts by the US’s Energy Information Administration (EIA), who expect Brent crude oil to average at $60 /bbl in 2018, and $61 /bbl in 2019.
Similarly, the annual average for West Texas Intermediate (WTI) grew by +18% in 2017 to $50.90 /bbl compared to 2016. With the EIA expecting it to be $4 /bbl lower than Brent crude oil prices in 2018 and 2019. This is based on the assumption that current transportation constraints, from the Cushing storage hub in Oklahoma to the US Gulf Coast, will gradually lessen.
The annual average price for the Intermediate Fuel Oil (IFO) benchmark 380 centi-Stoke (cSt) Rotterdam grew by +43% to $305.22 /tonne in 2017 compared to the previous year. The Los Angeles price exceeded this, growing by +44% at $338.05 /tonne, while Singapore grew by +41% averaging at $328.72 /tonne. Just as Brent crude oil prices grew following OPEC’s decision, in particular after its meeting in May 2017, a similar effect was observed in the bunker markets, which frequently mirrors the patterns of the Brent crude market.
As observed in other commodities, the Marine Gas Oil (MGO) mirrors price changes across the market. When compared to 2016, the benchmark MGO Rotterdam grew +22% to produce an average price of $473.58 /tonne throughout 2017. Increases were observed for Los Angeles, expanding by +17% to $555.21 /tonne, and Singapore witnessing a price increase of +23% to $493.01/tonne.
In an attempt to reduce sulphur emissions from the global maritime shipping industry, the International Maritime Organisation’s (IMO) Marine Environmental Protection Committee decided in London on October 2016, to implement global sulphur limit reductions from 3.5% to 0.5% by 2020. According to the IMO, this is a demonstration of a clear commitment to ensure global shipping meets its environmental obligations and targets. However, the Financial Times (30.05.2017) reported that this pending change in bunker fuel standards threatens to increase fuel prices, possibly pushing up freight rates.
TABLE 5A
Bunker Prices: 2007-2017 (IFO 380 cSt $/Tonne)
Year Rotterdam L.A. Singapore
2007 345.06 381.66 382.82
2008 471.91 524.54 505.62
2009 353.81 375.12 371.87
2010 450.23 468.83 464.14
2011 617.94 655.87 646.94
2012 639.64 681.37 664.06
2013 594.8 631.43 615.93
2014 532.14 568.31 559.68
2015 264.15 288 291.6
2016 213.11 233.97 232.76
2017 305.22 338.05 328.72
Source: Clarksons
GRAPH 5A
Bunker & Oil Prices: 2013-2017
100.00
200.00
300.00
400.00
500.00
600.00
700.00
800.00
20.00
40.00
60.00
80.00
100.00
120.00
140.00Rotterdam 380cst Bunker Price ($/tonne)
$/To
nne
$/Ba
rrel
Brent Crude Oil Price ($/bbl)
2013201220112010200920082007 2014 2015 20172016
Source: Clarksons
GRAPH 5B
Oil Prices ($): 2007-2017
20.00
40.00
60.00
80.00
100.00
120.00
140.00OPEC Basket Price WTIBrent CrudeBrent Crude
2013201220112010200920082007 2014 2015 20172016
Source: Clarksons

TRADE REVIEW (ALL MODES)
14Tr
ade
TABLE 6A
ROI External Merchandise Trade Growth (Value): 2007-2017
Year Exports (€m)
Imports (€m)
Trade Surplus
(€m)
%Export Change
%Import Change
%Trade Surplus
Change
2007 89,363 65,286 24,077 4% 3% 5%
2008 87,604 58,716 28,888 -2% -10% 20%
2009 86,786 47,698 39,088 -1% -19% 35%
2010 89,963 48,093 41,870 4% 1% 7%
2011 93,164 52,936 40,228 4% 10% -4%
2012 93,507 55,057 38,450 0.40% 4% -4%
2013 89,182 54,722 34,460 -5% -1% -11%
2014 92,616 60,865 31,751 4% 11% -8%
2015 112,407 70,111 42,296 21% 15% 39%
2016 116,916 69,604 47,312 4% -1% 7%
2017 122,138 76,889 45,249 4% 10% -4%
Source: CSO
TABLE 6B
ROI External Merchandise Trade by Commodity Group (Value): 2016-2017
Exports Imports
Commodity Group (€m) % Change
2016
% Share 2017
(€m) % Change
2016
% Share 2017
Food & Live Animals 11,354 12% 9% 7,158 7% 9%
Beverages & Tobacco 1,360 2% 1% 900 -1% 1%
Crude Materials 1,803 18% 1% 869 9% 1%
Mineral Fuel & Lubricants 1,025 48% 1% 4,679 24% 5%
Animal & vegtable Oils 93 19% 1% 262 8% 1.00%
Chemicals & Pharmaceuticals 67,768 2% 55% 17,435 17% 23%
Manfactured Goods 2,266 6% 2% 5,038 6% 7%
Machinery & Transport Equipment 20,501 -4% 17% 30,007 -5% 39%
Misc. Manfactured Articles 14,834 1% 12% 8,262 0% 11%
Other Commodities 1,132 17% 1% 2,180 2% 3%
Total 122,138 4% 100% 76,889 10% 100%
Source: CSO
GRAPH 6A
ROI External Merchandise Trade (Value): 2007-2017
40,000
60,000
80,000
100,000
120,000
140,000
160,000
180,000
200,000
220,000
20172016201520142013201220112010200920082007
Valu
e (€
m)
Imports Exports Total
Source: CSO
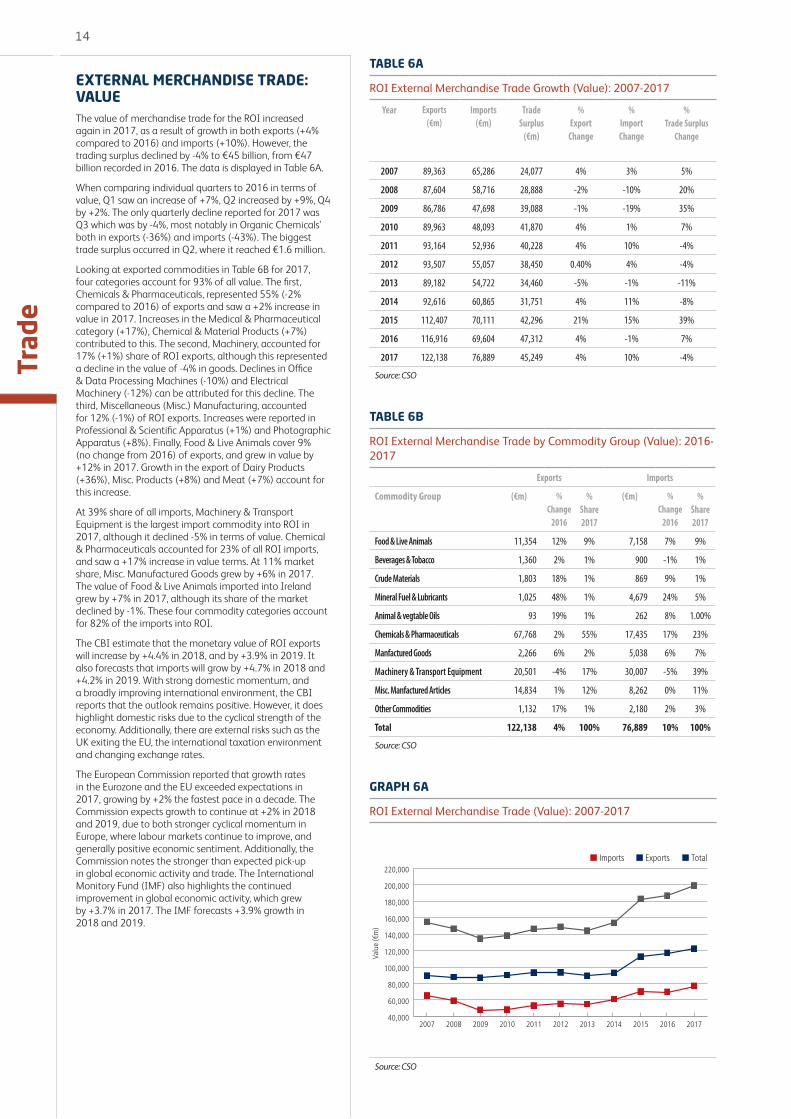
EXTERNAL MERCHANDISE TRADE: VALUEThe value of merchandise trade for the ROI increased again in 2017, as a result of growth in both exports (+4% compared to 2016) and imports (+10%). However, the trading surplus declined by -4% to €45 billion, from €47 billion recorded in 2016. The data is displayed in Table 6A.
When comparing individual quarters to 2016 in terms of value, Q1 saw an increase of +7%, Q2 increased by +9%, Q4 by +2%. The only quarterly decline reported for 2017 was Q3 which was by -4%, most notably in Organic Chemicals’ both in exports (-36%) and imports (-43%). The biggest trade surplus occurred in Q2, where it reached €1.6 million.
Looking at exported commodities in Table 6B for 2017, four categories account for 93% of all value. The first, Chemicals & Pharmaceuticals, represented 55% (-2% compared to 2016) of exports and saw a +2% increase in value in 2017. Increases in the Medical & Pharmaceutical category (+17%), Chemical & Material Products (+7%) contributed to this. The second, Machinery, accounted for 17% (+1%) share of ROI exports, although this represented a decline in the value of -4% in goods. Declines in Office & Data Processing Machines (-10%) and Electrical Machinery (-12%) can be attributed for this decline. The third, Miscellaneous (Misc.) Manufacturing, accounted for 12% (-1%) of ROI exports. Increases were reported in Professional & Scientific Apparatus (+1%) and Photographic Apparatus (+8%). Finally, Food & Live Animals cover 9% (no change from 2016) of exports, and grew in value by +12% in 2017. Growth in the export of Dairy Products (+36%), Misc. Products (+8%) and Meat (+7%) account for this increase.
At 39% share of all imports, Machinery & Transport Equipment is the largest import commodity into ROI in 2017, although it declined -5% in terms of value. Chemical & Pharmaceuticals accounted for 23% of all ROI imports, and saw a +17% increase in value terms. At 11% market share, Misc. Manufactured Goods grew by +6% in 2017. The value of Food & Live Animals imported into Ireland grew by +7% in 2017, although its share of the market declined by -1%. These four commodity categories account for 82% of the imports into ROI.
The CBI estimate that the monetary value of ROI exports will increase by +4.4% in 2018, and by +3.9% in 2019. It also forecasts that imports will grow by +4.7% in 2018 and +4.2% in 2019. With strong domestic momentum, and a broadly improving international environment, the CBI reports that the outlook remains positive. However, it does highlight domestic risks due to the cyclical strength of the economy. Additionally, there are external risks such as the UK exiting the EU, the international taxation environment and changing exchange rates.
The European Commission reported that growth rates in the Eurozone and the EU exceeded expectations in 2017, growing by +2% the fastest pace in a decade. The Commission expects growth to continue at +2% in 2018 and 2019, due to both stronger cyclical momentum in Europe, where labour markets continue to improve, and generally positive economic sentiment. Additionally, the Commission notes the stronger than expected pick-up in global economic activity and trade. The International Monitory Fund (IMF) also highlights the continued improvement in global economic activity, which grew by +3.7% in 2017. The IMF forecasts +3.9% growth in 2018 and 2019.

15
Trad
e
TABLE 7A
ROI External Merchandise Trade Growth (Volume): 2007-2017
Year Exports -Tonnes (000s)
Imports -Tonnes (000s)
Trade Balance - Tonnes
(000s)
%Export Change
%Import Change
%Trade
Balance Change
2007 13,918 41,474 -27,556 0% 9% 14%
2008 14,000 38,196 -24,195 1% -8% -12%
2009 12,369 32,814 -20,444 -12% -14% -16%
2010 13,885 35,150 -21,264 12% 7% 4%
2011 15,017 34,165 -19,148 8% -3% -10%
2012 15,728 34,007 -18,278 5.00% 0% -5%
2013 15,672 36,602 -20,930 0% 8% 15%
2014 16,714 36,385 -19,671 7% -1% -6%
2015 18,551 39,061 -20,510 11% 7% 4%
2016 18,825 38,676 -19,851 1% -1% -3%
2017 18,398 40,176 -21,778 -2% 4% 10%
Source: CSO
TABLE 7B
ROI External Merchandise Trade by Commodity Group (Volume): 2016-2017
Exports Imports
Commodity group Tonnes (000s)
% Change
2016
% Share 2017
Tonnes (000s)
% Change
2016
% Share 2017
Food & Live Animals 4,250 10% 23% 8,547 10% 21%
Beverages & Tobacco 820 -2% 4% 791 -6% 2%
Crude Materials 4,550 -13% 25% 8,146 7% 20%
Mineral Fuel & Lubricants 2,748 -1% 14% 13,269 1% 34%
Animal & vegtable Oils 126 -3% 1% 293 -1% 1.00%
Chemicals & Pharmaceuticals 1,209 7% 7% 3,791 6% 9%
Manfactured Goods 3,903 3% 21% 3,301 6% 8%
Machinery & Transport Equipment 418 8% 2% 968 -2% 2%
Misc. Manfactured Articles 312 -9% 2% 976 4% 2%
Other Commodities 102 -74% 1% 47 284% 1%
Total 18,398 -2% 100% 40,176 5% 100%
Source: CSO
GRAPH 7A
ROI External Merchandise Trade (Volume): 2007-2017
10,000
15,000
20,000
25,000
30,000
35,000
40,000
45,000
50,000
55,000
60,000
20172016201520142013201220112010200920082007
Volu
me
- Ton
nes
(000
s)
Imports Exports Total
Source: CSO
EXTERNAL MERCHANDISE TRADE: VOLUMEIn terms of the volume of ROI’s exports, trade declined -2% in 2017 to 18.3 million tonnes, down slightly from 18.8 million tonnes in 2016, as displayed in Table 7A. The volume of imports into ROI increased +5% to 40.1 million tonnes, up from the 38.6 million tonnes recorded in 2016. These trends resulted in an expansion of the trade imbalance to -21.7 million tonnes, the largest this decade even exceeding the previous high of -21.2 million tonnes in 2010.
The comparison of individual quarters to those in 2016 in terms of volume shows growth across Q1, Q3 and Q4. Q1 grew by +4%, Q3 by +5% and Q4 by +1%, with Q2 declining by -1%.
Three commodity categories were responsible for 83% in the volume of all ROI exports in 2017, as can be observed in Table 7B. Crude Materials held the largest share of export volumes at 25% (-2% compared to 2016), with volumes declining -13% in 2017. Reductions in Crude Fertilisers & Minerals by -47% and in Metalliferous Ores & Metal Scrap by -1% contributed to this decline.
Food & Live Animals represented 23% (+4% compared to 2016) of exports volumes, and expanded +10%, the highest rate in this category. Growth in Meat (+5%) and Dairy & Egg Products (+18%), contributed to the growth of this category in 2017.
At 21%, Manufactured Goods was the third largest export category from ROI, with overall volumes increasing +3% in 2017. Mineral Fuel and Lubricants declined by -1% in its overall volume, which also resulted in a -1% decline in its share of this market to 14%.
The import market had Mineral Fuel & Lubricants as its largest category at 34% (-3% compared to 2016), growing by +1% in terms of value. Food & Live Animals was the second largest commodity category in 2017 at 21% (+2% compared to 2016). Imports for this category grew by +10%, with increases of imports in Cereals (+17%) and Animal Feed (+9%) contributing strongly to this trend.
Crude Minerals had a 20% share of the volume of imports into ROI in 2017 (-2% compared to 2016). Volumes for this market segment increased by +7%, with Crude Fertilisers & Minerals (+17%) and Metalliferous Ores & Metal Scrap (+2%) driving growth.
There are noticeable differences in the volume and values of exports and imports. While Chemicals & Pharmaceuticals represented 55% in the value of ROI exports, it accounted for 7% in terms of volume. Although Crude Materials account for 25% of the value in ROI exports, its total volume only came to only 1%.

16Tr
ade
EXTERNAL MERCHANDISE TRADE: COUNTRYTable 8A highlights how the value of Ireland’s trade, both exports and imports, with the EU accounted for 54% of total trade, at €108 billion in 2017, with non-EU trade representing the remaining 46% worth €91 billion. The percentage of trade that Ireland did with both EU and non-EU countries, remained the same in 2017, as in 2016.
In terms of the value of EU trade, the UK, including Northern Ireland, continues to be the largest market for ROI. The UK accounted for 26% of ROI’s exports within the EU (+2% compared to 2016), a total of €16 billion. For imports, the figure from the UK is higher at 39% (+3%), at €17 billion.
The US continues to be the largest market outside the EU, accounting for 56% of exports in 2017 (+4% compared to 2016), totalling €33 billion. The US accounted for nearly half of ROI’s non-EU imports at 49% (+3%), representing €15 billion in value terms.
Exports of ROI products are split almost evenly between the EU at 51% (€62 billion) and non-EU at 49% (€59 billion). Including the UK, four Member States account for 72% of ROI’s EU exports, Belgium at 21% (€13 billion), Germany at 16% (€9 billion) and the Netherlands at 9% (€5 billion). The US, with a 56% share, and four other non-EU countries account for 77% of ROI’s non-EU exports, Switzerland at 10% (€6 billion), China at 7% (€4 billion), Japan at 4% (€2 billion) and Mexico at 2% (€1.4 billion).
The EU market accounts for 59% of ROI’s imports, while non-EU markets accounted for 41%. Including the UK, four Member States make up 80% share of ROI’s EU imports, with France at 21% (€9 billion), Germany at 15% (€6 billion) and the Netherlands at 5% (€2 billion). The US, together with three other non-EU countries amount to 71% of imports into ROI, with China at 14% (€14 billion), and Japan and Norway each representing 4% (€1 billion).
The remaining 18 Member States of Eurozone, accounted for 66% (-2% compared to 2016) of ROI exports within the EU at €41 billion (+2%). ROI imports from the Eurozone came to €23 billion (no change compared to 2016), that represented 52% (-2%) of the total.
Cross border trade with Northern Ireland accounted for 3% of all ROI trade within the EU in 2017. At just over €3 billion, both exports and imports with Northern Ireland represented 3% of each category in terms of ROI’s overall EU trade.
For ROI trade flows in terms of volume, a greater weight is given to the EU which accounted for 67%, and non-EU at 33%. The UK accounted for 34% of all EU trade volumes, followed by the Netherlands at 5%, France at 4%, with Germany and Spain at 2% each. For non-EU trade flows, the market is not as concentrated, with Guinea at 6%, the US at 5%, Norway at 4%, Brazil at 3% and Russia at 2%.
TABLE 8A
External Merchandise Trade – EU and non-EU Value: 2016-2017
Country Exports €’000 % of Total Imports €’000 % of Total TotalEU 62,689 51 45,350 54 108,040non-EU 59,448 49 31,538 46 90,987Total 122,137 100 76,888 100 199,027Source: CSO
TABLE 8B
EU External Merchandise Trade – Value: 2017
Country Exports €’000 % Imports €’000 %UK 16,000 26 17,730 39Belgium 13,331 21 9,563 21Germany 9,995 16 6,686 15Netherlands 5,894 9 2,324 5Eurozone 41,577 66 23,678 52Total EU 62,689 45,350Source: CSO
TABLE 8C
Non-EU External Merchandise Trade – Value: 2017
Country Exports €’000 % Imports €’000 %US 33,196 56 15,602 49Switzerland 6,211 10 4,354 14China 4,378 7 1,193 4Japan 2,364 4 1,130 4Mexico 1,427 2 971 3Non-EU Total 59,448 31,538Source: CSO
GRAPH 8A
EU and non-EU External Merchandise Trade – Volume: 2017
Rest of EU
France
United KingdomNetherlands
GermanySpain
34%
56% 3%3%
2%2%
Rest of Non-EU
Norway
GuineaUnited States
BrazilRussia
EU
EU NON-EU11%
63%
9%
8%
5%
4%
Non-EU
Source: CSO

iSHIP INDEX

18Ir
ish
Ship
ping
Inde
x
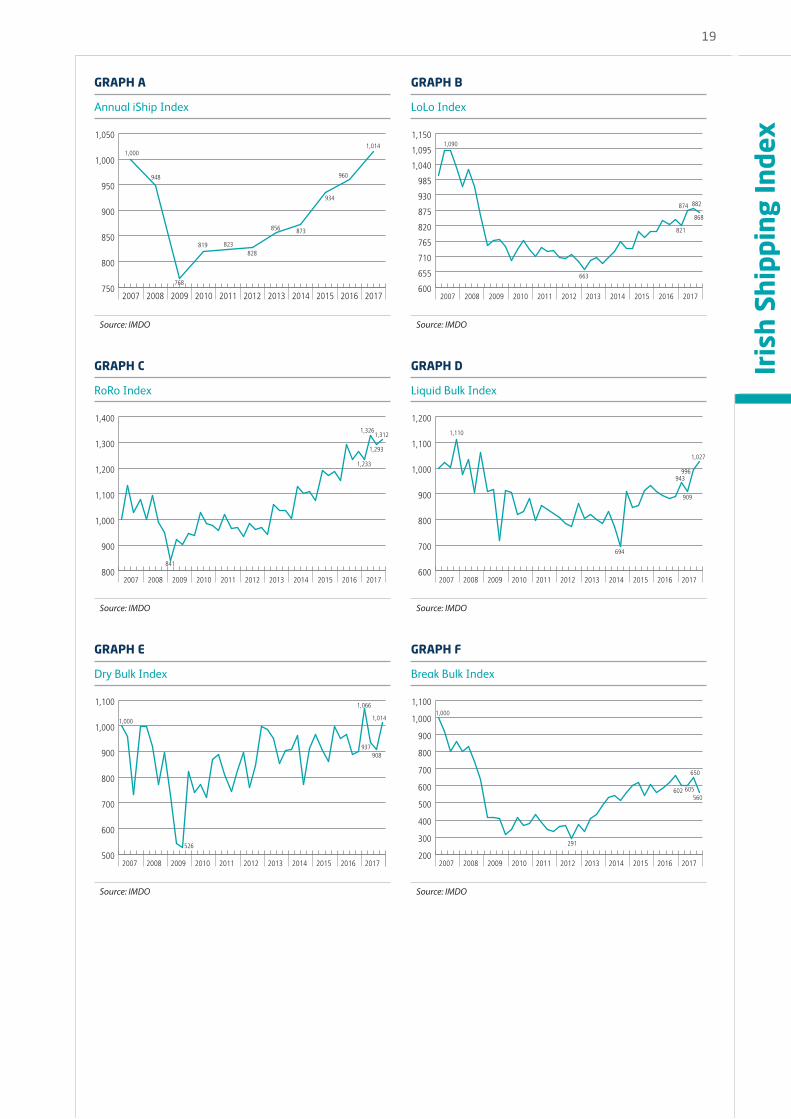
iSHIP INDEXThe iShip Index is a quarterly weighted indicator that gauges the health of the Irish shipping industry and the wider economy. The Index is comprised of five separate indices, representing the main maritime traffic categories moving through ports in the Republic of Ireland: Lo/-Lo, Ro/-Ro, Dry Bulk, Liquid Bulk & and Break Bulk. As all three bulk segments are traditionally measured in tonnage, Lo-Lo and Ro-Ro volumes are expressed in tonnage terms, whereby 1 TEU =10 tonnes, and 1 Freight Unit = 14 tonnes, thus establishing a common denominator. The base period is Quarter 1 2007 at which point, all indices were set at 1000.
The iShip Index indicates a +6% gain in overall shipping activity in 2017, with positive growth across all four quarters. It was recorded that Q1, Q3 and Q4 all exceeded the 1000 mark, the first time this was recorded for any quarter since Q2 2008.
Growth was driven by the Lo/Lo and Ro/Ro sectors, with activity increasing in both sectors by +4%. Ro/Ro traffic is a reliable indicator of the trade between Ireland and the UK. The UK accounted for 26% of ROI’s EU exports (+2% compared to 2016), a total of €16 billion. For EU imports, the figure from the UK is higher at 39% (+3%), amounting to €17 billion in value terms.
The Lo/Lo sector experienced continued growth in exports, up by +4%. Both LoLo and RoRo sectors are strongly influenced by domestic demand, with increases in activity in these sectors correlating strongly with reports of increased consumer consumption in the domestic economy. The ECB’s Harmonised Index of Consumer Prices for Ireland saw average growth of +0.3% during 2017.
Growth in the iShip Index was buoyed by an expansion in activity of +6% in the Dry Bulk Sector, the largest component of the Index. Dry Bulk activity in 2017 was influenced by growth in commodities such as Bauxite (which grew by +2% compared to 2016) and Alumina (-3%) dominating this segment of the market. The volume of Coal into Moneypoint Terminal increased by +14%. This market segment was also impacted by increased agricultural activity, with significant increases in Cereal (+78%), Animal Feed (+11%) and Fertiliser (+11%).
The Break Bulk Index, a relatively small component of the iShip Index, saw no growth in 2017. Increases in volume in Q1 (+7%), Q2 (+3%), and Q3 (+5%) were offset by contraction of -15% in Q4.
The Liquid Bulk Index grew by +8% in 2017, having declined by -9% in the previous year. The recovery in growth in this market segment has been driven by growth in transhipments through Bantry Bay, which saw traffic increase by +182% in 2017.
SHIPPING INDEX
iShip Index, 2007-2017
2007 2008 2009 2010 2011 2012 2013 2014 2015 2016 2017
650
700
750
800
850
900
950
1,000
1,050
1,100
Q4Q3Q2Q1Q4Q3Q2Q1Q4Q3Q2Q1Q4Q3Q2Q1Q4Q3Q2Q1Q4Q3Q2Q1Q4Q3Q2Q1Q4Q3Q2Q1Q4Q3Q2Q1Q4Q3Q2Q1Q4Q3Q2Q1
1,042
693
1,015
995 1002
1,042
Source: IMDO
19
Iris
h Sh
ippi
ng In
dex
GRAPH A
Annual iShip Index
750
800
850
900
950
1,000
1,050
20172016201520142013201220112010200920082007
1,000
948
768
819 823828
856 873
934
960
1,014
Source: IMDO
GRAPH C
RoRo Index
800
900
1,000
1,100
1,200
1,300
1,400
20172016201520142013201220112010200920082007
841
1,293
1,233
1,3261,312
Source: IMDO
GRAPH E
Dry Bulk Index
500
600
700
800
900
1,000
1,100
20172016201520142013201220112010200920082007
1,000
526
1,066
908937
1,014
Source: IMDO
GRAPH B
LoLo Index
600
655
710
765
820
875
930
985
1,040
1,095
1,150
20172016201520142013201220112010200920082007
1,090
821
663
882874
868
Source: IMDO
GRAPH D
Liquid Bulk Index
600
700
800
900
1,000
1,100
1,200
20172016201520142013201220112010200920082007
1,110
694
943996
909
1,027
Source: IMDO
GRAPH F
Break Bulk Index
200
300
400
500
600
700
800
900
1,000
1,100
20172016201520142013201220112010200920082007
1,000
291
602 605560
650
Source: IMDO

IRISH MARKET REVIEW
22Ir
ish
Mar
ket
TABLE 9A
ROI Port Traffic: Total Bulk (Tonnes)
Total
Port 2016 2017 % Change
Bantry 297,927 838,979 182%
Cork 7,045,565 7,195,671 2%
Drogheda 1,222,783 1,282,113 5%
Dublin 6,117,329 6,336,106 4%
Dundalk 51,899 74,341 43%
Galway 588,103 601,312 2%
Greenore 630,609 789,330 25%
New Ross 271,915 345,423 27%
Shannon Foynes 11,013,400 11,237,915 2%
Rosslare-Europort 41,170 43,729 6%
Waterford 1,046,055 1,328,908 27%
Wicklow 97,255 142,641 47%
Youghal 89,306 118,538 33%
Total ROI 28,513,316 30,335,006 6%
Source: IMDO
GRAPH 9A
Total Bulk Tonnage: ROI Ports (Monthly)
2017
Tonn
es
Liquid Dry Break Total
0
500000
100,0000
150,0000
200,0000
250,0000
300,0000
350,0000
2008 2009 2010 2011 2012 2013 2014 2015 2016
Source: IMDO
GRAPH 9B
Bulk Traffic by Category: 2010-2017
Tonn
es (0
00s)
Liquid Dry Break
0,000
2,000
4,000
6,000
8,000
10,000
12,000
14,000
16,000
18,000
20172016201520142013201220112010
Source: IMDO
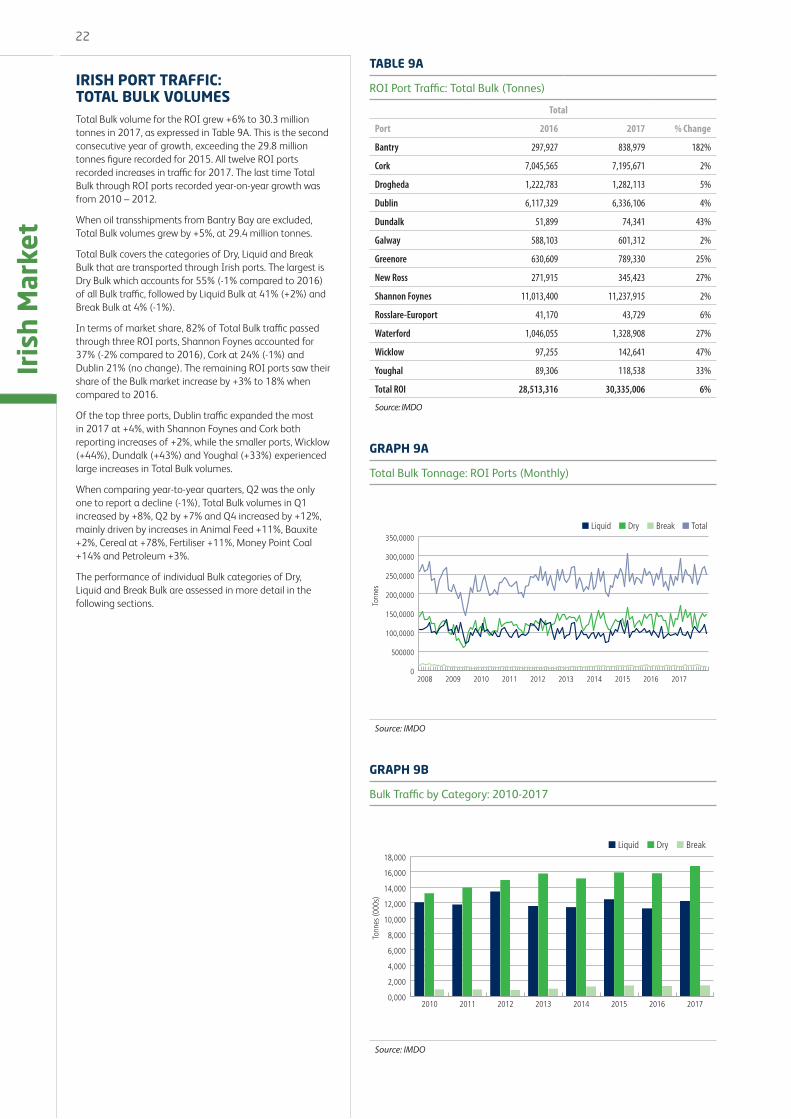
IRISH PORT TRAFFIC: TOTAL BULK VOLUMESTotal Bulk volume for the ROI grew +6% to 30.3 million tonnes in 2017, as expressed in Table 9A. This is the second consecutive year of growth, exceeding the 29.8 million tonnes figure recorded for 2015. All twelve ROI ports recorded increases in traffic for 2017. The last time Total Bulk through ROI ports recorded year-on-year growth was from 2010 – 2012.
When oil transshipments from Bantry Bay are excluded, Total Bulk volumes grew by +5%, at 29.4 million tonnes.
Total Bulk covers the categories of Dry, Liquid and Break Bulk that are transported through Irish ports. The largest is Dry Bulk which accounts for 55% (-1% compared to 2016) of all Bulk traffic, followed by Liquid Bulk at 41% (+2%) and Break Bulk at 4% (-1%).
In terms of market share, 82% of Total Bulk traffic passed through three ROI ports, Shannon Foynes accounted for 37% (-2% compared to 2016), Cork at 24% (-1%) and Dublin 21% (no change). The remaining ROI ports saw their share of the Bulk market increase by +3% to 18% when compared to 2016.
Of the top three ports, Dublin traffic expanded the most in 2017 at +4%, with Shannon Foynes and Cork both reporting increases of +2%, while the smaller ports, Wicklow (+44%), Dundalk (+43%) and Youghal (+33%) experienced large increases in Total Bulk volumes.
When comparing year-to-year quarters, Q2 was the only one to report a decline (-1%), Total Bulk volumes in Q1 increased by +8%, Q2 by +7% and Q4 increased by +12%, mainly driven by increases in Animal Feed +11%, Bauxite +2%, Cereal at +78%, Fertiliser +11%, Money Point Coal +14% and Petroleum +3%.
The performance of individual Bulk categories of Dry, Liquid and Break Bulk are assessed in more detail in the following sections.

23
Iris
h M
arke
t
TABLE 10A
ROI Port Traffic: Dry Bulk: Tonnes: 2016 & 2017
Dry
Port 2016 2017 % Change
Cork 1,257,373 1,367,849 9%
Drogheda 934,417 1,000,514 7%
Dublin 2,053,199 2,033,572 -1%
Dundalk 37,780 52,999 40%
Galway 128,113 138,437 8%
Greenore 433,668 628,607 45%
New Ross 269,348 345,423 28%
Shannon Foynes 9,702,950 9,962,950 3%
Waterford 970,089 1,206,873 24%
Wicklow 21,076 2,970 -86%
Total 15,808,013 16,740,194 6%
Source: IMDO
GRAPH 10A
Market Share of Dry Bulk Traffic: Port 2017
Greenore
New Ross
Dublin
Cork
Drogheda
Dundalk
Galway
8%6%
12%
<1%
1%4%2%
7%
60%
Shannon Foynes
Waterford
Source: IMDO
GRAPH 10B
% Change in Dry Bulk Traffic – ROI Ports: 2011-2017
-10%
-5%
0%
5%
10%
15%
20%
25%
Q4Q3Q2Q1Q4Q3Q2Q1Q4Q3Q2Q1Q4Q3Q2Q1Q4Q3Q2Q1Q4Q3Q2Q1Q4Q3Q2Q1
% C
hang
e
20122011 2013 2014 2015 2016 2017
Source: IMDO
DRY BULKThe Dry Bulk market in ROI ports expanded by +6% in 2017 to 16.7 million tonnes as expressed in Table 10A. It was the sixth year of reported growth through ROI ports, and the third time growth of over 5% has been recorded this decade, the other years being 2011 and 2013. Dry Bulk is composed of commodities such as Alumina, Animal Feed, Bauxite, Cement, Coal, Fertiliser and Iron Ore.
When comparing year-to-year quarters, Q1 saw an increase of +12%, Q3 to +2% and Q4 grew +14%. The only exception in 2017 was Q2 which saw volumes decline -3%.
From Graph 10A it can be observed that three ports account for 80% of all traffic in the Dry Bulk market (a decrease of -2% compared to 2016). The largest is Shannon Foynes at 60% (-1%), followed by Dublin at 12% (-1%), and Cork at 8% (no change). The remaining six ports represented 20% (+2%).
In examining growth in the larger ports from Table 10A, Shannon Foynes saw its overall Dry Bulk traffic increase by +3% in 2017 to 9.9 million tonnes. Dublin declined by -1% to just over 2 million tonnes of Dry Bulk, the port last recorded consecutive year-on-year growth in this market from 2011 – 2013. Cork recorded +9% growth in 2017, reaching 1.3 million tonnes, ending three years of contraction from 2014 – 2016. In terms of the other ROI ports, Greenore (+45%) and Dundalk (+40%) experienced the highest increases, while Wicklow (-86%) saw a significant reduction in traffic in Dry Bulk throughout 2017.
Looking at the commodities, heavy industry accounted for 50% of the Dry Bulk traffic in 2017, with Bauxite (which grew by +2% compared to 2016) and Alumina (-3%) dominating this segment of the market. The volume of Coal into Moneypoint Terminal increased by +14% during 2017, while it fell by -52% in all other ROI ports. The terminal is dedicated to importing coal which powers the Electricity Supply Board’s largest electricity plant in Ireland, which generates up to 25% of all electricity for the Irish state.
The volume of agriculture throughput increased in ROI ports in 2017 as a result of growth in the sector. The CSO reports that overall, exports of Food and Live Animals for 2017 increased by +12%. Data from the CSO show that both the volume and value of Cereals increased by +5%, Milk by +45% and Livestock +4%. According to the CSO, these increases in agricultural activity resulted in an increase in expenditure for Animal Feed (+6%) and Fertiliser (+13%).
Mirroring these CSO statistics, increases in volumes through ROI ports were observed in agricultural products such as Cereal (+78%), Animal Feed (+11%) and Fertiliser (+11%).
24Ir
ish
Mar
ket
TABLE 11A
ROI Port Traffic: Liquid Bulk (Tonnes)
Liquid
Port 2016 2017 % Change
Bantry 297,927 838,979 182
Cork 5,442,847 5,556,719 2
Drogheda 33,057 33,001 0
Dublin 4,016,703 4,280,355 7
Galway 438,417 450,774 3
New Ross 2,567 0 -100
Shannon Foynes 1,050,417 1,074,615 2
Total 11,281,935 12,234,443 8
Source: IMDO
GRAPH 11A
Market Share of Liquid Bulk Traffic: 2017
Drogheda
Dublin
Galway
Bantry Bay
Cork
7%9%
35%45%
>1%
4%
Shannon Foynes
Source: IMDO
GRAPH 11B
% Change in Liquid Bulk Traffic – ROI Ports: 2012-2017
-25%
-15%
-5%
5%
15%
25%
35%
Q4Q3Q2Q1Q4Q3Q2Q1Q4Q3Q2Q1Q4Q3Q2Q1Q4Q3Q2Q1Q4Q3Q2Q1
% C
hang
e
2012 2013 2014 2015 2016 2017
Source: IMDO
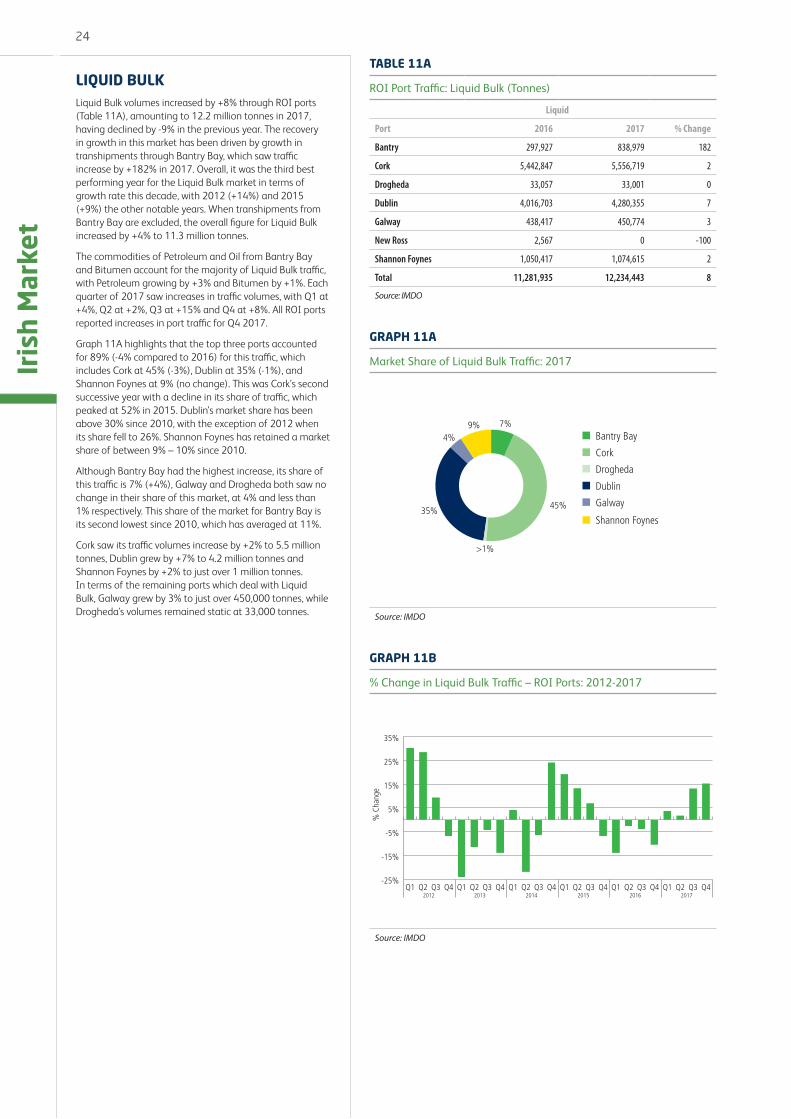
LIQUID BULKLiquid Bulk volumes increased by +8% through ROI ports (Table 11A), amounting to 12.2 million tonnes in 2017, having declined by -9% in the previous year. The recovery in growth in this market has been driven by growth in transhipments through Bantry Bay, which saw traffic increase by +182% in 2017. Overall, it was the third best performing year for the Liquid Bulk market in terms of growth rate this decade, with 2012 (+14%) and 2015 (+9%) the other notable years. When transhipments from Bantry Bay are excluded, the overall figure for Liquid Bulk increased by +4% to 11.3 million tonnes.
The commodities of Petroleum and Oil from Bantry Bay and Bitumen account for the majority of Liquid Bulk traffic, with Petroleum growing by +3% and Bitumen by +1%. Each quarter of 2017 saw increases in traffic volumes, with Q1 at +4%, Q2 at +2%, Q3 at +15% and Q4 at +8%. All ROI ports reported increases in port traffic for Q4 2017.
Graph 11A highlights that the top three ports accounted for 89% (-4% compared to 2016) for this traffic, which includes Cork at 45% (-3%), Dublin at 35% (-1%), and Shannon Foynes at 9% (no change). This was Cork’s second successive year with a decline in its share of traffic, which peaked at 52% in 2015. Dublin’s market share has been above 30% since 2010, with the exception of 2012 when its share fell to 26%. Shannon Foynes has retained a market share of between 9% – 10% since 2010.
Although Bantry Bay had the highest increase, its share of this traffic is 7% (+4%), Galway and Drogheda both saw no change in their share of this market, at 4% and less than 1% respectively. This share of the market for Bantry Bay is its second lowest since 2010, which has averaged at 11%.
Cork saw its traffic volumes increase by +2% to 5.5 million tonnes, Dublin grew by +7% to 4.2 million tonnes and Shannon Foynes by +2% to just over 1 million tonnes. In terms of the remaining ports which deal with Liquid Bulk, Galway grew by 3% to just over 450,000 tonnes, while Drogheda’s volumes remained static at 33,000 tonnes.

25
Iris
h M
arke
t
TABLE 12A
ROI Port Traffic: Break Bulk (Tonnes)
Break
Port 2016 2017 % Change
Cork 308,925 252,097 -18%
Drogheda 255,309 248,598 -3%
Dublin 47,427 22,179 -53%
Dundalk 14,119 21,342 51%
Galway 21,573 4,910 -77%
Greenore 196,942 160,723 -18%
Shannon Foynes 260,033 305,522 17%
Rosslare-Europort 41,170 43,729 6%
Waterford 75,966 122,537 61%
Wicklow 130,327 139,671 7%
Youghal 89,306 118,538 33%
Total ROI 1,399,926 1,396,118 0%
Source: IMDO
GRAPH 12A
Market Share – Break Bulk Traffic: 2017
Shannon Founes
Greenore
Dublin
Cork
Drogheda
Dundalk
Galway18%
18%
9%
>1%
2%2%
8%
10%
11%22%
Waterford
YoughalWicklow
Source: IMDO
GRAPH 12B
% Change in Break Bulk – ROI Ports: 2011-2017
-20%
-10%
0%
10%
20%
30%
40%
50%
60%
Q4Q3Q2Q1Q4Q3Q2Q1Q4Q3Q2Q1Q4Q3Q2Q1Q4Q3Q2Q1Q4Q3Q2Q1Q4Q3Q2Q1
% C
hang
e
20122011 2013 2014 2015 2016 2017
Source: IMDO
BREAK BULK The Break Bulk market saw zero growth in 2017, declining marginally by -3,808 tonnes, as presented in Table 12A. This is the second consecutive year of no growth, following a decline -5% in 2016. The Break Bulk market had declined in 2010 (-3%), 2011 (-3%) and 2012 (-5%). However, this was followed by three years of growth in 2013 (+20%), 2014 (+29) and 2015 (+10%).
Commodities such as Timber, Steel Products, Machinery and other general project cargo make up the majority of the Break Bulk cargo. When comparing year-to-year quarters to 2016, growth was recorded in Q1 at +7%, Q2 at +3% and Q3 at +5%, with Q4 declining -15%.
Graph 12A shows that three ports accounted for 58% (-1% compared to 2016) in terms of share of Break Bulk traffic. Shannon Foynes overtook Cork as the top location for Break Bulk in ROI, accounting for 22% (+2%), Cork was 18% (-4%), Drogheda was 18% (no change). As can be observed, the Break Bulk market is not as highly concentrated when compared to the Dry and Liquid Bulk markets.
This is the highest market share Shannon Foynes has recorded since 2010, even exceeding the 20% share it achieved in 2013. Since 2010 Cork has recorded three years of double-digit growth. Unlike the previous two ports, Drogheda’s market share has swung to a greater extent, from a decline of -9% in 2012 to an increase of +344% in 2013.
Half of the twelve ROI ports in this market saw declines in their volumes, including two of the top three ports, Cork -18% and Drogheda -3%. Volumes through Shannon Foynes grew +17%.
In other ports, volumes were volatile. Galway, Dublin and Greenore saw declines of -77%, -53%, -18% respectively. There were increases in traffic volumes in Waterford (+61%), Dundalk (+51%) and Youghal (+33%).
The remaining 42% (+1%) from the other ports also saw increases in their market shares, with Wicklow at 10% (+2%), Youghal 8% (+2%) and Dundalk at 2% (+1%). Contraction was recorded in Greenore at 12% (-2%), Dublin at 2% (-1%), and Galway at less than 1% (-2%) for the Break Bulk market.
Machinery recorded a significant increase of +166% for 2017. Timber and Cement both saw declines in port traffic, falling -2% and -12% respectively. The Construction Information Services found that during 2017 increases of +10% for on-site projects were observed in both Residential and Industrial. However, decreases occurred in Civil & Utilities (-38%), Medical (-23%), Retail (-17%), and Education (-7%). The CSO’s Production in Building and Construction Index rose from 160 points in Q1 to 181.5 points in Q4 2017. Similarly, Ulster Bank’s Construction Purchasing Managers Index for January 2017 was 55.9 points, and increased in January 2018 to 61.3 points.

26Ir
ish
Mar
ket
TABLE 13A
Laden Container Port Traffic (TEU)
No. of TEUs Total
Port 2016 2017 % Change
Dublin 507,129 530,287 5%
Cork 165,416 170,875 3%
Waterford 29,291 30,289 3%
Belfast 164,452 167,465 2%
Warrenpoint 25,627 20,958 -18%
Total ROI 701,836 731,451 4%
Total NI 190,079 188,423 -1%
Total 891,915 919,874 3%
Source: IMDO
GRAPH 13A
Total Monthly Container Traffic through All ROI Ports: 2008-2017
0
10,000
20,000
30,000
40,000
50,000
60,000
70,000
80,000
90,000
2017201620152014201320122011201020092008
Laden Imports Laden Exports Total
No.
of T
EUs
Source: IMDO
TABLE 13B
Total Container Port Traffic (TEU) (Laden and Unladen)
No. of TEUs Total
Port 2016 2017 % Change % Share
Dublin 663,732 698,419 5% 58%
Cork 209,881 217,764 4% 18%
Waterford 43,240 42,408 -2% 3%
Belfast 212,504 215,699 2% 18%
Warrenpoint 42,233 32,470 -23% 3%
Total ROI 916,853 958,591 5% 79%
Total NI 254,737 248,169 -3% 21%
Total IRL 1,171,590 1,206,760 3% 100%
Source: IMDO
LIFT-ON/LIFT-OFF MARKET: PORTS*In 2017, total Laden Container traffic for the island of Ireland increased by +3% to 919,874 TEUs (Table 13A). This was the fourth consecutive year of growth, and is the largest volume of container traffic recorded since 2008, when traffic stood at 1,012,171 TEUs.
Laden Exports from ROI increased by +7% in 2017 to 319,213 TEUs, with increases in traffic at Cork (+7%) and Dublin (+8%), while there was no growth at Waterford. Growth remained strong across the quarters, with Q1 at +6%, Q2 grew by +8%, Q3 by +11% and Q4 at +6%, with volumes averaging 79,804 TEUs per quarter. Volumes remained relatively stable throughout the year, in particular across the last three quarters of 2017.
The growth in Laden Export container traffic corresponds to data from the CSO, which reports that exports totalled €122 billion (+2%) in 2017, the highest annual total on record. Further to this, Investec’s Manufacturing Purchasing Management Index for Ireland increased by +6% to 59 points in January 2018 compared to January 2017, recording a fourteen-month high for the index.
Northern Ireland’s ports of Belfast and Warrenpoint saw a decrease of -1% of Laden Container traffic in 2017, totalling 188,423 TEUs. Growth was strongest in Q2 (+3%) and Q3 (+2%), while declines were recorded for Q1 (-5%) and Q4 (-3%). In terms of Laden Container traffic, Belfast saw growth of +2% for 2017, while Warrenpoint declined by -18%. Laden Exports for Northern Ireland declined -3% to 90,006 TEUs. Belfast saw its laden export traffic grow by +2% in 2017, with Warrenpoint declining -22%.
Laden Imports into ROI ports increased by +2% to 412,239 TEUs, the fourth consecutive year of growth for this market. Traffic through Dublin grew by +2% and by +8% in Waterford, while Cork experienced no growth in 2017. Growth was recorded across all four quarters.
Data from the CSO supports this, as imports in 2017 grew to a record level, increasing by +4% to €76.8 billion, compared to 2016. Imports from the UK to Ireland increased by +10% to €17,303 million in the same period.
Consumer sentiment correlates strongly with laden import performance. The Consumer Sentiment Index (CSI) for December 2017 reached 103 points, an increase of +7% from the same month in 2016. The CSI is produced by the Economic and Social Research Institute and KBC Bank.
Additionally, Northern Ireland’s Laden Import market grew by +1% in 2017 to 98,416 TEUs. Growth in Belfast of +2% can be attributed to this, while Warrenpoint declined by -4% in 2017. Growth was recorded in the majority of quarters, Q1 +1%, Q2 +2%, Q3 +3%, while Q4 saw a decline of -1%.
In terms of share of total Laden Traffic for the island of Ireland from Table 13B, Dublin retained its top position of 58% (+1% compared to 2016). Cork (19%), Waterford (3%) and Belfast (18%), all saw no change in their individual shares of this market, with Warrenpoint declining by -1% to 2% market share.
* For unitised traffic, both RoRo and LoLo freight moves in an all-island context. While figures for bulk in its various forms are given for the Republic of Ireland, it is our normal practice to include traffic through Northern Ireland ports for analysis of unitised traffic.
27
Iris
h M
arke
t
GRAPH 14A
TEU Distribution of LoLo Vessel Arrivals – ROI Ports: 2017
901-1000 TEUS
1001-1200 TEUS
801-900 TEUS
<600 TEUS
600-800 TEUS
14%
35%
11%
14%
15%
9.90%
>1201 TEUS
Source: Marine Traffic
GRAPH 14B
Liner Service Destinations: 2016 & 2017
Spain
BelgiumNetherlands
UKOther
18%5%
54%
5%
18%
2017
17.2%4%
55%
6%
17.3%
2016
Source: Marine Traffic
GRAPH 14C
Estimated Total Capacity and Traffic in Irish Ports per Month 2018
60000
70000
80000
90000
100000
110000
120000
130000
140000
Dec-18Nov-18Oct-18Sep-18Aug-18Jul-18Jun-18May-18Apr-18Mar-18Feb-18Jan-18
TEU capacity Total Tra�c Laden and Unladen
No.
of T
EUs
Source: IMDO
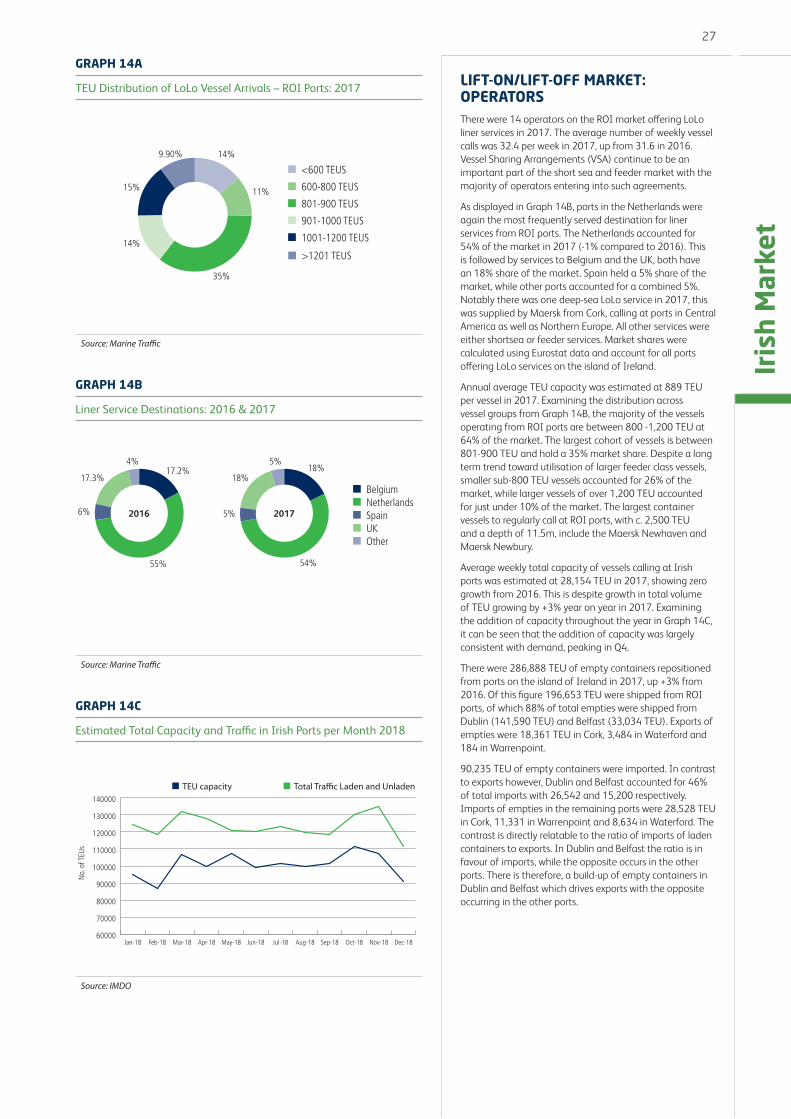
LIFT-ON/LIFT-OFF MARKET: OPERATORSThere were 14 operators on the ROI market offering LoLo liner services in 2017. The average number of weekly vessel calls was 32.4 per week in 2017, up from 31.6 in 2016. Vessel Sharing Arrangements (VSA) continue to be an important part of the short sea and feeder market with the majority of operators entering into such agreements.
As displayed in Graph 14B, ports in the Netherlands were again the most frequently served destination for liner services from ROI ports. The Netherlands accounted for 54% of the market in 2017 (-1% compared to 2016). This is followed by services to Belgium and the UK, both have an 18% share of the market. Spain held a 5% share of the market, while other ports accounted for a combined 5%. Notably there was one deep-sea LoLo service in 2017, this was supplied by Maersk from Cork, calling at ports in Central America as well as Northern Europe. All other services were either shortsea or feeder services. Market shares were calculated using Eurostat data and account for all ports offering LoLo services on the island of Ireland.
Annual average TEU capacity was estimated at 889 TEU per vessel in 2017. Examining the distribution across vessel groups from Graph 14B, the majority of the vessels operating from ROI ports are between 800 -1,200 TEU at 64% of the market. The largest cohort of vessels is between 801-900 TEU and hold a 35% market share. Despite a long term trend toward utilisation of larger feeder class vessels, smaller sub-800 TEU vessels accounted for 26% of the market, while larger vessels of over 1,200 TEU accounted for just under 10% of the market. The largest container vessels to regularly call at ROI ports, with c. 2,500 TEU and a depth of 11.5m, include the Maersk Newhaven and Maersk Newbury.
Average weekly total capacity of vessels calling at Irish ports was estimated at 28,154 TEU in 2017, showing zero growth from 2016. This is despite growth in total volume of TEU growing by +3% year on year in 2017. Examining the addition of capacity throughout the year in Graph 14C, it can be seen that the addition of capacity was largely consistent with demand, peaking in Q4.
There were 286,888 TEU of empty containers repositioned from ports on the island of Ireland in 2017, up +3% from 2016. Of this figure 196,653 TEU were shipped from ROI ports, of which 88% of total empties were shipped from Dublin (141,590 TEU) and Belfast (33,034 TEU). Exports of empties were 18,361 TEU in Cork, 3,484 in Waterford and 184 in Warrenpoint.
90,235 TEU of empty containers were imported. In contrast to exports however, Dublin and Belfast accounted for 46% of total imports with 26,542 and 15,200 respectively. Imports of empties in the remaining ports were 28,528 TEU in Cork, 11,331 in Warrenpoint and 8,634 in Waterford. The contrast is directly relatable to the ratio of imports of laden containers to exports. In Dublin and Belfast the ratio is in favour of imports, while the opposite occurs in the other ports. There is therefore, a build-up of empty containers in Dublin and Belfast which drives exports with the opposite occurring in the other ports.
28Ir
ish
Mar
ket
TABLE 15A
Roll-on/Roll-off Freight Traffic (Freight Units)
Freight Units Total
Port 2016 2017 % Change % Share ROI & NI
Cork 522 556 7% <1%
Dublin 944,531 992,062 5% 89%
Rosslare 128,350 127,820 0% 11%
Belfast 513,885 525,656 2% 63%
Larne 206,748 214,788 4% 26%
Warrenpoint 96,373 98,589 2% 12%
Total ROI 1,073,403 1,120,438 4% 57%
Total NI 817,006 839,033 3% 43%
Total IRL 1,890,409 1,959,471 4% 100%
Source: IMDO
TABLE 15B
Roll-on/Roll-off Freight Traffic (Freight Units): 2016-2017
Freight Units Accompanied Unaccompanied %
Port 2016 2017 % Change 2016 2017 % Change
Cork 477 473 -1% 45 83 84%
Dublin 354,641 359,643 1% 589,890 632,419 7%
Rosslare 69,523 69,575 0% 58,826 58,245 -1%
Belfast 192,468 182,320 -5% 321,417 343,336 7%
Larne 137,919 148,203 7% 68,829 66,585 -3%
Warrenpoint 7,642 7,549 -1% 88,731 91,040 3%
Total ROI 424,641 429,691 2% 648,761 690747 6%
Total NI 338,029 338,072 0% 478,977 500961 5%
Total IRL 762,670 767,763 1% 1,127,738 1,191,708 6%
Source: IMDO
GRAPH 15A
Market Share of Roll-on/Roll-off Traffic: Port: 2017
Rosslare
LarneWarrenpoint
Rosslare
Cork
Dublin
5%
6%
11%
27% 51%
<1%
Source: IMDO
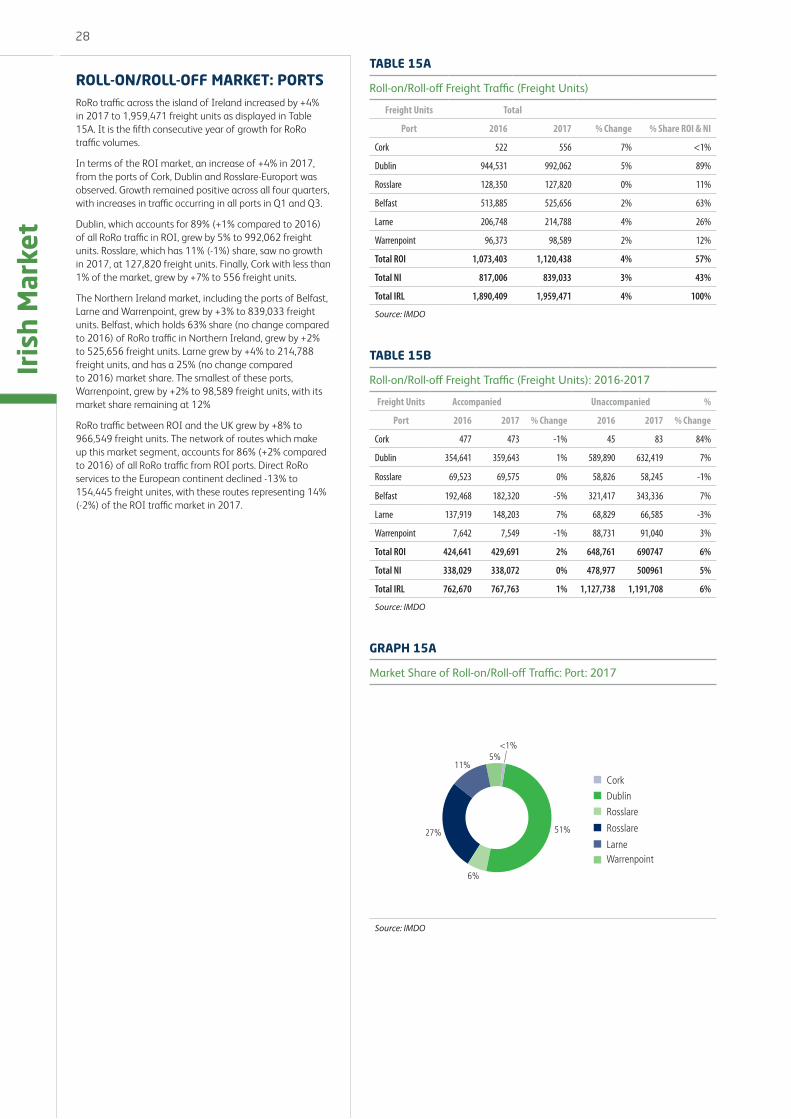
ROLL-ON/ROLL-OFF MARKET: PORTSRoRo traffic across the island of Ireland increased by +4% in 2017 to 1,959,471 freight units as displayed in Table 15A. It is the fifth consecutive year of growth for RoRo traffic volumes.
In terms of the ROI market, an increase of +4% in 2017, from the ports of Cork, Dublin and Rosslare-Europort was observed. Growth remained positive across all four quarters, with increases in traffic occurring in all ports in Q1 and Q3.
Dublin, which accounts for 89% (+1% compared to 2016) of all RoRo traffic in ROI, grew by 5% to 992,062 freight units. Rosslare, which has 11% (-1%) share, saw no growth in 2017, at 127,820 freight units. Finally, Cork with less than 1% of the market, grew by +7% to 556 freight units.
The Northern Ireland market, including the ports of Belfast, Larne and Warrenpoint, grew by +3% to 839,033 freight units. Belfast, which holds 63% share (no change compared to 2016) of RoRo traffic in Northern Ireland, grew by +2% to 525,656 freight units. Larne grew by +4% to 214,788 freight units, and has a 25% (no change compared to 2016) market share. The smallest of these ports, Warrenpoint, grew by +2% to 98,589 freight units, with its market share remaining at 12%
RoRo traffic between ROI and the UK grew by +8% to 966,549 freight units. The network of routes which make up this market segment, accounts for 86% (+2% compared to 2016) of all RoRo traffic from ROI ports. Direct RoRo services to the European continent declined -13% to 154,445 freight unites, with these routes representing 14% (-2%) of the ROI traffic market in 2017.

29
Iris
h M
arke
t
GRAPH 16A
Quarterly Roll-on/Roll-off Freight Traffic: 2014-2017
20172017201620152014
350000
370000
390000
410000
430000
450000
470000
Q4Q3Q2Q1
No.
of f
reig
ht u
nits
Source: IMDO
GRAPH 16B
Operator Share of the Market: 2017
P&O Ferries
Irish Ferries
Stena Line
SeaTruck
Brittany Ferries
Cobelfret40% 13%
7%<1%
19%
21%
Source: IMDO
GRAPH 16C
Roll-on/Roll-off Freight Traffic per Corridor: 2014-2017
20172017201620152014
0
100000
200000
300000
400000
500000
600000
700000
800000
900000
SouthernNorthernContinentalCentral
No.
of f
reig
ht u
nits
Source: IMDO
ROLL-ON/ROLL-OFF MARKET: OPERATORSThere were six freight operators providing scheduled services between ROI, the UK and the European Continent. Brittany Ferries, Cobelfret, Irish Ferries, P&O Ferries, SeaTruck and Stena Line offer routes across four corridors: Northern, Central, Southern and Direct Continental, connecting Ireland to important markets in terms of trade and tourism.
The Central Corridor, which involves routes from Dublin to the UK, saw an increase of +8% in freight volume in 2017. This follows a +7% increase in 2016. The Central Corridor continues to be the busiest sea-route between Ireland and the UK. It now accounts for 45% of all freight traffic (+1% compared to 2016). Irish Ferries, P&O Feries, SeaTruck and Stena Line operate services from Dublin to Holyhead, Heysham and Liverpool.
The Northern Corridor, involving routes from Northern Ireland to the UK, experienced a +2% increase of freight traffic in 2017, having grown by +4% in 2016. The Northern Corridor saw no change in its share of the market in 2017, remaining at 42% compared to 2016. This corridor previously held the position as the busiest route until 2016, when it was overtaken by the Central Corridor. P&O Ferries, SeaTruck and Stena Line operate services from Belfast, Larne and Warrenpoint to Birkenhead (Liverpool), Cairnryan and Heysham.
The direct Continental Corridor, which includes services from Ireland to France, Belgium and the Netherlands, saw a decrease in freight traffic in 2017. It was the only corridor which reported a decrease in freight traffic in 2017. It declined -13% in freight units, having observed growth on the corridor by +19% in 2015 and +15% in 2016. This has resulted in a decline of the Continental Corridor’s market share, down -2% to 8%, having achieved 10% market share in 2016. Brittany Ferries, Cobelfret, Irish Ferries and Stena Line provide services from Cork, Dublin and Rosslare to Continental Europe.
The Southern Corridor, where Irish Ferries and Stena Line provide services from Rosslare to Pembroke and Fishguard respectively, saw no overall increases in freight traffic. Its share of the market remained unchanged at 5%, a figure it has held since 2015.

30Ir
ish
Mar
ket
GRAPH 17A
% Change – Passenger Traffic – Island of Ireland: 2011-2017
-12%
-10%
-8%
-6%
-4%
-2%
0%
2%
4%
6%
8%
Q4Q3Q2Q1Q4Q3Q2Q1Q4Q3Q2Q1Q4Q3Q2Q1Q4Q3Q2Q1Q4Q3Q2Q1Q4Q3Q2Q1
% C
hang
e
20122011 2013 2014 2015 2016 2017
Source: IMDO
GRAPH 17B
Passenger Traffic per Corridor: 2010-2017
Continental SouthernNorthernCentral
0
500,000
1,000,000
1,500,000
2,000,000
20172016201520142013201220112010
No.
of P
asse
nger
s
Source: IMDO
GRAPH 17C
Annual Change in Air & Sea Passenger Traffic: 2011-2017
SeaAir
% C
hang
e
-7%
-5%
-3%
-1%
1%
3%
5%
7%
9%
11%
13%
2017201620152014201320122011
Source: Fáilte Ireland
PASSENGER TRAFFICPassenger numbers between the island of Ireland, the UK and Continental Europe saw only marginal growth of less than 1% in 2017. A total of just over 4.29 million passengers travelled on the Central, Continental, Northern and Southern Corridors. Just over 18,000 additional passengers were recorded to have travelled on these routes in 2017. This follows two years of decline in this market in 2016 (-2%) and 2015 (-3%).
The largest corridor, Northern, accounted for 41% of all passenger numbers (+1% compared to 2016), this is the highest recorded share for the Northern corridor this decade. Its total passenger numbers increased by +3% to over 1.7 million passengers for 2017. This is the corridor’s highest level since 2014, when it reached over 1.76 million.
The second largest corridor, Central, saw 39% of all passengers use its services (+1% compared to 2016). The Central corridor recorded a throughput of 1.6 million passengers in 2017, an increase of +2% compared to 2016. This corridor has maintained a share of the passenger market of between 38% - 39% throughout this decade.
The Southern corridor has the third highest passenger carryings, accounting for 13% of the market. A total of over 577,000 passengers, an increase of +1% travelled on this corridor in 2017. It maintained its 13% share of the market for a second consecutive year.
The smallest of the corridors, Continental, was the only one that reported a decline in its passenger numbers. A decrease of -20% was recorded for this corridor in 2017, where its passenger numbers declined to just over 294,000, the lowest number reported for this decade. This reduction in passenger traffic resulted in the Continental corridor’s market share falling to 7% (-2% compared to 2016).
In terms of car volumes to both the UK and European continent, a cumulative increase of +9% in cars using both routes was recorded between 2013 and 2016. This trend continued in 2017, where a +2% increase was recorded in cars travelling between ROI and the UK, from 674,900 to 689,300. In cars travelling to the continent, an increase of +1% was reported for 2017, up from 118,400 to 119,000 cars.

31
Iris
h M
arke
t
GRAPH 18A
Annual Numbers in Cruise Ship Calls
0
20
40
60
80
100
120
1402016 2017
Warren
point
Foyle
Belfa
st
Waterfo
rd
Shan
non
Galway
Dun La
ogha
ireDub
linCork
Bantr
y
No.
of V
esse
l Cal
ls
Source: Individual ports
GRAPH 18B
Annual Cruise Ship Calls: 2011-2017
Dublin Belfast OthersCork
0
50
100
150
200
250
300
350
2017201620152014201320122011
53
85
3231
57
87
45
38
62
100
57
54
52
86
64
33
57
93
59
39
57
109
83
36
62
127
94
41
Source: Individual ports
GRAPH 18C
Global Cruise Passengers: 2009-2018
Source: Cruise Liners International Association
CRUISE SECTORThere were 324 cruise vessel calls into ten ports on the island of Ireland in 2017, a +14% increase on 2016, as displayed in Graph 18A. Three ports accounted for 87% of all port calls, Dublin at 127 (39%) an increase of 18, Belfast with 94 (29%) an increase of 11, and Cork at 62 (19%) with an increase of 5.
There has been a steady growth in cruise traffic since 2011, with 2014 as the only year recording a -14% decrease in calls. An average of +9% increase in traffic has been observed throughout this period. 2017 was the highest year for calls into ports on the island of Ireland, a +61% increase from 201 calls to eight ports in 2011, to 324 call into ten ports in 2017. Passenger numbers have increased by +93% from 214,623 in 2011 to 415,115 in 2017.
From Graph 18B the three ports with the largest market shares accounted for 96% of the total passenger figure. Belfast was the top destination with 153,801 passengers (37%), an increase of +19,209 from 2016. Dublin had 146,429 passengers (35%), an increase of +36,545, while Cork saw 99,263 passengers (24%) pass through its port, an increase of +9,577 passengers.
However, declines in passenger numbers were observed in other ports. Dun Laoghaire saw a decline of one cruise call to seven in 2017, which resulted in a decline of -4,816 passengers visiting the port. Waterford saw a decline of -2,788 passengers as a result of the number of cruise ship calls declining by 2 to 12. Cruise calls into Warrenpoint dropped by 1 to 2 during 2017, resulting in a decline of -286 passengers.
From the remaining ports, increases in passenger numbers were observed at Galway (+2,496), Bantry Bay (+1,377), Foyle (+756) and Shannon Foynes (+207). This growth was the result of an increase of nine additional cruise vessel calls across these ports throughout 2017.
Bantry Bay had its first visit of a cruise liner into the port in almost three decades, with the 205m long MS Prinsendam and its 800 passengers arriving in the port in August 2017. Belfast saw its largest cruise liner call into the port. The Regal Princess, measuring 330m, called into Belfast in September 2017 with 3,600 passengers.
Just as Ireland’s Cruise Sector has displayed an upward growth trend in recent years, similar levels of growth can be observed globally. Graph 18C displays how Cruise Liners International Association (CLIA) report that total passenger numbers have grown by 26% since 2011, from 20.5 million to 25.8 million in 2017. CLIA expect numbers to increase again to 27.2 million for 2018. The addition of 27 new cruise ships to the international fleet will assist in increasing global cruise ship passenger.
0
5
10
15
20
25
30
2018(f)201720162015201420132012201120102009
Pass
enge
r No.
s (m
illio
ns)

32Ir
ish
Mar
ket
FORECASTINGThe IMDO forecast model for 2018 expects Bulk to increase +3.2%, Lolo traffic to grow by +1% and RoRo by +4.4%.
Clarksons’ forecast that global containership trade suggests growth of +4.7% in 2018 and +4.7% in 2019. These predictions come at a time of gradual improvement in the international economic environment. Although risks remain on the demand side, the supply growth over the next few years is projected to remain moderate. This is expected to ensure a continuation in the rebalancing of supply and demand in the market, as observed in 2017.
According to the Economic and Social Research Institute (ESRI), in 2017 the ROI GDP – which is highly correlated with the Irish unitised trade – grew by +7.8%. In 2018, GDP is expected to grow by +4.8%, according to the latest ESRI economic forecast. GDP is expected to grow by +3.9% in 2019, based on a technical assumption that an agreement is in place between the UK and the EU. Strong domestic consumption and investment, along with improving international conditions, are the main factors underpinning this growth.
The IMDO forecast that the ROI Bulk market will grow by +3.2%. This market section differs from unitised trade as it is more volatile due to the nature of the commodities involved, such as agricultural products which vary due to weather and harvest yields.
The IMDO’s forecasts were generated using a univariate model (see technical note in the annex). There are a number of advantages to using a univariate method when forecasting port throughput in the short term, i.e.: 1 – 2 years. The first is that it is independent of other variables, and it is also independent of any resulting uncertainty which surrounds the forecasting of explanatory variables such as GDP and the exchange rate. Secondly, it offers a systematic approach to the forecasting of time series modeling that can be easily replicated.
Conversely, univariate models have one main disadvantage, which is that these models are only informed by past values and as such, are incapable of forecasting significant unforeseen deviations from the long term trend.
TABLE 19A
Forecast for 2018 for three major categories
2016 2016 2018 (f)
Total Bulk -2.2% 3.0% 3.2%
Laden LoLo 4.9% 4.2% 1.0%
RoRo 6.3% 4.4% 4.4%
Source: IMDO
GRAPH 19A
Total Bulk Forecast 2018
1,000,000
1,500,000
2,000,000
2,500,000
3,000,000
2009 2010 2011 2012 2013 2014 2015 2016 2017 2018 (f)
Total Bulk
Tonn
es
2008
Source: IMDO
GRAPH 19B
Laden Lolo and RoRo Forecast 2018
0
20000
40000
60000
80000
100000
120000Laden LoLo RoRo
TEUs
and
Fre
ight
Uni
ts
2009 2010 2011 2012 2013 2014 2015 2016 2017 2018 (f)2008
Source: IMDO

GLOBAL MARKET REVIEW

34G
loba
l Mar
ket
TANKER MARKETThe crude tanker market, which refers to the movement of unrefined crude oil from its point of extraction to refineries, continued to deteriorate in 2017. The guideline Time Charter Rates (TCR) fell noticeably across all four of the major tanker sectors. Average TCRs for 2017 in the Aframax, Suezmax and VLCC sectors fell to the lowest levels since 2013, with the Product sector rates remaining supressed. In total across all four tanker sectors there was an overall decline of -26% during 2017. TCR are set for vessels for a fixed period of time, instead of a certain number of voyages and allow comparisons between periodic changes in a shipping company’s performance.
In terms of TCR averages in 2017 from Table 20A, Aframax declined -39% from $21,488 in 2016, to $15,490. Suezmax also declined during 2017, with earnings down -32% from $27,302 in 2016 to $18,495. The VLCC market saw average earnings falling -26%, from $36,585 in 2016 to $27,084. Overall, the Product sector had the lowest decrease among the leading tanker categories, declining -15% from $15,388 in 2016 to $13,077.
OPEC’s decision to cut supply until the end of 2018 was another key driver of the steep decline in rates witnessed during 2017. With fewer vessels in the Middle East, increased numbers of VLCCs were present in the Atlantic basin, where they compete with Suezmaxes. This has pushed down rates across the crude tanker market.
An additional factor in these decreases, has been the expansion of the fleet, which grew by +5.7% in 2017. In 2018, however, fleet expansion is expected to slow to +3.5%, which may lead to a gradual improvement in the current market balance between demand and capacity.
Demand for Product tankers expanded by +3.8% in 2017, due to growing intra-Asian trade and US exports. If these factors continue throughout 2018, demand is expected to grow by +3.8%. The Product tanker fleet expanded by +4.3% in 2017, but is expected to ease to +2.2% in 2018, which could start to rebalance the market.
Following two years of decline in demolition, 2017 saw tanker recycling picking up. Over 2.1 million DWT was sold for scrap in August alone, the highest monthly volume in over 13 years.
TABLE 20A
One Year Time Charter Rates ($/day): 2017
Product Aframax Suezmax VLCC
Jan-17 18,135 27,800 36,250 51,400
Feb-17 17,175 26,750 34,063 45,000
Mar-17 17,469 25,750 32,625 42,500
Apr-17 17,175 25,350 30,500 42,500
May-17 16,313 23,656 28,750 39,875
Jun-17 15,813 21,750 27,875 38,125
Jul-17 15,100 19,750 26,050 32,500
Aug-17 13,750 19,125 23,375 30,438
Sep-17 13,175 16,400 21,350 26,750
Oct-17 12,063 16,313 21,750 28,063
Nov-17 12,250 17,250 22,500 30,250
Dec-17 12,525 18,000 22,500 31,250
Source: Clarksons
GRAPH 20A
Tanker One Year Time Charter Rates: 2007-2017
0,000
10,000
20,000
30,000
40,000
50,000
60,000
70,000
80,000
90,000Suezmax VLCC ProductAframax
US$
per d
ay
2007
2008
2009
2010
2011
2012
2013
2014
2015
2016
2017
Source: Clarksons
GRAPH 20B
Demand Supply Dynamics: Crude Tankers: 2007-2018(f)
-5%
-3%
-1%
1%
3%
5%
7%
9%
11%
2018(f)20172016201520142013201220112010200920082007
Demand Growth Supply Growth
% C
hang
e
Source: Clarksons

35
Glo
bal M
arke
t
DRY BULK MARKETThere was improvement in the Dry Bulk Market in 2017, largely due to improved demand. The Baltic Dry Index (BDI) saw a yearly increase from 676 points in 2016, to 1,153 points in 2017, a +71% increase. The BDI is a composite of the Capesize, Panamax, Supramax and Handysize Time Charter Rates (TCR).
TCR for 2017 increased across all four vessel types, following double-digit declines in the previous year. Capesize grew the most by +84% to $15,150 per-day, Panamax by +70% to $10,665, Handymax grew by +51% to $9,822, and Handysize by +54% to $8,087.
Average daily earnings came to $10,986/day in 2017, a six year high. Capesize saw its daily earnings grow from to $23,737 in December 2017 (+96% compared to December 2016), Panamax grew to $12,254 (+25%), Supermax to $12,988 (+48%), and Handysize to $9,604 (+5%).
Global seabourne trade in Dry Bulk is estimated to have grown by +4% to 1,477 million tonnes (mt) in 2017. A +5% increase in iron ore imports into China contributed significantly to this increase, with further growth of +4%, expected in 2018. Global iron ore trade is forecasted to expand +3% to 1,524 mt in 2018.
Trade in global wheat is currently projected to grow by +2% to 359 mt, in the 2017/18 crop year. In 2017, China alone accounted for 16% of seaborne trade in wheat, and it is expected that Chinese imports will decline -14% during 2017/18, due to improved domestic harvest and increased stockpiles.
Capacity for the Dry Bulk sector increased by +2.9% in 2017 to 817 mt. This was the result of an addition of 454 bulk carriers, totalling 38 million DWT, entering the fleet. Additionally, 15 million DWT from 215 vessels were sold for scrap, resulting in this moderate fleet growth. Despite demand expecting to outpace fleet growth for a second consecutive year, it is expected the Dry Bulk fleet will grow by +1.7% in 2018 to 831 million tonnes.
The Short Sea Index (SSI – as observed in Graph 21A) shows signs of returning to a more cyclical pattern in 2017, one that was last observed from 2012 – 2014. During that period, rates averaged at 16.5 on the SSI, however, rates began operating at decreased levels, with 2015 at 15.4, and 2016 at 14. On average, rates were recorded at 13.8 in 2017 on the Short Sea Index, highlighting a continuation of this trend. Q1 2017 saw the market stagnant, with a trajectory largely flat. Q2 saw continued uncertainty within the market, however, summer is traditionally the lowest point of the year. It would not be until Q3 that market conditions improved rapidly, mainly due to the harvest and the end of the summer holiday period. From there the market continued to accumulate momentum into Q4, which was sustained right through to the year-end.
GRAPH 21A
HC Shipping & Chartering – Short Sea Index: 2012-2017
12
13
14
15
16
17
18
19
201720162015201420132012
Source: HC Shipping and Chartering
GRAPH 21B
Dry Bulk One Year Time Charter Rates: 2005-2016
0
10,000
20,000
30,000
40,000
50,000
US$
per d
ay
2009 2010 2011 2012 2013 2014 2015 2016 2017
Capesize Panamax Handymax Handysize
Source: Clarksons
GRAPH 21C
Baltic Dry Index: 2007-2017
0
2,000
4,000
6,000
8,000
10,000
12,000
2007 2008 2009 2010 2011 2012 2013 2014 2015 2016 2017
Source: Clarksons
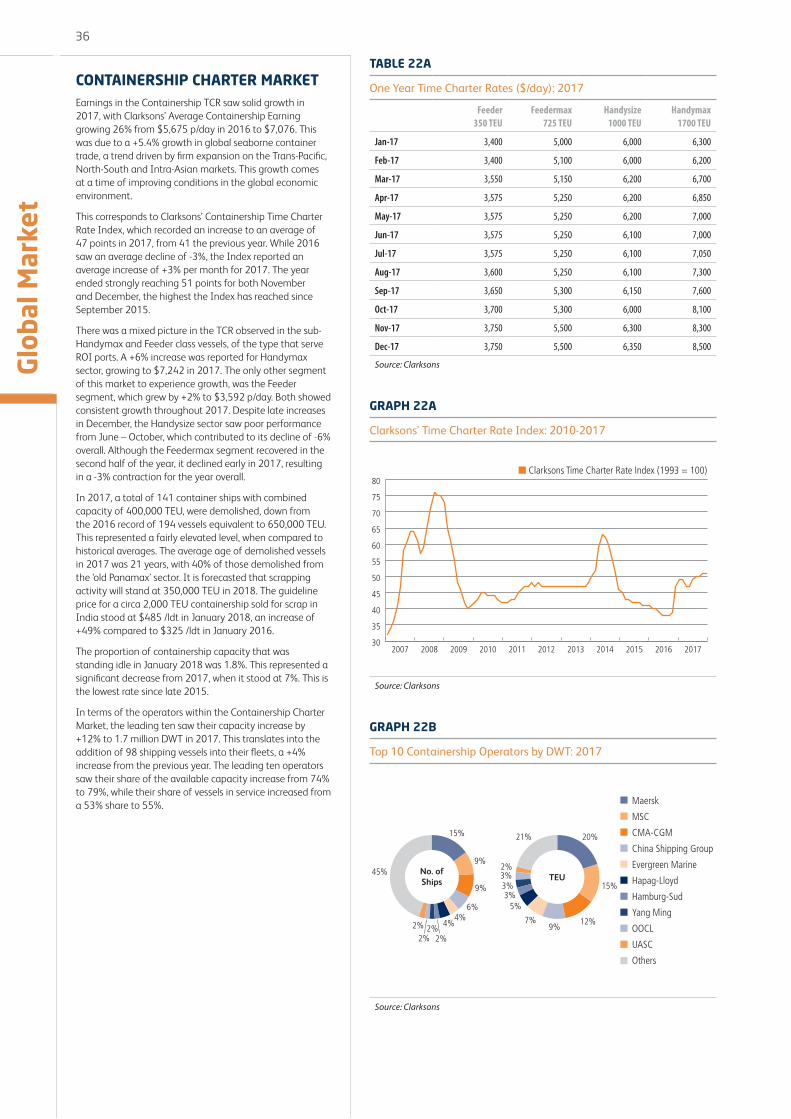
36G
loba
l Mar
ket
CONTAINERSHIP CHARTER MARKETEarnings in the Containership TCR saw solid growth in 2017, with Clarksons’ Average Containership Earning growing 26% from $5,675 p/day in 2016 to $7,076. This was due to a +5.4% growth in global seaborne container trade, a trend driven by firm expansion on the Trans-Pacific, North-South and Intra-Asian markets. This growth comes at a time of improving conditions in the global economic environment.
This corresponds to Clarksons’ Containership Time Charter Rate Index, which recorded an increase to an average of 47 points in 2017, from 41 the previous year. While 2016 saw an average decline of -3%, the Index reported an average increase of +3% per month for 2017. The year ended strongly reaching 51 points for both November and December, the highest the Index has reached since September 2015.
There was a mixed picture in the TCR observed in the sub-Handymax and Feeder class vessels, of the type that serve ROI ports. A +6% increase was reported for Handymax sector, growing to $7,242 in 2017. The only other segment of this market to experience growth, was the Feeder segment, which grew by +2% to $3,592 p/day. Both showed consistent growth throughout 2017. Despite late increases in December, the Handysize sector saw poor performance from June – October, which contributed to its decline of -6% overall. Although the Feedermax segment recovered in the second half of the year, it declined early in 2017, resulting in a -3% contraction for the year overall.
In 2017, a total of 141 container ships with combined capacity of 400,000 TEU, were demolished, down from the 2016 record of 194 vessels equivalent to 650,000 TEU. This represented a fairly elevated level, when compared to historical averages. The average age of demolished vessels in 2017 was 21 years, with 40% of those demolished from the ‘old Panamax’ sector. It is forecasted that scrapping activity will stand at 350,000 TEU in 2018. The guideline price for a circa 2,000 TEU containership sold for scrap in India stood at $485 /ldt in January 2018, an increase of +49% compared to $325 /ldt in January 2016.
The proportion of containership capacity that was standing idle in January 2018 was 1.8%. This represented a significant decrease from 2017, when it stood at 7%. This is the lowest rate since late 2015.
In terms of the operators within the Containership Charter Market, the leading ten saw their capacity increase by +12% to 1.7 million DWT in 2017. This translates into the addition of 98 shipping vessels into their fleets, a +4% increase from the previous year. The leading ten operators saw their share of the available capacity increase from 74% to 79%, while their share of vessels in service increased from a 53% share to 55%.
TABLE 22A
One Year Time Charter Rates ($/day): 2017
Feeder 350 TEU
Feedermax 725 TEU
Handysize 1000 TEU
Handymax 1700 TEU
Jan-17 3,400 5,000 6,000 6,300
Feb-17 3,400 5,100 6,000 6,200
Mar-17 3,550 5,150 6,200 6,700
Apr-17 3,575 5,250 6,200 6,850
May-17 3,575 5,250 6,200 7,000
Jun-17 3,575 5,250 6,100 7,000
Jul-17 3,575 5,250 6,100 7,050
Aug-17 3,600 5,250 6,100 7,300
Sep-17 3,650 5,300 6,150 7,600
Oct-17 3,700 5,300 6,000 8,100
Nov-17 3,750 5,500 6,300 8,300
Dec-17 3,750 5,500 6,350 8,500
Source: Clarksons
GRAPH 22A
Clarksons’ Time Charter Rate Index: 2010-2017
30
35
40
45
50
55
60
65
70
75
80
2007 2008 2009 2010 2011 2012 2013 2014 2015 2016 2017
Clarksons Time Charter Rate Index (1993 = 100)
Source: Clarksons
GRAPH 22B
Top 10 Containership Operators by DWT: 2017
Maersk
MSC
CMA-CGM
China Shipping Group
Evergreen Marine
Hapag-Lloyd
Hamburg-Sud
Yang Ming
OOCL
UASC
Others
20%
15%
9%7%
5%3%
3%
12%
3%2%
21%
TEU
9%
9%
6%4%
4%
2%2%
2%2%
15%
45% No. ofShips
Source: Clarksons

37
Glo
bal M
arke
t
DEEP SEA CONTAINER TRADES & FREIGHT RATESCONTAINER TRADE GROWTH
The global box trade market improved yet again in 2017, growing by +5.2%, a faster rate than in 2016 (+3.4%) and 2015 (+2.2%). These increases were driven by robust growth on the North-South and Intra-Asia trade markets. While there remains a lack of clarity surrounding the autumn closures of a number of Chinese factories, this did not have a significant impact. The global box trade is expected to maintain relatively strong growth at +5% in 2018, as a result of positive global conditions. In 2019, it is expected to see growth moderate slightly, but remaining healthy at +4.7%.
CONTAINER CAPACITY
Fleet capacity in 2017 grew by +3.5%, up on the figures of +1.2% reported in 2016, with rapid growth in the largest vessel sizes, and continued decreases in the sub -8,000 TEU fleet. Deliveries of 1.1 million TEU for 2017 were at subdued levels, relative to recent years, while recycling reached 400,000 TEU. It is expected that fleet capacity in 2018 will grow by +4.1%. Deliveries and demolitions are expected to remain relatively moderate, with larger ships accounting for deliveries.
BOX FREIGHT RATES
An improvement in the container shipping sector was observed in 2017, following a very difficult market environment in 2016. Following the collapse in 2016 of the South Korean operator Hanjin Shipping, one of the world’s leading shipping companies, freight rates continued to remain generally weak. Box freight rates on mainlane routes recorded gains in late 2016, and these improvements were largely maintained into 2017.
CONSOLIDATION
By the end of 2017, the ten largest companies accounted for 79% (+5% compared to 2016) of all global containership capacity, and for 54% (+1%) of vessels. Maersk, with the leading share, saw its capacity grow by +2% in 2017, both MSC and CMA CGM expanded by +9%, with China COSCO Shipping growing by +17%. Hapag-Llyod saw a significant increase of its capacity, up by +53% due to the addition of the United Arab Shipping Company and its 58 vessels into the company, which has created the world’s fifth-largest carrier. This indicates that consolidation amongst liner companies is now a well-established trend, as indicated by Clarksons in 2016.
GRAPH 23A
Container Imports: 2007-2017
0.00
20.00
40.00
60.00
80.00
100.00
120.00
20172016201520142013201220112010200920082007
TEU
(mill
ions
)
Europe North America Global
Source: Clarksons
GRAPH 23B
Containership Charter Rates vs Container Freight Rates: 2010-2017
0
10
20
30
40
50
60
70
80
0.00
500.00
1000.00
1500.00
2000.00
2500.00
SCFI Shanghai-Europe (base port) Freight RateCCFI Composite Index
Clarkson's Containership Timecharter Rate Index
20122010 2011 2014 2015 20162013 2017
Clar
kson
s In
dex
CCFI
, SCF
I
Source: Clarksons
GRAPH 23C
Annual Number of Vessels & Container Capacity: 2010-2017
0
5000
10000
15000
20000
25000
20172016201520142013201220112010
000 TEUNumber of Vessels
Source: Clarksons

38G
loba
l Mar
ket
NEWBUILDING AND DEMOLITION MARKETRORO FLEET
In December 2017, the global RoRo fleet’s capacity stood at 7.5 million DWT. This is the RoRo fleet’s third consecutive year at this figure. The fleet has steadily declined since 2010 (-10%) from a previous high of 8.3 million DWT. There has been a slowdown in demolitions in the RoRo market since the middle of this decade, with just 19 demolitions from 2015 to 2016, and 18 in 2017. However, there has been a +50% increase in demolitions so far in the 2010s of 294, compared to 196 for the 2000s. The RoRo orderbook expanded by +10% in 2017, the second highest figure recorded this decade. On average, the RoRo orderbook has declined by -10% from 2010 to 2018, with 2012 (+2%) and 2013 (+14%) the only other years where increases where observed.
CONTAINERSHIP FLEET
Total Containership fleet grew by +2% to 20 million TEU in 2017, following stronger growth in 2016 (+5%) and 2015 (+8%). Similar trends were observed for DWT, which grew by +1% to 248,000 DWT in 2017, slower compared to 2016 (+4%) and 2015 (+7%). While the number of vessels averaged 5,144, a decline of -1%, the first decrease so far this decade, although growth has not exceeded +2% since 2011. This can be attributed to the continued fall in deliveries in 2017, which declined by -17% both in terms of TEU and DWT, and -12% for total number of vessels. This downward trend has been observed since 2009, with the exception of 2014 which saw a +6% increase. Demolitions declined by -39% in terms of TEU and -26% for vessels, following a spike due to improved scrap prices, in addition to lowered Time Charter Rates in 2016.
DRY BULK FLEET
The Bulk fleet recorded an increase of its capacity in 2017, compared to 2016, growing +3.2% to 809,000 DWT. The previous year saw the Bulk fleet grow at its slowest since 2000 at 2.1% to 783,000 DWT. The figures mirror those from 2000 – 2004, which perhaps reflect a return to more normal levels of expansion in future. A similar trend was observed for the total number of vessels, which increased by +2.3% in 2017, to an average of 11,041, following 2016 (+1.6%) recording the lowest level of growth since 2003 (+0.8%). The orderbook for the Bulk fleet continued to fall in 2017, and at its steepest since the downward trend first began in 2010. Bulk DWT declined by -37% to 71 million DWT, while the total number of vessels also declined by -43%.
TANKER FLEET
The capacity across the five main categories of the Tanker fleet saw growth in 2017. Afamax grew by +5%, Handysize and Panamax both grew by +4%, Suzemax grew by +9% and VLCC by +7%. The orderbook for deliveries declined across all categories in 2017. Afamax declined by -15%, Handsize by -23%, Panamax by -32%, Suezmax declined the most by -27%, and VLCC by -22%. Demolitions increased by +158% in 2017, from 40 in 2016, to 102 in 2017.
GRAPH 24A
Containership Orderbook by Size Range: 2010-2017
0
500000
1000000
1500000
2000000
2500000
3000000
3500000
4000000
4500000
5000000
20172016201520142013201220112010
TEU
Intermediate 6,000 - 8,000 TEU
Neo-Panamax 12,000 - 15,000 TEU
Neo-Panamax 8,000 - 12,000 TEU
Intermediate, 3,000 - 6,000 TEU
Total Feeder
Post-Panamax 15,000+ TEU
Source: Clarksons
GRAPH 24B
Bulk Carrier Orderbook: 2010-2017
0
50
100
150
200
250
300
350
20172016201520142013201220112010
DWT,
Mill
ions
Bulk Orderbook Tanker Orderbook
Source: Clarksons
GRAPH 24C
Demolition by Fleet Category: 2010-2017
0
100
200
300
400
500
600
700
20172016201520142013201220112010
No.
of V
esse
ls
ContainershipTanker Bulk Carrier RoRo
Source: Clarksons

39
GLOSSARY OF TERMS
Aframax: derives its name from AFRA which stands for Average Freight Rate Assessment, refers to a tanker of between 80,000 – 120,000 DWT.
bbl: Oil Barrel
bpd: Barrels Per Day
Capesize: Vessels that average at 156,000 DWT, they cannot transit Suez Canal
CSO: Central Statistics Office
CPI: Consumer Price Index
cSt: Centistoke (measurement of fuel viscosity)
DWT: Dead Weight Tonnage
ESRI: Economic and Social Research Institute
GDP: Gross Domestic Product represents the total value added (output) in the production of goods and services in the country.
GNP: Gross National Product is the sum of GDP and Net factor income from the rest of the world.
Handysize and Supermax: Ships of 50,000 – 60,000 DWT.
HICP: Harmonised Index of Consumer Prices
IFO: Intermediate Fuel Oil
Merchandise Trade: Goods which add or subtract from the stock of material resources of a country by entering (imports) or leaving (exports) its economic territory.
Panamax: Are cargo ships that travel through the Panama Canal, up to 52,500 DWT.
Product Tankers: Vessels that carry Clean Petroleum Products, including gasoline, jet fuel, naphta and clean condensates.
Freight Unit: Wheeled equipment for carrying cargo, such as a truck, trailer or semi-trailer, which can be driven or towed on to a vessel
Suezmax: Oil tanker vessels between 120,000 – 250,000 DWT in size.
TEU: Twenty-foot Equivalent Unit
TCR: Time Charter Rates are set for shipping vessels for a fixed period of time, instead of a certain number of voyages. Rate averages allow comparisons between periodic changes in a shipping company’s performance.
VLCC: Very Large Crude Carriers are oil tanker vessels between 150,000 – 320,000 DWT in size.
SOURCES OF DATAThe bulletin contains the results of quarterly and annual analysis of activity at Irish ports, and the activity of shipping lines operating from Irish ports. The data is compiled from returns made by the Harbour Authorities, State Companies, Northern Ireland Ports and RoRo shipping lines on routes to and from Ireland and the UK as outlined below:
PORT COMPANIES:
Drogheda Port Company
Dublin Port Company (Including Dundalk Port Company)
Dún Laoghaire Harbour Port Company
Galway Port Company
Greenore Port Company
New Ross Port Company
Port of Cork Company (Including Bantry Bay Port Company)
Port of Waterford Company
Rosslare Europort
Shannon Foynes Port Company
Wicklow Port Company
Port of Youghal Company
NORTHERN IRELAND PORTS:
Belfast Harbour Commissioners
Foyle Port
Port of Larne
Warrenpoint Harbour Authority
ROLL-ON/ROLL-OFF SHIPPING LINES:
Irish Ferries
P&O Irish Sea Ferries
Seatruck Ferries
Stena Line
ACKNOWLEDGEMENT: Marine Traffic very kindly provided the data for Graphs 14A and 14B (p. 27) and we would like to thank them for their professionalism and helpfulness in assisting us with it.
Glo
ssar
y an
d So
urce
s

40
TECHNICAL NOTE
• The iShip Index is a weighted indicator comprised of five separate indices, representing the main maritime freight categories moving through ports in the Republic of Ireland: LoLo, RoRo, Dry Bulk, Liquid Bulk & Break Bulk.
• The LoLo index comprises solely of laden traffic.
• The following ports have been included in the index: Port of Cork, Drogheda Port, Dublin Port, Dundalk Port, Dún Laoghaire Harbour, Galway Harbour, Greenore Port,
New Ross Port, Rosslare-Europort, Shannon Foynes Port, Port of Waterford and Wicklow Port. Bantry Bay has been excluded as its throughput is predominantly of a transhipment nature.
• All data is derived from the individual port companies and subject to a one-year revision period.
• The base period is Quarter 1 2007 at which all indices equal 1000.
TRAFFIC BREAKDOWN
LIQUID BULK: Consists mainly of petroleum, heavy fuel oil, liquefied gas and bio-ethanol.
DRY BULK: Consists mainly of animal feed, fertilizer, cereals, ore, bauxite, alumina, and coal.
BREAK BULK: Consists mainly of construction related materials and project cargo.
LoLo (LIFT ON/LIFT OFF): There are direct daily container services from the Republic of Ireland to Great Britain, mainland Europe and the Mediterranean. There are also worldwide transhipment services available from the Republic of Ireland.
RoRo (ROLL ON/ROLL OFF): This traffic is wheeled accompanied and unaccompanied goods vehicles. The majority of this trade is between Ireland and the United Kingdom, but there is also a Con-Ro service between Ireland and Continental Europe included in this traffic classification.
FORECASTING
A univariate time series model is determined by its own history and by random effects that have taken place in a variable’s past.
The variables used within this forecasting model are monthly throughput for the following traffic categories: Laden LoLo, RoRo and Total Bulk.
After assessing the forecasting accuracy of a multitude of univariate models, the Seasonal Auto Regressive Integrated Moving Average (SARIMA) method and the Exponential Smoothing (ES) method were found to be the most appropriate for the data in question. SARIMA was found to be the best univariate model in forecasting RoRo and LoLo, while ES was found the most appropriate for Bulk. Both SARIMA and ES are well established methods of forecasting variables.
Note: Only Republic of Ireland throughput data is used. Bantry is excluded from Total Break due to the volatility of transhipments making it harder to make forecasts in the Bulk category.
Tech
nica
l Not
e

DESIGN BY

THE IRISH MARITIME DEVELOPMENT OFFICE Telephone: +353 1 775 3900 Email: [email protected] www.imdo.ie