Volume 11. Number 1 January-June, 2019 ISSN: 0974-0988
62
Transcript of Volume 11. Number 1 January-June, 2019 ISSN: 0974-0988


January-June, 2019Volume 11. Number 1 ISSN: 0974-0988
EDITORIAL BOARD
Chief Patron
Shri Ram Kishore Agarwal
Chairman
GL Bajaj Group of
Institutions
Patron
Mr. Pankaj Agarwal
Vice Chairman
GL Bajaj Group of
Institutions
Chief Editor
Dr. Urvashi Makkar
Director General
GLBIMR, Greater Noida
Editors
Dr. Prachi Agarwal
Associate Professor
GLBIMR, Greater Noida
Dr. Anand Rai
Associate Professor
GLBIMR, Greater Noida
Dr. Alain BogéHead of MBA Programme (Fragrance and Cosmetics), ISC Paris, School of Business (Former CEO at BGM International, France)
Dr. Arun UpnejaDean and Professor, Boston University School of Hospitality AdministrationBoston, USA
Dr. H. G. ParsaProfessor, Daniels College of Business, University of Denver, USA
Dr. Djamchid AssadiProfessor, Burgundy School of Business, France
Dr. Bharath M. JosiamProfessor, Hospitality and Tourism Management, College of Merchandising Hospitality and Tourism, University of North Texas, USA
Ashish PatelManaging Director, Morgan Franklin Consulting, MCLean, Virginia, USA
Dr. Ka LinProfessor, Zhejiang University, Hangzhou, China
Dr. Elisante Ole Gabriel Permanent Secretary, Ministry of Information, Youth Culture and SportsDar Es Salaam, Tanzania
Dr. K.L. JoharFormer Vice Chancellor, Guru Jambheshwar University, Hissar, Haryana, India
Dr. Sanjiv MittalProfessor & Dean, University School of Management Studies, GGS Indraprastha University, New Delhi, India
Dr. Madhu VijProfessor, Faculty of Management Studies, University of Delhi, India
Dr. Shiv Kumar TripathiVice Chancellor, Mahatma Gandhi University, Meghalay, India
Hashan HaputhantriHead of Marketing, TVSL, Sri Lanka
Dr. Satish KumarAssociate Professor & HOD, Dept. of Management Studies, Malviya National Institute of Technology (MNIT), Jaipur, India
Kamalendu BaliDirector-Solutions, Concentrix, Gurgaon, India
Dr. S.M. SajidProfessor, Department of Social Work, Jamia Millia Islamia(Former Registrar and Pro Vice-Chancellor), Jamia Millia Islamia, India
Dr. Ravindra K. GuptaPrincipal, PGDAV College (Eve.) University of Delhi, Delhi, India
'Optimization': Journal of Research in Management is a bi-annual peer reviewed journal of GL Bajaj Institute of Management and Research, Greater Noida. It aims at bridging the gap between the known and the unknown, between theory and practice and also between perspectives of academics and those of the corporate world. It consists of multi-disciplinary, interdisciplinary empirical and conceptual research work dedicated towards advances in contemporary and futuristic research in the area of management. The Journal focuses on empirical and applied research that is relevant to practicing managers and meets the standards of academic rigor. Please refer to back page for Guidelines for Authors.
Contact Address
Chief Editor
GL Bajaj Institute of Management and Research, Greater NoidaApproved by AICTE, Ministry of HRD, Govt. of India, for PGDM Program
Plot No. 2, Knowledge Park – III, Greater Noida, G.B. Nagar, (U.P.) – 0201306 India.
Website: http://glbimr.org/journal-glbimr.php
The views expressed in the articles and other material published in 'Optimization' Journal of Research in Management does not reflect the opinions of the institute.Copyright @ GL Bajaj Institute of Management and Research, Greater Noida. All Rights Reserved. ISSN -0974-0988
E-mail: [email protected],
ADVISORY BOARD
Listed in EBSCO and Indexed in i-Scholar Database

From the Desk of the Chief Editor..............
In the rapidly changing world, businesses are witnessing an exciting era of challenges. Organizations aregrappling with constant change—from strengthening economic activity in emerging markets, to the riseof digital revolution, to increasing regulations , growing threat of cybercrime and data privacy risks, thewar for talent, and the quickening pace of technology innovation. This is coinciding with the positivephase when our bi –annual peer reviewed ‘Optimization: Journal of Research in Management’have assumed a very professional and proactive role in promoting research of high standards in Indiaand globally. Since its inception, the Journal has made outstanding progress and has exceptionallycontributed in the field of research. In adherence to reflection of its excellence, we are pleased to informyou that ‘Optimization: Journal of Research in Management’ is now listed in EBSCO andindexed in i-Scholar Database.
The present issue of the ‘Optimization: Journal of Research in Management’, Volume 11, Number1, January-June 2019 encompasses an excellent assembly of articles and research papers on themeslike financial inclusion, assets investment, risk management, digitalization, customer relationshipmanagement, green logistics and human resource development for the benefit of the readers, practitioners,researchers and academicians.
The first research paper “The Poor’s Wealth: The Case of Istanbul’s Suburbs in Turkey” hasbeen authored by Beyza Oba, Djamchid Assadi, and Zeynep Kabadayi Kuscu. The researchersexamined the Accumulation of Wealth by Poor People of Turkey by conducting a survey on assets possessedby them. Based on interviews with minimum wage earners about the wealth of their households it wasfound that the lower-income groups accumulated wealth mainly by debt which makes them vulnerableto any financial crises and negatively influences their living conditions.
The next paper co-authored by Subagyo and Kanchan Bisht on “Performance Analysis of DifferentAsset Class in India” compares historical returns of different asset class namely Nifty 50, Sensex 30,Equity Mutual fund, Debt Mutual fund, Gold and Real Estate for 10 years horizon and discusses theimpact of recent change in the Indian Financial Budget relating to Long Term Capital Gain Tax (LTCG)over Real Estate investor’s returns.
Shwetank Parihar and Chandan Bhar in their paper on “Markov Analysis as a Tool forDeveloping a Model for Risk Management: A Case Study based on Electrical TransmissionLine Installation Projects” analyzes the various aspects of risk assessment, when there is very lowhistorical data available, by the use of Markov analysis and expert opinion for impact value. The paperalso proposes a model for risk assessment that can be very well employed at the projects where thehistorical data is very less and overall risk mitigation can be dealt very efficiently.
The next research paper by Debarun Chakraborty and Wendrila Biswas on “Digital India andIndian Society: A Case Study” reviews the impact of Digitization on Indian Society and highlightsthat how digitization has led to social transformation by supporting and enhancing elements such asliteracy, basic infrastructure, overall business environment, regulatory environment, etc. It argues thatthe Digital India program is just the beginning of a digital revolution, once implemented properly it willopen various new opportunities for the citizens.

Volume 11, Number 1 January-June 2019 ISSN No. 0974-0988
Contents
S.No. Page No.
Research Papers
1. The Poor’s Wealth: The Case of Istanbul’s Suburbs in Turkey 1-14Beyza Oba, Djamchid Assadi & Zeynep Kabadayi Kuscu
2. Performance Analysis of Different Asset Class in India 15-22Subagyo & Kanchan Bisht
3. Markov Analysis as a Tool for Developing a Model for Risk Management: 22-29A Case Study Based on Electrical Transmission Line Installation ProjectsShwetank Parihar & Chandan Bhar
4. Digital India & Indian Society: A Case Study 30-34Debarun Chakraborty & Wendrila Biswas
5. Effective CRM Adoption and Implementation: The Critical Role of Flexibility 35-40Kumar Shalender & Rajesh Kumar Yadav
6. Study of Green Logistics Practices: A Case of 3PL in the Automobile Industry 41-47Raj Kumar Malik & Gyanesh Kumar Sinha
7. Human Resource Development Practices and Employee Performance: 48-55Study of Indian Automobile IndustryAshwini Mehta & Yogesh Mehta

1Volume 11, No. 1
* Professor, Faculty of Business Administration, Istanbul Bilgi University, Istanbul, Turkey
** Professor, Digital Management Department, Burgundy School of Business, Dijon, France
*** Lecturer, Department of International Management and Trade, Piri Reis University, Istanbul, Turkey
The Poor’s Wealth: The Case of Istanbul’s Suburbs in Turkey
Beyza Oba,* Djamchid Assadi** & Zeynep Kabadayi Kuscu***
ABSTRACT
What constitutes the wealth of the poor and howis it accumulated? The objective of this paper isto appraise the assets that the poor might havein the specific context of Turkey where the officialstatistics might underestimate them. This questionis of crucial importance because of its contrastwith the accumulation of wealth that occurredfollowing the financialization of the economy inthis country and market-oriented policies. Basedon interviews with minimum wage earners aboutthe wealth of their households we identified majorcategories of wealth prevalent among low-incomegroups that might have been invisible to theofficial statistical radars and how they areaccumulated. Our sample of low-income groupsand their wealth means having a house, a carand ability to pay for the schooling of olderchildren. Our results indicate that lower-incomegroups accumulated wealth mainly by debt whichmakes them vulnerable to any financial crises andnegatively influences their living conditions.Furthermore, we argue that accumulating wealththrough debt reproduces social inequality and highinterest debt of many low-income families leadsto wealth (dis)accumulation since they own lessof their material wealth.
Keywords: Wealth, income, Social stratification,Financialization, Financial inclusion, Turkey
INTRODUCTION
Social scientists have under-estimated the impactof wealth on economic wellbeing and socialstratification in favor of that of income in the lastfew decades. Basically, the absence of data forempirical analysis and the evolution of theoreticalparadigms explain this oversight.
While data on wealth accounting and estimatesand on national balance sheets were available priorto World War 1, the focus has progressively shiftedto the income statistics to explore social inequality.The focus of national accounts has been mainlyflows of output, income and consumption ratherthan stocks-assets and liabilities (Piketty andZucman, 2014). Thus, data on wealth accumulationin a specific country has been based on flows ofsavings and investments. The theoretical apparatuson wealth have also evolved. In the early postWorld War II years, wealth was theoreticallyassociated to the elite power, as mainly elite groupscould proceed to accumulation of wealth (Skopeket al., 2014). Only after the full-blownindustrialization, wealth became an issueencompassing the whole population.
The above theoretical under-estimation is howeverdetrimental to studies of social stratificationbecause wealth plays a significant role as generatorof income, material comfort, stabilization ofconsumption, access to political power and social

Optimization: Journal of Research in Management2
status (Wilterdink, 2007), educational attainmentand social mobility (Kus, 2016), health and well-being (Bonini, 2008; Hochman and Skopek, 2013).Furthermore, ordinary traits of every society suchas age composition, households’ structure andearnings, inheritance (Cowell et al., 2017),institutional settings, property rights (De Soto,2000) and economic conditions also contributeto wealth accumulation and consequently to wealthdistribution.
Many researchers assert that financialization whichpenetrated almost all countries has also intensifiedwealth accumulation and subsequently socialstratification. Policies of easy access to credit suchas subprime loans, refinancing, credit cards andautomobile titling enabled lower and lower-middlegroups to acquire assets, which they would nothave been able to afford otherwise.
Asevolution of wealth modifies social stratification,the study of wealth distribution supports theunderstanding and conceptualizing of socialstratification. Individuals and households oftenconsider wealthas the basis of decisions onconsumption and investment in any given society(Skopek et al., 2014).
In line with the above, we address this inquiry:do the poor have actually wealth that nationalstatistics overlook? The objective is to appraisethe poor’s assets that public authorities might haveneglected to record because ofhigh cost ofregisteringsmall and unclassified properties. In thisperspective, we endeavor to discover how low-income groups accumulate wealth -in particular-with recourse to indebtedness. In so doing, weaim to provide grounds for further discussions onthe usage of credit to improve the low-incomegroups’ position in social stratification.
We conduct this research in the specific contextof Turkey which contains the two pillars of ourresearch subject: social stratification by wealthdistribution and recourse to loans to build upassets. Turkey scores high in poverty rate (17.3 %in 2014). 50% of the population earn less than50% of the median disposable income as comparedto 11 % in the OECD countries (OECD, 2016). Ginicoefficient stands at 0.404 in 2016 (TurkishStatistical Institute).However, credit usage steadilyincreases in the balance sheet of even modestrevenue, households (TCMM, Central Bank ofTurkey; TBMM, The Banks Association of Turkey).Financial crises forced banks to change their targetthe credit segment of the middle and low-incomegroups (Kuº, 2016). Households started to use
credit to improve their living standards. Lowincome and upper middle classes are the maintarget of consumer credits, mortgage andautomobile titles. Low-income groups face adilemma. They can use high-cost debt to improvetheir wealth such as home, car, higher educationand even consumption of heavy appliances.However, by doing so, they must meetsimultaneously daily expenses and financial chargesto honor their debts. Low-income groups riskvulnerability during a crisis because of high-costfinancial products, sold disproportionately topeople with less education. The percentage of non-performing loans is particularly high in Turkey.
We conducted our field study in suburbs ofIstanbul and collected data about the assets andliabilities of several low-income households.However, we did not aim to from a representativesample to generalize findings to a parent-population at a national level. At this stage, wedesigned our field research for familiarizing withthe peculiarities of the poor’s wealth and comparingit to the official statistics. Since we consider wealthrather than income to explore social stratification-without disbelieving the role of the latter- we havecorollary focused on understanding the peculiaritiesrather than counting variable of a preconceivedmodel.
The contribution of this paper is twofold; first weaim to develop an insight about household wealthof the low-income households which cannot bedelivered by national statistics. As an alternativeto studies on wealth we use micro level data onhouseholds provided by individuals. Although thismicro data, to a limited extend is available forsome countries, in case of Turkey such data isnot available. Forexample, the OECD report “InIt Together” (2015) provides a detailed data setabout the composition of household wealth whichincorporates the distribution of non-financial andfinancial assets and liabilities, whereas dataregarding household wealth is not available forTurkey. Second, this study focuses on low-incomegroups; forexample, Piketty and Zucman(2014)estimate top wealth shares based on tax returnsand estate returns. Alverado et al., (2018) indicatethat as a sample for top income groups in theMiddle East countries they have used billionaireslist published by Forbes. However, this is a difficulttask as well, due to under-reporting and usage ofoffshore bank accounts. In contrast this studyfocuses on low-incomehouseholds and tries tounderstand to what extend wealth and income arecorrelated.

3Volume 11, No. 1
Attempting to address this inquiry, the reminderof the paper is structured as follows: First, wereview the extant literature to provide a precisedefinition of wealth and its components. What weexactly understand by wealth logically precedesany exploration on the wealth of low-incomegroups. Second, we provide an overview of Turkisheconomy with an emphasis on poverty and theactions taken by political authorities. Third, wepresent the research design and in particular, themultidimensional questionnaire we have developedaccording to the literature review. Fourth, wedescribe the empirical study and a report of thefindings. Paper concludes with the discussion ofthe findings as they pertain to wealth, financialinclusion and social inequality.
LITRATURE REVIEW
Drawing on the requirements of our research inquiry,this section proceeds to the review of literature onwealth, accumulation of wealth, distribution of wealthand income inequality in Turkey.
Wealth and its Functions
A person’s purchasing power mainly derives fromincome and wealth. The former’s main source isemployment. The latter’s is the ownership of assetslike property, savings, shares, etc. Wealth andincome are different with reference to time; incomeis what an individual has at a point in time, whilewealth generally accrues across periods andgenerations. In other words, wealth is a stock ofassets, which is accrued through time and reflecthistorical well-being, but income reflects currentflow of earnings (Cowell et al., 2017; Skopek etal., 2014).
Income and wealth are however complementaryin the sense that wealth is often the result of theaccumulation of not affected revenues. Individualsbuild their patrimony by renouncing affectingincome to current expenditure and consumption.Wealth can also yield an income and contributeto an agent’s current or future purchasingpower.One can also increase his/her assets throughcredit and debt. However, what s/he still oweson them is not considered yet as his/her wealth.Wealth is thus the total assets belonging to acertain unit such as a person, a family or a countryminus any liabilities.
These assets can be financial assets such as savingsaccounts, stocks, or bonds; material assets likevehicles, refrigerators or other consumer durables;property such as home, farm, or business (Scholz
and Firestone, 2007; Cowel et al., 2017; Spilerman2000). Generally, a household’s wealth containsproperty wealth, financial wealth, physical wealth,and private pension value. Property wealth reflectsthe value of a household’s main residence plusany other property such as second home, holidayhomes, buy-to-lets, and land. The net propertyvalue equals properties minus values for anymortgages held against the properties. Financialwealth comprises monies saved both formally (incurrents account, saving accounts, stocks andshares) and informally (saved under the bed andin children’s assets). Liabilities such as debts oncredit cards, arrears on household bills, studentloans are subtracted from the above to provide anet measure of financial wealth. Physical wealthreflects the value of household contents,possessions and valuables in the main residenceand any other properties owned. Some examplesinclude antiques, artworks, stamp collections, etc.The values of vehicles are included here. Thecalculations sometimes do not register smallerbelongings, such as computers, because they haveless retained value. Finally, private pension valueis the accrued value in all pensions that are notrelated to state supported retirement. This includesoccupational pensions, personal pensions, retainedrights in private pensions and pensions in payment.
Carl Menger (1934) does a distinction betweenproperty and wealth which is insightful for ourresearch. Property is the sum of goods at a person’scommand. Wealth is the sum of economic goodsat an individual’s command. The existence of wealthpresupposes, therefore, an individual in a positionto employ for the satisfaction of his needs,the economic goods whose supplies are smallerthan the demands for them. Hence, if there werea society where all goods were available in amountsexceeding the requirements for them, there wouldbe neither economic goods nor any wealth.
Researchers believe and distinguish wealthaccomplishes different functions in society(Wilterdink, 2007; Skopek et al., 2014):
1) Replicating itself by profits, interest, rents anddividend,
2) generating revenues,
3) providing material comfort through durablegoods having utility functions,
4) safeguarding material security in case ofinterruptions in income (Spilerman, 2000) andas a result, prevent downward social mobility(Yorke, 2015),

Optimization: Journal of Research in Management4
5) offering freedom and autonomy in consumption,leisure, postponing or quitting work,
6) achieving social statusby showing possessionsor by obliging others through generosity andmaterial help,
7) giving access to political and economic power,and
8) enhancing family privileges and linkstransferring fortune from one generation to thenext through inheritance to descendants (Scholzand Firestone, 2007).
Accumulation of Wealth
Semyonov and Lewin-Epstein (2013) identify threemechanismsas the main sources of wealth creationand accumulation: income from work,intergenerational transfers (inherited wealth) andstate created opportunities.Income is mainly usedto cover household expenditure and if any is savedcreates wealth for investment or else. In thisperspective, wealth generated by income is atradeoff between savings and consumption. Peoplecan save more when they earn and de-accumulatewhen their incomes decline.Schneider et al. (2016)also believe that different saving habits affectinequality of wealth. If the work is the main sourceof a household’s income, then its membersgenerally prefer to save rather than consume(Spilerman, 2000). Low-income groups will sufferin both cases since they will have meager resourcesfor building their future (getting a life insuranceor a house) and enjoying present (consumingleisure, arts and household durables). Inheritancecan also influence wealth accumulation processpositively (Skopek et al., 2014, (Gale and Scholtz,1993). It has been reported that intergenerationaltransfers influence educational and human capitalattainment (Rumberger, 1983). Finally, thegovernment transfers constitute a third source forwealth accumulation and includewelfare policieslike housing and land acquisition, pension funds,taxation, inheritance laws (Semyonov and Lewin-Epstein, 2013; Cowell et al., 2017).
Distribution of Wealth
As wealth gives access to privileges, one can arguethat unequal wealth accumulationcan lead toinequality and social stratification. Various studiesreport a positive relation between wealth and livingstandards (Spilerman, 2004), education (Nam andHuang, 2009), life performance (Pfeffer andHallsten, 2012), health (Semyonov et al., 2013),well-being (Hochman and Skopek, 2013).
If wealth is taken as a capacity of maintaining astandard of living, then it can have differing effectson consumption of wealthy and poor groups(Semyonov and Lewin-Epstein, 2013; Torche andCosta-Riberio, 2012). For example, illness or jobloss affect more households whocannot benefitfrom security provided by wealth. Similarly, low-income groups have less chance to participate inthe political process and be involved in the powerprocess.
Also, household wealth in the form of a vacationhome or piece of art can provide enjoyment to itsowner and household assets can be used as acollateral for the provision of credits for startingup a small business. Households with less wealthhave less chance of acquiring assets (a house, acar), cultural capital and experiencingentrepreneurial ventures. Thus, wealth and itsaccumulation will have a significant influence onthe development and maintenance of socialstratification.
While most economists have paid attention tothe distribution of income, a few like Atkinson(1996) have pioneered the research on thedistribution of wealth. Piketty (2017) used aplethora of data to confirm that the growinginequality between incomes derived from capital,super-manager salaries and inherited wealth onone side and those derived notably from laboron the other side, has considerably underminedthe meritocratic values of democracy. Thedistribution of wealth continues to be unequal,unless the proportion of capital-income lowersas opposed to that of other forms of income(Piketty, 2017). However, Schneider et al. (2016)demonstrate that inequality in the distributionof incomes accounts for only half of the inequalityin the distribution of wealth.
For reducing wealth inequality, Schneider et al.(2016) suggest a variety of methods such as taxationof wealth-holders-and-transfers, upsurge incommunal ownership, development of shares inmutual funds, a progressive inheritance tax, andmeasures to reduce the marginal benefits to thebenefits of low income earners. Corollary, incentivesto save among low-incomers and to consume forthe rich would reduce inequality of wealth.
Whilst distributive policies might be useful, it isvital to avoid capital flight and decline of a nation’saffluence (Schneider et al., 2016).One should notunderestimate that economic growth improves thesituation of the poor, even though it is oftenaccompanied by inequality. Okun (2015) believes

5Volume 11, No. 1
in a positive correlation between inequality andeconomic growth. In fact, a degree of inequalitymight mean that the savings of the rich can meetlarge set-up costs of providing more funds forinvestment, and creating more income-generatingjobs for the poor. Inequality fell continuouslyduring the first three quarters of the twentiethcentury, but thereafter remained either relativelyconstant or increased (Schneider 2004, Schneideret al. 2016).
From an economic perspective, people mighta cc ep t i n cr ea s in g i nequa li ty i f ec onomi cgrowth benefits to their income and wealth.However, from a social vantage, they mightconsider the material equality as a due rightin a modern society. Schneider et al. (2016)claims the level of accepted inequality of thewealth distribution depends on views of whata society should be like.
The Turkish Context
In this section, we provide evidence about macrolevel variables that influence wealth accumulationoflow-income groups in Turkey.Turkey scores 0.398in income inequality, highest among memberOECD countries, and represents à high rate ofpoverty rate in both older and younger groups.In younger groups poverty rate is even morepronounced. Poverty gap in Turkey is 0.306, whichindicates that the mean income of the poor is belowthe poverty line (OECD 2014). 14.3 percent of thepopulation is below the poverty line (TUIK, 2016).
Distribution of household income shows that low-income groups (first quintile) account 6.2 percentof the total while high income groups’ share (lastquintile) is about 47.2 percent (TUIK, 2016). Mainsources of household income among low-incomegroups is wages and salaries (39.7 per cent), socialtransfers (20.5 per cent), ownership of smallbusiness (16.9 per cent), casual work (14.5 percent) and pensions (12.8 per cent) (Table 1).
Table 1: Distribution of Household Income (Comparison BetweenLow and High Income Groups)
Types of Income Years Total First Quintile Last Quintile
Wages and salaries 2016 49,7 39,7 51,4
Casual 2016 2,5 14,5 0,4
Entrepreneurial 2016 19,8 16,9 23,7
Agricultural 2016 5,0 8,9 3,7
Non-agricultural 2016 14,8 8,0 20,0
Rental income 2016 3,1 1,2 4,3
Property income 2016 2,5 1,4 3,4
Social transfers 2016 19,6 20,5 14,7
Pensions and survival 2016 18,0 12,8 13,8
benefits
Other social transfers 2016 1,6 7,7 0,8
Inter-household 2016 2,5 4,5 2,0
transfers
Other 2016 0,2 1,3 0,0
Source: TUIK, 2016
Largest portion of household expenditure (allquintiles combined) goes to rent (25.2 percent),food (19.5 percent) and commuting (18.2 percent).House is a common asset in most of the Turkishhouseholds. 52.9 per cent of the low and middle-income families and 64.9 per cent of the uppermiddle and high-income families have a house
(TUIK, 2016). Similarly, both groups use consumercredits: 56 per cent and 74.5 per cent respectively.However, 93.3 per cent of low-income groupscannot afford to have a week of holidays in a yearand 60.4 per cent of them report that they donot have a capacity to afford unexpected expenses(Table 2).

Optimization: Journal of Research in Management6
Given these facts about poverty and wealth inTurkey, a deeper insight can be developed byproviding a background about the political, socialand economic antecedents of poverty gap with aspecial focus on the role assumed by the state.
Two dominant actors characterize the Turkishmodernization project: family owned conglomeratesand a centralized bureaucratic state. The latterhad a dominant role in the creation of businesselites, big business groups as well as themaintenance of law and order (Heper, 1985).Industrialization was the major of the politicalauthorities during the statist period (Buðra, 2007).
During 1960s, the rural poor started to findtemporary and seasonal jobs in the newlydeveloping fringes of cities, called “gecekondu”.Gecekondu settlements were built on publiclyowned land with often no water and sewage
systems and without legal permissions. Peoplemoving from the countryside to the cities continuedto keep their fields in their villages and in a wayhad a double income. Gecekondus, which were builton public property (either state owned or belongingto municipalities). By provisioning amnesties andassurance for a legal ownership, political partiesaimed to gain the support of the gecekondu settlersas a voting pool by political parties. Gecekondusdefinitely enjoyed a redistribution effect (Baþleventand Dayýoðlu, 2005).
In 1980, Turkey shifted from state-led and inwardoriented industrialization to neoliberal reformsconducting to the development of privateentrepreneurship and the strengthening of informaleconomy. The gecekondus settlers moved to citiesfor a better earning and possibly better livingconditions. This migration created a labor force(Elveren and Ozgür, 2016) and the “urban poor”(Pinarcioðlu and Iþýk, 2008).
Table 2: Some Indicators of Living Conditions (2015, 2016)
Below 60% Between Above 120%of the Median 60%-120% of of the
income the Median Medianincome income
Living conditions indicators 2015 2016 2015 2016 2015 2016
Owner (%) 57,2 52,9 58,5 58,2 64,2 64,9
Tenant(%) 25,8 29,4 23,9 24,6 21,4 21,5
Lodging (%) 0,3 0,5 1,0 1,0 2,4 2,6
Other(%) 16,7 17,2 16,6 16,2 11,9 11,0
Installments and loans (Other thanmortgage -for the main dwelling-andhousing cost)
A heavy burden (%) 27,0 25,3 28,1 22,5 22,7 19,5
A slight burden (%) 27,5 28,8 37,5 41,8 42,4 44,1
Not burden at all (%)No installment/ 1,6 1,8 2,6 3,8 9,3 11,0
loan (%) 43,9 44,1 31,8 32,0 25,6 25,5
Capacity to afford paying for one weekholiday/year
Can afford (%) 5,2 6,7 17,7 23,9 53,0 59,3
Cannot afford (%) 94,8 93,3 82,3 76,1 47,0 40,7
Capacity to afford a meal with meat,chicken or fish every second day
Can afford (%) 29,1 37,1 56,2 56,1 92,3 82,3
Cannot afford (%) 70,9 62,9 43,8 43,9 7,7 17,7
Capacity to afford unexpectedfinancial expenses
Can afford (%) 33,5 39,6 61,0 60,4 93,0 85,0
Cannot afford (%) 66,5 60,4 39,0 39,6 7,0 15,0
Source: TUIK, 2016

7Volume 11, No. 1
Another outcome of the post 1980 neoliberalreforms wasthe emergence of informal economy(Kus, 2014). Increase in informality led to lesstax revenues and social security premiums, andin fine influenced income redistribution. After 1980,with the expansion in labor-intensive sectors liketextiles, a decrease in wages in these sectors wasobserved. Urban poor, which were not educatedor only had a primary school education, becamepart of the informal economy by being involvedin entrepreneurial activity. In addition, they findjob opportunities as unskilled labor force in theinformal economy.
Parallel to the evolution of the incomes, theformation of wealth also witness changes as theregulative capacity of the state has decreased, urbanpoor located at the outskirts of cities, as“gecekondu” habitants were able to benefit andaccumulate wealth from the illegal real estatemarket (Pinarcioðlu and Iþýk, 2008). Also,meanwhile the former gecekondu owners who wereable to benefit from the various populist moves(amnesties) of the ruling parties were able toincrease the value of their property; gecekondusthat were once modest one room structures turnedto be multi-floor structures. Owners of these multi-floor gecekondus turned out to be property ownersof the urban property. This phenomenon remindsthe argument Do Soto (2000) states about theimpact of institutional settings on property rights.The development of this market was not limitedto the deliberate actions of the urban poor; highincome groups were fascinated to have enclaves(so called site) which will provide a high qualityof life (facilities which provide opportunity forsports, for socializing, replace cooking at home, aspace for quasi-cultural activities), guarded andsafe and yet affordable. Big business groups thatwere engaged in construction industry were alsodrawn in to exploit this opportunity. Thus,gecekondus built at the fringes of big cities bythe rural poor for housing necessity becamevaluable urban property and an income source fortheir owners. Furthermore, as a recentphenomenon these areas (former gecekondudistricts), became the subject of gentrification andare transformed to suburban residence sites orsatellite cities. These sites accommodate bothmiddle class professionals and low-income groupswhose ancestors once owned a gecekondu on thatland. Since by various amnesties, gecekonduowners had the legal right to ownershipgentrification provided an opportunity for themto own a house in these dwellings.
Currently, the low-income groups are better equippedin terms of material wealth since they can accumulatethrough intergenerational transfer of wealth fromtheir ancestors who were the property owners ofgecekondus and benefitting from credit usageopportunities provided by financialization. We alsostress that wealth accumulation and redistributionof the poor is influenced by the populist initiativesof the political parties, which evaluate these groupsas an important potential source for ballots. Asindicated by Kus (2016), Turkey witnessed the riseof a “debtfare system”where as discussed byCarruthers (2007) political rules determined theboundaries for economic rules and people engagedin markets followed the political rules forced themarket forward.
RESEARCH METHODOLOGY
On the field, we aimed to measure householdwealth and of low-income families in Turkey. Wealso tried to find out how wealth is accumulatedamong low-income groups. Our unit of analysiswas household. Following Cowell et al. (2017), wedefine household as a group of people who livein the same dwelling and share householdexpenses. TUIK, Turkish database where wecollected some of our data also adopts a similardefinition and stresses that household memberscollectively meet their basic needs. If wealth istaken as a potential of consuming and maintaininga living standard, then household as a unit ofanalysis is pertinent for a better understandingof poverty, wealth accumulation or dis-accumulation and finally social stratification.
Referring to our literature review, we definehousehold wealth as the total sum of assets(financial and non-financial) minus total debt(mortgage, consumer credit, vehicle credit, studentloans, etc.). To simplify data collection, we utilizeda household balance sheet (see figure 1), whichwas developed in line with extant literature. Sucha detailed list is important for both obtaining dataand constructing a thorough picture of the low-income household’s wealth.
Fifteen items are surveyed according to ourhousehold balance sheet around five basic themes:financial assets, non-financial assets, income sources,current liabilities and investments.Besides questionsabout wealth, we also questioned about socio-demographic characteristics such as the size of thehousehold (number of members), number of incomeearning members in the household, and locationof the household as well as the demographiccharacteristics of the sample (Table 3).

Optimization: Journal of Research in Management8
Table 3: Socio-Demographic Characteristics of Households and Respondents
No. of No. of Location (City, Age of Gender Occupation ofhousehold income District) respon- of respondentmembers earning dent respon-
feamily dentmembers
R1 4 3 Alibeykoy/Istanbul Female 46 Cleaning staff
R2 5 2 Sangazi/Istanbul Female 22 Office worker
R3 3 2 Cekmekoy/Istanbul Male 23 Worker in aHairdresser
R4 4 4 Yenidogan/Istanbul Female 32 Waitress at a Cafe
R5 5 3 Kartal/Istanbul Female 22 Office worker
R6 4 2 Cekmekoy/Istanbul Female 39 Charlady
R7 2 2 Tasdelen/Istanbul Female 42 Owner of ahairdresser
R8 4 2 Sarigazi/Istanbul Female 37 Cleaning staff
R9 4 2 Tasdelen/Istanbul Male 17 Waiter in a Cafe
R10 3 2 Umraniye/Istanbul Female 26 Manicurist
R11 5 2 Sarigazi/Istanbul Female 26 Office secretary
R12 4 2 Sancaktepe/Istanbul Female 50 Charlady
R13 3 2 Tasdelen/Istanbul Female 30 Office worker
R14 4 3 Sahryicedit/Istanbul Female 26 Office worker
R15 4 2 Pendik/Istanbul Female 26 Office worker
R16 4 3 Esenler/Istanbul Female 36 Photocopy centerworker
R17 5 2 Esatpasa/Istanbul Female 38 Charlady
R18 3 1 Sancaktepe/Istanbul Female 37 Cleaning staff
R19 2 2 Umraniye/Istanbul Female 25 Office worker
R20 3 2 Umraniye/Istanbul Female 37 Charlady
R21 5 2 Umraniye/Istanbul Female 38 Charlady
Source: Authors
The interview guide (Appendix 1) was first preparedin English and then translated into Turkish. Inline with the rationale of a household balance sheet,the interview guide stressed on twelve categoriesof question: socio-demographic features, generalattitudes about wealth, financial liquid assets, realestate, personal property, investment, currentliabilities, noncurrent liabilities.
We have decided to accomplish the field surveyaround Istanbul because gentrification policies thatthe Turkish government provided for the
construction industry created a boom in thenumber of available houses in general, andparticularly in Ýstanbul.
Data Collection: Method and Sampling
For the primary data collection purpose, we usedsemi-structured interviews. This method, whoserationale resides in gaining insights on informants’opinions and behaviors through conversation andinteraction, corresponds to our research objectiveof discovering the poor’s definition and report of

9Volume 11, No. 1
their wealth. As previously mentioned, our researchrationale was not surveying a representative sampleand to generalize the findings to a whole parent-population.
In this vein, we conducted a series of semi-structured face-to-face interviews with 21respondents between August 2016 and October2016 to obtain micro level data on householdwealth of low-income groups in Turkey. We focusedthroughout the interviews on household becausewe have assumed that wealth such as a house isusually made at the household level. We defineda household as a unit of individuals whose centerof life is at a shared address and who share dailyfinances. Individuals who temporarily do not liveat that address but regularly return there are alsoconsidered as members of the household. We havenot considered as household, individuals who sharea home without having a couple (family) life orparenthood, or domestic staff residing at thataddress.
Interviews were conducted with a single personrepresenting the household. For this purpose, weidentified a referent in each household who isexpected to have full information about themembers of the household and has assumedresponsibility to for household consumption.
The sample members were heterogeneous in termsof age (17-65, mean age 35.9) and gender (maleand female). In terms of income, they representedthe lowest income group, either minimum wageearners or slightly higher. In 2016 minimum wagewas set as net 1.300 TL (approximately 371 USdollars) and gross 1.647 TL (approximately 470US dollars).
Interviewees were mainly occupied by small andmedium sized companies or work as charladies.Only one respondent (R7) is self-employed. Twoof the respondents are retired and one of them isjobless. Table 3 provides a detailed informationabout the demographics of our sample.
We gave respondents time to think for respondingin their own words in a relaxed environment. Weconducted all interviews in Turkish. Flow ofconversation determined statements and order ofquestions. Interviews ranged in length fromapproximately 15 minutes to 20 minutes. Eachinterview was digitally recorded and fullytranscribed. We have also enriched the interviewswith observation notes taken during theconversations and some secondary data.
The values reported are assessments therespondents made in particular, about the valuesof real estates and businesses owned by households.Although they may be flawed, self-assessments arecrucial for two reasons: the poor’s attitude abouttheir wealth and the difficulty of assessing theactual value of properties that are often notregistered.
DATA ANALYSIS AND DISCUSSION
The first part of the interviews aimed atunderstanding the financial assets of thehousehold.
In this vein, we collected data about the bankdeposits both with and without an interest inTurkish lira (one TL equals 0.22 € and $ 0.26 inthe date of our survey), gold accounts, gold keptat home, foreign currency accounts (mainly USdollar and euro), stocks and bonds.
All respondents complained that they are unableto spare some money as savings as they have tomeet their liabilities and cover household expenses.R17’s comments reflect the comments of otherrespondents;
My husband works with minimum wage andI work two days a week, so we just manageexpenses, we can just balance [if we can savesome amount] I would open a bank account[and keep it in interest].
R1’s comments strengthen this point as well, “whencalculated all we earn goes for debts, if any isleft we either pay for bills or for kitchen expenses”.However, even if the possibility to save is weakin case they can, the financial asset is preferred.The majority of the respondents preferred demanddeposits (19 out of 21) then time deposits (8/21)and gold kept at home (8/21). US dollar is alsopreferred (5/21) as compared to euro (3/21) asan investment tool.
As Respondent 5, a retired primary school teacherindicated, “dollar and euro are short term,occasional investments, we prefer TL” most ofthe respondents asserted that TL and gold at homeare the preferred investment tools. As indicatedby Respondent 11, a female office worker, “goldis a popular investment tool at the moment” and”…prefer to keep at home” (R 19).
Second theme of questions are related to the non-financial assets (real estate, personal wealth anda second real estate like farm, office, summerhouse) owned by the household.Having a house

Optimization: Journal of Research in Management10
seems to be a priority for most of the Turkishcitizens and our respondents shared this attitudeas well. Most of the respondents (17/21) owned ahouse and furthermore. The same number usedmortgage for buying their house. Half of thosewho owned a house has also invested into a secondreal estate. Respondents who do not own a houseare a newly married couple (R 19), a householdowning only a summerhouse (R 14) and a breadearner of a large household where the othermembers are dependents (children and mother-in-law) rather than wage earners (R17).
Nearly half of the respondents (10/21) owned acar. 10 households in our sample owned a houseand a car and five of them had a house, a car anda second real estate. In most cases, respondentsbuy car by bank loans (at interest rates rangingfrom 1.09 % to 1.29 %) and for buying a house(at interest rates ranging from 0.80 % to 1.19 %)they use mortgage, as indicated by R1, usingfinancial instruments is done simultaneously, “Wehave mortgage, car loan just finished”.
In the third section of the questionnaire, we askedfor the revenue sources of a household.Except 3respondents (R2 jobless, R6 retired and R20charlady) 18 respondents reported that at leastone member of the household is on the payroll ofa company and receive monthly salary.
For three respondents (R5, R1 and R21), monthlyretirement pay provides an additional householdrevenue. Except for R20, work as a charlady isan additional revenue to the total budget of thehousehold.
Four households (R2, R5, R7, and R9) collectedrent from their second real estate investments. Fourhouseholds (R1, R2, R9, R16) generated revenuesby harvesting their fields in their villages locatedin places other than Ýstanbul. However, this isan irregular income depending on climate, marketprice of the agricultural products and distributionof the revenues among the members of theextended family is not even.
“We came from Ordu [a city in Black seacost], we have hazelnut fields in our village,and we might have some extra income fromhazelnut. But my husband’s family is a largeone and we share the money raised” (R1).
“In Sivas [mid Anatolia] we have a fieldwhich we inherited from my father, but mycousins take care of it and do the harvest.So, we get nothing” (R7).
In the fourth section of the interviews, we aimedto understand the type of currentliabilities(mortgage, consumer credits, car loans, loans foreducation, credit card debts) that dominate thebalance sheet of a low-income household.
Nearly all non-financial assets (car, house, andsecond real estate) are purchased by using bankloans in our sample. Consumer loans are mainlyused as advance payments for buying a house. Mostof the respondents claimed that they used mortgageor car loans in the past but currently they areover with the payments. As is stated by R13 “wehave consumer loan for one year that we usedfor the advance payment of our house”. Also, inmost cases loans for house and car are usedconsecutively. R1 indicated “we have mortgage,car loan just finished”.
18 respondents use credit cards, 7 of them havemortgage payments, 6 of them use consumercredits and 5 of them used bank loans for payinguniversity fees for their children. There are twotypes of universities in Turkey. While publicuniversities are free of charge, private foundation-charge fees for students.
R12, a charlady commented, “we don’t have anydebts except debts for my daughters’ school fees28.000 TL (approximately 8.000 $ US) for bothfor a year”.
Finally, we asked questions about the investments(stocks, bonds, social security, and private pension)of the respondents. None of the respondentsinvested in stocks and bonds. One of the reasonsfor eliminating stocks and bonds as an investmenttool can be explained in line with the thinly tradedfinancial markets in Turkey. Furthermore, volatilityin financial markets, lack of knowledge to investto these instruments strengthens this negativeattitude towards bonds and stocks.
In each household of our sample at least onemember benefited from SGK (Turkish socialsecurity system). In some cases, more than onemember of the household had SGK. In this system,premiums paid by one employed family member(male or female) will provide benefits for the othermembers of the family (spouse and children). TheTurkish social security system is modeled as ahybrid of Continental and Mediterranean insurancesystems. Accordingly, employees pay premiums inline with their insurance status and then collectedin a joint pool. Provision of benefits is based onthe premiums paid. SGK incorporates short term(work accidents, occupational disease, sickness, and

11Volume 11, No. 1
maternity leave) and long-term (invalidity, old age,survivor’s) insurances.
Fifteen respondents have SGK and premiums arepaid by their employers. One respondent (R7) isself-employed and is registered to Baðkur(alternative to SGK for owners of small andmedium sized companies) whereas her husbandhas SGK.
Three respondents (R12, R17 and R20) pay SGKpremiums themselves. One respondent (R21)benefits from her husband’s SGK package. Sevenrespondents have subscribed to private pensionsystem. In contrast to SGK, in the private pensionsystem, they pay their fees but recently with anew regulation, 25 per cent of the monthlypayments is subsidized by the state.
Nine respondents have private health insurance.SGK insurance coverage is applicable in publichospitals whereas private insurance benefits coverprivate hospitals and freelance doctors, thus privatehealth insurance is a complementary to SGK.Private health insurance is given as a fringe benefitpayment in most of the privately owned mediumand big sized companies. Only one respondent(R13) receive private health insurance benefit fromher employer and 8 of them pay for themselves.
CONCLUSION
We aimed in this paper to identify the forms andthe origins of the poor’s wealth beyond the officialstatistics. The results of our field study providesignificant insights for our research inquiry andpurpose.
The wealth of the typical low-income Turkishhousehold is mainly a house and a car, which areowned by bank loans in the form of mortgage,vehicle credits and consumer credits. Acquiringreal estate has become affordable in Turkey evenfor modest income earners mainly as a consequenceof utilizing financial instruments and politicalparties’ supportive policies forlegalizing “illegal”properties. Also, gentrification policies adopted bythe AKP government has been instrumental inincreasinghousingsupply.
Gentrification policies that the Turkish governmentprovided for the construction industry created aboom in the number of available houses in themarket, especially in Ýstanbul. Furthermore, themarket-oriented state strategies in the late 1980shave also enabled many low-income individualsto reap the benefits of informal economy as laborforce and else to accumulate revenues and acquire
(illegal) real estate market. By exploiting thepopulist strategies of the ruling parties of allpolitical wings, the poor was able to traversebetween formal and informal economy andaccumulate material wealth which provided anopportunity for upward mobility.
Finally, financialization provided instruments forthe provision of assets that otherwise would havebeen too costly to afford for the low-incomefamilies. After 2006 financial crises and the fallof demand for investing, banks turned to consumermarkets and consumption. Credit usage becamean important instrument for middle and low-income households for accumulating materialwealth.
It is true that finance-led instruments turned tobe one of the dominant cause of wealthaccumulation in particular for home or carownership. The members of our sample acquirednearly all their non-financial assets (car, house,and second real estate) by using bank loans. Mostof the respondents claimed that they used mortgageor car loans in the past but currently they areover with the payments.
However, wealth accumulation with debt mightbe the main source of insecurity. Especially, if theevolution of the labor market leads to outsourcingand incoming migrant workers; factors thatweakens the low-income groups’ ability to meettheir obligations. As their dependence on financialmarkets deepened, low-income households sharein fact their wealth with the actors of financialmarkets. We think that the financial inclusionwhich contributed the wealth accumulation of thepoor has also opened a venue for socialprecarity.Flaherty (2015) believes these policieshave socialized in fine private debts and damagedthe strata of many low-income households.Montgomery and Young (2010) provided evidenceabout how increasing debts and servicing costsfor marginalized households have led to wealth(dis) accumulation. It is now clear thatfinancialization has significantly influenced wealthredistribution and enhanced the shares of topincome groups.
Besides house and car, gold is also kept “underthe mattress” according to a Turkish saying bysome low-income householders mainly for givingaway as a present for weddings, child birth oracquisition of a new house. If a child attendinguniversity lives in a household, then most likelyeducation loans are used as well.

Optimization: Journal of Research in Management12
In addition to the wealth creation andaccumulation, our study also provided insights onthe low-income households’revenue sources.Salaryand retirement pay showed to be the predominantform of regular income for a big majority of oursample members. Some of them also gain someother types of income such as revenues ofharvesting their fields in their villages.
The findings of the research on hands open avenuesfor further research. As the poor have formed andaccumulated wealth mainly through theconventional financial institutions, a major axe ofresearch would be that of the alternative finance’simpact on the poor’s access to financial facilitiesand the more accommodating conditions of debtaccess and reimbursement. By alternative finance,we mean channels and instruments that haveemerged outside of the conventional system suchas regulated banks and capital markets. This isan important issue because conventional marketimperfections might particularly affect the poorand reduce their ability to contribute to economicgrowth.
The findings of this research also provide insightsfor public policies. If the poor are not that poorthat official statistics show, then the institutionsare more defective than what they seem to be inthe fight against poverty. In this perspective, therule of law is not a luxury in the povertyeradication, but a Sine Qua Non condition.
REFERENCES
• Alvaredo, F., Assouad, L., & Piketty, T. (2016).Meauring inequality in the Middle East 1990-2016: The world’s most unequal region. WIDworld, Series no. 2017/15.
• Atkinson, A. (1996). Public economics inaction: The basic income tax proposal. InOxford. Oxford University Press.
• Baslevent, C., & Dayoglu, M. (2005). The effectof squatter housing on income distribution inurban Turkey. Urban Studies, 42(1), 31-45.
• Bonini, A. (2008). Cross-national variation inindividual life satisfaction: Effects of nationalwealth, human development, andenvironmental conditions. Social IndicatorsResearch, 87(2), 223-236.
• Bowra, A. M., W, H., & Khan, A. H. (2011).An empirical investigation of human resourcepractices: A study of autonomous medicalinstitution employee in punjab. AfricanJournal of Business Management, 6390-6400.
• Buðra, A. (2007). Poverty and citizenship: Anoverview of the social-policy environment inrepublican Turkey. International Journal ofMiddle East Studies, 39(1), 33-52.
• Carruthers, B. (2007). Rules, institutions, andNorth’s institutionalism: State and market inearly modern England. European ManagementReview, 40-53.
• Cowell, F., Karagiannaki “, & McKnight, A.(2013, 06 08). Accounting for cross countrydifferences in wealth inequality. Retrievedfrom http://sticerd.lse.ac.uk: http://s t i c e r d . l s e . a c . u k / d p s / c a s e / c p /CASEpaper168.pdf
• De Soto, H. (2000). The mystery of capital:Why capitalism triumphs in the West and failseverywhere else. London: Black Swan.
• Economic survey-Turkey. (2016). OECDPublishing. Retrieved from http://www.oecd-ilibrary.org/economics/oecd-economic-surveys-turkey-2016_eco_surveys-tur-2016-en.
• Elveren, A., & Ozgür, G. (2016). The effet ofinformal economy on income inequality:Evidence from Turkey. PANECONOMICUS,63(3), 293-312.
• Flaherty, E. (2015). Top incomes underfinance-driven capitalism, 1990–2010: Powerresources and regulatory orders. Socio-Economic Review, 13(3), 417-447.
• Gale, W., & Scholz, J. (1994). Intergenerationaltransfers and the accumulation of wealth. TheJournal of Economic Perspectives, 8(4), 145-160.
• Heper, M. (1985). The State Tradition inTurkey. Northgate.
• Hochman, O., & Skopek, N. (2013). The impactof wealth on subjective well-being: Acomparison of three welfare-state regimes.Research in Social Stratification and Mobility,127-141.
• Kus, B. (2014). The informal road to markets:Neoliberal reforms, private entrepreneurshipand the informal economy in Turkey.International Journal of Social Economics,41(4), 278-293.
• Kus, B. (2016). Wealth inequality: Historicaltrends and cross national differences.Sociology Compass, 10(6), 518-529.
• Menger , C. (n.d.). Principles of Economics.Forwarded by P. G. Klein, Introduction BY F.A. Hayek. Translated by J. Dingwall AND B.

13Volume 11, No. 1
F. Hoselitz. Ludwig von Mises Institute,Auburn, Alabama. Retrieved on October 30,2015, from https://mises.org/library/princ.Forwarded by P. G. Klein, Introduction BYF. A. Hayek. Translated by J. Dingwall ANDB. F. Hoselitz. Alabama. Retrieved October 30,2015, from https://mises.org/library/princ
• Nam, Y., & Huang, J. (2009). Equalopportunity for all? Parental economicresources and children’s educationalattainment. Children and Youth ServicesReview, 31(6), 625-634.
• OECD. Publishing 2015, In It Together: WhyLess Inequality Benefits All. OECD Publishing.(2015). OECD. Publishing 2015, In It Together:Why Less Inequality Benefits All. OECDPublishing.
• Okun, A. (2015). Equality and efficiency: Thebig tradeoff. Brookings Institution Press.
• Pfeffer, F., & Hällsten, M. (2012). Mobilityregimes and parental wealth: The UnitedStates, Germany, and Sweden in comparison.Retrieved from https://ssrn.com/abstract=2166784 or http://dx.doi.org/10.2139/ssrn.2166784
• Piketty, T. (2017). Capital in the Twenty-FirstCentury. Harvard University Press.
• Pinarcioglu, M., & Isik, o. (2008). Not onlyhelpless but also hopeless: Changing dynamicsof urban poverty in Turkey, the case ofSultanbeyli Ýstanbul. European PlanningStudies, 16(10), 1353-1370.
• Rumberger, R. (1983). The influence of familybackground on education, earnings, andwealth. Social Forces, 61(3), 755-773.
• Schneider, M., & Pottengerand , M. (2016).The Distribution of Wealth–GrowingInequality. Edward Elgar Publishing.
• Scholz, C., & Firestone, J. (2007). Wealth”Blackwell Encyclopedia of Sociology.Blackwell Publishing. Retrieved October 01,2015, from http://www.blackwellreference.com/subscriber/tocnode.html?id=g
• Semyonov, M., & Lewin-Epstein, N. (2013).Ways to richness: Determination of householdwealth in 16 countries. European SociologicalReview, 29(6), 1134-1148.
• Skopek, N., Buchholz, S., & Blossfeld, P. (2014).National patterns of income and wealthinequality. International Journal ofComparative Sociology, 55(6), 463-488.
• Spilerman, S. (2000). Wealth and stratificationprocesse. Annual Review of Sociology, 26(1),497-524.
• Spilerman, S. (2004). The impact of parentalwealth on early living standards in Israel.American Journal of Sociology, 110(1), 92-122.
• Torche, F., & Costa-Ribeiro, C. (2012). Parentalwealth and children’s outcomes over the life-course in Brazil: A propensity score matchinganalysis. Research in Social Stratification andMobility, 30(1), 79-96.
• Wilterdink, N. (2007). Inequality, Wealth.Blackwell Publishing. Retrieved October 01,2015, from http://www.blackwellreference.com/subscriber/tocnode.html?id=g9
• Yorke, D. (2015). Wealth. Blackwell Publishing.Retrieved October 01, 2015, from http://www.blackwellreference.com/subscriber/tocnode.html?id=g9780631233176_chunk_g97814
APPENDIX
Appendix 1: The Interview Guide
1. Information Profile and Socio-Demographic Features
First part of the interview collects data about socio-demographics features of the respondents. Sinceunit of analysis is the household, we will addresstotal household wealtyh but not the wealth of asingle individual. Respondent(s) is (are) the mostfinancially knowledgeable member of thehousehold, although other household members mayalso provide information about wealth. Thefollowing will be addressed:
• Size of the family (family members)
• Age, education, and gender of the members
• Number of income earning family members
• Number of non-income earning family members
• Location of the home (region, city, district)
2. General Attitudes About Wealth
Objective: Discovering the poor's understandingof wealtyh
• Unpaid bills
• Where does wealtyh come from?
• What are the different types of wealth?
• Which type of wealth is important for makingmore money and having regular revenue?

Optimization: Journal of Research in Management14
3. Financial Liquid Assets
Objective: In this part, also we will ask questionsto understand the composition of most used liquidfinancial assets in by a household such as cash,bank accounts, gold accounts, and credit cards.
• Cash
• Banking accounts
• Credit cards and loans
• Gold (kept at home)
• Foregin currency (kept in hand)
• Other
4. Real Estate
Objective: Finding out respondents' assesments oftheir own real estate property mainly comprisedof residential (land, flat, house, condominiums andtownhomes), commercial (office buildings,warehouses, livestock in rural areas, retail storebuildings) and industrial categories (factories, farm,mines).
• Residential real estate
• Commercial real estate
• Industrial real estate
• Other
5. Personal Property and Wealth
Objective: Assessing the poor's wealth
• Automobile
• Jewellery
• Tools and machinery
• Furniture and appliances
• Collectibles
• Other
6. Investment
Objective: Finding out respondents' assessmentsof their own investments, i.e. financial assets
purchased with the idea of generating income inthe future or selling at a higher price. We also tryto collect data about types of social security benefits(if ever), retirement pensions (if ver) and lifeinsurance (if ever). The reason we decided toinclude such data is that pensions, social securityand insurance can be complementary indicatorsof wealth.
• Stocks
• Bonds
• Social security benefits
• Life insurance Retirement pension
• Tools and machinery
• Furniture and appliances
• Other
7. Current Liabilities
Objective; Assessing the respondents' debts orobligations that are due within one year.
• Unpaid bills
• Installment loans
• Mortgage due
• Vehicle loans
• Student loans
• Other
8. Noncurrent Liabilities
Objective: Assessing the respondents' debts orobligations that are due within one year.
• Installment loan due after one year
• Mortgage due
• Other
9. Final Remarks on Wealth and IncomeGeneration
Is there anything you would like to add on howyour family wealth can be used for generatingincome?

15Volume 11, No. 1
Performance Analysis of Different Asset Class in India
Subagyo* & Kanchan Bisht**
* Associate Professor, Finance and Managerial Accounting, Economic Faculty, Universitas Nusantara PGRI Kediri,Jalan K.H. Achmad Dahlan 76, Kediri, East Java, Indonesia 64121, [email protected]
** Assistant Manager, HDFC Asset Management Company Ltd, Dehradun, Uttrakhand, India,[email protected]
ABSTRACT
Investment is a way of investing the funds indifferent asset class available such as equity, debt,bonds, fixed deposits, real estate, gold etc. Eachasset class has different risk return trade off. Thisstudy compares historical returns of different assetclass namely Nifty 50, Sensex 30, Equity Mutualfund, Debt Mutual fund, Gold and Real Estatefor 10 years horizon i.e 2007-2016. It also takes20 years data for Nifty 50,Sensex 30 andgoldi.efrom 1997- 2016 and compares the returnsover the years. Further, itdiscusses the impact ofrecent change in the Indian Financial Budgetrelating to Long Term Capital Gain Tax (LTCG)over Real Estate investor’s returns. This studyshows that Debt Mutual fund has given betterreturns as compared to other asset classes forshorter period of time i.e. for one year period.However, for long term investors,equity mutualfunds have performed consistently better ascompared to other asset class.This study alsoreveals that change in budget relating to LTCGholding period for immovable property has madethe real asset investment class more attractivefor wealthy investors.
Keyword: Mutual Fund, Net Asset Value, LongTerm Capital Gain, Stock Index, CAGR.
INTRODUCTION
Investment is the employment of funds with theaim of getting return on it.It is commitment offunds which have been saved from currentconsumption with the hope that some benefits willbe received in future. Thus, it is a reward forwaiting for money. Various investment optionsareavailable, offering differing risk-rewardtradeoffs. Each asset class has its own merits anddemerits. The following table shows characteristicsof various asset class based on returns, risk,liquidity, tax and convenience.
Keeping these different asset classes, investors mayhave following different investment objectives.
Short term high priority: Investors have a highpriority towards achieving some objectives in ashort time. For example, a couple will give highpriority to buy a house and invest their moneyaccordingly.
Long term high priority: Some investors lookforward for long term needs e.g. investing foreducation of a child or post retirement period etc.
Low priority goal: These objectives have lowpriority in investing. These objectives are notpainful. After investing in high priority assets,investors can invest in these low priority assetslike buying domestic appliances etc.

Optimization: Journal of Research in Management16
Money making goal: Investors may haveobjective to maximize wealth. The investors investin companies to get benefitted with capitalappreciation apart from regular/current income(dividend).
Mutual Fund
Mutual fund is a way of investment by poolingmoney from different investors and diversifiescollected funds into different option like equity,debt, gold, bonds, etc. Investors can get exposureof same securities through mutual fund who maynot want to invest directly in financial markets.Investors can diversify their portfolio holdings withsmall amounts, by investing in gold and real estatethrough mutual funds. Each product offered by amutual fund company is called a scheme. MutualFund Company offer varieties of schemes or funds,each catering to a different investment need ofthe investor. An investor may choose to investthrough a mutual fund to be able to use the servicesof the fund manager who will make the investmentdecisions relating to selection of securities, timingof investments, reviewing and rebalancing theportfolio periodically and executing the operationaldecisions related to the portfolio. These servicesare provided to the investor by charging a fee.There are different types of mutual funds availablein the financial market. Some of them are listedbelow.
Equity Mutual Fund: An equity fund is amutual fund that invests in stocks. It can bemanaged actively or passively. Equity funds arealso known as stock funds. These funds invest amaximum part of their corpus into equitiesholdings. Equity investments are meant for a longertime horizon. The Equity Funds are classified,based upon their investment objective, as follows:
Diversified Equity Funds(Large Cap)
Mid-Cap Funds
Small Cap Funds
Sector Specific Funds
Tax Savings Funds (ELSS)
Thematic Funds
Debt Mutual Fund: Debt Mutual Funds is amixture of debt or fixed income securities suchas, Government Securities, Treasury Bills,Corporate Bonds, Money Market instruments andother debt securities of different time periods. Debtsecurities have a fixed maturity date with a fixedrate of interest. These funds provide low risk andprovide stable income to the investors. Debt fundsare of following types:
Gilt Funds
Income Funds
Short Term Plans
Liquid Funds
Monthly Income Plans (MIPs)
Gold: Gold is the most popular as an investmentproduct. Investors buy gold generally to diversifyrisk, through the use of derivatives. The goldmarket is subject to speculation and volatility asare other markets. Gold is useful as a store ofwealth. It acts as secret assets. The investment ishighly liquid and can be sold at any time. Themarket prices are continuously increasing withreturn on investment. The investment is also safeand secure. There is a high degree of prestige valuefor gold in the society. The benefit of capitalappreciation is also available.
Real Estate: Real estate generates income or isotherwise intended for investment purposes. Thisis considered as one of the oldest investment
Table 1: Characteristics of Various Asset Class
Asset class
Return
Risk Liquidity Tax Shelter Convenience Current
Yield Capital
Appreciation
Equity Shares Low High High Very High High High
Equity Mutual Funds
Low High High Very High High Very High
Debt Mutual Funds
Moderate Low Low High Low Very High
Gold Nil Moderate Moderate Moderate Low Moderate
Real estate Moderate Moderate Low Low Low Low

17Volume 11, No. 1
product and has gained a lot off importance inthe recent past due to very high returns it hasgenerated for the investors.
Stock Index
Nifty50:The NIFTY 50 index is National StockExchange of India’s benchmark stock market indexfor Indian equity market. Nifty is generally ownedand managed by India Index Services and Products(IISL), which is a wholly owned subsidiary of theNSE Strategic Investment Corporation Limited. TheNifty is a well diversified 50 stock index accountingfor 22 sectors of the economy. It is used such asbenchmarking fund portfolios, index basedderivatives and index funds.
SENSEX 30:The SENSEX was introduced by theBombay stock exchange in 1986. It is one of theprominent stock market indexes in India. Itcomprises of 30 stocks.
LITERATURE REVIEW
The literatures review on performance analysis ofdifferent asset classhas revealed that there has beena very few study which focuses on the comparisonof different asset class over 20 years time period.
There have been different studies in the past whichhave analyzed the performance of some asset classin terms of their risk and return. Guha Deb,Banerjee and Chakrabarti in 2007 have conducteda study on Indian mutual fund data for the period2000-2005 on a sample of 96 mutual funds. Theirstudy showed that only 18 funds exhibited positiveexcess returns over their style benchmarks althoughnone of them are statistically significant at 5%significance level.Anand and V. Murugaiah in 2008conducted a study on performance of mutual fundsof 113 selected schemes and found that mutualfunds were not able to compensate to investorsfor the additional risk taken by investing in mutualfunds. Dzikevicius and Vetrovin 2012 combinedbusiness cycle and asset allocation theories byadding significant information about performanceof different asset classes during different stagesof business cycle and demonstrated that differentasset classes have different returncharacteristics.Rajni in 2015 calculated that the Indian equitymarket had provided an average return of 16.59%as against the expected rate of 10.84% during theperiod of 2003-2013 with a delivered risk premiumof 9.78% per annum. S.NarayanRao in 2003evaluated performance of Indian mutual funds ina bear market through relative performance index,
risk-return analysis, Treynor’s ratio, Jensen’s alpharatio, Sharpe ratio and Fama’s measure. This studytakes into account 269 open-ended schemes forcalculating relative performance index. The resultsof performance measures indicates that 58 schemesof mutual fund in the sample were able to satisfyinvestor’s expectations by providing excess returnsover expected returns. Thenmozhi&Karthika in2014 found that Debt is another significant assetclass for the investors and the major debtinstruments are the bonds. Dilip in 2014 foundGold to be a valuable asset class that can improvethe risk-adjusted performance of a well-diversifiedportfolio of stocks which also hedge against variousmarket and macroeconomic factors. Inder andVohra in 2012 evaluate the long run performanceof index funds schemes and captures sentimentsof market and performance of the market.
Cole and IP in 1993 studies the performance ofAustralian equity trusts and found portfoliomanagers were unable to earn positive returns ininvestment. Most of these studies are either limitedto one or two asset classes or having analysis oflimited time period. Therefore, this study has gotrelevance as it has different asset classes with timehorizon of as high as 20 years included into it.
OBJECTIVES OF THE STUDY
This study has following objectives to achieve.
i) Comparison of returns of different asset classwith different time horizon
ii) Impact of change in Long Term Capital GainTax over investor’s return in Real Estate Asset.
RESEARCH METHODOLOGY
This section discusses an overview of variousdimensions of the research, tools and techniquesand methods used to achieve the researchobjectives.
The Data and the Sample
The study is primarily exploratory as well asdescriptive and is focused on six categories of assetclass namely SENSEX 30, NIFTY 50, EquityMutual Fund, Debt Mutual Fund, Gold and RealEstate.
Data
The data has been taken from Association ofMutual Fund Industry of India (AMFI), BombayStock Exchange (BSE), National Stock Exchange(NSE), Bank Bazaar, and Residex Index published
Optimization: Journal of Research in Management18
by National Housing Bank (NHB). The sampleperiod undertaken for study is from the year 1997-2016.
In this study, it is proposed to do a comparativeanalysis of six categories of asset class namelySENSEX 30, NIFTY 50, Equity Mutual Fund, DebtMutual Fund, Gold and Real Estate. The analysishas been done for the short term, medium termand long term horizon.Here, short term is definedas one year period, medium term is defined as 5years period, and long term is defined as 10 yearsand more.
For this purpose, Compound Annual Growth Rate(CAGR) of index of SENSEX 30, index of NIFTY50, Net Asset Value (NAV) of Equity Mutual Funds,NAV of Debt Mutual Funds, prices of gold, andindex of Residex have been calculated. Thecalculation of NAV and CAGR have been explainedin the following chapter under the head ‘modelsand techniques’.
Sample Frame
The sample frame is called the list of the targetpopulation. The sample frame in this study is allthose Mutual funds which are reporting theirperformance data to AMFI, and Real Estate pricesreported to NHB.
Sample Size
This study has taken samples of top four AssetManagement Company (AMC) on the basis of theirAsset Under Management (AUM) for Equity andDebt oriented mutual funds. It also included top8 popular cities (Delhi, Mumbai, Chennai,Bangalore, Kolkata, Hyderabad, Ahmadabad andPune) for the calculation of real estate price change.
Sampling Technique
In order to analyze and compare the performanceof different asset class, a convenience sampling ischosen.
Models and Techniques
For the conduct of the study, CAGR of NAV,SENSEX30, NIFT50, Real Estate Prices, GoldPrices have been used.
CAGR is calculated as under:
Where:
EV = Investment’s ending value
BV = Investment’s beginning value
n = Number of periods (months, years, etc.)
Net Asset Value (NAV) is calculated as under:
NAV = (Market Value of All Securities Held byFund + Cash and Equivalent Holdings - FundLiabilities) / Total Fund Shares Outstanding
ANALYSIS AND FINDINGS
Comparison of Returns of Different AssetClass
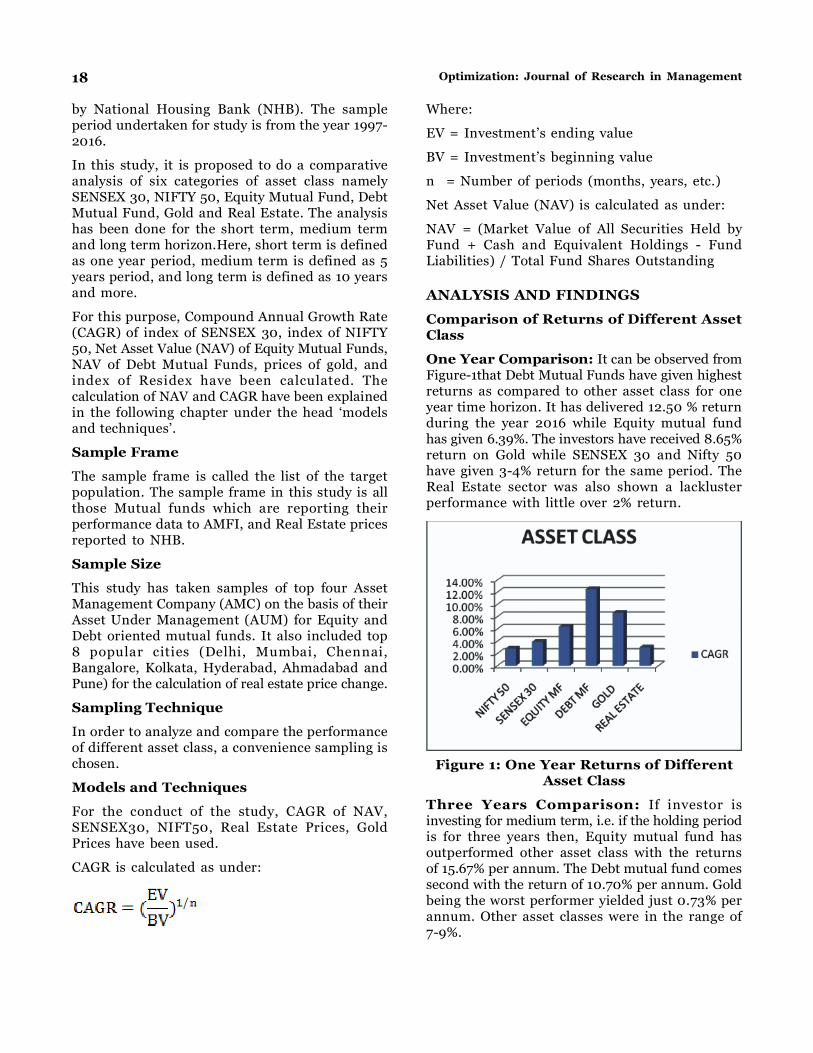
One Year Comparison: It can be observed fromFigure-1that Debt Mutual Funds have given highestreturns as compared to other asset class for oneyear time horizon. It has delivered 12.50 % returnduring the year 2016 while Equity mutual fundhas given 6.39%. The investors have received 8.65%return on Gold while SENSEX 30 and Nifty 50have given 3-4% return for the same period. TheReal Estate sector was also shown a lacklusterperformance with little over 2% return.
Figure 1: One Year Returns of DifferentAsset Class
Three Years Comparison: If investor isinvesting for medium term, i.e. if the holding periodis for three years then, Equity mutual fund hasoutperformed other asset class with the returnsof 15.67% per annum. The Debt mutual fund comessecond with the return of 10.70% per annum. Goldbeing the worst performer yielded just 0.73% perannum. Other asset classes were in the range of7-9%.

19Volume 11, No. 1
Figure 2: Three Year Returns of DifferentAsset Class
Five Years Comparison: If investor is investingfor five years then again Equity mutual fund hasoutperformed other asset classes with the returnsof 16.28 % per annum. The Debt mutual fundcomes with the return of 9.30% per annum. Sensexand Nifty has given 11.40% and 12.03% per annumrespectively. Real estate has given return of 11%.Gold again being the worst performer yielded -1.61 % per annum returns.
Figure 3: Five Year Returns of DifferentAsset Class
Ten Years Comparison: If investor is investingfor ten years then again Equity mutual fund hasoutperformed other asset classes with the returnsof 11% per annum. Gold has given second highestreturn among all with 10.23% per annum. TheDebt mutual fund comes with the return of 8.20%.Sensex and Nifty has given 6.683% and 9.11%respectively. Real estate has given return of 9 %per annum over ten years period.
Figure 4: Ten Year Returns of DifferentAsset Class
Twenty years Comparison: For twenty yearscomparison, data relating to Gold, Nifty 50 andSensex 30 are only available. Looking at these data,it is observed that NIFTY 50 is giving the highestreturns with 11.4% per annum, while Sensex30with 9.54% and Gold with 9.42% came second andthird respectively.
Figure 5: Twenty Year Returns ofDifferent Asset Class
Table-2 below gives the snap shot of the returnsof various asset classes over different time horizon.
Budget implication on return of Real EstateAsset: Indian Budget 2017 has proposed a changein Long Term Capital Gains (LTCG) holding periodfor Immovable property (like Real EstateAsset)from 3 years to now 2 years. This meansthat if investor sells the property after the holdingperiod of two years, he will get the advantage ofLTCG.
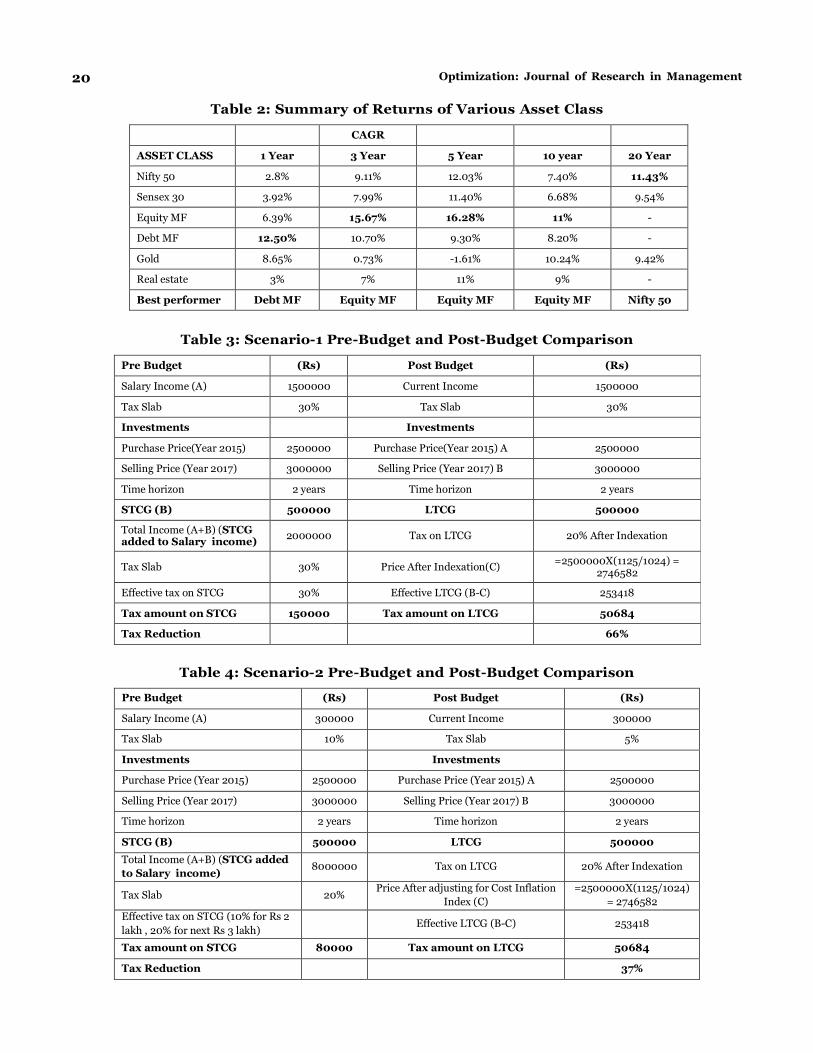
Optimization: Journal of Research in Management20
Table 2: Summary of Returns of Various Asset Class
CAGR
ASSET CLASS 1 Year 3 Year 5 Year 10 year 20 Year
Nifty 50 2.8% 9.11% 12.03% 7.40% 11.43%
Sensex 30 3.92% 7.99% 11.40% 6.68% 9.54%
Equity MF 6.39% 15.67% 16.28% 11% -
Debt MF 12.50% 10.70% 9.30% 8.20% -
Gold 8.65% 0.73% -1.61% 10.24% 9.42%
Real estate 3% 7% 11% 9% -
Best performer Debt MF Equity MF Equity MF Equity MF Nifty 50
Table 3: Scenario-1 Pre-Budget and Post-Budget Comparison
Pre Budget (Rs) Post Budget (Rs)
Salary Income (A) 1500000 Current Income 1500000
Tax Slab 30% Tax Slab 30%
Investments
Investments
Purchase Price(Year 2015) 2500000 Purchase Price(Year 2015) A 2500000
Selling Price (Year 2017) 3000000 Selling Price (Year 2017) B 3000000
Time horizon 2 years Time horizon 2 years
STCG (B) 500000 LTCG 500000
Total Income (A+B) (STCG added to Salary income)
2000000 Tax on LTCG 20% After Indexation
Tax Slab 30% Price After Indexation(C) =2500000X(1125/1024) =
2746582
Effective tax on STCG 30% Effective LTCG (B-C) 253418
Tax amount on STCG 150000 Tax amount on LTCG 50684
Tax Reduction
66%
Table 4: Scenario-2 Pre-Budget and Post-Budget Comparison
Pre Budget (Rs) Post Budget (Rs)
Salary Income (A) 300000 Current Income 300000
Tax Slab 10% Tax Slab 5%
Investments
Investments
Purchase Price (Year 2015) 2500000 Purchase Price (Year 2015) A 2500000
Selling Price (Year 2017) 3000000 Selling Price (Year 2017) B 3000000
Time horizon 2 years Time horizon 2 years
STCG (B) 500000 LTCG 500000
Total Income (A+B) (STCG added to Salary income)
8000000 Tax on LTCG 20% After Indexation
Tax Slab 20% Price After adjusting for Cost Inflation
Index (C) =2500000X(1125/1024)
= 2746582 Effective tax on STCG (10% for Rs 2 lakh , 20% for next Rs 3 lakh)
Effective LTCG (B-C) 253418
Tax amount on STCG 80000 Tax amount on LTCG 50684
Tax Reduction
37%

21Volume 11, No. 1
Table 5: Scenario-3 Pre-Budget and Post-Budget Comparison
Pre Budget (Rs) Post Budget (Rs)
Salary Income (A) 600000 Current Income 600000
Tax Slab 20% Tax Slab 20%
Investments
Investments
Purchase Price (Year 2015) 2500000 Purchase Price (Year 2015) A 2500000
Selling Price (Year 2017) 3000000 Selling Price (Year 2017) B 3000000
Time horizon 2 years Time horizon 2 years
STCG (B) 500000 LTCG 500000
Total Income (A+B) (STCG added to Salary income)
1100000 Tax on LTCG 20% After Indexation
Tax Slab 30% Price After Indexation C =2500000X(1125/1024)
= 2746582 Effective tax on STCG (20% for Rs 4
lakh , 30% for next Rs 1 lakh) Effective LTCG (B-C) 253418
Tax amount on STCG 110000 Tax amount on LTCG 50684
Tax Reduction
54%
This study also analyses the implication of suchchanges in returns of different type of investors(different income group investors). There are threescenarios possible for different income group ofinvestors.
Scenario-1 assumes that the investor has incomeof Rs. 15 Lakh per annum and he is liable to pay30% tax. Suppose, he has invested Rs. 25 Lakh inReal Estate and sold it after 2 year for Rs 30 Lakh.In this case, table below shows the calculationsof effective returns and compare both Pre-Budgetand Post-Budget scenario. It can be observed thatthe investor can reduce its tax liability by 66%post budget. Scenario-2, where the income of aninvestor is Rs 3 lakh per year, reduces the taxliability by 37% post budget. Scenario-3, wherethe income of an investor is Rs 6 lakh per year,reduces the tax liability by 54% post budget.
CONCLUSION
This study concludes that the medium to long terminvestors should prefer Equity oriented MutualFund schemes to maximize their returns. However,if the investor has short investment horizon, debtoriented mutual fund schemes should be thepreferred choice.
Budget 2017 has further enhanced the net takehome from these investment assets in general. Thestudy reveals that change in budget relating toLTCG holding period for immovable property hasmade the real asset investment class moreattractive for wealthy investors. Investor, havingthe tax bracket of 30 %, is able to reduce its tax
liability by 66%. At the same time, those, havingthe tax bracket of 10 %, are able to reduce its taxliability by 37% only.
REFERENCES
• Anand S. and MurugaiahV. (2012). Analysisof Components of Investment Performance:An Empirical Performance of Mutual Fundsin India. http://papers.ssrn.com/sol3/papers.cfm?accessed on March 20, 2017.
• Dilip, K. (2014). Return and VolatilityTransmission between Gold and Stock Sectors:Application of Portfolio Management andHedging Effectiveness. IIMB ManagementReview. 26(1).
• Dzikevicius, A., and Vetrov, J. (2012). Analysis ofAsset Classes through the Business Cycle. Business,Management and Education. 10(1), 1-10.
• Guha Deb, Banerjee, Chakrabarti.(2011). Performanceof Indian Equity Mutual Funds vis a vis their StyleBenchmarks: An Empirical Exploration. http://ssrn.com/abstract=962827, 1-17
• Inder S. and Vohra S. (2012). Mutual FundPerformance: An Analysis of Index Funds.International Journal of Research InCommerce & Management. 3 (2), 143- 146.
• Thenmozhi, M., & Nair, K. S. (2014). Impactof Changes in Macroeconomic Factors onTreasury Bond Returns.
• Rajani Kant (2015). Equity Risk PremiumPuzzle: The Case of Indian Stock Market, IUPJournal Applied Finance. 21(3), 50-56.

Optimization: Journal of Research in Management22
Markov Analysis as a Tool for Developing a Model for RiskManagement: A Case Study Based on Electrical
Transmission Line Installation Projects
Shwetank Parihar* & Chandan Bhar**
ABSTRACT
The study develops a model for risk assessmentby the use of Markov analysis combined with theDelphi approach for expert opinion, the papergives a methodology under which the various riskfactors are firstly collected then they are appliedfor Markov analysis, the Markov analysis returnsthe probability of occurrence of that particularrisk factor, this probability is then used tocalculate the R
value, a model is then given which
is used to calculate the final impact value for eachrisk, which will be used in risk deciding riskmitigation plan.
Keywords: Risk Management, Markov Analysis,Electrical Transmission Line Installation Projectand Risk Assessment.
INTRODUCTION
The risk management process for any industry isdependent on the risk assessment and this processis in particularly cumbersome when the projectinvolves a severe amount of civil work and isriddled with deadlines and day to day operationalproblems like an electrical transmission lineinstallation projects.
In this study we have developed a model in whichwe can assess the probability of risk occurrencesfor an electrical transmission line installationproject with the help of probability, the modeldeveloped gives us the risks involved in atransmission line installation project along withthe use of other factors that influence these risksare also studied and included in the analysis, anelectrical transmission line installation project isvery highly sensitive in case of risk managementand every such project is unique in itself hencethe need for historical data is more but such datais very scarce and hence we have developed asystem which can predict risk level with minimalusage of historical data, but the main problemthat had been encountered is that if historical datais less we have to tend towards probabilisticapproach but such an approach is also boundedby the need for a huge amount of data and involvesnon practical assumptions and conditions.
On giving an insight we found that both qualitativeand quantitative risk assessment methods arediscussed by many authors (Chen et al., 2011;Thevendran and Mawdesley, 2004; Olaru et al.,2014) in which basically risk factor based approachis used, on the other hand many authors (Ping
* PhD , Department of Management Studies, Indian School of Mines, Dhanbad, [email protected]
** Professor, Department of Management Studies, Indian School of Mines, Dhanbad, [email protected]

23Volume 11, No. 1
and Li, 2010; Erickson and Evaristo, 2006; Wuet al. 2008) have made a more generalized studyfor risk assessment which is not based on anyspecific industry. The need for better riskassessment is always present since both qualitativeand quantitative assessment methods discussed bymany authors are heavily dependent on historicaldata, so what we have analyzed here is that Markovanalysis can be used in order to have a specificprobability of risk occurrence to be decided, themain advantage that has emerged in our study isthat we need very less amount of data to forecastthe risk occurrence level, further the study takesturn and calculates the impact level of various risksinvolved and on combining the probability andimpact we can have a system which is very helpfulin deciding the risk level and hence the riskmitigation plan for an electrical transmission lineinstallation project.
Risk management in power sector is one such topicwhich is always given priority since the costinvolved in the project is very high and even asmall amount of risk can cause dramatic loss forthe project(Geraldi, et al., 2008), moreover withthe increase in the development process of thecountry we have even more electrical transmissionline installation projects underway, so in order tohave dedicated system for risk assessment in suchprojects we have developed a model which needsvery less amount of historical data and works onboth quantitative and non quantitative techniquesto decide upon the level of the risk. This studydeals with a model for risk assessment of electricaltransmission line installation projects which willbe helpful in optimizing the risk managementprocess for the whole of the project.
The study stresses on the identification of riskfactors involved in an electrical transmission lineinstallation project, then these risk factors arediscussed by experts and finally the experts employprobability of transition matrix for being used asseed value in Markov analysis, the analysis returnsthe final probability of risk occurrence for eachrisk factor. Then
Rvalue is calculated by multiplying
it with the impact value of each risk factor, thisimpact value is generated by the use ofmathematical modeling. Hence finally the R
value
which is the risk indicator value is obtained frommultiplying the probability obtained from Markovanalysis with the impact value of that risk factor.
Hence the study deals with quantifying the riskfactors with the help of probability. Markov analysisis used to give that probability and the seed value
that is the transition matrix that is required forMarkov, is obtained by qualitative data analysisthat is completed by questionnaire and expertdiscussions. Hence in this study the balance isestablished in between the various quantitative andnon quantitative methods available for riskassessment and this is what makes the study moreuseful and flexible in its approach, finally the riskvalue calculated is divided into percentage of totalR
value so that in accordance with the percentage
employed by the analysis we can distribute therisk mitigation resources so that the investmentin risk process is optimized. The study shows thattechnical and human resource related risks arehaving highest risk levels so special care is neededto be given for these risk factors while designingrisk mitigation plan for such a project.
The purpose of this paper is to introduce a modelthat requires very less input but the accuracy levelfor deciding the risk level should be high, hencethe Markov analysis is used in order to have aprobability of risk occurrence being generatedwhich will be analyzed along with the impact levelto give final risk value for that electricaltransmission line installation project, that also withvery less amount of historical data requirements.
LITRATURE REVIEW
Risk management process is defined and analyzedby many authors but sector specific studies areless in number and more so over a dedicated studyfor an electrical transmission line installationproject are very few, risk management is generallyseen over as a planning process for a series ofevents that can be related with one another orindependent events which can cause problems withthe upbringing of the project at various levels. Therisk management process is analyzed by manyauthors (Dey, 2001; Dey, 2010; Aloini et al., 2012;Fang and Marle, 2012; Dikmen et al., 2008;Thevendran and Mawdesley, 2004; Fan et al.,2008; Chen et al., 2011 Menches, and Hanna,2006)with different aspects, some have even taken aspecific risk factor and worked on its importancein risk management but all the studies generallypoint out in the direction that risk assessment andmonitoring is essential for preparation of riskmitigation plan or for having a better riskmanagement plan, although different techniquesmay be used or the industry type can be differentbut the risk factor decision is very general andthe overall process is one or the same.

Optimization: Journal of Research in Management24
The uncertainty management is also given in-depthanalysis by many authors (Soderholm, 2008; Sun,Wei and Yue, 2008; Tavares, Ferreira and Coelho,1998), mainly the calculable events in a projectare called as risks and the incalculable are calledby the name of uncertainty, even power networksector is also studied keeping in view theoptimization of project risk management, but stillspecific studies on transmission line installationphase, which itself is a big phase, is missing.Although techniques which are suggested aredifferent but mainly they are of two types that isquantitative and qualitative.
The main difference that lies is the decision orchoice related to the type of techniques to be used.The main techniques that are used are ISM(Interpretive Structural Modeling), AHP (AnalyticalHierarchy Process), Decision tree based approachand Probabilistic methods etc. So what we cananalyze is that the process for risk managementis quiet well accepted and generalized and is basedon risk factor decision and treatment but thetechnique that are to be used for dealing with theserisk factors needs to be worked upon since onetechnique is entirely different from the other andhence we have decided to analyze upon such atechnique which can be accurately used to predictthese risk factors with less dependence on historicaldata and still being more reliable.
Risk assessment for any particular project is adaunting task, many authors (Baccarini and Archer,2001; Barber, 2004) have given insight on thisaspect also, since for this risk ranking of projects,what is of utmost importance is the measurementof risks involved in the projects, both the authorshave introduced the methodology of risk rankingson the basis of five point rating method andgeneralized system based assessment for thebenchmarking of the whole project respectively.Similarly (Thiry, 2002) has also given a value basedmodel in which it is proved that performance basedtools that reduce uncertainty are better adaptedfor project success. The tools that are used forranking of risk factors can be ISM (InterpretiveStructural Modeling), AHP (Analytical HierarchyProcess) and Monte Carlo as demonstrated bydifferent authors (Iyer and Sagheer, 2010; Olaruet al., 2014).
The studies are also done specifically on powersector (Wyk et al., 2007; Regos, 2013; Tummalaand Burchett, 1999) but special consideration toelectrical transmission line installation section ismissing, although each of these studies analyses
exhaustively the factors and considerations thatare necessary for power sector projects, the studiesare more concentrated on operating condition risksbut in our study we have included the risks thatare present during installation phase of electricaltransmission line installation. These studies arealso used in pooling of risk factors for our ownanalysis and considering various risks factors thatare taken for consideration in our own study alsobut only after expert discussion on these collectedrisks.
For Markov Analysis the probability that is neededto prepare the transition matrix is obtained withthe help of expert discussion, many authors(Tanimoto & Hagishima, 2005; Skulj, 2011) havegiven different viewpoints regarding collection ofprobabilities, the mathematical approaches seemsto be having a very large number of assumptionsfor generating functions for probability but theseassumption are impractical for our case study oftransmission line installation projects and hencewe can say that deriving out these probabilitiesmathematically always proves full of constraints.Hence, in order to generate transition probabilitieswe have taken expert opinion from Delphi method,Skulj (2011) has used conditional desires as riskreducing methods, which is based on probabilisticstudies only on the other hand authors (Tanimoto& Hagishima, 2005) have also taken survey methodto derive the transition probabilities, in their paperfor the Markov dealing with the operation of airconditioner in dwellings, we have field datacollected and then parameters are decided on whichthe probability function is generated in the formof sigmoid function. Finally, the transitionprobability of on and off of air conditioner iscalculated and shown on the graph for differentdwellings on the basis of temperature differences,similarly in our study we have generatedprobabilities for risk occurring and non occurringfrom field data and expert opinion on thesetransition probabilities and finally to increase theaccuracy we have calculated probabilities for aboutfifty period’s of state transition matrix and theresult is used to generate the overall risk modelby multiplying it with impact function hencegenerated. The calculation is done simply bycollecting data for each of the risk factors andthen they are fed into a single value by taking theaverage, this average value then work as seed valuefor the Markov process and generate probabilityof risk occurrences.

25Volume 11, No. 1
RESEARCH METHODOLOGY
Markov Analysis
It is a technique which forecasts probabilities offuture events by analyzing presently knownprobabilities. It is a very simple yet effectivemethod in which a matrix of transition probabilitiesis developed, which is a matrix of conditionalprobabilities of being in a future state with respectto a current state. Then this transition matrix ismultiplied with original probability matrix and witheach ongoing multiplication we get a newprobability finally when there is an equilibrium
point for probability at each period we reach thefinal probability. This analysis is used extensivelyin predicting market changes and bad debts incase of finance but it can be very well used inprediction of risk occurrences in the same fashion.
Now we will find out the various risk factors thatare involved in any conventional transmission lineinstallation project, then after collection of theserisk factors from literature survey, we have takenexpert opinion regarding each major risk factor,the various risk factors that are collected by expertopinion and literature survey are shown in table 1.
Table 1: Showing Risk Factors Considered in the Study
Authors /Risk Factors
Aloini et al. (2012)
Baccarini et
al.(2001)
Castro et al.(1995)
Chen et al.
(2011)
Dey (2001)
Dikmen et al. (200
8)
Erickson
et al. (200
6)
Fan et al (2008)
Fang et al. (2012)
Iyer et al.
(2010)
Regos
(2012)
Thevendran
(2004)
Wu et al.
(2008)
Wyk et al. (2007)
Technical Risk
N S S S S S S S S S N N S S
Environmental Risk
N S N S S S S S N S S S S N
Financial Risk
N S N S S S S S S S N S N N
Human Risk
N S N N S N S N N S S S S N
HR Risks
S S N N S S S N S N N S S N
S= Supported by author, N= Not S= Supported by author, N= Not Supported by author
Here the main risk factors that have been collectedare Technical Risk, Environmental Risk, FinancialRisk, Human risk and Human Resource (HR) risk.
Steps involved for calculation of risk valuefor each risk factor –
Step I – Take each risk factor one by one, sincewe have got five major risk factors identified theyare Technical Risk, Environmental Risk, FinancialRisk, Human risk and HR risk, we will be takingeach risk one by one, for example if we assume R
Technical = (1) = [1, 0] in I state, that means risk
has occurred in state I so the probability of riskoccurrence in state I is 1 and the probability ofnon occurrence of risk is 0.
Step II – Now prepare matrix of transitionprobabilities P.
P =P11
P21
P12
P22( )
Where P11
= Probability that risk occurred in firststate and will occur in next state also.
P12
= Probability that risk occurred in first stateand will not occur in next state.
P21
= Probability that risk do not occurred in firststate but will occur in next state.
P22
= Probability that risk do not occurred in firststate and will not occur in next state also.
Step III – We know that (1) = [1, 0], now find (2) which is equal to (1) * P, similarly
(3) = (2) * P, now generate a state probabilitytable for each risk, as shown in Table 2.
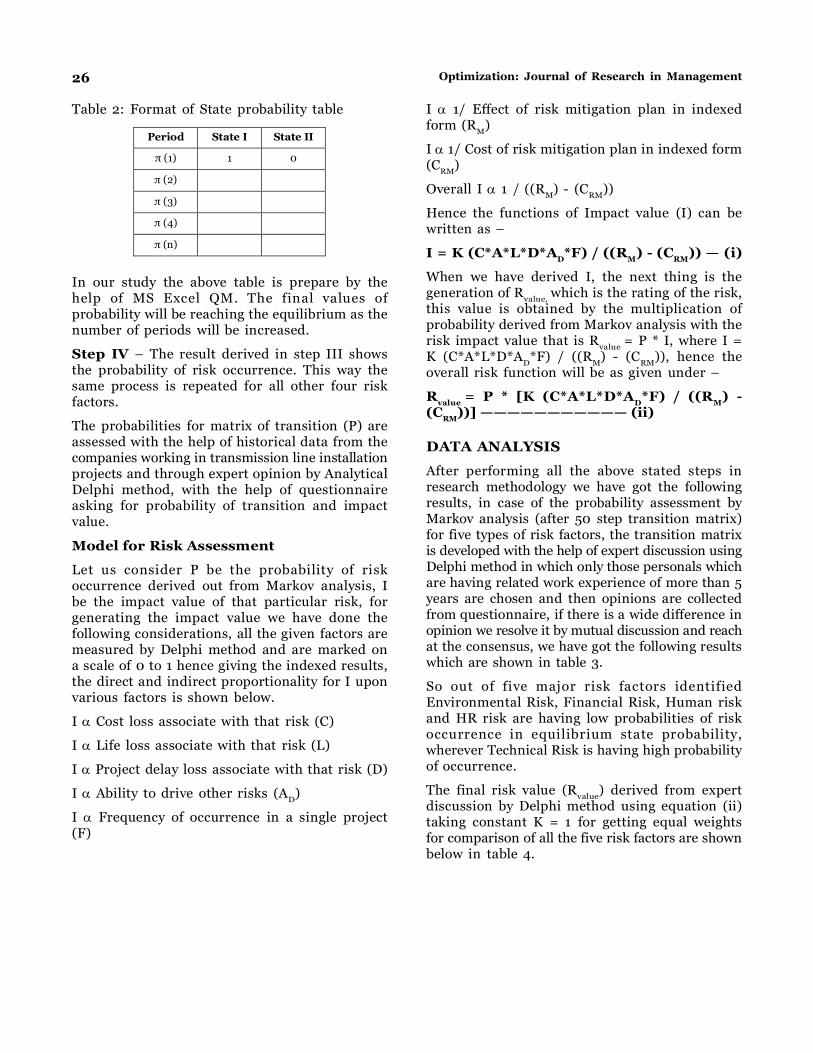
Optimization: Journal of Research in Management26
Table 2: Format of State probability table
Period State I State II
π (1) 1 0
π (2)
π (3)
π (4)
π (n)
In our study the above table is prepare by thehelp of MS Excel QM. The final values ofprobability will be reaching the equilibrium as thenumber of periods will be increased.
Step IV – The result derived in step III showsthe probability of risk occurrence. This way thesame process is repeated for all other four riskfactors.
The probabilities for matrix of transition (P) areassessed with the help of historical data from thecompanies working in transmission line installationprojects and through expert opinion by AnalyticalDelphi method, with the help of questionnaireasking for probability of transition and impactvalue.
Model for Risk Assessment
Let us consider P be the probability of riskoccurrence derived out from Markov analysis, Ibe the impact value of that particular risk, forgenerating the impact value we have done thefollowing considerations, all the given factors aremeasured by Delphi method and are marked ona scale of 0 to 1 hence giving the indexed results,the direct and indirect proportionality for I uponvarious factors is shown below.
I Cost loss associate with that risk (C)
I Life loss associate with that risk (L)
I Project delay loss associate with that risk (D)
I Ability to drive other risks (AD
)
I Frequency of occurrence in a single project(F)
I 1/ Effect of risk mitigation plan in indexedform (R
M)
I 1/ Cost of risk mitigation plan in indexed form(C
RM)
Overall I 1 / ((RM
) - (CRM
))
Hence the functions of Impact value (I) can bewritten as –
I = K (C*A*L*D*AD*F) / ((R
M) - (C
RM)) — (i)
When we have derived I, the next thing is thegeneration of R
value, which is the rating of the risk,
this value is obtained by the multiplication ofprobability derived from Markov analysis with therisk impact value that is R
value = P * I, where I =
K (C*A*L*D*AD
*F) / ((RM
) - (CRM
)), hence theoverall risk function will be as given under –
Rvalue
= P * [K (C*A*L*D*AD*F) / ((R
M) -
(CRM
))] ——————————— (ii)
DATA ANALYSIS
After performing all the above stated steps inresearch methodology we have got the followingresults, in case of the probability assessment byMarkov analysis (after 50 step transition matrix)for five types of risk factors, the transition matrixis developed with the help of expert discussion usingDelphi method in which only those personals whichare having related work experience of more than 5years are chosen and then opinions are collectedfrom questionnaire, if there is a wide difference inopinion we resolve it by mutual discussion and reachat the consensus, we have got the following resultswhich are shown in table 3.
So out of five major risk factors identifiedEnvironmental Risk, Financial Risk, Human riskand HR risk are having low probabilities of riskoccurrence in equilibrium state probability,wherever Technical Risk is having high probabilityof occurrence.
The final risk value (Rvalue
) derived from expertdiscussion by Delphi method using equation (ii)taking constant K = 1 for getting equal weightsfor comparison of all the five risk factors are shownbelow in table 4.

27Volume 11, No. 1
Table 3: Probability Assessment by Markov Analysis
Risk category
Probability value derived from MS Excel QM software
Technical Risk
50 step transition matrix
1 1 1 2 1 2
1 1 0 0.436241611 0.5637584
1 2 0 0.436241611 0.5637584
End prob(given init) 0.436241611 0.5637584
Environmental Risk
50 step transition matrix
1 1 1 2 1 2
1 1 0 0.153005465 0.8469945
1 2 0 0.153005464 0.8469945
End prob(given init) 0.153005465 0.8469945
Financial Risk
50 step transition matrix
1 1 1 2 1 2
1 1 0 0.250000001 0.75
1 2 0 0.25 0.75
End prob(given init) 0.250000001 0.75
Human Risk
50 step transition matrix
1 1 1 2 1 2
1 1 0 0.194233687 0.8057663
1 2 0 0.194233687 0.8057663
End prob(given init) 0.194233687 0.8057663
HR Risks
50 step transition matrix
1 1 1 2 1 2
1 1 0 0.280370027 0.71963
1 2 0 0.280355844 0.7196442
End prob(given init) 0.280370027 0.71963
Table 4: Showing Comparison of all the Five Risk Factors on the Basis of Rvalue
Risk Factors P C L D AD F RM C RM (C*A*L*D*AD*F) (RM - CRM) FINAL (I) Rvalue = P * I
Technical Risk 0.4362 8.33 5.69 5.66 7.25 3.69 8.63 5.9 7176.919446 2.73 2628.908 1146.839
HR Risks 0.2804 6.51 5.4 6.91 6.35 5.63 8.9 4.87 8684.301962 4.03 2154.914 604.1732
Human Risk 0.1942 3.25 7.8 2.41 1.4 8.61 5.9 5.6 736.421049 0.3 2454.737 476.7926
Environmental Risk 0.153 4.58 7.58 7.28 5.63 3.65 5.347 2.6 5193.585938 2.747 1890.639 289.2781
Financial Risk 0.25 5.7 2.6 5.2 5.2 5.48 6.89 2.5 2196.015744 4.39 500.2314 125.0578

Optimization: Journal of Research in Management28
From table 3 we can very well say that technicaland HR related risks are having highest R
value..
Moreover we all can say here that the analysisprovides a very sound detail for risk mitigationplan in which we can say that those risks whoseR
value are higher should be given more importance,
we can express it also in terms of percentage andthen total investment of all sorts that are decidedfor risk mitigation can be usefully divided on thebasis of this percentage only, as shown in table 5below.
Table 5: Showing the Rvalue
of Each Risk inTerms of Percentage of Total R
value.
Risk Factors Rvalue = P * I %
Technical Risk 1146.8 43.406
HR Risks 604.17 22.867
Human Risk 476.79 18.046
Environmental Risk 289.28 10.949
Financial Risk 125.06 4.7332
Total 2642.1 100
Hence the results also guide how much investmentcan be done for each risk in terms of percentageof total monetary level kept aside for riskmitigation. The results shows that samemethodology can be used to upkeep the riskmitigation plans for any project and since theMarkov analysis being based on transitionprobabilities the overall accuracy is greater ascompared to the case of pure probabilistic methods.
CONCLUSION AND FUTURE STUDIES
The paper analyzes the various aspects of riskassessment when there is very low historical dataavailable, by the use of Markov analysis and expertopinion for impact value. The paper also gives amodel for risk assessment which comprises ofimpact value of each risk, this impact value hencegenerated when multiplied by the probabilityderived from Markov analysis shows that the risklevel can be very well decided, in our studyTechnical and Human resource (HR) are foundto be most important risks since they both governsabout total 66 percent of total R
value , hence when
ever risk mitigation plans are needed to be fulfilledfor electrical transmission line sector we need tobe especially careful for such risks.
Another important aspect of this study is that weneed to have better and trained work force which
will reduce the HR risks and human life risks both,since collectively they form about 41 percent oftotal R
value, these risks are heavily interrelated and
hence on applying proper training to the HR teamand the workers we can drastically reduce suchrisks, which will be helpful in removingunnecessary risks that come in between the projectschedule.
In future such studies can be very helpful indeciding the risk level or standards for the entireindustry, moreover the same methodology can bevery well employed at the projects where thehistorical data is very less, the results shows thatwith very less amount of time and monetary inputswe can have a complete analysis of risk for anyproject, moreover its better than non quantitativemethods that are used generally, since these nonquantified methods are only used because of lackof historical data for probabilistic methods butthis method is based on probability but stillrequires comparatively very less historical data.The study revels and proves how efficiently therisk value can be calculated with the combineduse of Markov analysis and model derived in thestudy, the overall risk mitigation can be veryefficiently dealt since the results are quantifiedwithout the need of historical data, in future suchdecisions can also be done by the use of automatedsystems since the process can be very wellconverted into algorithm and can be even directlyattached as a module with various projectmanagement software. Hence the study proves veryhelpful for not only electrical transmission lineprojects but in numerous other type of projectsalso, which involves great monetary and nonmonetary inputs at the stake.
REFERENCES
• Aloini, D. Dulmin, R. & Mininno, V. (2012).Risk assessment in ERP projects. InformationSystems. 37, 183-199.
• Baccarini, D. & Archer, R. (2001). The riskranking of projects: A methodology.International Journal of Project Management.19, 139 -145.
• Barber, E. (2004). Benchmarking themanagement of projects: A review of currentthinking. International Journal of ProjectManagement. 22, 301- 307.
• Castro, Robert D. (1995). Overview of thetransmission line construction process. ElectricPower System Research. 35, 119-125.

29Volume 11, No. 1
• Chen, Z., Li, H., Ren, H., Xu, Q. & Hong, j.(2011). A total environmental risk assessmentmodel for international hub airports.International Journal of Project Management.29, 856-866.
• Dey, P. (2010). Managing project risk usingcombined analytical hierarchy process and riskmap. Applied Soft Computing, 10, 990 – 100.
• Dey, P. (2001). Decision support system forrisk management: a case study. ManagementDecision, 39 (8), 634-649.
• Dikmen, I., Birgonul, M.T., Anac, C., Tah,J.H.M. & Aouad, G. (2008). Learning fromrisks: A tool for post-project risk assessment.Automation in Construction, 18, 42–50.
• Erickson, J. M. & Evaristo, R. (2006). RiskFactors in Distributed Projects. Proceedingsof the 39th Hawaii International Conferenceon System Sciences IEEE.
• Fan, M., Lin, N. & Sheu, C. (2007). Choosinga risk handling strategy: An analytical model.International Journal of ProductionEconomics. 112, 700-713.
• Fang, C. & Marle, F. (2012). A simulation basedrisk network model for decision support inproject risk management. Decision SupportSystems. 52, 635-644.
• Geraldi, J. G., Turner, J. R., Maylor, H.,Soderholm, A., Hobday & Brady, T. (2008).Innovation in project management: Voices ofresearch. International Journal of ProjectManagement. 26, 586-589.
• Iyer, K.C. & Sagheer, M. (2010). HierarchicalStructuring of PPP Risks Using InterpretiveStructural Modeling. Journal of ConstructionEngineering and Management. 136, 151-159.
• Menches, L. C. & Hanna, A. S. (2006).Quantitative measurement of SuccessfulPerformance from the Project Manager’sPerspective. Journal of ConstructionEngineering and Management, 132, 1284 –1293.
• Olaru, M., Sandru, M. & Pirnea, I.C. (2014).Monte Carlo method application forenvironmental risks impact assessmentinvestment projects. Procedia – Social andBehavioral Sciences, 109, 940 – 943.
• Ping, Z. W. & Li, L. (2010). The Analysis andEstimation on Risk Factors in EngineeringProject Life Cycle. 978-1-4244-5326-9/10,IEEE.
• Regos, G. (2012). Comparison of power plant’srisks with multi criteria decision Models.Central European Journal of OperationsResearch, 21(4), 845 – 865.
• Skulj, D. (2011). The use of Markov operatorsto constructing generalized probabilities.International journal of ApproximateReasoning, 52, 1392 – 1408.
• Soderholm, A. (2008). Project managementof unexpected events. International Journalof Project Management, 26, 80-86.
• Sun, W. & Ma. Y. (2008). Risk Assessment inElectrical Power Network Planning ProjectBased on Principal Component analysis andSupport vector Machine. Proceedings of 7th
World Congress on Intelligent Control andAutomation.
• Tanimoto, J. & Hagishima, A. (2005). Statetransition probability for the Markov Modeldealing with on/off cooling schedule ondwellings. Energy and Building. 37, 181 - 187.
• Tavares, L. V., Ferreira, J. A. A. & Coelho, J.S. (1998). On the optimal management ofproject risk. European Journal of OperationalResearch. 107, 451-469.
• Thevendran, V. & Mawdesley, M. J. (2004).Perception of human risk factors inconstruction Projects: an exploratory study.International Journal of Project Management.22, 131-137.
• Thiry, M. (2002). Combining value and projectmanagement into effective programmemanagement model. International Journal ofProject Management. 20, 221-227.
• Tummala, V. M. R. & Burchett, J. F. (1999).Applying a risk Management Process (RMP)to manage cost risk for a EHV Transmissionline project. International Journal of ProjectManagement. 19, 223-235.
• Wu, C.H., Wang, Luan & Fang, K. (2008).Investigating the Relationship between ProjectRisk and Project Performance. Thirdinternational Conference on Convergence andHybrid Information Technology IEEE.
• Wyk, R. V., Bowen, P. & Akintoye, A. (2007).Project risk management practice: The caseof a South African utility company.International Journal of Project Management.26, 149-163.

Optimization: Journal of Research in Management30
Digital India & Indian Society: A Case Study
Debarun Chakraborty* & Wendrila Biswas*
* Assistant Professor, Department of Management & Social Sciences, Haldia Institute of Technology, Haldia
ABSTRACT
It is a well-known fact that digital India is theoutcome of many innovations and technologicaladvancements. These transform the lives of peoplein many ways and will empower the society in abetter manner. The Digital India Program, aninitiative of honorable Prime Minister Mr.Narendra Modi, will transpire new developmentin every sector. The motive behind the concept isto build participative, transparent and responsivesystem. The Digital India drive is a dream projectof the Indian Government to remodel India intoa knowledgeable economy and digitallyempowered society, with good governance forcitizens by bringing synchronization and co-ordination in public accountability, digitallyconnecting and delivering the governmentprograms and services to mobilize the capabilityof information technology across governmentdepartments. Today, every nation wants to befully digitalized and this programme strives toprovide equal benefit to the user and serviceprovider. Hence, an attempt has been made inthis paper to understand Digital India – as acampaign where technologies and connectivity willcome together to make an impact on all aspectsof governance and improve the quality of life ofcitizens.
Keywords: Digitization, Digital India, Impacton Society.
INTRODUCTION
Advanced Technologies, which incorporate CloudComputing and Mobile Applications, have risenas impetuses for speedy monetary developmentand national strengthening over the globe.Advanced advances are by and large progressivelyutilized by us in regular daily existences, from retaillocations to government workplaces. They enableus to interface with each other and furthermoreshare data on issues and concerns looked by us.Decent Prime Minister imagines changing ourcountry and making open doors for all residentsby bridling advanced advances. His vision is toenable each resident with access to advancedadministrations, learning and data. Advanced Indiais the following enormous thing that India is seeing.It goes for significantly contacting the lives ofeverybody with the change venturing to every partof the ways of both provincial and urban India.
Today, the world has changed from an informationwise to techno learning astute. Consider somethingand it is accessible in a single tick. Along theselines, Digital India is a stage by the administrationto motivate and interface Indian Economy to suchan information shrewd world. The program focusesto make Government administrations accessibleto individuals carefully and appreciate theadvantage of the most up to date data andmechanical advancements. It brings out differentplans like E-Health, Digital Locker, E-Sign, E-

31Volume 11, No. 1
Education and so forth and across the countrygrant entryway. The program endeavors to givelevel with advantage to the client and specialistorganization. The buyers will be profited by methodfor sparing time, cash, physical and psychologicalvitality spent in protracted government forms.
The Digital India Program has been propelled witha point of changing the nation into a carefullyengaged society and learning economy. The DigitalIndia would guarantee that Governmentadministrations are accessible to nativeselectronically. It would likewise get openresponsibility through ordered conveyance oftaxpayer driven organizations’ electronically; aUnique ID and e-Pramaan in light of credible andstandard based interoperable and coordinatedgovernment applications and information premise.
Computerized India is a fantasy venture of thelegislature for the residents and Industries of Indiawhich could help in associating the different overa wide span of time tasks to convey India to aworldwide stage. Through this task taxpayersupported organizations are accessible for urbanand rustic nationals carefully or electronically. Itwill accomplish advanced development and makeconstructive effect in the general population livingin rustic and urban regions. It will draw in interestin all item producing ventures. Andhra Pradeshis the principal State to have picked this usage.The Digital India venture plans to change ournation into an advanced economy with cooperationfrom provincial or urban natives and organizations.This will guarantee that all taxpayer drivenorganizations and data are accessible anyplace,whenever, on any gadget that is anything butdifficult to-utilize, exceedingly accessible andanchored. Computerized India Project expelsadvanced hole between the rustic and urban India.
LITERATURE REVIEW
A Study of New-Age e-Entrepreneurship in India(Arjuna Kumar Sahul, 2015) Arjuna Kumarinvestigate Digital India and other activity likeNational Digital Literacy Mission (NDLM) entranceof cell phone and broadband has brought up inhuge number and example of clients has changed.‘Entrepreneurial urbanization’ in Dholera brilliantcity, Gujarat (Datta, 2015) Datta has investigatedtop to bottom basic examination on Dholera savvycity to recommended how state endeavor to drawin worldwide capital and improve financialdevelopment through development of new townships. An Empirical Study (Sarin, 2016) Sarin
clarified Digital India program, which goes forsetting up e-framework in the country willempower quicker foundation of the IoT business.A Trend Analysis (Sarkar, 2016) Sarkarexamination IT and Innovation in keeping moneysegment has made it more focused and conveyingbetter client administrations. It has change keepingmoney from money and paper based to cashlessand paperless. (G.Piro, 2014) G. Piro center aroundprogress ICT innovation bolster administrations(i.e. e-government and open organization, shrewdtransportation framework, open security social,medicinal services, training, building and urbanarranging, condition and vitality and wateradministration application in Smart urbancommunities by forthcoming remote innovations.
Dream to the real world (Suresh, 2016) Sureshinvestigates techniques for arranged urbanization,rule for keen city improvement and disclosemusings to change urban India. (Singh, 2016) Singhexplored Indian saving money segment andexamined the difficulties and openings in it. Creatorput his perspectives that Indian Government needsgreater banks to back, its social undertakings,framework stores like Digital India, Bullet Trainand so forth. A walk towards advanced India (Joshi,2016) Joshi dissect the parameters (i.e.comprehension and learning, legitimate part ofportable wallet) for the utilization of versatilewallet, Banks giving this administration mustconcentration to give mindfulness about it Morethan 75%(more than 100 center) of populaceutilizing cell phone and each one of versatile clientmust utilize portable wallet. Versatile wallet benefitis critical device of Digital India. (Joshi, 2016) Joshian endeavor to comprehend calculatedcomprehension and review with the present patternin computerized human services in India andworld. This examination likewise addresses issuesand difficulties in digitization of human servicesbenefits in India. (Singh, 2016) Singh concentratedon the reasonable comprehension of advancedlocker. The proposed a mindfulness battle in thisnation about advanced bolted is required andcomputerized locker is imperative piece of DigitalIndia. Green Tab information bistro (BharatBhagtani, 2016) Bharat investigated theattainability of plan of action of e-library throughessential research and advantages of it. Creatorexpects it will achieve its breakeven point in twoyears. (Raghavendra Kulkarni, 2016) RaghavendraKulkarni clarifies and examination the describes,favorable circumstances and difficulties in theexecution of E-Governance the two principle points

Optimization: Journal of Research in Management32
of interest of E Governance are expandedstraightforwardness and quick open administrationconveyance. Electronic conveyance of Services(Sarkar, 2016) Sarkar features highlights andadministrations of E-Kranti. Request of ITequipment will increment with the assessment ofthis program a viable approach in view of pastinvolvement for Ne GP ought to be actualized forthe E administration.
RESEARCH OBJECTIVE
• To study the impact of Digitization on Indiansociety
RESEARCH METHODOLOGY
The secondary data has been gathered at first. Forthis reason, different magazines and diaries havebeen utilized as it is a calculated paper. Hence,the concentration is to find out about the idea,its application and the effect on economy. Alongthese lines subjective information have beenutilized. As the examination paper is of calculatedand survey nature, the specialist has connectedexploratory research configuration by utilizingfluctuated secondary data profited from theoptional information sources. In view of theauxiliary information and audit, the scientist haswritten about different rising patterns and issuesand difficulties in advanced India. Research report,diary and daily paper articles from famous authorshave been checked on.
IMPACT OF DIGITIZATION ON INDIANSOCIETY
Social sectors such as education, healthcare, andbanking are unable to reach out to the citizensdue to obstructions and limitations such asmiddleman, illiteracy, ignorance, poverty, lack offunds, information and investments. Thesechallenges have led to an imbalanced growth inthe rural and urban areas with marked differencesin the economic and social status of the people inthese areas. Modern Information andCommunications Technology (ICT) makes it easierfor people to obtain access to services andresources. The penetration of mobile devices maybe highly useful as a complementary channel topublic service delivery apart from creation ofentirely new services which may have an enormousimpact on the quality of life of the users and leadto social modernization.
The poor literacy rate in India is due tounavailability of physical infrastructure in rural
and remote areas. This is where m-Educationservices can play an important role by reachingremote masses. According to estimates, the digitalliteracy in India is just 6.5% and the internetpenetration is 20.83 out of 100 populations. Thedigital India project will be helpful in providingreal-time education and partly address thechallenge of lack of teachers in education systemthrough smart and virtual classrooms. Educationto farmers, fisher men can be provided throughmobile devices. The high speed network canprovide the adequate infrastructure for onlineeducation platforms like Massive Open OnlineCourses (MOOCs).
Mobile and internet banking can improve thefinancial inclusion in the country and can createwin-win situation for all parties in the value-chainby creating an interoperable ecosystem and revenuesharing business models. Telecom operators getadditional revenue streams while the banks canreach new customer groups incurring lowestpossible costs.
Factors such as a burgeoning population, poordoctor patient ratio (1:870), high infant mortalityrate, increasing life expectancy, fewer qualityphysicians and a majority of the population livingin remote villages, support and justify the needfor tele medicine in the country. M-health canpromote innovation and enhance the reach ofhealthcare services.
Digital platforms can help farmers in know-how(crop choice, seed variety), context (weather, plantprotection, cultivation best practices) and marketinformation (market prices, market demand,logistics). One of the most interesting andimportant factors related to digitization is the linkto overall societal welfare. Digitization, as a socialprocess, enables the institutions to generate,cooperate and create larger for the benefits andprogress of the society through digitalcommunications and applications.
The process of digitization involves the massdigitization of books and older and rare materials.For the purpose of preserving the knowledgecontents for future generations or making themavailable to a much wider community than couldever access the physical objects, many of theinstitutions(libraries and cultural archives) havestarted digitization initiatives to provide access tothe history of societies, countries, cultures andlanguages. More than a last three decades, culturalheritage institutions (libraries, archives andmuseums) have incorporated technology into all
33Volume 11, No. 1
aspects of their mission and services. By digitizingtheir resources, cultural heritage institutions canmake information accessible that was previouslyonly available to a selected group of users Fordigitization, a number of libraries, archives,museums and publishers have been scanning theirolder documents and rare images for many yearsand catalogued and made them available throughthe World Wide Web.
However, the process of digitization is not onlymeans of preservation of knowledge contents, butalso protecting these delicate and rare originalsdocuments from heavy wear and tear whenpresenting to a large community. By providingaccess to digitized item online, institutions enablethe users all over the world to view the informationat different time sequel or simultaneously. Also,the users no longer need to invest much time andmoney to visit the physical location for an item.This conversion of all types of valuable and culturalcontents into bits and bytes gives rise to a newdimension of reaching towards the vast audiencemaking availability to valuable cultural resourcesin ways that were not possible in the past. Thus,users from all over the world are depending onthe ease and speed of digital access for unearthingmany new and rare resources, of which they neverhave any knowledge or found in print collections.Moreover, the digitization is facilitated awareness,research and promotion of both past and presentculture and knowledge, also has a direct impacton overall happiness and satisfaction of the peoplethat they get from the capacities and capabilitiesconnecting with digital technology.
CONCLUSION
Digital conversion of print sources has improvedrapidly in the past few years. Digitization is thesocial transformation started by the massiveadoption of digital technologies to generate process,share and manage digital information. Digitizationis an inclusive technique of preservation and accessby which all the institution‘s assets are transformedinto digital and creating high-quality copies indigital format. It provides advanced opportunitiesfor preservation and access to knowledge contents,also it changes the ways in which collections areused and accessed. Emerging digitization initiativesand ways in which institutions are becoming digitalare causing various effects on economy, societyand academics as well. These radical and rapidchanges make the information presentation anddistribution more rapid, open, and global access
to the information than has been available in thepast. In addition, converting material from analogto digital format reduces some of the costs includedin digitization operations for providing access toprint sources.
However, the digital copies should not be areplacement for the original items of knowledge.Digital files are not permanent and should needa regular maintenance and transformation to newerformats. For utilizing the full benefits fromdigitization, organizations should select thematerial carefully for digitization and digitize onlythose items that will provide the maximum benefitto both administrator and user. Because, successfuldigital projects are the outcome of carefulevaluation of collections, and also, carefulassessment of the institution‘s goals and prioritiesand development of thoughtful strategies willassure that meaningful, high-quality digital versionsare created, and that both original and digital assetsare managed well over time.
A digitally connected India can help in improvingsocial and economic condition of people throughdevelopment of non-agricultural economic activitiesapart from providing access to education, healthand financial services. However, it is importantto note that ICT (Information and CommunicationsTechnology) alone cannot directly lead to overalldevelopment of the nation. The overall growth anddevelopment can be realized through supportingand enhancing elements such as literacy, basicinfrastructure, overall business environment,regulatory environment, etc. The Digital Indiaprogram is just the beginning of a digitalrevolution, once implemented properly it will openvarious new opportunities for the citizens.
REFERENCES
• Ahaskar, A. (2016). live mint politics. Retrievedfrom live mint e paper: www.livemint.com/Politics/m2QJ2ZRmjgebA0Uvdsz7ki/taking-IT-skills-to-themasses.html
• Arjuna Kumar Sahu1, D. M. (2015). DigitalIndia: A Study of New-Age e-Entrepreneurshipin India. Siddhant, 110-116.
• Aruna Sundararajan, A. U. (2016, December20). The economic times in collaboration withERICSSON Presents. Retrieved from TheEconomic Times:economictimes.indiatimes.com/digital-india-isachevable-but-it has-its-set- of challenges/challenges/changemakersshow/48900738.cms

Optimization: Journal of Research in Management34
• Bharat Bhagtani, B. B. (2016). Digital India:Green tab knowledge cafe. Developing IndianEconomy an Engine job creation (pp. 322-333).Ahmedabad: Gujarat Technological University.
• BUREAU, R. N. (2016, June 26). THE HINDU.Retrieved from thehindubusinessline.com:http://www.thehindubusinessline.com/info-t e c h / w h y - i t - f i r m s - a r e - s h y i n g - a w a y -fromgovtprojects/ article876012.ece
• Chowdhary, S. (2016, June 27). The FinancialExpress. Retrieved fromwww.financialexpress.com: epaper.financialexpress.com/853900/financial-express-mumbai/27-june-2016#page/8/1
• Datta, A. (2015). New urban utopias ofpostcolonial India: Entrepreneurialurbanization in Dholera smart city. Gujarat.Dialogues in Human Geography, 3–22.
• Deloitte. (2016, 12 14). Deloitte. Retrieved fromDeloitte Touche Tohmatsu India LLP: https://www2.deloitte.com/content/dam/Deloitte/in/D o c u m e n t s / t e c h n o l o g y -mediatelecommunications/in-tmt-very-largedatabases-noexp.pdf
• Deloitte, ASSOCHAM. (2015, September).Deloitte. Retrieved from Deloitte: https://www2.deloitte.com/content/dam/Deloitte/in/Document/technology-media- telecommunications/in-tmtempowering- india-citizensthrough-technology-noexp.pdf
• G.Piro, I. (2014). Information centric servicesin Smart Cities. The Journal of Systems andSoftware, 169-188.
• Joshi, D. (2016). Reviewing digitization inhealthcare services in India. Developing IndianEconomy an Engine of Job creation. 57-68
• Joshi, R. (2016). Uniting mobile wallet in thecustomer journey: A stride towards DigitalIndia. Developing Indian Economy an EngineJob Creation. 37-50. Ahmedabad: GujaratTechnological University.
• KPMG. (2016, August). KPMG. Retrieved fromKPMG: https://assets.kpmg.com/content/dam/kpmg/sg/pdf/2016/09/sgsingapore-payments-roadmap-enabling-the future-the-future of payments.pdf
• Ministry of Electronics & InformationTechnology,Government of India. (2016,December 20). digitalIndia.gov.in. Retrievedfrom www.digitalindia.gov.in/content/about-programe
• Raghavendra Kulkarni, A. B. (2016). E-governance –reforming government throughtechnology . Developing Indian Economy anEngine Job Creation (pp. 365-370).Ahmedabad: Gujarat Technological University.
• Sarin, G. (2016). Developing Smart Cities usingInternet of things: An Empirical Study.Computing for Sustainable GlobalDevelopment (INDIACom),2016 3rdInternational Conference (pp. 315-320). NewDelhi: IEEE Conference Publication.
• Sarkar, A. (2016). E-kranti – electronic deliveryof services . Developing Indian Economy anEngine Job creation. 388-399. Ahmedabad:Gujarat Technological University.
• Sarkar, D. S. (2016). Technological Innovationsin Indian Banking Sector - A Trend Analysis.Journal of Commerce & Management Thought.171-185.
• Singh, A. (2016). Indian Banking Sector-challenges and opportunities. Remarking.
• Singh, A. G. (2016). A study on diffusion ofdigital locker technology in Vadara district.Developing Indian Economy an Engine JobCreation. 273-280. Ahmedabad: GujaratTechnological University.
• Suresh, P. (2016). Development of Smart Citiesin India-Dream to Reality. ScholedgeInternational Journal of Business Policy &Governance, 73-81.
• The Boston Consulting Group, Internet AndMobile Association Of India. (2016).India@Digital Bharat. Mumbai: The BostonConsulting Group.
• The Hindu. (2016, July 29). The HinduBusiness line infotech. Retrieved fromT h e h i n d u b u s i n e s s l i n e . c o m :www.thehindubusinessline.com/info-tech/digitisation-will-change-economic-growth-model-nilekani/article8918146.ece

35Volume 11, No. 1
Effective CRM Adoption and Implementation:The Critical Role of Flexibility
Kumar Shalender* & Rajesh Kumar Yadav**
* Associate Professor, Chitkara Business School, Chitkara University, [email protected]
** Assistant Professor, Amity School of Business, Amity University Uttar Pradesh, Noida
ABSTRACT
Rapid globalization has presented phenomenalgrowth opportunities for businesses across theworld. To leverage these opportunities,organizations are increasingly turning towardcustomer relationship management (CRM). CRMhelps in maintaining long-term customerrelationship by developing products/servicesaligned with the customers’ need. However, ever-changing market conditions and evolvingTechnology have created a turbulent andtumultuous environment for the CRM. Flexiblestrategies ensure that CRM adapts to changingbusiness realities timely, thereby minimizing thenegative effect on the organization due to adelayed response. The study proposes that flexiblestrategies, particularly in marketing, services, andinformation system (IS), have a positive impacton firm performance and help the organizationto retain its competitive edge.
Keywords: CRM, Flexibility, Information System(IS), Marketing, Relationship, Service.
INTRODUCTION
In the last three decades, Customer RelationshipManagement (CRM) has emerged as a powerfultool to align the interest of a firm with its customers
(Boulding et al. 2005). It has emerged as apowerful concept for achieving a sustainablecompetitive edge and being customer oriented, itsimportance in today’s turbulent environmentcouldn’t be over emphasized. CRM helps indeveloping long-term relationship with customersand in the process, strives to build a strong brandloyalty. No wonder, every customer-orientedorganisation attaches utmost importance to itsCRM. Along the same lines, the rapidly evolvingmarketplaces and shrinking product life-cycles haveenhanced the importance of flexibility for achievingcustomer satisfaction and superior marketingperformance (Gurau, 2009). Especially buildingflexibility in the core functions such as marketing,service, and information system (IS) have receivedmuch importance equally among academicians andpractitioners. The purpose of the study is topropose a conceptual framework to aid effectiveadoption and implementation of the CRM in anorganization.
Based on the literature and experts’ interviews,the study has selected the three most importantfunctions – marketing, service, and IS – forgeneration of flexibility. These three variables havebeen chosen on the basis of extant literature reviewwhich has later ratified by the experts form a widearray of Industry segments. Academic scholars and

Optimization: Journal of Research in Management36
practitioners are almost unanimous of the fact thatmarketing, service, and information system (IS)are the most critical for the success of CRM asthey significantly influence its adoption andimplementation effectiveness. After selection, studyrevisits these variables from flexibility viewpointto identify the critical areas where flexibility canbe generated and how that enable the betteradoption and implementation of CRM. Towardsthe end a conceptual framework integrating allthese variables is proposed that not only aids theCRM’s effectiveness but also helps the firm toachieve sustainable competitive advantage.
LITERATURE REVIEW
Customer Relationship Management (CRM):Both the important aspects of this research, i.e.,CRM and flexibility have received enough attentionin the extant literature. CRM is the combinationof people, processes, and Technology to betterunderstand the customer perspective. The CRMshould be considered as an integrated approachwhich focuses on customer acquisition, customerretention, and management of the relationship ina way that will become profitable for theorganization. In sum, CRM is one of the ways toachieve customer loyalty and its effectiveimplementation leads to the attainment ofsustainable competitive edge. As acquiring a newcustomer is far more costly than retaining thepresent one, the organizations across the industryare rigorously implementing CRM practices fortheir customer retention and competitive advantage(Jain et al. 2016). In fact with the rapid evolutionof Information Technology, the companies areadopting different ways including e-CRM to retaincustomers and enhance their loyalty.
Flexibility: Flexibility is a multidimensionalconcept and has many connotations to it.Adaptability, pliability, elasticity, suppleness, andmalleability are some of the synonyms that areattached to flexibility. The flexibility has remainedone of the core areas of research since 1930sthough it is only after the globalization; the conceptcame back into Limelight. The blurring boundariesof businesses, flickering customer taste, shorteningproduct life cycles, and decreasing customer loyaltyare some of the reasons behind the enhancedimportance researchers today attached to theflexibility (Singh and Shalender 2014; Shalender2018). The most suitable definition of flexibilitythat is near to the common man’s understandingis doing something else than what was originally
intended. Flexibility also means taking a positionbetween two extreme ends and constantly adaptingand reconfiguring the strategy according to changesin the market on a real-time basis. From theliterature review and expert interviews, we haveidentified three important functions – marketing,service, and IS – for building flexibility that willin turn aid effective adoption and implementationof CRM.
The very first variable, i.e., marketing flexibilityis defined as the ability of transnationalcorporations to recalibrate its marketing effortsin a short period in response to changingenvironmental context (Grewal and Transtutaj,2001). This aspect helps the organization to takea quick decision on the four P’s of marketing –Product, Price, Place and Promotion. By quick andresponsive tailor made marketing strategies thatare based on changing preferences of target market,marketing flexibility helps to meet the customers’need more effectively and hence, aid in thecustomer retention and loyalty. Flexibility in secondvariable of study, i.e., service allows theorganization to allow enhanced participation ofcustomers in overall business processes. Asconsumers do not avail services but rather life-enhancing experiences (Vargo and Lusch 2004),enhancing their participation in the business issure to result in mutually beneficial relationships.In fact, Prahald and Ramaswamy (2004) suggestedthat nowadays the value is co-created by companiestogether with their customers, making it desirableto have requisite level of flexibility in serviceoperation. Benefits of Service flexibility to the CRMcan be realized in form of more harmoniouscustomers having sense of belongingness for thecompany.
In contrast to direct benefits provided by marketingand service, Flexibility in the IS benefits the CRMindirectly by integrating the processes andprocedures for its effective implementation. Anideal IS seamlessly connecting the databases,processes, and procedures across the departmentsand in the backdrop of turbulent environment,its flexibility has assumed so much prominence.Gebauer and Schober (2006) defined IS flexibilityas the ability to accommodate a certain amountof variation regarding the requirements of thesupported business process. In fact, IS flexibilitynot only aids to increase the overall effectivenessof CRM but also helps in the marketing andservices by providing the quick and timelyresponse.

37Volume 11, No. 1
THEORETICAL SCHEME ANDUNDERPINNINGS
The study is conducted with the help of extensiveliterature review and experts’ interviews whichresulted into finalization of three aspects for theflexibility generation – marketing, service and IS.To this end, various online databases of thepublications along with relevant conferences detailshave been searched to construct the theoreticalframework for the study. Besides, practical casestudies from the corporate world have also beenincluded in the research to demonstrate the adoptionand implementation benefits that CRM realize onaccount of flexibility incorporation in areas ofmarketing, services and IS. Flexibility attributesrelated to each variable along with their relevancehave been presented in the section given below:
Marketing Flexibility: Flexibility in context ofmarketing refers to the ability of a company tomeet the challenge of satisfying customers withinthe overall framework of its business strategy(Sharma, M.K. et.al. 2010). This requires thecompany to be flexible enough to have wide rangeof products to cater needs of diversified groupswhich also makes the organization less dependenton one category and reducing its vulnerability onsingle product (Shalender and Singh 2015).Marketing flexibility also enables the organizationsto have a high market share/ strong marketpresence (Abbot and Banerji, 2003). To achievemarketing flexibility, a firm must generate theflexibility in its 4 P’s that will help the organizationto recalibrate its efforts in response to evolvingconditions (Shalender et al. 2017). The firstdimension of product flexibility refers to the abilityof organization to make a variety of products onthe same production facility/line. It equips themanufacturer with the ability to manufacturemultiple products on same capacity, and the abilityto relocate the capacity between different productsin response to realized demand (Goyal andNetessine, 1998). Price flexibility, on the otherhand, is the mechanism of free market to moderateoutput fluctuations in the face of demand shock(Kandil, 1999). Also Flaschel and Franke (2000)noted that price flexibility represents a spectrumranging from one extreme of complete flexibilityto complete rigidity at other end rather than havinga characteristic of yes-or-no circumstances.
The Study by Ashkena (2000) attached significantimportance to the place flexibility and in his article,“How to loosen organizational boundaries” theauthor emphasized the importance of placeflexibility, along with speed, innovation andintegration, in organizational success. Gilbert
(1999) described the importance of promotionflexibility in terms of an incentive to evoke desiredresponse from the target market. Promotionalflexibility equips the organization to react quicklyto the campaign launched by its competitors. Italso pertains to the advantage that company getsby taking the lead in terms of launching thepromotional campaign before its rivals. Thisflexibility helps in realizing the effectiveness ofCRM by providing better value proposition tocustomers that is according to latest trends andchanged preferences. In turn, CRM helps back byproviding the crucial information to marketingabout the latest developments in market place withthe help of IS flexibility.
Table 1: Marketing Flexibility
Attributes Importance
Product Flexibility broad range of customers
Price Flexibility Value for money, swift price change
Place Flexibility Customer convenience, reaching to
the last mile
Promotion Flexibility Effective positioning
Service Flexibility: This dimensions aims toincrease the customer participation through theenhanced level of interaction with the organization.The involvement helps the organization bydetermining the responsibility to purchase andrepurchase along with supporting the firm withpositive referrals (Schneider and Bowdon, 1999).The desired level of service flexibility in theorganization can be achieved through the structuralchanges and process reorientation. Organizationstructure is a means to achieve the mission andobjectives of firm and hence bears a significantimportance in realizing the overall efficiency ofthe work force. Traditional business structuresfavors the control from upward as power is vestedat top most position of hierarchy. Though effectivein the padst its efficiency is on decline in face ofemerging realities. Inefficiency of hierarchicalorganizations in the context of globalization hasbeen pointed out by Achrol and Kotler (1999).Because of the rigid top down control that spansacross a number of levels, these structures failsto respond effectively and efficiently to thechanging environment situations. Decentralizingand flattening of the structures are some of theflexible approaches and in both the cases controlmoves closer to the action typically increase thedecision maker understanding of the situation(Englehardt and Simmons, 2002). Another flexiblestrategy as discussed by Hamel (2000) advocates
Optimization: Journal of Research in Management38
the philosophy of dividing the structure like a cell.This helps to make the organization moreresponsive as the task-focus increases andcustomers will be benefitted in terms of increasedattention aspect.
Table 2: Service Flexibility
Attributes Importance
Enhanced Participation Building customer confidence
Involvement in value creation Evokes positive referrals
Permeability to processes Allows enhanced transparency
The second component of service flexibility, i.e.,process reorientation refers to the speed at whichthe company can make decisions, alter schedules,or amend existing orders to meet customer needs(Holweg and Pil, 2001). In case of services thisaspects relates to making the processes moreflexible in order to increase the customer exposureto the whole process. Prahalad and Ramaswamy(2004) suggested that the value co-creation bycompanies together with their customers requireprocess reorientation to enhance value deliveryexperience. Having the capability of processreorientation helps the organization to quicklychange the processes according to changingcustomers’ preferences (Shalender and Yadav2018). In case of services, this allows the processesto be personalized and meet the need of individualcustomers. This also enables the enhancedparticipation of the consumers while the valueproposition is being generated and offers theman opportunity to give their crucial feedback.
Service flexibility helps CRM by providing moreconducive environment which facilitate insightsabout the customers’ behavior and demandspreferences; ultimately enhancing its overalloperational efficiency. In turn service gets benefittedfrom this enhanced level of CRM effectiveness asit is now better equipped to develop and sustainthe value-constellation system that aids its owneffectiveness even in case of changing dynamics.
Information System (IS) Flexibility:Information system (IS) plays crucial role inendowing the organization with capability torespond in timely and efficient manner. Thisrequires end-to-end integration of informationwithin the enterprise and a proper mechanism thatmakes this information available throughout thecompany seamlessly. Flexibility in this dimensionhelps by providing the updated information acrossthe organization on real time basis. IS flexibility,as defined by Mensah (1989), is ability to respond
and adapt to changing business conditions bothwithin and outside the organization. Successfulimplementation of CRM rests on the crossfunctional integration of the processes, people,operations, marketing capabilities, information,technology, and application (Payne and Frow,2005) and hence, the flexibility of IS cannot beunder-emphasized. Though there are variousdimensions of IS flexibility; some relevant onesgiven by Byrd and Turner (2000) have been shownin table 3 as below:
Table 3: IS Flexibility
Attributes Importance
IT connectivity Enables effective coordination and
enhanced integration
Data Transparency Enables permeability as well as
enhances efficiency
IT Compatibility Enablesthe smooth completion of
cross-functional operations.
Source: Byrd and Turner (2000)
CONCEPTUAL FRAMEWORK
Flexibility has inherent ability to act as a distinctivecompetence of organization and hence can providethe competitive edge to the firm. By use of flexiblestrategies, effectiveness of CRM can be enhancedthat not only helps the organization at strategiclevel (by acting as a competitive weapon) but alsoat business level by hedging the organizationagainst the devastating effect of decreasingcustomers’ loyalty aspect.
Flexibility in marketing and services reduces theunreasonable pressure on CRM; helping it toconcentrate on its core function while IS flexibilityaids the efficiency of CRM by effectively integratingthe various business processes along withresponding effectively to changing customers andbusiness demands. Thus a conceptual model aidingthe effectiveness of CRM with the help of thesethree variables is shown in figure 1.
CONCLUSION AND DISCUSSION
Of late, CRM and flexibility have emerged as keyresearch areas in the management domain. Bothof the aspects have crucial implication for the firm’sperformance and sustainability. However, despitetheir separate importance, its remain unclear howthese two concepts come together and affect theperformance of the firm. Most often CRMinitiatives; rather than focussing on their broadkey objectives become victim of the efforts directedto get short term gains. Improvements confined

39Volume 11, No. 1
within the boundaries of CRM might not get thedesired result in terms of enhancing its overalleffectiveness and the need to have a more holisticapproach mandated in the wake of continuouschange happening in market place.
This research makes a contribution in this regardas it studies how the effectiveness of CRM can beenhanced with the use of flexible strategies. Inparticular, the study correlates marketing flexibility,service flexibility, and IS flexibility with CRM andtheir combined effect on customer loyalty andcompetitiveness. The research proposes aconceptual model connecting all the variables forsuperior firm performance and assumes specialsignificance by proposing fresh, systemic, andcross-functional approach to aid CRMcompetitiveness to help organization survive duringthe turbulent times.
We propose to empirical test the conceptualframework on the Indian automobile industry infuture. To that end, the 4-wheeler segment hasbeen selected and the empirical investigation willreveal whether the theoretical model is valid ornot. The study has implication for the researchersas the combined effect of the flexibility and CRMhas not been explored much in the past. Scholarscan replicate this model on other segments too tofind whether result aligns in the same directionor not. The practitioners will be benefited fromthis conceptual framework as it allows combiningdifferent flexibility strategies for enhancing theeffectiveness of CRM. In other words, this can beused as a competitive tool for achieving anadvantage over the rivals.
REFERENCES
• Abbot, A. and Banerji (2003). StrategicFlexibility and Firm performance: The caseof US based Transnational Corporations.Global Journal of Flexible SystemsManagement. 4 (1&2), 1-12.
• Archrol, R.S. and Kotler, P. (1999). Marketingin network Economy. Journal of Marketing.146-163.
• Ashkenas, R. (2000). How to LoosenOrganizational Boundaries. The Journal ofBusiness Strategy. 21 (2), 11-12.
• Boulding, W., Stalin, R., Ehret, M., andJohnston, W.J. (2005). A CustomerRelationship Management Roadmap: What isKnown, Potential Pitfalls, and Where to Go.Journal of Marketing. 69(4), 155-166.
• Byrd, T.A and Turner, D.E. (2000). Measuringthe Flexibility of Information TechnologyInfrastructure: Exploratory Analysis of aConstruct. Journal of ManagementInformation Systems. 17(1), 167 – 208
• Englehardt, C.S. and Simmons, P.R. (2002).Organizational Flexibility for a ChangingWorld. Leadership and OrganizationalDevelopment Journal. 23(3), 113-121.
• Gebauer, J. and Schober, F. (2006).Information System Flexibility and CostEfficiency of Business Processes. Journal ofthe Association for Information Systems. 7(3),122 – 147.
Marketing Flexibility
Service Flexibility
Effective
CRM
Sustainable competitive edge
Enhanced customer loyalty
Figure 1: Conceptual Framework
Sustainable
Competitive Edge
Enhanced Customer
Loyalty

Optimization: Journal of Research in Management40
• Gilbert, D. (1999). Retail MarketingManagement, Prentice Hall, Harlow
• Goyal, M. and Netessine S., (2009). VolumeFlexibility or Product Flexibility or Both. TheWarton School, University of Pennsylvania.
• Grewal, R. and Tanshuhaj, P. (2001). BuildingOrganizational Capabilities for ManagingEconomic Crisis: The Role of MarketOrientation and Strategic Flexibility. Journalof Marketing. 65, 67-80.
• Gurau, C. (2009). Marketing Flexibility in thecontext of Service-Dominant Logic. TheMarketing Review. 9(3), 185-197.
• Hamel, G. (2000). Reinvent your company.Fortune .141(22), 100-18.
• Holweg, M. and Pil, K.F. (2001). Successfulbuild-to-order strategies start with thecustomer. Sloan Management Review. 43(1),73-82.
• Jain, P., Tomar, A., and Vishwakarma, N.(2016). Analysis of customer satisfaction inTelecom Sector on implementation of CRMwith respect to users. International Journalof Engineering. Management & MedicalResearch, 2(3), 1-8.
• Kandil, M., (1999). The asymmetric stabilizingeffects of price flexibility: historical evidenceandimplications. Applied Economics. 31, 825-839.
• Mensah, E. (1989). Evaluating InformationSystems Projects: A Perspective on Cost BenefitAnalysis. Journal of Information Systems.14(3), 205-217.
• Payne, A. and Frow, P. (2005). A strategicFramework for Customer RelationshipManagement. Journal of Marketing. 69(4),167-176.
• Prahalad, C. K. and Ramaswamy, V. (2004).The Future of Competition: Co-CreatingUnique Value with Customers. Boston,Massachusetts: Harvard Business School Press.
• Schneider, B. and Bowden, D. E. (1999).Understanding customer delight and outrage.MIT Sloan Management Review. 41(1), 35-45.
• Shalender, K. (2018). Entrepreneurialorientation for Sustainable Mobility throughElectric vehicles: Insights from InternationalCase Studies. Journal of EnterprisingCommunities: People and Places in the GlobalEconomy. 12(1), 67-82.
• Shalender, K. and Singh, N. (2015). MarketingFlexibility: Significance and Implications forAutomobile Industry. Global Journal ofFlexible Systems Management. 16(3), 251–262.
• Shalender, K., Singh, N., and Sushil (2017).AUTOFLEX: Marketing FlexibilityMeasurement Scale. Journal of StrategicMarketing.25(1), 65-74.
• Shalender, K. and Yadav, R.K. (2018).Promoting e-mobility in India: Challenges,framework, and future roadmap. Environment,Development, and Sustainability, 20(6), 2587-2607
• Sharma, M.K., Sushil and Jain, P. K. (2010).Revisiting Flexibility in Organizations:Exploring its Impact on Performance. GlobalJournal of Flexible Systems Management. 11(3), 51-68.
• Singh, N. and Shalender, K. (2014). Successof Tata Nano through Marketing Flexibility:A SAP–LAP Matrices and Linkages Approach.Global Journal of Flexible SystemsManagement.15(2), 145–160.
• Vargo, S. L. and Lusch, R. F. (2004). Evolvingto a New Dominant Logic for Marketing.Journal of Marketing. 68(1), 1-17.

41Volume 11, No. 1
Study of Green Logistics Practices: A Case of 3PL in theAutomobile Industry
Raj Kumar Malik* & Gyanesh Kumar Sinha**
* Research Scholar, G.D. Goenka University, Gurgaon, Haryana, [email protected]
** Associate Professor, G.D. Goenka University, Gurgaon, Haryana, [email protected]
ABSTRACT
Logistics plays a major role in pollutingenvironment but it’s an important part of supplychain management without which no business canrun and our daily needs items cannot be fulfilled.With the increase in demand pollution level isalso increasing which is threat to our cominggeneration. Transportation is main key indicatorof logistics which creates pollution. This also emitsthe greenhouse gases which creates globalwarming. Certain rules have been made byGovernment of India to check on pollution.Similarly big industries are also taking greeninitiatives to minimize pollution level. variousstudy claims that the small & medium companieshas less focus due to lack of resources and havea fear to increase the cost. The present paperuses existing related research papers and journalswith the objective to gain theoretical know-howon the significance of logistics & green logisticsinitiatives taken by automobile manufacturingcompanies in India. A case approach is used forempirical evidence in one of the leadingautomobile industry at Uttrakhand to understandtheir best practice to mitigate pollution. One ofthe initiative taken by them for reducingtransportation need by introducing 3PL (Thirdparty logistics provider) which has not only
reduced their cost, they got other intangiblebenefits also. This initiative has resultedsubstantial reduction in pollution level.
Keywords –Green Logistics, Supply ChainManagement (SCM), Environment, Pollution, 3PL(Third Party Logistics).
INTRODUCTION
The world economy is growing very fast with thischange in demand of products. Simultaneouslyneed of logistics is also increasing. Logistics hasmajorly three elements transportation, warehousing& packaging. Transportation is one of the majorsource in creating pollution in air. Vehicles areexhausting greenhouse gases which is resultingthinning of ozone layer which ultimately causingglobal warming. So with the increase in demandpollution is also increasing as transport load isincreasing. Evangelista, P., Santoro, L., & Thomas,A. (2018) says in logistics segment is moreprominent due to increase in demand & is thesecond largest creator of greenhouse gases afterpower generation, demand is growing. In recentyears, Green Supply Chain Management (GSCM)and sustainability issues have been attracting risingattention among researchers and practitioners,basically due to increased environmental concerns

Optimization: Journal of Research in Management42
and to an ever-competitive environment. Asremarked by Min and Kim (2012), this growinginterest sparked a series of new lines of researchdealing with various supply chain activities thathave important environmental implications,ranging from manufacturing to logistics andtransportation.
There is a need that organizations should focuson environment sustainability alongwith businessgrowth. It is important to take suppliers, dealers& customers all together for balancing ofenvironment. To deal with pollution due to logisticsa concept has emerged called green logistics. Undergreen logistics all factors i.e. transportation,warehousing, Packaging to be account for toimprove environment.
Green Transportation- Under this initiativesoptions are explored to minimize the need oftransportation, use of alternative transport whichcreates less pollution, designing of vehicles whichexhausts less pollution, proper maintenance ofvehicles, reverse logistics and use of milk runconcept.
Green Warehousing- Under this initiative,warehouse are designed in such a way they getnatural light and usage of low consumptionelectrical equipment. The material handlingequipment’s doesn’t exhaust pollution, Usage ofvertical height for space optimization. Inventoriesare kept to optimize space and transportation.
Green Packaging- Under this initiative usageof ecofriendly, reusable and recyclable materialspackaging is used to minimize the wastages whosedisposal creates pollution. This initiatives also saveslot of tree cutting also because use of wood,corrugated box and paper are made from wood.
Government’s regulations- Government ofIndia has made stringent rules from design tillimplantation i.e. upgradation from the BS StandardBS-III to BS-IV Norms on 1st April-17. Similarlythe next upgradation of BS standard BS-VI beingimplemented from 2020, as per BSES, Bharat StageEmission Standard. Government has also come upwith the regulation for regular checking & issuingpollution certificate for all vehicles running on road.The life cycle for all diesel vehicles have been fixedunder which these vehicles will be permitted torun for 10 years in Delhi-NCR. Rule is also beingformed to scrap all vehicles after 15 years (TheTimes of India, February 2018). The NationalHighway Authority of India has developed tonational highways in the recent past in the outskirt
of Delhi (Eastern Peripheral and WesternPeripheral) i.e. KMP ( Kundli ,Manesar, Palwal),eastern peripheral road which goes from UttarPradesh to Haryana without entering in to Delhi.It is expected to decongest Delhi by offloadingmovement of 50000 trucks (approax) per day outof Delhi Delhi and thus reducing the pollution levelby reducing 27 percent (Chaudhry, 2018).
However, despite the initiative and efforts by theGovernment, checks are not found to be robustand compliances in stricter forms. The smallindustries have not shown to prompt inimplementing it because of fear of cost impact &lack of resources and finding the shortcut routeto bypass.
PROBLEM STATEMENT
Pollution is the biggest threat to environment.Logistics is one of the major source of pollutionin supply chain especially through transportation.The needs of transportation is increasing with theincrease in demand and it’s the automobile industrywhich is responsible for production of vehicles fortransportation. Therefore it must be studied tosee how transportation is contributing in vehicularemission and what kind of practices (especiallygreen practices) being taken by industries help inminimizing pollution level. While studying theimpact of logistics on environment and greeninitiatives it is important to study simultaneouslythe challenges faced by small & mediumorganizations in implementation green initiatives,best practices adopted by big organizations & thecost impact of green logistics on their economy.
OBJECTIVE OF THE STUDY
Main objectives are described as under-
• To study the impact of pollution of logisticson environment.
• To study the green initiatives to minimizepollution level.
• To study the challenges in implementing greeninitiatives in automobile industries.
• To study the cost impact of green initiatives inlogistics in automobile industries.
RESEARCH METHODOLOGY
The present study is descriptive in naturesupported by empirical evidence using case studyapproach. For the purpose of present study, variousresearch articles on logistics & green initiatives

43Volume 11, No. 1
on logistics have been reviewed from researchjournals couple with the case study approach inan automobile organization. A leading automobilecompany based in Uttrakhand was selected forconducting case study to explore current practiceson green logistics, their methodology, outcome ofthe initiative & motivation as well as challengesfaced by them for implementing the initiative. Thehas been done by interviewing management teamof logistics including supply chain, warehousing,security & safety who are directly or indirectlyresponsible for handling logistics in the plant.
LITERATURE REVIEW
Logistics plays very important role in today’s worldwith the increase in consumption and demand.But simultaneously it is delivering pollution whichis impacting on environment. To overcome thisproblem green initiatives are required. The Councilof Supply Chain Management Professionals (2007)describes logistics management “the part of SupplyChain Management that plans, implements, andcontrols the efficient, effective forward and reverseflow and storage of goods, services and relatedinformation between the point of origin and thepoint of consumption in order to meet customers’requirements.” Reviews has been made fromrelated journals to get the knowledge of study madeso far in this regard.
Logistics & its Importance- Logistics is anintegral part of Supply chain and it is one of themain element. Logistics takes care of materialhandling from end to end i.e. from suppliers endtill dealers end. This also includes holding ofmaterial & finish goods in warehouse & designingof packaging material to take care of no transitdamage with cost competitiveness. MartinChristopher (2016) says “ logistics is the processof strategically managing the procurement,movement and storage of materials, parts andfinished inventory (and the related informationflows) through the organization and its marketingchannels in such a way that current and futureprofitability are maximized through the cost-effective fulfilment of orders.” As per EU, roadfreight carriage is most popular & utilizing approx.49% share in Europe because of flexibility natureand have lesser cost impact. As per Stank et al.,(2005) logistics is an integral and most importantpart of supply chain management.
Srivastava (2006) explored the Indian scenario oflogistics and its integration with supply chain andsupply chain partners. As per him managers know
very well how to integrate information flow fromSCM of main manufacturer to supplier, materialflow from supplier to manufacturer and the facilityrequired to perform well. He also said there isextensive pressure globally on supply chain andlogistics team to improve to manage environmentbut it is not implemented as expected due tovarious internal and external reasons.
Impact on Environment- Logistics has a largerimpact on environment because transport vehiclesemits greenhouse gases which contains CO2, CO,NOx, Hydrocarbon & smoke which are harmfuland resulting air pollution as well as thinning theozone layer causing global warming (Abukhader& Jönson,, 2004). Vehicles running on road formaterial handling emits CO2 which createspollution, having road accidents and noise pollutionas well (Sheu et al, 2005). Besides the logisticsperformance relates with organization image interms of its delivery commitments with best priceand safe transportation so that no any damage ofproduct during transit. As per the study done byGreen Jr, K. W. et.al (2008), the logisticsperformance is positively impacted by supply chainmanagement strategy and that both logisticsperformance and supply chain managementstrategy positively impact marketing performance,which in turn positively impacts financialperformance. Neither supply chain managementstrategy nor logistics performance was found todirectly impact financial performance.”
Green Logistics Practices - Logistics hasbasically three elements i.e. transportation,warehousing & packaging. Transportation comeson priority as it emits Greenhouse gases whichare creating air pollution and global warming. 3PLis one of the initiatives to optimize transportationneeds. Hertz and Alfredsson (2003) define a 3PLas “an external provider who manages, controls,and delivers logistics activities on behalf of ashipper”. They take care of all transportationmanagement from pick up material from suppliertill reverse logistics after delivery of materials toplant. Similarly they take care of delivery of finishproducts till dealers end. As observed by Pagellet al. (2004), the Supply Chain has a pressure toensure cost effectiveness as well as environmentalbalancing. To reduce the work load pressure onroad transport it is important to use mix transportarrangement i.e use of railways and waterwaysalongwith roadways which will reduce the roadovercrowding as well as it will be cost effectivealso. This will reduce environment imbalancing& will improve safety (Sheu et al., 2005). As per

Optimization: Journal of Research in Management44
Karagülle (2012), the strengthening of intermodaltransportation through green transport strategiesmay be an effective approach to eco friendly andsafer freight transport. Janic (2007) describes inhis study that logistics team has to maintain closeloop contact with all supply chain team whichincludes 3PL service provider and customer &supplier for better performance. Min and Kim,(2012) mentioned in their study that green logisticswas important to take care of environmental issuesrelated to hazardous material movement & storage,packaging design to suit environment, inventorymanagement and warehousing & to havesustainable transportation system so that pollutiongeneration is reduced to bare minimum. Cagnoet al.(2008) has studied for various green practicesbeing followed presently and what givensuggestions for further improvements whichreduces pollution 7 takes care environment. Leeand Dong, (2009) has designed logistics networkingsystem to improve green environment.
Reverse Logistics – Reversed logistics isimportant to optimize use of transportation byutilizing similar truck bringing the material fortransportation of empties or other materials. Thissaves the cost as well as reduction in pollutionlevel. Fleischmann, M. et.al (2001) focused onreverse logistics in their study. They compared themodified logistics system w.r.t. traditional methodwhich is generally being used. They suggestedholistic methods for reshaping logistics system.Reverse logistics is also used for recycling of waste& non usable products.
Motivation & Challenges – Whenever theprocess is challenged and new systems are madesome pressure is build up in system.Simultaneously some motivation factors also comesin picture which moves the process ahead. It isalways mixture of motivation & pressures whichwork concurrently. Similarly in implementing thegreen logistics various internal & external pressuresare buildup. Xu et al. (2013), has classified thisinto five main categories i.e. having complianceto regulations set by government, to keep theexistence in competitive world, the financialbackbone which is most important to run anorganization, have identified different pressuresand classified them into five government policiesand regulations, marketability of the product andcompetitiveness, external factors in the supplychain, financial factors, production and operationalfactors) based on their similarities. Sarkis (2003)& Lieb and Lieb (2010) also defined externalpressures as mentioned above as well as the gap
in coordination and harmony between all supplychain team members which includes supply chainteam, logistics team, suppliers and customers.Similarly there is internal pressure withinorganizations. Sarkis (2003) , Lieb and Lieb (2010),and Zailani et al. (2010) describes internalpressures as company’s commitment towardsenvironment, top management focus towardsachievements, giving parallel focus to environmentalongwith cost reduction and efficiency up. Besidesthere is lack of skill, no training facility to improveknowledge, investment restrictions i.e. releasingless fund against requirement and unwillingnessto change the process. Govindan et al. (2013) haveidentified five main categories which are effectingas barriers which are “ outsourcing (e.g., lack ofgovernment support to adopt environmentalfriendly policies, complexity of measuring/monitoring suppliers’ environmental practices);technology (e.g., lack of technical expertise, lackof human resource, lack of effective environmentalmeasures); knowledge (e.g., lack of environmentalknowledge, perception of ‘out-of-responsibility’zone, disbelief about environmental benefits);financial (e.g., financial constraints, non-availabilityof bank loans to encourage green products/processes, high investments and less return-on-investments); and involvement and support (e.g.,lack of customer awareness and pressure aboutGSCM, lack of Corporate social responsibility, lackof top management involvement in adopting greenpractices”. These gives negative pressure inimplementing green practices. But it givesmotivation to team by involvement of topmanagement, regular reviews & appreciations, goodworking environment as resultant of greenpractices, awards & recognitions from internal &external world.
THIRD PARTY LOGISTICS (3PL) CASESTUDY
The present case study is done for leading ISO9001 & ISO 14000 certified company based inUttarakhand. This is an automobile (vehiclemanufacturing) company with 2000 (approx.)employees which are getting its parts andcomponents supply from local ancillary units andwell as other parts of India. It has got one of thelargest market share in pan India its productssegment. A study was conducted to observe theimpact of green initiatives in transportation systemby implementing the third party logistics (3PL).Transportation chosen because it is one of themajor source which emits pollution & impactingglobal warming.

45Volume 11, No. 1
The company under present study has takeninitiatives to made improvements in all area oflogistics i.e. transportation, warehousing &packaging to improve environment. The case studyis made in one of the initiatives of greentransportation i.e. consolidation of transportationby introducing 3PL (3rd party logistics) serviceprovider. This has resulted the reduction in overalltrucks requirement which in turn had saving intransportation cost as well as reduction in pollutionlevel. Following are the major observations.
Earlier Practice – Earlier suppliers from variouslocations were sending materials to thatorganization. Suppliers were having their owntrucks and supplying the materials based on theireconomic truck load quantity. This concept waspush type i.e. material was pushed by supplierbased on their manufacturing outcome. This hasresulted the over stocking at their end as well aslot of traffic congestion happened because approx.300 trucks were entering/day to that organization.
Innovative Practice – The company introduceda 3PL service provider and started a milk runconcept. This service provider is controlled bythem. Under this practice, the service providersends his trucks at supplier’s location and makecollection of material based on their requirement.3PL service provider has grouped 4-6 suppliersin one cluster based on nearby locations & volumeof material to be procured. So he deployed thetrucks based on number of clusters made forcollecting the material.
In this procedure their SCM team generates thetime wise pickup requirement based on sequenceof production and communicate this requirementto supplier & to 3PL service provider. Therepresentative of 3PL give pick up schedule to histruck drivers who go to supplier end for pickupof material. In this contract 3PL service provideris responsible for timely bringing the material withquantity verification. The penalty clause areimposed in case of failures i.e. in case supplierfails timely supply at their end which causesproduction loss. Similarly in case there is anydiscrepancy observed in invoice quantity v/sphysical stock at their end, 3PL will be responsibleand will be penalized. It means 3PL is responsibleto check material as per invoice quantity beforeleaving there factory. 3PL is also responsible incase some damages happen due to mishandlingduring transit. But in case supplier is not readywith the material at pickup time then 3PL is notheld responsible. In this situation suppliers gets
penalty to drop the material at their end at hisown cost. Supplier is also being penalized in casethere is production loss due to material shortagebecause of his preparation delay. Withimplementation of there was reduction of approx.30% trips.
Benefit of this Practice- This practice has win-win situation. The new practice has reduced therequirement of trucks, therefore, the cost has gonedown as well and at the same time pollution levelhas also reduced. The major impacts have beensummarized in the following paragraphs.
i) Inventory Reduction: The concept ofmaterial procurement shifted from push topull system i.e. earlier supplier used to sendmaterial its own as per their manufacturingcapability but now picking of material fromsupplier’s end by 3 PL as per consumptionpattern resulted reduction in inventory. Soearlier OEM used to keep high inventorywhich reduced to Hourly on JIT philosophy.There is a reduction of inventory approx. 50%for the parts procured by 3PL serviceprovider.
ii) Space Savings: By the reduction ininventory and staking the parts vertically needof space is reduced drastically. Since spaceis one of the costlier affair now a days, lotof saving has happened.
iii) Transportation Reduction: There is areduction in IBL (inbound logistics) truckssubstantially because of consolidation ofoverall requirement. Earlier supplier’s usedtheir trucks for dispatching the materialswhich is done by OEM now through 3PL bypicking up from their location. In some casessupplier brings full truck load with unwantedmaterial resulting overstocking and sometimepartially filled un-utilization of trucks capacityimpacting inwarding of more number oftrucks. After implementation of 3PL there wasreduction in 30 % of trucks requirement whichwas approx. 100 trips /day. Average runningper trip of a truck is approx. 50 kms so perday reduction in 5000 kms run of trucks. Thishas given direct savings in transportation cost.
iv) Turnaround Time (TAT): Theimplementation of 3PL has impacted thereduction in inwarding of trucks, whichresulted de-congestion inside the plant andvehicle got free flow movement .Due to thisthere was faster unloading of vehicles whichultimately reduced in turnaround time of

Optimization: Journal of Research in Management46
trucks. So earlier average trip per truck was2 per day which was improved to 3 trips/day with the same truck.
v) Safe Working: Due reduction in congestion,it has improved the safety of employees aswell. There was reduction in rate of accidentswhich earlier used to happen due tocongestion inside the plant.
vii) Smooth Flow of Production: The newpractices has lead to smooth production flownow, earlier there were some productionstoppage due to shortage of material onaccount of transit delay by supplier’s vehicle,which has been reduced. Earlier supplierswere using unprofessional transport providerswhich were having unstructured approach.But now 3PL service provider who areprofessional in nature maintaining theirvehicle very well. This has reduced down timeof vehicle not available. Besides the workloadof supply chain engineers has also reducedwhich was being spent in chasing of vehicles.The control of supplier is shifted fromsuppliers to OEM because 3PL is implementedby OEM, which gives better results.
viii) Reduction in Pollution: By the reducingthe needs for trucking operations (reducingthe running of trucks (9 ton weight) by 5000KM/day in 303 operating days per year). ,there is reduction in CO2 by 2180 ton/annumapprox. which ultimately reduces pollution.The calculation is made with the help of aformula given by Mr. Jason Mathers (Mathers,2015) GHG emission (ton) = Distance run(KM)* Weight (ton)* Emission factor (161.8gms /ton-km run)/10,000,00.
CONCLUSION
The study has been made to understand logistics,its need in current scenario & impact onenvironment. The study also done of the greenlogistics preferences by automobile industries andinitiation taken by government to minimize thepollution level which impacts on environment. Theliterature review is done through earlier researchesmade & related journals to identify the areas ofgreen logistics. A case study is also done in oneof the leading automobile industry to identify theinnovative practice followed, its tangible &intangible benefits, their motivation level anddifficulty observed in implementation of greenlogistics practices. Similar practices can be madein different companies operating in the automobileindustry. Further study also can be made to
understand the linkage of green logistics withsupply chain as well as overall performance of theorganization.
REFERENCES
• Abukhader, S. M., & Jönson, G. (2004).Logistics and the environment: Is it anestablished subject?. International Journal ofLogistics Research and Applications, 7(2), 137-149.
• Cagno, E., Magalini F. and Trucco, P. (2008).Modelling and planning of product recoveryNetwork: the case study of end-of-liferefrigerators in Italy, International Journalof Environment Technology andManufacturing, 8(4), pp.385–404.
• Chaudhry, C. (2019, November 19). Ringaround Delhi: Final piece to fall in place asWPE opens today. The Times of India, p. 4
• Christopher, M. (2016). Logistics & supplychain management. Pearson UK.
• Competitiveness: an overview of Turkishlogistics industry, Procedia-Social andBehavioral Sciences, 4(1), pp.456-460
• Council of Supply Chain ManagementProfessionals (2007). Supply chainmanagement and logistics managementdefinitions, available at: www.cscmp.org/Website/ AboutCSCMP/Definitions/Definitions.
• Evangelista, P., Santoro, L., & Thomas, A.(2018). Environmental Sustainability in Third-Part Logistics Service Providers: A SystematicLiterature Review from 2000–2016.Sustainability, 10(5), 1627.
• Fleischmann, M., Beullens, P., BLOEMHOFRUWAARD, J. M., & Van Wassenhove, L. N.(2001). The impact of product recovery onlogistics network design. Production andoperations management, 10(2), 156-173.
• Gonzalez-Benito, J. and Gonzalez-Benito, O.(2006). The role of stakeholder pressure andmanagerial values in the implementation ofenvironmental logistics practices, InternationalJournal of Production Research, 44(7),pp.1353–1373.
• Govindan, K., Kaliyan, M., Kannan, D. andHaq, A.N. (2013). Barriers analysis for greensupplyChain management implementation inIndian industries using analytic hierarchyprocess, International Journal of Production

47Volume 11, No. 1
Economics [online] http://dx.doi.org/10.1016/j.ijpe.2013.08.018 (accessed 3 October 2013).
• Green Jr, K. W., Whitten, D., & Inman, R. A.(2008). The impact of logistics performanceon organizational performance in a supplychain context. Supply Chain Management: AnInternational Journal, 13(4), 317-327.
• Hertz, S., & Alfredsson, M. (2003). Strategicdevelopment of third party logistics providers.Industrial marketing management, 32(2), 139-149.
• Hervani, A. and Helms, M. (2005).Performance measurement for green supplychain Management’, Benchmarking: AnInternational Journal, 12(4), pp.330–353.
• Jumadi, H. and Zailani, S. (2010). Integratinggreen innovations in logistics services towardsLogistics service sustainability: a conceptualpaper’, Environmental Research Journal, 4(4),pp.261–271.
• Janic, M. (2007). Modeling the full costs ofan intermodal and road freight transportnetwork. Transportation Research Part D:Transport and Environment, 12(1), pp. 33-44
• Jumadi, H. and Zailani, S. (2010). Integratinggreen innovations in logistics services towardsLogistics service sustainability: a conceptualpaper, Environmental Research Journal, 4(4),pp.261–271.
• Lee, D.H. and Dong, M. (2009). Dynamicnetwork design for reverse logistics operationsunder Uncertainty, Transportation ResearchPart E: Logistics and Transportation Review,45(1), pp.61–71.
• Lieb, K.J. and Lieb, R.C. (2010). Environmentalsustainability in the third-party logistics (3PL)Industry’, International Journal of PhysicalDistribution & Logistics Management, 4(7),pp.524–533.
• Langella, I.M. and Zanoni, S. (2011). Eco-efficiency in logistics: a case study ondistribution Network design, InternationalJournal of Sustainable Engineering, 4(2),pp.115–126.
• Karagülle, A.O. (2012). Green business forsustainable development and Min, H. and Kim,I. (2012). Green supply chain research: past,present, and future, Logistics Research, 4(1-2), pp.39–47.
• Mathers, J.(2015, March 24). Green Fright
Move: How to Calculate Emissions from aTruck Move. EDF Business. Retrieved fromhttp://business.edf.org/blog/2015/03/24/gr een -f r e i ght -m a th -ho w- to- c a l c u la t e-emissions-for-a-truck-move.
• Pagell, M., Yang, C. L., Krumwiede, D. W., &Sheu, C. (2004). Does the competitiveenvironment influence the efficacy ofinvestments in environmental management?.Journal of Supply Chain Management, 40(2),30-39.
• Rabinovich, E. and Knemeyer, A.M. (2006).Logistics service providers in Internet supplychains, California Management Review, 48(4),pp. 84-108.
• Sheu, J.B., Chou, Y.H., Hu, C.C. (2005). Anintegrated logistics operational model forgreen-supply chain management,Transportation Research Part E: Logistics andTransportation Review,41(4), pp.287313
• Stank, T.P., Davis, B.R. and Fugate, B.S.(2005). A strategic framework for supply chainoriented logistics”, Journal of BusinessLogistics, 26(2), pp. 27-45.
• Srivastava, S.K. (2006). Logistics and supplychain practices in India, VISION – The Journalof Business Perspective, 10(3), pp. 69-79.
• Sarkis, J. (2003).A strategic decisionframework for green supply chainmanagement, Journal of Cleaner Production,11(4), pp.397–409.
• Vachon, S. and Klassen, R.D. (2006).Extending green practices across the supplychain. The Impact of upstream anddownstream integration, International Journalof Operations & Production Management,26(7), pp.795–821.
• Xu, L., Mathiyazhagan, K., Govindan, K., Haq,A. N., Ramachandran, N. V., & Ashokkumar,A. (2013). Multiple comparative studies ofgreen supply chain management: pressuresanalysis. Resources, Conservation andRecycling, 78, 26-35.
• Zhu, Q. and Sarkis, J. (2007). The moderatingeffects of institutional pressures on emergentgreensupply chain practices and performance,International Journal of Production Research,45( 18/19), pp.4333–4355.

Optimization: Journal of Research in Management48
Human Resource Development Practices and EmployeePerformance: Study of Indian Automobile Industry
Ashwini Mehta* & Yogesh Mehta**
* Assistant Professor, MGGCPS, Indore, M.P., [email protected]
** Associate Professor, FCM, SGT University, Gurgaon, Haryana, [email protected]
ABSTRACT
Human resource plays a vital role in highly skilledand knowledge intensive industries like automobileindustry. The growth and development of anorganization greatly depends upon its humanresource than the other resources and to achievesuccess it is necessary that right person must beplaced at right job and his potential must beenhanced through multiple and continuoustraining since development and delivery of qualityproducts and services depend upon quality ofhuman resource. Talented and learned humanresource is the need of highly competitive, dynamicand technical industries, needed continuous andmultiple-skill training. Thus, to attain such humanresource, industries should emphasize ondeveloping and nurturing a strategy based humanresource development practices. Results of thisstudy could provide human resource professionalswith useful and valuable information to formulatestrategies to decide what human resourcepractices should be effectively implemented in theirorganizations that maximizes employee’sperformance. This study investigated the impactof HRD Practices namely compensation,performance appraisal, training and development,job definition, career planning, employeeparticipation, selection on employee performanceof selected Indian automobile industries.
Keywords: HRD Practices, EmployeePerformance, Compensation, PerformanceAppraisal, Training and Development, EmployeeParticipation.
INTRODUCTION
Indian Automobile industry is the one of theindustrial sector that has shown tremendousgrowth after 90’s. The $93 billion automotiveindustry contributes 7.1% to India’s GDP andalmost 49% to the nation’s manufacturing GDP(FY 2015-16) and it is likely to grow up to 12%(FY 2016-17). The industry employs 29 millionpeople, directly and indirectly, and contributes to13% of excise revenue for the Government. Withthis pace of growth & contribution it’s necessaryfor them to meet the market requirements andthe global demands which entail for efficient andchallenging human capital.
Automobile industries in achieving their overallobjective faces certain issues like globalcompetition, product development, costcontainment, problems related to HR departmentand its challenges. The major problem faced isemployee retention which arises due lack of growthand development of the present employee on bothpersonal and professional front, low pay package,lack of benefits or poor work environment. Toovercome the problem a well developed HR

49Volume 11, No. 1
department is crucial with its well framed HRpolicies.
Human Resource Development (HRD) plays asignificant role in developing an efficient and skilledworkforce so that the organization as well asemployees can accomplish their objectives. Itprovides opportunities to the employees in termsof training, performance management, performanceappraisal, succession planning etc that leads tooverall organizational development.
Organizations can become dynamic and growthrough the efforts and competencies of theirhuman resources. HRD thus plays an importantrole in framing such practices that can help theemployees in motivating and keeping their moralehigh. Such practices further have a positive impacton the employee’s performance. Hence in thepresent age of cut throat competition the survivaland growth of an industry needs well developedand efficient human resource with varied skills.
LITERATURE REVIEW
There are number of HRD practices that couldbe tested in connection with employeeperformance. Karami, et al., (2017) proposed fivesub-constructs for HRM namely; HR strategy,employee retention, employee assessment,employee management, and HR developments. Allthe constructs were extracted based on theliterature review and found most suitable for theSaudi aluminum industry. A self-administeredquestionnaire was developed and a randomsampling method was used to select the samplesfor this study. All the questions were tested forreliability, validity and unidimensionality throughconfirmatory factor analysis. Finally, SEM analysiswas carried out to test the proposed model forHRM contributed to the development of newframework on the relationship between HRM andTM that increases organisational performance inthe UAE aluminum industry perspective. Sarker(2017) measured the effect of human resourcepractices on the employee performance in bankingsector of Bangladesh. A sample survey onconvenience sampling based data set about 328different levels of employees from the banks indifferent locations of Bangladesh were selected.A structured questionnaire was used to collectprimary data related to some HR issues namely-institutional Commitment and motivation,Employee relations, Compensation, Physical WorkEnvironment, Training & Development, Promotion,Job Satisfaction (independent variables) and the
employee performance (dependent variable) of thedesigned banks. The study revealed that all theHRD Practices except compensation and training& development have significant impact on theemployee performance in the banking industry ofBangladesh. The findings of study provided a clearguidance to the banking practitioners/policymakers to take further steps in achieving theorganizational goal through the employeeperformance. Hassan (2016) conducted a study todetermine the impact of HRD Practices onemployee’s performance in the Textile industry ofPakistan. The sample size of 68 employees wasconsidered to check the association between HRDPractices and employee’s performance. It was foundfrom the results that HRD Practices(Compensation, Career Planning, PerformanceAppraisal, Training, and Employee Involvement)impact on employee’s performance positively.
Al_Qudah et al., (2014) investigated the effect ofHRD Practices (recruitment and selection,compensation) on employee performance inMalaysian Skills Institute. The results indicatedthat recruitment and selection and compensationsignificantly correlated with the employeeperformance in Malaysian Skills Institute. Khatibiet al., (2012) investigated the impact of HRDPractices (Compensation, Evaluation, andPromotion) on perceived employee performancein a sample of 9 hospitals in Iran. The resultsshowed that compensation impact employeeperformance significantly. Patnaik, et al., (2012)conducted a study to examine the impact of threeimportant HRD Practices, namely, selective hiring,compensation and promotion practices onperceived performance of 294 teachers in Indianuniversities. It was found from the results thatHRD Practices positively impact on perceivedperformance of teachers and compensationpractices, in particular, are found to be of thehighest importance. Riaz et al., (2012) conducteda study to establish the relationship betweenEmployee’s Performance and HRD Practices in thedeveloping countries like Pakistan and found thepositive association between promotion andcompensation with employee performance butemployee performance are not significantlyassociated with performance evaluation. Pakistanihospitals need to change some compensation forthe improvement of hospital employee’sperformance. Gyensare and Asare (2012) conducteda study to examine the impact of three HRDPractices (compensation, performance evaluationand promotion) on perceived performance of

Optimization: Journal of Research in Management50
psychiatry nurses in the mental hospitals in Ghana.The sample size was 130, Pearson correlation andmultiple regression analyses were used. It wasfound from the results that compensation impactperceived employee performance positively. It wasalso revealed a positive relationship exist amongperformance evaluation, promotion, and employeeperceived performance. Zaitouni et al., (2011)investigated the impact of HRD Practices on theaffective, continuance, and normativeorganizational commitment among employees inthe banking sector in Kuwait. The full-time, andpart-time employees (managers and non-managers)of five large private banks in Kuwait were includedas sample. Both Exploratory Factor Analysis (EFA)and hierarchical regression analyses were used todraw the relationship between these variables. Theresults showed that fifty percent of the variablesconfirmed previous studies and the remaining fiftypercent did not support these studies due to factorssuch as culture and values. Tanveer et al., (2011)evaluated the impact and links between HRDPractices and employee’s performance of the textilesector of Pakistan. This was achieved by developingand testing the model based on HRD Practices(recruitment and selection, training andperformance appraisal) as independent variableson the employee’s performance as a dependentvariable. Research findings proved a significantrelationship exist between human resourcepractices and employees performance. Aleem etal., (2011) examined the relationship between HRDPractices (compensation, performance appraisal,employee relations, job security, promotion,employee participation, and pension fund) andperceived employee performance in the healthsector of Pakistan. Furthermore, satisfaction withHRD Practices was a moderating variable betweenemployee performance and HRD Practices. Datawere collected from 220 employees (top, middleand lower level) of autonomous medical institutionsof Pakistan (Punjab) through questionnaires. Theresults indicated that the compensation, employeerelations, job security, promotion, and pensionimpact performance of health sector employeespositively except employee participation andperformance appraisal. Baloch et al., (2010)measured the impact of HRD Practices(compensation, promotion and performanceevaluation) on perceived employee performanceof Bankers in NWFP, Pakistan. The results indicatethat compensation, promotion practice;performance evaluation practices and perceivedemployee performance exist. Multiple Regressionsshowed that 57% percent of the variance in
perceived employees’ performance can beaccounted for compensation, performanceevaluation and promotion. Marwat et al., (2010)explored the relationship between HRD Practicesincluding selection, training, career planning,compensation, performance appraisal, jobdefinition and employee participation andperceived employee performance in telecom sectorin Pakistan. It was found that all the testedvariables were positively correlated butcompensation and training were highly correlated.Shahzad et al., (2008) conducted a study amonguniversity teachers in Pakistan. The results of thestudy indicate that compensation, promotion werepositively related to employee perceivedperformance while performance evaluation was notsignificantly correlated with perceived employeeperformance.
Teseema & Soeters (2006) studied eight HRDPractices and their relationship with perceivedemployee performance. These eight practicesinclude recruitment and selection practices,placement practices, training practices,compensation practices, employee performanceevaluation practices, promotion practices, grievanceprocedure and pension or social security. Singh,A. K. (2005) attempted to identify the relationshipbetween HRD Practices (planning, recruitment, andselection) and the philosophy of management ofthe Indian business organizations. The sample forthe study consisted of 95 respondents from twoprivate sector organizations and 119 respondentsfrom two public sector organizations. The findingsof the study indicate that the variables of HRDPractices were highly but negatively related to thephilosophy of management in the private sectororganizations.
It is seen from the above literature reviews thatmost of the studies are showing correlation betweenHRD Practices and employee performance inacademics and other sectors in other countries too,limited to manufacturing sectors in Indian context.Therefore, the present study is an attempt to testthe impact of HRD Practices on employeeperformance in developing countries like Indiaparticularly for Automobile Companies.
OBJECTIVES
1. To study the employee performance level ofselected Indian Automobile Industry
2. To determine the relationship between HRDPractices and employee performance.

51Volume 11, No. 1
HYPOTHESIS
• H01: HRD Practices are negatively correlated
with the employee performance.
• H02: Selection is positively correlated to
employee performance.
• H03: Training and Development impacts
employee performance positively.
• H04: Performance appraisal is positively
correlated to employee performance.
• H05: Career planning is positively correlated
to employee performance.
• H06: Compensation is positively correlated to
employee performance.
• H07: Employee participation is positively
correlated to employee performance.
• H08: Job definition is positively correlated to
employee performance.
RESEARCH METHODOLOGY
In order to study the objectives and hypothesisframed for the study, descriptive research designwas used. The population of the study includesemployees of the selected automobile industriesof India. Keeping in view the objectives of the studyand certain limitations, non-probabilistic samplingtechnique (convenience sampling technique) wasadopted to select the sample. The sample size forthe study was 100 employees employed inautomobile industries located in Delhi-NCR inIndia. Organizational citizenship behavior(Argentero et al., 2008) and Qureshi M Tahir(2006) questionnaires for employee performanceand HRD Practices were used to collect the data.Initially, questionnaires distributed to 150employees of the automobile industries, out ofwhich 128 questionnaires returned by theemployees. 28 questionnaires were rejected dueto incompleteness. Finally, 100 questionnaires wereused for the study.
DATA ANALYSIS
The data were gathered, tabulated and analyzedusing the statistical analysis software. TheStatistical Package for Social Sciences (SPSS)version 21 was used to perform Mean, Standarddeviation, Correlation analysis, Regression analysis.
It is observed from the Table No- 1 (seeappendix) that Performance Appraisal (PA) hashighest mean followed by Job Definition andSelection. Rest of the variables means value ranging
between 3.78 and 3.94 for HRD Practices whereashighest mean of Civic Virtue of OrganizationalCitizenship Behavior is 4.07 followed byCconscientiousness and Altruism.
Similarly the Employees’ Participation has higheststandard deviation followed by Job Definition. Restof the variables standard deviation value is rangingbetween 0.394 and 0512 for HRD Practices whereasAltruism of Organizational Citizenship Behaviorhas highest standard deviation value followed byCconscientiousness and Civic Virtue.
Correlation Analysis
It is statistically measures the strength of linearassociation between the two sets of data. Itdetermines the degree of relationship betweenvariables. One very convenient and useful way ofinterpreting the value of coefficient of correlationbetween two variables is to use the square ofcoefficient of correlation, which is called coefficientof determination. The coefficient of determinationthus equals r2. If the value of r= 0.9, r2 will be0.81 and this would mean that 81 percent of thevariation in the dependent variable has beenexplained by the independent variable. Both thevariables were standardized and Karl-Pearson’scoefficient of correlation was carried out.
It is found from the analysis Table No-2 (seeappendix) that there is significant relationshiplies between HRD Practices and OCB. It appearsfrom the table that HRD Practices andOrganizational Citizenship Behavior have a positiveand significant correlation at 1% level ofsignificance. It is also observed from the analysisTable No-3 (see appendix) that there issignificant relationship lies between the variablesof HRD Practices and OCB. It appears from thetable that the variables of HRD Practices andOrganisational Citizenship Behaviour have apositive and significant correlation at 1% level ofsignificance.
Regression Analysis
It is a procedure of functional relationship usedfor prediction. A simple regression analysis wascarried out. Both the variables were standardizedand ‘F’ ratio for analysis of variance (ANOVA) wasalso estimated. The student t’ test was used totest the hypothesis of impact of independentvariables on dependent variables.
The resulted regression model Table No-4 (seeappendix) is the estimation of impact of HRD

Optimization: Journal of Research in Management52
Practices (HRDP) on Organisational CitizenshipBehaviour (OCB). It is found that the R square isnot so impressive (0.271). This indicates that thedetermination power of the regression equationis about 27.1 percent. This shows that HRDPractices explain 27.1 percent variation inOrganisational Citizenship Behaviour for theselected Automobile Industries in Delhi-NCR. Therest of 72.9 percent of Organisational CitizenshipBehaviour is unexplained in the model. Thestandard error of the estimates is 0.66923, whichis less than one. The F-ratio (ANOVA) is 36.351is statistically insignificant at 1% level ofsignificance. Therefore, the model is acceptable,estimated by enter method.
It is observed from the analysis that the value ofR square is very low which implies thatindependent variable i.e. HRD Practices in themodel explaining 27.1 % variation in the dependentvariable i.e. Organisational Citizenship Behaviour.It implies that other variables not included in theprocess are explaining 72.9% variation independent variable. R square is also known as thecoefficient of determination. Its value lies between0 and 100. The regression model obtained by entermethod is good, supported by the value of adjustedR Square (0.263) which is found to be positive.
It is found from the ANOVA Table No-5 (seeappendix) that value of F is 36.351 at p<0.01,significant. It implies that the P value of the overallF-test is significant; regression model can predictthe response variable better than the mean of theresponse. It also shows that the P value for theoverall F-test is at significance level, can concludethat the R-squared value is significantly differentfrom zero.
Regression Model: OCB = 1.987E-16 + (0.538)HRDP
It is found from the Table No-6 (see appendix)that the intercept is very small and statisticallysignificant. This implies that there is no scope ofautonomous Organisational Citizenship Behaviour.This also supports the value of R square in themodel.
Therefore, it may be concluded that HRD Practiceshas positive but moderate impact on OrganisationalCitizenship Behaviour.
Hypothesis Testing
It is found from the analysis that hypothesis H01
is accepted i.e. HRD Practices and OrganisationalCitizenship Behaviour are positively and
significantly correlated. Also, the hypotheses H02
to H07
are accepted i.e. all the variables of HRDPractices and Organisational Citizenship Behaviourhave positive and significant correlation.
CONCLUSION
Today as organizations operate in a dynamicenvironment it becomes necessary to enhance thecompetencies of their employees through adoptingthe HRD practice. The present study brings outpositive relation between HRD practices andemployee performance. The practices namelycompensation, performance appraisal, careerplanning etc leads to employees developmentenhancing their skills, increased motivation andmoral boosting resulting in increased overallperformance of the organization.
This study provides additional information for themanagement the influences of HRD practicestoward employee performance. The result of thestudy could also be a determinant towards makingmore reliable decisions on the planning processin HRD matters and implementation of associatingprogram to increase management awareness andother employees’ involvement.
LIMITATIONS AND FUTURE STUDY
There are also many limitations of this study whichincludes;
• First, the study is only limited to automotiveindustries of Delhi-NCR. So the results of thisstudy can only be used for further research inautomobile industry at Delhi-NCR level.
• Secondly the HRD Practices parametersdiscussed in this study are very short innumbers. These HRD Practices are taken fromthe research work already done by differentresearchers. Hence there are several otherparameters practices which could be focusedin future studies.
REFERENCES
• Al_Qudah, H. M. A., Osman, A., & Al_Qudah,H. M. (2014). The Effect of Human ResourcesManagement Practices On EmployeePerformance. International Journal OfScientific & Technology Research, 3(9), 129-134
• Argentero, P., Cortese, C. G., & Ferretti, M.S. (2008). An Evaluation of OrganizationalCitizenship Behavior: Psychometric

53Volume 11, No. 1
Characteristics of the Italian Version ofPodsakoff et al’s Scale. TPM, 15(2), 61-75
• Baloch, Q.B., Ali, N., Ahsan, A., & Mufty, A.(2010). Relationship between HRD Practicesand perceived employees performance ofbankers in NWFP, Pakistan: EmpiricalEvidence. European Journal Social Science,10(2), 210-214.
• Bowra, A. M., W, H., & Khan, A. H. (2011).An empirical investigation of human resourcepractices: A study of autonomous medicalinstitution employee in punjab. AfricanJournal of Business Management, 6390-6400.
• Gyensare, M. A., & Asare, J. A. (2012).Relationship between HRD Practices andperceived performance of psychiatry nursesin Ghana. African Journal of BusinessManagement, 6(6), 2137-2142.
• Hassan, S. (2016). Impact of HRM Practiceson Employee’s Performance. InternationalJournal of Academic Research in Accounting,Finance and Management Sciences, 6(1), 15–22
• Karami, A.K.D., Yazid, M. S. A., Khatibi, A.,& Azam, S. M. F. (2017). Developing andValidating the HRM Framework in the UAEAluminium Industry Context. EuropeanJournal of Human Resource ManagementStudies, 1(1), 36-49
• Khatibi, P., Asgharian, R., Saleki, Z., & Manafi,M. (2012). The Effect of HRD Practices onPerceived Employee Performance: A study ofIranian. Interdisciplinary Journal ofContemporary Research in Business, 4(4), 82-98.
• Marwat, Z. A., Arif, M., & Jan, K. (2010).Impact of selection, training, performanceappraisal and compensation on employeeperformance: A case of Pakistani telecomsector. Interdisciplinary Journal ofContemporary Research in Business, 1(7), 186-201.
• Riaz, Q., Khan, A., Wain, A. M., & Sajid, M.(2012). Impact of HRD Practices on PerceivedPerformance of Hospital Employees inPakistan. Journal of Economics andSustainable Development, 3(11), 10-15
• Sarker, A. S. (2017). Human ResourceManagement Practices and EmployeePerformance in Banking Sector of Bangladesh.Journal of Human Resource Management,10(1/2), 68-80
• Shahzad, K., Bashir. S., & Ramay, M.I. (2008).Impact of HRD Practices on the perceivedperformance of university teachers in Pakistan.International Revolution Business Research,4(2), 302-315.
• Singh, A. K. (2005). HRD Practices andPhilosophy of Management in IndianOrganizations. Vikalpa, 30(2), 71-79.
• Tahir, Q. M. & Mohammad, R. I. (2006).Impact of Human Resource ManagementPractices on Organizational Performance inPakistan, Unpublished doctoral dissertation,Muhammad Ali Jinnah University Islamabad.
• Tanveer, Y., Shaukat, M.Z., Alvi, S.A., & Munir,A. (2011). The Way Human ResourceManagement (HRM) Practices EffectEmployees Performance: A Case of TextileSector. Interdisciplinary Journal ofContemporary Research in Business, 1(4), 112-117.
• Tessema, MT & Soeters, JL. (2006). Challangesand practices of HRM in developing countries:Testing the HRM - performance link in theEritrean civil service. International Journalof Human Resource, 17(1), 86-105.
• Zaitouni, M., Sawalha, N. N., & Sharif, A. E.(2011). The Impact of Human ResourceManagement Practices on OrganizationalCommitment in the Banking Sector in Kuwait.International Journal of Business andManagement, 6(6), 108-123.

Optimization: Journal of Research in Management54
AppendixTable 1: Descriptive Statistics
Variables N Minimum Maximum Mean Std. Deviation Skewness
Statistic Statistic Statistic Statistic Statistic Statistic Std. Error
AL 100 3 5 3.66 0.593 0.360 0.241
CV 100 3 5 4.07 0.425 -0.272 0.241
CS 100 3 5 3.98 0.471 -0.058 0.241
T 100 3 5 4.05 0.415 -0.090 0.241
PA 100 3 5 4.10 0.394 -0.285 0.241
CP 100 2 5 3.85 0.492 -1.077 0.241
EP 100 2 5 3.78 0.694 -0.208 0.241
JD 100 3 5 4.07 0.603 -0.134 0.241
C 100 3 5 3.94 0.512 -0.371 0.241
S 100 3 5 4.05 0.491 0.156 0.241
Table 2: Correlation Analysis (OCB and HRDP)Variables OCB HRDP
OCB
Pearson Correlation 1 0.520**
Sig. (2-tailed) 0.000
N 100 100
HRDP
Pearson Correlation 0.520** 1
Sig. (2-tailed) 0.000
N 100 100
**. Correlation is significant at the 0.01 level (2-tailed).
Table 3: Correlation Analysis (OCB and HRDP Parameters)Variables T PA CP EP JD C S
OCB
Cor 0.383** 0.386** 0.548** 0.177 0.390** 0.482** 0.378**
Sig.(2-T) 0.000 0.000 0.000 0.079 0.000 0.000 0.000
N 100 100 100 100 100 100 100
T
Cor 1 0.668** 0.566** 0.411** 0.435** 0.701** 0.684**
Sig.(2-T) 0.000 0.000 0.000 0.000 0.000 0.000
N 100 100 100 100 100 100 100
PA
Cor 0.668** 1 0.688** 0.422** 0.298** 0.645** 0.685**
Sig.(2-T) 0.000 0.000 0.000 0.003 0.000 0.000
N 100 100 100 100 100 100 100
CP
Cor 0.566** 0.688** 1 0.260** 0.309** 0.516** 0.534**
Sig.(2-T) 0.000 0.000 0.009 0.002 0.000 0.000
N 100 100 100 100 100 100 100
EP
Cor 0.411** 0.422** 0.260** 1 0.297** 0.341** 0.434**
Sig.(2-T) 0.000 0.000 0.009 0.003 0.001 0.000
N 100 100 100 100 100 100 100
JD
Cor 0.435** 0.298** 0.309** 0.297** 1 0.472** 0.324**
Sig.(2-T) 0.000 0.003 0.002 0.003 0.000 0.001
N 100 100 100 100 100 100 100
C
Cor 0.701** 0.645** 0.516** 0.341** 0.472** 1 0.719**
Sig.(2-T) 0.000 0.000 0.000 0.001 0.000 0.000
N 100 100 100 100 100 100 100
S
Cor 0.684** 0.685** 0.534** 0.434** 0.324** 0.719** 1
Sig.(2-T) 0.000 0.000 0.000 0.000 0.001 0.000
N 100 100 100 100 100 100 100

55Volume 11, No. 1
Table 4: Model Summary
Model R R Square Adjusted R
Square Std. Error of the Estimate
Change Statistics
R Square Change
F Change df1 df2 Sig. F
Change
1 0.520a 0.271 0.263 0.66923 0.271 36.351 1 98 0.000
a. Predictors: (Constant), HRDP
Table 5: ANOVAb
Model Sum of Squares Df Mean Square F Sig.
1
Regression 16.280 1 16.280 36.351 0.000a
Residual 43.891 98 0.448
Total 60.172 99
a. Predictors: (Constant), HRDP
b. Dependent Variable: OCB
Table 6: Coefficientsa
Model
Unstandardized Coefficients
Standardized Coefficients t Sig.
95.0% Confidence Interval for B
B Std. Error Beta Lower Bound Upper Bound
1 (Constant) 1.987E-16 0.067 0.000 1.000 -0.133 0.133
HRDP 0.538 0.089 0.520 6.029 0.000 0.361 0.715
a. Dependent Variable: OCB

'Optimization': Journal of Research in Management is double blind review journal. It welcomes original papers from both academicians and practitioners on management, business, and organizational issues. Papers, based on theoretical or empirical research should exemplify the practical applicability and/or policy implications of work described.
The manuscript should be accompanied by the following: (1) An abstract of 150‐200 words along with five key
words; (2) A brief profile of the author/s describing author's name, current designation and affiliation, contact address, phone/fax numbers and e-mail address etc. The authors should send a declaration stating that the paper has neither been published nor will it be submitted elsewhere till the editorial decision from 'Optimization': Journal of Research in Management has been communicated. Recommended length of the manuscript should not exceed 8,000 words. All tables, charts, and graphs should be placed with the content and should be in black and not in color. Wherever necessary, the source should be indicated at the bottom. The number and complexity of exhibits should be as low as possible. Authors are expected to adhere to standards of correct academic writing. References indicated at the bottom should be complete in all respects, with authors' names arranged alphabetically.
We request authors to follow the APA Style developed by the American Psychological Association. Book: Single authorIn-Text Citation: (Pegrum, 2009)Reference List: Pegrum, M. (2009). From blogs to bombs: The future of electronic technologies in education. Crawley, W.A: UWA Publishing.
Book: Two authorsIn-Text Citation: (Page & Stritzke, 2015) But when outside parenthesis: Page and Stritzke (2015) suggested that ...Reference List: Page, A. C., & Stritzke, W. G. K. (2015). Clinical psychology for trainees: Foundations of science-informed practice (2nd ed.). Cambridge: Cambridge University Press.
Book: Chapter [ie. article] in edited bookIn-Text Citation: (Groundwater-Smith, 2007)Reference List: Groundwater-Smith, S. (2007). As rain is to fields, so good teachers are to students. In S. Knipe (Ed.), Middle years schooling: Reframing adolescence (pp. 151-170). Frenchs Forest, N.S.W: Pearson Education Australia.
Journal article in print: 8 or more authorsIn-Text Citation: (Sohrabi et al., 2011)Reference List: Sohrabi, H. R., Weinborn, M., Badcock, J., Bates, K. A., Clarnette, R., Trivedi, D. Martins, R. N. (2011). New lexicon and criteria for the diagnosis of Alzheimer's disease. Lancet Neurology, 10(4), 299-300.
Journal article onlineIn-Text Citation: (Gagné et al., 2015)Reference List: Gagné, M., Forest, J., Vansteenkiste, M., Crevier-Braud, L., van den Broeck, A., Aspeli, A. K., . . . Westbye, C. (2015). The Multidimensional Work Motivation Scale: Validation evidence in seven languages and nine countries. European Journal of Work and Organizational Psychology, 24(2), 178-196. http://dx.doi.org/10.1080/1359432x.2013.877892
All Correspondence should be addressed to:Chief EditorGL Bajaj Institute of Management and Research, Greater NoidaApproved by AICTE, Ministry of HRD, Govt. of India, for PGDM Program
Plot No. 2, Knowledge Park – III, Greater Noida, G.B. Nagar, (U.P.) – 0201306 India.
Website: http://glbimr.org/journal-glbimr.php
'Optimization': Journal of Research in Management reserves the right to make editorial amendments to the final draft of the manuscript to suit the journal's requirements. Communication regarding editorial changes and proofs for correction will be sent to the first author unless otherwise indicated.
E-mail: [email protected],
GUIDELINES FOR AUTHORS