Volume 104, No. 10 …usda.mannlib.cornell.edu/usda/waob/weather_weekly//2010s/2017/... · February...
22
Volume 104, No. 10 http://www.usda.gov/oce/weather March 7, 2017 (Continued on page 3) Contents Extreme Maximum & Minimum Temperature Maps.................. 2 Temperature Departure Map .................................................... 3 February 28 Drought Monitor & Snow Cover Map .................... 4 National Weather Data for Selected Cities ............................... 5 Selected U.S. February Records ........................................... 8 National Agricultural Summary ................................................. 9 International Weather and Crop Summary & February Temperature/Precipitation Table....................... 11 Bulletin Information & Satellite/Radar Imagery of Wildfires on the Plains .......... 22 WEEKLY WEATHER AND CROP BULLETIN ost of California got a reprieve from stormy weather, although early-week downpours soaked areas along and near the southern coast. Toward week’s end, widespread but generally light precipitation returned to northern California. The early-week storminess also brought briefly heavy rain and snow to parts of Arizona and the Four Corners region. Meanwhile, periods of precipitation continued across the Northwest, but mostly dry weather prevailed on the Plains. The central and southern Plains experienced a corresponding increase in M U.S. DEPARTMENT OF COMMERCE National Oceanic and Atmospheric Administration National Weather Service U.S. DEPARTMENT OF AGRICULTURE National Agricultural Statistics Service and World Agricultural Outlook Board HIGHLIGHTS February 26 – March 4, 2017 Highlights provided by USDA/WAOB
Transcript of Volume 104, No. 10 …usda.mannlib.cornell.edu/usda/waob/weather_weekly//2010s/2017/... · February...
Volume 104, No. 10 http://www.usda.gov/oce/weather March 7, 2017
(Continued on page 3)
Contents
Extreme Maximum & Minimum Temperature Maps .................. 2 Temperature Departure Map .................................................... 3 February 28 Drought Monitor & Snow Cover Map .................... 4 National Weather Data for Selected Cities ............................... 5 Selected U.S. February Records ........................................... 8 National Agricultural Summary ................................................. 9 International Weather and Crop Summary & February Temperature/Precipitation Table....................... 11 Bulletin Information & Satellite/Radar Imagery of Wildfires on the Plains .......... 22
WEEKLY WEATHER AND CROP BULLETIN
ost of California got a reprieve from stormy weather, although early-week downpours soaked
areas along and near the southern coast. Toward week’s end, widespread but generally light precipitation returned to northern California. The early-week storminess also brought briefly heavy rain and snow to parts of Arizona and the Four Corners region. Meanwhile, periods of precipitation continued across the Northwest, but mostly dry weather prevailed on the Plains. The central and southern Plains experienced a corresponding increase in
M
U.S. DEPARTMENT OF COMMERCE National Oceanic and Atmospheric Administration National Weather Service
U.S. DEPARTMENT OF AGRICULTURE National Agricultural Statistics Service and World Agricultural Outlook Board
HIGHLIGHTS February 26 – March 4, 2017
Highlights provided by USDA/WAOB
2 Weekly Weather and Crop Bulletin March 7, 2017
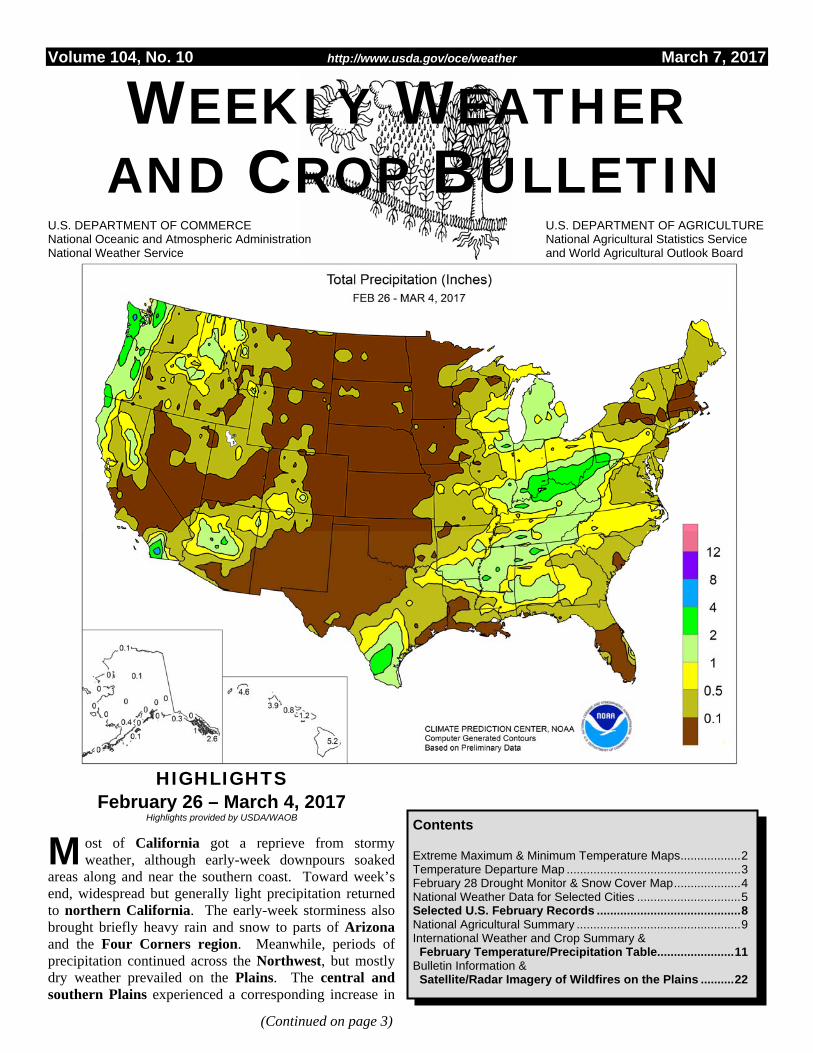
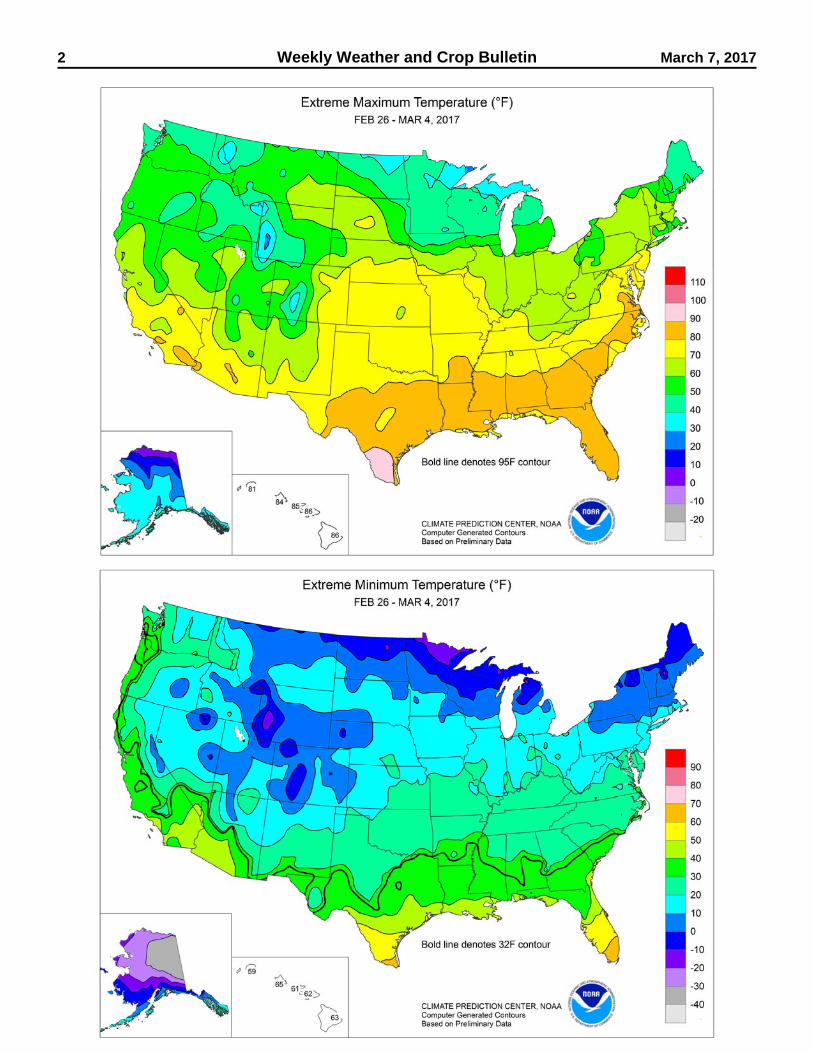
March 7, 2017 Weekly Weather and Crop Bulletin 3 (Continued from front cover) wildfire activity. Farther east, widespread showers and locally severe thunderstorms affected the South, East, and Midwest, with 1- to 2-inch totals occurring in several locations. On February 28, a rash of several dozen tornadoes across the Midwest and mid-South resulted in at least four fatalities—three in Illinois and one in Missouri. On March 1, weakening storms swept across the eastern U.S., producing only light rain and localized wind damage. Later, end-of-week rainfall brought beneficial moisture to Deep South Texas. Temperatures were lower than last week but still significantly above normal in much of the central and eastern U.S., averaging as much as 10°F above normal in the middle Mississippi Valley and environs. In contrast, lingering cool conditions in the West held temperatures at least 5°F below normal in several locations. Another wave of early-season warmth across the central and eastern U.S. peaked on February 28 and March 1, followed by more typical late-winter temperatures. In the eastern U.S., a late-week cold snap brought widespread sub-freezing temperatures as far south as northern parts of Mississippi, Alabama, and Georgia. While freezes are not unusual across the Southeast in early March, the record-setting warmth that preceded the cold snap left some fruit, ornamental, and nursery crops vulnerable to freeze injury. The most recent warm spell capped the warmest February on record in dozens of communities across the South, East, and Midwest. February monthly average temperature records from 1882 were broken in Lansing, MI, and Columbus, OH. Records from February 1925 were erased in locations such as Elkins, WV, and Philadelphia, PA. And, February 1930 standards were eclipsed in Dayton, OH, and Des Moines, IA. The month’s final warm spell began on February 27 with daily-record highs in Florida locations such as Fort Myers (89°F) and Naples (88°F). A day later, February 28 featured record-setting highs in Fort Myers (90°F) and Naples (88°F), along with locations such as McAllen, TX (96°F); Shreveport, LA (85°F); Alma, GA (85°F); and Quincy, IL (74°F). In the East, consecutive daily-record highs were set on February 28 – March 1 in Jacksonville, FL (87 and 88°F), and Wilmington, DE (66 and 75°F). Elsewhere on March 1, high temperatures reached or exceeded the 80-degree mark as far north as Richmond, VA (81°F), and Washington, DC (80°F). Subsequently, sharply colder air arrived in the East. Watertown, NY, collected a daily-record low of 14°F on March 4, just 3 days after posting a daily-record high of 65°F. Farther south, March 4 lows dipped to the freezing mark or below in locations such as Meridian, MS (32°F), and Macon, GA (30°F).
Early in the week, snow fell across portions of the interior Northwest. Record-setting snowfall totals for February 27 included 2.9 inches in Spokane, WA; 2.7 inches in Lewiston, ID; and 1.9 inches in Pendleton, OR. Meanwhile, rain briefly drenched coastal southern California. On February 27, more than 5 inches of rain fell on Palomar Mountain, while daily-record totals reached 4.03 inches in Escondido, 2.34 inches in San Diego, and 2.30 inches in Campo. A day later, heavy showers accompanied the Midwestern severe weather outbreak. Record-setting rainfall totals for February 28 included 1.78 inches in South Bend, IN; 1.57 inches in Cincinnati, OH; and 1.11 inches in Muskegon, MI. On March 1, Madison, WI, collected a daily-record snowfall of 3.7 inches. At week’s end, precipitation overspread southern Texas and returned to the Northwest, where Lewiston, ID, reported a daily-record sum (0.74 inch on March 4, including 4.1 inches of snow). On March 4 in Texas, record-setting rainfall totals reached 1.75 inches in McAllen, 1.71 inches in Brownsville, and 1.39 inches in Laredo. Generally mild conditions in northern Alaska contrasted with cold weather farther south. Meanwhile, heavy snow blanketed parts of southeastern Alaska, while the much of the mainland was mostly dry. From February 28 – March 4, snowfall totaled 12.5 inches on Annette Island and 6.2 inches in Juneau. Some of the heaviest snow fell on February 28 – March 1, when 24-hour totals included 24.4 inches in Annex Creek and 12.5 inches in Pelican. Farther south, a slow-moving storm system, known as a “Kona low,” soaked parts of Hawaii with heavy rain—and brought significant snow (locally more than 6 inches) to the highest elevations of the Big Island. February 28 – March 1 rainfall totaled 4.18 inches in Lihue, Kauai, and 3.69 inches in Honolulu, Oahu—with both locations reporting wind gusts in excess of 40 mph on the latter date.
4 Weekly Weather and Crop Bulletin March 7, 2017
L
L
L
S
L
L
L
SL
L
L
L
S
S
LL
S
L
S
SL
SL
S
S
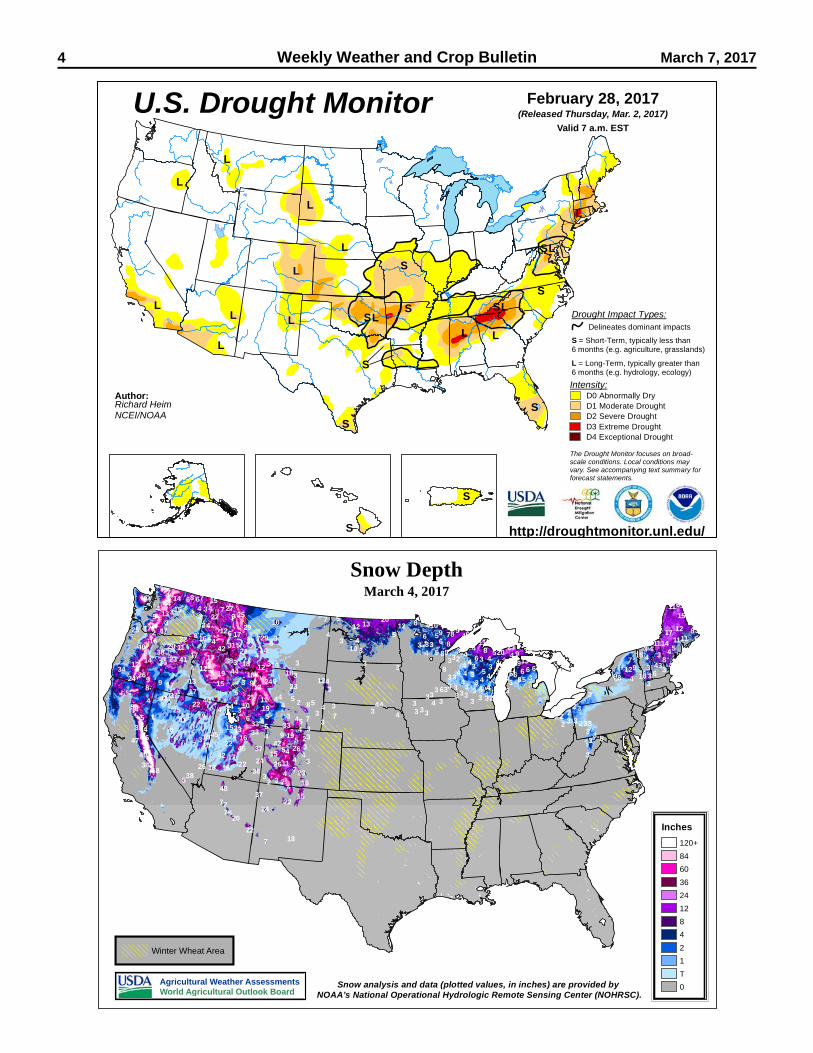
The Drought Monitor focuses on broad-scale conditions. Local conditions may vary. See accompanying text summary for forecast statements.
S http://droughtmonitor.unl.edu/
U.S. Drought Monitor February 28, 2017
Valid 7 a.m. EST
(Released Thursday, Mar. 2, 2017)
Intensity:D0 Abnormally DryD1 Moderate DroughtD2 Severe DroughtD3 Extreme DroughtD4 Exceptional Drought
Author: Richard Heim
Drought Impact Types:
S = Short-Term, typically less than 6 months (e.g. agriculture, grasslands)
L = Long-Term, typically greater than 6 months (e.g. hydrology, ecology)
Delineates dominant impacts
NCEI/NOAA
2
22
2
2
2
2
2
2
2
2
2
2
2
2
2
22
33
3
3 3
3
3
3
3 3
3
3
3
3
3
3
3
3
3
3
33
3
3
33 3
3
3
3
3
3
33
33
3
3 3
3
3
3
3
3
3
3
3
3
3
3
3
3
3
3
3
3 3
3
33
3
33
3
3
3
3
3
3
3
3
3
3
3
3
3
3
3
3
3
3
3
3
3
3
3
3
3
33
3
4
4
4
4
4
4
4
4
4
4
4
44
4
4
4
4
4
44
4
4
4
4
4
44
4
4
44
4
4
4
4
4
4
4
4
4
4
4
4
4
44
4
4
4
4
4
4
4
4
4
44
44
5
5
5
5
55
5
5
5
5
5
5
5
5
5
5
5
5
5
5
5
5
5
5
5
5
5
666 6
6
6
6
6
6
6
6
6
666
6
66
6 6
7
7
7
7
7
7
7
7
7
7
7
7
7
7
7
7
7
7
8
8
88
88
88
8
8
8
8
88
8
8
8
8
8
9
9
99
9
9
9
999 9
99
9
101010
10
10
10
10
10
10
10
10
10
11
11
11
1111
11
11
11 1112
12
12
12
12 12
12 12 12
12 12 1313
13
1313
13
1313
14
1414
14
14
14
14
15
15
15
15
15
15
15
15
15
16
16
161616
16
17
17 17
17
17
17
17
17
17
17
18
18
18
18
18
18
18
18
1819
1919
19
19
20
20
202021
22
22
22
22
22
22
22
23
23
23
23
23
2424
24
24
24
24
24
25
25
25
25
25
2626
26
26
27
27
27 29
29
30
31
32 3333
34
3436
37
37
38
3838
38
40
40
41
41
42
42
42
43
44
44
45
45
46
47
47
48
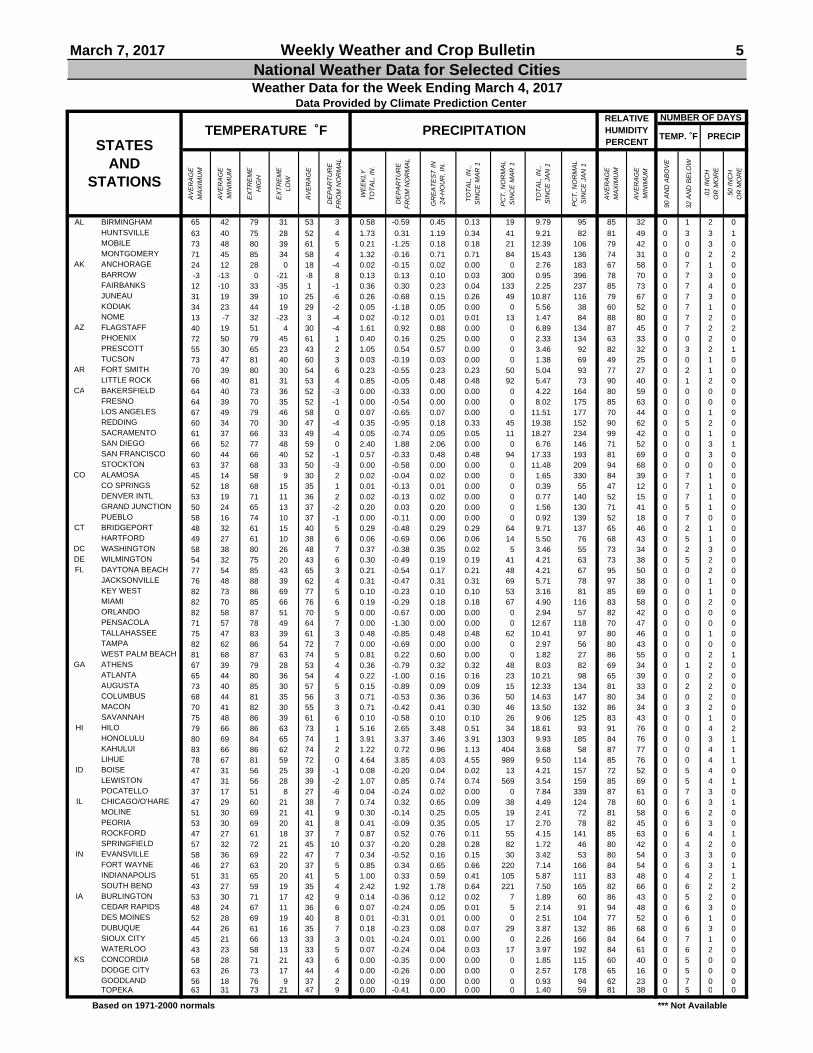
Snow Depth
Inches
120+
84
60
36
24
12
8
4
2
1
T
0Snow analysis and data (plotted values, in inches) are provided by NOAA’s National Operational Hydrologic Remote Sensing Center (NOHRSC).
Agricultural Weather AssessmentsWorld Agricultural Outlook Board
Winter Wheat Area
March 4, 2017
March 7, 2017 Weekly Weather and Crop Bulletin 5
NUMBER OF DAYS
AV
ER
AG
E
MA
XIM
UM
AV
ER
AG
E
MIN
IMU
M
EX
TR
EM
E
HIG
H
EX
TR
EM
E
LOW
AV
ER
AG
E
DE
PA
RT
UR
E
F
RO
M N
OR
MA
L
WE
EK
LY
TO
TA
L, I
N.
DE
PA
RT
UR
E
F
RO
M N
OR
MA
L
GR
EA
TE
ST
IN
24
-HO
UR
, IN
.
TO
TA
L, I
N.,
SIN
CE
MA
R 1
PC
T.
NO
RM
AL
SIN
CE
MA
R 1
TO
TA
L, I
N.,
S
INC
E J
AN
1
PC
T.
NO
RM
AL
SIN
CE
JA
N 1
AV
ER
AG
E
MA
XIM
UM
AV
ER
AG
E
MIN
IMU
M
90 A
ND
AB
OV
E
32 A
ND
BE
LOW
.01
INC
H
O
R M
OR
E
.50
INC
H
O
R M
OR
E
AL BIRMINGHAM 65 42 79 31 53 3 0.58 -0.59 0.45 0.13 19 9.79 95 85 32 0 1 2 0HUNTSVILLE 63 40 75 28 52 4 1.73 0.31 1.19 0.34 41 9.21 82 81 49 0 3 3 1MOBILE 73 48 80 39 61 5 0.21 -1.25 0.18 0.18 21 12.39 106 79 42 0 0 3 0MONTGOMERY 71 45 85 34 58 4 1.32 -0.16 0.71 0.71 84 15.43 136 74 31 0 0 2 2
AK ANCHORAGE 24 12 28 0 18 -4 0.02 -0.15 0.02 0.00 0 2.76 183 67 58 0 7 1 0BARROW -3 -13 0 -21 -8 8 0.13 0.13 0.10 0.03 300 0.95 396 78 70 0 7 3 0FAIRBANKS 12 -10 33 -35 1 -1 0.36 0.30 0.23 0.04 133 2.25 237 85 73 0 7 4 0JUNEAU 31 19 39 10 25 -6 0.26 -0.68 0.15 0.26 49 10.87 116 79 67 0 7 3 0KODIAK 34 23 44 19 29 -2 0.05 -1.18 0.05 0.00 0 5.56 38 60 52 0 7 1 0NOME 13 -7 32 -23 3 -4 0.02 -0.12 0.01 0.01 13 1.47 84 88 80 0 7 2 0
AZ FLAGSTAFF 40 19 51 4 30 -4 1.61 0.92 0.88 0.00 0 6.89 134 87 45 0 7 2 2PHOENIX 72 50 79 45 61 1 0.40 0.16 0.25 0.00 0 2.33 134 63 33 0 0 2 0PRESCOTT 55 30 65 23 43 2 1.05 0.54 0.57 0.00 0 3.46 92 82 32 0 3 2 1TUCSON 73 47 81 40 60 3 0.03 -0.19 0.03 0.00 0 1.38 69 49 25 0 0 1 0
AR FORT SMITH 70 39 80 30 54 6 0.23 -0.55 0.23 0.23 50 5.04 93 77 27 0 2 1 0LITTLE ROCK 66 40 81 31 53 4 0.85 -0.05 0.48 0.48 92 5.47 73 90 40 0 1 2 0
CA BAKERSFIELD 64 40 73 36 52 -3 0.00 -0.33 0.00 0.00 0 4.22 164 80 59 0 0 0 0FRESNO 64 39 70 35 52 -1 0.00 -0.54 0.00 0.00 0 8.02 175 85 63 0 0 0 0LOS ANGELES 67 49 79 46 58 0 0.07 -0.65 0.07 0.00 0 11.51 177 70 44 0 0 1 0REDDING 60 34 70 30 47 -4 0.35 -0.95 0.18 0.33 45 19.38 152 90 62 0 5 2 0SACRAMENTO 61 37 66 33 49 -4 0.05 -0.74 0.05 0.05 11 18.27 234 99 42 0 0 1 0SAN DIEGO 66 52 77 48 59 0 2.40 1.88 2.06 0.00 0 6.76 146 71 52 0 0 3 1SAN FRANCISCO 60 44 66 40 52 -1 0.57 -0.33 0.48 0.48 94 17.33 193 81 69 0 0 3 0STOCKTON 63 37 68 33 50 -3 0.00 -0.58 0.00 0.00 0 11.48 209 94 68 0 0 0 0
CO ALAMOSA 45 14 58 9 30 2 0.02 -0.04 0.02 0.00 0 1.65 330 84 39 0 7 1 0CO SPRINGS 52 18 68 15 35 1 0.01 -0.13 0.01 0.00 0 0.39 55 47 12 0 7 1 0DENVER INTL 53 19 71 11 36 2 0.02 -0.13 0.02 0.00 0 0.77 140 52 15 0 7 1 0GRAND JUNCTION 50 24 65 13 37 -2 0.20 0.03 0.20 0.00 0 1.56 130 71 41 0 5 1 0PUEBLO 58 16 74 10 37 -1 0.00 -0.11 0.00 0.00 0 0.92 139 52 18 0 7 0 0
CT BRIDGEPORT 48 32 61 15 40 5 0.29 -0.48 0.29 0.29 64 9.71 137 65 46 0 2 1 0HARTFORD 49 27 61 10 38 6 0.06 -0.69 0.06 0.06 14 5.50 76 68 43 0 5 1 0
DC WASHINGTON 58 38 80 26 48 7 0.37 -0.38 0.35 0.02 5 3.46 55 73 34 0 2 3 0DE WILMINGTON 54 32 75 20 43 6 0.30 -0.49 0.19 0.19 41 4.21 63 73 38 0 5 2 0FL DAYTONA BEACH 77 54 85 43 65 3 0.21 -0.54 0.17 0.21 48 4.21 67 95 50 0 0 2 0
JACKSONVILLE 76 48 88 39 62 4 0.31 -0.47 0.31 0.31 69 5.71 78 97 38 0 0 1 0KEY WEST 82 73 86 69 77 5 0.10 -0.23 0.10 0.10 53 3.16 81 85 69 0 0 1 0MIAMI 82 70 85 66 76 6 0.19 -0.29 0.18 0.18 67 4.90 116 83 58 0 0 2 0ORLANDO 82 58 87 51 70 5 0.00 -0.67 0.00 0.00 0 2.94 57 82 42 0 0 0 0PENSACOLA 71 57 78 49 64 7 0.00 -1.30 0.00 0.00 0 12.67 118 70 47 0 0 0 0TALLAHASSEE 75 47 83 39 61 3 0.48 -0.85 0.48 0.48 62 10.41 97 80 46 0 0 1 0TAMPA 82 62 86 54 72 7 0.00 -0.69 0.00 0.00 0 2.97 56 80 43 0 0 0 0WEST PALM BEACH 81 68 87 63 74 5 0.81 0.22 0.60 0.00 0 1.82 27 86 55 0 0 2 1
GA ATHENS 67 39 79 28 53 4 0.36 -0.79 0.32 0.32 48 8.03 82 69 34 0 1 2 0ATLANTA 65 44 80 36 54 4 0.22 -1.00 0.16 0.16 23 10.21 98 65 39 0 0 2 0AUGUSTA 73 40 85 30 57 5 0.15 -0.89 0.09 0.09 15 12.33 134 81 33 0 2 2 0COLUMBUS 68 44 81 35 56 3 0.71 -0.53 0.36 0.36 50 14.63 147 80 34 0 0 2 0MACON 70 41 82 30 55 3 0.71 -0.42 0.41 0.30 46 13.50 132 86 34 0 3 2 0SAVANNAH 75 48 86 39 61 6 0.10 -0.58 0.10 0.10 26 9.06 125 83 43 0 0 1 0
HI HILO 79 66 86 63 73 1 5.16 2.65 3.48 0.51 34 18.61 93 91 76 0 0 4 2HONOLULU 80 69 84 65 74 1 3.91 3.37 3.46 3.91 1303 9.93 185 84 76 0 0 3 1KAHULUI 83 66 86 62 74 2 1.22 0.72 0.96 1.13 404 3.68 58 87 77 0 0 4 1LIHUE 78 67 81 59 72 0 4.64 3.85 4.03 4.55 989 9.50 114 85 76 0 0 4 1
ID BOISE 47 31 56 25 39 -1 0.08 -0.20 0.04 0.02 13 4.21 157 72 52 0 5 4 0LEWISTON 47 31 56 28 39 -2 1.07 0.85 0.74 0.74 569 3.54 159 85 69 0 5 4 1POCATELLO 37 17 51 8 27 -6 0.04 -0.24 0.02 0.00 0 7.84 339 87 61 0 7 3 0
IL CHICAGO/O'HARE 47 29 60 21 38 7 0.74 0.32 0.65 0.09 38 4.49 124 78 60 0 6 3 1MOLINE 51 30 69 21 41 9 0.30 -0.14 0.25 0.05 19 2.41 72 81 58 0 6 2 0PEORIA 53 30 69 20 41 8 0.41 -0.09 0.35 0.05 17 2.70 78 82 45 0 6 3 0ROCKFORD 47 27 61 18 37 7 0.87 0.52 0.76 0.11 55 4.15 141 85 63 0 6 4 1SPRINGFIELD 57 32 72 21 45 10 0.37 -0.20 0.28 0.28 82 1.72 46 80 42 0 4 2 0
IN EVANSVILLE 58 36 69 22 47 7 0.34 -0.52 0.16 0.15 30 3.42 53 80 54 0 3 3 0FORT WAYNE 46 27 63 20 37 5 0.85 0.34 0.65 0.66 220 7.14 166 84 54 0 6 3 1INDIANAPOLIS 51 31 65 20 41 5 1.00 0.33 0.59 0.41 105 5.87 111 83 48 0 4 2 1SOUTH BEND 43 27 59 19 35 4 2.42 1.92 1.78 0.64 221 7.50 165 82 66 0 6 2 2
IA BURLINGTON 53 30 71 17 42 9 0.14 -0.36 0.12 0.02 7 1.89 60 86 43 0 5 2 0CEDAR RAPIDS 48 24 67 11 36 6 0.07 -0.24 0.05 0.01 5 2.14 91 94 48 0 6 3 0DES MOINES 52 28 69 19 40 8 0.01 -0.31 0.01 0.00 0 2.51 104 77 52 0 6 1 0DUBUQUE 44 26 61 16 35 7 0.18 -0.23 0.08 0.07 29 3.87 132 86 68 0 6 3 0SIOUX CITY 45 21 66 13 33 3 0.01 -0.24 0.01 0.00 0 2.26 166 84 64 0 7 1 0WATERLOO 43 23 58 13 33 5 0.07 -0.24 0.04 0.03 17 3.97 192 84 61 0 6 2 0
KS CONCORDIA 58 28 71 21 43 6 0.00 -0.35 0.00 0.00 0 1.85 115 60 40 0 5 0 0DODGE CITY 63 26 73 17 44 4 0.00 -0.26 0.00 0.00 0 2.57 178 65 16 0 5 0 0GOODLAND 56 18 76 9 37 2 0.00 -0.19 0.00 0.00 0 0.93 94 62 23 0 7 0 0TOPEKA 63 31 73 21 47 9 0.00 -0.41 0.00 0.00 0 1.40 59 81 38 0 5 0 0
Based on 1971-2000 normals *** Not Available
TEMP. ˚F
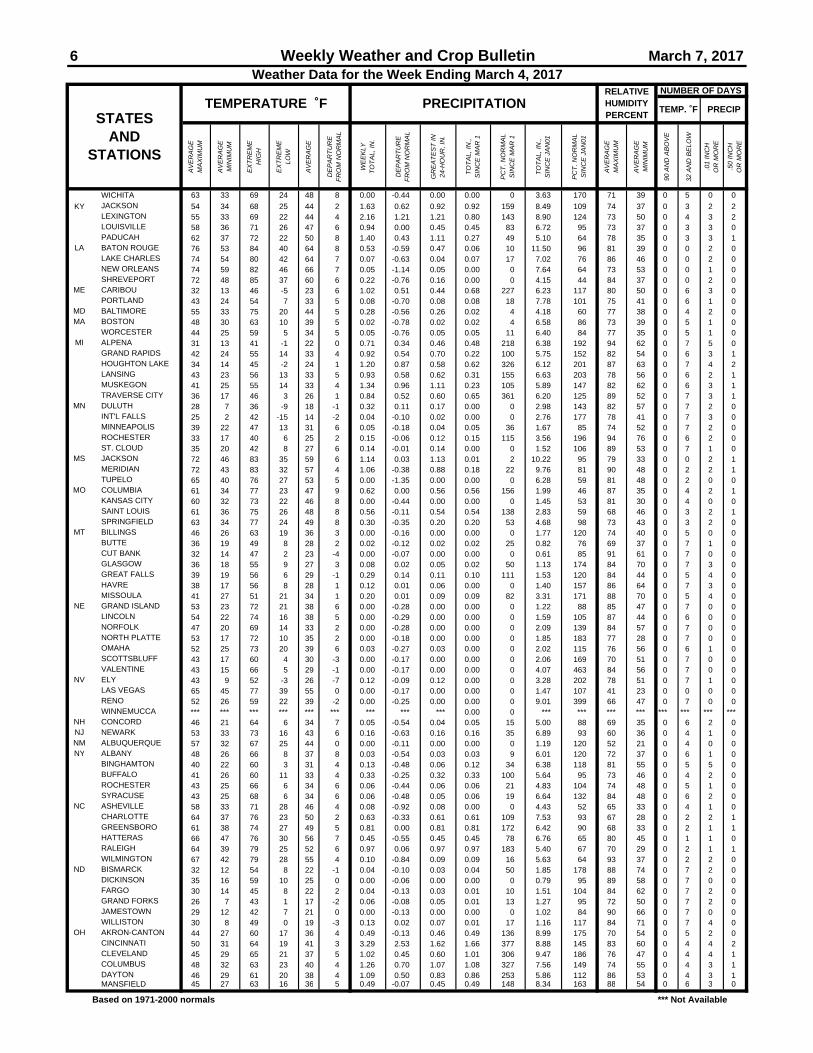
National Weather Data for Selected CitiesWeather Data for the Week Ending March 4, 2017
Data Provided by Climate Prediction Center
PRECIPSTATES
AND STATIONS
RELATIVE HUMIDITY PERCENT
TEMPERATURE ˚F PRECIPITATION
6 Weekly Weather and Crop Bulletin March 7, 2017
NUMBER OF DAYS
AV
ER
AG
E
MA
XIM
UM
AV
ER
AG
E
MIN
IMU
M
EX
TR
EM
E
HIG
H
EX
TR
EM
E
LOW
AV
ER
AG
E
DE
PA
RT
UR
E
F
RO
M N
OR
MA
L
WE
EK
LY
TO
TA
L, I
N.
DE
PA
RT
UR
E
F
RO
M N
OR
MA
L
GR
EA
TE
ST
IN
24
-HO
UR
, IN
.
TO
TA
L, I
N.,
SIN
CE
MA
R 1
PC
T.
NO
RM
AL
SIN
CE
MA
R 1
TO
TA
L, I
N.,
S
INC
E J
AN
01
PC
T.
NO
RM
AL
SIN
CE
JA
N01
AV
ER
AG
E
MA
XIM
UM
AV
ER
AG
E
MIN
IMU
M
90 A
ND
AB
OV
E
32 A
ND
BE
LOW
.01
INC
H
O
R M
OR
E
.50
INC
H
O
R M
OR
E
WICHITA 63 33 69 24 48 8 0.00 -0.44 0.00 0.00 0 3.63 170 71 39 0 5 0 0
KY JACKSON 54 34 68 25 44 2 1.63 0.62 0.92 0.92 159 8.49 109 74 37 0 3 2 2LEXINGTON 55 33 69 22 44 4 2.16 1.21 1.21 0.80 143 8.90 124 73 50 0 4 3 2LOUISVILLE 58 36 71 26 47 6 0.94 0.00 0.45 0.45 83 6.72 95 73 37 0 3 3 0PADUCAH 62 37 72 22 50 8 1.40 0.43 1.11 0.27 49 5.10 64 78 35 0 3 3 1
LA BATON ROUGE 76 53 84 40 64 8 0.53 -0.59 0.47 0.06 10 11.50 96 81 39 0 0 2 0LAKE CHARLES 74 54 80 42 64 7 0.07 -0.63 0.04 0.07 17 7.02 76 86 46 0 0 2 0NEW ORLEANS 74 59 82 46 66 7 0.05 -1.14 0.05 0.00 0 7.64 64 73 53 0 0 1 0SHREVEPORT 72 48 85 37 60 6 0.22 -0.76 0.16 0.00 0 4.15 44 84 37 0 0 2 0
ME CARIBOU 32 13 46 -5 23 6 1.02 0.51 0.44 0.68 227 6.23 117 80 50 0 6 3 0PORTLAND 43 24 54 7 33 5 0.08 -0.70 0.08 0.08 18 7.78 101 75 41 0 6 1 0
MD BALTIMORE 55 33 75 20 44 5 0.28 -0.56 0.26 0.02 4 4.18 60 77 38 0 4 2 0MA BOSTON 48 30 63 10 39 5 0.02 -0.78 0.02 0.02 4 6.58 86 73 39 0 5 1 0
WORCESTER 44 25 59 5 34 5 0.05 -0.76 0.05 0.05 11 6.40 84 77 35 0 5 1 0MI ALPENA 31 13 41 -1 22 0 0.71 0.34 0.46 0.48 218 6.38 192 94 62 0 7 5 0
GRAND RAPIDS 42 24 55 14 33 4 0.92 0.54 0.70 0.22 100 5.75 152 82 54 0 6 3 1HOUGHTON LAKE 34 14 45 -2 24 1 1.20 0.87 0.58 0.62 326 6.12 201 87 63 0 7 4 2LANSING 43 23 56 13 33 5 0.93 0.58 0.62 0.31 155 6.63 203 78 56 0 6 2 1MUSKEGON 41 25 55 14 33 4 1.34 0.96 1.11 0.23 105 5.89 147 82 62 0 6 3 1TRAVERSE CITY 36 17 46 3 26 1 0.84 0.52 0.60 0.65 361 6.20 125 89 52 0 7 3 1
MN DULUTH 28 7 36 -9 18 -1 0.32 0.11 0.17 0.00 0 2.98 143 82 57 0 7 2 0INT'L FALLS 25 2 42 -15 14 -2 0.04 -0.10 0.02 0.00 0 2.76 177 78 41 0 7 3 0MINNEAPOLIS 39 22 47 13 31 6 0.05 -0.18 0.04 0.05 36 1.67 85 74 52 0 7 2 0ROCHESTER 33 17 40 6 25 2 0.15 -0.06 0.12 0.15 115 3.56 196 94 76 0 6 2 0ST. CLOUD 35 20 42 8 27 6 0.14 -0.01 0.14 0.00 0 1.52 106 89 53 0 7 1 0
MS JACKSON 72 46 83 35 59 6 1.14 0.03 1.13 0.01 2 10.22 95 79 33 0 0 2 1MERIDIAN 72 43 83 32 57 4 1.06 -0.38 0.88 0.18 22 9.76 81 90 48 0 2 2 1TUPELO 65 40 76 27 53 5 0.00 -1.35 0.00 0.00 0 6.28 59 81 48 0 2 0 0
MO COLUMBIA 61 34 77 23 47 9 0.62 0.00 0.56 0.56 156 1.99 46 87 35 0 4 2 1KANSAS CITY 60 32 73 22 46 8 0.00 -0.44 0.00 0.00 0 1.45 53 81 30 0 4 0 0SAINT LOUIS 61 36 75 26 48 8 0.56 -0.11 0.54 0.54 138 2.83 59 68 46 0 3 2 1SPRINGFIELD 63 34 77 24 49 8 0.30 -0.35 0.20 0.20 53 4.68 98 73 43 0 3 2 0
MT BILLINGS 46 26 63 19 36 3 0.00 -0.16 0.00 0.00 0 1.77 120 74 40 0 5 0 0BUTTE 36 19 49 8 28 2 0.02 -0.12 0.02 0.02 25 0.82 76 69 37 0 7 1 0CUT BANK 32 14 47 2 23 -4 0.00 -0.07 0.00 0.00 0 0.61 85 91 61 0 7 0 0GLASGOW 36 18 55 9 27 3 0.08 0.02 0.05 0.02 50 1.13 174 84 70 0 7 3 0GREAT FALLS 39 19 56 6 29 -1 0.29 0.14 0.11 0.10 111 1.53 120 84 44 0 5 4 0HAVRE 38 17 56 8 28 1 0.12 0.01 0.06 0.00 0 1.40 157 86 64 0 7 3 0MISSOULA 41 27 51 21 34 1 0.20 0.01 0.09 0.09 82 3.31 171 88 70 0 5 4 0
NE GRAND ISLAND 53 23 72 21 38 6 0.00 -0.28 0.00 0.00 0 1.22 88 85 47 0 7 0 0LINCOLN 54 22 74 16 38 5 0.00 -0.29 0.00 0.00 0 1.59 105 87 44 0 6 0 0NORFOLK 47 20 69 14 33 2 0.00 -0.28 0.00 0.00 0 2.09 139 84 57 0 7 0 0NORTH PLATTE 53 17 72 10 35 2 0.00 -0.18 0.00 0.00 0 1.85 183 77 28 0 7 0 0OMAHA 52 25 73 20 39 6 0.03 -0.27 0.03 0.00 0 2.02 115 76 56 0 6 1 0SCOTTSBLUFF 43 17 60 4 30 -3 0.00 -0.17 0.00 0.00 0 2.06 169 70 51 0 7 0 0VALENTINE 43 15 66 5 29 -1 0.00 -0.17 0.00 0.00 0 4.07 463 84 56 0 7 0 0
NV ELY 43 9 52 -3 26 -7 0.12 -0.09 0.12 0.00 0 3.28 202 78 51 0 7 1 0LAS VEGAS 65 45 77 39 55 0 0.00 -0.17 0.00 0.00 0 1.47 107 41 23 0 0 0 0RENO 52 26 59 22 39 -2 0.00 -0.25 0.00 0.00 0 9.01 399 66 47 0 7 0 0WINNEMUCCA *** *** *** *** *** *** *** *** *** 0.00 0 *** *** *** *** *** *** *** ***
NH CONCORD 46 21 64 6 34 7 0.05 -0.54 0.04 0.05 15 5.00 88 69 35 0 6 2 0NJ NEWARK 53 33 73 16 43 6 0.16 -0.63 0.16 0.16 35 6.89 93 60 36 0 4 1 0NM ALBUQUERQUE 57 32 67 25 44 0 0.00 -0.11 0.00 0.00 0 1.19 120 52 21 0 4 0 0NY ALBANY 48 26 66 8 37 8 0.03 -0.54 0.03 0.03 9 6.01 120 72 37 0 6 1 0
BINGHAMTON 40 22 60 3 31 4 0.13 -0.48 0.06 0.12 34 6.38 118 81 55 0 5 5 0BUFFALO 41 26 60 11 33 4 0.33 -0.25 0.32 0.33 100 5.64 95 73 46 0 4 2 0ROCHESTER 43 25 66 6 34 6 0.06 -0.44 0.06 0.06 21 4.83 104 74 48 0 5 1 0SYRACUSE 43 25 68 6 34 6 0.06 -0.48 0.05 0.06 19 6.64 132 84 48 0 6 2 0
NC ASHEVILLE 58 33 71 28 46 4 0.08 -0.92 0.08 0.00 0 4.43 52 65 33 0 4 1 0CHARLOTTE 64 37 76 23 50 2 0.63 -0.33 0.61 0.61 109 7.53 93 67 28 0 2 2 1GREENSBORO 61 38 74 27 49 5 0.81 0.00 0.81 0.81 172 6.42 90 68 33 0 2 1 1HATTERAS 66 47 76 30 56 7 0.45 -0.55 0.45 0.45 78 6.76 65 80 45 0 1 1 0RALEIGH 64 39 79 25 52 6 0.97 0.06 0.97 0.97 183 5.40 67 70 29 0 2 1 1WILMINGTON 67 42 79 28 55 4 0.10 -0.84 0.09 0.09 16 5.63 64 93 37 0 2 2 0
ND BISMARCK 32 12 54 8 22 -1 0.04 -0.10 0.03 0.04 50 1.85 178 88 74 0 7 2 0DICKINSON 35 16 59 10 25 0 0.00 -0.06 0.00 0.00 0 0.79 95 89 58 0 7 0 0FARGO 30 14 45 8 22 2 0.04 -0.13 0.03 0.01 10 1.51 104 84 62 0 7 2 0GRAND FORKS 26 7 43 1 17 -2 0.06 -0.08 0.05 0.01 13 1.27 95 72 50 0 7 2 0JAMESTOWN 29 12 42 7 21 0 0.00 -0.13 0.00 0.00 0 1.02 84 90 66 0 7 0 0WILLISTON 30 8 49 0 19 -3 0.13 0.02 0.07 0.01 17 1.16 117 84 71 0 7 4 0
OH AKRON-CANTON 44 27 60 17 36 4 0.49 -0.13 0.46 0.49 136 8.99 175 70 54 0 5 2 0CINCINNATI 50 31 64 19 41 3 3.29 2.53 1.62 1.66 377 8.88 145 83 60 0 4 4 2CLEVELAND 45 29 65 21 37 5 1.02 0.45 0.60 1.01 306 9.47 186 76 47 0 4 4 1COLUMBUS 48 32 63 23 40 4 1.26 0.70 1.07 1.08 327 7.56 149 74 55 0 4 3 1DAYTON 46 29 61 20 38 4 1.09 0.50 0.83 0.86 253 5.86 112 86 53 0 4 3 1MANSFIELD 45 27 63 16 36 5 0.49 -0.07 0.45 0.49 148 8.34 163 88 54 0 6 3 0
Based on 1971-2000 normals *** Not Available
TEMP. ˚F PRECIPSTATES
AND STATIONS
RELATIVE HUMIDITY PERCENT
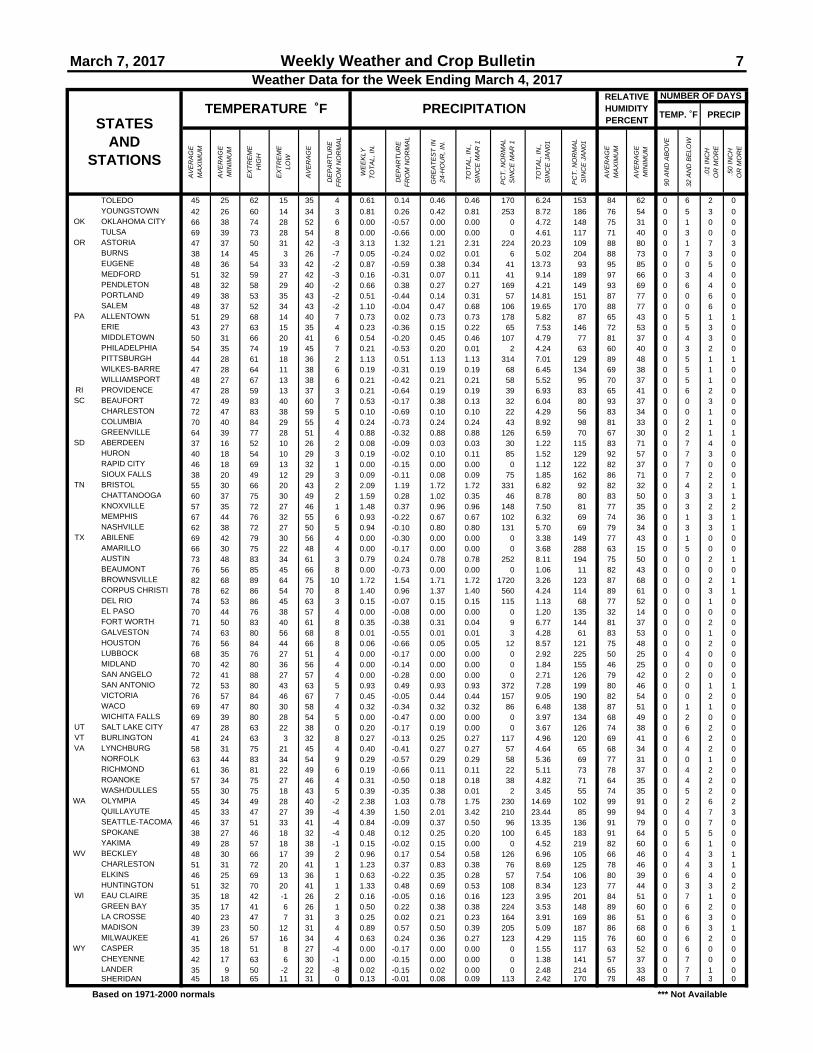
Weather Data for the Week Ending March 4, 2017
TEMPERATURE ˚F PRECIPITATION
March 7, 2017 Weekly Weather and Crop Bulletin 7
NUMBER OF DAYS
AV
ER
AG
E
MA
XIM
UM
AV
ER
AG
E
MIN
IMU
M
EX
TR
EM
E
HIG
H
EX
TR
EM
E
LOW
AV
ER
AG
E
DE
PA
RT
UR
E
F
RO
M N
OR
MA
L
WE
EK
LY
TO
TA
L, I
N.
DE
PA
RT
UR
E
F
RO
M N
OR
MA
L
GR
EA
TE
ST
IN
24
-HO
UR
, IN
.
TO
TA
L, I
N.,
SIN
CE
MA
R 1
PC
T.
NO
RM
AL
SIN
CE
MA
R 1
TO
TA
L, I
N.,
S
INC
E J
AN
01
PC
T.
NO
RM
AL
SIN
CE
JA
N01
AV
ER
AG
E
MA
XIM
UM
AV
ER
AG
E
MIN
IMU
M
90 A
ND
AB
OV
E
32 A
ND
BE
LOW
.01
INC
H
O
R M
OR
E
.50
INC
H
O
R M
OR
E
TOLEDO 45 25 62 15 35 4 0.61 0.14 0.46 0.46 170 6.24 153 84 62 0 6 2 0YOUNGSTOWN 42 26 60 14 34 3 0.81 0.26 0.42 0.81 253 8.72 186 76 54 0 5 3 0
OK OKLAHOMA CITY 66 38 74 28 52 6 0.00 -0.57 0.00 0.00 0 4.72 148 75 31 0 1 0 0TULSA 69 39 73 28 54 8 0.00 -0.66 0.00 0.00 0 4.61 117 71 40 0 3 0 0
OR ASTORIA 47 37 50 31 42 -3 3.13 1.32 1.21 2.31 224 20.23 109 88 80 0 1 7 3BURNS 38 14 45 3 26 -7 0.05 -0.24 0.02 0.01 6 5.02 204 88 73 0 7 3 0EUGENE 48 36 54 33 42 -2 0.87 -0.59 0.38 0.34 41 13.73 93 95 85 0 0 5 0MEDFORD 51 32 59 27 42 -3 0.16 -0.31 0.07 0.11 41 9.14 189 97 66 0 3 4 0PENDLETON 48 32 58 29 40 -2 0.66 0.38 0.27 0.27 169 4.21 149 93 69 0 6 4 0PORTLAND 49 38 53 35 43 -2 0.51 -0.44 0.14 0.31 57 14.81 151 87 77 0 0 6 0SALEM 48 37 52 34 43 -2 1.10 -0.04 0.47 0.68 106 19.65 170 88 77 0 0 6 0
PA ALLENTOWN 51 29 68 14 40 7 0.73 0.02 0.73 0.73 178 5.82 87 65 43 0 5 1 1ERIE 43 27 63 15 35 4 0.23 -0.36 0.15 0.22 65 7.53 146 72 53 0 5 3 0MIDDLETOWN 50 31 66 20 41 6 0.54 -0.20 0.45 0.46 107 4.79 77 81 37 0 4 3 0PHILADELPHIA 54 35 74 19 45 7 0.21 -0.53 0.20 0.01 2 4.24 63 60 40 0 3 2 0PITTSBURGH 44 28 61 18 36 2 1.13 0.51 1.13 1.13 314 7.01 129 89 48 0 5 1 1WILKES-BARRE 47 28 64 11 38 6 0.19 -0.31 0.19 0.19 68 6.45 134 69 38 0 5 1 0WILLIAMSPORT 48 27 67 13 38 6 0.21 -0.42 0.21 0.21 58 5.52 95 70 37 0 5 1 0
RI PROVIDENCE 47 28 59 13 37 3 0.21 -0.64 0.19 0.19 39 6.93 83 65 41 0 6 2 0SC BEAUFORT 72 49 83 40 60 7 0.53 -0.17 0.38 0.13 32 6.04 80 93 37 0 0 3 0
CHARLESTON 72 47 83 38 59 5 0.10 -0.69 0.10 0.10 22 4.29 56 83 34 0 0 1 0COLUMBIA 70 40 84 29 55 4 0.24 -0.73 0.24 0.24 43 8.92 98 81 33 0 2 1 0GREENVILLE 64 39 77 28 51 4 0.88 -0.32 0.88 0.88 126 6.59 70 67 30 0 2 1 1
SD ABERDEEN 37 16 52 10 26 2 0.08 -0.09 0.03 0.03 30 1.22 115 83 71 0 7 4 0HURON 40 18 54 10 29 3 0.19 -0.02 0.10 0.11 85 1.52 129 92 57 0 7 3 0RAPID CITY 46 18 69 13 32 1 0.00 -0.15 0.00 0.00 0 1.12 122 82 37 0 7 0 0SIOUX FALLS 38 20 49 12 29 3 0.09 -0.11 0.08 0.09 75 1.85 162 86 71 0 7 2 0
TN BRISTOL 55 30 66 20 43 2 2.09 1.19 1.72 1.72 331 6.82 92 82 32 0 4 2 1CHATTANOOGA 60 37 75 30 49 2 1.59 0.28 1.02 0.35 46 8.78 80 83 50 0 3 3 1KNOXVILLE 57 35 72 27 46 1 1.48 0.37 0.96 0.96 148 7.50 81 77 35 0 3 2 2MEMPHIS 67 44 76 32 55 6 0.93 -0.22 0.67 0.67 102 6.32 69 74 36 0 1 3 1NASHVILLE 62 38 72 27 50 5 0.94 -0.10 0.80 0.80 131 5.70 69 79 34 0 3 3 1
TX ABILENE 69 42 79 30 56 4 0.00 -0.30 0.00 0.00 0 3.38 149 77 43 0 1 0 0AMARILLO 66 30 75 22 48 4 0.00 -0.17 0.00 0.00 0 3.68 288 63 15 0 5 0 0AUSTIN 73 48 83 34 61 3 0.79 0.24 0.78 0.78 252 8.11 194 75 50 0 0 2 1BEAUMONT 76 56 85 45 66 8 0.00 -0.73 0.00 0.00 0 1.06 11 82 43 0 0 0 0BROWNSVILLE 82 68 89 64 75 10 1.72 1.54 1.71 1.72 1720 3.26 123 87 68 0 0 2 1CORPUS CHRISTI 78 62 86 54 70 8 1.40 0.96 1.37 1.40 560 4.24 114 89 61 0 0 3 1DEL RIO 74 53 86 45 63 3 0.15 -0.07 0.15 0.15 115 1.13 68 77 52 0 0 1 0EL PASO 70 44 76 38 57 4 0.00 -0.08 0.00 0.00 0 1.20 135 32 14 0 0 0 0FORT WORTH 71 50 83 40 61 8 0.35 -0.38 0.31 0.04 9 6.77 144 81 37 0 0 2 0GALVESTON 74 63 80 56 68 8 0.01 -0.55 0.01 0.01 3 4.28 61 83 53 0 0 1 0HOUSTON 76 56 84 44 66 8 0.06 -0.66 0.05 0.05 12 8.57 121 75 48 0 0 2 0LUBBOCK 68 35 76 27 51 4 0.00 -0.17 0.00 0.00 0 2.92 225 50 25 0 4 0 0MIDLAND 70 42 80 36 56 4 0.00 -0.14 0.00 0.00 0 1.84 155 46 25 0 0 0 0SAN ANGELO 72 41 88 27 57 4 0.00 -0.28 0.00 0.00 0 2.71 126 79 42 0 2 0 0SAN ANTONIO 72 53 80 43 63 5 0.93 0.49 0.93 0.93 372 7.28 199 80 46 0 0 1 1VICTORIA 76 57 84 46 67 7 0.45 -0.05 0.44 0.44 157 9.05 190 82 54 0 0 2 0WACO 69 47 80 30 58 4 0.32 -0.34 0.32 0.32 86 6.48 138 87 51 0 1 1 0WICHITA FALLS 69 39 80 28 54 5 0.00 -0.47 0.00 0.00 0 3.97 134 68 49 0 2 0 0
UT SALT LAKE CITY 47 28 63 22 38 0 0.20 -0.17 0.19 0.00 0 3.67 126 74 38 0 6 2 0VT BURLINGTON 41 24 63 3 32 8 0.27 -0.13 0.25 0.27 117 4.96 120 69 41 0 6 2 0VA LYNCHBURG 58 31 75 21 45 4 0.40 -0.41 0.27 0.27 57 4.64 65 68 34 0 4 2 0
NORFOLK 63 44 83 34 54 9 0.29 -0.57 0.29 0.29 58 5.36 69 77 31 0 0 1 0RICHMOND 61 36 81 22 49 6 0.19 -0.66 0.11 0.11 22 5.11 73 78 37 0 4 2 0ROANOKE 57 34 75 27 46 4 0.31 -0.50 0.18 0.18 38 4.82 71 64 35 0 4 2 0WASH/DULLES 55 30 75 18 43 5 0.39 -0.35 0.38 0.01 2 3.45 55 74 35 0 5 2 0
WA OLYMPIA 45 34 49 28 40 -2 2.38 1.03 0.78 1.75 230 14.69 102 99 91 0 2 6 2QUILLAYUTE 45 33 47 27 39 -4 4.39 1.50 2.01 3.42 210 23.44 85 99 94 0 4 7 3SEATTLE-TACOMA 46 37 51 33 41 -4 0.84 -0.09 0.37 0.50 96 13.35 136 91 79 0 0 7 0SPOKANE 38 27 46 18 32 -4 0.48 0.12 0.25 0.20 100 6.45 183 91 64 0 5 5 0YAKIMA 49 28 57 18 38 -1 0.15 -0.02 0.15 0.00 0 4.52 219 82 60 0 6 1 0
WV BECKLEY 48 30 66 17 39 2 0.96 0.17 0.54 0.58 126 6.96 105 66 46 0 4 3 1CHARLESTON 51 31 72 20 41 1 1.23 0.37 0.83 0.38 76 8.69 125 78 46 0 4 3 1ELKINS 46 25 69 13 36 1 0.63 -0.22 0.35 0.28 57 7.54 106 80 39 0 6 4 0HUNTINGTON 51 32 70 20 41 1 1.33 0.48 0.69 0.53 108 8.34 123 77 44 0 3 3 2
WI EAU CLAIRE 35 18 42 -1 26 2 0.16 -0.05 0.16 0.16 123 3.95 201 84 51 0 7 1 0GREEN BAY 35 17 41 6 26 1 0.50 0.22 0.38 0.38 224 3.53 148 89 60 0 6 2 0LA CROSSE 40 23 47 7 31 3 0.25 0.02 0.21 0.23 164 3.91 169 86 51 0 6 3 0MADISON 39 23 50 12 31 4 0.89 0.57 0.50 0.39 205 5.09 187 86 68 0 6 3 1MILWAUKEE 41 26 57 16 34 4 0.63 0.24 0.36 0.27 123 4.29 115 76 60 0 6 2 0
WY CASPER 35 18 51 8 27 -4 0.00 -0.17 0.00 0.00 0 1.55 117 63 52 0 6 0 0CHEYENNE 42 17 63 6 30 -1 0.00 -0.15 0.00 0.00 0 1.38 141 57 37 0 7 0 0LANDER 35 9 50 -2 22 -8 0.02 -0.15 0.02 0.00 0 2.48 214 65 33 0 7 1 0SHERIDAN 45 18 65 11 31 0 0.13 -0.01 0.08 0.09 113 2.42 170 79 48 0 7 3 0
Based on 1971-2000 normals *** Not Available
Weather Data for the Week Ending March 4, 2017
STATES AND
STATIONS
TEMP. ˚F PRECIP
RELATIVE HUMIDITY PERCENT
TEMPERATURE ˚F PRECIPITATION
8 Weekly Weather and Crop Bulletin March 7, 2017
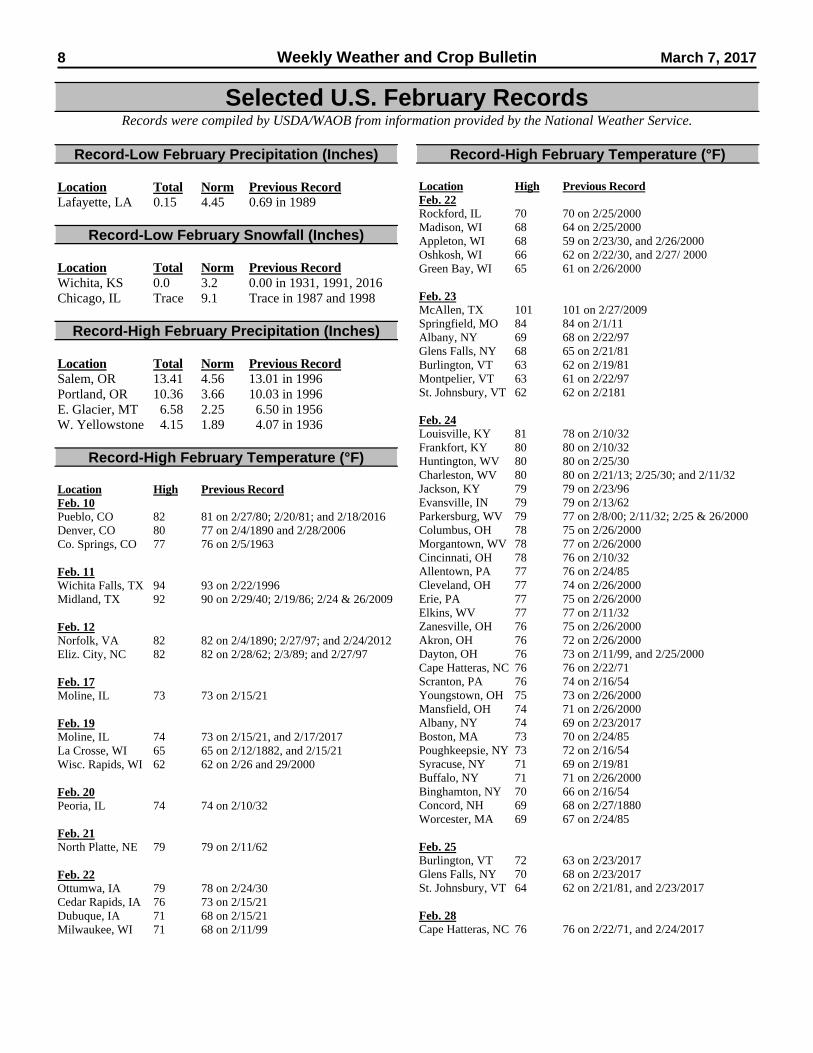
Selected U.S. February Records Records were compiled by USDA/WAOB from information provided by the National Weather Service.
Record-Low February Precipitation (Inches)
Location Total Norm Previous Record Lafayette, LA 0.15 4.45 0.69 in 1989
Record-Low February Snowfall (Inches) Location Total Norm Previous Record Wichita, KS 0.0 3.2 0.00 in 1931, 1991, 2016 Chicago, IL Trace 9.1 Trace in 1987 and 1998
Record-High February Precipitation (Inches) Location Total Norm Previous Record Salem, OR 13.41 4.56 13.01 in 1996 Portland, OR 10.36 3.66 10.03 in 1996 E. Glacier, MT 6.58 2.25 6.50 in 1956 W. Yellowstone 4.15 1.89 4.07 in 1936
Record-High February Temperature (°F) Location High Previous Record Feb. 10 Pueblo, CO 82 81 on 2/27/80; 2/20/81; and 2/18/2016 Denver, CO 80 77 on 2/4/1890 and 2/28/2006 Co. Springs, CO 77 76 on 2/5/1963 Feb. 11 Wichita Falls, TX 94 93 on 2/22/1996 Midland, TX 92 90 on 2/29/40; 2/19/86; 2/24 & 26/2009 Feb. 12 Norfolk, VA 82 82 on 2/4/1890; 2/27/97; and 2/24/2012 Eliz. City, NC 82 82 on 2/28/62; 2/3/89; and 2/27/97 Feb. 17 Moline, IL 73 73 on 2/15/21 Feb. 19 Moline, IL 74 73 on 2/15/21, and 2/17/2017 La Crosse, WI 65 65 on 2/12/1882, and 2/15/21 Wisc. Rapids, WI 62 62 on 2/26 and 29/2000 Feb. 20 Peoria, IL 74 74 on 2/10/32 Feb. 21 North Platte, NE 79 79 on 2/11/62 Feb. 22 Ottumwa, IA 79 78 on 2/24/30 Cedar Rapids, IA 76 73 on 2/15/21 Dubuque, IA 71 68 on 2/15/21 Milwaukee, WI 71 68 on 2/11/99
Record-High February Temperature (°F) Location High Previous Record Feb. 22 Rockford, IL 70 70 on 2/25/2000 Madison, WI 68 64 on 2/25/2000 Appleton, WI 68 59 on 2/23/30, and 2/26/2000 Oshkosh, WI 66 62 on 2/22/30, and 2/27/ 2000 Green Bay, WI 65 61 on 2/26/2000 Feb. 23 McAllen, TX 101 101 on 2/27/2009 Springfield, MO 84 84 on 2/1/11 Albany, NY 69 68 on 2/22/97 Glens Falls, NY 68 65 on 2/21/81 Burlington, VT 63 62 on 2/19/81 Montpelier, VT 63 61 on 2/22/97 St. Johnsbury, VT 62 62 on 2/2181 Feb. 24 Louisville, KY 81 78 on 2/10/32 Frankfort, KY 80 80 on 2/10/32 Huntington, WV 80 80 on 2/25/30 Charleston, WV 80 80 on 2/21/13; 2/25/30; and 2/11/32 Jackson, KY 79 79 on 2/23/96 Evansville, IN 79 79 on 2/13/62 Parkersburg, WV 79 77 on 2/8/00; 2/11/32; 2/25 & 26/2000 Columbus, OH 78 75 on 2/26/2000 Morgantown, WV 78 77 on 2/26/2000 Cincinnati, OH 78 76 on 2/10/32 Allentown, PA 77 76 on 2/24/85 Cleveland, OH 77 74 on 2/26/2000 Erie, PA 77 75 on 2/26/2000 Elkins, WV 77 77 on 2/11/32 Zanesville, OH 76 75 on 2/26/2000 Akron, OH 76 72 on 2/26/2000 Dayton, OH 76 73 on 2/11/99, and 2/25/2000 Cape Hatteras, NC 76 76 on 2/22/71 Scranton, PA 76 74 on 2/16/54 Youngstown, OH 75 73 on 2/26/2000 Mansfield, OH 74 71 on 2/26/2000 Albany, NY 74 69 on 2/23/2017 Boston, MA 73 70 on 2/24/85 Poughkeepsie, NY 73 72 on 2/16/54 Syracuse, NY 71 69 on 2/19/81 Buffalo, NY 71 71 on 2/26/2000 Binghamton, NY 70 66 on 2/16/54 Concord, NH 69 68 on 2/27/1880 Worcester, MA 69 67 on 2/24/85 Feb. 25 Burlington, VT 72 63 on 2/23/2017 Glens Falls, NY 70 68 on 2/23/2017 St. Johnsbury, VT 64 62 on 2/21/81, and 2/23/2017 Feb. 28 Cape Hatteras, NC 76 76 on 2/22/71, and 2/24/2017

March 7, 2017 Weekly Weather and Crop Bulletin 9
National Agricultural Summary February 27 – March 5, 2017
Weekly National Agricultural Summary provided by USDA/NASS
HIGHLIGHTS
A majority of the nation, stretching from the High Plains to the Atlantic Coast, recorded weekly temperatures on average more than 3°F above normal. Temperatures were more than 6°F above average in parts of the Great Plains and Mississippi Valley. Conversely, weekly temperatures in
portions of Colorado, Utah, and Wyoming were substantially below average. Precipitation was generally light across most of the nation, with only parts of the Ohio Valley, Arizona, California, and Texas recording weekly totals more than 2 inches above normal.
Arizona: Durum wheat planting was nearing completion by week’s end, with planting estimated at 95 percent (%) complete and conditions rated mostly good to excellent. Alfalfa conditions were rated mostly good to fair, depending on location, with harvesting taking place on three-quarters of the state’s alfalfa acreage. Barley conditions were mostly good to fair. Central Arizona growers shipped anise, beets, bok choy, broccoli, cabbage (green and red), carrots, cauliflower, celery, cilantro, collard greens, kale greens, kohlrabi, green onions, parsley, and Swiss chard. In western Arizona, growers shipped anise, arugula, bok choy, broccoli, cabbage (green and red), cauliflower, celery, Chinese cabbage, cilantro, endive, escarole, frisee, kale greens, lettuce (Boston, green leaf, iceberg, red leaf, romaine and other), parsley, radicchio, spinach, and Swiss chard. Pasture and range conditions were rated mostly fair to good. Recent storms have saturated soils in the northwestern part of the State; as a result, new forage was appearing in many locations. The highest precipitation reported during the week was 2.39 inches at Payson and the lowest was 0.01 inch at Bonita. Temperatures ranged from a low of 4°F in Grand Canyon and Flagstaff to a high of 83°F at Coolidge and Robson Ranch. Nineteen of the 52 weather stations reported above-normal weekly temperatures. California: There was a lot of variation in the weather across the state, as a departing Pacific system exerted its influence. Mountain snowpack continued to be very impressive, with Lodgepole in the southern Sierras and the Tahoe area reporting snow cover of nearly 7 feet. High temperatures were in the 30s to 40s in the mountains, 40 to 80s in the desert, 50s to 70s in the valley, and 60s to 70s along the coast. Low temperatures were in the 10s to 20s in the mountains, 20s to 40s in the valley, 30s to 50s in the desert, and 40s to 50s along the coast. Growers continued to wait
for fields to dry out sufficiently to resume planting winter grains and field crops. There were reports of lodging in mature wheat fields due to the recent high winds and rain. Pruning, discing, weed control, and pre-bloom spraying continued where dry orchard floor conditions permitted. Olive groves were pruned. Pruning, tying, berm sanitation, and brush shredding continued as vineyard floors dried. Herbicides were applied in some vineyards. Early varieties of stone fruit, including cherries, were blooming in Tulare County. Citrus harvest continued. Recent rains impacted the overall quality of citrus. Orange groves were hedge-rowed and skirted. A few seedless tangerine groves were being netted to prevent cross pollination during the pending bloom. As field conditions permitted, walnut and pistachio orchards were pruned. Almond bloom was progressing, with the southern portion of the state nearing completion. Rain and wind caused some almond petal drop. Recent rains slowed some harvesting, but broccoli, romaine, and red lettuce harvest continued in Imperial County. In Fresno County, winter onion and garlic fields were being fertilized and cultivated. In Tulare County, squash was being planted in hot tunnels. New fields were being prepared for spring planting. Strawberries continued to thrive. Non-irrigated pasture and rangeland continued to improve, with warmth promoting forb and grass growth. Range was reported to be in fair to excellent condition. Supplemental feeding of livestock continued to wane as range conditions improved. Bees were active in almond orchards. Sheep grazed stubble fields, idle cropland, and dormant alfalfa. Florida: There were 6.6 days suitable for fieldwork. Precipitation estimates ranged from no rain in Ft. Lauderdale (Broward County) to 1.14 inches in DeFuniak Springs (Walton County). Average temperatures ranged from 58.7°F in DeFuniak Springs
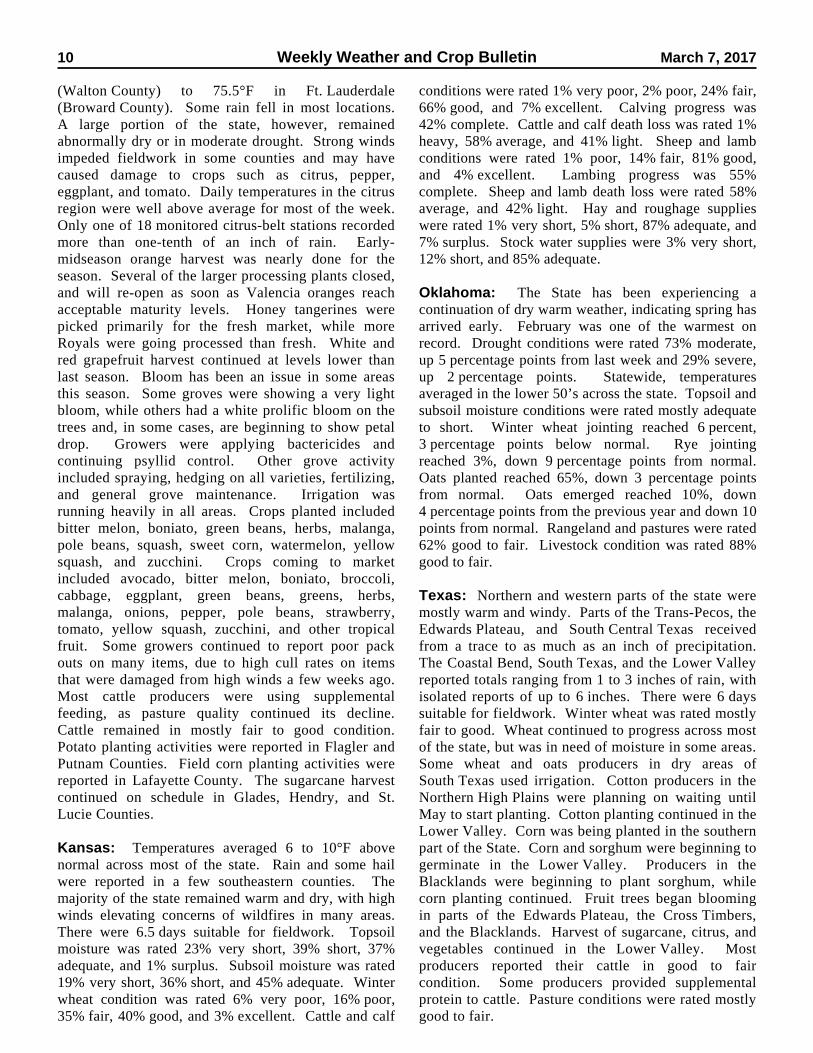
10 Weekly Weather and Crop Bulletin March 7, 2017 (Walton County) to 75.5°F in Ft. Lauderdale (Broward County). Some rain fell in most locations. A large portion of the state, however, remained abnormally dry or in moderate drought. Strong winds impeded fieldwork in some counties and may have caused damage to crops such as citrus, pepper, eggplant, and tomato. Daily temperatures in the citrus region were well above average for most of the week. Only one of 18 monitored citrus-belt stations recorded more than one-tenth of an inch of rain. Early-midseason orange harvest was nearly done for the season. Several of the larger processing plants closed, and will re-open as soon as Valencia oranges reach acceptable maturity levels. Honey tangerines were picked primarily for the fresh market, while more Royals were going processed than fresh. White and red grapefruit harvest continued at levels lower than last season. Bloom has been an issue in some areas this season. Some groves were showing a very light bloom, while others had a white prolific bloom on the trees and, in some cases, are beginning to show petal drop. Growers were applying bactericides and continuing psyllid control. Other grove activity included spraying, hedging on all varieties, fertilizing, and general grove maintenance. Irrigation was running heavily in all areas. Crops planted included bitter melon, boniato, green beans, herbs, malanga, pole beans, squash, sweet corn, watermelon, yellow squash, and zucchini. Crops coming to market included avocado, bitter melon, boniato, broccoli, cabbage, eggplant, green beans, greens, herbs, malanga, onions, pepper, pole beans, strawberry, tomato, yellow squash, zucchini, and other tropical fruit. Some growers continued to report poor pack outs on many items, due to high cull rates on items that were damaged from high winds a few weeks ago. Most cattle producers were using supplemental feeding, as pasture quality continued its decline. Cattle remained in mostly fair to good condition. Potato planting activities were reported in Flagler and Putnam Counties. Field corn planting activities were reported in Lafayette County. The sugarcane harvest continued on schedule in Glades, Hendry, and St. Lucie Counties. Kansas: Temperatures averaged 6 to 10°F above normal across most of the state. Rain and some hail were reported in a few southeastern counties. The majority of the state remained warm and dry, with high winds elevating concerns of wildfires in many areas. There were 6.5 days suitable for fieldwork. Topsoil moisture was rated 23% very short, 39% short, 37% adequate, and 1% surplus. Subsoil moisture was rated 19% very short, 36% short, and 45% adequate. Winter wheat condition was rated 6% very poor, 16% poor, 35% fair, 40% good, and 3% excellent. Cattle and calf
conditions were rated 1% very poor, 2% poor, 24% fair, 66% good, and 7% excellent. Calving progress was 42% complete. Cattle and calf death loss was rated 1% heavy, 58% average, and 41% light. Sheep and lamb conditions were rated 1% poor, 14% fair, 81% good, and 4% excellent. Lambing progress was 55% complete. Sheep and lamb death loss were rated 58% average, and 42% light. Hay and roughage supplies were rated 1% very short, 5% short, 87% adequate, and 7% surplus. Stock water supplies were 3% very short, 12% short, and 85% adequate. Oklahoma: The State has been experiencing a continuation of dry warm weather, indicating spring has arrived early. February was one of the warmest on record. Drought conditions were rated 73% moderate, up 5 percentage points from last week and 29% severe, up 2 percentage points. Statewide, temperatures averaged in the lower 50’s across the state. Topsoil and subsoil moisture conditions were rated mostly adequate to short. Winter wheat jointing reached 6 percent, 3 percentage points below normal. Rye jointing reached 3%, down 9 percentage points from normal. Oats planted reached 65%, down 3 percentage points from normal. Oats emerged reached 10%, down 4 percentage points from the previous year and down 10 points from normal. Rangeland and pastures were rated 62% good to fair. Livestock condition was rated 88% good to fair. Texas: Northern and western parts of the state were mostly warm and windy. Parts of the Trans-Pecos, the Edwards Plateau, and South Central Texas received from a trace to as much as an inch of precipitation. The Coastal Bend, South Texas, and the Lower Valley reported totals ranging from 1 to 3 inches of rain, with isolated reports of up to 6 inches. There were 6 days suitable for fieldwork. Winter wheat was rated mostly fair to good. Wheat continued to progress across most of the state, but was in need of moisture in some areas. Some wheat and oats producers in dry areas of South Texas used irrigation. Cotton producers in the Northern High Plains were planning on waiting until May to start planting. Cotton planting continued in the Lower Valley. Corn was being planted in the southern part of the State. Corn and sorghum were beginning to germinate in the Lower Valley. Producers in the Blacklands were beginning to plant sorghum, while corn planting continued. Fruit trees began blooming in parts of the Edwards Plateau, the Cross Timbers, and the Blacklands. Harvest of sugarcane, citrus, and vegetables continued in the Lower Valley. Most producers reported their cattle in good to fair condition. Some producers provided supplemental protein to cattle. Pasture conditions were rated mostly good to fair.
March 7, 2017 Weekly Weather and Crop Bulletin 11
COUNTRY CITY
AVG AVG HI LO DEP DEPMAX MIN MAX MIN AVG NRM TOT NRM
ALGERI ALGER 19 8 25 2 14 2.4 18 -49
BATNA 16 2 24 -5 9 2.7 7 -17
ARGENT IGUAZU 32 21 37 16 26 0.8 253 51
FORMOSA 33 23 38 17 28 0.9 122 -8
CERES 30 20 36 15 25 1 124 -12
CORDOBA 29 16 34 10 23 0.6 188 60
RIO CUARTO 28 17 34 10 23 1 65 -38
ROSARIO 30 20 35 12 25 1.6 131 5
BUENOS AIRES 30 19 35 11 24 2.1 165 67
SANTA ROSA 31 17 36 10 24 1.8 83 5
TRES ARROYOS 29 17 37 12 23 2.7 116 34
AUSTRA DARWIN 31 25 35 24 28 0.3 404 66
BRISBANE 30 23 32 19 26 1.6 40 -131
PERTH 30 17 39 8 24 -1.2 78 60
CEDUNA 27 16 46 7 21 -0.5 0 -11
ADELAIDE 26 17 41 11 22 -0.5 0 -41
MELBOURNE 26 14 37 7 20 0 35 -9
WAGGA 33 16 45 7 24 0.4 19 -21
CANBERRA 30 13 42 3 22 1.3 20 -36
AUSTRI VIENNA 6 -1 18 -5 3 1.6 55 22
INNSBRUCK 10 0 20 -4 5 3.8 30 -13
BAHAMA NASSAU 28 19 30 15 24 2 1 -41
BARBAD BRIDGETOWN 29 23 31 21 26 0.5 32 -9
BELARU MINSK -1 -5 10 -18 -3 1.6 25 -9
BERMUD ST GEORGES 20 16 23 13 18 -0.1 102 -9
BOLIVI LA PAZ 16 4 20 2 10 1.5 56 -46
BRAZIL FORTALEZA 30 25 31 23 28 -0.3 165 -49
RECIFE 31 27 32 24 29 -0.4 8 -93
CAMPO GRANDE 31 21 34 19 26 0.1 133 -34
FRANCA 29 20 32 18 24 1.3 196 -32
RIO DE JANEIRO 32 24 35 23 28 0.4 32 -92
LONDRINA 33 22 36 19 27 2.9 129 -56
SANTA MARIA 31 21 36 14 26 1.1 220 89
TORRES 30 22 31 16 26 -0.5 92 -61
BULGAR SOFIA 8 -1 20 -11 3 1.7 39 5
BURKIN OUAGADOUGOU 37 21 41 18 29 1.4 0 -1
CANADA TORONTO 4 -4 18 -12 0 5.1 58 17
MONTREAL 0 -8 12 -16 -4 4.2 106 47
WINNIPEG -6 -14 5 -27 -10 3.9 0 -13
REGINA -5 -13 7 -34 -9 3 0 -12
SASKATOON -5 -13 7 -30 -9 3.6 0 -10
LETHBRIDGE *** *** *** *** *** ***** ***** ******
CALGARY -2 -11 16 -30 -7 -1 31 22
VANCOUVER 6 0 13 -7 3 -1.8 129 8
CANARY LAS PALMAS 22 16 27 13 19 0.7 7 -13
CHILE SANTIAGO 31 15 35 11 23 3 0 -5
CHINA HARBIN -5 -17 4 -23 -11 1.4 5 1
HAMI 8 -7 14 -13 0 3.9 3 2
LANCHOW *** *** 12 *** *** ***** ***** ******
BEIJING 8 -3 16 -10 3 2.8 6 1
TIENTSIN 8 -3 17 -9 3 2.5 7 2
LHASA 13 -2 19 -8 5 3.6 0 -1
KUNMING 18 6 24 2 12 1.7 2 -15
CHENGCHOW 12 1 22 -4 6 3.2 9 -3
YEHCHANG 12 4 24 -1 8 1.1 38 7
HANKOW 13 3 23 -3 8 1.3 67 8
CHUNGKING 14 8 21 5 11 0.9 28 8
CHIHKIANG 13 5 24 -2 9 1.8 79 29
WU HU 12 2 25 -3 7 2.2 38 -23
SHANGHAI 11 3 20 -3 7 1.1 21 -40
NANCHANG 14 7 25 1 10 3.1 43 -58
TAIPEI 20 15 27 11 17 1 129 -75
CANTON 21 12 29 5 16 1.7 27 -42
NANNING 20 13 30 9 16 2.2 9 -34
COLOMB BOGOTA 21 6 25 2 14 0.3 45 6
COTE D ABIDJAN 32 26 32 22 29 1.2 39 -2
CUBA HAVANA 28 16 31 11 22 0.5 0 -41
CYPRUS LARNACA 17 7 21 0 12 0.4 1 -43
CZECHR PRAGUE 5 -1 14 -7 2 2.3 17 -3
DENMAR COPENHAGEN 4 0 9 -7 2 1.5 27 3
Based on Preliminary Reports
International Weather and Crop SummaryTEMPERATURE
( C ) (MM)
PRECIP.
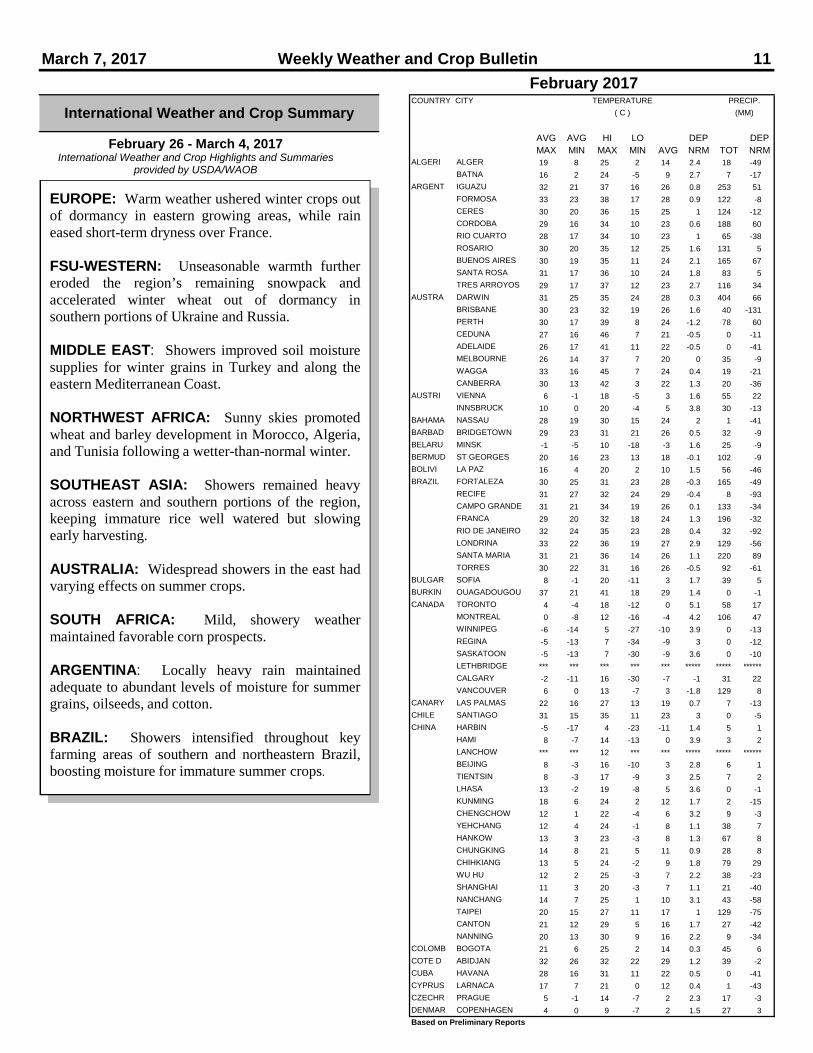
EUROPE: Warm weather ushered winter crops outof dormancy in eastern growing areas, while raineased short-term dryness over France.
FSU-WESTERN: Unseasonable warmth furthereroded the region’s remaining snowpack andaccelerated winter wheat out of dormancy insouthern portions of Ukraine and Russia.
MIDDLE EAST: Showers improved soil moisturesupplies for winter grains in Turkey and along theeastern Mediterranean Coast.
NORTHWEST AFRICA: Sunny skies promotedwheat and barley development in Morocco, Algeria,and Tunisia following a wetter-than-normal winter.
SOUTHEAST ASIA: Showers remained heavyacross eastern and southern portions of the region,keeping immature rice well watered but slowingearly harvesting.
AUSTRALIA: Widespread showers in the east hadvarying effects on summer crops.
SOUTH AFRICA: Mild, showery weathermaintained favorable corn prospects.
ARGENTINA: Locally heavy rain maintainedadequate to abundant levels of moisture for summergrains, oilseeds, and cotton.
BRAZIL: Showers intensified throughout keyfarming areas of southern and northeastern Brazil,boosting moisture for immature summer crops.
February 26 - March 4, 2017International Weather and Crop Highlights and Summaries
provided by USDA/WAOB
February 2017
12 Weekly Weather and Crop Bulletin March 7, 2017
COUNTRY CITY COUNTRY CITY
AVG AVG HI LO DEP DEP AVG AVG HI LO DEP DEPMAX MIN MAX MIN AVG NRM TOT NRM MAX MIN MAX MIN AVG NRM TOT NRM
EGYPT CAIRO 20 11 29 6 16 0.5 4 1 MARRAKECH 21 8 27 6 15 0.5 14 -17
ASWAN 25 10 33 6 17 -0.3 0 0 MOZAMB MAPUTO 33 23 38 19 28 1.6 156 41
ESTONI TALLINN 0 -5 7 -16 -2 1.9 34 -2 N KORE PYONGYANG 3 -7 10 -12 -2 0.7 24 10
ETHIOP ADDIS ABABA 24 12 28 8 18 1.1 57 20 NEW CA NOUMEA 29 24 32 22 27 0.5 72 -52
F GUIA CAYENNE 30 23 32 21 27 0.8 274 -45 NIGER NIAMEY 36 21 39 17 28 1.1 0 -1
FIJI NAUSORI 31 24 34 21 27 0.7 445 184 NORWAY OSLO -1 -5 5 -11 -3 2.7 51 6
FINLAN HELSINKI -1 -6 7 -17 -3 2.6 28 -5 NZEALA AUCKLAND 25 17 28 13 21 ***** 61 ******
FRANCE PARIS/ORLY 11 4 17 -2 7 2.9 42 2 WELLINGTON 21 15 25 9 18 ***** 84 ******
STRASBOURG 10 2 20 -4 6 2.9 47 14 P RICO SAN JUAN 30 23 32 22 26 1.5 35 -23
BOURGES 11 4 18 -3 7 2.8 45 -11 PAKIST KARACHI 30 15 35 11 23 2.3 0 -10
BORDEAUX 14 6 20 0 10 2.7 74 -1 PERU LIMA 30 23 32 21 26 2.8 1 1
TOULOUSE 14 5 18 1 10 2.8 36 -11 PHILIP MANILA 30 24 33 20 27 -0.7 36 23
MARSEILLE 15 8 20 2 12 3.8 21 -22 PNEWGU PORT MORESBY 31 25 34 24 28 1.0 105 -93
GABON LIBREVILLE 30 25 32 22 27 0.2 359 87 POLAND WARSAW 2 -3 14 -11 -1 0.4 32 10
GERMAN HAMBURG 5 1 12 -7 3 1.1 52 10 LODZ 2 -4 14 -12 -1 -0.1 40 10
BERLIN 5 0 13 -8 3 1.1 33 0 KATOWICE 4 -2 16 -10 1 1.2 30 -5
DUSSELDORF 9 3 16 -4 6 2.7 55 4 PORTUG LISBON 16 10 20 5 13 1.0 77 -7
LEIPZIG 6 0 14 -6 3 3.2 29 -1 ROMANI BUCHAREST 6 -3 18 -14 1 0.8 39 9
DRESDEN 6 0 14 -7 3 2.7 30 -6 RUSSIA ST.PETERSBURG -2 -5 6 -18 -4 2.4 40 9
STUTTGART 9 1 18 -5 5 3.4 22 -14 KAZAN -5 -10 4 -21 -7 3.2 53 22
NURNBERG 8 0 16 -5 4 3.3 21 -13 MOSCOW -3 -7 5 -23 -5 1.8 40 3
AUGSBURG 7 -1 19 -7 3 3.0 19 -20 YEKATERINBURG -8 -14 4 -29 -11 0.8 14 -5
GREECE THESSALONIKA 12 5 19 -3 9 1.7 28 -12 OMSK -11 -18 2 -31 -15 0.9 20 4
LARISSA 14 3 22 -4 8 1.8 24 -14 BARNAUL -7 -18 3 -33 -13 1.5 20 0
ATHENS 15 8 20 2 12 1.4 6 -28 KHABAROVSK -9 -19 -2 -29 -14 2.1 19 8
GUADEL RAIZET 29 21 30 17 25 0.6 59 -8 VLADIVOSTOK -4 -9 7 -15 -7 2.6 18 2
HONGKO HONG KONG INT 21 15 27 10 18 1.4 44 1 VOLGOGRAD -3 -10 9 -25 -6 0.5 35 12
HUNGAR BUDAPEST 6 0 17 -4 3 1.4 36 11 ASTRAKHAN 1 -8 17 -19 -4 0.9 17 8
ICELAN REYKJAVIK 5 2 8 -4 3 3.0 103 17 ORENBURG -9 -16 3 -29 -12 0.1 33 14
INDIA AMRITSAR 24 9 29 4 16 2.1 3 -32 S AFRI JOHANNESBURG 24 15 28 13 20 0.9 116 7
NEW DELHI 26 12 33 8 19 1.9 1 -20 DURBAN 28 22 33 17 25 1.0 130 -2
AHMEDABAD 32 16 37 10 24 1.8 0 ****** CAPE TOWN 28 17 35 14 23 1.8 1 -14
INDORE 30 14 35 9 22 1.8 0 -4 S KORE SEOUL 4 -4 12 -9 0 -0.2 11 -16
CALCUTTA 30 18 34 14 24 1.4 0 -25 SAMOA PAGO PAGO 30 26 32 23 28 0.2 467 158
VERAVAL 32 18 39 13 25 2.4 0 -1 SENEGA DAKAR 24 18 27 17 21 0.3 0 0
BOMBAY 34 18 39 14 26 1.2 0 ****** SPAIN VALLADOLID 13 4 19 0 8 2.0 34 2
POONA 33 14 37 12 24 1.6 0 -2 MADRID 13 4 20 -2 9 1.3 46 22
BEGAMPET 34 18 38 16 26 0.5 0 -9 SEVILLE 18 10 22 4 14 1.2 55 15
VISHAKHAPATNAM 31 22 32 20 27 0.5 0 -13 SWITZE ZURICH 8 1 19 -2 4 3.0 78 9
MADRAS 32 20 36 19 26 -0.3 0 -15 GENEVA 10 1 19 -4 5 2.6 49 -23
MANGALORE 34 23 37 19 28 0.9 0 -3 SYRIA DAMASCUS 15 0 22 -8 8 -0.1 10 -13
INDONE SERANG 31 24 34 23 28 0.4 343 120 TAHITI PAPEETE 31 25 33 24 28 1.0 375 159
IRELAN DUBLIN 9 4 13 -4 6 0.8 42 -10 TANZAN DAR ES SALAAM 33 26 35 23 30 1.6 108 51
ITALY MILAN 10 4 16 0 7 2.3 56 7 THAILA PHITSANULOK 34 20 37 18 27 -0.4 21 11
VENICE 10 4 14 0 7 2.1 210 165 BANGKOK 35 25 37 22 30 1.4 0 -18
GENOA 13 9 16 5 11 1.8 70 24 TOGO LOME 33 27 34 24 30 1.7 0 -32
ROME 16 7 17 0 11 2.2 39 -27 TRINID PORT OF SPAIN 32 22 33 20 27 1.3 36 0
NAPLES 16 8 19 2 12 2.4 39 -46 TUNISI TUNIS 18 9 23 5 13 1.4 37 -21
JAMAIC KINGSTON 30 23 32 21 27 0.7 8 -16 TURKEY ISTANBUL 10 4 17 -3 7 1.4 35 -23
JAPAN SAPPORO 1 -5 5 -11 -2 1.2 61 -36 ANKARA 7 -4 18 -17 1 1.1 4 -29
NAGOYA 10 2 15 -2 6 1.0 49 -17 TURKME ASHKHABAD 7 0 25 -5 4 -0.7 78 50
TOKYO 12 3 21 -2 7 1.2 16 -44 UKINGD ABERDEEN 8 3 14 -3 6 1.9 84 30
YOKOHAMA 12 4 19 0 8 1.6 16 -54 LONDON 10 5 18 -1 8 2.2 40 3
KYOTO 10 2 15 0 6 0.4 41 -41 UKRAIN KIEV 0 -5 11 -18 -3 0.6 33 -6
OSAKA 10 3 18 -1 7 0.6 49 -11 LVOV 3 -4 15 -15 -1 1.4 49 7
KAZAKH KUSTANAY -11 -18 3 -32 -15 0.1 28 14 KIROVOGRAD 0 -6 13 -17 -3 0.8 17 -9
TSELINOGRAD -10 -17 1 -32 -13 0.9 20 7 ODESSA 3 -2 16 -11 1 0.8 20 -14
KARAGANDA -8 -17 3 -32 -13 0.4 33 14 KHARKOV -2 -6 8 -22 -4 0.7 24 -9
KENYA NAIROBI 29 15 30 14 22 1.6 9 -38 UZBEKI TASHKENT 8 -1 20 -10 3 0.8 119 63
LITHUA KAUNAS 1 -3 10 -14 -1 1.5 32 1 YUGOSL BELGRADE 10 2 23 -6 6 2.5 24 -14
LUXEMB LUXEMBOURG 7 2 12 -2 5 3.0 54 -13 ZAMBIA LUSAKA 26 20 30 17 23 0.5 130 -59
MALAYS KUALA LUMPUR 33 25 35 24 29 2.0 112 -65 ZIMBAB KADOMA 28 18 30 15 23 -0.5 185 23
MALI BAMAKO 37 22 40 17 30 1.3 0 -1
MARSHA MAJURO 30 26 30 25 28 0.6 240 61
MARTIN LAMENTIN 30 22 30 19 26 1.1 43 -108
MAURIT NOUAKCHOTT 31 15 36 12 23 0.3 0 -3
MEXICO GUADALAJARA 25 10 30 7 17 0.4 1 -6
TLAXCALA 23 6 27 3 15 0.5 0 -5
ORIZABA 25 14 31 9 19 3.5 15 -18
MOROCC CASABLANCA 18 11 22 7 15 1.2 101 59
Based on Preliminary Reports
(MM) (MM)
TEMPERATURE
( C )
TEMPERATURE
( C )
PRECIP. PRECIP.
February 2017

March 7, 2017 Weekly Weather and Crop Bulletin 13
For additional information contact: [email protected]
Unseasonably warm weather prevailed, with beneficial rain arriving across key winter crop areas of central and western Europe. Temperatures during the period averaged 5 to 8°C above normal from Germany into Poland and the Balkans, accelerating winter wheat and rapeseed out of dormancy 2 to 4 weeks ahead of average. The early winter crop greening has heightened the need for moisture across much of southeastern Europe following a drier-than-normal winter. In contrast, moderate to heavy rain (15-70 mm) improved soil moisture for vegetative winter wheat in France, while lighter showers (4-50
mm) improved topsoil moisture for winter crops in Germany. Likewise, moderate to heavy rain (10-50 mm, locally more) in the United Kingdom benefited early-developing winter crops, while lighter, variable shower activity (2-44 mm) in Spain was generally beneficial for vegetative wheat and barley. Warmer-than-normal weather (1-4°C above normal) in England, France, and northern Spain encouraged a rapid winter crop development pace but left wheat and rapeseed in typically-colder northern growing areas more vulnerable to any potential late-season hard freezes.
EUROPE
14 Weekly Weather and Crop Bulletin March 7, 2017
For additional information contact: [email protected]
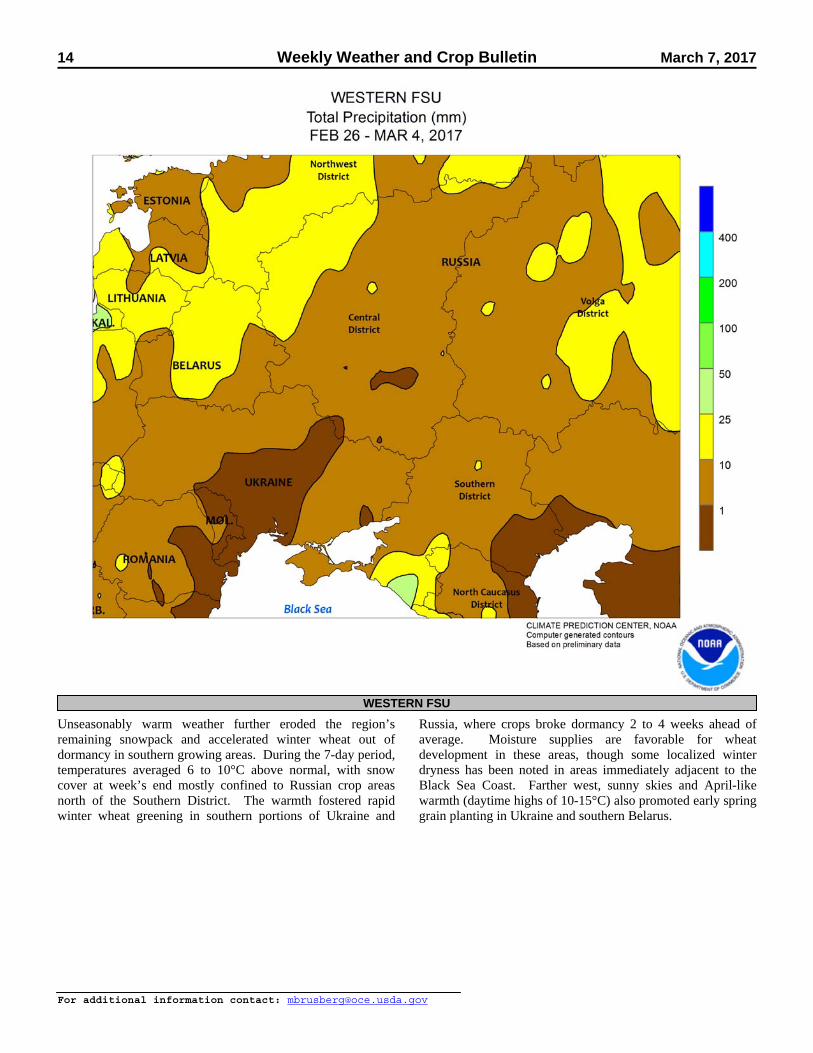
Unseasonably warm weather further eroded the region’s remaining snowpack and accelerated winter wheat out of dormancy in southern growing areas. During the 7-day period, temperatures averaged 6 to 10°C above normal, with snow cover at week’s end mostly confined to Russian crop areas north of the Southern District. The warmth fostered rapid winter wheat greening in southern portions of Ukraine and
Russia, where crops broke dormancy 2 to 4 weeks ahead of average. Moisture supplies are favorable for wheat development in these areas, though some localized winter dryness has been noted in areas immediately adjacent to the Black Sea Coast. Farther west, sunny skies and April-like warmth (daytime highs of 10-15°C) also promoted early spring grain planting in Ukraine and southern Belarus.
WESTERN FSU

March 7, 2017 Weekly Weather and Crop Bulletin 15
For additional information contact: [email protected]
Warm weather hastened winter grains out of dormancy in Turkey, while showers improved topsoil moisture for crop development over central and western growing areas. Temperatures averaged up to 7°C above normal in Turkey, with daytime highs in the middle and upper teens (degrees C) accelerating winter grains out of dormancy 2 to 3 weeks ahead of normal. Winter dryness has renewed concerns for winter grain growth on Turkey’s Anatolian Plateau, though light to moderate showers (5-40 mm) during the past week provided
much-needed topsoil moisture. Farther south, light to moderate showers (10-30 mm) improved soil moisture for vegetative winter grains from the eastern Mediterranean Coast into central and northern Iraq. In Iran, weekly average temperatures up to 5°C above normal reduced winter grain cold hardiness in the north and encouraged some crops to begin breaking dormancy. However, lingering snow cover coupled with weekly average temperatures below 5°C in northwestern Iran kept crops dormant in this part of the country.
MIDDLE EAST

16 Weekly Weather and Crop Bulletin March 7, 2017
For additional information contact: [email protected]
Sunny skies and near- to above-normal temperatures sustained good to excellent winter grain prospects across the region. In Morocco, drier weather following last week’s showers promoted the development of vegetative to heading wheat and barley. Likewise, sunny skies favored winter grain development in Algeria and Tunisia. Although topsoils have
begun to dry in Algeria following a much-drier-than-normal February, moisture reserves remained overall favorable due to persistent heavy rainfall in January. Temperatures up to 3°C above normal encouraged faster-than-normal crop development across most of the region save for near-normal temperatures in western and northern Morocco.
NORTHWESTERN AFRICA

March 7, 2017 Weekly Weather and Crop Bulletin 17
For additional information contact: [email protected]
Showers remained heavy across eastern and southern portions of the region. In the eastern Philippines, 25 to over 200 mm of rain maintained abundant soil moisture for immature rice but slowed harvesting of rice sown earlier in the season. Similarly in Java, Indonesia, 25 to 100 mm of rain kept rice sown in the latter part of the season well watered as harvesting of early-
season rice was beginning. In addition, late-season rainfall in both the Philippines and Java improved irrigation reserves for rice sown in the spring. Elsewhere, widespread showers (50-150 mm or more) in oil palm areas of Malaysia and Indonesia maintained good long-term moisture conditions for trees and improved summer yield prospects.
SOUTHEAST ASIA
18 Weekly Weather and Crop Bulletin March 7, 2017
For additional information contact: [email protected]
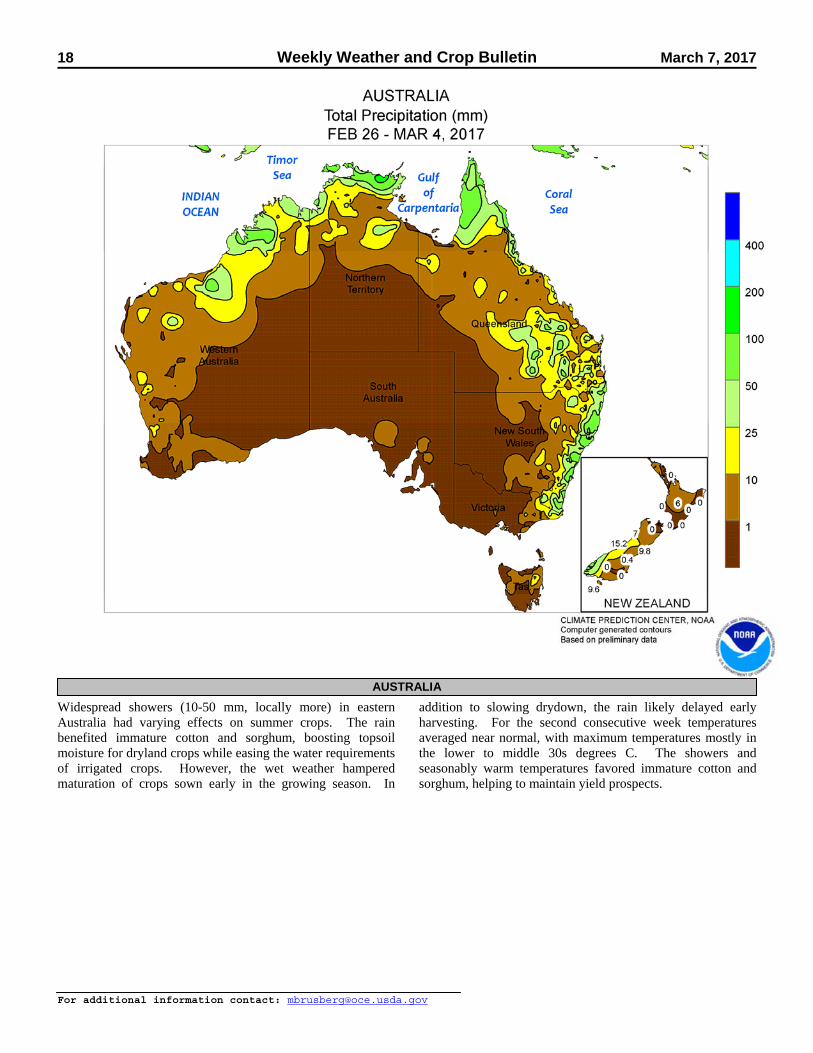
Widespread showers (10-50 mm, locally more) in eastern Australia had varying effects on summer crops. The rain benefited immature cotton and sorghum, boosting topsoil moisture for dryland crops while easing the water requirements of irrigated crops. However, the wet weather hampered maturation of crops sown early in the growing season. In
addition to slowing drydown, the rain likely delayed early harvesting. For the second consecutive week temperatures averaged near normal, with maximum temperatures mostly in the lower to middle 30s degrees C. The showers and seasonably warm temperatures favored immature cotton and sorghum, helping to maintain yield prospects.
AUSTRALIA

March 7, 2017 Weekly Weather and Crop Bulletin 19
For additional information contact: [email protected]
Mild, showery weather maintained favorable prospects for corn and other rain-fed summer crops in major commercial farming areas of the eastern interior. Rainfall was lighter than the previous week, totaling 5 to 25 mm from North West and Free State to Mpumalanga, as well as neighboring locations in Limpopo and KwaZulu-Natal. Late-week showers (greater than 25 mm) developed over eastern sections of North West, adding to accumulations from the earlier rain. Weekly temperatures averaged within 1°C of normal throughout these
areas, with daytime highs reaching the upper 20s and lower 30s (degrees C). Scattered, generally light showers (5-25 mm, locally higher) also lingered in coastal farming areas from Eastern Cape to eastern Mpumalanga as seasonable warmth (highs reaching the middle 30s) spurred development of sugarcane and other crops. Elsewhere, seasonable warmth and dryness spurred rapid development of irrigated corn and cotton in Northern Cape’s Orange River Valley, and hastened ripening of tree and vine crops in Western Cape.
SOUTH AFRICA
20 Weekly Weather and Crop Bulletin March 7, 2017
For additional information contact: [email protected]
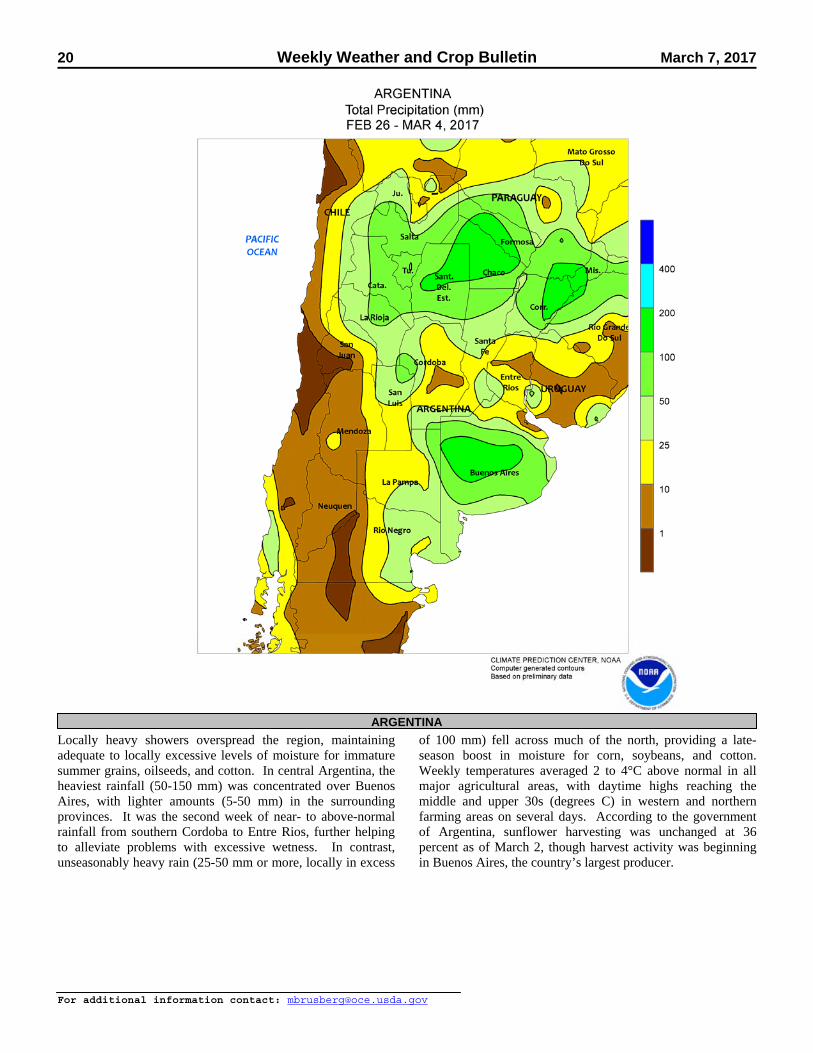
Locally heavy showers overspread the region, maintaining adequate to locally excessive levels of moisture for immature summer grains, oilseeds, and cotton. In central Argentina, the heaviest rainfall (50-150 mm) was concentrated over Buenos Aires, with lighter amounts (5-50 mm) in the surrounding provinces. It was the second week of near- to above-normal rainfall from southern Cordoba to Entre Rios, further helping to alleviate problems with excessive wetness. In contrast, unseasonably heavy rain (25-50 mm or more, locally in excess
of 100 mm) fell across much of the north, providing a late-season boost in moisture for corn, soybeans, and cotton. Weekly temperatures averaged 2 to 4°C above normal in all major agricultural areas, with daytime highs reaching the middle and upper 30s (degrees C) in western and northern farming areas on several days. According to the government of Argentina, sunflower harvesting was unchanged at 36 percent as of March 2, though harvest activity was beginning in Buenos Aires, the country’s largest producer.
ARGENTINA

March 7, 2017 Weekly Weather and Crop Bulletin 21
For additional information contact: [email protected]
Increasing rainfall maintained overall favorable prospects for summer crops, most notably soybeans and corn. Light to moderate rain (10-50 mm, locally higher) fell from Mato Grosso do Sul and Sao Paulo southward, with the highest amounts (greater than 25 mm) concentrated over southern Parana, Santa Catarina, northern Rio Grande do Sul, and eastern farming areas of Parana. According to the government of Rio Grande do Sul, soybeans — typically planted later than in other southern states — were 88 percent flowering to filling as of February 23 and could still benefit from the rainfall. Farther north, rainfall also intensified from Minas Gerais northward through western Bahia,
with amounts totaling 25 to 100 mm in most areas. The rainfall in these areas also benefited late-planted soybeans, as well as sugarcane, coffee, and other summer crops, including second-crop corn and cotton. Meanwhile, seasonal showers (25-100 mm) maintained favorable second-crop corn prospects in the Center-West Region. Summer warmth (daytime highs in the lower and middle 30s degrees C) fostered rapid rates of development throughout nearly all major agricultural areas. According to the government of Mato Gross, corn was 92 percent planted as of March 3, nearly 9 points ahead of last year’s pace.
BRAZIL
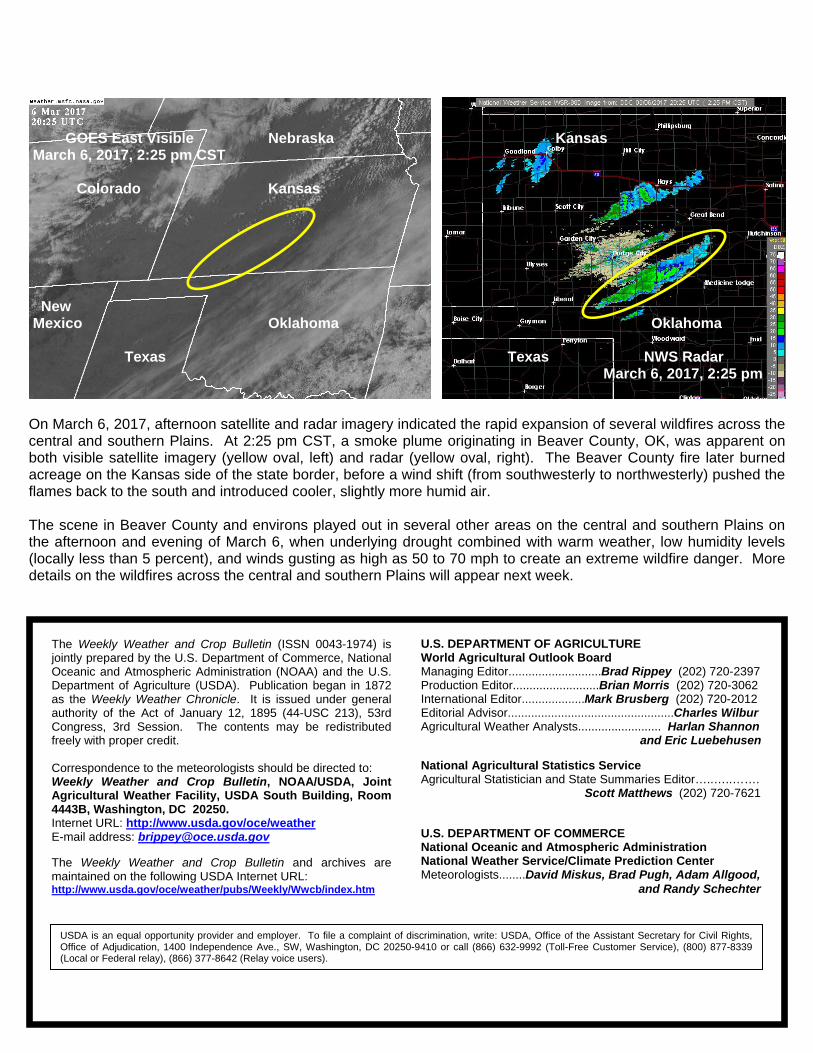
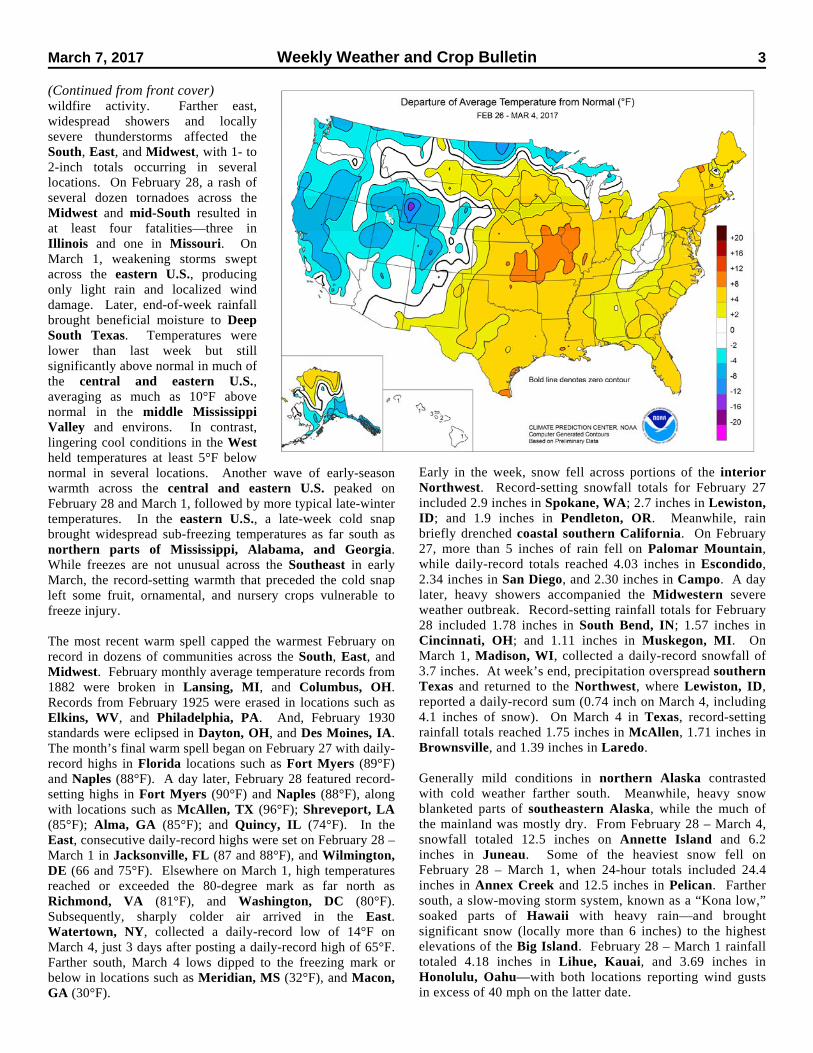
GOES East Visible Nebraska Kansas March 6, 2017, 2:25 pm CST Colorado Kansas New Mexico Oklahoma Oklahoma Texas Texas NWS Radar March 6, 2017, 2:25 pm On March 6, 2017, afternoon satellite and radar imagery indicated the rapid expansion of several wildfires across the central and southern Plains. At 2:25 pm CST, a smoke plume originating in Beaver County, OK, was apparent on both visible satellite imagery (yellow oval, left) and radar (yellow oval, right). The Beaver County fire later burned acreage on the Kansas side of the state border, before a wind shift (from southwesterly to northwesterly) pushed the flames back to the south and introduced cooler, slightly more humid air. The scene in Beaver County and environs played out in several other areas on the central and southern Plains on the afternoon and evening of March 6, when underlying drought combined with warm weather, low humidity levels (locally less than 5 percent), and winds gusting as high as 50 to 70 mph to create an extreme wildfire danger. More details on the wildfires across the central and southern Plains will appear next week.
The Weekly Weather and Crop Bulletin (ISSN 0043-1974) is jointly prepared by the U.S. Department of Commerce, National Oceanic and Atmospheric Administration (NOAA) and the U.S. Department of Agriculture (USDA). Publication began in 1872 as the Weekly Weather Chronicle. It is issued under general authority of the Act of January 12, 1895 (44-USC 213), 53rd Congress, 3rd Session. The contents may be redistributed freely with proper credit. Correspondence to the meteorologists should be directed to: Weekly Weather and Crop Bulletin, NOAA/USDA, Joint Agricultural Weather Facility, USDA South Building, Room 4443B, Washington, DC 20250. Internet URL: http://www.usda.gov/oce/weather E-mail address: [email protected] The Weekly Weather and Crop Bulletin and archives are maintained on the following USDA Internet URL: http://www.usda.gov/oce/weather/pubs/Weekly/Wwcb/index.htm
U.S. DEPARTMENT OF AGRICULTURE World Agricultural Outlook Board Managing Editor............................Brad Rippey (202) 720-2397 Production Editor..........................Brian Morris (202) 720-3062 International Editor...................Mark Brusberg (202) 720-2012 Editorial Advisor..................................................Charles Wilbur Agricultural Weather Analysts......................... Harlan Shannon and Eric Luebehusen National Agricultural Statistics Service Agricultural Statistician and State Summaries Editor…..…..……. Scott Matthews (202) 720-7621 U.S. DEPARTMENT OF COMMERCE National Oceanic and Atmospheric Administration National Weather Service/Climate Prediction Center Meteorologists........David Miskus, Brad Pugh, Adam Allgood,
and Randy Schechter
USDA is an equal opportunity provider and employer. To file a complaint of discrimination, write: USDA, Office of the Assistant Secretary for Civil Rights, Office of Adjudication, 1400 Independence Ave., SW, Washington, DC 20250-9410 or call (866) 632-9992 (Toll-Free Customer Service), (800) 877-8339 (Local or Federal relay), (866) 377-8642 (Relay voice users).