Volume 103, No. 35 …usda.mannlib.cornell.edu/usda/waob/weather_weekly//2010s/2016/... · August...
32
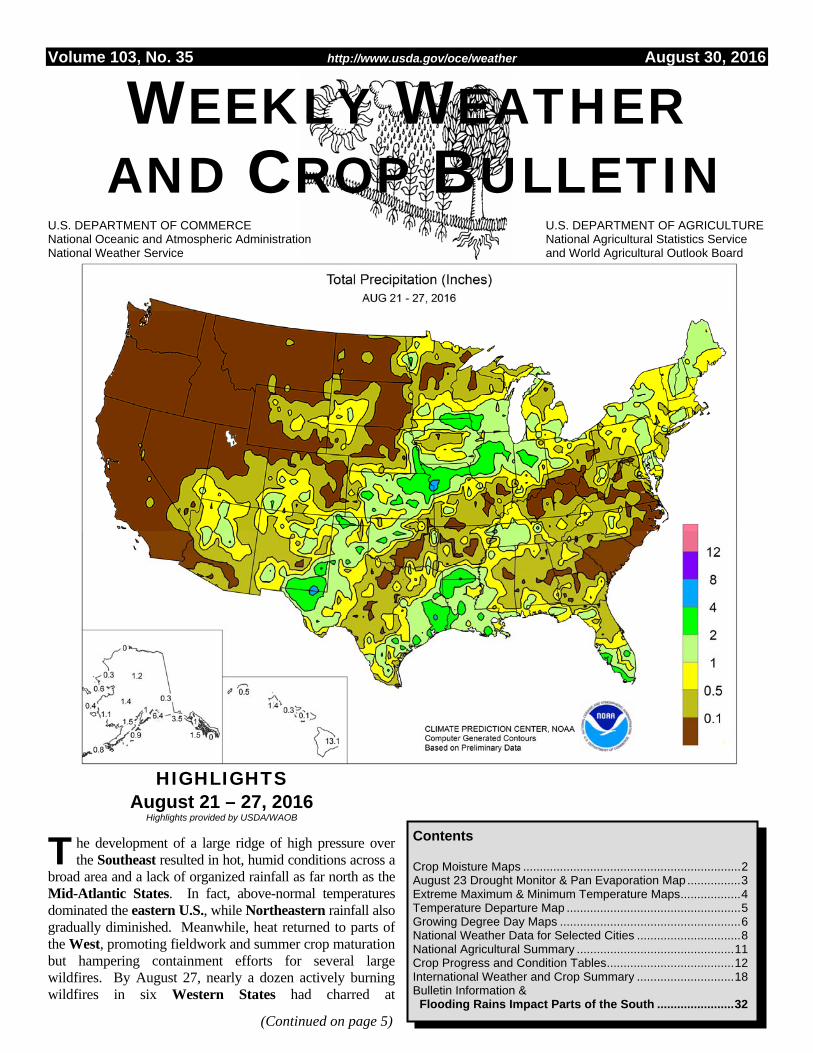
Volume 103, No. 35 http://www.usda.gov/oce/weather August 30, 2016 (Continued on page 5) Contents Crop Moisture Maps ................................................................. 2 August 23 Drought Monitor & Pan Evaporation Map ................ 3 Extreme Maximum & Minimum Temperature Maps.................. 4 Temperature Departure Map .................................................... 5 Growing Degree Day Maps ...................................................... 6 National Weather Data for Selected Cities ............................... 8 National Agricultural Summary ............................................... 11 Crop Progress and Condition Tables...................................... 12 International Weather and Crop Summary ............................. 18 Bulletin Information & Flooding Rains Impact Parts of the South ....................... 32 WEEKLY WEATHER AND CROP BULLETIN he development of a large ridge of high pressure over the Southeast resulted in hot, humid conditions across a broad area and a lack of organized rainfall as far north as the Mid-Atlantic States. In fact, above-normal temperatures dominated the eastern U.S., while Northeastern rainfall also gradually diminished. Meanwhile, heat returned to parts of the West, promoting fieldwork and summer crop maturation but hampering containment efforts for several large wildfires. By August 27, nearly a dozen actively burning wildfires in six Western States had charred at T U.S. DEPARTMENT OF COMMERCE National Oceanic and Atmospheric Administration National Weather Service U.S. DEPARTMENT OF AGRICULTURE National Agricultural Statistics Service and World Agricultural Outlook Board HIGHLIGHTS August 21 – 27, 2016 Highlights provided by USDA/WAOB
-
Upload
truongdang -
Category
Documents
-
view
216 -
download
3
Transcript of Volume 103, No. 35 …usda.mannlib.cornell.edu/usda/waob/weather_weekly//2010s/2016/... · August...
Volume 103, No. 35 http://www.usda.gov/oce/weather August 30, 2016
(Continued on page 5)
Contents
Crop Moisture Maps ................................................................. 2 August 23 Drought Monitor & Pan Evaporation Map ................ 3 Extreme Maximum & Minimum Temperature Maps .................. 4 Temperature Departure Map .................................................... 5 Growing Degree Day Maps ...................................................... 6 National Weather Data for Selected Cities ............................... 8 National Agricultural Summary ............................................... 11 Crop Progress and Condition Tables ...................................... 12 International Weather and Crop Summary ............................. 18 Bulletin Information & Flooding Rains Impact Parts of the South ....................... 32
WEEKLY WEATHER AND CROP BULLETIN
he development of a large ridge of high pressure over the Southeast resulted in hot, humid conditions across a
broad area and a lack of organized rainfall as far north as the Mid-Atlantic States. In fact, above-normal temperatures dominated the eastern U.S., while Northeastern rainfall also gradually diminished. Meanwhile, heat returned to parts of the West, promoting fieldwork and summer crop maturation but hampering containment efforts for several large wildfires. By August 27, nearly a dozen actively burning wildfires in six Western States had charred at
T
U.S. DEPARTMENT OF COMMERCE National Oceanic and Atmospheric Administration National Weather Service
U.S. DEPARTMENT OF AGRICULTURENational Agricultural Statistics Service and World Agricultural Outlook Board
HIGHLIGHTS August 21 – 27, 2016
Highlights provided by USDA/WAOB
2 Weekly Weather and Crop Bulletin August 30, 2016

August 30, 2016 Weekly Weather and Crop Bulletin 3
SL
SL
L
S
SSL
SL
SS
S
S
S
S
S
S
SL
S
S
SLS
SL
S
S
S
S
S
S
L
L
The Drought Monitor focuses on broad-scale conditions. Local conditions may vary. See accompanying text summary for forecast statements.
S
http://droughtmonitor.unl.edu/
U.S. Drought Monitor August 23, 2016
Valid 8 a.m. EDT
(Released Thursday, Aug. 25, 2016)
Intensity:D0 Abnormally DryD1 Moderate DroughtD2 Severe DroughtD3 Extreme DroughtD4 Exceptional Drought
Author: Brad Rippey
Drought Impact Types:
S = Short-Term, typically less than 6 months (e.g. agriculture, grasslands)
L = Long-Term, typically greater than 6 months (e.g. hydrology, ecology)
Delineates dominant impacts
U.S. Department of Agriculture
0.34
0.110.55
0.18
0.44
0.48
0.43
0.25 0.20
0.27
0.200.20
0.28
0.29
0.34
0.28
0.16
0.18
0.24
0.29
0.24
0.24
0.03
0.11
0.14
0.25
0.30
0.09
0.17
0.35
0.31
0.31
0.330.22
0.32
0.18
0.37
0.35
0.25
0.23
0.06
0.22
0.29
0.200.31
0.25
0.260.29
0.28
0.18
0.17
0.30
0.23
0.19
0.28
0.16
0.34
0.17
0.28
0.42
0.13
0.11
0.220.14
0.42
0.22
0.15
0.26
0.20
0.25
0.23
0.14
0.19
0.20
0.37
0.23
0.21
0.37
0.24
0.24
0.18
0.37
0.31
0.20
0.19
0.16
0.07
0.13
0.36
0.22
0.55
0.20
0.33
0.17
0.47
0.18
0.16
0.17
0.24
0.27
0.43
0.37
0.53
0.15
0.17
0.20
0.29
0.13
0.24
0.30
0.17
0.41
0.40
0.33
0.36
0.23
0.27
0.29
0.29
0.49
0.41
0.16
0.51
0.41
0.30
0.31
0.42
0.19
0.76
0.51
0.28
0.24
0.40
0.30
0.33
0.15
0.18
Data obtained from the NWS Cooperative Observer Network.
USDA Agricultural Weather Assessments
Based on preliminary data
Average Pan Evaporation (inches/day)August 21 - 27, 2016
4 Weekly Weather and Crop Bulletin August 30, 2016

August 30, 2016 Weekly Weather and Crop Bulletin 5 (Continued from front cover) least 20,000 acres of vegetation apiece. However, the monsoon circulation helped to suppress temperatures in the Southwest due to cloudiness and showers. Farther east, below-normal temperatures covered the nation’s mid-section, accompanied by widespread showers. The axis of heaviest rainfall stretched from the southern High Plains to the east-central Plains, benefiting pastures and immature summer crops, but causing local flooding. On the northern Plains, however, conditions remained dry enough to allow small grain harvest activities to proceed. Elsewhere, Midwestern conditions varied from cooler-than-normal weather in the western Corn Belt to late-season warmth in the Ohio Valley and the lower Great Lakes region. Locally heavy rain fell in parts of the Midwest, generally stretching northeastward from the southwestern Corn Belt. As the week began, cool conditions blanketed the northwestern and central U.S. Daily-record lows for August 21 dipped to 38°F in Casper, WY; 43°F in North Platte, NE; and 46°F in Hill City, KS. Just a few days later, however, record-setting heat returned to the Pacific Northwest. In western Washington, Quillayute posted a trio of daily-record highs (91, 92, and 86°F) from August 24-26. Consecutive daily-record highs occurred on August 25-26 in locations such as Salem, OR (97 and 99°F), and Seattle, WA (91 and 92°F). Meanwhile, consistent heat prevailed in much of the eastern U.S., where selected daily-record highs climbed to 99°F (on August 23) in Sarasota-Bradenton, FL; 99°F (on August 26) in Richmond, VA; 98°F (on August 27) in Raleigh-Durham, NC. Meanwhile, cloudiness and showers covered the western Gulf Coast region early in the week and the Southwest at week’s end. Victoria, TX, reported a record-low maximum temperature of 80°F on August 21; Cedar City, UT, achieved the same feat with a high of just 71°F on August 27. Early-week showers brought limited drought relief to the Northeast; daily-record rainfall totals for August 21 reached 1.45 inches in Reading, PA, and 1.30 inches in Watertown, NY. Meanwhile, lingering showers in the western and central Gulf Coast States maintained a sluggish fieldwork pace and further threatened the quality of unharvested crops, such as rice. In fact, heavy rain on August 25 resulted in daily-record totals in locations such as El Dorado, AR (4.71 inches), and Shreveport, LA (2.17 inches). Shreveport received measurable rain on 9 consecutive days from August 14-22, tying an August record originally set in 2008. August rainfall records were broken at several Arkansas locations, including Mount Ida—where the previous record of 12.00 inches had been set in
1915. Farther north, a cold front sweeping across northern sections of the Rockies and Plains produced high winds; a gust to 74 mph in Two Medicine, MT, was the highest in that location during August since the beginning of the century. Heavy rain eventually reached parts of the Midwest due to a combination of approaching cold fronts and moisture being channeled into the region by the monsoon circulation and the Southeastern ridge of high pressure. Selected Midwestern daily-record amounts totaled 2.45 inches (on August 23) in Sioux City, IA; 1.96 inches (on August 26) in Kansas City, MO; and 1.47 inches (on August 24) in Quincy, IL. Decorah, IA, was deluged by 8.06 inches of rain on August 23-24, breaking a 24-hour rainfall record in that location (previously, 6.60 inches on June 7-8, 2008). South Bend, IN, received 1.15 inches on August 27, further padding its new August rainfall record (previously, 8.88 inches in 2007). Areas from central Indiana to northwestern Ohio also endured a tornado outbreak on August 24. Toward week’s end, shower activity increased in coverage and intensity in the Southwest, where Flagstaff, AZ, collected consecutive daily-record rainfall amounts (1.41 and 0.94 inches) on August 26-27. Alaska’s warm, showery summer continued. Anchorage noted a daily-record rainfall of 1.02 inches on August 22, followed by a daily-record high of 73°F on August 27. Other Alaskan daily-record highs on the 27th included 78°F in Yakutat and 76°F in Juneau and King Salmon. Meanwhile, weekly rainfall totaled 1.67 inches in King Salmon, 1.61 inches in Anchorage, and 1.36 inches in McGrath. Farther south, parts of Hawaii experienced early- to mid-week downpours, followed by a return to more typical, late-summer weather. On the Big Island, Hilo netted 11.19 inches of rain on August 22-23. Through the 27th, Hilo’s month-to-date rainfall reached 19.01 inches, 219 percent of normal.

6 Weekly Weather and Crop Bulletin August 30, 2016
August 30, 2016 Weekly Weather and Crop Bulletin 7

8 Weekly Weather and Crop Bulletin August 30, 2016
NUMBER OF DAYS
AV
ER
AG
E
MA
XIM
UM
AV
ER
AG
E
MIN
IMU
M
EX
TR
EM
E
HIG
H
EX
TR
EM
E
LOW
AV
ER
AG
E
DE
PA
RT
UR
E
F
RO
M N
OR
MA
L
WE
EK
LY
TO
TA
L, I
N.
DE
PA
RT
UR
E
F
RO
M N
OR
MA
L
GR
EA
TE
ST
IN
24
-HO
UR
, IN
.
TO
TA
L, I
N.,
SIN
CE
JU
N 1
PC
T.
NO
RM
AL
SIN
CE
JU
N 1
TO
TA
L, I
N.,
S
INC
E J
AN
1
PC
T.
NO
RM
AL
SIN
CE
JA
N 1
AV
ER
AG
E
MA
XIM
UM
AV
ER
AG
E
MIN
IMU
M
90 A
ND
AB
OV
E
32 A
ND
BE
LOW
.01
INC
H
O
R M
OR
E
.50
INC
H
O
R M
OR
E
AL BIRMINGHAM 92 74 95 71 83 4 0.55 -0.17 0.45 13.50 114 35.11 95 92 51 5 0 2 0HUNTSVILLE 93 72 98 68 82 4 1.73 1.00 1.27 14.19 124 32.48 85 87 51 5 0 3 1MOBILE 92 74 95 72 83 2 0.16 -1.24 0.16 18.67 111 46.84 102 96 59 7 0 1 0MONTGOMERY 96 74 97 72 85 4 0.20 -0.58 0.12 10.85 87 33.22 88 87 42 7 0 2 0
AK ANCHORAGE 66 55 73 53 60 5 1.61 0.91 1.02 9.73 187 11.89 140 90 72 0 0 5 1BARROW 47 37 64 33 42 4 0.02 -0.20 0.01 2.34 115 3.68 142 87 66 0 0 2 0FAIRBANKS 69 53 72 49 61 7 0.28 -0.09 0.11 9.82 212 11.70 176 95 82 0 0 5 0JUNEAU 67 52 76 46 60 5 0.97 -0.31 0.31 12.71 106 35.50 115 92 80 0 0 4 0KODIAK 63 55 73 49 59 4 0.87 -0.26 0.28 9.22 70 51.99 118 94 83 0 0 6 0NOME 55 46 60 35 50 0 0.57 -0.17 0.46 7.18 119 10.26 106 91 82 0 0 3 0
AZ FLAGSTAFF 70 46 77 44 58 -5 2.74 2.15 1.38 10.17 190 17.19 116 98 43 0 0 5 2PHOENIX 100 78 103 74 89 -2 0.14 -0.03 0.10 2.17 115 4.05 82 50 30 7 0 2 0PRESCOTT 78 56 83 54 67 -3 2.52 1.85 1.09 7.77 126 11.56 89 92 40 0 0 5 2TUCSON 95 72 99 68 83 -2 0.02 -0.43 0.02 6.07 139 8.60 114 59 30 7 0 1 0
AR FORT SMITH 89 70 95 63 80 -1 0.04 -0.55 0.04 9.28 97 26.49 96 87 50 3 0 1 0LITTLE ROCK 92 74 96 68 83 3 0.14 -0.55 0.11 16.76 173 45.95 143 88 52 5 0 2 0
CA BAKERSFIELD 96 69 99 64 83 2 0.00 0.00 0.00 0.00 0 4.10 89 40 27 7 0 0 0FRESNO 95 65 99 61 80 1 0.00 0.00 0.00 0.06 25 9.08 115 58 35 7 0 0 0LOS ANGELES 75 64 76 63 70 -1 0.00 -0.03 0.00 0.00 0 6.00 63 82 65 0 0 0 0REDDING 98 63 102 60 81 3 0.00 -0.06 0.00 2.46 283 30.63 139 62 36 7 0 0 0SACRAMENTO 86 56 88 54 71 -3 0.00 -0.02 0.00 0.00 0 12.75 106 89 32 0 0 0 0SAN DIEGO 76 66 78 62 71 -2 0.00 -0.02 0.00 0.00 0 5.01 65 83 69 0 0 0 0SAN FRANCISCO 70 58 73 56 64 0 0.00 -0.01 0.00 0.00 0 12.44 93 81 67 0 0 0 0STOCKTON 90 57 93 54 74 -2 0.00 0.00 0.00 0.00 0 12.12 134 82 50 5 0 0 0
CO ALAMOSA 72 39 75 35 56 -5 0.20 -0.05 0.15 1.51 60 5.88 126 94 46 0 0 2 0CO SPRINGS 79 52 86 43 65 -1 0.01 -0.71 0.01 5.04 61 12.97 93 76 27 0 0 1 0DENVER INTL 82 53 93 47 67 -2 0.17 -0.14 0.12 2.91 53 10.73 101 72 27 2 0 2 0GRAND JUNCTION 84 57 92 51 70 -3 0.23 0.06 0.19 1.26 72 6.23 109 64 36 1 0 3 0PUEBLO 87 56 94 50 72 0 0.03 -0.42 0.03 3.02 56 10.20 105 76 39 3 0 1 0
CT BRIDGEPORT 85 68 93 59 77 5 0.39 -0.44 0.39 9.22 87 24.76 84 77 49 1 0 1 0HARTFORD 85 62 92 52 73 3 1.11 0.19 1.11 8.40 77 22.34 75 82 46 1 0 1 1
DC WASHINGTON 89 71 95 67 80 4 0.69 -0.07 0.69 9.60 99 24.94 97 82 49 3 0 1 1DE WILMINGTON 87 65 93 56 76 2 1.01 0.25 1.01 11.48 106 29.34 103 88 45 2 0 1 1FL DAYTONA BEACH 93 76 96 73 85 4 0.17 -1.32 0.12 5.57 35 25.57 81 92 52 7 0 3 0
JACKSONVILLE 93 72 97 66 83 3 0.36 -1.32 0.36 7.38 43 21.84 63 96 50 7 0 1 0KEY WEST 90 78 92 72 84 0 5.06 3.71 2.11 12.94 105 24.59 105 94 74 5 0 5 4MIAMI 93 80 94 78 86 2 0.26 -1.91 0.21 23.81 111 44.20 120 88 59 7 0 3 0ORLANDO 93 77 97 76 85 2 0.57 -0.87 0.47 19.90 100 39.99 117 90 58 7 0 3 0PENSACOLA 87 78 92 75 83 1 0.39 -1.10 0.28 21.21 104 45.47 101 89 64 2 0 4 0TALLAHASSEE 95 76 100 74 86 4 0.89 -0.62 0.33 23.60 112 46.99 102 90 50 7 0 3 0TAMPA 93 79 95 77 86 3 0.98 -0.82 0.52 24.77 134 40.67 132 87 57 7 0 4 1WEST PALM BEACH 92 79 94 78 86 3 1.32 -0.38 1.07 10.16 54 31.53 83 84 62 7 0 5 1
GA ATHENS 90 71 94 69 81 3 0.39 -0.41 0.25 15.80 136 30.97 94 99 77 4 0 3 0ATLANTA 91 73 94 71 82 4 1.15 0.38 0.80 9.98 84 29.12 84 88 54 4 0 2 1AUGUSTA 94 70 98 67 82 3 0.00 -1.01 0.00 6.73 56 25.46 81 93 46 7 0 0 0COLUMBUS 94 74 96 72 84 3 0.87 0.11 0.87 8.48 71 27.92 81 91 41 7 0 1 1MACON 95 71 98 68 83 4 0.04 -0.79 0.04 6.25 56 24.21 76 92 43 7 0 1 0SAVANNAH 94 72 98 68 83 3 0.07 -1.58 0.07 11.17 63 33.84 96 88 50 7 0 1 0
HI HILO 83 72 87 68 77 1 13.13 10.94 8.81 37.07 140 62.01 77 93 80 0 0 6 3HONOLULU 87 76 88 75 82 0 1.40 1.33 1.24 4.42 337 8.47 83 79 70 0 0 3 1KAHULUI 90 73 94 69 82 2 0.05 -0.06 0.03 1.88 165 9.61 80 79 72 3 0 3 0LIHUE 87 75 89 73 81 1 0.51 0.11 0.19 4.21 76 10.64 47 84 74 0 0 6 0
ID BOISE 86 56 95 50 71 -1 0.00 -0.07 0.00 0.45 35 4.97 64 41 22 2 0 0 0LEWISTON 89 57 99 50 73 1 0.00 -0.17 0.00 2.82 115 9.63 113 45 26 3 0 0 0POCATELLO 83 44 92 40 63 -4 0.00 -0.14 0.00 0.44 21 7.25 87 52 22 1 0 0 0
IL CHICAGO/O'HARE 81 63 85 56 72 1 1.30 0.23 0.84 12.72 115 26.35 109 88 61 0 0 4 1MOLINE 82 62 87 53 72 0 2.06 1.07 1.48 18.48 148 28.48 107 91 61 0 0 4 1PEORIA 82 64 87 56 73 1 2.82 2.15 1.32 14.71 139 23.82 98 97 62 0 0 4 2ROCKFORD 81 62 85 52 71 1 1.05 0.09 0.43 13.55 109 25.61 101 90 63 0 0 4 0SPRINGFIELD 85 66 91 55 75 2 0.35 -0.39 0.30 19.93 195 33.53 138 94 56 1 0 3 0
IN EVANSVILLE 87 67 93 59 77 2 0.14 -0.55 0.14 16.71 159 38.46 127 92 55 3 0 1 0FORT WAYNE 82 61 86 54 72 2 0.96 0.16 0.94 8.85 83 23.04 93 92 58 0 0 2 1INDIANAPOLIS 84 67 92 58 76 3 2.50 1.69 1.82 16.82 141 34.32 122 91 57 2 0 3 2SOUTH BEND 79 62 84 55 71 1 1.36 0.43 1.15 18.94 168 34.05 133 96 68 0 0 3 1
IA BURLINGTON 81 63 86 54 72 -1 0.74 -0.11 0.25 13.15 107 24.00 92 100 61 0 0 4 0CEDAR RAPIDS 79 60 85 52 69 -2 0.95 -0.01 0.55 19.80 163 30.31 128 100 65 0 0 3 1DES MOINES 81 63 85 57 72 -1 0.76 -0.25 0.70 13.11 104 24.35 98 89 64 0 0 2 1DUBUQUE 78 60 85 52 69 0 0.72 -0.35 0.57 18.21 155 29.16 118 96 66 0 0 3 1SIOUX CITY 79 58 85 51 69 -2 2.45 1.82 2.45 8.48 90 24.21 127 89 65 0 0 1 1WATERLOO 78 59 82 54 68 -2 0.34 -0.56 0.32 18.18 145 28.61 119 90 65 0 0 2 0
KS CONCORDIA 83 62 93 57 72 -4 2.41 1.76 1.05 12.19 111 25.06 117 88 66 1 0 5 1DODGE CITY 88 61 99 52 74 -3 1.37 0.81 0.64 10.44 120 21.56 126 90 42 2 0 3 2GOODLAND 83 53 95 47 68 -4 0.68 0.23 0.51 5.84 64 13.20 82 84 44 2 0 3 1TOPEKA 85 64 89 55 75 0 3.22 2.35 1.38 12.01 101 31.32 127 92 65 0 0 4 3
Based on 1971-2000 normals *** Not Available
TEMP. ˚F
National Weather Data for Selected CitiesWeather Data for the Week Ending August 27, 2016
Data Provided by Climate Prediction Center
PRECIPSTATES
AND STATIONS
RELATIVE HUMIDITY PERCENT
TEMPERATURE ˚F PRECIPITATION

August 30, 2016 Weekly Weather and Crop Bulletin 9
NUMBER OF DAYS
AV
ER
AG
E
MA
XIM
UM
AV
ER
AG
E
MIN
IMU
M
EX
TR
EM
E
HIG
H
EX
TR
EM
E
LOW
AV
ER
AG
E
DE
PA
RT
UR
E
F
RO
M N
OR
MA
L
WE
EK
LY
TO
TA
L, I
N.
DE
PA
RT
UR
E
F
RO
M N
OR
MA
L
GR
EA
TE
ST
IN
24
-HO
UR
, IN
.
TO
TA
L, I
N.,
SIN
CE
JU
N 1
PC
T.
NO
RM
AL
SIN
CE
JU
N 1
TO
TA
L, I
N.,
S
INC
E J
AN
01
PC
T.
NO
RM
AL
SIN
CE
JA
N01
AV
ER
AG
E
MA
XIM
UM
AV
ER
AG
E
MIN
IMU
M
90 A
ND
AB
OV
E
32 A
ND
BE
LOW
.01
INC
H
O
R M
OR
E
.50
INC
H
O
R M
OR
E
WICHITA 88 67 94 57 77 -2 0.12 -0.54 0.07 20.74 206 36.30 170 88 57 2 0 2 0
KY JACKSON 86 66 92 59 76 3 0.05 -0.86 0.05 17.81 139 40.62 122 94 54 3 0 1 0LEXINGTON 87 66 94 58 77 3 0.08 -0.70 0.08 16.07 127 35.00 109 88 51 3 0 1 0LOUISVILLE 89 70 93 63 80 4 0.00 -0.69 0.00 14.58 132 33.64 109 85 46 4 0 0 0PADUCAH 89 66 95 58 78 3 0.79 0.14 0.79 17.53 152 41.73 127 94 52 4 0 1 1
LA BATON ROUGE 93 75 96 72 84 3 2.70 1.39 1.28 42.79 261 72.99 167 97 56 6 0 4 2LAKE CHARLES 91 76 92 74 83 1 1.62 0.45 1.02 25.49 168 55.81 150 99 63 6 0 3 2NEW ORLEANS 94 79 97 76 87 5 2.44 0.96 1.04 26.14 144 55.46 125 86 67 7 0 5 3SHREVEPORT 92 74 95 72 83 1 3.10 2.52 2.17 16.42 144 50.65 149 98 59 6 0 4 2
ME CARIBOU 78 57 85 51 68 6 1.19 0.28 0.86 14.70 136 30.62 126 91 55 0 0 4 1PORTLAND 82 60 88 53 71 5 0.75 0.08 0.67 8.02 87 23.53 82 88 47 0 0 3 1
MD BALTIMORE 86 65 93 59 76 2 0.38 -0.45 0.38 13.25 127 31.09 112 85 53 2 0 1 0MA BOSTON 84 66 91 61 75 4 0.90 0.12 0.84 3.92 43 20.26 75 87 43 1 0 2 1
WORCESTER 80 61 85 54 71 4 1.40 0.49 0.74 7.68 66 23.39 75 89 44 0 0 2 2MI ALPENA 80 56 87 48 68 5 0.21 -0.56 0.13 5.19 59 19.97 106 88 49 0 0 2 0
GRAND RAPIDS 79 60 82 53 70 2 1.45 0.53 1.18 14.80 143 31.81 136 88 56 0 0 4 1HOUGHTON LAKE 77 57 82 50 67 4 0.24 -0.64 0.22 8.66 98 22.73 122 91 62 0 0 2 0LANSING 79 60 83 53 70 3 0.57 -0.30 0.38 10.34 114 23.25 115 90 58 0 0 3 0MUSKEGON 78 61 80 55 70 3 1.24 0.31 0.87 11.21 140 25.15 126 90 64 0 0 4 1TRAVERSE CITY 78 61 83 54 70 3 0.48 -0.33 0.16 7.03 76 18.62 88 91 49 0 0 5 0
MN DULUTH 75 56 85 50 66 4 0.33 -0.66 0.32 12.05 101 22.16 107 91 62 0 0 2 0INT'L FALLS 76 48 85 37 62 0 0.65 -0.08 0.59 12.21 122 19.99 122 95 54 0 0 2 1MINNEAPOLIS 77 61 84 56 69 0 1.11 0.21 1.02 15.81 133 24.73 117 87 57 0 0 3 1ROCHESTER 76 57 80 53 67 1 0.87 -0.07 0.87 16.62 134 28.31 126 97 69 0 0 1 1ST. CLOUD 75 55 83 48 65 -1 0.05 -0.88 0.05 14.33 128 20.70 108 100 57 0 0 1 0
MS JACKSON 93 74 95 72 84 3 2.22 1.46 1.36 20.67 177 53.11 138 93 54 7 0 4 2MERIDIAN 96 74 98 72 85 4 0.69 0.03 0.60 12.35 100 37.34 91 90 52 7 0 2 1TUPELO 92 73 97 70 82 3 1.45 0.86 1.32 13.76 128 35.86 95 90 67 5 0 3 1
MO COLUMBIA 84 65 90 58 75 0 0.10 -0.73 0.07 17.82 162 27.96 103 97 62 1 0 2 0KANSAS CITY 84 64 88 55 74 -1 5.10 4.31 1.96 16.41 139 36.94 145 91 55 0 0 4 3SAINT LOUIS 88 70 95 62 79 2 0.03 -0.60 0.03 14.90 146 27.94 107 80 54 3 0 1 0SPRINGFIELD 86 67 92 56 77 1 0.68 -0.20 0.68 13.90 124 25.15 89 87 58 3 0 1 1
MT BILLINGS 80 52 92 47 66 -3 0.00 -0.18 0.00 2.35 61 7.75 73 62 22 2 0 0 0BUTTE 73 36 86 30 55 -5 0.00 -0.30 0.00 2.15 46 5.68 59 69 18 0 1 0 0CUT BANK 73 46 87 36 60 -1 0.00 -0.39 0.00 3.79 69 8.27 84 74 25 0 0 0 0GLASGOW 79 50 92 46 64 -4 0.02 -0.23 0.02 7.72 153 16.00 186 76 44 2 0 1 0GREAT FALLS 77 48 91 37 62 -2 0.01 -0.35 0.01 3.28 65 9.30 83 67 23 1 0 1 0HAVRE 78 46 93 39 62 -4 0.03 -0.22 0.02 5.38 122 13.27 153 83 42 1 0 2 0MISSOULA 81 46 93 40 63 -2 0.03 -0.23 0.03 3.10 83 8.22 86 64 32 1 0 1 0
NE GRAND ISLAND 82 57 93 47 70 -2 0.00 -0.69 0.00 4.59 48 19.27 99 86 50 1 0 0 0LINCOLN 82 60 91 52 71 -3 0.23 -0.50 0.17 8.55 86 20.86 101 91 55 1 0 3 0NORFOLK 79 57 87 45 68 -3 1.18 0.60 1.15 8.44 81 24.89 123 89 58 0 0 3 1NORTH PLATTE 86 52 94 43 69 -2 0.05 -0.34 0.05 7.95 96 19.13 122 88 37 2 0 1 0OMAHA 81 61 86 55 71 -2 1.22 0.52 1.20 12.24 116 25.23 117 86 63 0 0 2 1SCOTTSBLUFF 82 52 94 47 67 -2 0.01 -0.21 0.01 3.62 63 12.73 101 88 46 1 0 1 0VALENTINE 82 51 94 45 66 -5 0.11 -0.30 0.11 8.10 97 22.02 143 84 40 1 0 1 0
NV ELY 84 43 88 39 63 -1 0.15 -0.04 0.15 2.06 104 8.86 132 62 20 0 0 1 0LAS VEGAS 98 77 102 71 87 -1 0.04 -0.04 0.03 0.86 98 3.71 118 38 22 7 0 2 0RENO 91 57 96 53 74 5 0.04 -0.02 0.04 0.04 5 5.25 109 47 21 5 0 1 0WINNEMUCCA 90 45 97 38 68 0 0.00 -0.08 0.00 0.01 1 4.58 85 35 12 4 0 0 0
NH CONCORD 87 56 90 46 72 5 0.94 0.24 0.54 5.48 59 18.21 76 89 38 3 0 4 1NJ NEWARK 88 67 95 59 78 3 0.14 -0.72 0.13 9.41 82 24.62 79 75 41 2 0 2 0NM ALBUQUERQUE 81 58 84 55 70 -5 0.21 -0.16 0.13 2.17 64 3.36 56 82 36 0 0 2 0NY ALBANY 82 60 87 50 71 3 0.74 -0.09 0.42 12.69 123 23.44 94 92 50 0 0 3 0
BINGHAMTON 76 59 82 51 68 3 1.39 0.61 1.20 11.13 110 23.92 95 91 62 0 0 3 1BUFFALO 81 63 86 57 72 4 1.82 0.88 1.54 6.39 63 17.63 70 88 51 0 0 2 1ROCHESTER 83 62 88 56 73 5 0.75 -0.10 0.47 5.28 57 16.89 78 88 49 0 0 2 0SYRACUSE 81 61 86 52 71 3 0.66 -0.17 0.61 8.73 82 23.49 93 90 54 0 0 2 1
NC ASHEVILLE 85 65 90 63 75 4 0.07 -0.92 0.07 13.57 114 28.45 88 89 53 1 0 1 0CHARLOTTE 93 70 98 65 81 3 0.63 -0.20 0.34 6.20 60 21.49 74 82 40 5 0 2 0GREENSBORO 89 69 94 65 79 3 0.95 0.14 0.55 11.69 105 30.66 106 89 47 4 0 2 1HATTERAS 87 72 90 69 80 2 0.01 -1.49 0.01 16.28 113 50.34 139 86 57 1 0 1 0RALEIGH 92 69 99 64 81 4 0.18 -0.65 0.18 17.11 157 36.71 126 86 45 4 0 1 0WILMINGTON 89 70 95 65 80 1 0.00 -1.64 0.00 16.91 88 39.59 102 94 52 3 0 0 0
ND BISMARCK 79 50 89 41 64 -3 0.00 -0.44 0.00 11.36 161 18.54 148 91 48 0 0 0 0DICKINSON 80 48 97 43 64 -3 0.04 -0.31 0.04 7.21 108 11.94 98 87 23 1 0 1 0FARGO 79 56 91 46 68 1 0.30 -0.25 0.30 9.99 117 15.46 103 83 50 1 0 1 0GRAND FORKS 78 53 88 45 66 0 0.34 -0.23 0.32 12.13 143 19.02 135 90 50 0 0 2 0JAMESTOWN 76 52 84 45 64 -3 0.01 -0.45 0.01 12.92 155 18.83 135 92 53 0 0 1 0WILLISTON 83 51 99 44 67 0 0.01 -0.29 0.01 6.68 113 11.75 112 74 37 2 0 1 0
OH AKRON-CANTON 85 63 91 56 74 5 0.75 -0.05 0.54 8.42 79 23.09 89 84 48 2 0 3 1CINCINNATI 86 65 92 56 75 1 0.02 -0.82 0.02 12.65 110 32.26 109 93 58 3 0 1 0CLEVELAND 85 65 93 58 75 6 0.95 0.07 0.42 7.43 71 23.36 93 84 45 2 0 4 0COLUMBUS 84 64 91 56 74 1 1.11 0.33 0.53 12.23 103 26.96 101 92 56 1 0 3 1DAYTON 84 64 90 56 74 3 0.45 -0.31 0.37 9.91 90 26.12 95 91 54 1 0 3 0MANSFIELD 83 62 90 54 73 5 0.35 -0.70 0.30 7.03 55 23.43 80 98 49 1 0 2 0
Based on 1971-2000 normals *** Not Available
TEMP. ˚F PRECIPSTATES
AND STATIONS
RELATIVE HUMIDITY PERCENT
Weather Data for the Week Ending August 27, 2016
TEMPERATURE ˚F PRECIPITATION

10 Weekly Weather and Crop Bulletin August 30, 2016
NUMBER OF DAYS
AV
ER
AG
E
MA
XIM
UM
AV
ER
AG
E
MIN
IMU
M
EX
TR
EM
E
HIG
H
EX
TR
EM
E
LOW
AV
ER
AG
E
DE
PA
RT
UR
E
F
RO
M N
OR
MA
L
WE
EK
LY
TO
TA
L, I
N.
DE
PA
RT
UR
E
F
RO
M N
OR
MA
L
GR
EA
TE
ST
IN
24
-HO
UR
, IN
.
TO
TA
L, I
N.,
SIN
CE
JU
N 1
PC
T.
NO
RM
AL
SIN
CE
JU
N 1
TO
TA
L, I
N.,
S
INC
E J
AN
01
PC
T.
NO
RM
AL
SIN
CE
JA
N01
AV
ER
AG
E
MA
XIM
UM
AV
ER
AG
E
MIN
IMU
M
90 A
ND
AB
OV
E
32 A
ND
BE
LOW
.01
INC
H
O
R M
OR
E
.50
INC
H
O
R M
OR
E
TOLEDO 83 61 87 53 72 2 1.79 1.02 1.29 9.23 100 22.99 104 100 59 0 0 2 2YOUNGSTOWN 83 60 88 52 71 3 0.96 0.17 0.55 11.78 108 26.88 107 92 55 0 0 2 1
OK OKLAHOMA CITY 91 68 96 57 79 -1 0.18 -0.41 0.08 7.22 75 19.63 83 89 42 4 0 3 0TULSA 92 70 98 59 81 0 0.04 -0.67 0.04 6.73 68 20.58 76 89 52 4 0 1 0
OR ASTORIA 78 54 91 51 66 5 0.00 -0.34 0.00 3.54 77 40.77 108 90 70 2 0 0 0BURNS 85 38 94 35 62 -1 0.00 -0.08 0.00 0.54 39 4.39 64 51 20 1 0 0 0EUGENE 89 51 98 49 70 4 0.00 -0.28 0.00 1.03 36 20.96 72 74 46 3 0 0 0MEDFORD 96 57 99 51 77 5 0.00 -0.13 0.00 1.02 76 10.00 97 52 15 7 0 0 0PENDLETON 87 55 96 46 71 0 0.00 -0.13 0.00 1.80 113 7.38 94 45 24 3 0 0 0PORTLAND 87 58 97 53 73 5 0.00 -0.25 0.00 2.17 73 21.91 104 74 48 3 0 0 0SALEM 89 56 99 51 72 6 0.00 -0.19 0.00 1.69 68 21.98 98 69 45 3 0 0 0
PA ALLENTOWN 86 60 91 52 73 3 0.73 -0.26 0.73 10.53 88 27.26 92 86 49 2 0 1 1ERIE 82 64 89 57 73 3 0.69 -0.37 0.41 12.00 109 25.77 100 82 55 0 0 2 0MIDDLETOWN 86 66 91 59 76 3 2.08 1.33 2.05 13.32 130 30.51 114 97 49 3 0 2 1PHILADELPHIA 88 69 93 62 78 3 0.60 -0.23 0.60 7.45 68 25.45 90 80 45 2 0 1 1PITTSBURGH 83 63 89 56 73 3 0.57 -0.19 0.37 9.44 86 23.06 89 88 47 0 0 2 0WILKES-BARRE 81 60 87 51 71 2 0.91 0.19 0.91 8.82 86 21.64 88 93 51 0 0 1 1WILLIAMSPORT 84 61 91 53 73 3 1.58 0.79 1.58 12.06 106 24.00 88 88 54 1 0 1 1
RI PROVIDENCE 85 65 93 56 75 4 0.74 -0.18 0.74 7.31 74 25.45 85 84 45 1 0 1 1SC BEAUFORT 92 73 96 71 83 3 0.00 -1.76 0.00 7.92 44 26.31 76 92 50 6 0 0 0
CHARLESTON 92 72 97 68 82 2 0.00 -1.62 0.00 10.78 60 31.54 89 88 48 7 0 0 0COLUMBIA 94 72 97 68 83 3 0.00 -1.19 0.00 8.66 57 22.58 65 83 44 7 0 0 0GREENVILLE 89 70 95 68 80 3 0.04 -0.81 0.04 10.59 87 28.12 82 91 51 4 0 1 0
SD ABERDEEN 80 52 89 42 66 -3 0.01 -0.50 0.01 7.10 83 14.04 92 86 53 0 0 1 0HURON 81 53 91 45 67 -3 0.00 -0.43 0.00 6.07 77 14.88 93 89 46 1 0 0 0RAPID CITY 82 51 101 44 66 -4 0.97 0.65 0.77 5.75 92 10.39 80 79 35 1 0 2 1SIOUX FALLS 78 58 88 49 68 -1 0.64 -0.05 0.64 6.36 71 17.85 100 92 62 0 0 1 1
TN BRISTOL 87 63 95 58 75 3 1.36 0.74 1.36 8.02 75 24.93 86 98 50 3 0 1 1CHATTANOOGA 92 70 97 65 81 3 0.86 0.06 0.60 5.63 48 22.87 62 87 50 5 0 2 1KNOXVILLE 90 69 97 61 79 3 0.20 -0.36 0.10 11.35 101 30.62 91 91 49 3 0 2 0MEMPHIS 92 74 97 70 83 3 2.79 2.14 1.38 14.71 133 49.80 138 86 56 4 0 3 2NASHVILLE 90 68 96 62 79 2 2.37 1.63 1.60 17.16 162 31.60 98 93 50 4 0 3 2
TX ABILENE 91 70 93 67 80 -2 1.29 0.64 0.97 8.34 121 26.14 175 88 54 5 0 3 1AMARILLO 86 62 94 57 74 -1 0.28 -0.37 0.20 8.04 94 13.93 95 90 42 1 0 2 0AUSTIN 91 73 94 71 82 -2 0.21 -0.31 0.11 16.39 213 44.68 210 94 64 6 0 3 0BEAUMONT 91 75 95 74 83 1 1.26 0.09 0.51 22.43 142 51.93 136 98 62 4 0 4 1BROWNSVILLE 96 76 96 74 86 2 0.00 -0.84 0.00 3.46 50 13.45 91 95 51 7 0 0 0CORPUS CHRISTI 95 77 97 75 86 2 0.67 -0.26 0.67 5.57 67 23.79 125 96 52 7 0 1 1DEL RIO 91 74 93 72 83 -2 0.11 -0.23 0.11 11.83 209 20.44 168 93 63 5 0 1 0EL PASO 89 66 91 63 78 -2 2.27 1.88 1.53 4.89 128 5.53 100 76 35 4 0 3 1FORT WORTH 92 75 95 73 84 0 0.08 -0.32 0.08 11.83 166 28.59 125 86 48 7 0 1 0GALVESTON 89 79 91 76 84 0 1.45 0.35 0.81 17.22 159 37.76 142 92 68 4 0 5 2HOUSTON 91 75 95 73 83 0 1.49 0.55 0.74 24.49 210 53.44 176 96 71 4 0 3 1LUBBOCK 87 63 94 58 75 -2 0.54 -0.03 0.24 2.96 42 8.23 65 90 56 2 0 4 0MIDLAND 88 70 92 67 79 -1 0.29 -0.10 0.26 6.32 125 10.06 110 83 52 3 0 3 0SAN ANGELO 93 71 96 68 82 2 0.00 -0.53 0.00 9.83 188 25.46 197 88 51 6 0 0 0SAN ANTONIO 90 75 92 72 82 -2 1.11 0.49 0.64 7.56 89 29.38 139 91 56 6 0 2 1VICTORIA 91 73 94 70 82 -2 0.63 -0.15 0.62 7.13 69 27.35 109 97 67 6 0 2 1WACO 91 73 95 72 82 -2 1.42 1.03 1.32 9.31 136 31.96 151 97 65 6 0 2 1WICHITA FALLS 95 69 98 61 82 0 0.03 -0.58 0.03 5.88 82 22.37 120 86 49 6 0 1 0
UT SALT LAKE CITY 89 64 95 55 76 2 0.00 -0.17 0.00 0.59 29 8.24 76 36 12 3 0 0 0VT BURLINGTON 82 63 87 52 73 6 0.36 -0.55 0.28 8.19 76 19.04 82 82 45 0 0 2 0VA LYNCHBURG 88 64 94 58 76 3 0.00 -0.72 0.00 13.46 121 33.11 114 96 53 3 0 0 0
NORFOLK 86 71 93 66 79 2 0.54 -0.47 0.54 20.14 153 42.37 134 89 54 2 0 1 1RICHMOND 91 67 99 61 79 3 0.00 -0.88 0.00 12.80 108 33.43 113 86 44 4 0 0 0ROANOKE 87 66 94 59 76 2 0.18 -0.65 0.18 15.23 140 32.96 114 89 59 3 0 1 0WASH/DULLES 89 66 95 61 78 4 0.07 -0.80 0.07 10.31 95 27.97 101 82 47 4 0 1 0
WA OLYMPIA 81 51 93 46 66 3 0.00 -0.31 0.00 2.07 61 27.45 97 87 58 2 0 0 0QUILLAYUTE 76 51 92 43 63 4 0.05 -0.58 0.03 6.01 75 57.84 100 97 68 2 0 2 0SEATTLE-TACOMA 82 58 92 54 70 5 0.00 -0.27 0.00 2.65 87 23.72 116 76 50 2 0 0 0SPOKANE 83 57 90 50 70 3 0.00 -0.15 0.00 0.94 38 8.80 86 46 20 1 0 0 0YAKIMA 90 52 97 46 71 4 0.00 -0.08 0.00 0.44 41 5.89 123 60 30 4 0 0 0
WV BECKLEY 81 61 88 53 71 3 0.68 -0.01 0.68 17.88 152 36.91 126 90 66 0 0 1 1CHARLESTON 87 65 96 56 76 4 0.37 -0.50 0.37 12.59 100 32.49 107 96 50 3 0 1 0ELKINS 83 59 91 52 71 3 0.69 -0.25 0.29 12.56 96 30.98 97 93 49 1 0 3 0HUNTINGTON 87 65 95 56 76 3 0.09 -0.70 0.09 16.38 139 36.09 122 94 51 3 0 1 0
WI EAU CLAIRE 77 57 84 51 67 -1 0.26 -0.84 0.22 14.58 120 27.00 120 98 53 0 0 3 0GREEN BAY 75 58 81 50 66 0 1.26 0.38 1.10 10.44 104 21.62 110 100 67 0 0 2 1LA CROSSE 80 62 85 56 71 1 0.04 -0.92 0.04 17.32 145 29.92 131 97 59 0 0 1 0MADISON 78 59 84 51 69 1 1.46 0.47 0.95 18.32 157 32.24 140 92 62 0 0 2 2MILWAUKEE 81 64 87 56 73 4 0.62 -0.32 0.33 6.75 64 18.56 79 83 57 0 0 3 0
WY CASPER 80 44 92 38 62 -5 0.78 0.67 0.69 3.10 93 12.56 134 67 33 1 0 3 1CHEYENNE 78 51 89 44 64 0 0.21 -0.16 0.18 4.64 78 14.50 122 70 30 0 0 2 0LANDER 80 47 90 42 64 -4 0.01 -0.10 0.01 1.39 57 17.54 191 64 21 2 0 1 0SHERIDAN 80 46 95 43 63 -4 0.00 -0.18 0.00 2.36 63 11.71 114 70 29 2 0 0 0
Based on 1971-2000 normals *** Not Available
Weather Data for the Week Ending August 27, 2016
STATES AND
STATIONS
TEMP. ˚F PRECIP
RELATIVE HUMIDITY PERCENT
TEMPERATURE ˚F PRECIPITATION
August 30, 2016 Weekly Weather and Crop Bulletin 11
National Agricultural Summary August 22 - 28, 2016
Weekly National Agricultural Summary provided by USDA/NASS
HIGHLIGHTS
Most of the Nation recorded weekly precipitation below normal last week with the most notable exceptions occurring in the Mississippi Valley. Showers brought significant rain during the week to northwest Missouri and northeast Iowa where rainfall totals of four to six inches were common. Temperatures were generally above normal for the week in the eastern United States and Pacific
Northwest with small pockets recording average weekly temperatures more than 4°F above normal in California, Maine, Ohio, and Oregon. Temperatures were cooler than normal from the Rocky Mountains through the Great Plains with average weekly temperatures more than 6°F below normal reported in areas of Arizona and New Mexico.
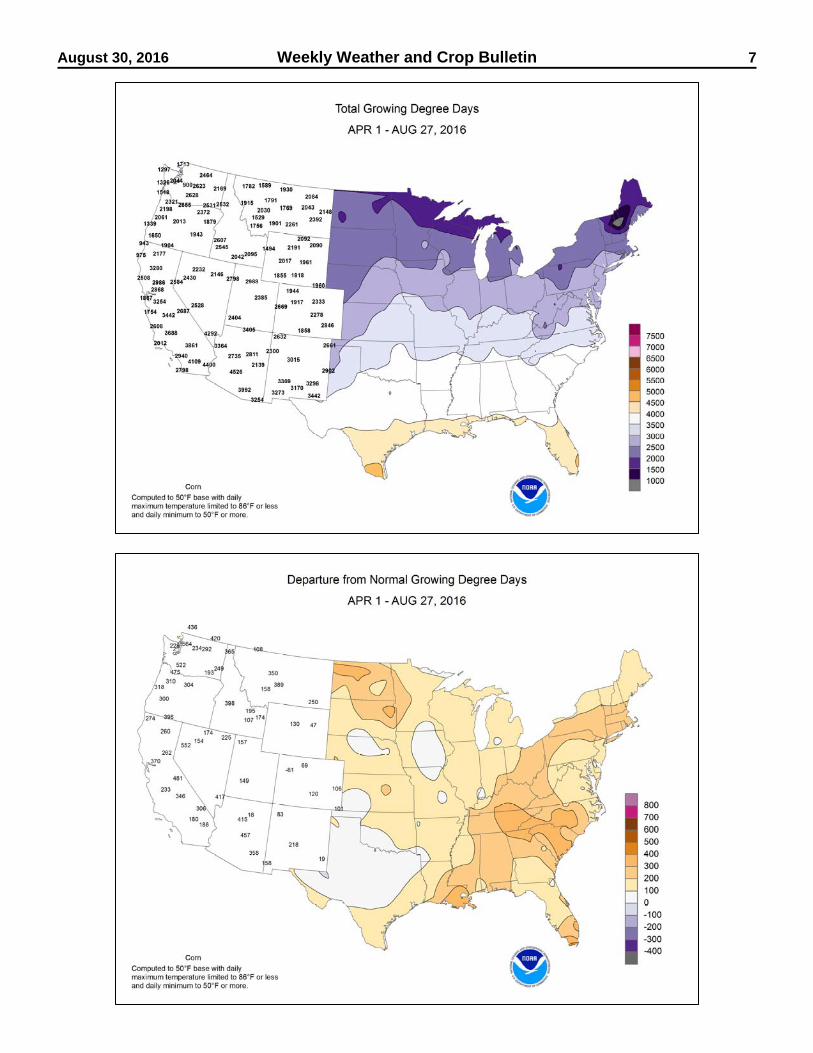
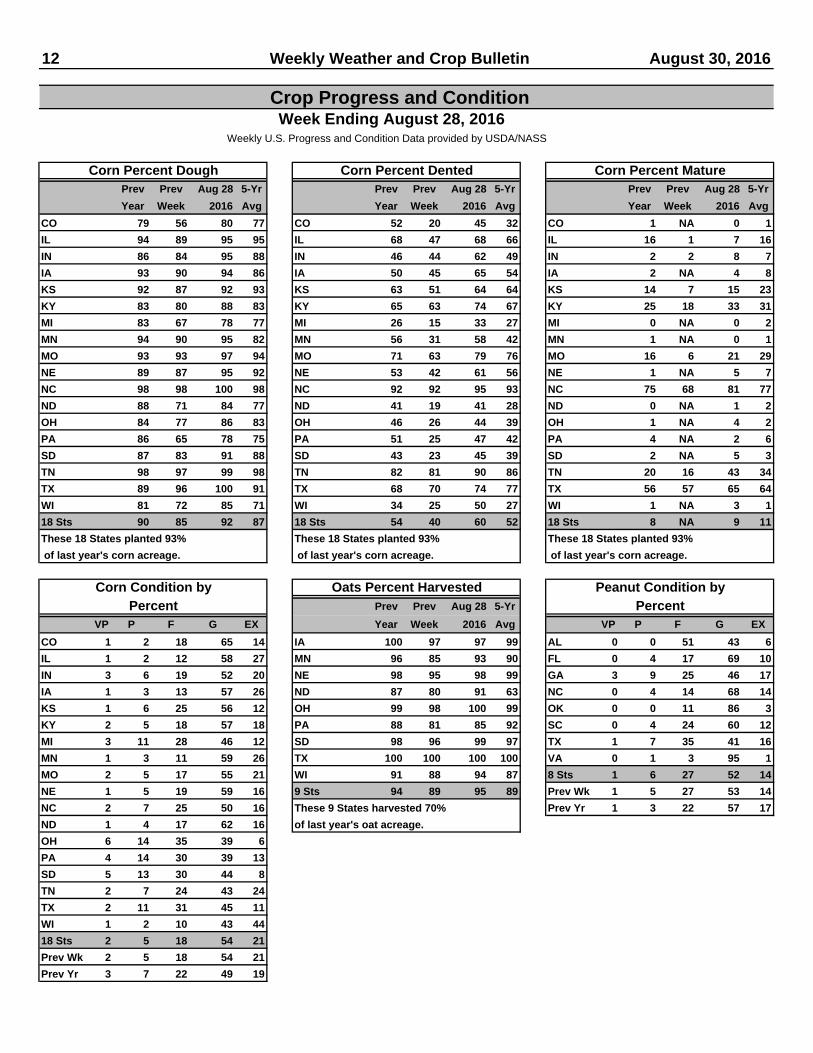
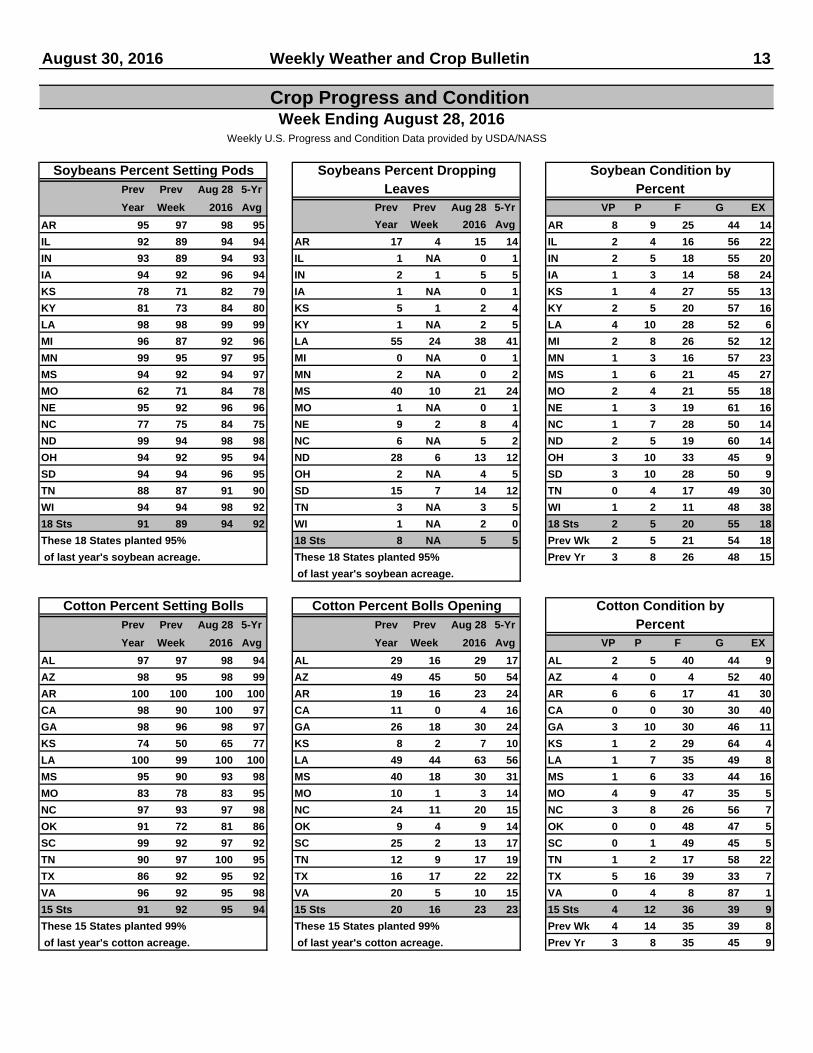
Corn: By August 28, ninety-two percent of the Nation’s corn crop had reached the dough stage, 2 percentage points ahead of last year and 5 percentage points ahead of the 5-year average. By week’s end, 60 percent of this year’s corn crop was at or beyond the dent stage, 6 percentage points ahead of last year and 8 percentage points ahead of the 5-year average. The percentage of the crop entering the dent stage advanced by 20 percentage points or more during the week in 8 of the 18 estimating States. Nine percent of the Nation’s crop was mature by August 28, slightly ahead of last year but 2 percentage points behind the 5-year average. Overall, 75 percent of the corn crop was reported in good to excellent condition, unchanged from last week but 7 percentage points above the same time last year. Corn conditions are the highest they have been this late in the season since 2004. Soybeans: Ninety-four percent of the Nation’s soybeans were at or beyond the pod setting stage by week’s end, 3 percentage points ahead of last year and 2 percentage points ahead of the 5-year average. Leaf drop advanced to 5 percent complete Nationally by August 28, three percentage points behind last year but equal to the 5-year average. Progress was most advanced in the Mississippi Delta with 38 percent of the crop dropping leaves in Louisiana and 21 percent dropping leaves in Mississippi, both 3 percentage points behind the State 5-year average. Overall, 73 percent of the soybean crop was reported in good to excellent condition, up slightly from last week and 10 percentage points above the same time last year. Cotton: Ninety-five percent of the Nation’s cotton crop was at or beyond the boll setting stage by August 28, 4 percentage points ahead of last year and slightly ahead of the 5-year average. By August 28, open bolls were evident in 23 percent of the Nation’s cotton fields, 3 percentage points ahead of last year but equal to the 5-year average. In Texas, the cotton harvest was slowed in the Upper Coast due to wet conditions. Overall, 48 percent of the cotton crop was reported in good to excellent condition, up slightly from last week but 6 percentage points lower than at the same time last year. In the High Plains of Texas, dry land cotton conditions were aided by rainfall and cooler temperatures. Sorghum: By week’s end, 95 percent of the sorghum crop was at or beyond the heading stage, slightly ahead of last year and 7 percentage points ahead of the 5-year average.
Nationally, 62 percent of this year’s sorghum crop was at or beyond the coloring stage by August 28, seven percentage points ahead of last year and 11 percentage points ahead of the 5-year average. Thirty-three percent of the crop was mature by week’s end, 5 percentage points ahead of last year and 3 percentage points ahead of the 5-year average. Harvest advanced slowly, with activity limited to portions of the southern Great Plains and the Mississippi Delta. By August 28, producers had harvested 18 percent of the Nation’s crop, slightly behind last year and 5 percentage points behind the 5-year average. Overall, 65 percent of the sorghum crop was reported in good to excellent condition, unchanged from last week but 3 percentage points lower than at the same time last year. Rice: By August 28, twenty-two percent of the Nation’s crop was harvested, 2 percentage points behind last year but slightly ahead of the 5-year average. Harvest progress advanced 12 percentage points for the week in Texas and 10 percentage points in Louisiana. Overall, 60 percent of the rice crop was reported in good to excellent condition, down slightly from last week and 6 percentage points below the same time last year. Small Grains: Ninety-five percent of the Nation’s oat crop was harvested by August 28, slightly ahead of last year and 6 percentage points ahead of the 5-year average. Harvest progress advanced 11 percentage points in North Dakota during the week, now estimated at 91 percent complete. By August 28, barley producers had harvested 86 percent of this year’s crop, 5 percentage points behind last year but 19 percentage points ahead of the 5-year average. Harvest progress was 90 percent or more complete in Minnesota and North Dakota. By week’s end, 81 percent of the spring wheat crop was harvested, 3 percentage points behind last year but 19 percentage points ahead of the 5-year average. Harvest progress was 24 percentage points ahead of the 5-year average in North Dakota and 15 percentage points ahead in Montana. Other Crops: Overall, 66 percent of the peanut crop was reported in good to excellent condition, down slightly from last week and 8 percentage points lower than at the same time last year. The peanut harvest started in Florida, estimated at 4 percent complete by August 28.
12 Weekly Weather and Crop Bulletin August 30, 2016
Crop Progress and Condition Week Ending August 28, 2016
Weekly U.S. Progress and Condition Data provided by USDA/NASS
Prev Prev Aug 28 5-Yr Prev Prev Aug 28 5-Yr Prev Prev Aug 28 5-Yr
Year Week 2016 Avg Year Week 2016 Avg Year Week 2016 Avg
CO 79 56 80 77 CO 52 20 45 32 CO 1 NA 0 1
IL 94 89 95 95 IL 68 47 68 66 IL 16 1 7 16
IN 86 84 95 88 IN 46 44 62 49 IN 2 2 8 7
IA 93 90 94 86 IA 50 45 65 54 IA 2 NA 4 8
KS 92 87 92 93 KS 63 51 64 64 KS 14 7 15 23
KY 83 80 88 83 KY 65 63 74 67 KY 25 18 33 31
MI 83 67 78 77 MI 26 15 33 27 MI 0 NA 0 2
MN 94 90 95 82 MN 56 31 58 42 MN 1 NA 0 1
MO 93 93 97 94 MO 71 63 79 76 MO 16 6 21 29
NE 89 87 95 92 NE 53 42 61 56 NE 1 NA 5 7
NC 98 98 100 98 NC 92 92 95 93 NC 75 68 81 77
ND 88 71 84 77 ND 41 19 41 28 ND 0 NA 1 2
OH 84 77 86 83 OH 46 26 44 39 OH 1 NA 4 2
PA 86 65 78 75 PA 51 25 47 42 PA 4 NA 2 6
SD 87 83 91 88 SD 43 23 45 39 SD 2 NA 5 3
TN 98 97 99 98 TN 82 81 90 86 TN 20 16 43 34
TX 89 96 100 91 TX 68 70 74 77 TX 56 57 65 64
WI 81 72 85 71 WI 34 25 50 27 WI 1 NA 3 1
18 Sts 90 85 92 87 18 Sts 54 40 60 52 18 Sts 8 NA 9 11
These 18 States planted 93% These 18 States planted 93% These 18 States planted 93%
of last year's corn acreage. of last year's corn acreage. of last year's corn acreage.
Prev Prev Aug 28 5-Yr
VP P F G EX Year Week 2016 Avg VP P F G EX
CO 1 2 18 65 14 IA 100 97 97 99 AL 0 0 51 43 6
IL 1 2 12 58 27 MN 96 85 93 90 FL 0 4 17 69 10
IN 3 6 19 52 20 NE 98 95 98 99 GA 3 9 25 46 17
IA 1 3 13 57 26 ND 87 80 91 63 NC 0 4 14 68 14
KS 1 6 25 56 12 OH 99 98 100 99 OK 0 0 11 86 3
KY 2 5 18 57 18 PA 88 81 85 92 SC 0 4 24 60 12
MI 3 11 28 46 12 SD 98 96 99 97 TX 1 7 35 41 16
MN 1 3 11 59 26 TX 100 100 100 100 VA 0 1 3 95 1
MO 2 5 17 55 21 WI 91 88 94 87 8 Sts 1 6 27 52 14
NE 1 5 19 59 16 9 Sts 94 89 95 89 Prev Wk 1 5 27 53 14
NC 2 7 25 50 16 These 9 States harvested 70% Prev Yr 1 3 22 57 17
ND 1 4 17 62 16 of last year's oat acreage.
OH 6 14 35 39 6
PA 4 14 30 39 13
SD 5 13 30 44 8
TN 2 7 24 43 24
TX 2 11 31 45 11
WI 1 2 10 43 44
18 Sts 2 5 18 54 21
Prev Wk 2 5 18 54 21
Prev Yr 3 7 22 49 19
Oats Percent Harvested Peanut Condition byPercent
Corn Percent Dough Corn Percent Dented Corn Percent Mature
Corn Condition byPercent
August 30, 2016 Weekly Weather and Crop Bulletin 13
Crop Progress and Condition Week Ending August 28, 2016
Weekly U.S. Progress and Condition Data provided by USDA/NASS
Prev Prev Aug 28 5-Yr
Year Week 2016 Avg Prev Prev Aug 28 5-Yr VP P F G EX
AR 95 97 98 95 Year Week 2016 Avg AR 8 9 25 44 14
IL 92 89 94 94 AR 17 4 15 14 IL 2 4 16 56 22
IN 93 89 94 93 IL 1 NA 0 1 IN 2 5 18 55 20
IA 94 92 96 94 IN 2 1 5 5 IA 1 3 14 58 24
KS 78 71 82 79 IA 1 NA 0 1 KS 1 4 27 55 13
KY 81 73 84 80 KS 5 1 2 4 KY 2 5 20 57 16
LA 98 98 99 99 KY 1 NA 2 5 LA 4 10 28 52 6
MI 96 87 92 96 LA 55 24 38 41 MI 2 8 26 52 12
MN 99 95 97 95 MI 0 NA 0 1 MN 1 3 16 57 23
MS 94 92 94 97 MN 2 NA 0 2 MS 1 6 21 45 27
MO 62 71 84 78 MS 40 10 21 24 MO 2 4 21 55 18
NE 95 92 96 96 MO 1 NA 0 1 NE 1 3 19 61 16
NC 77 75 84 75 NE 9 2 8 4 NC 1 7 28 50 14
ND 99 94 98 98 NC 6 NA 5 2 ND 2 5 19 60 14
OH 94 92 95 94 ND 28 6 13 12 OH 3 10 33 45 9
SD 94 94 96 95 OH 2 NA 4 5 SD 3 10 28 50 9
TN 88 87 91 90 SD 15 7 14 12 TN 0 4 17 49 30
WI 94 94 98 92 TN 3 NA 3 5 WI 1 2 11 48 38
18 Sts 91 89 94 92 WI 1 NA 2 0 18 Sts 2 5 20 55 18
These 18 States planted 95% 18 Sts 8 NA 5 5 Prev Wk 2 5 21 54 18
of last year's soybean acreage. These 18 States planted 95% Prev Yr 3 8 26 48 15
of last year's soybean acreage.
Prev Prev Aug 28 5-Yr Prev Prev Aug 28 5-Yr
Year Week 2016 Avg Year Week 2016 Avg VP P F G EX
AL 97 97 98 94 AL 29 16 29 17 AL 2 5 40 44 9
AZ 98 95 98 99 AZ 49 45 50 54 AZ 4 0 4 52 40
AR 100 100 100 100 AR 19 16 23 24 AR 6 6 17 41 30
CA 98 90 100 97 CA 11 0 4 16 CA 0 0 30 30 40
GA 98 96 98 97 GA 26 18 30 24 GA 3 10 30 46 11
KS 74 50 65 77 KS 8 2 7 10 KS 1 2 29 64 4
LA 100 99 100 100 LA 49 44 63 56 LA 1 7 35 49 8
MS 95 90 93 98 MS 40 18 30 31 MS 1 6 33 44 16
MO 83 78 83 95 MO 10 1 3 14 MO 4 9 47 35 5
NC 97 93 97 98 NC 24 11 20 15 NC 3 8 26 56 7
OK 91 72 81 86 OK 9 4 9 14 OK 0 0 48 47 5
SC 99 92 97 92 SC 25 2 13 17 SC 0 1 49 45 5
TN 90 97 100 95 TN 12 9 17 19 TN 1 2 17 58 22
TX 86 92 95 92 TX 16 17 22 22 TX 5 16 39 33 7
VA 96 92 95 98 VA 20 5 10 15 VA 0 4 8 87 1
15 Sts 91 92 95 94 15 Sts 20 16 23 23 15 Sts 4 12 36 39 9
These 15 States planted 99% These 15 States planted 99% Prev Wk 4 14 35 39 8
of last year's cotton acreage. of last year's cotton acreage. Prev Yr 3 8 35 45 9
Percent
LeavesSoybean Condition by
Percent
Cotton Percent Setting Bolls Cotton Percent Bolls Opening Cotton Condition by
Soybeans Percent Setting Pods Soybeans Percent Dropping

14 Weekly Weather and Crop Bulletin August 30, 2016
Crop Progress and Condition Week Ending August 28, 2016
Weekly U.S. Progress and Condition Data provided by USDA/NASS
Prev Prev Aug 28 5-Yr Prev Prev Aug 28 5-Yr Prev Prev Aug 28 5-Yr
Year Week 2016 Avg Year Week 2016 Avg Year Week 2016 Avg
AR 100 100 100 100 AR 96 92 99 95 AR 73 76 90 62
CO 89 89 92 82 CO 36 27 39 36 CO 2 0 1 4
IL 91 82 85 92 IL 68 63 73 63 IL 4 3 20 4
KS 94 90 96 85 KS 42 32 50 30 KS 2 1 3 2
LA 100 100 100 100 LA 100 100 100 100 LA 94 93 97 95
MO 94 87 93 93 MO 60 44 57 52 MO 11 3 7 11
NE 99 95 99 95 NE 39 44 74 36 NE 0 0 2 0
NM 73 56 75 55 NM 11 24 29 9 NM 0 0 2 0
OK 91 85 90 81 OK 49 45 51 49 OK 15 11 17 15
SD 95 96 96 97 SD 42 43 53 47 SD 2 3 8 2
TX 95 88 94 93 TX 74 76 78 78 TX 64 68 74 71
11 Sts 94 89 95 88 11 Sts 55 52 62 51 11 Sts 28 29 33 30
These 11 States planted 98% These 11 States planted 98% These 11 States planted 98%
of last year's sorghum acreage. of last year's sorghum acreage. of last year's sorghum acreage.
Prev Prev Aug 28 5-Yr Prev Prev Aug 28 5-Yr
Year Week 2016 Avg VP P F G EX Year Week 2016 Avg
AR 31 4 18 27 AR 4 15 34 39 8 AR 13 4 12 10
CO 0 NA 0 0 CO 0 5 28 60 7 CA 0 0 0 0
IL 0 NA 0 0 IL 2 5 23 63 7 LA 81 60 70 71
KS 0 NA 0 0 KS 1 3 22 59 15 MS 19 2 10 16
LA 76 70 80 77 LA 0 15 30 43 12 MO 0 0 2 2
MO 1 NA 0 0 MO 0 2 28 60 10 TX 69 70 82 72
NE 0 NA 0 0 NE 0 0 17 64 19 6 Sts 24 15 22 21
NM 0 NA 0 0 NM 0 3 77 19 1 These 6 States harvested 100%
OK 1 NA 1 3 OK 0 1 31 65 3 of last year's rice acreage.
SD 0 NA 0 0 SD 0 3 43 53 1
TX 48 46 47 58 TX 2 7 34 41 16
11 Sts 19 NA 18 23 11 Sts 1 5 29 52 13
These 11 States harvested 98% Prev Wk 1 6 28 52 13 VP P F G EX
of last year's sorghum acreage. Prev Yr 2 5 25 56 12 AR 7 12 31 36 14
CA 0 0 15 75 10
LA 6 11 30 50 3
Prev Prev Aug 28 5-Yr Prev Prev Aug 28 5-Yr MS 0 2 21 49 28
Year Week 2016 Avg Year Week 2016 Avg MO 1 3 24 51 21
ID 90 60 75 65 ID 87 64 85 68 TX 3 4 25 55 13
MN 94 77 88 74 MN 95 85 96 81 6 Sts 5 8 27 47 13
MT 80 53 73 55 MT 90 66 82 67 Prev Wk 4 9 26 48 13
ND 81 64 82 55 ND 93 77 90 66 Prev Yr 2 4 28 48 18
SD 92 89 91 87 WA 99 65 79 73
WA 100 66 78 73 5 Sts 91 70 86 67
6 Sts 84 65 81 62 These 5 States harvested 86%
These 6 States harvested 99% of last year's barley acreage.
of last year's spring wheat acreage.
Spring Wheat Percent Harvested Barley Percent Harvested
Percent
Percent
Rice Percent Harvested
Rice Condition by
Sorghum Percent Headed Sorghum Percent Coloring Sorghum Percent Mature
Sorghum Percent Harvested Sorghum Condition by

August 30, 2016 Weekly Weather and Crop Bulletin 15
Crop Progress and Condition Week Ending August 28, 2016
Weekly U.S. Progress and Condition Data provided by USDA/NASS
VP P F G EX VP P F G EX
AL 8 12 29 46 5 NH 21 37 36 6 0
AZ 11 15 35 31 8 NJ 0 1 51 43 5
AR 2 7 30 47 14 NM 3 23 46 25 3
CA 20 20 25 30 5 NY 6 13 39 36 6
CO 3 6 25 58 8 NC 3 12 38 42 5
CT 5 64 31 0 0 ND 6 11 28 51 4
DE 7 17 34 37 5 OH 9 18 31 34 8
FL 2 3 24 56 15 OK 2 9 41 42 6
GA 9 24 39 25 3 OR 26 26 28 17 3
ID 8 25 33 30 4 PA 15 23 36 22 4
IL 1 2 16 56 25 RI 19 52 29 0 0
IN 2 6 24 57 11 SC 8 24 26 39 3
IA 2 7 27 52 12 SD 8 19 36 36 1
KS 1 4 24 61 10 TN 4 12 36 40 8
KY 1 6 20 62 11 TX 4 10 33 41 12
LA 2 13 34 45 6 UT 2 10 41 41 6
ME 34 16 27 14 9 VT 0 29 59 12 0
MD 1 10 35 47 7 VA 2 11 35 47 5
MA 40 48 12 0 0 WA 10 16 27 43 4
MI 8 17 30 37 8 WV 1 11 35 49 4
MN 1 6 17 58 18 WI 0 3 16 55 26
MS 1 6 30 53 10 WY 10 18 32 35 5
MO 0 3 30 57 10 48 Sts 5 11 31 45 8
MT 14 21 34 26 5
NE 3 9 23 55 10 Prev Wk 6 12 31 43 8
NV 20 20 35 25 0 Prev Yr 5 13 32 42 8
Pasture and Range Condition by PercentWeek Ending Aug 28, 2016
5
7
6
7
7
6
6
6
5
6.1
6.4
6.7
6.6
6.8
4.36.9
4.4
5.6
6.1
6.3
4.3
6.8
6.4
6.1
3.8
4.1
4.3
5.2
5.7
6.7
3.3
4.9
5.2
4.5
5.66.6
3.7
6.2
6.8
7
5
5.6
7
76
6.7
7
6.5
Days Suitable for FieldworkThis product was prepared by theUSDA Office of the Chief Economist (OCE)World Agricultural Outlook Board (WAOB)
United StatesDepartment ofAgriculture
Week EndingAugust 28, 2016
Data obtained from USDA National AgriculturalStatistics Service (NASS) weekly Crop Progressreports. These reports are available throughhttp://www.nass.usda.gov/Publications/.
Days Suitable0.0 - 0.40.5 - 1.41.5 - 2.42.5 - 3.43.5 - 4.44.5 - 5.45.5 - 6.46.5 - 7.0
VP - Very Poor; P - Poor;F - Fair;
G - Good; EX - Excellent
NA - Not Available* Revised

16 Weekly Weather and Crop Bulletin August 30, 2016
Crop Progress and Condition Week Ending August 28, 2016
Weekly U.S. Progress and Condition Data provided by USDA/NASS
11[-3]
0[0]
4[0]
0[0]
5[-2]
2[0]
10[0]
3[+2]
1[0]
3[-1]
2[0]
0[0]
2[-1]
22[-5]1
[-3]
8[+4]
3[+1]
22[0]
10[-2]
14[+2]
13[0]
5[0]
3[-4]
12[+4]
14[+1]
2[-1]
8[-1]
62[-9]
15[-8]
28[-22]
7[-1]
17[+1]
19[-6]
2[-4]
20[-1]
11[-10]
11[+2]
6[-2]
20[+3]
7[-7]
14[0]
0[0]
4[0]0
[0]
10[-7]
0[0]
4[+1]
0[0]
Topsoil MoistureThis product was prepared by theUSDA Office of the Chief Economist (OCE)World Agricultural Outlook Board (WAOB)
United StatesDepartment ofAgriculture
Data obtained from USDA National Agricultural Statistics Service weekly Crop Progressreports. These reports are available through http://www.nass.usda.gov/Publications/.
Top ## - Percent Surplus
[Bottom ##] - Change from Last WeekSurplus
Change from Last Week
11
-1
48 States
Percent SurplusWeek Ending - August 28, 2016
Percent90 - 10080 - 8970 - 7960 - 6950 - 5940 - 4930 - 3920 - 2910 - 19 0 - 9
33[-20]
70[0]
43[+5]
73[-5]
31[+1]
2[0]
65[-5]
31[+1]
40[0]
48[-1]
62[+3]
44[+2]
61[+6]
17[-2]
38[+1]
5[0]
21[+3]
39[-2]
9[-2]
36[+1]
62[+9]
3[-1]
5[-2]
4[0]
7[-3]
35[+2]
34[+4]
47[-2]
1[+1]
16[+3]
38[+1]
22[+1]
35[-3]
18[-4]
6[-4]
46[+20]
39[+7]
18[+4]
45[-10]
28[+11]
20[+2]
70[-1]
66[-2]95
[+5]
30[+8]
80[+9]
66[+21]
Topsoil MoistureThis product was prepared by theUSDA Office of the Chief Economist (OCE)World Agricultural Outlook Board (WAOB)
United StatesDepartment ofAgriculture
Percent Short to Very ShortWeek Ending - August 28, 2016
Data obtained from USDA National Agricultural Statistics Service weekly Crop Progressreports. These reports are available through http://www.nass.usda.gov/Publications/.
Top ## - Percent Short to Very Short
[Bottom ##] - Change from Last WeekShort to Very Short
Change from Last Week
25
-2
48 States
Percent90 - 10080 - 8970 - 7960 - 6950 - 5940 - 4930 - 3920 - 2910 - 19 0 - 9

August 30, 2016 Weekly Weather and Crop Bulletin 17
Crop Progress and Condition Week Ending August 28, 2016
Weekly U.S. Progress and Condition Data provided by USDA/NASS
8[-2]
0[0]
2[0]
0[0]
3[-1]
5[0]
2[0]
2[+1]
1[0] 2
[-1]
1[0]
2[0]
8[0]
0[0]
20[-1]1
[-2]
4[+1]
2[+1]
19[0]
10[-1]
9[0]
10[0]
1[-4]
16[+1]
10[+3]
12[+1]
2[-1]
15[0]
53[-3]
14[-3]
3[-1]
22[-17]
7[-2]
4[-1]
6[-1]
19[-5]
1[-2]
11[+2]
4[-2]
4[-2]
0[0]
5[-1]
3[+3]
2[+2]
13[-3]
0[0]
4[-1]
0[0]
Subsoil MoistureThis product was prepared by theUSDA Office of the Chief Economist (OCE)World Agricultural Outlook Board (WAOB)
United StatesDepartment ofAgriculture
Data obtained from USDA National Agricultural Statistics Service weekly Crop Progressreports. These reports are available through http://www.nass.usda.gov/Publications/.
Top ## - Percent Surplus
[Bottom ##] - Change from Last WeekSurplus
Change from Last Week
8
-1
48 States
Percent SurplusWeek Ending - August 28, 2016
Percent90 - 10080 - 8970 - 7960 - 6950 - 5940 - 4930 - 3920 - 2910 - 19 0 - 9
37[-15]
80[0]
46[+4]
55[-1]
27[-1]
3[0]
65[-5]
26[+2]
37[0]
50[+3]
65[+3]
33[0]
45[+2]
55[+4]
18[-2]
44[+1]
10[0]
20[+1]
9[-2]
34[+4]
58[+5]
4[-2]
26[0]
8[-1]
5[-2]
42[-2]
26[+2]
47[-3]
2[+2]
13[-5]
43[+2]
40[-3]
30[-6]
5[+1]
10[-6]
37[-4]
38[+16]
31[+7]
17[+5]
23[+5]
22[+1]
61[-3]
91[+4]
22[+2]
58[-12]
89[+9]
60[+12]
Subsoil MoistureThis product was prepared by theUSDA Office of the Chief Economist (OCE)World Agricultural Outlook Board (WAOB)
United StatesDepartment ofAgriculture
Percent Short to Very ShortWeek Ending - August 28, 2016
Data obtained from USDA National Agricultural Statistics Service weekly Crop Progressreports. These reports are available through http://www.nass.usda.gov/Publications/.
Top ## - Percent Short to Very Short
[Bottom ##] - Change from Last WeekShort to Very Short
Change from Last Week
26
-1
48 States
Percent90 - 10080 - 8970 - 7960 - 6950 - 5940 - 4930 - 3920 - 2910 - 19 0 - 9
18 Weekly Weather and Crop Bulletin August 30, 2016
For additional information contact: [email protected]
International Weather and Crop Summary
August 21-27, 2016 International Weather and Crop Highlights and Summaries provided by USDA/WAOB
HIGHLIGHTS
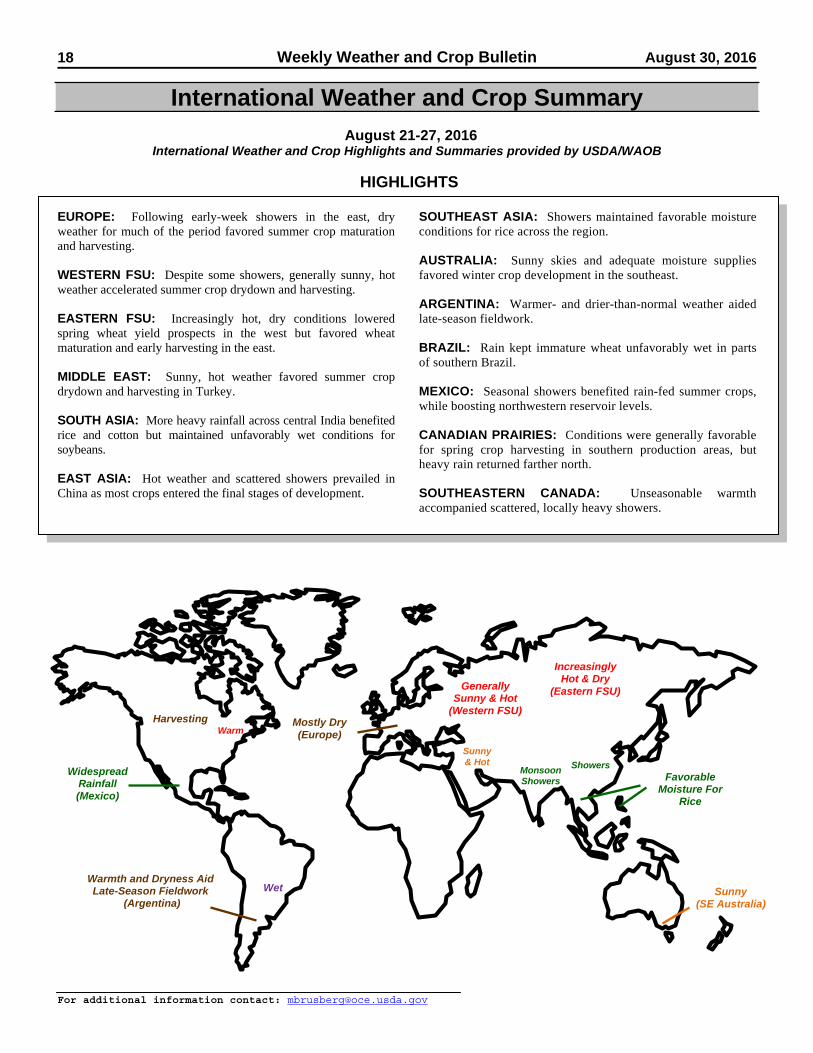
EUROPE: Following early-week showers in the east, dry weather for much of the period favored summer crop maturation and harvesting. WESTERN FSU: Despite some showers, generally sunny, hot weather accelerated summer crop drydown and harvesting. EASTERN FSU: Increasingly hot, dry conditions lowered spring wheat yield prospects in the west but favored wheat maturation and early harvesting in the east. MIDDLE EAST: Sunny, hot weather favored summer crop drydown and harvesting in Turkey. SOUTH ASIA: More heavy rainfall across central India benefited rice and cotton but maintained unfavorably wet conditions for soybeans. EAST ASIA: Hot weather and scattered showers prevailed in China as most crops entered the final stages of development.
SOUTHEAST ASIA: Showers maintained favorable moisture conditions for rice across the region. AUSTRALIA: Sunny skies and adequate moisture supplies favored winter crop development in the southeast. ARGENTINA: Warmer- and drier-than-normal weather aided late-season fieldwork. BRAZIL: Rain kept immature wheat unfavorably wet in parts of southern Brazil. MEXICO: Seasonal showers benefited rain-fed summer crops, while boosting northwestern reservoir levels. CANADIAN PRAIRIES: Conditions were generally favorable for spring crop harvesting in southern production areas, but heavy rain returned farther north. SOUTHEASTERN CANADA: Unseasonable warmth accompanied scattered, locally heavy showers.
Sunny & Hot
Widespread Rainfall (Mexico)
Mostly Dry (Europe)
Wet
Increasingly Hot & Dry
(Eastern FSU)
Sunny (SE Australia)
Generally Sunny & Hot
(Western FSU)
Monsoon Showers
Warmth and Dryness Aid Late-Season Fieldwork
(Argentina)
Harvesting
Showers
Warm
Favorable Moisture For
Rice

August 30, 2016 Weekly Weather and Crop Bulletin 19
For additional information contact: [email protected]
Despite early-week showers in the east, generally dry weather for much of the week accelerated summer crop drydown and harvesting. Sunny skies across central and western Europe favored drydown and harvesting of corn and sunflowers. Likewise, winter rapeseed planting gained momentum in France and Germany. However, late-week showers (2-20 mm, locally more) in Spain slowed fieldwork but provided topsoil moisture in advance of upcoming winter grain planting. In the north, despite unsettled weather over much of the United Kingdom (1-50 mm), drier conditions (less than 10 mm) in southeastern England
allowed spring grain maturation and seasonal fieldwork to proceed without significant delay. Meanwhile, widespread showers (10-60 mm, locally more) early in the period over eastern Europe slowed summer crop maturation and harvesting but boosted soil moisture for winter crop planting and establishment. Sunny skies followed, allowing crop maturation and harvesting to resume. Overall, conditions for corn, sunflowers, and soybeans are improved over last year’s heat and drought impacted crops, although localized dryness has adversely impacted summer crops in the lower Danube River Valley.
EUROPE

20 Weekly Weather and Crop Bulletin August 30, 2016
For additional information contact: [email protected]
Despite scattered showers, mostly sunny, hot conditions accelerated summer crop maturation and harvesting. Showers and thunderstorms (2-60 mm) dotted the region, though rainfall was not widespread or heavy enough to cause significant fieldwork delays. Temperatures for the week averaged 3 to 8°C above normal, which coupled with generally sunny skies
promoted drydown and early harvesting of corn and sunflowers in Moldova, Ukraine, and Russia. Winter wheat sowing was able to proceed as well in these same areas. Spring wheat harvesting in the eastern Volga District also gained momentum, though crop yield prospects in this part of Russia have been lowered by protracted heat and dryness during grain fill.
WESTERN FSU
August 30, 2016 Weekly Weather and Crop Bulletin 21
For additional information contact: [email protected]
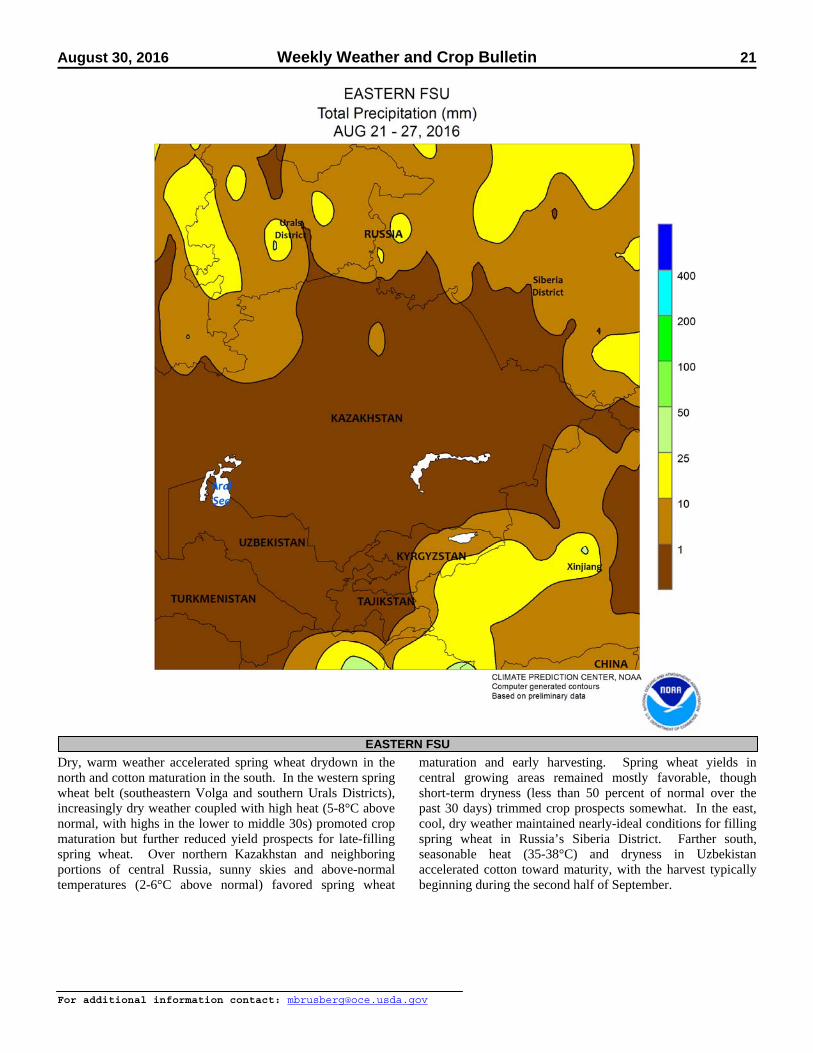
Dry, warm weather accelerated spring wheat drydown in the north and cotton maturation in the south. In the western spring wheat belt (southeastern Volga and southern Urals Districts), increasingly dry weather coupled with high heat (5-8°C above normal, with highs in the lower to middle 30s) promoted crop maturation but further reduced yield prospects for late-filling spring wheat. Over northern Kazakhstan and neighboring portions of central Russia, sunny skies and above-normal temperatures (2-6°C above normal) favored spring wheat
maturation and early harvesting. Spring wheat yields in central growing areas remained mostly favorable, though short-term dryness (less than 50 percent of normal over the past 30 days) trimmed crop prospects somewhat. In the east, cool, dry weather maintained nearly-ideal conditions for filling spring wheat in Russia’s Siberia District. Farther south, seasonable heat (35-38°C) and dryness in Uzbekistan accelerated cotton toward maturity, with the harvest typically beginning during the second half of September.
EASTERN FSU

22 Weekly Weather and Crop Bulletin August 30, 2016
For additional information contact: [email protected]
Seasonably dry, hot weather promoted summer crop maturation and harvesting. In Turkey, sunflowers are usually harvested during the latter half of August, while corn harvesting begins in
August and peaks in September. The cotton harvest typically starts in early September. Winter grains are planted in mid-autumn, with the seasonal arrival of cooler weather.
MIDDLE EAST

August 30, 2016 Weekly Weather and Crop Bulletin 23
For additional information contact: [email protected]
Heavy monsoon showers continued across central and northern India, with most areas receiving 50 to over 100 mm. The rainfall maintained adequate to abundant water supplies for rice in the east and boosted water reserves as far south as Andhra Pradesh. The rainfall also improved moisture conditions for groundnuts and cotton in Gujarat following dryness during the middle part of August. However, the wet weather was unwelcome for soybeans in Madhya Pradesh, where rainfall totals since July 1 were at a 30-year high. Meanwhile in Maharashtra, unseasonable dryness persisted for cotton and oilseeds. With the
exception of a 1-day rainfall total of nearly 200 mm in mid-August, rainfall has been below normal for much of the month. The dryness likely had little impact on soybeans and groundnuts following well-above normal rainfall during the first half of the season but could reduce cotton yields. In other parts of the region, heavy seasonal showers (50-100 mm or more) kept rice well watered in Bangladesh, while 25 to 50 mm or more in northern Pakistan boosted irrigation reserves for cotton and rice. However in Sri Lanka, dry weather for much of August increased irrigation demands of rice.
SOUTH ASIA

24 Weekly Weather and Crop Bulletin August 30, 2016
For additional information contact: [email protected]
Rainfall was mostly scattered across eastern China, as showers continued to miss key corn areas in the northeast. Little if any rainfall was reported in western Heilongjiang and adjoining areas of Inner Mongolia and Jilin. Untimely dryness throughout the reproductive phase has reduced yield prospects for corn and time was running out for rainfall to have any further benefit. In the remainder of the northeast, light to moderate showers (10-25 mm) maintained generally favorable soil moisture for corn and soybeans. Farther south, showers were scattered with amounts varying from 1 mm to locally over 50 mm. Most summer crops in the south were in the latter stages of development and likely beginning to mature. Late-crop rice in the southern provinces and corn on the North
China Plain were likely just entering reproduction, though. Along with the scattered showers, unseasonably hot weather (temperatures averaging 1-3°C above normal) prevailed through much of southern China and in the drier areas of the northeast. Elsewhere in the region, moderate showers (10-25 mm) on the Korean Peninsula did little to alleviate significant seasonal rainfall deficits. Though, irrigation for rice appeared sufficient to maintain yield prospects. In Japan, three tropical cyclones (Mindulle, Kompasu, Lionrock) from last week lingered into the current period and dropped more heavy showers (50-100 mm or more) in the north. The 2-week rainfall total in northern Honshu approached 200 mm, while in Hokkaido, the total was nearly 300 mm.
EASTERN ASIA

August 30, 2016 Weekly Weather and Crop Bulletin 25
For additional information contact: [email protected]
Widespread showers (50-100 mm or more) in Thailand and environs maintained adequate soil moisture for rain-fed rice while further improving irrigation reserves. The rainfall also stemmed a brief period of dryness occurring in the middle part of August. In the Philippines, heavy showers continued (100-200 mm or more) in the northwest, with more seasonable amounts (25-100 mm) in the remainder of the country, keeping rice and corn well watered. The extremely wet weather during
August in western Luzon eradicated any lingering dryness from earlier in the season. However, the lack of tropical cyclone activity in the east has kept seasonal rainfall below normal for relatively minor rice growing areas. Meanwhile, showers (25-50 mm or more) in oil palm areas of Malaysia and Indonesia maintained favorable moisture conditions over the last 90 days, but significant 6-month deficits continued in western growing areas of Malaysia.
SOUTHEAST ASIA
26 Weekly Weather and Crop Bulletin August 30, 2016
For additional information contact: [email protected]
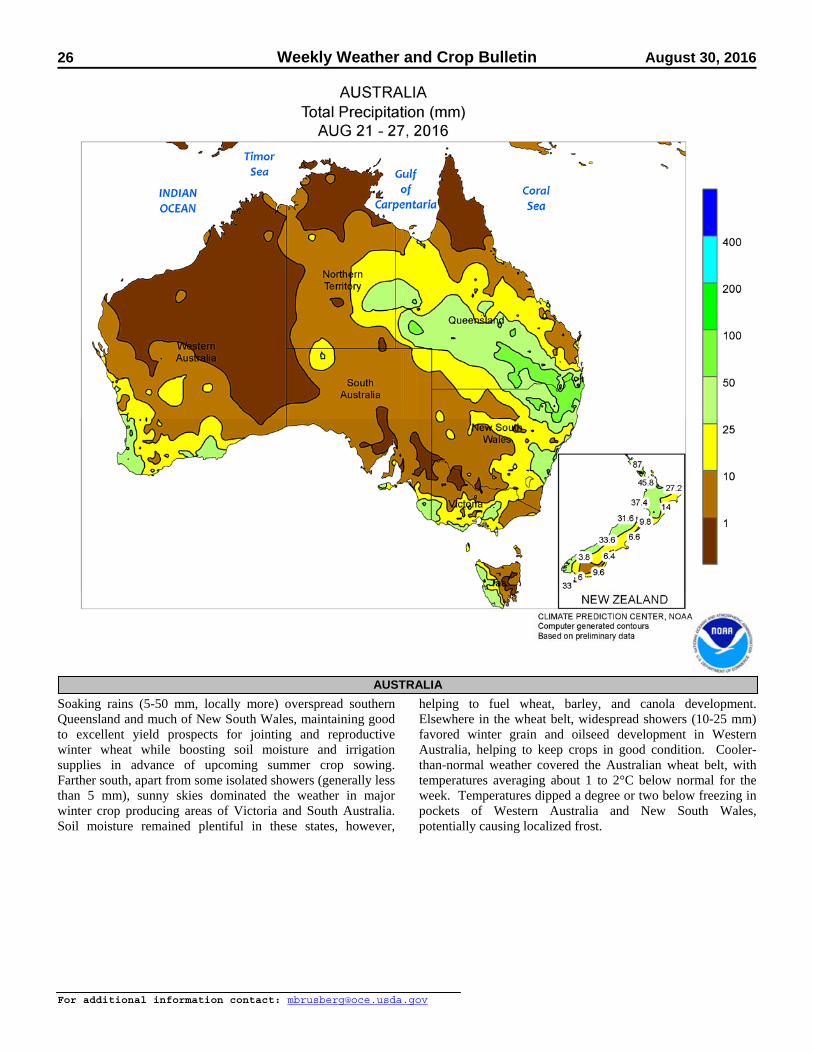
Soaking rains (5-50 mm, locally more) overspread southern Queensland and much of New South Wales, maintaining good to excellent yield prospects for jointing and reproductive winter wheat while boosting soil moisture and irrigation supplies in advance of upcoming summer crop sowing. Farther south, apart from some isolated showers (generally less than 5 mm), sunny skies dominated the weather in major winter crop producing areas of Victoria and South Australia. Soil moisture remained plentiful in these states, however,
helping to fuel wheat, barley, and canola development. Elsewhere in the wheat belt, widespread showers (10-25 mm) favored winter grain and oilseed development in Western Australia, helping to keep crops in good condition. Cooler-than-normal weather covered the Australian wheat belt, with temperatures averaging about 1 to 2°C below normal for the week. Temperatures dipped a degree or two below freezing in pockets of Western Australia and New South Wales, potentially causing localized frost.
AUSTRALIA

August 30, 2016 Weekly Weather and Crop Bulletin 27
For additional information contact: [email protected]
Generally warm, dry weather favored the late stages of seasonal fieldwork. Little to no rain fell in the main production areas of central and northern Argentina, and weekly average temperatures were 1 to 3°C above normal. Daytime highs ranged from the upper 10s and lower 20s (degrees C) in Buenos
Aires and La Pampa to the middle 30s in the far north; freezes were confined to traditionally cooler locations in the southwest. According to Argentina’s Ministry of Agriculture, corn was 90 percent harvested as of August 25, compared with 98 percent last year. Wheat planting was virtually complete at 99 percent.
ARGENTINA

28 Weekly Weather and Crop Bulletin August 30, 2016
For additional information contact: [email protected]
Unseasonably heavy rain covered a broad section of southern Brazil, keeping wheat unfavorably wet in some locations but providing abundant early-season moisture for summer crops. Rainfall totaled more than 25 mm over Parana and nearby locations of Rio Grande do Sul, with similar amounts recorded in southeastern Mato Grosso and along the northeastern coast of Bahia. Much of the rest of southern Brazil — including portions of Sao Paulo and southern Minas Gerais — reported 10 mm or more, causing localized delays in sugarcane and
coffee harvesting. However, according to reports emanating from Brazil, first crop corn planting is underway in some locations and can benefit from the early-season moisture. Weekly average temperatures were near to slightly below average in the wettest locations, although daytime highs reached the upper 30s toward the latter part of the week in southern Mato Grosso. Nighttime lows fell below 5°C from southern Parana through Rio Grande do Sul, but no freezes were recorded.
BRAZIL

August 30, 2016 Weekly Weather and Crop Bulletin 29
For additional information contact: [email protected]
Widespread rainfall maintained overall favorable conditions for rain-fed summer crops. Amounts were variable across the southern plateau (Jalisco to Puebla), ranging from 5 to 50 mm, accompanied by seasonable warmth (daytime highs reaching the upper 20s and lower 30s degrees C) that promoted growth of reproductive to filling corn. Pockets of heavy rain (50 to locally more than 100 mm) lingered over southern Veracruz and nearby locations in Oaxaca, otherwise rainfall tapered off from the previous week in the southeast
and along the southern coast, bringing some relief from previous periods of heavy showers. Amounts were also lower across northern Mexico, although beneficial rain continued in previously dry north-central agricultural areas (notably eastern Chihuahua and Coahuila), boosting irrigation reserves for cotton. However, summer warmth (daytime highs reaching the upper 30s) maintained high moisture requirements of livestock in the far northwest (Sonora) and northeast (Tamaulipas and Nuevo Leon).
MEXICO
30 Weekly Weather and Crop Bulletin August 30, 2016
For additional information contact: [email protected]
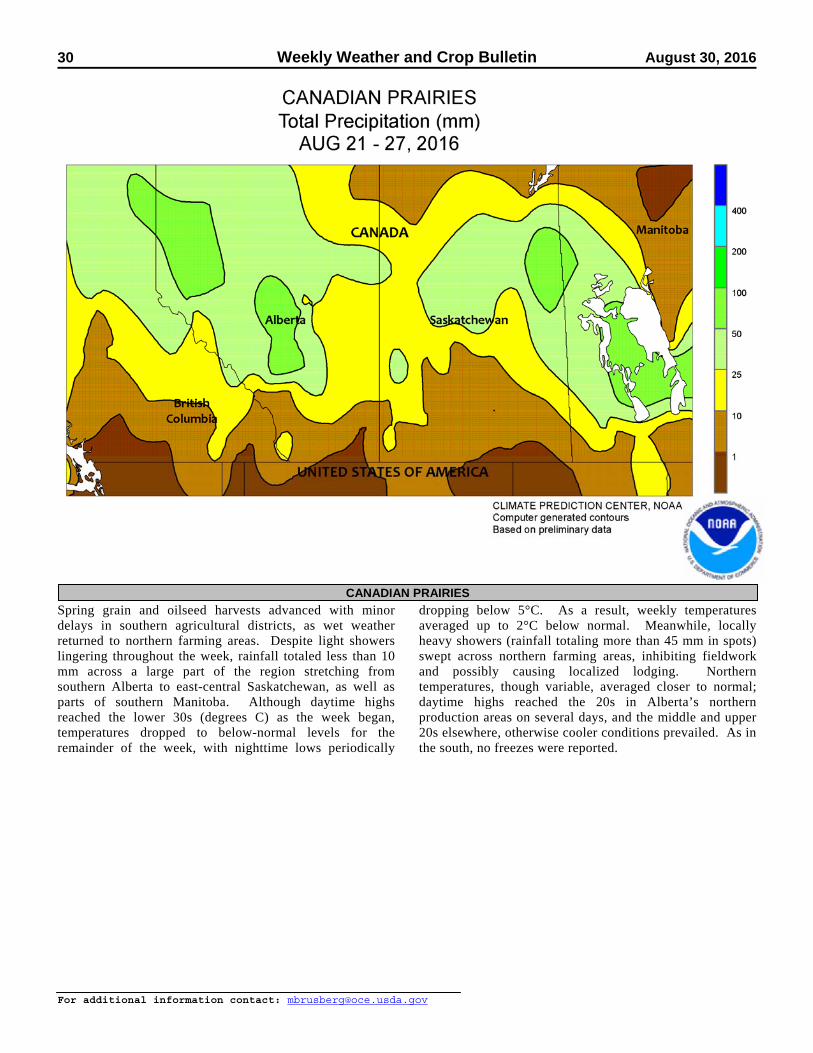
Spring grain and oilseed harvests advanced with minor delays in southern agricultural districts, as wet weather returned to northern farming areas. Despite light showers lingering throughout the week, rainfall totaled less than 10 mm across a large part of the region stretching from southern Alberta to east-central Saskatchewan, as well as parts of southern Manitoba. Although daytime highs reached the lower 30s (degrees C) as the week began, temperatures dropped to below-normal levels for the remainder of the week, with nighttime lows periodically
dropping below 5°C. As a result, weekly temperatures averaged up to 2°C below normal. Meanwhile, locally heavy showers (rainfall totaling more than 45 mm in spots) swept across northern farming areas, inhibiting fieldwork and possibly causing localized lodging. Northern temperatures, though variable, averaged closer to normal; daytime highs reached the 20s in Alberta’s northern production areas on several days, and the middle and upper 20s elsewhere, otherwise cooler conditions prevailed. As in the south, no freezes were reported.
CANADIAN PRAIRIES
August 30, 2016 Weekly Weather and Crop Bulletin 31
For additional information contact: [email protected]
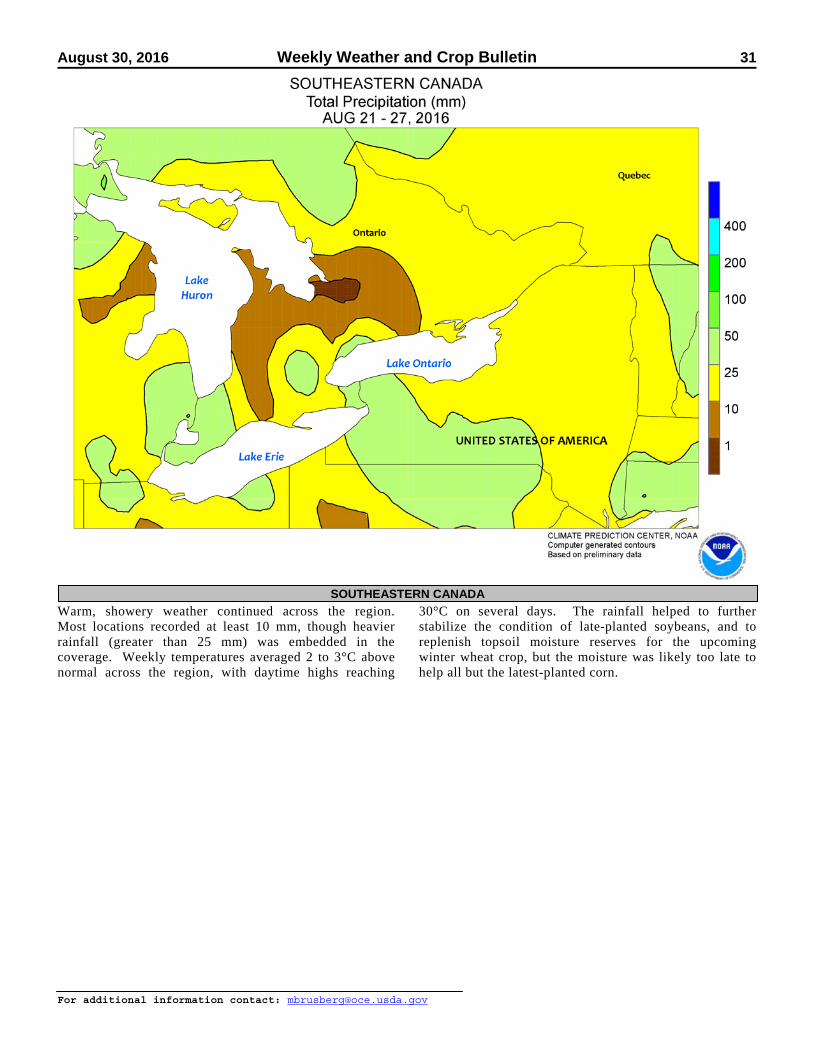
Warm, showery weather continued across the region. Most locations recorded at least 10 mm, though heavier rainfall (greater than 25 mm) was embedded in the coverage. Weekly temperatures averaged 2 to 3°C above normal across the region, with daytime highs reaching
30°C on several days. The rainfall helped to further stabilize the condition of late-planted soybeans, and to replenish topsoil moisture reserves for the upcoming winter wheat crop, but the moisture was likely too late to help all but the latest-planted corn.
SOUTHEASTERN CANADA
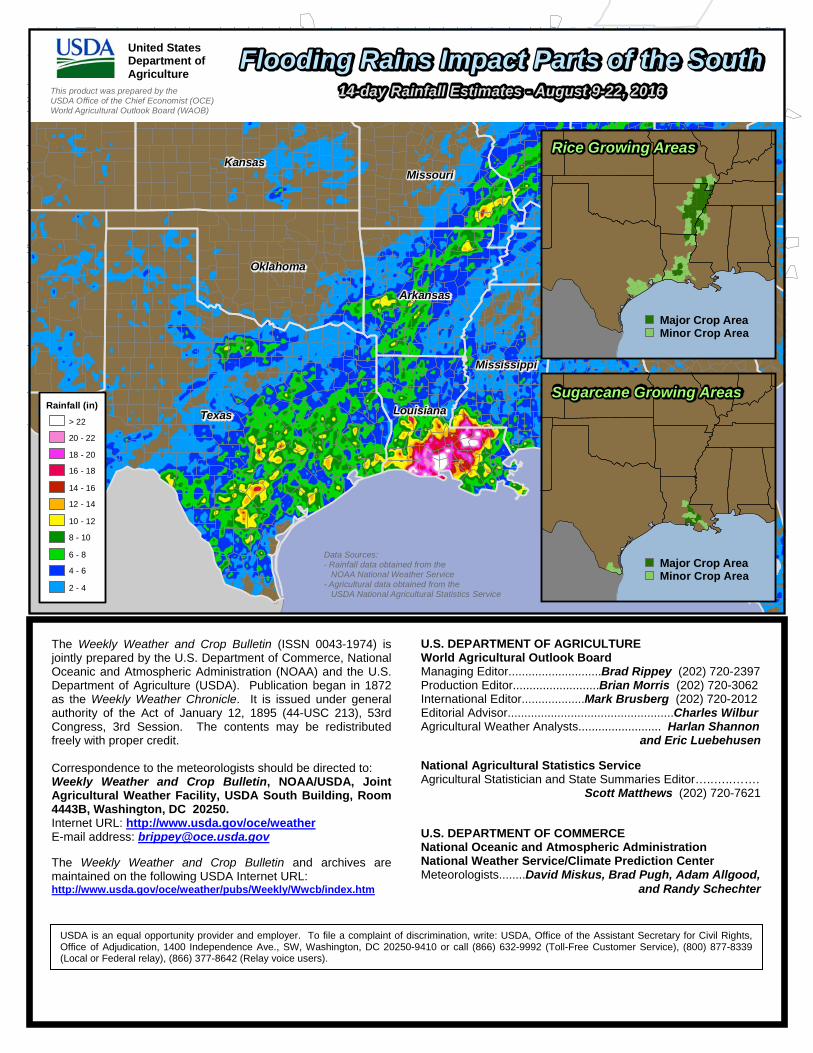
Data Sources:- Rainfall data obtained from the NOAA National Weather Service- Agricultural data obtained from the USDA National Agricultural Statistics Service
ArkansasArkansas
Flooding Rains Impact Parts of the SouthFlooding Rains Impact Parts of the South14-day Rainfall Estimates - August 9-22, 201614-day Rainfall Estimates - August 9-22, 2016This product was prepared by the
USDA Office of the Chief Economist (OCE)World Agricultural Outlook Board (WAOB)
United StatesDepartment ofAgriculture
TexasTexas
OklahomaOklahoma
LouisianaLouisiana
KansasKansasMissouriMissouri
MississippiMississippi
Sugarcane Growing AreasRainfall (in)
> 22
20 - 22
18 - 20
16 - 18
10 - 12
14 - 16
12 - 14
8 - 10
2 - 4
6 - 8
4 - 6
Rice Growing Areas
Major Crop AreaMinor Crop Area
Major Crop AreaMinor Crop Area
The Weekly Weather and Crop Bulletin (ISSN 0043-1974) is jointly prepared by the U.S. Department of Commerce, National Oceanic and Atmospheric Administration (NOAA) and the U.S. Department of Agriculture (USDA). Publication began in 1872 as the Weekly Weather Chronicle. It is issued under general authority of the Act of January 12, 1895 (44-USC 213), 53rd Congress, 3rd Session. The contents may be redistributed freely with proper credit. Correspondence to the meteorologists should be directed to: Weekly Weather and Crop Bulletin, NOAA/USDA, Joint Agricultural Weather Facility, USDA South Building, Room 4443B, Washington, DC 20250. Internet URL: http://www.usda.gov/oce/weather E-mail address: [email protected] The Weekly Weather and Crop Bulletin and archives are maintained on the following USDA Internet URL: http://www.usda.gov/oce/weather/pubs/Weekly/Wwcb/index.htm
U.S. DEPARTMENT OF AGRICULTURE World Agricultural Outlook Board Managing Editor............................Brad Rippey (202) 720-2397 Production Editor..........................Brian Morris (202) 720-3062 International Editor...................Mark Brusberg (202) 720-2012 Editorial Advisor..................................................Charles Wilbur Agricultural Weather Analysts......................... Harlan Shannon and Eric Luebehusen
National Agricultural Statistics Service Agricultural Statistician and State Summaries Editor…..…..……. Scott Matthews (202) 720-7621 U.S. DEPARTMENT OF COMMERCE National Oceanic and Atmospheric Administration National Weather Service/Climate Prediction Center Meteorologists........David Miskus, Brad Pugh, Adam Allgood,
and Randy Schechter
USDA is an equal opportunity provider and employer. To file a complaint of discrimination, write: USDA, Office of the Assistant Secretary for Civil Rights, Office of Adjudication, 1400 Independence Ave., SW, Washington, DC 20250-9410 or call (866) 632-9992 (Toll-Free Customer Service), (800) 877-8339 (Local or Federal relay), (866) 377-8642 (Relay voice users).