Volume 10 Number 11, November 2016 ISSN 1996 - 0794
104
African Journal of Food Science Volume 10 Number 11, November 2016 ISSN 1996-0794
Transcript of Volume 10 Number 11, November 2016 ISSN 1996 - 0794

African Journal of
Food Science
Volume 10 Number 11, November 2016 ISSN 1996-0794


ABOUT AJFS The African Journal of Food Science (AJFS) (ISSN 1996-0794) is published monthly (one volume per year) by Academic Journals.
African Journal of Food Science (AJFS) provides rapid publication of articles in all areas of Food Science such as Sensory analysis, Molecular gastronomy, Food safety, Food technology etc. The Journal welcomes the submission of manuscripts that meet the general criteria of significance and sc ientific excellence. Papers will be published shortly after acceptance. All articles published in AJFS are peer-reviewed.
Contact Us Editorial Office: [email protected]
Help Desk: [email protected]
Website: http://academicjournals.org/AJFS
Submit manuscript online http://ms.academicjournals.me/
Editors Dr. Hu Xiao-Qing
Thaddeus Chukwuemeka Ezeji Ohio State University and Ohio State Agricultural and Development Center (OARDC) Department of Animal Sciences 1680 Madison Avenue Wooster, Ohio 44691 USA.
Prof. Kofi E. Aidoo Department of Biological and Biomedical Sciences Glasgow Caledonian University Cowcadden Road Glasgow G4 0BA.
Dr. Barakat S.M. Mahmoud Food Safety/Microbiology Experimental Seafood Processing Laboratory Costal Research and Extension Centre Mississippi State University 3411 Frederic Street Pascagoula, MS 39567 USA.
Prof. Dr. A.N. Mirsa Department of Biosciences and Biotechnology, School of Biotechnology Fakia Mohan University, Vyasa Vihar, Balsore-756019, India.
Dr. Neela Badrie Department of Food Production, Faculty of Science and Agriculture, University of the West Indies, St. Augustine, Republic of Trinidad and Tobago, West Indies.
Prof. Yulong Yin Institute of Subtropical Agriculture (ISA), The Chinese Academy of Science (CAS), Hunan, Changsha 410125, Post Box 10, China.
State Key Lab of Food Science and Technology, Jiangnan University, 1800 Lihu Ave., Wuxi 214122, China.
Dr. R. A. Siddique Department of Veterinary Biochemistry College of Veterinary Science and Animal Husbandry Navsari Agricultural University, Navsari, 396450 Gujarat, India.
Dr. Brnčid Mladen Faculty of Food Technology and Biotechnology; Pierottijeva 6; 10000 Zagreb.
Dr. Jianbo Xiao Institute of Chinese Medical Sciences State Key Laboratory of Quality Research in Chinese Medicine University of Macau,Macau
Dr. Petr Konvalina, Ing University of South Bohemia in Ceske Budejovice, Faculty of Agriculture, Studentska 13, České Budějovice, Czech Republic
Dr. Ashish Kumar Singh Senior Scientist, Dairy Technology Division National Dairy Research Institute, Karnal-132001 Haryana, India.
Dr. K. Pandima Devi Department of Biotechnology Alagappa University Karaikudi- 630 003 Tamil Nadu India.

Editorial Board Dr. Chakradhar Reddy Dr. Khaled A. Osman
Division of Gastroenterology Department of Plant Production and Protection
University of Miami/Jackson Memorial Hospital College of Agriculture & Veterinary Medicine,
Miami, Florida, U. S. A. Qassim University, Buriadah, Al-Qassim
Dr. Sara Chelland Campbell P.O. Box 6622
Department of Nutrition, Food and Exercise Sciences Saudi Arabia.
Florida State University Tallahassee, Florida Dr. Olusegun Olaoye
U. S. A. Division of Food Sciences University of Nottingham
Dr. Naveen Dixit United Kingdom.
University of Florida Institute of Food and Agricultural Sciences Dr. Anastasios Koulaouzidis
Southwest Florida Research and Education Center Staff Gastroenterologist
U. S. A. Centre of Liver & Digestive Disorders Royal Infirmary of Edinburgh
Dr. M. Ayub Hossain 51 Little France Crescent
Bangladesh Agricultural Research Institute United Kingdom.
Gazipur-1701 Bangladesh. Dr. Ding
Dr . Aline Lamien-Meda Department of Respiratory Diseases,
Department of Biochemistry and Phytochemistry General Hospital of Chinese People’s Armed Police Forces
Institut für Angewandte Botanik und Pharmakognosie Beijing,
Veterinärmedizinische Universität Wien, Veterinärplatz 1, China.
A-1210 Wien, Austria. Dr. Ashok Kumar Malik
Department of Chemistry,
Dr. Olalekan Badmus CDLU, Sirsa,
Research and development Team, Haryana
Thames water, Leeds University, Dr. Chongbi Li
United kingdom. Biotechnology Field. Institute of Biopharmaceutical Engineering ,
Dr. Rui Cruz Zhaoqing University,
ADEA-Escola Superior de Tecnlogia China.
Universidade do Algarve Campus da Penha, Estrada da Penha Dr. Odara Boscolo
8005-139 Faro National Museum / Federal University of Rio de Janeiro)-
Portugal. Phanerogamic systematic and ethnobotany Laboratory- Botany Department,
Prof. Zheng do Rio de Janeiro, Brazil
Key Laboratory for Biotechnology on Medicinal Plants of Jiangsu Province, Xuzhou Normal University, Dr. José Lavres Junior
Xuzhou 221116, University of São Paulo,
China. Center for Nuclear Energy in Agriculture, São Paulo -Brazil Dr. Gokben Ozbey Fırat University, Vocational School of Health Services, Engineering Campus, Elaziğ Turkey.

International Jourcal of Medicine and Medical Sciences
Afi
African Journal of Food Science
Table of Contents: Volume 10 Number 11 November, 2016
ARTICLES
Overview of dairy processing and marketing in East African dairy value chains: Opportunities and challenges 254
Michael N.I. Lokuruka
Acceptance and integration of biofortified vitamin A maize into common diets 263 Kelvin Mulungu
Biochemical properties of three lactic acid bacteria strains isolated from
traditional cassava starters used for attieke preparation 271
Krabi Ekoua Regina, Assamoi Allah Antoine, Ehon Ayawovi Fafadzi, Amani N’guessan Georges, Niamké Lamine Sébastien, Cnockaert Margo, Aerts Maarten and
Vandamme Peter
Determinants of seasonal food insecurity in the ‘green famine’ belt of Ethiopia:
The case of households in Belo-jiganfoy District, Benishangul-gumuz region 278
Guyu F. D. and Muluneh W.
Quantification of inositols in Jatropha curcas L. of different provenances
from Mexico 292
Jorge Martinez Herrera, Elizabeth Arguello García, Cristian Jimenez Martinez,
Gloria Davila Ortiz, Mercedez Muzquiz, Mercedez Martin Pedrosa
and Alejandro Varela Sandin
Vitamin A losses in a commercial food supply chain of fortified vegetable cooking
oil and maize flour: A case from Malawi 297
Ulemu K. Chimimba, Ishmael B. M. Kosamu and Lawrence Muhamba
Analysis and identification of the volatile compounds in melon-bitter leaf soup 302
Opeyemi Oyekunke Olabode and Gibson Lucky Arueya
Chemical, functional, rheological and sensory properties of amaranth flour
and amaranth flour based paste 313
Tanimola A. R., Otegbayo B. and Akinoso R.

African Journal of Food Science
Table of Contents: Volume 10 Number 11 November, 2016
Evaluation of dry matter, starch and beta-carotene content in orange-fleshed
sweet potato (Ipomoea batatas L.) genotypes tested in three agro-ecological
zones of Malawi 320
D. M. Kathabwalika, E. H. C. Chilembwe and V. M. Mwale
Volatile compound analysis of the leaves and seeds of Piper guineense using gas chromatography-mass spectrometry (GC-MS) 327
Ojinnaka, M. C., Ubbor, S. C., Okudu, H. O. and Uga, U.
Hygienic practices and critical control points along the milk collection chains in smallholder collection and bulking enterprises in Nakuru and Nyandarua
Counties, Kenya 333
Teresiah W. Ndungu, Mary Omwamba, Patrick S. Muliro and Gerard Oosterwijk
Nutritive values of some non-conventional leafy vegetables and scarcity food
plants of north east India 340
Chandra K. S., Dimple Gogoi, Gautam K. H. and Handique A. K.

Vol. 10(11) pp. 254-262, November 2016
DOI: 10.5897/AJFS2016.1465
Article Number: 4FC488060687
ISSN 1996-0794
Copyright © 2016
Author(s) retain the copyright of this article
http://www.academicjournals.org/AJFS
African Journal of Food Science
Review
Overview of dairy processing and marketing in East African dairy value chains: Opportunities and
challenges
Michael N.I. Lokuruka
Department of Food Science and Nutrition, Karatina University, Box 1957-10101, Karatina and, PSC, P.O. Box 30095-00100, Nairobi, Kenya.
Received 9 May, 2016; Accepted 5 August, 2016
Worldwide, the dairy sector is one of the fastest growing productive sectors. The global sector growth in the decade 2011 to 2020 is projected to be higher than that experienced in 2000 to 2010, mainly due to expected robust growth in developing countries. Global milk production in 2014 stood at about 800 million metric tons. India is the global leader in milk production accounting for 16% of output, with the USA coming second with 14.6% of global production, while Africa produces less than 10% of global output. Sub-Saharan Africa commands 0.2% of the global trade volume in the dairy sector. Egypt is the African Continental leader in milk output, as Africa remains the largest importer of milk powders, butter and ghee. The shortfalls in demand show potential investment opportunities and growth areas in the sector. The East African output of butter and ghee stands at about 15% of the African output of these products. Kenya and Uganda produce considerable amounts of processed dairy products, although, the milk processed rarely exceeds 12 to 15% of domestic milk supply, with most milk production being consumed at farm level. Tanzania produces more butter and ghee than other East African Community (EAC) members with Burundi been the least. Although, informal marketing channels, offering cheaper fresh milk are attractive, increasing decentralization of regulatory services, growing effectiveness of law enforcement and consumer awareness of the healthfulness of processed milk, will continue to reduce informal marketing of unprocessed fresh milk in EAC countries. Despite the quest for global export, the unmet domestic dairy products demand in EAC member states may slow entry into global markets. To meet the numerous requirements in export markets requires cautious, planned and systematic forays over time. Key words: East Africa, dairy value chains, processing, marketing, opportunities, challenges.
INTRODUCTION World and African dairy products status and outlook Globally, the cow is the major source of milk and dairy products for human consumption. Worldwide, the dairy sector is one of the fastest growing food sectors both in terms of volumes output, sales and real commodity
prices. The global growth in the current decade 2011 to 2020 is expected to be better than that experienced in the decade 2000 to 2010, mainly due to projected robust growth in developing countries (FAO, 2012). The dairy products expected to exhibit real growth include fresh milk, cheese, butter, fermented products, skim milk
Lokuruka 255
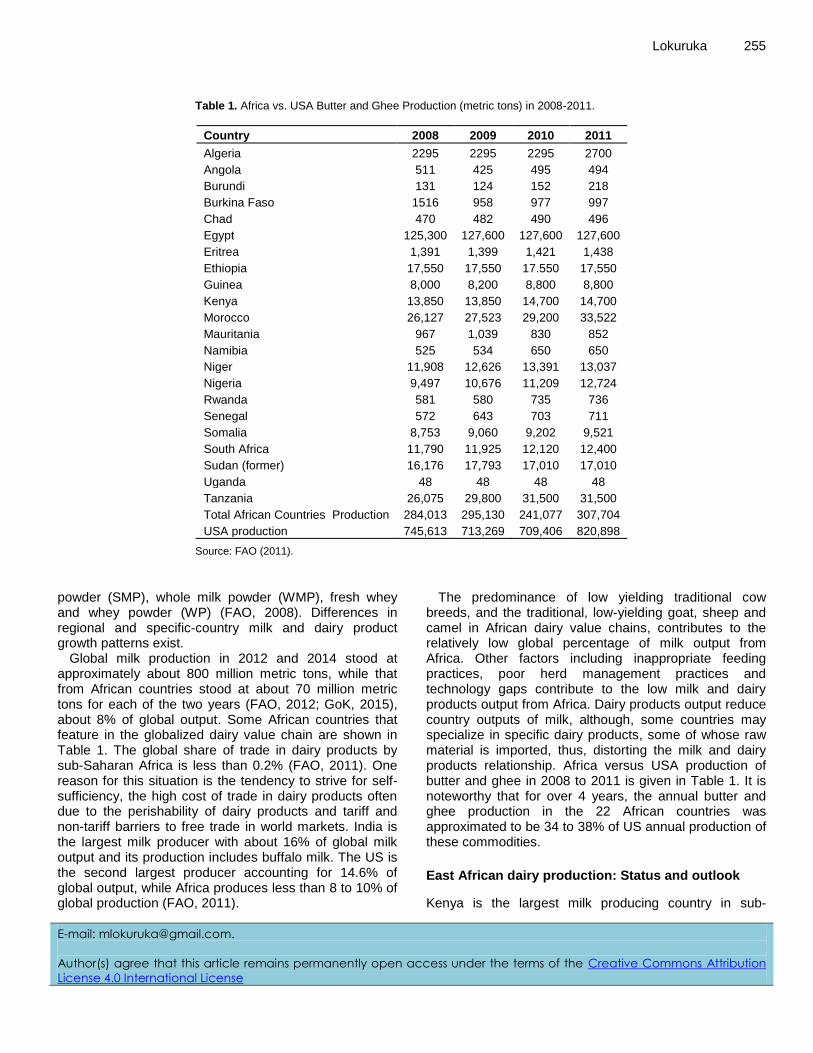
Table 1. Africa vs. USA Butter and Ghee Production (metric tons) in 2008-2011.
Country 2008 2009 2010 2011
Algeria 2295 2295 2295 2700
Angola 511 425 495 494
Burundi 131 124 152 218
Burkina Faso 1516 958 977 997
Chad 470 482 490 496
Egypt 125,300 127,600 127,600 127,600
Eritrea 1,391 1,399 1,421 1,438
Ethiopia 17,550 17,550 17.550 17,550
Guinea 8,000 8,200 8,800 8,800
Kenya 13,850 13,850 14,700 14,700
Morocco 26,127 27,523 29,200 33,522
Mauritania 967 1,039 830 852
Namibia 525 534 650 650
Niger 11,908 12,626 13,391 13,037
Nigeria 9,497 10,676 11,209 12,724
Rwanda 581 580 735 736
Senegal 572 643 703 711
Somalia 8,753 9,060 9,202 9,521
South Africa 11,790 11,925 12,120 12,400
Sudan (former) 16,176 17,793 17,010 17,010
Uganda 48 48 48 48
Tanzania 26,075 29,800 31,500 31,500
Total African Countries Production 284,013 295,130 241,077 307,704
USA production 745,613 713,269 709,406 820,898
Source: FAO (2011).
powder (SMP), whole milk powder (WMP), fresh whey and whey powder (WP) (FAO, 2008). Differences in regional and specific-country milk and dairy product growth patterns exist.
Global milk production in 2012 and 2014 stood at approximately about 800 million metric tons, while that from African countries stood at about 70 million metric tons for each of the two years (FAO, 2012; GoK, 2015), about 8% of global output. Some African countries that feature in the globalized dairy value chain are shown in Table 1. The global share of trade in dairy products by sub-Saharan Africa is less than 0.2% (FAO, 2011). One reason for this situation is the tendency to strive for self-sufficiency, the high cost of trade in dairy products often due to the perishability of dairy products and tariff and non-tariff barriers to free trade in world markets. India is the largest milk producer with about 16% of global milk output and its production includes buffalo milk. The US is the second largest producer accounting for 14.6% of global output, while Africa produces less than 8 to 10% of global production (FAO, 2011).
The predominance of low yielding traditional cow breeds, and the traditional, low-yielding goat, sheep and camel in African dairy value chains, contributes to the relatively low global percentage of milk output from Africa. Other factors including inappropriate feeding practices, poor herd management practices and technology gaps contribute to the low milk and dairy products output from Africa. Dairy products output reduce country outputs of milk, although, some countries may specialize in specific dairy products, some of whose raw material is imported, thus, distorting the milk and dairy products relationship. Africa versus USA production of butter and ghee in 2008 to 2011 is given in Table 1. It is noteworthy that for over 4 years, the annual butter and ghee production in the 22 African countries was approximated to be 34 to 38% of US annual production of these commodities.
East African dairy production: Status and outlook
Kenya is the largest milk producing country in sub-
E-mail: [email protected].
Author(s) agree that this article remains permanently open access under the terms of the Creative Commons Attribution
License 4.0 International License
256 Afr. J. Food Sci.
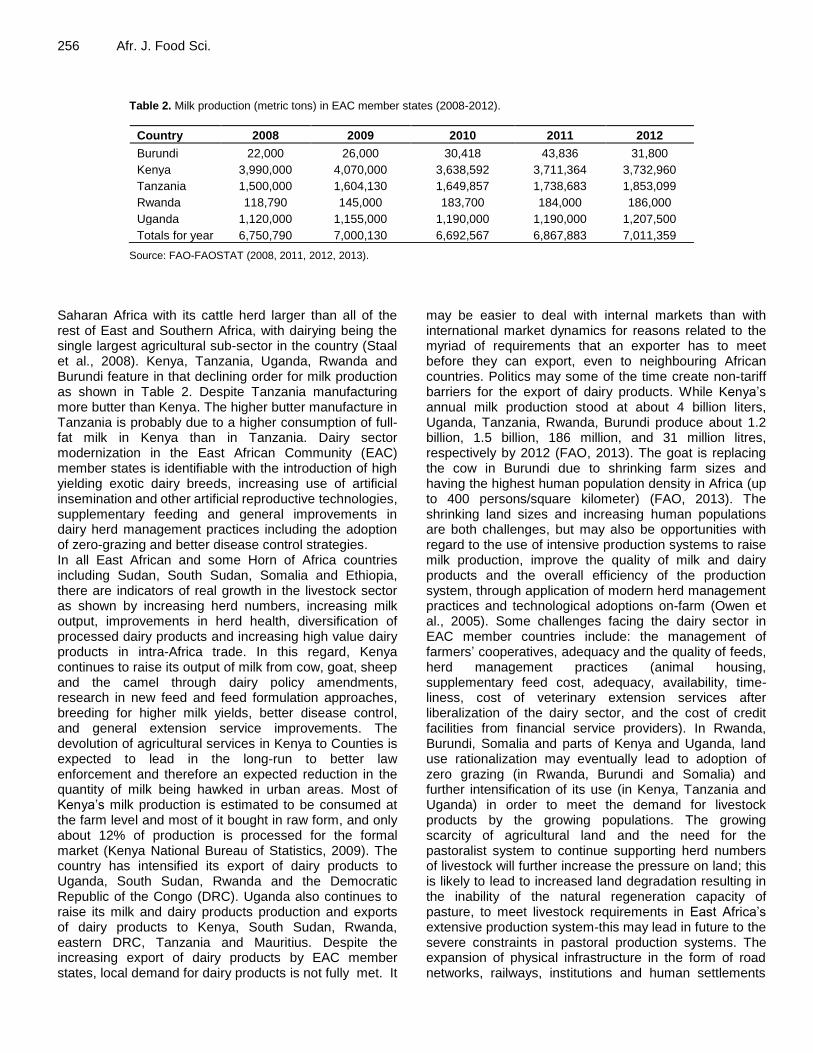
Table 2. Milk production (metric tons) in EAC member states (2008-2012).
Country 2008 2009 2010 2011 2012
Burundi 22,000 26,000 30,418 43,836 31,800
Kenya 3,990,000 4,070,000 3,638,592 3,711,364 3,732,960
Tanzania 1,500,000 1,604,130 1,649,857 1,738,683 1,853,099
Rwanda 118,790 145,000 183,700 184,000 186,000
Uganda 1,120,000 1,155,000 1,190,000 1,190,000 1,207,500
Totals for year 6,750,790 7,000,130 6,692,567 6,867,883 7,011,359
Source: FAO-FAOSTAT (2008, 2011, 2012, 2013). Saharan Africa with its cattle herd larger than all of the rest of East and Southern Africa, with dairying being the single largest agricultural sub-sector in the country (Staal et al., 2008). Kenya, Tanzania, Uganda, Rwanda and Burundi feature in that declining order for milk production as shown in Table 2. Despite Tanzania manufacturing more butter than Kenya. The higher butter manufacture in Tanzania is probably due to a higher consumption of full-fat milk in Kenya than in Tanzania. Dairy sector modernization in the East African Community (EAC) member states is identifiable with the introduction of high yielding exotic dairy breeds, increasing use of artificial insemination and other artificial reproductive technologies, supplementary feeding and general improvements in dairy herd management practices including the adoption of zero-grazing and better disease control strategies. In all East African and some Horn of Africa countries including Sudan, South Sudan, Somalia and Ethiopia, there are indicators of real growth in the livestock sector as shown by increasing herd numbers, increasing milk output, improvements in herd health, diversification of processed dairy products and increasing high value dairy products in intra-Africa trade. In this regard, Kenya continues to raise its output of milk from cow, goat, sheep and the camel through dairy policy amendments, research in new feed and feed formulation approaches, breeding for higher milk yields, better disease control, and general extension service improvements. The devolution of agricultural services in Kenya to Counties is expected to lead in the long-run to better law enforcement and therefore an expected reduction in the quantity of milk being hawked in urban areas. Most of Kenya’s milk production is estimated to be consumed at the farm level and most of it bought in raw form, and only about 12% of production is processed for the formal market (Kenya National Bureau of Statistics, 2009). The country has intensified its export of dairy products to Uganda, South Sudan, Rwanda and the Democratic Republic of the Congo (DRC). Uganda also continues to raise its milk and dairy products production and exports of dairy products to Kenya, South Sudan, Rwanda, eastern DRC, Tanzania and Mauritius. Despite the increasing export of dairy products by EAC member states, local demand for dairy products is not fully met. It
may be easier to deal with internal markets than with international market dynamics for reasons related to the myriad of requirements that an exporter has to meet before they can export, even to neighbouring African countries. Politics may some of the time create non-tariff barriers for the export of dairy products. While Kenya’s annual milk production stood at about 4 billion liters, Uganda, Tanzania, Rwanda, Burundi produce about 1.2 billion, 1.5 billion, 186 million, and 31 million litres, respectively by 2012 (FAO, 2013). The goat is replacing the cow in Burundi due to shrinking farm sizes and having the highest human population density in Africa (up to 400 persons/square kilometer) (FAO, 2013). The shrinking land sizes and increasing human populations are both challenges, but may also be opportunities with regard to the use of intensive production systems to raise milk production, improve the quality of milk and dairy products and the overall efficiency of the production system, through application of modern herd management practices and technological adoptions on-farm (Owen et al., 2005). Some challenges facing the dairy sector in EAC member countries include: the management of farmers’ cooperatives, adequacy and the quality of feeds, herd management practices (animal housing, supplementary feed cost, adequacy, availability, time-liness, cost of veterinary extension services after liberalization of the dairy sector, and the cost of credit facilities from financial service providers). In Rwanda, Burundi, Somalia and parts of Kenya and Uganda, land use rationalization may eventually lead to adoption of zero grazing (in Rwanda, Burundi and Somalia) and further intensification of its use (in Kenya, Tanzania and Uganda) in order to meet the demand for livestock products by the growing populations. The growing scarcity of agricultural land and the need for the pastoralist system to continue supporting herd numbers of livestock will further increase the pressure on land; this is likely to lead to increased land degradation resulting in the inability of the natural regeneration capacity of pasture, to meet livestock requirements in East Africa’s extensive production system-this may lead in future to the severe constraints in pastoral production systems. The expansion of physical infrastructure in the form of road networks, railways, institutions and human settlements

will compound the availability of land available for sector growth. Dairy products processing: Opportunities and challenges The most common outputs from milk processing generally include fermented products, skim milk, cheese, fresh and ripened cream, fresh whey, butter and ghee, skim milk powder, whole milk powder, ice cream, whey powder, casein and lesser derivatives of whey. While the level of technological development of the dairy sector in a country influences the nature of dairy products that are derived from milk processing, local demand or export demand, determine the derivatives of the local dairy industry. The size and the complexity of the dairy industry in a country largely determine the nature and amount of dairy products in the local dairy value chain. In most African dairy sectors, the most common derivatives of milk processing include pasteurized and long-life milk, cheese, yoghurt, fresh fluid whey, butter and ghee, and on a smaller but increasing scale, skimmed milk. The increasing demand for the latter is due to perceived benefits to human health of the consumption of reduced amounts of saturated fatty acids in diets (ISSFAL, 2004; Lokuruka, 2007). Opportunities in dairy processing Dairy technologists and dairy scientists, food technologists and animal production scientists contribute to the expansion and technological advances in the dairy sector and therefore, impact positively on the quality of the contribution of the dairy sector to a country’s economy. A number of east African universities offer degree courses in Food Technology, with degree courses in dairy technology being increasingly offered in the same institutions. The oldest department of dairy technology at Egerton University in Kenya has since the 1960s continued training a large number of dairy technologists for the East African region and beyond, including central, Southern Africa and the Caribbean. Most dairy factories in the East African region process pasteurized milk, yoghurt, cheese and long life fluid milk. The demand for dairy products presents opportunities for job creation along the dairy value chain, for increasing farm incomes and for value addition through processing and sale of products to domestic and export markets. In small scale and unregulated dairy industry, as is observed with dairy cooperatives, whey and its ingredients are either given to calves or are let out to pollute the environment, a practice that is increasingly coming under scrutiny in an effort to take care of the environment, cut down on wasteful resource disposal and maximize social and economic value from available animal resources.
Lokuruka 257
The further processing of these by-products of dairy processing, presents opportunities for value addition of what would normally go to waste in undeveloped dairy value chains. Whey can be dried further by water removal to allow recovery of casein, minerals and vitamins from the stream. In Africa, only the Republic of South Africa produces some whey dry powder. Some dairy by-products are part of the increasing range of minor food ingredients referred to as functional foods. Functional components in foods confer both functional properties in food processing as well as nutritional benefits to consumer health. In dairy foods, the functional ingredients include milk lactoferrins, immunoglobulins, peptides from milk protein hydrolysis, fatty acids such as conjugated linoleic acid (CLA), oligosaccharides and melatonin (De Wit, 1998). By-products of whey and the functional ingredients of dairy “waste” streams have industrial applications and value. These nutrients can be exported to developed countries for use in the pharmaceutical industry and as ingredients in high value food product preparations if they cannot be value added in developing producer countries. Condensed whey concentrate can be made from whey to take advantage of its potentially low cost and good nutrient profile. This potential product from whey processing can be turned to human food and animal feed in East African dairy value chains. As low yielding dairy cattle and goats predominate in East Africa, there is room for genetic breeding of high yielding milk animals. Although, semen importation mainly from the US and recently from the Republic of South Africa to improve the Kenyan dairy herd has been ongoing over many years, it has not translated into marked increase in milk output. This may be attributed to the unfavourable contribution of other factors that combine with genetic potential to influence the expected higher milk output, including feeding practices. Nevertheless, genetic breeding for high milk yield is necessary and recom-mended for dairy farmers (especially those on zero-grazing systems) and for government dairy experimental stations. These research stations serve as demonstration units and sales points for improved dairy animals to farmers.
Improved milk output reduces importation of dairy products thus, sparing foreign exchange and making more milk available to citizens thereby improving the nutritional status especially of poorer clients and farmer households, whose source of protein may often be milk as meats would be out of their reach due to their higher purchase prices. Further sector investment should focus on feed manufacture, artificial reproductive technology use, chilling facilities, cold transportation facilities and the manufacture of specialty dairy products for niche markets. As African and East African populations and economies grow, the demand for milk and dairy products will increase and the opportunities for more jobs and prosperity will result. The niche markets include high-end tourist hotels and hotel chains that import dairy products
258 Afr. J. Food Sci. from Europe or the US for foreign visitors to the EACmember states. The substitution of imports by locally manufactured dairy products will save foreign exchange, create employment through small and medium industrial dairy concerns, thus, supporting industrialization in EAC member states. In Africa, only the Republic of South Africa, Zimbabwe and Kenya in that declining order produce WMP (being 0.8% of World production of WMP) (FAO, 2011). Challenges in dairy processing Milk processing at an industrial scale is severely limited in Africa partly because dairy processing machinery is imported mainly from outside the African continent, and is expensive. In countries where commercial dairy processing plants have been set up, only a few dairy products are produced, sometimes, due to the lack of appropriate handling and processing technologies and the shortage of knowledgeable experts to manage the industry, professionally. When dairy scientists/ technologists are available, managerial expertise may lack. The lack of technology may also combine with the lack of market, an unstable market or a market located far away from the site of processing plants, to curtail processing capability. Long distance to market raises the price of dairy products making them out of reach of the poorer members of society for whom this nutritious food would be appropriate. In most dairy processing industries in Africa, skim milk powder or whole milk powder tend to be expensive to produce and are therefore mainly imported to meet unmet domestic demand for fluid milk. Lack of milk chilling facilities to cool milk enroute to market, or while waiting collection, may also discourage production and therefore curtail dairy products processing, and the outlay of a diversified product portfolio. As dry milk powders are mainly imported by the EAC member states, reconstituted milk made from dry powders tends to be expensive for the average consumer and this may limit milk and dairy products consumption; Industrial energy tends to be expensive in Kenya and relatively so in most East African economies thus, affecting the price of processed dairy products, accordingly. Nevertheless, there is no absolute certainty that local production of milk powders may be cheaper in view of the low milk volumes available, and the expense of importing expensive machinery, whose maintenance costs are prohibitive. Some challenges faced by processors include low milk deliveries to processing plants resulting from low production or low investment in processing capacity. During times of glut, low processing capacity means that the processor cannot take advantage of periods of high production, often leading to wastage (milking is not done and calves are left to suckle continuously, while at the other extreme, milk is left to spoil and is eventually poured out). This situation can lead to depressed prices
to farmers which can discourage high production. As glut often leads to low prices to farmers, low producer costs rarely translate to low consumer prices. In situations where investment in feed manufacture by local entrepreneurs is low, recommended animal feeds are imported and this tends to raise production costs. The high milk production costs are not compensated by higher payments for milk delivered to processors. Low prices or delayed payments often encourages the farmer to sell in the informal markets which pay on delivery as opposed to having to wait for the processor to pay after selling processed products in the formal markets. The incomes from selling milk to hawkers are thus higher for farmers and the prices to consumers may be lower (Thorpe et al., 2000). Hawking raw milk in informal markets continues to plague the Kenyan dairy value chain and the scenario may be similar in other EAC member states. Sometimes, the quality of the available animal feed is low, influencing animal production accordingly.
Dairy products marketing: Opportunities and challenges
Opportunities in dairy products marketing
It is a good practice that dairy factories are located near or in dairy farming areas; also, the nearer the market is to dairy processing factories, the lower the end product transportation and haulage costs. Low product haulage costs mean low product prices to consumers. Good infrastructure in the form of good roads and rail, potable water and extension services are necessary, if the cost of product handling has to be as low as possible, as the quality of infrastructure influences the ease of transporting raw materials from farm to factory and finished goods to market (Owen et al., 2005). Adequate and good quality water for food processing is critical for good quality end product and therefore its shelf life. The shorter the distance covered by the marketing team to deliver products to market, the higher the quality of products reaching customers and vice versa. Although, competition between fresh milk of different milk species is normally non-existent, the preference for cow milk is almost universal in East Africa except with the Hindus, for whom a cow is deity and who therefore do not consume its milk. However, there are ethnic-based differences in dairy products acceptance arising from familiarity with the dairy species.
Most pastoralist ethnic communities of East Africa accept milk from camel, goat, sheep and cow, but the acceptance of camel milk by non-pastoralist communities living in urban and/or rural areas is generally low, and the sale of such milk requires niche marketing, targetting mainly former nomads who have settled in urban areas. This scenario tends to discourage the expansion of the dairy industry based on other milks other than cow milk.

The location of the plant in a neighbourhood can provide employment opportunities and encourage dairy farming in a locality. Other areas of potential opportunity include the increasing decentralization of regulatory services, the growing effectiveness of law enforcement and consumer awareness of the healthfulness of processed milk. These factors will generally continue to impact positively on the marketing of processed milk and lead to a reduction in hawking of unprocessed milk through informal channels in East Africa and other developing countries. However, law enforcement is a necessary additional tool if the informal marketing of raw milk by hawkers has to be discouraged. Challenges in dairy products marketing Common challenges faced by small scale dairy farmers include long delays in payments for milk delivered to processing plants, and long distances covered by farmers over poor roads to dairy processing plants. Others include low investment in chilling plants which affects the quality of farmers’ milk resulting in rejection of considerable amounts of milk and low prices of milk delivered to factories compared to prices offered by hawkers and on-farm buyers of fresh milk. The low uptake of credit facilities by farmers and small scale processors due to their risk averseness, the impact of the multiplicity of collateral requirements for financial assistance, impacts negatively on dairy sector develop-ment (World Bank, 2011). Legislative hurdles in international marketing of dairy products Despite the allure of international markets, penetrating them is not as easy as may be perceived.
Food trade is regulated by statute. Regulatory agencies in importing countries generally issue licences to importing entities to apply for it at a fee. Normally, there are specific licences for specific foods and sometimes different licences are needed for the same food type depending on the state of the food; for example for processed fluid milk and processed frozen milk, different licences may be required to export them. Foods are also traded under specific agreements which may specify the manner of handling, quantities, the timing of deliveries, etc. but generally, the procedures follow the provisions provided for in the applicable laws. It is advisable for importers and exporters to know the applicable statutes and the manner of engagement of parties in trade transactions for succesful and long-term engagement. Milk and dairy products are some of the most controlled commodities in food trade as far as quality assurance and food safety is concerned. Normally, all imported foods are subject to inspections by regulatory agencies
Lokuruka 259 and can be “held” until tests show compliance with applicable importing country laws before they are allowed into market on authority of the regulatory authorities. Fulfilment of regulations for mandatory documentation at the point of entry is normally required before testing is done.
It is thus critical that proper procedures as necessary to obtain the appropriate documentation are followed to avoid economic losses and penalties that may be imposed incase of irregularities. An import permit or cargo clearance permit is usually the first document required at the point of entry before the food goes for testing for “fitness for purpose”. It is therefore incumbent upon traders that they apply for the required documentation prior to the export of dairy products, besides meeting other legislative and food handling requirements, some of which may be dairy product-specific. For processed dairy foods, ensuring that the dairy product is produced in a regulated environment is mandatory; the environment must be one in which food is under the regular surveillance of the competent authority in the exporting country (Lokuruka, 2011). In the case of Kenya for exported dairy food, these agencies include the Kenya Dairy Board, Kenya Bureau of Standards, Ministry of Health and the Department of Veterinary Services (Lokuruka, 2011). A private quality assurance agency such as Bureau Veritas may be employed by the State Regulatory Agency or the exporter to enforce quality specifications and the appropriate environmental conditions at processing. Providing documented proof that the dairy food is produced under a regulated environment is often assumed as proof of being able to produce safe and quality-assured dairy product for export. Where feasible, sending advance products for quality and safety testing in certified laboratories in the importing country saves time and money. The use of permitted additives and preservatives in dairy products for export should be confirmed with the importing country regulatory agencies. These can differ by country and is therefore prudent for the dairy trader to have this knowledge by country and dairy product type. Food safety concerns in global dairy foods marketing Besides local and regional markets, international markets are potential outlets of dairy products from the EAC dairy value chains. Due to the unique nature of requirements for marketing food in international markets, an examination of the intricacies of marketing dairy food in international markets is important. The mobility of people and animal foods around the world carries risks associated with the increase and transfer of zoonoses across the globe through food trade; some recent concerns in this regard include salmonella, avian flu and prions. The use of recommended antibiotics, good hygiene practices, and vaccines to treat animals are

260 Afr. J. Food Sci. safeguards to keep zoonoses in check. Food importers or regulatory agencies in importing countries most often will test for levels of certain indicator microorganisms like salmonella in animal foods or foods in which animal foods are ingredients and for chemical residues such as antibiotics in dairy products. The use of recommended safeguards in a country’s animal food industry within the agreed and recommended international protocols is likely to increase a country’s exports of the respective food commodity around the globe.
Today, countries are setting disease-free zones, certified testing laboratories among other requirements as safeguards to maintain and improve food safety. Often, the consumer needs to be assured that the food handler is cognizant of food safety and quality right from the farm. It is prudent to demand zero tolerance of any suspect undesirable potential agent in processed dairy foods; due diligence at all stages of the dairy value chain and the practice of good hygience practice (GHP) and good agricultural practice (GAP) are recommended for food safety assurance to succeed. This may mean surveillance on the farm, prudent use of pesticides according to manufacturer’s instructions and the use of “safe” chemicals as certified by the Ministry incharge of Agriculture and Food (Lokuruka, 2011). However, no “absolutely safe” chemical is available as far as food production and processing is concerned; any chemical will normally for all practical purposes have some undesirable effects on humans, most of the effects being long-term (Lokuruka, 2011). Of importance in this respect is the quantity of the chemical or processing aid used in food and the conditions of food handling and processing; these factors determine the amount and nature of the potential residue in the end product. To-do and not-to-do basics in international dairy foods trade For anybody wishing to engage in international trade, it is prudent to consult with prospective customers, and agents in the destination market so as to determine the best strategy for selling products in the market. Studying competing products in the country where you wish to do business is a good way to know what is available and works in that market. Such a search can open a niche for your product. Products for export are invariably packaged and therefore some basics that you have to ensure are in your product package include: 1. The name of product: Choose a name and understand its misconceptions and other hidden meanings in the destination markets. 2. The colours of the package: Understand what the colours you choose for the package may mean whether implied or real in the market where you intend to sell your product.
3. Packaging and labelling design: Besides your colour choices, your illustrations or graphics need to be appropriate, appealing and understandable to your product end-user. If you want to sell your products in stores that scan data, bar-coding your product will be essential. 4. The size or quantity of product: A designated volume/size or quantity might be perfect for one importing market or even in the country of origin according to country patterns of consumption, but it could be way too much in another. If too much of your product will go to waste, it is not economical or convenient for your consumer, and it is likely that they won't buy it again. So it is prudent to check average consumption volumes or weights and sizes before you decide how much product to fill into your sales/retail package. 5. Weights and measures: You should use the weights and measures that are applicable in the country where you desire to sell your product. 6. The language on the package: The labelling on the outside of the package in the language of the importing country is mandatory. The label or sticker should state the common name of the product, the importing agent's name and address, the weight of the package in the importing country's standard units of measurement, an appropriate ingredients legend, an indication of suitable storage conditions and the expiry date. 7. Pictures of your product on the label: A picture tells a thousand words. Illustrations are acceptable, so choose only those that are suitable and portray good meaning when associated with the product you want to offer in the sales market. 9. Packaging material: If your packaging is behind the times in the importing country, don't think you will be able to unload it in the world market. Customers worldwide appreciate innovation and cutting-edge technology, and they EXPECT it to be show-cased for imports anywhere. 10. Handling warranties, guarantees, consignment sales or service calls overseas: Anticipate what it will take to put one of these commitments in place globally. If it is not feasible, then do not offer it as the market may not be friendly to your product for long no matter how good, affordable and convenient it may be. 11. Environmental effects on your product: Humidity, extreme hot or cold temperatures, poor infrastructure, etc. all can affect how your product holds up in a new market. So choose a market that is a better fit for your product. Adapting products to meet the needs of an international market is a considerable undertaking, and will most likely require a substantial investment of both time and money. It will be smart to determine if the anticipated sales will outweigh the expense, and to project how long it will take to recover your product adaptation costs. If they are not favourable, do not attempt it and instead choose to work on the local market or neighbouring country-markets.
Conclusion Although, the EAC countries do not currently meet domestic milk and dairy product consumption require-ments, there is room for export of surpluses to international markets. Farmers in EAC member states have the potential to generate surplus milk for export, but the milk should be of the highest quality in order to produce high quality processed products; National governments should strive to provide the required infrastructure, create policies that encourage investment in the dairy value chain and support universities to conduct appropriate dairy research and produce adequately trained manpower for the dairy industry. Local/County Governments have the responsibility to provide potable water for high quality dairy processing, encourage implementation of appropriate trade policies and adequate extension services in a bid to raise production.
The provision of appropriate extension services by government agencies can keep dairy products affordable. Processors on the other hand will be required to make adequate investment in processing capacity, fabricate appropriate processing machinery, and pay fair prices to encourage higher milk production by farmers; it is partly the responsibility of regulatory agencies to provide appropriate and timely market information to the dairy sector as they improve law enforcement in order to improve quality and hygiene in the dairy value chain. To succeed in export, trade requires up to date knowledge of legislative, food safety, packaging and marketing requirements of the importing market and knowledge of the competing products in the destination market. In well-structured, organized and functioning EAC dairy value chains, farmers, processors, traders and Governments can reap maximum benefits and contribute in the long-term to GDP growth and nutritional well-being of countries’ populations.
RECOMMENDATIONS
In order for the EAC dairy sector to grow steadily, the author recommends the adoption and implementation of the following:
1. Investment in the training of dairy scientists, technologists, food engineers and Business managers. The opportunity of fabricating machinery locally by trained and resident food engineers can reduce the cost of machinery and save on foreign exchange. Management expertise is necessary for the appropriate and professional management of the dairy business as the application of science and technology alone is not adequate to run a business concern profitably and professionally. 2. Improving production and milk quality at farm level-by
Lokuruka 261 providing quality feeds, ensuring affordable credit facilities are available, and improving management practices at farm level-through appropriate extension training, good animal housing, animal health and feeding; zero grazing is a management/production practice that the author recommends for intensive production, though it may be expensive to implement and maintain. 3. Installing preservation technologies at farm level and preserving milk and dairy products in transit and along the value chain (it may be desirable to form cooperatives to enable economies of scale at milk collection and transportation when the factory is far from the farming area and milk collection points); the provision of chilling facilities along the value chain is absolutely necessary, even on a small scale, due to the perishable nature of milk and dairy products. 4. Regulatory control and provision of market information-extension services and veterinary services for quality product marketing and animal health, respectively, are necessary for a functional and progressive dairy sector. Appropriate policy direction and plans are necessary and should be provided by Government and its agencies. 5. Investment in renewable green energy sources for sustainability of energy supply. This is bound to bring down the cost of industrial energy which currently curtails production and inflates pricing to consumer disadvantage resulting in low returns on investment to entrepreneurs in both the dairy and energy sectors. The investment and utilization of green energy sources is also likely to cut down on the use of fossil fuels for energy generation and make investment in the dairy value chain attractive. The development of green energy technologies is suitable for rural areas where it may not be cost-effective to use electrical energy from the national grid due to the low usage potential arising from low populations and low incomes profile of would-be consumers. 6. Enforcing cost-effectiveness and export requirements- Where exports are contemplated, compliance with dairy food safety, packaging, marketing and other regulations should be strictly adhered to as required by the importers and as specified by the local and international applicable statutes. Profitability is assured only when full knowledge of the cost-revenue structure of the dairy business is available, known and when critical non-financial demands of the consumer are met fully.
Conflict of interest The author declares that there is no conflict of interest.
REFERENCES
De Wit JN (1998). Nutritional and functional properties of whey proteins
in food products. J. Dairy Sci. 81(3):597-608. FAO (2008). Global Dairy Sector: Status and Trends. FAO, Rome.
Available at: http://www.fao.org/docrep/012/i1522e/i1522e02.pdf.

262 Afr. J. Food Sci. FAO (2011). OECD-FAO Agricultural outlook-2011 to 2020.
OECD/FAO, Rome. Available at: http://www.fao.org/fileadmin/user_upload/newsroom/docs/Outlookflyer.pdf
FAO (2013). Burundi-evolution of production quantities for selected commodities. FAOSTAT, FAO, Rome Available at: faostat.fao.org/site/339/default.asp.
FAO (2013). Kenya-evolution of production quantities for selected commodities. FAOSTAT, FAO, Rome. Available at: faostat.fao.org/site/339/default.asp.
FAO (2013). Rwanda-evolution of production quantities for selected commodities. FAOSTAT, FAO, Rome. Available at: faostat.fao.org/site/339/default.asp.
FAO (2013). Tanzania-evolution of production quantities for selected commodities. FAOSTAT, FAO, Rome. Available at: faostat.fao.org/site/339/default.asp.
FAO (2013). Uganda-evolution of production quantities for selected commodities. FAOSTAT, FAO, Rome. Available at: faostat.fao.org/site/339/default.asp.
GoK-Government of Kenya (2015). Economic Review of Agriculture (ERA) 2015. Ministry of Agriculture, Livestock and Fisheries, Central Planning and Project Monitoring Unit, Nairobi. Available at: http://www.kilimo.go.ke/wp-content/uploads/2015/10/Economic-Review-of-Agriculture_2015-6.pdf
ISSFAL (2004). Recommendations for dietary intake of polyunsaturated fatty acids in healthy adults. June 2004. Available at: http://www.issfal.org/news-links/resources/publications/PUFAIntakeReccomdFinalReport.pdf.
Kenya National Bureau of Statistics (2009). Dairy Status-Kenya.
Ministry of Planning and National Development, Nairobi. Available at: www.knbs.or.ke/index/php.
Lokuruka MNI (2007). Role of fatty acids of milk and dairy products in cardiovascular diseases: A Review. Afr. J. Food Agric. Nutr. Dev. 7(1):45-59.
Lokuruka MNI (2011). The Food Law and Standardization System of Kenya. Lap-Lambert Academic Publishers, Såårbrucken, Germany. Availableat:www.abebooks.com/Food_Law__Standardization_System_Kenya_Michael/10798574397/bd
Owen E, Kitali A, Jayasuriyan B, Smith T (2005). Livestock and wealth creation: improving husbandry of animals kept by resource-poor farmers in developing countries. Nottingham, Nottingham University Press.
Staal S, Pratt A, Jabbar W (2008). Dairy Development for the resource-poor-Part 2: Kenya and Ethiopia Dairy Development Case Studies: Rome, Pro-poor Livestock Policy Initiative.
Thorpe W, Muriuki H, Omoro A, Owango M, Staal S (2000). Development of small-holder dairying in East Africa with particular reference to Kenya. UZ/RVAU/DIAS/DANIDA-ENRECA Project review workshop. Harare, Zimbabwe.
World Bank (2011). Module 4-Smallholder dairy production. Agriculture investment source book. Available at www.worldbank.org/Agsourcebook.

Vol. 10(11) pp. 263-270, November 2016
DOI: 10.5897/AJFS2016.1458
Article Number: E189D7760689
ISSN 1996-0794
Copyright © 2016
Author(s) retain the copyright of this article
http://www.academicjournals.org/AJFS
African Journal of Food Science
Review
Acceptance and integration of biofortified vitamin A maize into common diets
Kelvin Mulungu
The University of Zambia, Institute of Economic and Social Research (INESOR), Zambia.
Received 25 April 2016, Accepted 3 August, 2016.
Micronutrient deficiency ranks high as one of the public health challenges facing developing countries. Muti-faceted approaches have been put in place to reduce the impact of this problem, and among them is the promotion and dissemination of staple crops bred to deliberately have higher levels of selected micronutrients like vitamin A. In the Northen part of Zambia, HarvestPlus, working with other partners has been promoting orange maize rich in vitamin A among poor members of the community organized into Livelihoods Enhancement Groups (LEGs). A survey was conducted among households that belong to LEG sand took part in the cultivation of orange Vitamin A Maize (VAM). After the first year in which the community was introduced to biofortified VAM, LEGs grew it in group plots, shared the produce after the harvest and had their first home use. These households were followed up with a survey that asked a range of questions and interviews were conducted with a sample of 96 households which were randomly selected from the list of those that cultivated and shared the produce. The author descriptively assess how well VAM has been integrated into common diets. Findings show that almost all households like VAM as compared to both cassava and white maize meal, the two other staples in Northern Zambia. In all the forms in which it was cooked, households liked it. There are, however, fewer households who reported mixing VAM flour and cassava flour- something which is common with white maize flour. There are no differences in the likability of VAM across districts and gender. The reasons advanced for preference of VAM include; its nutritional content, its taste and the ability of households to prepare nshima (thick porridge) using less VAM flour as compared to cassava and white maize flour. Farmers also like VAM agronomically because it is an early maturing variety and for its double cobbing characteristic. These results provide a mix of agronomic and consumption attributes that can be used
in the promotion of VAM and have implications for further research full colony need to scientifically test some of the perceived benefits households reported like using less VAM maize flour than white maize flour for cooking same amount of nshima and it being more filling. Key words: Biofortification, integration of food, common diets.
INTRODUCTION Biofortification is a promising strategy to reduce micronutrient malnutrition especially in rural areas. In most of these areas, the poor grow their own food. According to IAPRI (2016), the percentage of rural households who manage to feed themselves and actually
sell some of the maize is at 61% with the remaining being able to feed from their produce for a less long period from their produce. In these settings, the strategy involves breeding staple food crops to be a rich source of one or more key micronutrients, such as iron, zinc, vitamin A,
264 Afr. J. Food Sci. and iodine, and disseminating these crops in areas where the rate of micronutrient deficiency is high and where poor households consume a large share of calories from staple foods. On average, an adult Zambian consumes about 74 kg of maize per year and it remains the dietary mainstay in central, southern and eastern Zambia accounting for about 60% of the national calorie consumptions (Dorosh et al, 2009). Apart from maize, the other staple is cassava, accounting for roughly 15% of national calorie consumption. In the Northern and Western parts of Zambia, cassava takes a much more prominent role and usually this area is referred to as a dual staple zone (Dorosh et al., 2009; Haggblade et al., 2012). Poverty levels in rural areas have remained high (76%)
as compared to urban areas (27%) even though they have been reducing at a lower rate. Malnutrition related problems have barely changed over the last decades. Stunting, for children below 5 years of age has increased to 48% from about 45% in 2010, according to the Living
Conditions Monitoring Survey (LCMS) "Central Statistical
Office, 2015".Vitamin A deficiency is equally high, at about 54% of the children below 5 years of age (WHO, 2009). Zambia, despite recording bumper harvests year after, has also been ranked poorly on the Global Hunger Index which measures nutritional outcomes. In the 2015 report, Zambia is among the 3 worst countries in Africa. All this underscores the need for newer approaches to responding to nutrition challenges the country is facing.HarvestPlus Zambia working with Self Help Africa in the Integrated Research in Development Programme with the financial help of Irish Aid has been promoting and researching on vitamin A maize (VAM) in the Northern parts of Zambia. Havert Plus is a global leader in fighting micronutrient deficiency (hidden hunger) working in Asia, Africa and South America. The programme is co-hosted by the International Food Policy Research Institute and the International Center for Tropical Agriculture. Self Help Africa is an international Non-Governmental Organisation that is working on sustainable agriculture and nutrition programmes. In this project, HarvetPlus partnered with World Fish Center and Center for International Forestry Research, also members of the Consultative Group on International Agricultural Research to manage the research in development programme while Self Help manages the development aspect of the programme. The research programme is a 3-pronged approach focusing on nutrition, fisheries and forestry with each component managed by Harvet Plus, World Fish and CIFOR, respectively. Harvest Plus concentrates its efforts on promoting biofortied crops and researching on adoption
and utilization. The goal of the project is to reach some of the most poor in the communities and to do this, quite homogenous grouping of the poor had to be established. These were arranged at village level. Groups consisting of 45 members of the community who are chosen on a vulnerability (poverty) criterion were organized- these were named Livelihoods Enhancement Groups (LEGs) and numbered numerically.
In the first season of promotion of VAM, seeds of about 60 g were distributed to members of the Livelihood Enhancement Groups (LEGs) to host demonstration plots for two varieties, GV 665 A and HP 1002. The demonstration plots were at zone level- usually comprising of about 4 LEGs. The demonstration plots were a point of learning for both the farmers and the researchers. For the farmers, they got first-hand experience on how to grow VAM after receiving trainings on the agronomic and nutritional value of VAM. After harvest, the groups shared the produce among themselves for household use, while others stored and used them at group (LEG) level. Depending on the number of members who were active and the production level, quantities shared differed but all those interviewed got at least 10 kg. Depending on the family size, frequency of preparation and quantity received, households were able to eat VAM for a period of between a month and 3 months. A follow-up utilization survey was then conducted to investigate farmers‟ perceptions on the growing of VAM and how well it was being integrated into common diets. Results of the survey constitute this article.
Cropping patterns and nutrition The economy of Northern Province is predominantly agricultural based. More than 80% of Northern Province‟s population depends on agriculture and natural resources. Though there are variations across the districts in terms of the specific activity portfolios, the main activities include crop farming, fishing, livestock and forest extraction. The main crops grown in the province are cassava, maize, groundnuts, beans, millet and sweet potatoes. The two districts, Mbala and Luwingu have some differences also within them. According to Ngoleka (2013) who did some livelihoods zoning in the two districts, four zones were identified (3 in Luwingu, 1 in Mbala). According to the report, Mbala district comprises one livelihood zone: the „Maize, Cassava and Bean Zone‟. The three zones in Luwingu are: 1. Fish pond fishing, cassava and agricultural trade zone, 2. West and east cassava, groundnuts and rice zone, and
*Corresponding author. E-mail: [email protected].
Author(s) agree that this article remains permanently open access under the terms of the Creative Commons Attribution
License 4.0 International License
3. Lake fishing, cassava and irrigated vegetable zone.
While Mbala is a maize belt, Luwingu is a cassava belt and it is only recently that farmers have started growing maize mainly because of the inputs they receive through the Farmer Input Support Programme (FISP). By giving heavily subsidized inputs (fertilizer and maize seed) mostly meant for maize, even farmers who traditionally grew cassava are switching to maize so as to access these inputs and because of the certain market they are assured for maize through the government grain marketing board, the Food Reserve Agency. For promotion of VAM, this is a good opportunity because VAM will be part of „maize‟ that is being adopted than bringing it later on after they have known other white maize varieties for years. Knowledge of growing maize is also noticeably different among farmers in these two districts. Cassava is grown in both districts, but more so in Luwingu. The province accounts for about 39% of the total cassava production (quantity); this is compared to just about 17% for maize nationally (CSO/MAL, 2014). The other main starch is millet, though it is mostly used for brewing of both alcoholic and non-alcoholic local beverages. In times of shortage of both maize and cassava, people resolve to cooking nshima from millet (finger) flour. The main legumes are bean and groundnuts. This is traditionally a bean producing region, with 71% of the national produce coming from the province. Most of the bean is traded and sees its way to major consumption hubs like Copperbelt and Lusaka and little is kept for home consumption. The major farming systems in the province include shifting cultivation [chitemene], semi-permanent hoe system, semi-permanent hoe system and ox plough system, semi-commercial cultivation, and commercial systems. The majority of the smallholder farmers in the districts of Mbala and Luwingu use simple technologies [hand hoe and oxen] and there is minimal purchases of inputs such as fertilizers.
However, crop diversification is still limited and it has been further hampered by FISP which has continued to promote maize at the expense of other crops. The province has continued to experience chronic food and nutrition security problems, with stunting as the most common nutritional disorder affecting children under five years. Nationally, vitamin A deficiency and lack of iron are some of the serious micro-nutrient deficiencies affecting children and women. In Mbala, Vitamin A Deficiency (VAD) is above the national levels with about half of the children estimated to be affected. Halimatou et al. (2014) estimates that about 90% of the women in Luapula and Northern provinces of Zambia do not get enough vitamin A from the commonly consumed foods. Though, there are other efforts to reduce VAD, such as the national vitamin A supplementation program which distributes high dose vitamin A capsules twice annually to children 6 to 59 months of age, and vitamin A fortification of sugar (WHO, 2009), they face challenges like
Mulungu 265 sustainability, coverage and efficiency. Supplementation is targeted at young children despite having a good coverage of 89% of the country geographically between 2007 and 2011 (Kafwembe, 2009; Fiedler et al., 2013) while sugar fortification is reaching mainly the wealthy part of the population who afford other foods that provide vitamin A and has potential for hypervitaminosis (Clewes and Kankasa, 2003; Gannon et al., 2014). Biofortification aims to complement the government efforts like supplementation and commercial fortification by allowing farmers to grow micro-nutrient rich crops and access the nutrients when consumed.
To be a member of the LEG, there is a vulnerability criterion which must be passed. The criteria includes; a) female headed households and/or b) elderly headed households and/or c) households with orphans and vulnerable children and/or d) people with health conditions and impairments
Given these criteria, members of the LEGs are expected to have below average levels of micronutrient deficiencies. Around 26% of the rural households are female headed while those headed by the elderly (60 years and older) make up 5.5% of the total rural population (IAPRI, 2016). Within households, males tend to have significantly more education than females. Women play multiple roles in both agricultural production and nutrition, and interventions that consider trade-offs between their respective roles and their time and labor constraints are more likely to lead to positive outcomes (Sitko et al., 2011). Gender is very important in nutrition related programs because women‟s status and decision-making power directly affects the nutritional status of their children. Women are also the most nutritionally vulnerable when pregnant and lactating, as their bodies must cope with the additional nutritional stresses and demands of pregnancy and lactation (Sitko et al., 2011). A correlation is also present between years of schooling and income (Kuteya et al., 2011). In most studies determining causes of child malnutrition, literacy level of the mother/guardian to the child has been found to be one of the major factors (Maleta et al., 2003; Bantamen et al., 2014; Boulos et al., 2016). This means that apart from being poor, these groups‟ nutritional status is exacerbated by low literacy levels. Therefore, some of the factors that are related to the acceptance of VAM among members of the LEGs given the likely nutritional status were investigated.
Because consumers are followed after they have prepared different foods at home, this approach uses a kind of home-use testing instead of the central location testing where consumers are in a central place to taste the VAM and be asked questions about it. This allows the consumers to cook the product in various ways they want for a longer period of time and give their sensory scores, perceptions, observations and any problems they encounter and in this case compare it with other products that they usually eat at home. One drawback, however, is

266 Afr. J. Food Sci. that the researcher has no control over how the product is prepared, and any answers about taste, aroma and appearance could not dully depend on the intrinsic value of the product but maybe also on the way each household prepared it.
Data source The data was collected from LEGs in Mbala and Luwingu. A structured questionnaire was administered to 96 farmers who are members of the LEGs and mostly took part in the growing of VAM the previous season. Fifty Two from Mbala, while 44 were drawn from Luwingu. At the time of the study, the number of LEGs in Mbala was about 102 with each LEG having 45 members selected using the above stated criteria while Luwingu had about 99 LEGs. However, the number of LEGs that took part in the VAM demonstration plots in the previous season is less as some zones did not have demonstration plots. In both Luwingu and Mbala, there were 4 zones with demonstration plots. No VAM seed was commercially available and farmers could not grow it at home but only through the HarvestPlus managed
demonstration plots. VAM seed only became commercially available in the 2014/2015 agricultural season as ZAMSEED seed company marketed the first
variety while in the 2015/2016 agricultural season, two
more seed companies started marketing their varieties commercially as well. The sample is drawn from
members of the LEGs and among members that took part in the growing of VAM because the study was also interested in the farmers experience with the crop agronomically. Because of resources, only about 30% of the number of farmers that took part was sampled. The sampling was done randomly from the participation lists during field activities at the plots. The questionnaire included questions on demographics. Focus group discussions were held with selected members of different LEGs; one in each district. This was a means of triangulating the data as well as getting some detailed information on the why and how questions that could not easily be solicited by the questionnaire. The FGD guide followed mainly in the same line as the questionnaire but with more focus on understanding the basic framework within which the decisions are made and the reasons for some perceptions that were advanced.
RESULTS
In this section, results are presented mostly in the descriptive sense. Though inferential and descriptive in nature, the results offer helpful insights into the household level utilization dynamics and acceptability of entered in SPSS and exported to Stata for analysis.
Descriptive statistics
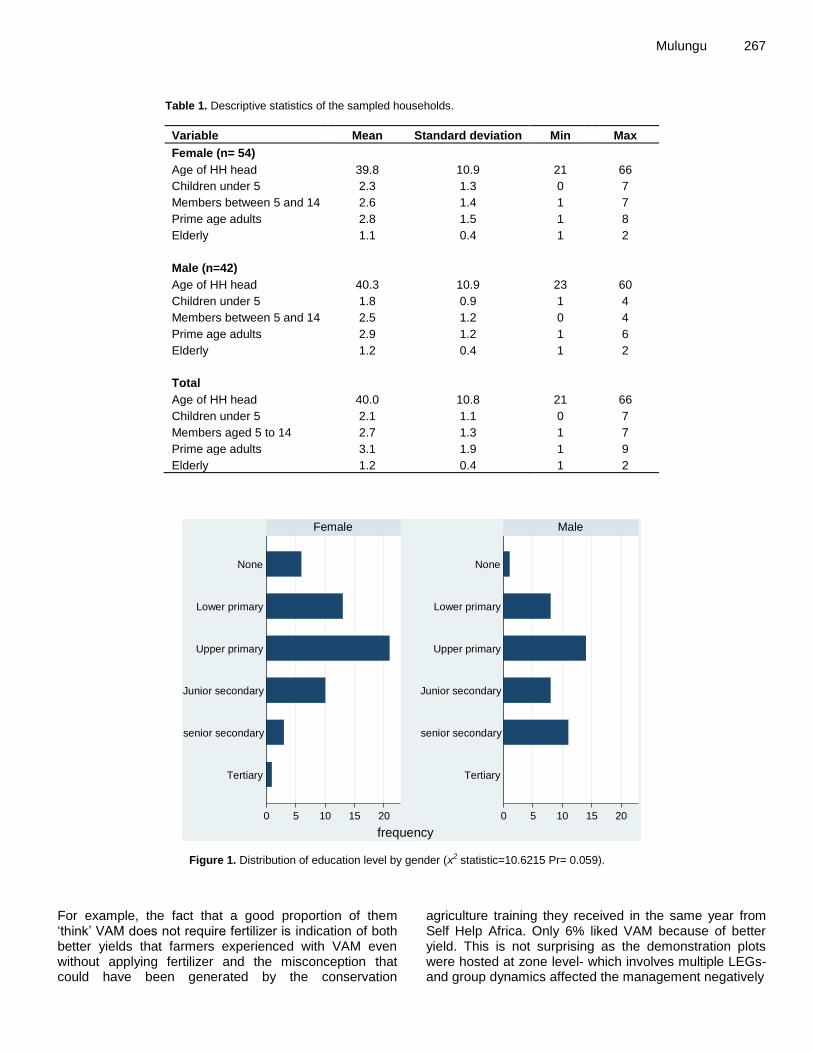
In Table 1, the sampled households are described. The description is gendered to capture any differences between the two sexes. About 56% of the sampled households were female. This above-average percentage for women reflects the membership of the LEGs where about 60% of the members per LEG are female. This is a direct endeavor by the program to empower female headed households. The average age of the female heads of households was 40 years, like that of males. Both female and male headed households have almost the same number of children under five at about 2 children per household. There is equally the same number of members between 5 and 14 and prime age adults which are about 3 on average.
Figure 1 shows the association between gender and education level. Majority of both male and female heads of households have only reached up to upper primary. Lower primary for females is the second most achieved level of education at about 12%, while for males, senior secondary school comes in second at about 11%. The Chi-square statistic, testing the hypothesis, that is, an association between gender and level of education attained, indicates that there is a relationship between gender and level of education at 90% confidence level. A good proportion of males have achieved higher level of education as compared to females. The females‟ level of education seems to be heavy at the tail, majority have attained lower levels of education. Agronomic attributes
After participating in the growing of VAM for one season, the farmers were able to give the characteristics of VAM that they like from observation and information they
received during the training. Table 3 shows that the most important VAM attribute among farmers in northern region is the early to medium maturity attribute. Traditionally, late maturing varieties have been promoted in this region and have been adopted by farmers. This is based on the classification of the region as a high rainfall region with over 1,200 mm of rainfall per annum. However, with a changing climate, less and less rainfall is being received in the region (Thurlow et al., 2012) and the late maturing varieties which include the local open pollinated varieties (OPVs) are being impacted negatively. It is therefore, not surprising to find that the early maturing attribute is mentioned by 47% of the farmers as the reason they like VAM. The VAM varieties that were planted in the demonstration plots require between 100 and 125 days maturing with very good drought resistance.
Farmers also prefer the double-cobbing attribute of VAM.This is an attribute that is currently present in all the three released varieties.However, among the attributes, there are also farmers‟ misconceptions about VAM.
Mulungu 267
Table 1. Descriptive statistics of the sampled households.
Variable Mean Standard deviation Min Max
Female (n= 54)
Age of HH head 39.8 10.9 21 66
Children under 5 2.3 1.3 0 7
Members between 5 and 14 2.6 1.4 1 7
Prime age adults 2.8 1.5 1 8
Elderly 1.1 0.4 1 2
Male (n=42)
Age of HH head 40.3 10.9 23 60
Children under 5 1.8 0.9 1 4
Members between 5 and 14 2.5 1.2 0 4
Prime age adults 2.9 1.2 1 6
Elderly 1.2 0.4 1 2
Total
Age of HH head 40.0 10.8 21 66
Children under 5 2.1 1.1 0 7
Members aged 5 to 14 2.7 1.3 1 7
Prime age adults 3.1 1.9 1 9
Elderly 1.2 0.4 1 2
Figure 1. Distribution of education level by gender (x2 statistic=10.6215 Pr= 0.059).
For example, the fact that a good proportion of them „think‟ VAM does not require fertilizer is indication of both better yields that farmers experienced with VAM even without applying fertilizer and the misconception that could have been generated by the conservation
agriculture training they received in the same year from Self Help Africa. Only 6% liked VAM because of better yield. This is not surprising as the demonstration plots were hosted at zone level- which involves multiple LEGs- and group dynamics affected the management negatively
0 5 10 15 20 0 5 10 15 20
Tertiary
senior secondary
Junior secondary
Upper primary
Lower primary
None
Tertiary
senior secondary
Junior secondary
Upper primary
Lower primary
None
Female Male
frequencyGraphs by Gender

268 Afr. J. Food Sci.
Table 2. Comparison of orange maize nshima with cassava and white maize nshima.
Is VAM the same, better or worse than… Better (%) Same (%) Worse (%)
Cassava nshima 97 2 1
White maize nshima 84 16 0
Table 3. Reasons why VAM is preferred agronomically as compared to „local‟ varieties.
Reason Absolute Percent
Early maturing 45 46.9
Double cobbing 24 25.0
Does not require fertilizer 15 15.6
Pest and disease resistant 10 10.4
Different spacing 7 7.3
Better yield 6 6.3
Germinates better than white 2 2.1
Different tillage 1 1.0
For instance, in some cases, planting was done late as the different LEGs kept debating on site selection and in some cases, the administering of cultural practices like planting, weeding, fertilizer application e.t.c. was done later than should be. For example one zonal demonstration plot in Luwingu was only planted in January when it should have been planted by November the previous calendar year.
Utilization of VAM The reception for VAM has been good. Farmers who had shared the maize, prepared at home and ate them were asked to compare VAM nshima (a thick porridge made from maize flour) to white maize nshima and cassava meal nshima. Unlike sensory tasting (for example as used by Meenakshi et al., 2011), consumer testing which was used in this study seeks to measure the personal response (liking, preference or acceptance) of consumers (current or potential) of a product, a product idea or specific product characteristics (Meilgaard et al., 2006; Tomlins et al., 2007). Also, different from most studies (Meenakashi et al., 2011; Laurie and Heerden, 2014; Oparinde et al., 2015), this study, firstly combines agronomic and consumption attributes of VAM, secondly by allowing the households to prepare and consume the product in the home under normal conditions, using household-recipes and without the presence of the researcher, it offers an opportunity to assess if preferences remain stable over time, once the novelty value of the product has worn off. The author did not concentrate on asking about the attributes as these may differ and vary across these three sources of starch and
hence make it difficult to compare. Also, the sum of the attributes may not be equal to the whole (Hanley et al., 1998). Generally, VAM nshima is preferred to both cassava and white maize nshima. There are more people (97%) who prefer it over cassava meal nshima. Compared with white maize nshima, 84% say VAM is better and about 16% say it is just the same. White maize nshima, based on the ratings in Table 2, is therefore the closest substitute for VAM nshima. This presents an opportunity to have many households that are currently consuming cassava turn to VAM as it is much more preferred.
Reasons for preference of VAM over white maize and
cassava nshima differ. According to table 4 having a good taste coupled with being nutritious by way of Vitamin A rank as the most popular reasons why VAM is preferred as compared to white maize nshima while having vitamin A is the most popular reason why VAM is preferred as compared to cassava nshima. After an experience with VAM, studies like Steven and Winter-Nelson (2008) have also shown that there is a preference for VAM as compared to white even without a price discount especially among families with younger children and those without significant access to meat products. In Zambia, the general population has a high level of knowledge about vitamin A deficiency, but mostly in urban areas. This preference for VAM could be based on the newly received information about the importance of vitamin A in helping to fight VAD for these rural households.
As Meenakshi et al. (2011) found, providing nutritional information to the consumers increases their acceptability of VAM. In this study, most households who have had an experience in the home setting mention the presence of vitamin A as the reason for the preference of VAM over both white and cassava. Other reasons that people advanced include the softer texture of VAM and that they were able to use less flour as compared to white and cassava. The smell of VAM also came out as a reason, though few thought this is what made it better than cassava. The characteristic smell of β-carotene is in some cases what makes people associate VAM with the yellow maize that was distributed in late 90s as relief food and hence became associated with famine and low social-economic status (Meenakshi et al., 2011). For those who perceive VAM to be just the same as white and cassava, they concentrated more on the energy it gives and because both give strength (VAM and white and VAM and cassava), they found no reason to rate one better than the other.

Mulungu 269
Table 4. Why households prefer VAM nshima to white maize nshima and cassava.
Reason Compared to white Compared to Cassava
Frequency Percent Frequency Percent
Good taste 24 33.80 31 37.80
Has Vitamin A 24 33.80 35 42.68
Cook more with less flour 9 12.68 2 2.44
Softer 5 7.04 4 4.88
Nice smell 5 7.04 4 4.88
Filling 3 4.23 5 6.10
Both give strength 1 1.41 1 1.22
Total 71 100.00 81 100.00
Table 5. Forms in which VAM was eaten.
Use/product Absolute Percent
Nshima 83 86.5
Plain porridge 31 32.3
Fresh maize 15 15.6
Munkoyo 11 11.5
Porridge with groundnuts 4 4.2
Whole grain boiled 3 3.1
Nshima mixed with cassava 2 2.1
The Chi-square statistic indicates that the ratings do not differ significantly across gender. There is no association between the preference of VAM as compared to white or preference of VAM to cassava and gender of the respondent.
In Table 5, the forms in which VAM was prepared are presented. At a trial stage, and given that this is the first home use these households had with a limited quantity (because it could not last all year round), these forms in which it was eaten can be taken as the priority or main forms. Households in some cases got too little a quantity to have the luxury of cooking it in a variety of ways repeatedly for a long period of time. Close to 87% of the households mentioned nshima as one of the ways they prepared VAM, followed by plain VAM porridge. Fresh maize and munkoyo (a local non-alcoholic brew made from any maize flour) came in as the third and fourth most common ways in which the households used VAM. There were few farmers who mixed VAM with cassava meal, though this is very common with white maize flour. However, the two who mixed it with cassava, both female headed households in Mbala, mentioned that they enjoyed it and it was nice. In the focus group discussion, some members expressed skepticism about mixing as they thought the colour of the mixture would not look good. But after the ones who had tried shared the
experience, other members were more willing to try it as well. If a lot of people do not mix with cassava, it could
have implications on the continued consumption of VAM as most households mix cassava and white maize (both for palatability and also for taste), as they approach the lean season, when maize stocks decline and the remaining quantities are used with cassava. Conclusion Orange maize presents itself with a dual message for promoting it: the agronomic characteristics and the nutrition qualities. However, to the rural consuming farmers, the VAD problem is not a felt one, but rather an expressed one and the invisible nature of the nutrition traits presents a challenge communicating it to the community. However, making the community first understand and appreciate the problem creates a need in them and VAM comes in as a means to the end. As VAM does not require a change in habits, it is easy for people to fit it into their lives (van den Kommer, 2010). But they also trust the promise, even when traits are invisible and nutritional impact may not be noticeable directly. This is the reason why people mention the presence of vitamin A and why they prefer VAM to other sources of starch even though it is invisible and the impact not directly felt. Among mothers especially, there is also a good deal of information being received about the importance of vitamin A through various government initiatives like the child health week (Fiedler and Lividini, 2014).
The acceptance and easy integration as shown by various ways households have prepared VAM can also be explained by the provision of nutrition information by HarvestPlus. There is no reason to suspect that these households are avoiding to „look at a gift horse in the mouth‟ as the only gift they got was seed and they had to do their own cultivation. Secondly, having been prepared and eaten at home and not in a central location under the observation of the researcher, they are less likely to associate the home experience with the initial gift. Muzhingi et al. (2008) have shown that nutrition information plays a major role in influencing consumer acceptance of a product and is the single most important

270 Afr. J. Food Sci. factor in determining a household‟s decision to consume maize that otherwise is non-white. This coupled with the agronomic likability of VAM, makes it easy for farmers to adopt it. The fact that this maize can also be marketed on agronomic attributes alone entreats the question as to what to weigh more in the promotion, especially that marketing it on agronomic attributes would still deliver the health benefits. However, in the spirit of disclosing to the consumers the full product, akin to “product labeling”, both agronomic and nutritional information needs to be given out there.
This study was limited in that the likability measured here is stated rather than revealed as no actual market data was collected on quantities produced as
replacement for white maize or purchased from the market. Farmers at this point have not actually adopted VAM, suffice to mention that a good number of them had kept even a handful for planting the following season. Longer home use is likely to result in even better ratings for VAM (Meenakshi et al., 2012). If this likability and easy integration into common diets is stable overtime and translates into adoption, government has an opportunity to sustainably promote VAM as another viable option to reducing the vitamin A deficiency in rural areas. These promotions, in the traditional government extension system can still be based on the agronomic attributes with some nutritional information. Conflict of Interests
The authors have not declared any conflict of interests. REFERENCES
Bantamen G, Belaynew W, Dube J (2014). Assessment of factors
associated with malnutrition among under five years age children at Machakel Woreda, Northwest Ethiopia: a case control study. J. Nutr. Food Sci. 2014.
Boulos C, Salameh P, Barberger-Gateau P (2016). Malnutrition and frailty in community dwelling older adults living in a rural setting. Clin. Nutr. 35(1):138-143.
Clewes C, Kankasa C, Welsh J, Campbell J (2003). Report of the national survey to evaluate the impact of vitamin A interventions in Zambia in July and November 2003. Atlanta: United States Agency for International Development and CDC.
Dorosh PA, Dradri S, Haggblade S (2009). Regional trade, government policy and food security: Recent evidence from Zambia. Food Policy 34(4):350-366.
Fiedler JL, Lividini K (2014). Managing the vitamin A program portfolio: A case study of Zambia, 2013–2042. Food Nutr. Bull. 35(1):105-125.
Fiedler JL, Lividini K, Zulu R, Kabaghe G, Tehinse J, Bermudez OI (2013). Identifying Zambia's Industrial Fortification Options: Toward Overcoming the Food and Nutrition Information Gap-Induced Impasse. Food Nutr. Bull. 34(4):480-500.
Gannon B, Kaliwile C, Arscott SA, Schmaelzle S, Chileshe J, Kalungwana N, Mosonda M, Pixley K, Masi C, Tanumihardjo SA
(2014). Biofortified orange maize is as efficacious as a vitamin A supplement in Zambian children even in the presence of high liver reserves of vitamin A: a community-based, randomized placebo-controlled trial. Am. J. Clin. Nutr. 100(6):1541-1550.
Haggblade S, Andersson Djurfeldt A, Banda Nyirenda, D., Bergman
Lodin, J., Brimer L, Chiona M, Chitundu M, Chiwona-Karltun L, Cuambe C, Dolislager M, Donovan C (2012). Cassava commercialization in Southeastern Africa. J. Agribusiness Dev. Emerg. Econ. 2(1):4-40.
Halimatou A, Kohler L, Taren D, Mofu M, Chileshe J, Kalungwana N (2014). Zambia food consumption and micronutrient status survey report. Lusaka: National Food and Nutrition Commission. DRAFT
Hanley, N., Wright, R. E., & Adamowicz, V. (1998). Using choice experiments to value the environment. Environ. Res. Econ. 11(3-4):413-428.
Indaba Agricultural Policy Research Institute. (2016). Rural Agricultural Livelihoods Report. Lusaka, Zambia.
Kafwembe EM, Chipipa J, Njunju E, Chilengi R (2009). The vitamin A status of Zambian children in a community of vitamin A supplementation and sugar fortification strategies as measured by the modified relative dose response (MRDR) test. Int. J. Vitam. Nutr. Res. 79(1):40-47.
Kuteya A, Kabwe S, Beaver M, Chapoto A, Burke WJ, Mason NM, Weber MT (2011). Statistical report on categorization of rural cropping households in Zambia. Food Security Research Project Working Paper (51).
Laurie SM, Van Heerden SM (2012). Consumer acceptability of four products made from beta-carotene-rich sweet potato. Afr. J. Food Sci. 6(4):96-103.
Maleta K, Virtanen SM, Espo M, Kulmala T, Ashorn P (2003). Childhood malnutrition and its predictors in rural Malawi. Paediatr. Perinatal Epidemiol. 17(4):384-390.
Meenakshi JV, Banerji A, Manyong V, Tomlins K, Mittal N, Hamukwala, P. (2012). Using a discrete choice experiment to elicit the demand for a nutritious food: Willingness-to-pay for orange maize in rural Zambia. J. Health Econ. 31(1):62-71.
Meilgaard MC, Civile GV, Carr BT (2006). Sensory evaluation techniques (4th ed.). Florida: CRC Press.
Muzhingi T, Langyintuo A, Malaba L, Banzinger M. 2008. Consumer acceptability of yellow maize products in Zimbabwe. Food Policy 33:352-361.
Ngoleka S (2013). Livelihoods and Rural Wealth Ranking among Farm Household in Mbala and Luwimgu districts, Northern Province, Zambia, Irish Aid Local Development Programme (IALDP) Baseline Report to Self Help Africa, Produced by Evidence for Development
Oparinde A, Birol E, Murekezi A, Katsvairo L, Tedla Diressie M, Nkundimana JD, Butare L (2015). Consumer Acceptance of Biofortified Iron Beans in Rural Rwanda: Experimental Evidence. HarvestPlus Working Paper 18.
Sitko NJ, Chapoto A, Kabwe S, Tembo S, Hichaambwa M, Lubinda R, Chiwawa H, Mataa M, Heck S, Nthani D. (2011). Technical compendium: Descriptive agricultural statistics and analysis for Zambia in support of the USAID mission‟s Feed the Future Strategic Review (No. 104016). Michigan State University, Department of Agricultural Food, and Resource Economics.
Thurlow J, Zhu T, Diao X (2012). Current climate variability and future climate change: estimated growth and poverty impacts for Zambia. Rev. Dev. Econ. 16(3):394-411.
Tomlins K, Ndunguru G, Stambul K, Joshua N, Ngendello T, Rwiza E, Amour R, Ramadhani B, Kapande A, Westby A (2007). Sensory evaluation and consumer acceptability of palefleshed and orange-fleshed sweetpotato by school children and mothers with preschool children. J. Sci. Food Agriculture 87:2436-2446.
Von Grebmer K, Bernstein J, de Waal A, Prasai N, Yin S, Yohannes Y. (2015). 2015 Global hunger index: Armed conflict and the challenge of hunger. Intl. Food Policy Res Inst. P 46.
World Health Organization (2009). Global prevalence of vitamin A deficiency in populations at risk 1995–2005. Available at: http://whqlibdoc.who.int/publications/2009/9789241598019_eng.pdf

Vol. 10(11) pp. 271-277, November 2016
DOI: 10.5897/AJFS2016.1430
Article Number: 219DD4460694
ISSN 1996-0794
Copyright © 2016
Author(s) retain the copyright of this article
http://www.academicjournals.org/AJFS
African Journal of Food Science
Full length Research Paper
Biochemical properties of three lactic acid bacteria strains isolated from traditional cassava starters used
for attieke preparation
Krabi Ekoua Regina1*, Assamoi Allah Antoine1, Ehon Ayawovi Fafadzi1, Amani N’guessan Georges2, Niamké Lamine Sébastien1, Cnockaert Margo3, Aerts Maarten3 and
Vandamme Peter3
1Université Félix Houphouët-Boigny, UFR Biosciences, Laboratoire de Biotechnologies, 22 BP 582 Abidjan 22,
Côte d‟Ivotre. 2Food Technology Laboratory, Formation and Research Unit of Sciences and Technologies of Food, UFR/STA
University Nangui Abrogua, Abidjan, Côte d‟Ivoire. 3Laboratory of Microbiology, Faculty of Sciences, Ghent University, K. L. Ledeganckstraat 35, 9000 Gent, Belgium.
Received 1 March 2016; Accepted 25 May, 2016.
Variable sensorial quality of attieké (a fermented cassava product like couscous) is mainly due to different types of artisanal starters used for fermentation of cassava dough. Biochemical properties of eleven lactic acid bacteria identified as Lactobacillus plantarum strains isolated from these traditional cassava starters were evaluated in vitro. Three of these isolates (Lp 210, Lp 140 and Lp 19) presented suitable properties (fermentation at 45°C, important acidification rate, enzymatic activities, osmotolerance, thermotolerance) necessary for their potential use in drastic environment. These rapid acid producers’ strains also induced a rapid drop of pH of MRS broth under pH 4 which is a major food safety factor. These potentialities confer to these strains ability to be selected as microbial starters for the reliable and reproducible lactic fermentation of cassava dough into attieké in order to optimize and standardize the quality and organoleptic characteristics of this staple food. Key words: Attieké, cassava, lactic acid bacteria, biochemical properties, lactic fermentation.
INTRODUCTION Cassava (Manihot esculenta Crantz) is the third agricultural resource after rice and maize as a source of calories in tropical countries (FAO, 2008; De Oliveira et al., 2015; Ngobisa et al., 2015). In Africa, tendency for cassava‟s use is almost 40%, and represents nearly
twice of that of the world (Tetchi et al., 2012). For 200 million people (more than a quarter of the continent's total population), cassava represents staple food necessities of which each consumes more than 100 kg per year (Pierre, 2012). Cassava is traditionally processed into
*Corresponding author. E-mail: [email protected].
Author(s) agree that this article remains permanently open access under the terms of the Creative Commons Attribution
License 4.0 International License

272 Afr. J. Food Sci. a wide variety of fermented products such as attiéké, gari, lafun, fufu, baton de manioc or chips, particularly suited to transportation, trade and rapid preparation of meals (Pierre, 2012; Kouamé et al., 2012). Through thousands of years, demand for the production and consumption of fermented foods has extremely increased and accordingly, those foods occupied a substantial part of the diet worldwide (Elyas et al., 2015; Ngobisa et al., 2015).
In Côte d‟Ivoire, the most popular food derived from fermented cassava is attiéké (Djeni et al., 2008; Kouamé et al., 2012). Quality of cassava derived-food is largely dependent on technologies processing which consist of a combination of steps such as peeling, boiling, steaming, punding, slicing, grating, roasting, soaking, pressing and fermentation (Pierre, 2012). Fermentation of cassava dough by bacteria and yeasts does not only enhance detoxification; it also improves food quality and safety by product preservation, flavor development, cyanide reduction and changes in functional properties (Obilie et al., 2003; Padonou et al., 2010).
In attiéké production, producers use a traditional cassava starter, which constitutes the main source of microorganisms which are predominant in the later fermentation of cassava dough. Djeni et al. (2011) established characteristics of each of the three „‟attieke‟‟ type and the differences between them, probably due to the differences in their traditional starter used to conduct the fermentation. Microflora of these traditional starters has not been studied so far, but similar studies on fermented cassava derived-food such as agbelima, lafun and chikwangue which shows that the actives microorganisms in cassava fermentation process are generally lactic acid bacteria (LAB) because the cassava dough fermentation results mainly from a lactic fermentation (Coulin et al., 2006).
LAB generally regarded as safe (GRAS), play an essential role in the majority of food fermentations and preservation, and a wide variety of strains are routinely employed as starter cultures in the manufacture of dairy, meat, vegetable, and bakery products (Elyas et al., 2015; Gemechu, 2015). They contribute to the enhancement of sensory, quality and safety features of these fermented foods (Holzapfel and Wood, 2014). Their antimicrobial activity has been attributed to produced metabolites such as organic acids, carbon dioxide, hydrogen peroxide, diacetyl and bacteriocins which can inhibit pathogenic and spoilage microorganisms, extending the shelf life and enhancing the safety of food products (Piard and Desmazeaud, 1992).
Lactobacilli represent one of the major microbial groups involved in these desirable fermentations. Among them, Lactobacillus plantarum is regularly noted among cassava dough fermentative germs (Kostinek et al., 2007; Edward et al., 2012). Therefore, this study was carried out to select LAB strains as potential microbial starters for
cassava dough fermentation into attiéké. MATERIALS AND METHODS Samples collection and isolation of fermentative microorganisms The biological material used was constituted of „‟Adjoukrou‟‟ traditional cassava inocula ready-to-use, collected in small-scales production of attieké from thirteen high production locations in Abidjan, Côte d'Ivoire. The collected samples wrapped in sterile poly ethylene sacs (Stomacher, Laboratoire Humeau, Rennes, France), were immediately transported in ice box to the laboratory in less than 1 h, where they were mixed and then subdivided into five aliquots. Preparation of stock solutions, inoculation of agar plates and cultivation of the various microorganisms were carried out (Coulin et al., 2006). Total viable (LAB) count in each sample was analyzed by spread plating the tenfold diluted samples into de Man, Rogosa and Sharpe (MRS), Bile Esculin Azide (BEA), Mayeux, Sandine and Elliker (MSE), and M17 agar plates (all from OXOID, Basingstoke, Hampshire, UK), respectively to obtain the widest possible variety of LAB associated with fermenting traditional cassava starters. The media were supplemented with nystatin (1%) to inhibit fungal growth. Petri dishes were then incubated in an anaerobic jar at 30°C for 48 h. Morphological and biochemical characterization of isolates Phenotypic characteristics Isolates were performed by Gram staining method and catalase test. For mobility test, each colony was sub-cultured in MRS broth, and the medium was then incubated at 30°C for 24 h. After incubation, the mobility was determinated by using of an optical microscope (Primo Star, Zeiss, Marly-Le-Roi, France). The isolates characterized as Gram-positive rods and catalase negative, were tested for carbohydrate fermentation ability using the API 50 CH strips with API CHL medium (API system LaBalme le Grottes, Montalieu Vercieu, France), incubated at 30°C for 48 h following manufacturers instruction.
Acid producing strains were identified as earlier described (Dicks and Van Vuren, 1987) with slight modification. Each strain was inoculated at 30°C in 5 mL MRS agar medium without beef extract, and with 0.004 g/L of bromocresol purple in tubes. Acid production was monitored during three days by formation of yellow area in the tube and acidification capacity was analyzed by a visual evaluation of the yellow area‟s spread.
Then tests of aerobic and anaerobic growth were assessed using two inoculated tubes containing 5 mL of MRS broth supplemented with 0.004 g/L of bromocresol purple of which one was incubated aerobically at 30°C, and the other anaerobically in an anaerobic jar. If growth was possible, the purple would turn yellow. Homo- or heterofermentative assimilation of glucose was assessed using 5 mL MRS agar broth in tubes. The heterofermentative character was analyzed by a visual evaluation of the breakdown of the agar broth due to CO2 gas production at the bottom of the tube. An isolate was deemed to be a homofermentative lactic acid producer if no gas was produced.
Eleven strains were selected from all these experiments, and tested for their ability to lactic acid fermentation at 45°C and 50°C to select the possible thermotolerant of them in MRS broth without beef extract, and with 0.004 g/L of bromocresol purple in tubes. An 18 h culture of each isolate was used as the inoculums whereby the cells were spun down, re-suspended in 0.85% saline, and 100 µL of
the suspension was inoculated into each test bottle. Three of them were then selected and also tested at 15, 30 and 37°C and subjected to lactic acid concentrations of 0.5 and 1% and to NaCl concentrations of 2, 5, 7 and 9 % (w/v). Four pH were tested, that is, 3, 5, 7 and 9. The basal medium was adjusted with 1M phosphoric acid and 1M NaOH, and the tubes were placed at the specific temperatures or at 37°C concerning tests dealing with pH, concentrations of lactic acid and NaCl, respectively. After 42 h, growth level was evaluated by visual inspection by the color change and turbidity of each bottle was noted as a simple indication of growth or no growth. All experiments were done in triplicate. Assay of acidification capacity of isolates The three thermotolerant strains were selected and tested during 42 h for their capacities to reduce pH to less than 4.2 (Kostinek et al., 2007). For this purpose, 5 mL of MRS broth (into tubes) adjusted to pH 6.5 before autoclaving (pH 6.2 after autoclaving) was inoculated with 0.2% of an overnight preculture (OD600 = 1) and cultures were grown aerobically at 37°C. Acid production was determined by measuring the culture pH after 6, 12, 18, 24, 30, 36 and 42 h by a pH-meter (pH700, Eutech Instruments, Adelaide, Australia). During microbial growth, the pH of MRS broth media was automatically measured by a pH-meter (pH700, Eutech Instruments, Adelaide, Australia). Biomass evolution was followed by measuring absorbance at 600 nm. Acidity was titrated against 0.1N NaOH using phenolphthalein as indicator and the total titratable acidity was calculated as a percentage of lactic acid. Strains able to induce drop of MRS broth pH from 6.2 to less than 4.2 at the end of the fermentation were selected for further screening studies (Kostinek et al., 2007). Screening of enzymatic activities of isolates For alpha-amylase and cellulase production, LAB isolates were grown on modified MRS agar plates containing 20 g/L cassava starch or carboxymethylcellulose (CMC) as the sole carbon source on Petri dishes. The plates were incubated at 37°C for 24 h, and flooded with iodine. Production of amylase or cellulase was evident by a clear area surrounding the colonies (Ouattara et al., 2008). Identification of isolates Strains were identified by MALDI-TOF-MS (Matrix-Assisted Laser Desorption/Ionisation Time-Of-Flight Mass Spectrometry (ABSciex, Framingham, MA, USA)) according to Doan et al. (2012). Bacterial cells were grown on MRS-agar under aerobic conditions for 48 h at 28°C, and sub-cultured twice. Cell extractions were prepared according to the formic acid and acetonitrile extraction protocol as described by Freiwald and Sauer (2009). One μL of freshly prepared cell extract was spotted on a 384 Opti-TOF stainless steel MALDI target plate (ABSciex, Framingham, MA, USA) and dried at room temperature. Next 1 μL of 0.5% (w⁄v) α-cyano-4-hydroxycinnamic acid (α-CHCA) in 50: 48: 2 acetonitrile: water: trifluoroacetic acid solution was added and allowed to dry.
Bacterial fingerprints were acquired using the 4800 Plus MALDI TOF⁄TOFTM- Analyzer (ABSciex, Framingham, MA, USA) in linear positive ion mode. Ions were generated by a 200-Hz-tripled UV Nd: YAG laser, accelerated in a 20-kV electric field through a grid at 19.2 kV and separated according to their m⁄ z ratio in a 1.5-m long linear field-free drift region. For each spotted extract, 40 laser shots at 50 random positions within the spot were collected automatically
Krabi et al. 273 in the mass range from 2000 to 20 000 Da. A maximum laser intensity of 5200 pdu (power distribution unit) resulted in base peak signal intensities varying between 5.0 × 10² and 1.0 ×10⁴ cps (continuous periodic signal).
Prior to the analyses, calibration was performed with a protein calibration standard that includes the adrenocorticotropic hormone (ACTH) fragment 18–39 MALDI-MS standard (m⁄ z 2465.7), insulin (m⁄ z 5734.6), ubiquitin I (m⁄ z 8565.9), cytochrome C (m⁄ z 12361.5) and myoglobin (m⁄ z 16952.3). The raw data were extracted as t2d files from the 4800 plus MALDI TOF⁄TOFTM-analyzer software, imported into the Data Explorer 4.0 software (Applied Biosystems) and transformed to text files.
Next, these text files were imported into the BioNumerics 5.0 software package (Applied- Maths, Sint-Martens-Latem, Belgium) and converted to fingerprints for further analysis. Pearson‟s product moment correlation coefficient was used to determine similarity between the spectra by which the spectra were subsequently clustered using the Unweighted Pair Group Method with Arithmetic Mean (UPGMA) clustering algorithm. To validate the tentative identifications of the isolates, their profiles were clustered against all previously characterized lactic acid producing bacteria (Doan et al., 2012).
RESULTS AND DISCUSSION Isolation and screening of microorganisms from natural sources has always proved to be a successful way for obtaining industrially interest strains (Adejumo, 2014). It is well understood that LAB, which grow as the adventitious microflora of foods or that are added to foods as starter cultures, are generally considered to be harmless (Elyas et al., 2015).
In this study, eleven presumptive LAB strains (regular rod shape (bacilli), positive for Gram staining, negative for catalase and oxydase and non-endospore forming) were isolated from traditional cassava starters used for attieké fermentation and identified as L. plantarum via MALDI-TOF MS. Figure 1 overviews the protein profiles of these isolates, including the reference spectrum of the type strain of L. plantarum (LMG 6907
T). The strains Lp 210, Lp 140 and Lp 19
shows more than 80% spectral similarity with the L. plantarum type strain. These homofermentative strains among the eleven with greater lactic acid fermentative ability on glucose (produced titratable acidity more than 1% after 12 h), presented growth and fermentative ability at 45°C, and were confirmed as L. plantarum according to their sugar fermentation profile by API 50 CHL kit (Percentage ID more than 99%).
Surprising, strains LP 210, LP 140 and Lp 19 were isolated from BEA agar plates. L. plantarum strains, by their biochemical properties, presented suitable characters for their use as pure microbial starters for cassava dough fermentation (Edward et al., 2012). Ability for microbial growth and fermentation at high temperature such at 45°C is a suitable feature for their industrial exploitation, especially for the thermotolerance in tropical regions where ambient

274 Afr. J. Food Sci.
Figure 1. UPGMA dendrogram based on the Pearson correlations between the mass spectra of 11 isolates and the L. plantarum type strain. Protein profiles are displayed as gel views ranging from 2000 m/z to 20000 m/z.
Table 1. Microbial growth according to different environmental conditions.
Environmental conditions Isolates
Lp 210 Lp140 Lp 19
Temperature (°C)
15 + + +
30 + + +
37 + + +
45 + + +
50 - - -
Lactic acid (%,W/v)
0.5 + + +
1 - - -
NaCl (%,W/v)
2 + + +
5 + + +
7 + + +
9 - - -
pH
3 + - -
5 + + +
7 + + +
9 - - -
temperature is generally higher than 30°C (Ndoye et al., 2006).
Indeed, this property makes it possible to reduce in a
considerable way the cooling water expenses during production in bioreactor and to prevent great mortality during storage after processes such as atomization, freeze-drying (Ndoye et al., 2006). Moreover, a high fermentation temperature also reduces contamination by other microorganisms. In addition, these three strains presented resistance to drastic environment (ability to growth and to ferment at 7% NaCl which requires an osmotolerance property, and ability to resist at low pH for Lp 210 (that is, pH = 3) indicating their acidophilic character (Table 1).
High osmotolerance ability and acidophilic character are suitable features for an industrial LAB. They all grew as well-in the absence and presence of oxygen, possessed trace of amylase and cellulase for Lp 210 but did not degrade starch into fermentable sugars able to be directly fermented. These strains showed similar fermentation profile excepted for raffinose and Potassium-gluconate of which the fermentation was strain-dependant. Strain Lp 140 fermented Potassium-gluconate and Strains Lp 210 and Lp 19 did not. Raffinose fermentation is met for strains Lp 140 and Lp 19 (Table 2). Cassava roots contain raffinose (Dossevi et al., 1980). Ability for fermentation of indigestible sugars like raffinose or stachyose is an interesting property. Indeed, in humans, these sugars are metabolized by microorganisms in the large intestine, liberating huge amounts of gas, which can then cause gastrointestinal disorders (LeBlanc et al., 2004).
Cellulase is a cell wall degrading enzyme required to break down cassava tissue and to induce a desired textural modification by softening cassava derived-foods

Krabi et al. 275
Table 2. Enzyme activities and technological properties of the three isolates.
Strains Cellulase α-amylase Raffinose fermentation pH < 5.3 at 6 h pH < 4.2 at12h Fermentation at 45°C
Lp 210 + + - + + +
Lp 140 - + + + + +
Lp 19 - + + + + +
Figure 2. Changes in growth curve (a) and titratable acidity (b) during the isolates growth.
(Obilie et al., 2003). In addition to this enzyme, amylase is required in starchy food to improve their digestibility. However, in many studies, only a few amylolytic LAB have been isolated from starchy fermented foods in Africa such as gari (a cassava fermented partially gelatinized granular-product) production in Benin (Kostinek et al., 2007).
An important feature for a potential LAB starter strain is its ability to rapidly acidify its environment, as the acid production and the accompanying pH decrease is well-known to extend the lag phase of sensitive organisms including food borne pathogens. Suitability for lactic acid fermentation of isolates was studied on MRS broth over 42 h. Microbial growth and produced titratable acidity were presented in Figure 2. Strain Lp 140 presented better growth followed by Lp 19 and then by Lp 210. Peaks of growth (OD600 = 2.1-2.6) and the produced amount of
lactic acid (1.3-1.7 %) were obtained after 42 h.
In cassava dough for attiéké preparation, titratable acidity increased until 0.7±0.05 % after 24 h (Coulin et al., 2006). Also, in traditional cassava starters used for attiéké preparation, titratable acidity ranged from 0.02 to 0.09% (Kakou et al., 2010; Tetchi et al., 2012). These low rates of titratable acidity met during the process of attiéké preparation compared to the obtained levels in this study could be explained by the MRS broth composition, which is very rich comparatively to cassava dough, mainly consists of starch (89%), protein (2.5%), fat (1%) and other minerals (more than 1 %), respectively (Pierre, 2012).
The high content of produced titratable acidity (more than 1% after 12 h on MRS broth) shows that these isolates may be suitable for industrial production of lactic acid and, also as pure starters for lactic acid fermentation

276 Afr. J. Food Sci. of cassava dough. Generally, L. plantarum has the best ability for lactic acid fermentation than others strains such as bacteria, yeasts or moulds (Kostinek et al., 2007). In addition, LAB, especially L. plantarum strains show antimicrobial properties (production of organics acid, bacteriocin and hydrogen peroxide) contributing to inhibition or reduction of pathogens (Kostinek et al., 2007; Yasmeen et al., 2015).
Vieira-Dalodé et al. (1994) reported that lactic acid fermentation for the production of máwe (a fermented
cereal in Bénin), reduced the Enterobacteriaceae population below the detection level (< log10 1.7 cfu/g) after 24 h of fermentation. The pH of MRS broth (6.2 after autoclaving) decreased faster during the first hours for these strains. These isolates induced a rapid pH decrease to below 5.3 after 6 h and 4.2 after 12 h (that is, pH = 4.08, 3.92 and 3.93 for isolates Lp 210, Lp 19 and Lp 140, respectively) and then, the pH remains constant to a value of 3.50 to 3.70 after 24 to 42 h.
Comparatively to Kostinek et al. (2007) and Edward et al. (2012), these isolates are rapid acid producer‟s strains. In fact, a pH less than 4.2 constitutes a major food safety factor. The required pH to inhibit undesirable bacteria should be at least pH 4.2. This is because spoilage bacteria, as well as pathogens, notably those including members of Enterobacteriaceae family, do not grow below this pH level (Kostinek et al., 2007; Edward et al., 2012). Coliforms have been mentioned in traditional cassava starters and in cassava dough during attiéké preparation. Their presence is evidence of possible faecal contamination, through water or materials used or from the environment (Tetchi et al., 2012).
Thus, from both a quality and safety perspective, the use of starter cultures is recommended, as it would lead to a rapid acidification, inhibition of spoilage and pathogenic bacteria (Holzapfel, 2002), and to a safe and constant quality product. Antimicrobial activities against bacteria causing diarrhoea have been related to LAB involved in fermentation of uji, a Kenyan indigenous fermented cereal gruel (Mbugua and Njenga, 1991).
Several studies have shown that at pH <4.0 diarrhoea-causing pathogens will be inhibited in traditional ready-to-eat“ fermented food products (Steinkraus, 1996). Thus, in regarding to such technological properties, these three isolates would be confirmed in further steps by pilot plant fermentations. These results also are in agreement with literature considering L. plantarum as suitable starters culture for cassava dough fermentation into cassava derived-foods like gari and kivunde (Giraud et al., 1983; Kimaryo et al., 2000; Kostinek et al., 2008). Conclusion Three L. plantarum strains isolated from traditional cassava starters with important lactic acid fermentative
ability induced a rapid decline of the initial pH of MRS broth (main food safety factor). These strains were thermotolerant and osmotolerant, presented cellulase for Lp 210 and alpha-amylase activities necessary for cassava dough softening, and fermented raffinose (an indigestible sugar) for Lp 140 and Lp 19. In regards to these features, they may be suitable for their industrial exploitation and, particularly as microbial starters for reliable and reproducible fermentation of cassava dough to optimize and standardize the quality of attieké. Conflict of Interests The authors have not declared any conflict of interests. ACKNOWLEDGEMENTS The authors sincere thanks go to West Africa Agricultural Productivity Program (WAAP) and Agence universitaire de la francophonie: University Agency of the Francophonie (AUF) for their financial support. They are also grateful to producers who had freely accepted to participate to this study. REFERENCES Adejumo TO (2014). Antimicrobial activity of lactic acid bacteria isolated
from fermented milk products. Afr. J. Food Sci. 8(10):490-496. Coulin P, Farah Z, Assanvo J, Spillmann H, Puhan Z (2006).
Characterization of the microflora of attiéké, a fermented cassava product during traditional small-scale preparation. Int. J. Food Microbiol. 106 (2):131-136.
De Oliveira EC, Elizabeth S, Teresa LV, Édison M, Luiz HCA, Guilherme B, Jair RP (2015). Influence of harvest time in accumulation of biomass between cassava cultivars. Afr. J. Agric. Res. 10 (51):4675-4680.
Dicks LMT, Vuuren VHJJ (1987). A modification of the hot-tube method for the detection of carbon dioxide produced by heterofermentative Lactobacillus strains. J. Micro. Methods 6(5):273-275.
Djeni NT, Kouadio FN, Adjéhi TD, Koffi MD (2008). Impact of different levels of a traditional starter on the fermentation of cassava dough for Attiéké production. Food 2(2):145-151.
Doan NT, Van HK, Cnockaert M, De Brandt E, Aerts M, Le Thanh B, Vandamme P (2012). Validation of MALDI-TOF MS for rapid classification and identification of lactic acid bacteria, with a focus on isolates from traditional fermented foods in Northern Vietnam. Lett. Appl. Micro. 55(4):265-273.
Dossevi L, Bantsimba M, Digaud A, Fournier P (1980). Effects of soluble carbohydrates from several tropical foods (cassava, peanuts, coconut and papaya) on calcium utilization in the rat. Ann. Nut. Aliment., 34(3):527-536.
Edward VA, Egounlety M, Melanie H, Petrus JVZ, Suren S, Naledzani DN, Vetja MH, Charles MAPF (2012). Isolation and screening of microorganisms from a gari fermentation process for starter culture development. Afr. J. Biotechnol. 11 (65):12865-12877.
Elyas YYA, Yousif NME, Ahmed IAM (2015). Screening of lactic acid bacteria from sudanese fermented foods for bacteriocin production. J. Micro. Biotech. Food Sci. 4(5):373-378.
FAO (2008). http://www.fao.org/ag/agp/agpc/gcds/accessed Freiwald A, Sauer S (2009). Phylogenetic classification and

identification of bacteria by mass spectrometry. Nat. Protoc. 4:732-742.
Gemechu T (2015). Review on lactic acid bacteria function in milk fermentation and preservation. Afr. J. Food Sci. 9(4):170-175.
Giraud E, Gosselin L, Raimbault M (1993). Production of a Lactobacillus plantarum starter with linamarase and amylase activities for cassava fermentation. J. Sci. Food Agric. 62(1):77-82.
Holzapfel WH (2002). Appropriate starter culture technologies for small-scale fermentation in developing countries. Int. J. Food Micro. 75(3):197-212.
Holzapfel WH, Wood BJB (Eds.) (2014). Introduction to the LAB. John Wiley & Sons, Ltd. Chichester. pp. 1-12.
Kakou AC, Tagro GS, Olo K, Akissi KF, Koffi NR, Marina KC (2010). Biochemical and microbial changes during traditional spontaneous lactic acid fermentation process using two varieties of cassava for production of a “Alladjan” starter. Int. Food Res. J. 17:563-573.
Kimaryo VM, Massawe GA, Olasupo NA, Holzapfel WH (2000). The use of a starter culture in the fermentation of cassava for the production of "kivunde", a traditional Tanzanian food product. Int. J. Food Micro. 56(2-3):179-190.
Kostinek M, Specht I, Edward VA, Pinto C, Egounlety M, Sossa C, Mbugua S, Dortu C, Thonart P, Taljaard L, Mengu M, Franz CM, Holzapfel WH (2007). Characterisation and biochemical properties of predominant lactic acid bacteria from fermenting cassava for selection as starter cultures. Int. J. Food Micro. 114(3):342-351.
Kostinek M, Hanak A, Specht I, Dortu CM, Thonart P, Mbugua S, Holzapfel WH, Hertel C, Franz CM (2008). Use of Lactobacillus strains to start cassava fermentations for Gari production. Int. Food Microbiol. 128(2):258-267.
Kouamé AK, Djéni TN, N‟guessan FK, Dje MK (2012). Post processing microflora of commercial attieke (a fermented cassava product) produced in the south of Côte d‟Ivoire. Lett. App. Microbiol. 56:44-50.
LeBlanc JG, Garro MS, Savoy de GG (2004). Effect of pH on Lactobacillus fermentum growth, raffinose removal, alpha-galactosidase activity and fermentation products. Appl. Micro. Biotech. 65(1):119-123.
Mbugua SK, Njenga J (1991). The antimicrobial activity of fermented Uji. Ecol. Food Nutr. 28:191-198.
Ndoye Bassirou, Lebecque Stephane, Dubois-Dauphin Robin, Tounkara Lat, Guiro T Amadou, Kere Christine, Diawara Bréhima and Thonart Philippe (2006). Thermoresistant properties of acetic acids bacteria isolated from tropical products of Sub-Saharan Africa and destined to industrial vinegar. Enzyme Micro. Technol. 39(4):916-923.
Krabi et al. 277
Ngobisa NAIC, Kammegne DP, Ntsomboh NGM, Zok S, Fontem D
(2015). Isolation and identification of some pathogenic fungi associated with cassava (Manihot esculenta Crantz) root rot disease in Cameroon. Afr. J. Agric. Res. 10(50):4538-4542.
Obilie EM, Tano-Debrah K, Amoa-Awua WK (2003). Microbial modification of the texture of grated cassava during fermentation into akyeke. Int. J. Food Micro. 89(2-3):275-280.
Ouattara HG, Ban-Koffi L, Karou GT, Sangare A, Niamke SL, Diopoh JK (2008). Implication of Bacillus sp. in the production of pectinolytic enzymes during cocoa fermentation. World J. Microbiol. Biotechnol. 24: 1753 -1760.Padonou SW, Nielsen DS, Akissoe NH, Hounhouigan JD, Nago MC, Jakobsen M (2010). Development of starter culture for improved processing of Lafun, an African fermented cassava food product. J. App. Micro. 109(4):1402-1410.
Pierre MTA (2012). Influence de la fermentation contrôlée, du pressage et de la granulation mécanisés du manioc (Manihot esculenta Crantz) râpé sur les caractéristiques physicochimiques et sensorielles de «l‟Attiéké». PhD. Thesis, Nanguy Abrogoua University, Côte d‟Ivoire.
Piard JC, Desmazeaud M (1992). Inhibiting factors produced by lactic acid bacteria bacteriocins and other antibacterial substances. Lait 72(2):113-142.
Steinkraus KH (1996). Handbook of Indigenous Fermented Foods. (2nd ed., revised and Expanded). Marcel Dekker.
Tetchi FA, Oluwa WS, Kakou AC, Amani NG (2012). Effect of cassava variety and fermentation time on biochemical and microbiological characteristics of raw artisanal starter for attiéké production. Inn. Rom. Food Biotechnol. 10:40-47.
Vieira-Dalodé G, Jespersen L, Hounhouigan D J, Moller PL, Nago CM, Jakobsen M (2007). Lactic acid bacteria and yeasts associated with gowé production from sorghum in Bénin. J. Appl. Micro. 103(2):342-9
Yasmeen YAE, Nuha MEY, Isam AMA (2015). Screening of lactic acid bacteria from sudanese fermented foods for bacteriocin production. J. Microbiol. Biotechnol. Food Sci. 4(5):373-378.
http://www.ncbi.nlm.nih.gov/pubmed?term=Holzapfel%20WH%5BAuthor%5D&cauthor=true&cauthor_uid=12036143
http://www.ncbi.nlm.nih.gov/pubmed?term=Holzapfel%20WH%5BAuthor%5D&cauthor=true&cauthor_uid=17188771

Vol. 10(11) pp. 278-291, November 2016
DOI: 10.5897/AJFS2016.1434
Article Number: 8E1D34D60698
ISSN 1996-0794
Copyright © 2016
Author(s) retain the copyright of this article
http://www.academicjournals.org/AJFS
African Journal of Food Science
Full Length Research Paper
Determinants of seasonal food insecurity in the ‘green famine’ belt of Ethiopia: The case of households in Belo-jiganfoy District, Benishangul-gumuz region
Guyu F. D. 1* and Muluneh W.2
Addis Ababa University, Ethiopia.
Received 3 March, 2016, Accepted 8 August, 2016.
Despite enormous body of literature on household food insecurity and its determinants in the non-green belt of Ethiopia, such a research is scanty or nonexistent in the ‘green famine’ belt. The objective of this study was to examine factors determining household food insecurity in the ‘green famine’ belt of Ethiopia. Logistic regression model was employed to analyze the data collected through cross-sectional survey of 220 households selected from Belo-jiganfoy district. The study revealed that food insecurity was significantly determined by demographic, socioeconomic and technological factors. The effects of household size, participation in local labor unions and farming systems on food insecurity were positive while that of the use of extravagant consumption, small-scale irrigation, aggregate production, and education of household head were negative. Therefore, the study recommended that interventions should target at these most significant variables when attempting to build household resilience to food insecurity. Key words: Food insecurity, determinant, logistic model, ‘green famine’, Ethiopia.
INTRODUCTION Ethiopia‟s economy has been growing on average by a double digit rate since 2004 (IMF, 2014). Perhaps following this fast economic growth, food security status at national level has shown improvements over the last two and half decades. Food insecurity at national level had declined from approximately 52% in 1980s to 43% in 1995/96 (Devereux, 2000), but stayed almost the same at about 44% in 2003 (USAID, 2004). From this status, it had declined to 38.7% in 2004/05 and further to 35.6% in 2005/06. Then, it came down to 33.3% in 2006/2007 and
28% in 2009/10 (MoFED, 2008). Despite the fast economic growth and declining trend in food insecurity status at national level, empirical research shows that food insecurity at household level has remained considerably high in many parts of the country. A surprising feature of food insecurity in Ethiopia is its situation in the „green famine‟ belt, the area that generally represents the western half of Ethiopia characterized by adequate rainfall, green vegetation cover, almost absence of drought, low population pressure, and better
*Corresponding author. E-mail: [email protected]. Tel: +251912194272.
Author(s) agree that this article remains permanently open access under the terms of the Creative Commons Attribution
License 4.0 International License
land resource endowments (Guyu, 2015). In Benishangul-gumuz region (BGR) as a whole, about 58% of the population was food insecure in 2004 (BGRFS, 2004). Empirical studies at community and household levels in different districts of the region show that food insecurity (proxy indicator of „green famine‟) is deep-rooted in the region. A qualitative study of semi-pastoral communities indicates that poverty and food insecurity in the region in general and in Dibate district in particular were severe (Guyu, 2012). According to this study, mainly people among the indigenous ethnic group (particularly the Gumuz) resorted to depend on wild foods as coping mechanism. The other work, such a dependence on wild foods was found to be an indicator of food sovereignty of households as they preferred to this source of food to food market (Guyu and Muluneh, 2015). The proportions of food insecure households were 85% in Assosa district (Dagnachew, 2004) and 58% in Bullen district (Guyu, 2014), both being in BGR. A parallel study in Belo-jiganfoy district showed that the majority of households were food insecure by all standards (Guyu, 2015). Moreover, the analysis of resilience-vulnerability continuum in the same district revealed that about 65% of households were vulnerable while only about 35% of them were resilient to food insecurity at different levels (Guyu and Muluneh, 2015). This shows that food insecurity has remained one of the most considerable challenges of the region despite the relative suitability of conditions for agricultural production.
According to FAO (2010), food security exists when all people, at all times, have physical, social and economic access to sufficient, safe and nutritious food that meets their dietary needs and food preferences for an active and healthy life. Household food insecurity is the application of this concept to at household level, with individuals within household as the focus of concern (FAO, 2010; Canali and Slaviero 2010). In Ethiopian context, household food insecurity exists when a household is not capable of sufficiently feeding its members from either its own production or purchase from the market, in return to own cash that might be earned from the exchange of self-endowment (Degefa, 2005). In this manuscript, household food insecurity is used as a proxy indicator of „green famine‟
„Green famine‟ exists when people face the challenges of acute food shortage leading to hunger or starvation but when such acute shortage of food occurs in areas characterized by environmentally and demographically favorable conditions for agricultural production (Guyu, 2015; Guyu and Muluneh 2015). The concept was initially used in Mulugeta (2014) as an official academic research topic conducted in Southern Ethiopia although the idea of „green famine‟ in Ethiopia was mentioned earlier by some authors (Alemayehu, 2001) and foreign media such as Agence France-Press [AFP] (2008). The concept of „green famine‟ used in Mulugeta (2014) is entirely dependent on the suggestion of Alemayehu (2001), both
Guyu and Muluneh 279 located in „enset‟ producing southern highlands of Ethiopia. But these areas are characterized by high population pressure, fragmented and degraded lands and, occasional occurrences of droughts but considered as everything is „green‟ there. The concept is then redefined by adapting to the situations in Western Ethiopia in Guyu (2015) and became more mature in Guyu and Muluneh (2015), both sources using seasonal food insecurity as a proxy indicator of „green famine‟, in which the area itself is termed as „green famine‟ belt (GFB) of Ethiopia. In the later sources, „greenness of everything‟, as opposed to Alemayehu (2001) and Mulugeta (2014), is defined for not only adequate rainfall and vegetation but also adequate availability of farmland as a result of low population density and existence of little or no drought. Therefore, the phrase food insecurity and „green famine‟ in this paper are used synonymously. By definition and based on the empirical reviews, the GFB in general and the case study area in particular is vulnerable to „green famine‟ or seasonal food insecurity. The question in this paper is what determines household‟s food insecurity status (that is, a proxy indicator of „green famine‟) in the GFB of Ethiopia?
The causes of household „green famine‟ are related primarily and heavily to agricultural production. Different theories that explain the causation of food insecurity can be used to understand the factors that determine „green famine‟. The first is the demographic theory explanation of food security, which in turn is divided into two different perceptions held by different thinkers, primarily Thomas Malthus and Easter Boserup. Thomas Malthus (1766-1834) argues that population tends to increase faster than the food supply because rapid population growth results in tremendous land degradation leading to the down spiral of agricultural productivity and the decline in per capita food supply for consumption (Degefa, 2005). According to the neo-Malthusian theory, increasing and high population, if remain unchecked, leads to famine and food shortages. Contrary to the Neo-Malthusian views, Boserup argues that increasing and large population stimulates agricultural development and ensures increased level of food supply (Boserup, 1965). Both theories are however criticized for they are merely availability-oriented models but have been used as theoretical foundations for understanding causes of failures in food availability. However, food insecurity is not caused by factors that determine availability component alone. Rather, models used to capture and comprehensively understand the determinants of food insecurity should include all components of food security: Availability, accessibility and utilization as well as stability (Gross et al., 2000) and, sovereignty too.
Another theory that can be used to explain causes of famine and food insecurity is supply-demand explanation of food insecurity (Shiferaw et al., 2003). According to this theory, determinants of food insecurity can be divided into two: Supply-side determinants and demand-side
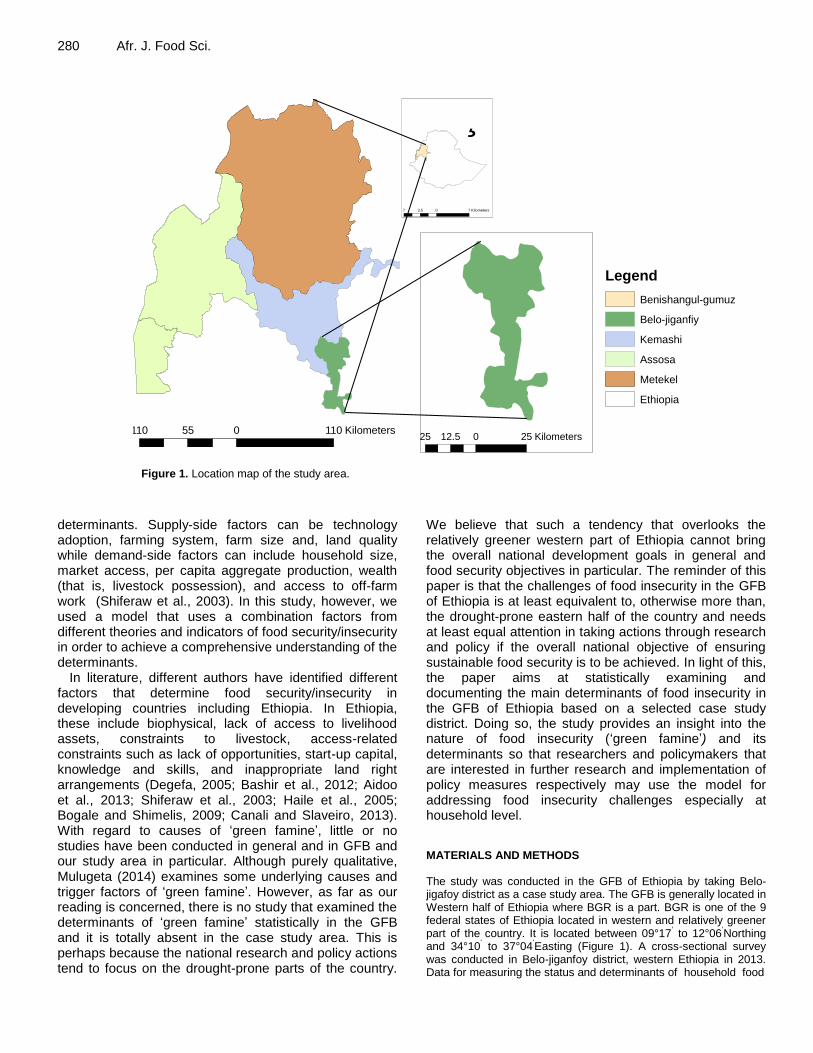
280 Afr. J. Food Sci.
Figure 1. Location map of the study area.
determinants. Supply-side factors can be technology adoption, farming system, farm size and, land quality while demand-side factors can include household size, market access, per capita aggregate production, wealth (that is, livestock possession), and access to off-farm work (Shiferaw et al., 2003). In this study, however, we used a model that uses a combination factors from different theories and indicators of food security/insecurity in order to achieve a comprehensive understanding of the determinants.
In literature, different authors have identified different factors that determine food security/insecurity in developing countries including Ethiopia. In Ethiopia, these include biophysical, lack of access to livelihood assets, constraints to livestock, access-related constraints such as lack of opportunities, start-up capital, knowledge and skills, and inappropriate land right arrangements (Degefa, 2005; Bashir et al., 2012; Aidoo et al., 2013; Shiferaw et al., 2003; Haile et al., 2005; Bogale and Shimelis, 2009; Canali and Slaveiro, 2013). With regard to causes of „green famine‟, little or no studies have been conducted in general and in GFB and our study area in particular. Although purely qualitative, Mulugeta (2014) examines some underlying causes and trigger factors of „green famine‟. However, as far as our reading is concerned, there is no study that examined the determinants of „green famine‟ statistically in the GFB and it is totally absent in the case study area. This is perhaps because the national research and policy actions tend to focus on the drought-prone parts of the country.
We believe that such a tendency that overlooks the relatively greener western part of Ethiopia cannot bring the overall national development goals in general and food security objectives in particular. The reminder of this paper is that the challenges of food insecurity in the GFB of Ethiopia is at least equivalent to, otherwise more than, the drought-prone eastern half of the country and needs at least equal attention in taking actions through research and policy if the overall national objective of ensuring sustainable food security is to be achieved. In light of this, the paper aims at statistically examining and documenting the main determinants of food insecurity in the GFB of Ethiopia based on a selected case study district. Doing so, the study provides an insight into the nature of food insecurity („green famine‟) and its determinants so that researchers and policymakers that are interested in further research and implementation of policy measures respectively may use the model for addressing food insecurity challenges especially at household level. MATERIALS AND METHODS The study was conducted in the GFB of Ethiopia by taking Belo-jigafoy district as a case study area. The GFB is generally located in Western half of Ethiopia where BGR is a part. BGR is one of the 9 federal states of Ethiopia located in western and relatively greener part of the country. It is located between 09°17„ to 12°06„Northing and 34°10„ to 37°04„Easting (Figure 1). A cross-sectional survey was conducted in Belo-jiganfoy district, western Ethiopia in 2013. Data for measuring the status and determinants of household food
7 0 73.5 Kilometers
¸
Legend
Benishangul-gumuz
Belo-jiganfiy
Kemashi
Assosa
Metekel
Ethiopia
110 0 11055 Kilometers25 0 2512.5 Kilometers
37004„Easting (Figure1).
Figure1 Location Map of the Study Area

insecurity were collected through a structured questionnaire. The questionnaire includes information on sources of food, as well as demographic and socioeconomic determinants of food insecurity. Accordingly, the dependent variable in the study is food insecurity (Y), which is one of the negative outcomes of household livelihoods, the positive outcome being food security. It was assumed that food security/insecurity is a function of socioeconomic, cultural and demographic factors. Yj = f {X1j, X2j, X3j, …, Xij } (1) Where; Xij represents the ith determinant for the jth household. Yj
represents the food insecurity status of the jth household.
The overall food security status is a binary outcome variable that takes a value of 1 if a household is food insecure, 0 otherwise. Thus, the food insecurity of the ith household (Yj) is therefore given as follows: Yj = 1, if Ki < Z; and Yi = 0, if Ki ≥ Z Where, Ki is the per capita kcal/ADE/day for ith household, and Z is the food security line (i.e. the minimum required kcal/ADE/day). The determination of food insecurity status involves certain procedure. It was determined based on five steps following the foot-steps of Haile et al. (2005). First, household food balance model (HFBM) was used to determine the net available food (NAF) for each household based on Equation 1. The model was used to calculate the NAF as the difference between the gross available food (GAF) and food disposed due to various reasons (FDSP). The HFBM was originally adapted by Degefa (1996) from FAO regional food balance model (Messay, 2013) in the Ethiopian context and then used by many other authors (Haile et al., 2005; Messay, 2009a; Guyu, 2014; Guyu, 2015). Second, the NAF was converted to total kilocalories for each household and then to ADE based on conversion factors provided by the 1998 Ethiopian Health and Nutrition Research Institute (EHNRI). Third, the kilocalories per kilogram calculated in step two were compared with the minimum per day per ADE subsistence calories required by an adult to live a healthy and moderately active life in Ethiopia which is set at 2100 kcal. This threshold was used as a cut-point between food insecure and food secure households in this paper. NAF = (GAF – FDSPL) = (OPF + FP + FB) – (FS + SR + PHL)(2) Where; NAF = Net available food/dietary energy supply; GAF = gross available food; FS = food sold; FDSPL = food disposal; SR = seed reserved; OPF = own food produced; PHL = post-harvest loss; FP = food purchased; FB = food borrowed.
Food security/insecurity is a binary categorical response variable in this paper. Different options of models are available for analyzing a categorical dependent variable. Linear regression model is a commonly method used in many studies. It is, however, applied when the dependent variable is measured on a continuous scale. For a binary response variable, discriminant analysis and logistic regression method are widely used but of them have limitations. Discriminant analysis is used if all predictors are continuous and nicely distributed. Logit (loglinear) analysis is often used if all predictors are categorical although the dependent variable is always categorical. Finally, logistic regression is often chosen if predictors are mixed and/or if they are not nicely distributed. In other words, logistic regression makes no assumption about the distribution of explanatory variables for best prediction of binary outcomes. The probit model is an alternative to logistic model because they either of them can be used for a categorical dependent variable. While probit is based on standard normal distribution, the logit is based on standard logistic distribution. According to Sodjinou et al. (2015), these two models often lead to the same conclusion and it is difficult to make a choice between the
Guyu and Muluneh 281 probit and the logit on theoretical bases. In this paper, we used the binary logistic regression method for its advantages over others. It assumes that the dependent variable is linearly related with the predictors. The dependent variable (Yj) is defined as 1 if a household is food insecure, otherwise 0 (j ranging from 1 - 220) and given as follows:
Yj = β0 + β1X1j, β2X2j, β3X3j, …, βiXij + e (3)
Where; Yj is the dependent variable; β0 is a constant value that represents the Y intercept; β1, β2, β3, …, βi are coefficients or slopes of X1, X2, X3, …, Xi respectively, and X1, X2, X3, …, Xi are explanatory variables, i is the number of coefficients and j is the number of observations, and e is error term. Statistical Package for Social Sciences (SPSS) version 19 was statistical tool or software used for analyzing the data.
Hypothesized variables influencing household food insecurity
The following 16 potential explanatory variables were selected and hypothesized based on literature and the authors‟ observation of the study area.
Household size in ADE (continuous) (HHSZADE)
This is a count variable expressed in adult equivalent (ADE) that is expected to influence household food insecurity. There is no clear relationship between household size and agricultural productivity and hence food security in literature. Some argue that large household size increases crop productivity and improve food supply while others disagree with idea. The acceptance of either idea depends on the nature of the activity and the degree of involvement of labor force into the work. The Boserupean theory of agricultural change argues that households with more family size (labor supply) tend to produce higher crop yield per unit of area (Boserup, 1965). Following this theory, some authors hypothesized and proved it to have positive relationship with agricultural yield, for example, in organic cotton production in Benin which needs labor intensive production system although it has insignificant influence (Sodjinou et al., 2015). On the other hand, most authors showed that household size has positive influence on food insecurity (Shiferaw et al., 2003; Haile et al., 2005; Bogale and Shimelis, 2009; Bashir et al., 2012; Aidoo et al., 2013). One obvious reason for this is that as household size increases, the number of mouths to feed from the available food increases (Bogale and Shimelis, 2009). Observation in most areas of Ethiopia shows that farm households are small-scale subsistence or semi-subsistence producers with limited participation in the non-agricultural sector. In this case, as resources are very limited, the increasing household size may put more pressure on consumption than it contributes to production. Under such a situation, food requirements increase with the number of persons in a household (Shiferaw et al., 2003; Haile et al., 2005). As a result, we expect a positive relationship between household size and food insecurity in our study area.
Cultivated land size per household (continuous) (LCULTD)
Generally, literature shows that land size and agricultural yield have positive relationship (Sodjinou et al., 2015). Other things being constant, cultivated farmland size measured in hectares has also negative relationship with the probability of being food insecure (Bogale and Shimelis, 2009; Aidoo et al., 2013). Access to, and cultivation of, land decreases the likelihood that the household will be food insecure. In this paper too, cultivated land size is hypothesized to have negative influence on household food insecurity.

282 Afr. J. Food Sci. Irrigation use (dummy) (IRRUSE)
There is a general consensus among literature that use of irrigation has a negative influence on the probability of being food insecure (Bogale and Shimelis, 2009). In this paper, we also hypothesized that farm households‟ use of small scale irrigation has a negative influence on food insecurity. The idea is that households who practice small scale irrigation can produce more output than those who do not and the likelihood of these households to become food insecure is less. Especially, its benefits are bold when rain-fed agriculture failures occur for various reasons.
Education of household head (continuous) (HEDUY)
This variable is measured in terms of years households stayed in schools. Literature shows that the likelihood of being food insecure decreases as the number of years a household head stayed in schools increases (Haile et al., 2005). The assumption is that education equips individuals with the necessary knowledge of how to make a living. That is, literate individuals are keen to get information and use it (Bogale and Shimelis, 2009). In other words, educated producers are able to read manuals and other extension materials, accessible to information through media and can communicate with extension services (Sodjinou et al., 2015). In this paper too, we expect a negative influence of education of household head on the probability of being food insecure.
Off-farm income (continuous) (off-farm)
This is a continuous variable measured in Eth birr. Literature shows that the likelihood of being food insecure decreases as access to and earning of money through off-farm income increases (Omotesho et al., 2006; Bogale and Shimelis, 2009). Following this assumption of general literature, we also proposed that off-farm income has negative relationship with food insecurity. The idea is that as households have more and more access to and practice of these activities, their likelihood of being food insecure will decrease.
Dependence on wild foods (dummy) (DWFs)
This refers to gathering and hunting wild foods by households. Although no literature was found that analyzed WEFs as a determinant of food insecurity, literature shows their contribution to household food security (Debela et al., 2011; Agea et al., 2011; Guyu, 2015) and to household resilience to food insecurity (Guyu and Muluneh, 2015). Accordingly, WEFs is hypothesized to influence food insecurity negatively in the study area. The assumption is that households can compensate food shortages by gathering and hunting wild foods. In other words, households that are more involved in gathering and hunting WEFs improve their food security than those who depend less on them.
Livestock possession (continuous) (TLU)
Literature shows that livestock possession has negative influence on household food insecurity (Messay, 2009). The idea is that livestock can be sold in order to purchase food during food shortages (Bogale and Shimelis, 2009). Following this, it is expected to have a negative influence on household food insecurity in our study area.
Participation in labor unions (dummy) (LBRUPTC)
This refers to whether household members participated in labor
union, locally known as wenfel or debo. It is expected to influence household food insecurity negatively. The assumption is that households that work together through such local labor unions are less likely to be food insecure than those who do not. Ethno-culture background (dummy) (ETHCBGD) This refers to whether households belong to indigenous or non-indigenous ethnic group (Guyu, 2015). It is expected that the probability of being food insecure increases for indigenous than the non-indigenous ethno-culture group. Accordingly, being indigenous ethno-culture group is hypothesized to have positive influence on household food insecurity in our study area. Age of household head (continuous) (AGEHH) Age of household head is expected to influence household food security. Nevertheless, there is no general consensus as to the direction of the influence of age on food security in literature. For example, Sodjinou et al. (2015) argue that the relationship between farmers‟ age and the decision to adopt an innovation or technology is not clear in the literature. Some argue that a one year increase in age of household head increases the probability of being food secure (Bogal and Shimelis, 2009). Proponents of this argument assert that age of household head is negatively related with food insecurity for various reasons. Rural households mostly devote their lifetime or base their livelihoods on agriculture. The older the household head has more experience in farming and weather forecasting. Moreover, older persons are more risk averters, and mostly they tend to diversify their production activities. As a result, the chance for such a household to be food insecure is less. In addition, in a household where productive age groups are higher than the non-productive age groups, the probability of a household to face food shortage would be less, provided that the area provides good working atmosphere and production potential (Bogal and Shimelis, 2009). In contrast, others argue that it is positively related with household food security. That means, a one year increase in the age of household head decreases the chances of being food insecure (Bashir et al., 2012; Aidoo et al., 2013). The proponents of this argument assert that the direct relationship between age of household head and food security is due to the fact that the younger people are stronger than the elders and can perform tougher jobs in the field. Moreover, households with older heads are the multigenerational households having more retired and/or older persons to feed (Bashir et al., 2012). Based on the general observation of the study area, we expect a negatively influence of age of household head on food insecurity as at least older age is associated with adequate experiences than younger one. Health condition of household members (continuous) (HEALTH) This variable refers to the frequency of illness or sickness of members of a household during the year. This variable is expected to influence food insecurity positively in the study area. It is assumed that the more frequently the household members get sick, the more they will be food insecure and vice versa. Aggregate agricultural production (continuous) (AGRPD) This refers to the total amount of agricultural production (measured in kg) obtained by a household without considering the deductions through selling, seed reserves, losses due to attacks by rodents,

Guyu and Muluneh 283 Table 1. Descriptive statistics of kcal supply by food security status and ethno-culture group.
Kcal/
ADE/day
Food security status Ethno-culture group
Food-insecure Food-secure Both Non- indigenous Indigenous Both
Total 168530.6 220112.5 388643.0 197469.3 191173.7 388643.0
Minimum 0.01 2107.9 0.01 65.01 0.01 0.01
Maximum 2069.1 8899.48 8899.48 8028.20 8899.48 8899.48
Average 1066.7 3550.2 1766.56 1994.64 1579.95 1766.56
STD 462.8 1546.5 1440.06 1590.82 1280.56 1440.06
insects, etc. In principle, it should consist of both crop and livestock production. However, in this study the outputs of various crops alone are considered as livestock in TLU were taken as one variable in the model. Literature shows a disagreement as to the direction of the influence of this variable on food insecurity. Some show that aggregate production has a positive influence on household food insecurity through the price effect (Shiferaw et al., 2003). The assumption is that an increase in aggregate production causes price to fall and hence those households whose income is dependent on food crops face a fall in farm income. The higher the market supply, the lower the price, and hence the higher the loss of producer revenue is in the case of inelastic demand (Shiferaw et al., 2003). Others show it has a negative influence on household food insecurity perhaps without considering the price effect in the model (Haile et al., 2005). We also expect a negative influence of this variable on food insecurity as we do not consider the price effects because farm households in the study area are not entirely dependent on sell of crop yield as a source of income. oxen possession (continuous) (Ox) Literature shows that oxen possession has a negative influence on agricultural production in general as they are important means of tillage and allow producers to sow large area (Sodjinou et al. (2015) and food insecurity in particular (Messay, 2009). The assumption is that households who possess more oxen are less likely to be food insecure than those who possess either less or no ox. In this paper too, we expect that possession of oxen has negative influence on the probability of being food insecure. Farming system (dummy) (FARMSTM) Farming system may mean different systems for different authors. For example, for Shiiferaw et al. (2003) it refers to classifying the system based on a combination of crops produced so that they grouped farming system as cereal-based and cereal-enset-based system (Shiiferaw et al., 2003). For others, it refers to the division of farming into shifting cultivation and permanent field farming systems (Beyene et al., 2011). FAO (2001) defines farming system as a population of individual farm systems that have broadly similar resource bases, enterprise patterns, household livelihoods and constraints, and for which similar development strategies and interventions would be appropriate (FAO, 2001). It should be noted that a farm system refers to a household, its resources, and the resource flows and interactions at this individual farm level so that depending on the scale of the analysis, a farming system can encompass a few dozen or many millions of households. Accordingly, farming systems can be divided into irrigated farming systems, wetland rice based farming systems, rain-fed farming systems in humid areas of high resource potentials, rain-fed farming systems in steep and highland areas and rain-fed farming systems
in dry and cold low potential areas, dualistic (mixed large commercial and small holder) farming systems, coastal artisanal fishing, often mixed farming systems, and urban based farming systems (FAO, 2001). In this paper, the definition of farming system refers to whether farming is hoe-based or oxen-based system. It is hypothesizes that households who were based on hoe-farming system were likely to become more food insecure than households who were based on oxen-farming system. Extravagant consumption (dummy) (EXTRVGC) This refers to the post-harvest overconsumption of agricultural outputs through different pretexts, the notable ones being traditional festivals, gust hosting, and labor unions mainly by the indigenous people of the study area. We expect to have negative influence on household food insecurity the study area. The assumption is that the more households consume in post-harvest period through different pretexts, the more likely they will be food insecure. Aspiration for change and wealth (ASPR) Aspirations (or the capacity to aspire) refer to the manner in which people visualize the future and engage in forward-looking behavior (Frankenberger et al., 2007). This is the capacity of households that conditions the preferences, choices and calculations of individuals/groups as well as the relationships they form with one another (Frankenberger et al., 2007). We hypothesize that aspiration has negative influence on household food insecurity. The assumption is that households who aspire to change their living conditions into better ones will work day and night and become wealthy and food secure and are less likely to be food insecure.
RESULTS AND DISCUSSION Dietary supply (kcal) of surveyed households The descriptive statistics of food intake of surveyed households in terms of kcal are presented in Table 1. The study revealed that households had average food intake of 1766.56 kcal/ADE/day with standard deviation (STD) of 1440.06 kcal/ADE/day. Previous studies conducted in central Ethiopia (Shewa), where population density is high and land fragmentation is much more than the green famine belt; the average kcal intake was about 4726 kcal/ADE/day (Messay, 2009). Previous study conducted in Bullen district (located in BGR and hence in the green famine belt) in Northwestern Ethiopia, showed an

284 Afr. J. Food Sci.
Table 2. Distribution of household food security status by ethno-culture group (N = 220).
Food security status Type of information Ethno-culture group Total
(%) Indigenous (%) Non-indigenous (%)
Food-secure
% within FSS-of -hh 46.8 53.2 100.0
% within Ethno-culture G. 24.0 33.3 28.2
% of Total 13.2 15.0 28.2
Food-insecure
% within FSS-of -hh 58.2 41.8 100.0
% within Ethno-culture G. 76.0 66.7 71.8
% of Total 41.8 30.0 71.8
Both
% within FSS-of -hh 55.0 45.0 100.0
% within Ethno-culture G. 100.0 100.0 100.0
% of Total 55.0 45.0 100.0
average food intake of about 2319.02 kcal/ADE/day (Guyu, 2014). While the former clearly shows that the average food intake is much lower than the non-green areas, the later implies that food insecurity has been worsened in the green famine belt as the study was conducted in the same region. There were also differences between the food secure and food insecure groups in their average kcal intakes. As expected, the average food intake was larger for food secure households (3550.2 kcal/ADE/day) than the food secure ones (1066.7 kcal/ADE/day). As with our prior expectation, the average food intake was also larger for non-indigenous group (1994.64 kcal/ADE/day) than the indigenous ones (1579.95 kcal/ADE/day). The study also showed higher diversity in food intakes among household in the food secure group (STD = 1546.5) than in food insecure group (STD = 462.8) and among the non-indigenous group (STD = 1590.82) than the indigenous group (STD = 1280.56). This contrasts to the previous study in Bullen district where the mean kcal intake of households in the indigenous ethno-culture areas (that is, the Gumuz) was higher (1674.16 kcal/ADE/day) than in the non-Gumuz ethno-culture areas (1399.28 kcal/ADE/day) (Guyu, 2014). This shows that severe food shortage is not necessarily the feature of indigenous households. Food security status of surveyed households The food security status of households by ethno-culture groups is presented in Table 2. Overall, about 72% of surveyed households were food insecure. This result is very high by standards of some countries in Africa including Ethiopia. For example, in Kwara State, Nigeria 75% of surveyed households was food insecure (Omotesho et al., 2006). Similarly, it is alarmingly larger than the national level incidence of undernourishment indicated in FAO‟s previous study in Ethiopia that shows 41% in 2005 to 2007 and 28% in 2009/10 (FAO, 2010). It is almost similar with the finding by previous study
conducted in Oromiya zone (Wollo) where drought is frequent. Here, about 81 and 74% of households felt food insecure and were food non-sufficient (Degefa, 2005). Likewise, this finding is almost similar with previous study conducted in Arsi zone (Dodota district) in central eastern Ethiopia that showed about 79% of food insecure households (Haile et al., 2005), an area characterized by low rainfall distribution (Haile et al., 2005). Moreover, the finding is much more than that previous study conducted in the central part of Ethiopia (that is, Nonno district in Oromya region), an area characterized by high population density and land fragmentation, which showed about 21% of food insecure households (Messay, 2013). Within the green famine belt of Ethiopia (specifically in BGR), previous studies showed smaller proportions of food insecure households than this one. For example, previous study conducted at household level in Bullen district showed about 58% of food secure households (Guyu, 2014). A parallel study that assessed resilience-vulnerability continuum in Belo-jiganfoy district revealed about 65% of food insecure households (Guyu and Muluneh, 2015). The same study revealed that if the moderately food secure households on the continuum were considered as food insecure, the percent of food insecure households would have reached at 80% (Guyu and Muluneh 2015). Out of the total food insecure households, 46.8 and 53.2% were indigenous and non-indigenous ethno-culture groups respectively as compared to 58.2 and 41.8% of food insecure households respectively. Moreover, 24 and 76% of indigenous households were food secure and food insecure respectively as opposed to 33.3 and 66.7% of non-indigenous households respectively. In general, this study shows that food insecurity in our study area (that is, GFB) was at least similar with, otherwise more severe than, that of the drought-prone and high population density areas of Ethiopia. The overall implication of these results is that the depth and severity of food insecurity in the GFB of Ethiopia was severe as in the drought-prone and high population pressure areas. It is more severe for the indigenous households than the non-indigenous

Guyu and Muluneh 285 Table 3. Descriptive statistics of the variables included in the model (N = 220).
Variable Food insecure Food secure Both
t-Value Mean STD Mean STD Mean STD
HHSZ(ADE) 4.45 1.69 3.55 1.35 4.20 1.65 3.726***
LCULTD(ha) 4.11 2.64 5.52 5.13 4.50 3.57 -2.675***
HEDUY(year) 2.59 3.47 4.26 3.95 3.06 3.68 -3.083***
Livestock (TLU) 1.08 1.99 2.04 3.01 1.35 2.36 -2.779***
AGEHH (year) 39.55 12.61 35.18 11.97 38.32 12.56 2.347**
HEALTH(number) 10.01 9.73 9.00 8.57 9.72 9.41 0.713
AGRPRD (kg/hh) 2310 1620 4630 2682 2962 2232 -7.839***
OX (number) 0.49 1.24 0.73 1.16 0.55 1.217 -1.310
% Responded to given choices for the dummy variables in parentheses Chi-sq.
IRRUSE (yes) 6.8 5.5 12.3 4.022**
WEFs ((yes) 45.0 14.1 59.1 2.951*
LBRU (yes) 50.0 14.5 64.5 6.309**
ETHNCB (indig.) 41.8 13.2 55.0 2.360
FARNSTM (Hoe) 55.9 14.1 70.0 16.444***
EXTRVGC (yes) 43.2 20.0 63.2 2.250
ASPR (yes) 31.8 14.1 45.9 0.582
***, *** and * refers to statistically significant at <1, 5 and 10% respectively; Statistical tests used: t-test for continuous and Pearson chi-square for dummy variables.
ones. But, it should be understood that the nature of food insecurity is seasonal in the „GFB while it is chronic in the non-green famine areas of the country. Determinants of household food insecurity Descriptive results of hypothesized variables Descriptive statistics of hypothesized variables are summarized in Table 3. The mean household size of food insecure households (4.45ADE) was larger than that of food secure households (4.20ADE). The mean difference in the household size between the two groups was statistically highly significant (p<0.01). The negative sign of the t-value shows the inverse relationship between household size and the probability of being food secure. In contrast, the average cultivated land size of food insecure households (4.11 ha) was smaller than that of food secure households (5.52 ha) showing statistically significant mean difference between them (p<0.01) and positive relationship between land size and household‟s probability of being food secure. The mean year of household head education of the food insecure households (2.59 year) was much lower than that of the food secure households (4.26 years) and the mean difference between the two groups was significant with p<0.01 and positive relationship. Average livestock possession was smaller for food insecure households (1.08 TLU) than for food secure households (2.04 TLU) showing statistically significant difference (p<0.01). In
contrast, the average off-farm income was larger for food insecure households (2835.3 birr) than for food secure households (1766.8 birr) showing statistically significant difference at p<0.05. This is indeed because off-farm earning was fundamentally the feature of food insecure household. Similarly, the mean age of food insecure households (39.55 years) was relatively higher than that of food secure households (35.18 years) showing statistically significant differences at p<0.05. The average number of days a household had slept due to sickness (the indicator of the health condition) for food insecure households (10.01 days) was relatively higher than for food secure households (9.00 days) but the mean difference was not statistically significant at p<0.1. The mean aggregate production for food insecure households (2309.5 kg) was much smaller than for food secure households (4630.2 kg) with statistically significant difference at p<0.01. Likewise, the mean number of oxen possessed by food insecure households (0.49) was smaller than the food secure households (0.73) but not significant at p<0.1. About 13% of respondents had access to and used small scale irrigation, with about 7% for food secure and 6% for food secure households. Their mean difference was statistically significant at p<0.05. Almost 59% of households reported their dependence on one or more types of wild foods. Out of this, about 45% were food insecure while 14% were food secure households with statistically significant mean difference at p<0.1. Out of 64.5% of households who engaged in labor unions, 50% belongs to food insecure while 14.5% belongs to food secure households. Their mean

286 Afr. J. Food Sci.
Table 4. Binary regression showing parameters estimating the effects of determinants.
Variable B S.E. Wald Sig. Exp(B)
Household size (ADE) 1.528 0.296 26.744*** 0.000 4.611
Land cultivated (ha) -0.120 0.124 0.935 0.334 0.887
Irrigation use (yes/no) -1.795 0.782 5.268** 0.022 0.166
Household education (year) -.226 0.076 8.862*** 0.003 0.797
Dependence on WEFs (yes/no) 0.915 0.655 1.952 0.162 2.498
Livestock possession (TLU) 0.157 0.150 1.089 0.297 1.169
Participation in labor union (yes/no) 1.205 0.520 5.362** 0.021 3.335
Off-farm income (a
Eth. birr) 0.005 0.012 0.178 0.678 1.005
Ethno-culture (indigenous/non-indigen.) 0.094 0.765 0.015 0.803 1.098
Age of household Head (year) 0.008 0.020 0.154 0.695 1.008
Health condition (number of days/year) 0.002 0.028 0.006 0.938 1.002
Aggregate production (kg/household) -0.112 0.022 25.592*** 0.000 0.894
Oxen possession (number) -0.402 0.256 2.473 0.116 0.669
Farming systems (Hoe/oxen-based) 1.410 0.655 4.637** 0.031 4.096
Extravagant consumption (yes/no) -1.226 0.574 4.571** 0.033 0.293
Aspiration for change and wealth (yes/no) 0.793 0.584 1.845 0.174 2.210
Constant -1.977 1.222 2.616 0.106 0.138
Model prediction success (%)
Overall case predicted 88.6
Food Insecure 93.7
Food Secure 75.8
-2 Log-likelihood ratio for the model 124.049
H-L model test (df = 8) Chi-square = 12.341 (p = 0.137)
Nagelkerke Pseudo R2 0.668
***, ** and * represents statistically significant at <1, <5 and <10% respectively. a represents US $1 = 19.45 Eth. birr.
difference was significant at p<0.05. Out of 55% of households in the indigenous ethno-culture group contacted during survey, about 42% was food insecure while 13% was food secure, but their mean difference was statistically insignificant at p<0.1. As a whole, 70% of the respondents employed hoe-based farming system, with about 56% food insecure and 14% food secure. Indeed, their mean difference was highly significant (p<0.01).Almost 63% of respondents reported extravagant consumption as a cause of food insecurity. Of this, about 43% belongs to food insecure and 20% belongs to food secure and their mean difference was not statistically significant at p<0.1. Finally, about 46% of respondents reported that they had been aspiring for change and become wealthy. Out of this, almost 43% belongs to food insecure households and 20% belongs to food secure households. Regression results of determinants influencing household food insecurity The result of the binary logistic regression revealed that out of 15 hypothesized variables, 7 were statistically most significant at <10% level (Table 4). These include household size, use of small scale irrigation, household
head education, participation in labor union, aggregate production, farming system, and extravagant consumption. It does not mean that all the remaining 8 determinants had no influence on food insecurity. Health condition, ethno-culture background and age of household head were the most insignificant factors. Others had moderate effect on household food insecurity. Especially, oxen ownership had moderate influence at almost 10% level (p = 0.116) while aspiration for change and wealth (p=0.174), and dependence on wild foods (p=0.162) were the next moderate influencers at <20% level. Size of cultivated land (p=0.334) and livestock possession (p=0.297) can be regarded to have influenced food insecurity moderately at <35% level. Model characteristics The model produced by the binary logistic regression was checked for goodness of fit by using different methods and statistics. In all standards, the model was found appropriate and well fitted the data employed (Table 4). For selection of significant factors, first the regression analysis was run using forward stepwise likelihood ratio (Forward-LR) method. This showed seven significant variables at p<0.10 level. Both the change in -2 Likelihood

ratio and Wald statistics were in agreement in showing that each predictor was useful to the model. Moreover, the Omnibus chi-square statistic test was significant. The Hosmer and Lemeshow (H-L) chi-square statistic test for the model was 8.379 (p = 397). Then, as we were interested in those factors which were insignificant at p<0.10, we re-run the binary logistic regression using enter method. We found no difference in the type of significant variables and proceeded with further analysis. The H-L chi-square test statistic as indicated by the enter method was 12.341 (p = 0.137). Both methods were in agreement with each other and showed that the model adequately fitted the data because the p-value of both methods was greater than 0.05 which, as suggested by SPSS, shows a significant model fit. The pseudo R
2
statistic was 0.668 showing that almost 67% of the likelihood of a household being food insecure was strongly explained by the predictors in the model. Moreover, the logistic regression model predicted about 88% of the total variation in the food security status of surveyed households while such predictive capacities were almost 94 and 76% for food insecure and food secure households. The chi-square statistic shows that the parameters included in the model were significantly different from zero at p<0.10 level. This shows that the probability of households‟ being food insecure was generally related to the predictors in the model so that we can proceed to present and interpret the results. Effects of demographic factors on household food insecurity Household size In line with our prior expectation, the effect of household size on food security was positive (B=1.528) statistically most significant (p<0.01). Ceteris paribus, the odds ratio in favor of being food insecure increased by a factor of 4.611 with an increase in the household size by one member. This result conforms to the theory of Malthus (1798) that argues that large population lowers agricultural productivity and food security, but disproves the theory of Boserup (1965) that argues that large family size would increase agricultural productivity through intensification. This is also similar with several previous research findings conducted in developing countries including Ethiopia that showed statistically significant and positive relationship between household size and food insecurity (Shiferaw et al., 2003; Haile et al., 2005; Omotesho et al., 2006; Bogale and Shimelis, 2009; Bashir et al., 2012; Aidoo et al., 2013). The possible explanations to this sort of findings is that in an area where households depend on less productive agricultural land (Bogale and Shimelis, 2009) and/or areas where there is shortage of land or limited access to land and high rate of rural unemployment (Degefa, 2005),
Guyu and Muluneh 287 increasing household size results in increased demand for food which cannot match with the existing food supply so ultimately ending up with food insecurity. In contrast, the explanation of this finding in our study area (that is, the green famine belt) is quite different from the above ones because the situation here is characterized by relatively productive and adequate moisture and is different from the drought-prone and high population pressure areas of Ethiopia. The likely explanation is that many household members would be in their non-productive age and were in capable of contributing their labor. In this regard, the study showed that there were about 97 dependent people per 100 economically active people for the surveyed households. The other possible explanation is that most households reported their dependence on hoe-culture rather than on oxen-plough or other cultivation systems. The survey showed that about 70% of the households depended on hoe-culture which used traditional tool locally known as sapeta as main tool for tilling land manually and only 30% of them depended on oxen-culture as main tool for the same purpose. One more justification it that as observation shows that many people in the study area were not hard workers rather prefer to pass much of their working days or hours of days in villages drinking alcohols. In such a condition, an increase in household size obviously affects food insecurity positively. Age of household head Contrary to our expectation, the influence of the age of household head on food insecurity was positive but not significant (Table 4). This means that the odds ratio in favor of being food insecure increased by a factor of 1.008 with a one year increase in the age of household head. Although its effect was insignificant, the negative sign goes in line with some studies in developing countries (Bashir et al., 2012; Aidoo et al., 2013). The insignificant effect implies that the mean ages of the food insecure and food secure household heads were almost the same. Effects of economic, social and cultural factors on household food insecurity Cultivated land size Degefa (2005) argues that there should be a positive relationship between access to, and cultivation of land and food security (Degefa, 2005). This argument is proved by many studies in Ethiopia that showed that cultivated land size influences household food insecurity negatively and statistically significantly (Shiferaw, 2003; Bogale and Shimelis, 2009), in Nigeria (Omotesho et al., 2006) and in Ghana (Aidoo et al., 2013). Our study also

288 Afr. J. Food Sci. revealed a negative effect of household food insecurity in line with the general literature, but it was statistically insignificant (P>0.10). This relationship shows that the mean size of cultivated land size possessed by food insecure and food secure households was almost the same. Livestock possession Size of livestock possessed by households was insignificant at P<0.10 level in influencing food insecurity. In fact, its effect should not be underestimated as it had 70% probability of influencing food insecurity (p<0.297). The odds ratio in favor of being food insecure increased by a factor of 1.169 with a decrease in livestock size by 1 TLU. However, contrary to our expectation and the general literature (Bogale and Shimelis 2009; Messay 2009), this factor was positively related with food insecurity (B=0.157). The possible explanation for this is that livestock possession was reported by food insecure households and the type of livestock possessed was mostly chicken and small ruminants, which were generally owned by the poor and food insecure households. The better-offs and food secure households, on the other hand, rather possessed oxen. That is why the likelihood of being food insecure for households who had more TUL is was more than those who had less or no TLU. Aggregate production This variable is oriented towards the availability component of food security and is the main determinant of household food security/insecurity in rural areas of developing countries (Khan and Gill, 2009). In line with theory and as we expected earlier, the probability of being food insecure was negatively related with (B=-0.112), and significantly affected (p<0.01) by, aggregate production. The odds ratio in favor of being food insecure was increased by a factor of 0.894 with an increase in aggregate production by 1 kg. This is similar with many previous study in developing countries including Ethiopia which showed that per capita aggregate production had negative and statistically significant influence on household‟s probability of being food security (Shiferaw et al., 2003; Haile et al., 2005). The possible explanation is that households who produced more aggregate production were less likely to be food insecure than those who produced less. Oxen possession While the general theory shows that oxen possession is directly related with wealth and food security of
households, some argue that it is only one indicator of wealth (Degefa, 2005). The influence of oxen possession of food insecurity was negative (B = -0.402) but statistically insignificant (P>0.10). However, close observation of the probability value (that is, p = 0.116) shows that this variable had almost significant effect on food insecurity at almost 10% level. The odds ratio in favor of the probability of being food insecure decreased by a factor of 0.669 with an increase in one additional ox. This is similar with some studies that showed positive but significant relationship (Haile et al., 2005: Messay, 2009) although our finding shows insignificant result between oxen possession and food insecurity. The likely explanation of this result is clear that households that has one or more oxen can cultivate more food crops and are less likely to be food insecure that households having less or no an ox. Education In theory, education and household food security have direct linkages because, mainly in subsistence farming, literate farm household heads are better than their illiterate counterparts in several ways although the role of indigenous knowledge in realizing food security should not be underestimated (Degefa, 2005). Our finding is in line with this theory because it showed that education of household head influenced household food insecurity negatively (B=-0.226) and significantly (p<0.01). The odds ratio in favor of the probability of being food insecure decreased by a factor of 0.797 with one year increase in at school. This indicates that households headed by relatively better educated were less likely to be food insecure than those headed by less educated or illiterate ones. This goes in line with some previous studies in Ethiopia and Pakistan which showed statistically significant and positive relationship between level of household head education and the probability of being food secure (Haile et al., 2005; Bashir et al., 2012). The possible justification is that better educated household heads had better knowledge and skills that enabled them diversify their livelihoods, improve crop productivity, access means of generating income, and easily forecast possible occurrence of food shortages so that they could plan to tackle it. Off-farm income The effect of off-farm income on food insecurity was statistically insignificant at p<0.10. Moreover, contrary to our prior expectation and the general literature that shows negative relationship (Omotesho et al., 2006; Bogale and Shimelis, 2009), it was positively related with household food insecurity (B=0.005). The odds ratio in favor of being food insecure was increased by a factor of
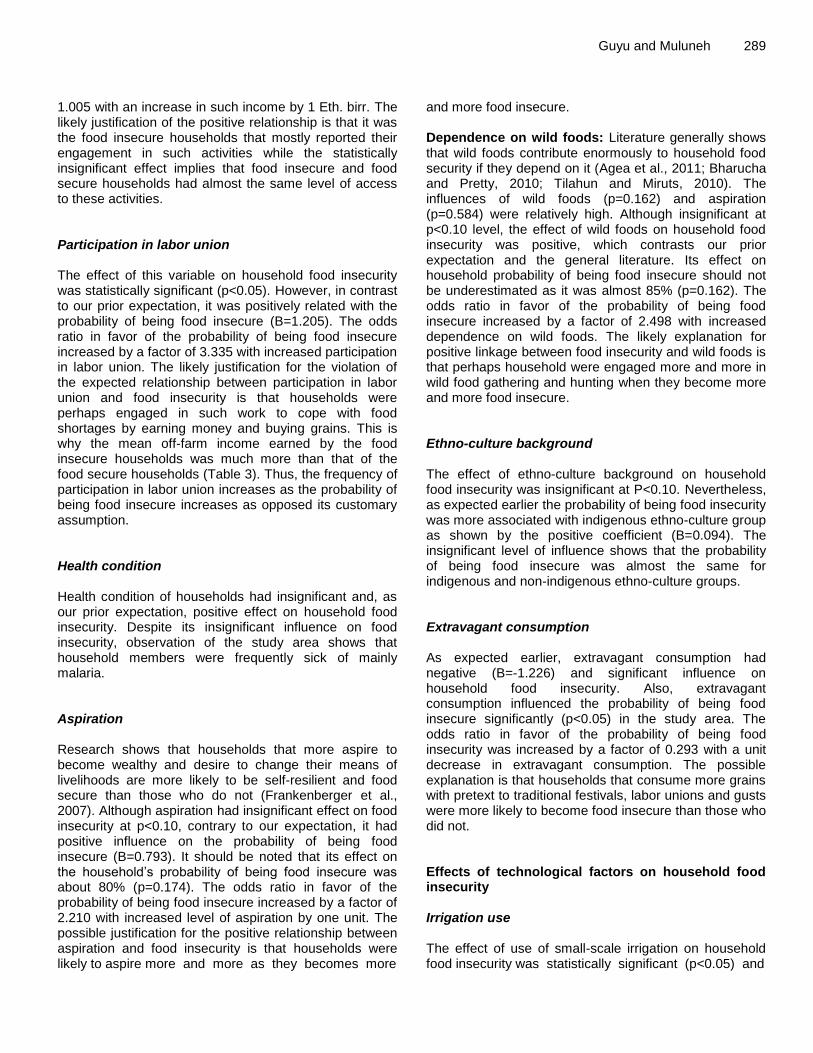
1.005 with an increase in such income by 1 Eth. birr. The likely justification of the positive relationship is that it was the food insecure households that mostly reported their engagement in such activities while the statistically insignificant effect implies that food insecure and food secure households had almost the same level of access to these activities. Participation in labor union The effect of this variable on household food insecurity was statistically significant (p<0.05). However, in contrast to our prior expectation, it was positively related with the probability of being food insecure (B=1.205). The odds ratio in favor of the probability of being food insecure increased by a factor of 3.335 with increased participation in labor union. The likely justification for the violation of the expected relationship between participation in labor union and food insecurity is that households were perhaps engaged in such work to cope with food shortages by earning money and buying grains. This is why the mean off-farm income earned by the food insecure households was much more than that of the food secure households (Table 3). Thus, the frequency of participation in labor union increases as the probability of being food insecure increases as opposed its customary assumption. Health condition Health condition of households had insignificant and, as our prior expectation, positive effect on household food insecurity. Despite its insignificant influence on food insecurity, observation of the study area shows that household members were frequently sick of mainly malaria. Aspiration Research shows that households that more aspire to become wealthy and desire to change their means of livelihoods are more likely to be self-resilient and food secure than those who do not (Frankenberger et al., 2007). Although aspiration had insignificant effect on food insecurity at p<0.10, contrary to our expectation, it had positive influence on the probability of being food insecure (B=0.793). It should be noted that its effect on the household‟s probability of being food insecure was about 80% (p=0.174). The odds ratio in favor of the probability of being food insecure increased by a factor of 2.210 with increased level of aspiration by one unit. The possible justification for the positive relationship between aspiration and food insecurity is that households were likely to aspire more and more as they becomes more
Guyu and Muluneh 289 and more food insecure. Dependence on wild foods: Literature generally shows that wild foods contribute enormously to household food security if they depend on it (Agea et al., 2011; Bharucha and Pretty, 2010; Tilahun and Miruts, 2010). The influences of wild foods (p=0.162) and aspiration (p=0.584) were relatively high. Although insignificant at p<0.10 level, the effect of wild foods on household food insecurity was positive, which contrasts our prior expectation and the general literature. Its effect on household probability of being food insecure should not be underestimated as it was almost 85% (p=0.162). The odds ratio in favor of the probability of being food insecure increased by a factor of 2.498 with increased dependence on wild foods. The likely explanation for positive linkage between food insecurity and wild foods is that perhaps household were engaged more and more in wild food gathering and hunting when they become more and more food insecure. Ethno-culture background The effect of ethno-culture background on household food insecurity was insignificant at P<0.10. Nevertheless, as expected earlier the probability of being food insecurity was more associated with indigenous ethno-culture group as shown by the positive coefficient (B=0.094). The insignificant level of influence shows that the probability of being food insecure was almost the same for indigenous and non-indigenous ethno-culture groups. Extravagant consumption As expected earlier, extravagant consumption had negative (B=-1.226) and significant influence on household food insecurity. Also, extravagant consumption influenced the probability of being food insecure significantly (p<0.05) in the study area. The odds ratio in favor of the probability of being food insecurity was increased by a factor of 0.293 with a unit decrease in extravagant consumption. The possible explanation is that households that consume more grains with pretext to traditional festivals, labor unions and gusts were more likely to become food insecure than those who did not. Effects of technological factors on household food insecurity Irrigation use The effect of use of small-scale irrigation on household food insecurity was statistically significant (p<0.05) and

290 Afr. J. Food Sci. negative (B=-1.795). The odds ratio in favor of the probability of being food insecure decreased by a factor of 0.166 with an increased access to and use of small-scale irrigation by a household. This goes in line with the findings of many previous studied conducted in Ethiopia and showed statistically significant and negative relationships between irrigation use and household food insecurity (Degefa, 2005; Bogale and Shimelis, 2009). The possible explanation is that although there is adequate rainfall in western Ethiopia (green famine belt), access to and use of small-scale irrigation enabled households to produce twice a year. This increased access to both income and food from crop production through irrigation especially during times of crop failures. Farming system In line with our prior expectation, the effect of farming system on household food insecurity was positive (B=1.410) and statistically significant (p<0.5). The odds ratio in favor of the probability of being food insecure increased by a factor of 4.096 with increased use of hoe-based farming system. In other words, the probability being food insecure for households who were based on hoe-culture as a farming system was 4.096 times more than those who were based on oxen-culture. The likely justification is that as hoe-based farming system is most traditional system of production, households who depended on it might not produce sufficient crop that could support their members throughout the year. In this regard, many households (mainly indigenous ones) in the study area heavily depended on hoe-based farming system.
Conclusion
This study focused on the determinants of food insecurity in the „green famine‟ belt GFB of Ethiopia. The study revealed that household size, use of small-scale irrigation, household education, participation in local labor unions, aggregate production, farming system, and extravagant consumption were found to significantly influence household food insecurity. Households with larger size, did not have access to irrigation, participated in labor union for coping with food shortages, produced more aggregate production, depended on hoe-based farming system, and extravagantly consumed available food were more likely to be food insecure than their counterparts. In contrast to the general literature, the positive linkage between food insecurity and engagement in labor unions shows households‟ engagement in such activities for earning money and coping with food shortages. Moreover, the influence of cultivated land size, wild foods, livestock in general and oxen possession in particular, and aspiration for change and wealth should
be considered as they had moderate effect on food insecurity. Thus, we conclude that factors from demographic, socioeconomic and technological ones determined the food insecurity of households in the study area. Policy interventions may therefore, focus on the most significant determinants while the moderate ones should not be overlooked. Further research interventions should focus on exploring the natural resource bases of the GFB and the trend in the precipitation level so that whether there are drought specks or not in the region. Conflict of Interests The authors have not declared any conflict of interests. REFERENCES Agea JG, KImondo JM, Okia CA (2011). Contribution of Wild Edible
Food Plants to Overall Household Diet in Bunyoro-Kitara Kingdom, Uganda. Agric. J. 6 (4):134-144.
Aidoo A, Mensah JO, Tuffour T (2013). Determinants of Household Food Security in the Sekyere-Afram Plains District of Ghana, 1
st
Annual International Interdisciplinary Conference Proceedings, , AIIC 2013, 24-26 April, 2013, Azores, Portugal. pp. 514-521.
Alemayehu Lerenso (2001) Food Security and Rural Vulnerability in Ethiopia: A Development Perspective. Ethiopian e-J. Res. Innov. Foresight 4(1):49-62.
Bashir MK, Schilizzi S and Pandit R (2012). The Determinants of Rural Household Food security: The Case of Landless Households of the Punjab, Pakistan, Working Paper 1208, School of Agricultural and Resource Economics, University of Western Australia, Crawley, Australia.
Beyene Teklu, Tegene Negesse and Ayana Angassa (2011). Effect of farming systems on livestock feed resources and feeding systems in Benishangul-Gumuz region, western Ethiopia. Int. Res. J. Agric. Sci. Soil Sci. 1(1):20-28.
Bharucha Z, Pretty J (2010) The Role and Values of Wild Foods in agricultural systems; Philosophical Transaction, R. Soc. Biol. Sci. 365:2913-2926
Bogale, A. and Shimelis, A. (2009) Household level determinants of food insecurity in rural areas of Dire Dawa, Eastern Ethiopia. Afr. J. Food Agric. Nutr. Dev. 9(9):1914-1926.
Boserup E (1965). The Conditions of Agricultural Growth: The Economics of Agrarian Change Under Population Pressure: Earthscan Publication Ltd, London.
Canali, Slaviero (2010). Food Insecurity and Risk Management of Smallholder Farming Systems in Ethiopia; European IFSA Symposium, Veinna, Austria.
Debela Hunde, Njoka JT, Zemede Asfaw, and Nyangito MM (2011). Seasonal availability and consumption of wild edible plants in semiarid Ethiopia: Implications to food security and climate change adaptation. J. Hortic. Forest. 3(5):138-149.
Degefa Tolossa (2005). Rural livelihoods, poverty and food insecurity in Ethiopia, A case study at Erenssa and Garbi communities in Oromiya Zone, Amhara National Regional State, PhD Thesis series 2005:106, Norwegian University of Science and Technology, NTNU, Trondheim
Devereux S (2000) Food Insecurity in Ethiopia: A Discussion Paper for DFID, IDS, Sussex.
FAO (2001). Farming Systems and Poverty: Improving Farmers‟ Livelihoods in a Changing world. Food and Agricultural Organization and World Bank, Washington DC.
FAO (2010). The Status of Food Insecurity in the World: Addressing Food Insecurity in a Protracted Crises. Food and Agricultural Organization of the United Nations, Rome.
Frankenberger TR, Sutter P, Amdissa T, Alemtsehay A, Mulugeta T, Moges T, Alemayehu S, Bernard T, Spangler T, Teshewamebrat E

(2007). Ethiopia: The Path to Self-resiliencey. Volume I: Final Report. CHF – Partners in Rural Development on behalf of the Canadian Network of NGOs in Ethiopia (CANGO), July 2007.
Gross R, Schoenebrger H, Pfeifer H, Preuss HA (2000). The Four Dimensions of Food and Nutrition Security: Definitions and Concepts; FAO-Nutrition and Food Security.
Guyu Ferede (2012) Voluntary Villagization Scheme (VVS) for Transforming Semi-pastoral Communities in Benishangul-Gumuz Region, Northwestern Ethiopia: Challenges and Local Development Indicators. J. Sustain. Dev Afr. 14 (5):162-196.
Guyu Ferede (2014) Ethno-culture Disparity in Food Insecurity Status: The Case of Bullen District, Benishangul-gumuz Regional State, Ethiopia, Afri. J. Food Sci. 8(2):54-63.
Guyu Ferede, Muluneh Wold-tsadik (2015). Household Resilience to Seasonal Food Insecurity: Dimensions and Magnitudes in the “Green Famine” Belt of Ethiopia. Appl. Sci. Rep. 11(3):125-143.
Guyu Ferede D (2015). Household Vulnerability to Green Famine: Component Based Analysis of Indicators in Belo-jiganfoy District (Case Study Area), Benishangul-Gumuz Region, Ethiopia. Appl. Sci. Rep. 9(3):139-156.
Haile HK, Alemu ZG, Kudhlande G (2005). Caused of Household Food Insecurity in Koredegaga Peasant Assocition, Oromiya, Ethiopia. Working Paper. Faculty of Natural and Agricultural Sciences, Department of Agricultural Economics, University of the Free State, South Africa.
IMF (2014) The Federal Democratic republic of Ethiopia. Selected issues. International Monetary Fund, Washington DC.
Khan RE, Gill AR (2009). Determinants of Food Security in Rural Areas of Pakistan. The paper was presented in National Conference on Socio-Economic Stability in Pakistan. February 16-17, 2009 at Sarhad University of Science and Technology Peshawer, Pakistan.
Guyu and Muluneh 291 Malthus TR (1798). An essay on the principle of population. Wrigley and
David Souden (eds.) The Works of Thomas Robert Malthus. Volume 1.
Messay Mulugeta (2009b). Causes of Rural Household Food Insecurity: A Case from Kuyu District, Central Ethiopia. J. Sustain. Dev. Afr. 11(4):286-304.
Messay Mulugeta (2013) Resettlement and Food Security Nexus in Ethiopia: A Case Study from Nonno District. PhD Dissertation Published by LAMBERT Academic Publishers, Germany.
Mulugeta Lolamo (2014) Green Famine in Ethiopia: Understanding the Causes of Increasing food Insecurity in the Southern Ethiopia Highlands, PhD Dissertation, University of Susex,
Omotesho OA, Adewumi MO, Muhammad-Lawal A, Ayinde OE. (2006) Determinants of Food Security among the Rural Farming Households I Kwara State, Nigeria. Afr. J. Gen. Agric. 2(1):7-15.
Sodjinou E, Glin LC, Nicolay G, Tovignan S, Hinvi J (2015). Socioeconomic Determinants of Organic Cotton Adoption in Benin, West Africa. Agric. Food Econ. 3(1):1.
Tilahun Teklehaymanot, Mirutse Gidey (2010) Ethnobotanical study of Wild Edible Plants of Kara and Kwego Semi-pastoralist People in Lower Omo river Valley, Debub Omo Zone, SNNP, Ethiopia. J. Ethnobiol. Ethnomed. 6(1):1.
USAID (2004) Breaking the Cycle of Food Crisis: Famine Prevention in Ethiopia, United States Agency for International Development. The Mitchel Group, Inc. (TMC).

Vol. 10(11) pp. 292-296, November 2016
DOI: 10.5897/AJFS2016.1440
Article Number: B10320C60701
ISSN 1996-0794
Copyright © 2016
Author(s) retain the copyright of this article
http://www.academicjournals.org/AJFS
African Journal of Food Science
Full Length Research Paper
Quantification of inositols in Jatropha curcas L. of different provenances from Mexico
Jorge Martinez Herrera1*, Elizabeth Arguello García2, Cristian Jimenez Martinez3, Gloria Davila Ortiz3, Mercedez Muzquiz4, Mercedez Martin Pedrosa4 and Alejandro Varela Sandin4
. 1Instituto Nacional de Investigaciones Forestales Agrícolas Y Pecuarias. Km 1, Carretera Huimanguillo-Cardenas,
Huimanguillo, Tabasco, ZIP 86400 México. 2Departamento de Ingeniería Química Petrolera Cárdenas, Universidad Popular de la Chontalpa, Tabasco, México.
3Escuela Nacional de Ciencias Biologicas-Instituto Politecnico Nacional.Unidad Profesional Adolfo Lopez Mateos. Av
Wilfrido Massieu Esq.Cda Miguel Stampa S/N.ZIP 07738.Del.Gustsvo A.Madero Ciudad de Mexico 4SGIT-INIA, Spain.
Received 21 March 2016, Accepted 4 August, 2016.
The plant, jatropha has attracted worldwide attention for its high oil content. The use of high performance liquid chromatography (HPLC) to separate and quantify, for the first time, the phytic acid (inositol hexaphosphate) and lower inositol phosphates (tri-, tetra- and penta-phosphates; IP6, IP5, IP4
and IP3) in toxic and non-toxic (NT) Jatropha curcas seeds from different locations in Mexico was proposed. There are reports on the total phytic acids but the method of precipitation used was not specific to distinguish between the phytic acid (IP6) and its hydrolysis products; therefore, this technique underestimates the IP6 content. It was observed that the total inositol concentration is independent on the presence or absence of phorbolesters (PE). The analysis showed that the toxic seeds from Villaflores and Chiapa de Corzo had high concentrations of total IP (46.2 and 42.5 mg/g, respectively) but the NT seeds from Huitzilan is the highest (56.88 mg/g) followed by Pueblillo (41.427 mg/g), Cuautla (37.832 mg/g) and Xochitlan (35.868 mg/g) showed higher values of IP. Finally, the toxic seeds from Coatzacoalcos (22.5 mg/g) showed lower value. This is the first work showing the different inositol phosphates present in jatropha seed samples, highlighting the presence of hexaphosphate acid as the major component. Key words: Phytic acid, high performance liquid chromatography (HPLC), anti-nutrients, phytates, IP5, IP6, hexaphosphate.
INTRODUCTION The Jatropha curcas L. is a plant which belongs to the family, Euphorbiaceae; it is native to Mexico and Central
America, but also cultivated throughout Central America, Africa and Asia (Francis et al., 2005). In Mexico, this
*Corresponding author. E-mail: [email protected]. Tel: (+52) 018000882222. Ext 87501.
Author(s) agree that this article remains permanently open access under the terms of the Creative Commons Attribution
License 4.0 International License
plant is extensively found in several states such as Hidalgo, Morelos, Puebla, Sinaloa, Sonora, Veracruz, Tamaulipas, Michoacán, Chiapas, Oaxaca, Guerrero, San Luis Potosí, Jalisco, Nayarit, Sonora, Yucatan and Quintana Roo (Martínez et al., 2010). The non-toxic varieties have been reported in the states of Veracruz, Puebla and Hidalgo mainly in the region called Totonacapan while toxic varieties exist in Chiapas, Guerrero, Oaxaca and state south of Veracruz (Martínez et al., 2006, 2010). The seed has 25 to 30% of protein and 52 to 60% of oil (Martínez et al., 2006, 2010). The authors reported an excellent protein and lipids content, as well as the amino acid and fatty acid profiles in the seeds from Veracruz and Morelos. In one of them, phorbol esters were identified, which characterizes mainly the toxic variety; moreover, a high content of trypsin inhibitors, lectins and phytates were found.
Some important physiological roles for phytate in plants are: (1) phosphate reserve; (2) energy store; (3) a competitor for ATP during its biosynthesis near maturity, when metabolism is inhibited and dormancy is induced; (4) an immobiliser of divalent cations needed for the control of cellular processes and released after germination; and (5) a regulator of inorganic phosphate (Pi) in seeds (Cosgrove and Irving, 1980).
Phytate removal is desirable because it forms complexes with minerals and dietary proteins which decrease their bioavailability. Due to the heat stability of phytates, they are not easily removed by cooking, autoclaving, roasting, or any of the conventional heat processing methods (Zhou and Erdman, 1995). The solubility of phytates in aqueous solvents can be used to reduce or eliminate them from food when it would be convenient. The uses of acid hydrolysis as well as the ability of endogenous and/or added enzymes to affect phytate hydrolysis are additional techniques to reduce or eliminate phytates from food. The election of a method for phytate reduction is largely dependent on the type of food and the final product formed (La Frano et al., 2014). Phytates can chelate minerals such as calcium, zinc and iron, resulting in insoluble complexes. Certain minerals such as iron and copper catalyze oxidative enzymes that generate free radicals, resulting in undesirable oxidative damage such as cell membrane damage (La Frano et al., 2014). The ability of phytates to chelate the divalent minerals makes them a natural antioxidant. For this reason, the phytate reduction or the elimination of it from food may not always be desirable. The role of the phytic acid in health and disease has been recently reviewed (Zhou and Erdman, 1995).
The level of phytates (7 to 11%) in J. curcas is relatively high when compared with other sources (Lott et al., 2002). The method of precipitation used was not specific to distinguish between the phytic acid (IP6) and its hydrolysis products; therefore, this technique underestimates the IP6 content in food. For this reason, the use of high performance liquid chromatography
Herrera et al. 293 (HPLC) is proposed in the present work as a reproducible technique to quantify for the first time IP6, IP5, IP4 and IP3 contents in the different J. curcas seeds. MATERIALS AND METHODS Sample materials The seeds were collected in 1: Yautepec; 2: Cuautla, Morelos; 3: Coatzacoalcos; 4: Pueblillo, Veracruz; 5: Huitzilan; 6: Xochitlan, Puebla; 7: Chiapa de Corzo; 8: Villaflores, Chiapas, in July, 2014. The edaphoclimatic conditions of the different regions in Mexico, from where the J. curcas seeds were collected, are as follows: (1) Yautepec, (Aw° semi-hot, sub-humid climate with rains in summer), localization LN 18°49´45” N, LO 99°05´35”, 1210 m altitude, 902 mm annual rainfall; soil, 902 mm average annual rainfall, 22.7°C average temperature, soil type: calcaric phaeozem + pellic vertisol; (2) Cuautla, (Awº = semihot, sub-humid climate with rains in summer), localization LN 18°50´22”, LO 98°56´56”; 1300 m altitude, 856 mm average annual rainfall, 22.6°C average temperature, soil type: calcaric phaeozem + pellic vertisol; (3) Coatzacoalcos, (Am = hot humid climate with abundant rains in summer), LN 18°08´06”, LO 94°28´10”, 10 m altitude, 2500 mm average annual rainfall, 25.6 average temperature, soil cambisol; (4) Pueblillo, (hot sub-humid region with rains in summer), LN 20°15´20”, LO 97°15´20”, 80 m altitude, 1500 mm annual rainfall; soil type: calcaric regosol; (5) Huitzilan, (Acf= semi-hot humid climate with rains all year), LN 19°58´10”, LO 97°41´30”, 900 m altitude, 2021 mm annual rainfall; 18.0 average temperature, soil luvisol; (6) Xochitlán, (Acf= semi-hot humid climate with rains all year), LN 18°42´91”, LO 97°46´22”, 1040 m altitude, 1400 mm annual rainfall; 24.0 average temperature, soil pellic vertisol; (7) Chiapa de Corzo, (A(w) hot sub-humid region with rains in summer), LN 16°44´26”, LO 93°01´50”, 450 m altitude, 990 mm annual rainfall; 26.0°C average temperature, soil regosol; (8) Villaflores, (A(wl) = hot sub-humid region with rains in summer), LN 15°45´26”, LO 92°16´13”, 560 m altitude, 1209 mm annual rainfall; 24.3°C average temperature, soil regosol. Sample preparation The individual inositol phosphates were extracted according to Burbano et al. (1995) with some modifications and determined according to the method of Lehrfeld (1994). A sample (0.5 g) was extracted with 5 mL of 0.5 M HCl by homogenization for 1 min at room temperature using an Ultraturrax homogenizer. The extract (2.5 mL) was diluted with 25 mL of water and placed into a SAX column (Varian). The column was washed with 2 mL of water, and then the inositol phosphates were eluted with 2 mL of 2 M of HCl. The eluted product was evaporated until dry and the residue was dissolved in 0.5 mL of a vacuum filtered buffer solution prepared by adding 1.6 mL of tetrabutylammonium hidroxide (TBNOH, 40% w/w solution in water), 0.2 mL of 5 M sulfuric acid and 0.1 mL of formic acid (ACS reagent, 91%) into 100 mL of methanol-water solution (51.5%). The solution was centrifuged at 12100 xg for 6 min to remove any suspended material before injecting it into the HPLC. Analytical methods The HPLC analysis was performed using a Beckman System Gold equipped with a refractive index detector. 10 µL were injected into a Hamilton macro-porous polymer PRP-1 (150x4.1 mm, 5 µm) which was used at 45°C with a rate of 1.2 mL/min. A reverse phase Cl8 column (Spherisorb ODS 5 pm, 250 X 4~6 mm) heated to 45°C was

294 Afr. J. Food Sci.
Figure 1. Characteristic peaks of inositol phosphates found in Jatropha seeds.
equilibrated with the mobile phase for 1 h. The mobile phase consisted of 515 mL of methanol added in 485 mL water. Afterwards, 8 mL of TBNOH, 1 mL of 5 M sulphuric acid, 0.5 mL of formic acid (91%) and 0.2 mL of phytic acid solution (6 mg/mL) were sequentially added. The pH registered was 4.1. The individual inositol phosphates were quantified by comparison with the external standards of phytic acid (Sigma). Chromatographic analysis was carried out three times on each sample. Statistical analysis Data were processed with Statistical Analysis System software (version 9.2.; SAS Institute Inc., Cary, NC, USA), under the completely randomized model, and the means were compared with the Tukey test (p = 0.05).
RESULTS Quantification of phytates in seeds There is scarce information on the phytates composition of J. curcas L. seeds from different provenances of Mexico. Figure 1 shows the characteristic peaks of inositol phosphates found in each seed sample. The retention time (minutes) detected was 6.34 for IP6, 4.48 for IP5, 3.19 for IP4 and 2.61 for IP3. As shown in Figure 1, IP6 is clearly the major component in all samples analyzed. Table 1 shows the values obtained for inositol phosphate content in each sample.
Moreover, it was observed that the inositol
concentration is independent of the presence or absence of phorbolesters (PE). The analysis showed that the toxic seeds from Villaflores and Chiapa de Corzo had high concentrations of IP (46.5 and 42.5 mg/g, respectively) and the non-toxic seeds from Pueblillo, Huitzilan and Cuautla showed higher values of IP (41.4, 56.8 and 37.8 mg/g, respectively). Finally, the toxic seeds from Coatzacoalcos (22.4 mg/g) and the non-toxic ones from Xochitlan (35.8 mg/g) and Yautepec (30.5 mg/g) showed lower values of IP. Table 1 shows the phorbol ester content previously reported by Martínez et al. (2006, 2010).
The concentration of total IP in Huitzilan seeds (non-toxic) found by HPLC is greater than that found by the method of precipitation of 9.2% (Martínez et al., 2010), similar results were observed in others seeds (Table 1).
DISCUSSION
The total content of phytates present in the raw seed of J. curcas were relatively high. These values differed greatly from those reported by Makkar et al. (1997) and Martinez et al. (2006, 2010) by using precipitation methods. The methodology used in the present work allowed the quantification of the individual inositol phosphates, which gave higher precision.
The seeds which reported a relatively high inositol phosphate content (IP) were from: Huitzilan, Puebla (Pue), Villaflores, Chiapas (Ch) and Chiapa de Corzo,

Herrera et al. 295 Table 1. Inositols content in J. curcas seeds from different provenances of Mexico.
Content (mg/g) IP3 IP4 IP5 IP6 IP total IP6 total
(%)
**Phytic acid
total (%)
**Phorbol esters
(mg/g)
Yautepec, Morelos 0.598a± 0.06 4.312a± 0.13 25.659a± 0.60 30.569 ± 0.58a 83.93 9.27 ND
Cuautla, Morelos 0.414b± 0.04 3.820b± 0.07 33.599b± 0.60 37.832 ± 0.60b 88.81 8.76 ND
Pueblillo, Veracruz 0.708c± 0.06 5.654c± 0.11 35.066b± 0.68 41.427 ± 0.62c 84.64 8.54 ND
Coatzacoalcos, Veracruz 0.411b± 0.04 3.815b± 0.42 18.270c± 0.74 22.496 ± 0.99d 81.12 8.55 3.85
Huitzilan, Puebla 0.191 ± 0.020 0.833d± 0.04 5.871c± 0.19 50.040d± 0.86 56.886 ± 0.94e 87.96 9.2 ND
Xochitlán, Puebla 0.552a± 0.02 4.577a± 0.31 30.739b± 0.97 35.868 ± 0.89b 85.7 7.8 ND
Villaflores, Chiapas 0.706c± 0.04 6.690d± 0.14 38.858e± 0.52 46.254 ± 0.66f 84.01 7.7 0.60
Chiapa de Corzo, Chiapas 0.577a± 0.04 6.749d± 0.18 35.239b± 0.31 42.565 ± 0.52c 82.78 7.3 4.05
*Three replicate of each sample and analyzed in triplicate with HPLC (mean values with their standard deviations expressed on a dry weight basis). Means with the same letter in each column are not statistically different (Tukey, p ≤ 0.05); ** Martínez et al. (2006, 2010). Ch. Only the seed from Huitzilan showed the IP3 (triphosphate inositol). The IP concentrations found in the J. curcas seeds from Mexico were higher when compared with other sources such as cereals (0.3-6%), legumes (0.5-8.0%), oilseeds (0.11-7%) and freshly fruits (0.1-2%) (Lott et al., 2002). It is important to mention that IP6 is found in higher percentage than IP5, IP4 and IP3; values between 81.12 and 88.81% of total phytate in seeds of Jatropha were quantified.
Recent studies on toxic and nontoxic Jatropha seed, have shown that phytate concentration is highest in the endosperm at 78.1 g kg
−1, constituting 96.5% of the total
phytate present in the whole kernel, whereas the cotyledon, hypocotyl and kernel coat contained 1.7, 0.27 and 0.84 g kg
−1, accounting for 2.1, 0.33 and 1.04% of
the total phytate respectively, suggesting that the major supply of phosphate during germination for metabolic activities is contributed by phytate present in the endosperm (Devappa et al., 2011).
The high phytate content found in protein concentrate prepared from jatropha seed cake indicates that phytate is strongly bound to protein in jatropha kernel and also has high affinity towards protein at low or high pH (Makkar et al., 2008). The calculated value of phytate for defatted jatropha kernel meal (89 g kg
−1) was within the
range (72–101 g kg−1
) reported for various toxic and non-toxic varieties of J. curcas, but about 5.9 times higher than that for defatted soy (15 g kg
−1) (Makkar et al.,
1998). High levels of antinutritional agents such oxalates, phytates and cyanates were more in the leaf than stem bark and root. Phytates were high in leafs (6.12%) but low in the stem bark (1.0%) and root (0.89%) (Agbor et al., 2015). The variation in the concentrations of inositol could be caused by different factors such as environmental fluctuations, culture site, irrigation conditions, type of soil, use of fertilizers and the year of crop.
Bassiri and Nahapetian (1977) observed that wheat varieties grown under dry land conditions had lower
concentrations of phytate when compared with the ones grown under irrigated conditions. Also, the application of different fertilizers (nitrogen and phosphorus) had an effect on the crops during their growth; fertilizers are reported to increase phytate content in the seeds (Miller et al., 1980; Saastamoinen and Heinonen, 1985).
The J. curcas seeds studied were collected in wild areas, some of them were found close to some crops in the localities of Huitzilan, Pueblillo, Villaflores and Chiapa de Corzo; probably, they were influenced by the fertilizers or were irrigated during the culture period, these factors could have produced the presence of higher concentrations of IP in the seeds. In contrast, the seeds from the last four J. curcas plants (from Yautepec, Cuautla, Xochitlan and Coatzacoalcos) did not present high IP values.
Although, many chemical and physical methods have been reported to remove phytate from the meal, enzymatic (phytase) treatment could be beneficial owing to its high specific activity towards phytate. Phytase treatment could improve the nutritional value of jatropha meal as a feed for monogastrics and would also reduce phosphorus inclusion in their diets (Devappa et al., 2010), whereas ruminants are considered to utilise phytate through the action of phytase enzymes produced by ruminal microbes. The presence of phytate in the kernel coat is also found to inhibit aflatoxin B1 production by Aspergillus flavus, thus helping in postharvest storage of dry seeds (Chen et al., 1995). Conclusion The use of HPLC as a method to quantify the inositol phosphate is better in terms of precision than the spectrometric method. The use of non-toxic seeds of J. curcas can be proposed for human and animal nutrition; however, it will be necessary to reduce the IP content, maybe by the use of phytase enzyme, therefore, more

296 Afr. J. Food Sci. studies are necessary in order to understand better the human and animal physiology, considering an appropriate phytate concentration which can have a possible beneficial effect. In future studies, we will assess whether fertilization doses, soil type and environmental conditions affect the inositol phosphate concentration in Jatropha seeds from commercial plantations where agronomic crop management is carried. Conflict of Interests The authors have not declared any conflict of interests. ACKNOWLEDGEMENTS Dr. Elias Martínez Hernández, University of Oxford, UK and Cristina Rosello Sánchez of the University Juárez Autónoma de Tabasco are appreciated for help in the revision of this manuscript. REFERENCES Agbor AA, Akpana AM, Dasofunjo K, James AW (2015). The biomedical
significance of the phytochemical, proximate and mineral compositions of the leaf, stem bark and root of Jatropha curcas. Asian Pacific J. Trop. Biomed. 5(8):650-657.
Bassiri A, Nahapetian A (1977). Differences in concentrations and interrelationships of phytate, phosphorus, magnesium, calcium, zinc, and iron in wheat varieties grown under dry land and irrigated conditions. J. Agric Food Chem. 25(5):1118-1122.
Burbano C, Múzquiz M, Osagie A, Ayet G, Cuadrado C (1995). Determination of phytate and lower inositol phosphates in Spanish legumes by HPLC methodology. Food Chem. 52: 321-325.
Chen D, Ling X, Rong Y (1995). Phytic acid inhibits the production of aflatoxin B1. J. Food Process Preserv. 19:27-32.
Cosgrove DJ, Irving GCJ (1980). Inositol Phosphates: Their Chemistry, Biochemistry and Physiology. Elsevier/North Holland, New York, NY.
Devappa RK, Makkar HPS and Becker K (2010). Nutritional, biochemical, and pharmaceutical potential of proteins and peptides from Jatropha: Review. J. Agric. Food Chem. 58:6543-6555.
Devappa RK, Makkar HPS and Becker K (2011). Localisation of antinutrients and qualitative identification of toxic components in Jatropha curcas seed. J. Sci. Agric. 92:1519-1525.
Francis G, Edinger R, Becker K. (2015). A concept for simultaneous wasteland reclamation, fuel production, and socio-economic development in degraded areas in India: Need, potential and perspectives of Jatropha plantations. Nat. Resour. Forum 29(1):12-24.
La Frano MR, de Moura FF, Boy E, Lonnerdal B, Burri BJ (2014).
Bioavailability of iron, zinc, and provitamin A carotenoids in biofortified staple crops. Nutr. Rev. 72(5):289-307.
Lehrfeld J. (1994). HPLC Separation and quantification of phytic acid and some inositol phosphates in food: Problems and solutions. J. Agric. Food Chem. 42(12):2726-2731.
Lott JNA, Ockenden I, Raboy V, Batten GD (2002). A global estimate of phytic acid and phosphorus in crop grains, seeds, and fruits. In Food phytates (N.R., Reddy, and S. K., Sathe). CRC press New York. pp. 7-24.
Makkar HPS, Becker K, Schmook B (1998). Edible provenances of Jatropha curcas from Quintana Roo state of México and effect of roasting on antinutrient and toxic factors in seeds. Plant Food Human Nutr. 52(1):31-36.
Makkar HPS, Becker K, Sporer F, Wink M (1997). Studies o nutritive potential and toxic constituents of different provenances of Jatropha curcas. J Agric. Food Chem. 45(8):3152-3157.
Makkar HPS, Francis G, Becker K (2008). Protein concentrate from Jatropha curcas screw-pressed seed cake and toxic and antinutritional factors in protein concentrate. J. Sci. Food Agric. 88:1542-1548.
Martínez-Herrera J, Martínez Ayala AL, Makkar H, Francis G, Becker K (2010). Agroclimatic conditions, chemical and nutritional characterization of different provenances of Jatropha Curcas L. from Mexico. Eur. J. Sci. Res. 39(3):396-407.
Martínez-Herrera J, Siddhuraju P, Francis G, Dávila OG, Becker K (2006). Chemical composition, toxic/antimetabolic constituents, and effects of different treatments on their levels in four provenances of Jatropha curcas L. from Mexico. Food Chem. 96:80-89.
Miller GA, Youngs VL, Oplinger ES (1980). Environmental and cultivar effects on oat phytic acid concentration. Cereal Chem. 57:189-191.
Saastamoinen M, Heinonen T (1985). Phytic acid content of some oat varieties and its correlation with chemical and agronomical characters. Annal Agric. Fenn. 24:103-105.
Zhou JR, Erdman JW (1995). Phytic acid in health and disease. Crit. Rev. Food Sci. Nutr. 35(6):495-508.

Vol. 10(11) pp. 297-301, November 2016
DOI: 10.5897/AJFS2016.1468
Article Number: 777265860703
ISSN 1996-0794
Copyright © 2016
Author(s) retain the copyright of this article
http://www.academicjournals.org/AJFS
African Journal of Food Science
Full Length Research Paper
Vitamin A losses in a commercial food supply chain of fortified vegetable cooking oil and maize flour: A case
from Malawi
Ulemu K. Chimimba*, Ishmael B. M. Kosamu and Lawrence Muhamba
Department of Physics and Biochemical Sciences, The Polytechnic, University of Malawi, Private Bag 303, Blantyre 3, Malawi.
Received 23 May, 2016; Accepted 28 June, 2016
Vitamin A levels were analyzed in fortified vegetable cooking oil and maize flour through a commercial food supply chain, from the production line to selected retail outlets using standard procedures over different times of exposure to sunlight. Samples from the production line acted as controls. In all the cases, vitamin A levels decreased at various stages of the supply chain with the least retention in products sold by street vendors. Statistical analysis showed significant losses (p<0.05) in vitamin A after the samples were exposed to sunlight. These results indicate that although food fortification is crucial in making micronutrients available to poor households, especially in developing countries like Malawi, there is need to sensitize retailers on proper handling and storage of these products to minimize losses in the supply chain. Key words: Fortification, vitamin A, supply chain, sunlight, vegetable cooking oil, maize flour.
INTRODUCTION Food fortification has recently been highlighted as one way of ensuring the supply of micronutrients to most of the population in the developing world (Heikens, 2007). For example, there have been mass fortification programmes in Zambia, Central America and Egypt (WHO, 2009) with the aim of decreasing micronutrient deficiencies among poor communities, especially children of 6-59 months and lactating women within 8 weeks of child birth (GoM, 2009). A national micronutrient survey conducted in Malawi in 2001 found that 60% of children
under the age of five, 57% of women of child bearing age, and 38% of school children were suffering from sub-clinical vitamin A deficiency (VAD) (GoM, 2009). Such high levels of micronutrient malnutrition have been linked to ailments which include low immunity, impaired physical, mental and psychomotor development and severe cases, night blindness. Such effects may affect child’s mental development and in the long term national economic development may suffer. Vitamin A deficiency has been reported to cause childhood blindness to
*Corresponding author. E-mail: [email protected]. Tel: +265-1-870-411. Fax: +265-1-870-578.
Author(s) agree that this article remains permanently open access under the terms of the Creative Commons Attribution
License 4.0 International License

298 Afr. J. Food Sci. estimated 140 million children worldwide (Combs, 2012). Severe vitamin A deficiency has also been reported in several sub-Saharan countries including Nigeria, Egypt, South Africa, Kenya, Namibia and Tanzania (Klemm et al., 2010). In South Africa, a country with a relatively good economic standing in Africa, it was recently found that 49% of preschool aged children and up to 68% among women of reproductive age had VAD (Mostert et al., 2005). These data are worrisome and certainly suggest an urgent need for interventions.
Despite the severe consequences that result from vitamin A deficiency, the good news is that a diverse diet, which includes foods of animal origin that are rich in preformed vitamin A (esters of retinol), might be sufficient to satisfy the daily requirements of vitamin A. However, in most developing countries, diets are monotonous (Ruel, 2001) and mainly based on cereals and legumes that are poor sources of vitamin A (West et al., 2002; WHO, 1998). Vitamin A is virtually absent in whole-grain cereals and flours. Because vitamin A deficiency results mainly from chronic dietary insufficiency, food fortification has been identified as an effective approach to abate the problem (Klemm et al., 2010). For example, it is possible to fortify flour from cereal grains using a powdered form of vitamin A, retinyl palmitate which has been found to be more stable than retinyl acetate (Combs, 2012). The fortification of vitamin A, which is fat soluble, in cooking oil is even much simpler and cheaper and can be done either with retinyl acetate or retinyl palmitate in oil base (Johnson, 1997).
In a drive to promote the reduction in micronutrient deficiency, the government of Malawi has been advocating for micronutrient supplementation of foods. In addition to iron and iodine, one of the target micronutrient for this exercise is vitamin A and the food vehicles chosen are sugar, vegetable cooking oil and maize flour (Yeudall et al., 2005). Fortifying a widely consumed food product or additive makes it easy to deliver low doses of vitamin A daily to a large number of people (Dary and Mora, 2002). This was the rationale behind the choice of these foods that are consumed by the majority of Malawians most of who live on less than 1 US$ per day. Actually, the current Human Development Index for Malawi is 0.400 and not only ranks Malawi at 141 out of 187 countries with comparable data but also puts it below the average for sub-Saharan Africa which is at 0.463 (UNDP, 2012).
Regardless of whether the vitamin A occurs naturally or has been added to a food product through fortification or other means, the potential exists for losses by chemical or physical means. These losses may also occur due to exposure to light and heat exposure resulting into oxidation (Butt et al., 2007). Vitamin losses are to some extent inevitable in the manufacturing, distribution, storage and preparation of processed foods (SUSTAIN, 1999). Retention of vitamin A in fortified foods is important for determination of the efficacy of the
fortification programs. It is therefore important to understand the degree of loss in the supply chain so that proper strategies can be put in place to ensure that the consumer is getting the intended dosage of the micronutrient (Butt et al., 2007). The Malawi Bureau of Standards (MBS) recommends a vitamin A content range of 30 to 60 mg/L for vegetable cooking oil and 10 to 40 mg/l for maize flour (SUSTAIN, 1999).
In Malawi, however, vitamin A losses in the food supply chain have not been evaluated. This study therefore assessed the extent of vitamin A losses in a supply chain of fortified food vehicles which comprised two brands of vegetable cooking oil and maize flour.
MATERIALS AND METHODS
The study was done in Blantyre City, Malawi, targeting one major flour producing company ,and two major oil manufacturing factories in Malawi´s commercial capital. One of the oil factories produces vitamin A fortified soybean cooking oil while the other produces vitamin A fortified sunflower cooking oil.
Sample collection from production line
Triplicate samples (1 L each) of freshly produced fortified vegetable cooking oil (sunflower and soybean) were collected from the two sampling points. Triplicate (1 kg) samples of fortified maize flour were also collected from the production line of the flour company. The fortified cooking oil and fortified flour bought form the manufacturing companies acted as a control. Fresh samples from production line were analyzed immediately after sampling and the remaining portions were analyzed after exposure to sunlight at intervals of seven, fourteen and thirty five days.
Sample collection from retail markets
Sampling from the retail markets was done by gathering information on the cooking oil bottles (batch coding and manufacturing date) to determine the most recent batch for use in the study. This was done because it was difficult to trace the same batches that had been sampled from the production line to the targeted retail markets. The most recent batches of soybean cooking oil sampled from Usave supermarket were the ones that had been stored in the shop for fifteen days from the manufacturing date. Ndirande market soybean cooking oil samples were analyzed after being retained by the retailer for six days while Zingwangwa market soybean cooking oil samples were analyzed after being retained by the retailer for seven days. Recent batches for sunflower oil had been in the supermarket for thirteen days on the day of sampling and the sunflower oil from Ndirande and zingwangwa market were three and five days old on the day of sampling. Flour samples collected from Usave supermarket had been stored for ten days from the manufacturing date while Ndirande and Zingwangwa samples were five and six days old respectively on sampling day. Triplicate 1 L samples of the same brands of fortified vegetable cooking oil were bought from a supermarket (USave) and street vendors in two open markets (Ndirande and Zingwangwa) in Blantyre City. Samples of cooking oil and maize flour from the retail markets were analyzed immediately after collection. The percent loss in vitamin A was calculated using the following formula: Loss (%) = [(initial vitamin A content - new vitamin A content) / initial vitamin A content] x 100

Vitamin A analysis Vitamin A analysis in oil Analytical procedures used in vitamin A analysis of the oil samples are those from the manual for internal monitoring of oil fortified with vitamin A (East, Central and Southern African Health Community, 2007). Approximately two grams of oil was weighed into a twenty 5 ml 25 ml volumetric amber flask and mass was recorded to four decimal places. Dichloromethane was added to the flask to dissolve the oil and mixed thoroughly. The same process was repeated using unfortified (blank) oil. Absorbance reading of samples and unfortified control was read on a spectrophotometer at 325 nm. Retinyl palmitate concentration of the oil sample was estimated using the following equation:
Where Abs corrected = Abs sample – Abs unfortified oil; Vf = final volume; CF=correction factor of the spectrophotometer, ideally; a= retinyl palmitate absorption coefficient in dichloromethane (mg-1 cm-1 L) 0.094; w= weight of sample.
Vitamin A analysis in flour
Vitamin A in flour was determined using spectrophotometric method (AOAC, 2002). About 0.05-1 g of flour and thick porridge samples were weighed using analytical scale (Model: ADAM PW 124) into 50 ml conical centrifuge tube. Six milliliters of dichloromethane was added to samples. The mixture was vortex for 2 min, and then 1.0 ml of methanol was added to the mixture and vortexed for 2 min. Ten milliliters of distilled water was added to the mixture, the vortex for 1 min. The mixtures were centrifuged for 2 min to separate the two phases. The dichloromethane phase went to the bottom. Using the Pasteur pipette, the flour pellet that were formed between the two liquid phase was set aside, and then the organic phase was transferred in to 10 ml measuring cylinder. The mixture was left to stand and the remaining water was removed with a Pasteur pipette, then the volume of the extract was recorded. The volume of extract was used to calculate the concentration. The extract was used for the determination of vitamin by directly recording the absorbance at 325 nm.
Preparation of standard vitamin A solution
One hundred milliliters amber was tare on an analytical balance. Using the pipette, 75.6 mg of standard retinyl palmitate (USP) was transferred into volumetric flask. Then dichloromethane was added to the flask to dissolve the vitamin A and make up the volume. Taking into account the actual concentration of the stock solution, appropriate aliquots was pippeted into a set of 50 ml amber volumetric flasks to give a set of standard solutions. A standard plot was prepared by reading the absorbance of the standard solutions of vitamin A. To 50 ml of volumetric flask, 0.1, 0.2, 0.3, 0.4 and 0.5 ml of standard solution was pippeted, then made up to the volume. The absorbance of these solutions was read at 325 nm and a standard plot was made. The absorbance of sample extract was measured and compared against the standard plot to determine the concentration. The following formula was used to calculate vitamin A concentration in samples. The concentration of vitamin A in extract of samples, treated in a similar manner to the standard solution was calculated using slope and constant of the standard plot. Absorbance = Slope x concentration + constant
Ulemu et al. 299
Therefore Concentration of vitamin A = (Absorbance – Constant) / slope of plot Concentration of vitamin A (mg retinol/Kg Flour ) would therefore be according the following:
Data analysis The mean, standard deviation and 95% confidence intervals (CI) of the mean were calculated using SPSS version 20. Single factor analysis of variance (ANOVA) and Turkey Honest significant difference (HSD) post hoc tests were also done using SPSS. RESULTS AND DISCUSSION The Malawi Bureau of Standards recommends 30-60 mg/l (Malawi Standard 51, 1988), in vegetable cooking oil and 10-40 mg/l in maize flour. This study results generally indicated varied vitamin A losses in all samples along the supply chain and during exposure to sunlight but drastic changes were observed in maize flour which lost up to 61% after 35 days of exposure to sunlight and an average of 55% in samples from street markets (Table 1). Actually, after two weeks of exposure to sunlight, maize flour had already lost most of the vitamin A to levels below the Malawi Bureau of Standards minimum value of 10 mg/l. The vitamin A loss in maize flour could be attributed to storage conditions (left in open basins at the market) of the flour which led to direct exposure to light.
One way of analysis of variance ( ANOVA) showed that there was significant loss of vitamin A levels in fortified sunflower oil after 35 days of sunlight exposure as compared to fortified soybean oil; 40% versus 27% (p < 0.05) respectively. The results obtained in this study for vitamin A loss in fortified soybean oil are in agreement with the finding of Puysuwan et al. (2007) who noted that fortified soybeans oil in losed PET bottles exposed to sunlight for 4 weeks at room temperature reduced thr
initial vitamin A concentration by 27.1 ± 12.1% without
accounting for the oxygen exposure upon opening.The vitamin A losses in oils and maize flour from samples from street vendors (Table 2) could be attributed to prolonged exposure to sunlight and also the nature of the packaging material used (sachets for oils and basins for
flour) by the vendors (Chakravarty,2000). This is so
because packaging is also a contributing factor to the losses in Vitamin A (Oluwalana et al., 2015).
Loss of vitamin A in vegetable cooking oils was lower than in maze flour and this could be attributed to the fact that oil stabilizes retinol and delays oxidation of the vitamin (Dutra- de – Oliveira, 1994, Pignitter et al., 2012). Though the samples used were produced by large
Abs corrected x Vf x CF spec Retinyl palmitate (mg/kg ) = a x w
Conc. Of vit.A in extract (M) x vol ( ml) of extract solution x 5.249 x 10⁵ Mass of Flour weighed ( g )

300 Afr. J. Food Sci.
Table 1. Vitamin A levels (mg/l) in the various samples analyzed from production line.
Sample source and treatment (Soybean oil) (sunflower oil) (maize flour)
Production Line – Fresh 41.37±0.09a 36.76±0.13
a 21.53±0.93
a
Production Line – 7 day sunlight exposure 33.89±0.64 b 27.35±0.56
b 10.92±0.46
b
Production Line – 14 day sunlight exposure 31.98±0.52 c 24.06±0.29
c 9.22±0.35
c
Production Line – 35 day sunlight exposure 30.11±0.04 d 22.83±1.69
c 8.49±0.06
c
Values are mean ± standard deviation of triplicate samples. Values within the same column with the same superscript are not significantly different (p < 0.05).
Table 2. Vitamin A levels (mg/l) in the various samples analyzed from retail markets.
Sample source and treatment (Soybean oil) (sunflower oil) (maize flour)
Supermarket 37.51±0.86 36.12±0.17 17.68±0.53
Ndirande Market 31.91±0.18 30.15±0.44 9.25±0.91
Zingwangwa Market 31.57±0.80 29.78±0.89 10.04±0.34
Values are mean ± standard deviation of triplicate samples.
manufacturing industries in Malawi, the authors acknowledge the limitation that the sampling points were only in one location (Blantyre). Other retailers who also serve a large portion of the population were left out, making the findings suggestive of the likely trend to be observed nationwide rather than being conclusive. The study did not measure the peroxide values of the oils which are also influenced by exposure to sunlight. For this reason, it is recommended that further studies should include a measure of the peroxide values of the oils which would give an indication of the quality (Chabiri et al., 2009) and storage stability of the product.
Conclusions This study shows loss of vitamin A in the commercial food supply chain of vegetable cooking oil and maize flour upon exposure to sunlight. Handling of vitamin A fortified foods should therefore be away from sunlight.The study also revealed higher vitamin A lose in maize flour than vegetable cooking oil when exposed to sunlight for the same duration. Sunflower cooking oil also exhibited higher vitamin A losses than soybeans oil.It is therefore recommended that more effort in future interventions of abating vitamin A deficiency should focus on soybean cooking oil as a vehicle. Retailers should also be sensitized on the importance of proper handling and storage of fortified cooking oil and maize flour to avoid loss of vitamin A. Conflict of Interests The authors have not declared any conflict of interests.
ACKNOWLEDGEMENT The authors thank the University of Malawi through the Department of Physics and Biochemical Sciences for financially supporting this study. REFERENCES AOAC (2002). Official Methods of Analysis of Association of Official
Analytical Chemist, 17th
ed., Arlington Virginia: Association of Official analytical Chemist. Chapter 32, pp. 1, 2, 23 and 43.
Butt MS, Arshad MU, Alam MS, Nadeem MT (2007). Bioavailability and storage stability of vitamin A fortificant (retinyl acetate) in fortified cookies. Food Res. Int. 40:1212-1219.
Chabiri, SA, Hati SS, Dimari GA,Oguguaja VO (2009). Comparative quality assessment of branded and unbranded edible vegetable oils in Nigeria. Pac. J. Sci. Technol. 1(2):927-934.
Chakravarty I (2000). Food-based strategies to control vitamin A deficiency. Food Nutr Bull 21:135-43.
Combs GF (2012). Vitamin A. The Vitamins (Fourth Edition) 2012. pp. 93-138.
Dary O, Mora JO (2002). International Vitamin A Consultative Group. Food fortification to reduce vitamin A deficiency: International Vitamin A Consultative Group recommendations. J. Nutr. 132:2927-2933.
Dutra-de-Oliveira JE (1994). Effect of heat treatment during cooking on the biological value of vitamin A fortified soybean oil in human. Int. J. Food Sci. Nutr. 45:2003-2017.
East, Central and Southern Health Community (2007). Manual for internal monitoring of oil fortified with vitamin A (Quality Assurance and Quality Control, QA/QC). Arusha, Tanzania.
GoM-Malawi Government (2009) National nutrition policy and strategic plan (2007-2011). Office of president and Cabinet, Department of Nutrition HIV and AIDS. Lilongwe, Malawi.
Heikens GT (2007). How can we improve the care of severely malnourished children in Africa? PLoS Med; 4(2):45. doi: 10.1371/journal.pmed.0040045. Johnson LE (1997). Oils, fats and margarine: overview of technology.
Food Fortification to End Micronutrient Malnutrition. State of the Art :22-26 The Micronutrient Initiative, International Development Research Centre Ottawa, Canada.
Klemm RDW, Keith P, West Jr., Amanda CP, Johnson Q, Randall P,
Ranum P, Northrop-Clewes C (2010). Vitamin A fortification of wheat flour: Considerations and current recommendations. Food and Nutrition Bulletin, Supplement no. 1.The United Nations University. Vol. 31.
Malawi Standard 51 (1988). Edible oil – General standard, Malawi Bureau of Standards, Blantyre, Malawi.
Mostert D, Steyn NP, Temple NJ, Olwagen R (2005). Dietary intake of pregnant women and their infants in a poor black South African community. Curationis 28:12-19.
Oluwalana IB, Oluwamukomi MO, Toriola BO, Karim OR (2015). Influence of packaging materials and storage conditions on the Vitamins A and E storage stability of Palm Oil in Nigeria. Adv. Res. 4(3):191-202.
Pignitter M, Somoza V (2012). Are Vegetable oils always a reliable source of vitamin A? A critical evaluation of analytical methods for the measurement of oxidative rancidity. Sight and Life, 26:18–27
Puysuwan L, Chavasit V, Sungpuag P, Hediger D, Punvichai T (2007). Feasibility and use of vitamin A fortified vegetable oilsamong consumers of different socioeconomic status in Thailand. Food
Nutr. Bull. 28:181−188. Ruel MT (2001). Can Food-Based Strategies Help Reduce Vitamin A
and Iron Deficiencies? A Review of Recent Evidence. International Food Policy Research Institute; Washington, DC, USA.
Solon FS, Sancex-Fermin LE, Wambangco LS, Solon MAM (1999). Final report-Iron and vitamin A stability in flour and products. Manila: Nutrition Center of the Philippines.
SUSTAIN (1999). The progress of wheat flour fortification with vitamin A in the Philippines. Final Report of the Micronutrient Assessment Project U.S. Agency for International Development, SUSTAIN Washington, DC.
UNDP-United Nations Development Programme (2012). Human Development Report 2011/2012-Country Fact Sheets –Malawi.
Ulemu et al. 301 West CE, Eilander A, Van Lieshout M (2002). Consequences of revised
estimates of carotenoid bioefficacy for dietary control of vitamin A deficiency in developing countries. J. Nutr. 132(9):2920S-2926S.
WHO-World Health Organization (1998). Safe vitamin A dosage during pregnancy and lactation. Document WHO/NUT/98 4 World Health Organization Geneva, Switzerland 2.
WHO-World Health Organization (2009). Global prevalence of vitamin A deficiency in populations at risk 1995–2005: WHO Global Database on Vitamin A Deficiency. WHO, Geneva.
Yeudall F, Gibson RS, Cullinan TR, Mtimuni B (2005).Efficacy of a community-based dietary intervention to enhance micronutrient adequacy of high-phytate maize-based diets of rural Malawian children. Public Health Nutr. 8:826-836.

Vol. 10(11) pp. 302-312, November 2016
DOI: 10.5897/AJFS2016.1460
Article Number: 59A8F0360705
ISSN 1996-0794
Copyright © 2016
Author(s) retain the copyright of this article
http://www.academicjournals.org/AJFS
African Journal of Food Science
Full Length Research Paper
Analysis and identification of the volatile compounds in melon-bitter leaf soup
Opeyemi Oyekunke Olabode and Gibson Lucky Arueya*
Department of Food Technology, University of Ibadan, Ibadan, Oyo State, Nigeria.
Received 27 April, 2016; Accepted 3 August, 2016.
Melon-bitter leaf soup is one of the most widely consumed soup delicacies across West Africa, owing to its unique and distinct flavour. The aim of this study therefore was to identify volatile compounds in this soup, thus establishing a critical baseline for further work. Melon-bitter leaf soup was prepared according to standard method. Functional groups of chemical moieties in the soup were obtained using Fourier Transform Infra-red Spectroscopy (FT-IR). Analysis and identification of the volatile compounds in the soup was by Headspace micro-extraction at 40°C coupled with gas chromatography/mass-spectroscopy (GC/MS) using helium as carrier gas at a constant flow rate of 1 ml/min and an injection volume of 0.5 µl (split ratio of 10:1). Amines, esters, acids, benzenes, alkanes, pyrazines and terpenes were established and authenticated. Major aroma contributors to the soup flavour were found to be acetic acid (22.31%), 3-methylbutanoic acid (13.38%), 2-methylbutanoic acid (6.38%), 2-methylpropanoic acid (4.69%), tetramethylpyrazine (4.45%), butanoic acid (2.51%), propanoic acid (2.09%), trimethylpyrazine (1.55%), methylpyrazine (1.10%), furfural (1.10%), hexanoic acid (0.64%), linalool (0.38%), 1,8-cineole (eucalyptol) (0.35%) and 2,5 dimethylpyrazine (0.29%), all characterized with distinct peaks on the chromatogram. Volatile flavor compounds associated with melon bitter leaf soup were isolated and identified. Acetic acid was the major flavorant. Key words: Aroma, volatile compounds, melon- bitter- leaf soup, flavorant, Fourier transform infra-red spectroscopy (FT-IR), gas chromatography/mass-spectroscopy (GC/MS).
INTRODUCTION Consumer and marketing studies invariably have shown that taste, as opposed to perceived nutrition or health value, is the key influence on food selection (Drewnowski, 1996; Glanz et al., 1998). More than ever before, consumers are demanding better tasty foods made from natural sources and usually at a reasonable
price. This has necessitated research into the development of natural and nature identical food flavours (Lawless and Heymann, 2010). A determining factor in the acceptance or rejection of a foodstuff is its flavor, as this plays a very important role in palatability and is one of the key parameters determining the overall quality of a
*Corresponding author. E-mail: [email protected] or [email protected]. Tel: +234-805-9546-297.
Author(s) agree that this article remains permanently open access under the terms of the Creative Commons Attribution
License 4.0 International License

food product (Carterette and Friedman, 1989). Flavour is defined as the combined perception of odor, taste and mouthfeel (texture) (Ney, 1988). The flavour of a food is created by aromatic substances that are biosynthesized during normal metabolic processes in plants and animal possibly further modified by processing (Reineccius, 1999). A number of these flavours have been used in food industries as part of their key inputs. Understanding the mechanisms by which flavour compounds are formed can lead to optimized methods of food processing, allowing targeted formation and retention of flavor. Fundamental flavor chemistry information is also essential in genetic engineering of plants and animals for improving flavor in the raw materials of food products (Carterette and Friedman, 1989). Advances in analytic methodology have enabled the identification of numerous compounds with known flavor properties. As more compounds are correlated with characteristic flavors, there is a trend to study flavor precursors and to explain how flavor is developed and released. Understanding the chemical reactions involved in the processing and storage of foods helps in achieving optimum consumer acceptability (Teranishi, 1989). Besides flavor, other sensory properties with a great impact on the consumer are color and appearance. Flavor is generally thought to consist of the volatile components sensed in the nose, both through the nostrils (orthonasally) and from inside the mouth (retronasally), nonvolatile compounds sensed on the tongue and compounds that are perceived in the mouth as texture or mouthfeel. Flavor analysis has typically focused on measuring volatile compounds, for example by gas chromatography-mass spectroscopy (GC-MS) and GC-olfactory methods. Chicken flavor, a commonly used food flavour was evaluated by Gasser and Grosch (1990) who identified 2-methyl-3-furanthiol, methionol, 2,4,5-trimethylthiazole, 2-trans-nonenal and other compounds as significant components, but concluded that 2-methyl-3-furanthiol was the dominant flavor contributor. Many of these key aroma compounds in chicken soup were authenticated by Farmer (1999) to further include 3-methylthiopropanal. However, aldehydes, ketones and alcohols were identified as flavor compounds associated with fresh fish soup (Ólafsdóttir and Fleurence, 1998). The intensity of the aroma seems to be related more with chemical factors such as volatility and hydrophobic nature, and the stereo-chemical structure such as type and position of the functional groups of the aromatic compounds than with their concentration. It has been demonstrated that the size, shape, conformational structure and type and position of the functional groups of the aromatic compounds are important elements in establishing the appropriate bonds to the olfactory receptor proteins present in the olfactory epithelium, thereby giving rise to the perception (Pelosi, 1994). The flavour components of button mushroom soup was analyzed by Qin et al. (2011) who found 1-octen-3-ol
Olabode and Arueya 303 (mushroom-like flavor), 1-octen-3-one (mushroom-like flavor), benzaldehyde (floral flavor), 2,5-dimethylpyrazine (popcorn-flavour), 2,6-dimethylpyrazine (roasted nut flavor), 3-methylbutanal (fruity flavor) and 2-acethylthiazole (meat flavor) to be the main components. On the other hand, duck soup exhibited significant amounts of pentanal, 3-ethyl-2-methyl-1,3-hexadienne and 2-pentyl furan amongst others as flavor components (Zhang et al., 2012). Takakura et al. (2014) identified the main active compounds contributing to the aroma in pork soup to be hexanoic, decanoic and octanoic acids.
Fish flavors are mainly characterized by the volatile compounds in fish. Ólafsdóttir and Fleurence (1998) presented a good review on the main groups of fish odors. These are species related fresh fish odor, microbial spoilage odor, oxidized odor, environmentally derived odor, and processing odor. The type of functional group is related more with the intensity of the aroma than with its type. Katanaka and Kaijawara (1992) found that the intensity of aroma of the unsaturated C6 - aldehydes is between 10 - and 1000-fold stronger than that of their corresponding hexenols, which have the double bond at the same position and with identical geometry. While a number of scientific investigations have been conducted on the flavor profiles of these foreign soups, there is paucity of data on some soup delicacy such as melon bitter leaf soup widely consumed in Nigeria and indeed in West Africa. Omah et al. (2015) compared two Nigerian soups (Egusi soup and bitter leaf soup) and concluded that the instant bitter leaf soup was most preferred as compared to instant Egusi soup.
Solid phase microextraction (SPME) is the most recently applied technique in the analysis of volatile compounds. Pawliszyn’s (2001) group was the first to develop the SPME method, and they applied it to environmental analysis. Since then, it has become a widely used technique for the analysis of volatiles in foods. The technique employs a fiber of adsorbent material placed inside a modified chromatographic needle to isolate and concentrate the compounds. The fiber is positioned in the headspace of the sample for a specific time. The volatile compounds are diffused and distributed on the polymer coating as a function of their coefficients of distribution. The fiber is removed from the sample and placed in the GC injector, where the compounds are thermally desorbed.
The objective of this study was to isolate and identify the volatile compounds associated with melon-bitter leaf soup. MATERIALS AND METHODS Collection of raw materials The following material inputs: dried melon seed (Citrullus colocynthis), dried catfish (Clarias gariepinus), stockfish (Brosme

304 Afr. J. Food Sci.
Heating of palm oil (for 2 min)
Addition of onions and locust beans (frying for about 5 min)
Inclusion of grinded pepper (cooking for about 15 min)
Addition of milled melon seed (further cooking for 10 min)
Progressive addition of boiled stockfish, dried fish and crayfish (cooking for 5 min)
Addition of salt (mixing)
Mixing with shredded melon bitter leaf
Steaming (5 min)
Melon bitter leaf soup
Figure 1. Flowchart of melon bitter leaf soup preparation.
brosme), dried crayfish (Cambarus robustus) and table salt were used. Other materials included, chili pepper (Capsicum annuum), onion (Allium cepa), tomatoes (Solanum lycopersicum), fresh bitter leaf (Vernonia amygdalina), fermented locust beans (Parkia biglobosa) and palm oil. All materials used were obtained from retail outlets in Bodija Ibadan, Nigeria. Preparation of melon-bitter leaf soup Two hundred and fifty grams each of clean dry cat and stock fishes were boiled in a liter of water for about 20 min. Melon seed (600 g), crayfish (150 g), tomatoes (100 g), chili pepper (25 g) and onions (100 g) were sorted and separately milled. The bitter leaf was wet cleaned and thinly shredded. These inputs were next used in the soup preparation as described by FIIRO (2006) (Figure 1). The resulting soup sample was allowed to cool, freeze dried (-45°C) and stored until further analysis.
Evaluation of some chemical properties of the soup mix Moisture, protein, fat and carbohydrate contents as well as pH and titratable acidity of the soup mix were evaluated according to standard methods (AOAC, 2005). Extraction and analysis of volatiles in the key soup ingredients and soup using HS-SPME-GC/MS One gram each of sample stock (locust bean, onion, melon seeds, crayfish, stockfish, bitter leaf and the soup) was extracted at 40°C by automated headspace solid-phase micro-extraction with the agitation of the sample. The SPME fiber (Sigma Aldrich, Dorset, UK) was coated with DVB-Carboxen on PDMS 50/30 μm (1 cm in length) (Sigma Aldrich, Dorset, UK), according to the method of Rocha et al. (2001). The compound absorbed by the fiber was desorbed in the injection port. Analysis was carried out on a GC

Table 1. Proximate composition of the freeze dried soup mix.
Parameter Quantity
Moisture (%) 4.36 ± 0.02
Protein (%) 40.43 ± 0.05
Fat (%) 7.32 ± 0.03
Carbohydrate (%) 30.28 ± 0.05
pH 5.36 ± 0.06
Titratable acidity (mg/100 ml) 18.00 ± 0.03
Each value is mean ± SD of triplicates.
Clarus 500 Perkin Elmer system (Beacons field, UK) comprising an Aoc-20i auto sampler (Beacons field, UK) and gas chromatograph interfaced to a mass spectrometer (GC-MS) instrument. The following conditions were employed: column Elite-1 fused silica polar capillary column (30 x 0.25 mm inner diameter x 1 µM df composed of 100% dimethylpolysiloxane), operating an electron impact mode at 70 eV; helium (99.999%) was used as carrier gas at a constant flow rate of 1 ml/min and an injection volume of 0.5 µl (split ratio of 10:1), injector temperature 280°C (ion-source temperature 280°C). The oven temperature was programmed starting from 110°C (isothermal for 2 min), with an increase of 10°C/min up to 200°C and thereafter 5°C/min attaining 280°C, ending in 9 min (isothermal at 280°C). Mass spectra were obtained by electron ionization at 70 eV; a scan interval of 0.5 s and fragments from 40 to 450 Da. The total GC running time was 36 min. Compounds were identified by comparison with mass spectra from the National Institute of Standard and Technology Mass spectra library database (NIST No. 11). Determination of functional groups with FTIR spectroscopy Eight milligrams of the sample was thoroughly blended with potassium bromide powder and pelletized (13 mm diameter and 1 mm thickness). The sample was next introduced to FTIR (Spectro-BX, Perkin Elmer, UK) scanned at a range of 350-4000 nm to determine the functional groups inherent in the soup. Statistical analysis Data of proximate analysis were expressed as means ± standard deviation (SD).
RESULTS AND DISCUSSIONS Some chemical properties of the soup mix The physicochemical properties of soup (freeze dried) are presented in Table 1. The moisture content of the freeze dried sample (4.36%) was lower than that reported by Omah et al. (2015). Moisture content closely linked with low water activity has been implicated as a key factor in flavor developments in foods (Tamanna and Mahmood, 2015). Fat content (7.32%) was lower than the values reported for Ogbono soup mix (34.62%)
Olabode and Arueya 305 (Bamidele et al., 2015). Fat plays an essential and direct role in flavor perception of flavorant, the most important flavor compound being free fatty acids produced by lipolysis (Engels, 2014). The carbohydrate content (30.28%) was higher in values than that reported for Ogbono soup mix (27.18%) (Bamidele et al., 2015). Naknean and Meenune (2010) reported that carbohydrates such as sugars and polysaccharides are commonly used to entrap flavor compounds while interaction between food carbohydrates and flavor compounds is required for suitable flavor retention and release during processing and eating. Protein content observed in the sample (40.43%) was higher than that in Ogbono soup mix (18.42%) (Bamidele et al., 2015). High content of protein was expected since most ingredients that made up the soup are highly proteinaceous. Hydrolytic reaction resulted in amines and amino acids which ostensibly led to the formation of some volatile aroma compounds (Reineccius, 1999). The soup’s titratable acidity (18 mg/100 ml) and pH (5.36) reflects the acidic nature of the soup which may have enhanced hydrolytic reactions, yielding various flavor precursors (Belitz et al., 2009). The pH values have been reported to have significant influence on volatile compounds formed in Maillard type reaction as envisaged here (Shaoping et al., 2013). The formations of several volatile compounds including heterocyclic compounds have been a function of prevailing pH (Madruga and Mottram, 1998). Belitz et al. (2009) remarked that acidic medium also promotes the formation of furan and its derivatives in soups. Analysis of volatiles in the soup and its ingredients
Volatile compounds present in the key ingredients
The ingredient that made up the soup showed: compounds in ground melon seed (52), fresh bitter leaf soup (32), onions (33), locust beans (56), crayfish (23), stockfish (25) and dried catfish (62). All volatiles identified were compounds of esters, amides, alcohols, benzenes, alkenes and furans which may have reacted together during cooking process to yield the corresponding volatile compounds in the final soup. FT-IR analysis of the soup
FT-IR analysis revealed the presence of various functional groups present in the soup samples (freeze dried). The frequency range and functional group obtained from absorption spectra were noteworthy (Table 2).
In this study, the band at 3404.00 cm-1
was due to the presence of amines, the sharp peak at 2920.00 cm
-1 was
attributed to alkyl group while the band at 1740.67 cm-1
is
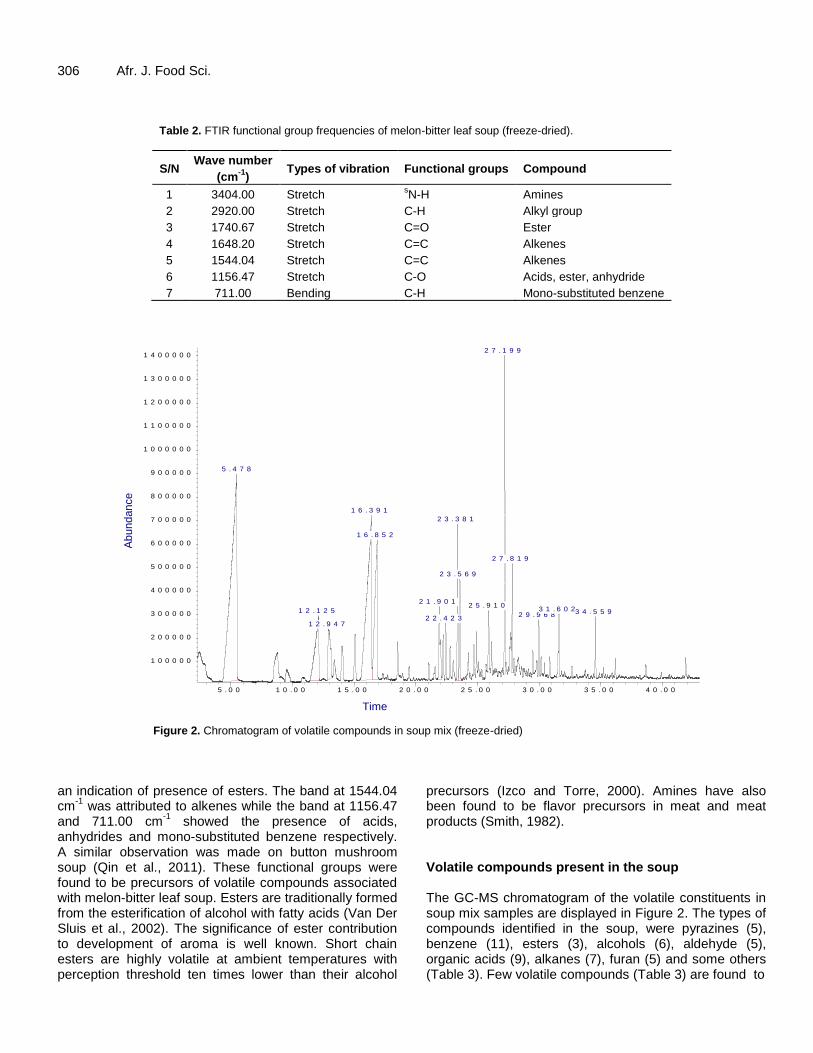
306 Afr. J. Food Sci.
Table 2. FTIR functional group frequencies of melon-bitter leaf soup (freeze-dried).
S/N Wave number
(cm-1
) Types of vibration Functional groups Compound
1 3404.00 Stretch sN-H Amines
2 2920.00 Stretch C-H Alkyl group
3 1740.67 Stretch C=O Ester
4 1648.20 Stretch C=C Alkenes
5 1544.04 Stretch C=C Alkenes
6 1156.47 Stretch C-O Acids, ester, anhydride
7 711.00 Bending C-H Mono-substituted benzene
5 . 0 0 1 0 . 0 0 1 5 . 0 0 2 0 . 0 0 2 5 . 0 0 3 0 . 0 0 3 5 . 0 0 4 0 . 0 0
1 0 0 0 0 0
2 0 0 0 0 0
3 0 0 0 0 0
4 0 0 0 0 0
5 0 0 0 0 0
6 0 0 0 0 0
7 0 0 0 0 0
8 0 0 0 0 0
9 0 0 0 0 0
1 0 0 0 0 0 0
1 1 0 0 0 0 0
1 2 0 0 0 0 0
1 3 0 0 0 0 0
1 4 0 0 0 0 0
T im e - - >
A b u n d a n c e
T I C : 2 0 1 4 - 0 4 - 2 3 E lm o r e # 0 2 . D \ d a t a . m s
5 . 4 7 8
1 2 . 1 2 5
1 2 . 9 4 7
1 6 . 3 9 1
1 6 . 8 5 2
2 1 . 9 0 1
2 2 . 4 2 3
2 3 . 3 8 1
2 3 . 5 6 9
2 5 . 9 1 0
2 7 . 1 9 9
2 7 . 8 1 9
2 9 . 9 6 83 1 . 6 0 23 4 . 5 5 9
Ab
un
dan
ce
Time
Figure 2. Chromatogram of volatile compounds in soup mix (freeze-dried)
an indication of presence of esters. The band at 1544.04 cm
-1 was attributed to alkenes while the band at 1156.47
and 711.00 cm-1
showed the presence of acids, anhydrides and mono-substituted benzene respectively. A similar observation was made on button mushroom soup (Qin et al., 2011). These functional groups were found to be precursors of volatile compounds associated with melon-bitter leaf soup. Esters are traditionally formed from the esterification of alcohol with fatty acids (Van Der Sluis et al., 2002). The significance of ester contribution to development of aroma is well known. Short chain esters are highly volatile at ambient temperatures with perception threshold ten times lower than their alcohol
precursors (Izco and Torre, 2000). Amines have also been found to be flavor precursors in meat and meat products (Smith, 1982). Volatile compounds present in the soup The GC-MS chromatogram of the volatile constituents in soup mix samples are displayed in Figure 2. The types of compounds identified in the soup, were pyrazines (5), benzene (11), esters (3), alcohols (6), aldehyde (5), organic acids (9), alkanes (7), furan (5) and some others (Table 3). Few volatile compounds (Table 3) are found to

Olabode and Arueya 307 Table 3. Volatile compounds in melon bitter leaf soup (freeze-dried).
S/N Compound Retention time
(min) Linear retention index
Pyrazines
1 Trimethylpyrazine 15.07 821
2 2, 5 (and/or 2, 6) Dimethylpyrazine 19.45 912
3 Trimethyl pyrazine + octanal (10:1) 23.57 1003
4 Tetramethylpyrazine 27.20 1088
5 Ethyltrimethylpyrazine 30.15 1162
Benzenes
6 Propylbenzene 21.56 959
7 1,2–Dimethybenzene 18.72 897
8 1-Ethyl-3-methybenzene 21.90 966
9 1 Ethyl-4-methylbenzene hexanoic acid (3:1) 21.99 968
10 1,3,5, -Trimethyl benzene 22.22 973
11 1 Ethyl-2-methylbenzene 22.77 985
12 1,2,4-Trimethylbenzene 23.38 999
13 1,4 – Dichlorobenzene 24.26 1019
14 1,2,3–Trimethyl benzene 24.71 1030
15 A methylvinylbenzene 25.35 1045
16 MW 134 benzene 27.05 1085
Esters
17 1–Methoxy-2-propylacelate 17.33 868
18 2-Ethylhexanoic methyl ester 25.22 1042
19 2-Ethylhexylacrylate 32.65 1227
Alcohols
19 2,3-Butanediol enantiomer 2 13.39 786
20 Toluene + 1-pentanol (1:1) 12.52 768
21 2-Methylphenol 25.69 1053
22 1-Octanol 26.33 1068
23 Phenol 22.42 978
24 Menthol 30.86 1180
Aldehydes
25 Pentanal 9.05 696
26 (E)-2-Heptanal 21.49 957
27 Octanal 23.57 1003
28 Nonanal 27.73 1101
29 Hexanal 14.02 799
Acids
30 Acetic acid+tri-diacetyl 5.48 607
31 2 Methyl propaonic acid 12.13 760
32 Butanoic acid 12.95 777
33 3-Methylbutanoic acid 16.39 848
34 2-Methybutanoic acid 16.85 858
35 Pentanoic acid 17.72 876
36 Hexanoic acid 21.99 968
37 Tri octanoic acid 29.97 1157

308 Afr. J. Food Sci. Table 3, Contd.
38 Nonanoic acid 33.72 1257
Alkanes
39 Octane 14.02 799
40 3-Methylundecane 30.42 1169
41 Pentadecane 41.87 1499
42 Hexadecane 44.95 1599
43 Undecane 27.68 1099
44 Heptadecane 47.84 1699
45 Tetradecane 38.64 1398
Furans
46 Tr-furfural 16.39 848
47 2-Pentylfuran 23.03 991
Ketones
48 Acetoin (3-hydroxy – 2 – butanone) 9.55 707
49 Trimethylamine
Others
50 Limonene 24.92 1035
51 Linalool 27.73 1101
52 1,6–Cineole (eucalyptol) 25.08 1039
53 Camphor 29.97 1157
Hydrocarbons
54 MW 156 saturated hydrocarbon 26.43 1070
55 MW 170 saturated hydrocarbon 27.49 1095
be predominant in the soup aroma and included acetic acid, propanoic acid, 2-methylpropanoic acid, butanoic acid, trimethyl pyrazine, 3-methylbutanoic acid, furfural, 2-methylbutanoic acid, 2,5-dimethylpyrazine, hexanoic acid, 1,8-cineole, tetra-methylpyrazine, linalool, camphor and menthol.
Apparently, quite a number of volatiles found in the soup ingredients were absent in the end product while several volatiles compounds were generated in situ. These developments may be a function of thermal processing culminating perhaps in either the release of volatiles already existing in the ingredients or degradation of amino acids, sugars, nucleotides and/or Maillard reactions occurring between amino acids and reducing sugars (Qin et al., 2011).
Undoubtedly, flavorants, especially the volatile compounds, are generated through chemical reactions between natural precursors present in raw ingredients during thermal processing. Limiting precursors or critical component leading to the formation of characteristic volatile aromas of cooked foods such as meat have been established (Farmer, 1999). Reactions leading to flavor
development may include pyrolysis of amino acids and peptides, carbohydrate degradation, interaction of sugars with amino acids and peptides, breakdown of ribonucleotides and lipids (Shahidi, 1998). Evidently, most non-volatiles are odorless and extremely hydrophilic and includes compounds such as table salt, citric acid and sugar (Choudhury, 2008). These are known to impact significantly on the taste of substances and thus regarded as flavorants. A number of other non-volatiles such as amino acids, peptides, fats, carbohydrates and organic acids also provide and enhance tastes in food (Choudhury, 2008). Although, generally odorless, these also generate characteristic volatiles. Their chemical interaction such as during hydrolytic cleavages usually leads to the formation of specific aromas (Chen and Ho, 1998).
Understandably, the soup inputs such as locust beans, melon seed, bitter leaf, crayfish, stockfish, dried catfish and onion have their characteristic flavour owing to their inherent chemical compositions. Possible reaction routes involved in the formation of the key aroma compounds present in the soup are as follows:

Olabode and Arueya 309 Table 4. Possible key contributors to flavour of melon bitter leaf soup (freeze-dried).
Retention time (min)
Compound Peak identification Formula Relative peak area
(%)
5.48 (Carboxylic acid) Acetic acid CH3CO2H 22.31
8.78 (Carboxylic acid) Propanoic acid CH3 CH2CO2H 2.097
12.13 (Carboxylic acid) 2-methylpropanoic acid CH3 (CH3)CHCO2H 4.69
12.95 (Carboxylic acid) Butanoic acid CH3CH2 CH2 CO2H 2.51
15.07 (Aromatic) Methylpyrazine C5H6N2 1.20
16.39 (Carboxylic acid/aldehyde)
3-methylbutanoic acid+furfural CH3CH(CH3)CH2CO2H ; C5H6N2 13.38
16.85 (Carboxylic acid) 2-methylbutanoic acid CH3CH2 CH(CH3)CO2H 6.37
19.45 (Caboxylic acid) 2,5-dimethylpyrazine CH6H8 N2 0.29
21.99 (carboxylic acid) Hexanoic acid CH3CH2 CH2CH2 CH2 CO2H 0.64
23.57 (Aromatic) Trimethylpyrazine C7H10N2 1.55
25.08 (Aromatic) 1,8-Cineole (eucalyptol) C10H18O 0.35
27.20 (Aromatic) Tetramethylpyrazine C8H12N2 4.45
27.73 (monoterpenoid) Linalool CH3) 2 C=CH(CH2 )2 C(CH3)(OH) CH(CH2 )
0.38
Formation of substituted compounds of pyrazine The related volatile compounds found in the melon bitter leaf soup in this study were the substituted pyrazine compounds which included trimethylpyrazine, 2,5-dimethylpyrazine, tetramethylpyrazine and ethyl-methylpyrazine. These compounds showed high retention factors due to their high level of affinity for the stationary phase and their molecular weight (Owens et al., 1997). They may have been formed from amino acids and diketones present in melon seed, bitter leaf, onion, fish and locust beans, all of plant/animal origin as used in this study during processing temperatures (37- 100°C). The condensation reaction between diketones and amino acids followed by Strecker degradation produced α-aminoketones and thereafter oxidation may have led to the final substituted pyrazine compounds detected in the final soup (Yaylayan, 2003). In heated foods, the main source of the aldehydes is Strecker degradation of amino acids, while in fat containing foods, it is lipid oxidation (Reineccus et al., 2003). A widely accepted mechanism of pyrazines formation is reportedly based on the Maillard reaction and Strecker degradation (Belitz et al., 2009). The reaction of α-amino acids and reducing sugars initially generated Amadori/Heyns compounds, a rearrangement reaction which led to the formation of reductones which included α-dicarbonyls and α-aminocarbonyls condensed to pyrazines. Pyrazines can also be formed directly from the Strecker degradation (Whitfield, 1992).
The high protein (40.43%) and carbohydrate (30.28%) contents under acidic conditions (pH 5.36) and high temperature (100°C) promoted the formation of large
concentration of aroma precursors, ostensibly through hydrolytic reactions. These aroma precursors such as amines, amino acids and reducing sugars are usually associated with carbonyl groups (Reineccius et al., 2003). Having condensed through pathways such as Strecker degradation and oxidation processes, these gave rise to unstable intermediate (dihydropyrazines) which culminated in the formation of pyrazines (Yaylayan, 2003). The greater possibility of forming 2,5-dimethylpyrazine rather than 2,6–dimethylpyrazine was reported in a model system of glycine peptides and glucose (Weenen, 1998). Alanine and phenylalanine are strong pyrazine producer. Acetaldehyde and formaldehydes are Strecker aldehydes and also could be degradation products from glucose and other amino acids (Qin et al., 2011).
Pyrazines are one of the most important groups among the identified volatiles in food systems as they are widely distributed in foods that are processed at high temperatures and low moisture conditions. Formation of furan and its derivatives
The analysis carried out on melon bitter leaf soup indicated the presence of furfural and 2-pentyl furan (Table 4). These pathways have been identified by some related studies (Belitz et al., 2009).
The hydrolytic products arising from the thermal processing of the proteins and carbohydrates in the soup may have formed aldotetrose derivatives which then undergo cyclization to form furan. The acidic medium of the soup may have enhanced the formation of mono and
310 Afr. J. Food Sci. di-unsaturated acids. These during cyclization may possibly have yielded furfural. Furfural has been reported to be the most important contributor to roasted meat flavours. It is also found in castor bean condiments (Ojinnaka and Ojimelukwe, 2013). This pathway may have led to the formation of furan and its derivatives in this study. The heating of monosaccharides gives rise to a large number of compounds of furan. As reported and demonstrated by Belitz et al. (2009), the formation can be explained by enolization and dehydration of carbohydrates. Formation of aldehydes Another group of products suggested to have been formed from Strecker degradation of α-amino acids were pentanal, 2-heptanal, octanal, nonanal and hexanal also with relatively high retention factors owing to their high affinity for the stationary phase and low affinity for the mobile phase. Hexanal has earlier been observed by Takakura et al. (2014), in pork soup characterized by fruity flavour. Aldehydes generated in this study were Strecker aldehydes and may have been formed from Strecker degradation of amino acids. Additionally, these aldehydes may also have emanated from lipid oxidation by hemolytic β-scission containing carbon atom of the fatty acid in the oil. This radical could then combine with a hydroxyl moiety to produce an alcohol, giving rise to an aldehyde (decanal) by tautomerization.
Peroxidation of polyunsaturated fatty acids was initiated by additional mixtures of aldehydes besides several shorter fatty acids, keto, hydroxy or epoxy compounds (Vistoli et al., 2013).
The heat induced formation of these compounds from various fatty acids has been investigated (Guillen and Goicoechea, 2008). Thus, peroxidation of (n-6) fatty acids (linoleic and arachidonic acids) produces well defined compounds, 2,4-decadienal and 3-nonenal from 9-hydroperoxy linoleate; hexanal and pentanal from 13-hydroperoxy linoleate, and 2-heptenal from 10-hydroperoxy linoleate. Other volatile decomposition compounds frequently encountered include: 2-hexenal, 2-octenal, 2,4-nonadienal, 4,5-dihydroxydecenal and especially 4-hydroxy-2, 3-trans-nonenal (4HNE). Formation of carboxylic acids and alcohols Acetic acid is a well-known degradation product of saccharides. The formation of carboxylic acids may be a result of oxidative α-dicarbonyl cleavage. Novotny et al. (2008) also reported the formation of carboxylic acids due to sugar degradation. Davidek et al. (2006), also observed the formation of acetic acid and other short chain carboxylic acid in Maillard model systems (90°C,
pH 6-10) and concluded that thermal treatment of 1-deoxy-d-erythro-2,3-hexodiulose (in the presence of oxygen enriched water under alkaline conditions) enhanced the formation of acetic acid. Acetic acid has been reportedly observed in pork soup and is characterized by sour flavour (Takakura et al., 2014). Melon bitter leaf soup also indicated the presence of butanoic, 3-methylbutanoic, 2-methylbutanoic, pentanoic, hexanoic, octanoic, nonanoic, 2-methylpropanoic and ethanoic acids (acetic acid) which may also have been formed through the hydrolysis of esters and amides in the soup ingredients (stockfish, melon seed and onion) at the cooking temperature and acidic pH of the soup (Choudhury, 2008).
In this study, it can be concluded that sugar degradation by carbonyl group is a major pathway for the formation of carboxylic acid. Propanoic and butanoic acids are generated as a result of heating and Maillard reaction (Mottram and Whitefield, 1995). Esters and amides are two of the carboxylic acid derivatives formed from carboxylic acids in reaction with alcohols and ammonia, respectively. These reactions are reversible implying that these derivatives can also undergo hydrolysis to form carboxylic acids, alcohol or ammonia. Formation of linalool, limonene and camphor Linalool may have been formed from geranyl acetate via hydrolysis into geraniol followed by isomerization into linalool under the cooking condition. Limonene (cyclic monoterpene) possibly came from geranyl acetate by loss of acetate ion followed by cyclization. The camphor component which is a bicyclic monoterpene may have emanated from geranyl acetate through isomerization and cyclization into intermediate products such as α-pinene via linaloyl acetate. These reactions are usually favoured by high temperatures as obtained during the cooking process (Spracklen et al., 2008). Formation of alkenes and alkanes Octane, 3-methylundecane, pentadecane, hexadecane, undecane, heptadecane and tetradecane were identified to be present in the soup. These compounds may have been formed from peroxidation of oleic acid and some other fatty acids (Boonprab et al., 2003). Conclusion
Several volatile compounds were identified as the key aroma contributor of the soup and included acetic, propanoic, 2-methylpropanoic and butanoic acids, and methylpyrazine, 2,5 and/or 2,6-dimethylpyrazine, hexanoic

acid, 1,8-cineole, tetramethylpyrazine, linalinol, camphor and menthol. Carboxylic acids were the most abundant class of compound representing over 50% of the total volatile compounds, followed by heterocyclics and monoterpernoids in that order.
Conflict of Interests
The authors declare that there is no conflict of interests. REFERENCES
AOAC (2005). Official Methods of Analysis (18th Ed). Association of
Analytical Chemists, Washington D.C. pp. 222-225. Bamidele OP, Ojedokun OS, Fasogbon BM (2015). Physicochemical
properties of instant Ogbono mix (Irvingia gabonensis) powder. Food Sci. Nutr. 3(4):313-318.
Belitz HD, Grosch W, Schieberle P (2009). Food Chemistry. 4th edition.
Springer –Verlag. Berlin, Heidelberg. pp. 8-92. Boonprab K, Matsui K, Yoshida M, Akakabe Y, Chirapat A, Kajiwara T
(2003). C6-aldehyde formation by fatty acid hyperoxidase in brown alga Laminara angusta. Z. Naturforsch. 58(3-4):207-214.
Carterette E, Friedman MP (1989). Flavor Chemistry. Trends and Development. Washington, DC: American Chemical Society.
Chen J, Ho CT (1998). The flavour of poultry meat In: Flavor of Meat, Meat products and seafoods. (Shahidi F, Ed.). Blackwell Publishers, London. pp. 84-100.
Choudhury B (2008). Volatile and non volatile components of beef marrow bone stocks. PhD. Thesis. The state University of New Jersey: NewJersey.
Davidek T, Robert F, Devaud S, Vera FA, Blank I (2006). Sugar fragmentation in the Maillard reaction cascade: Formation of carboxylic acids by a new oxidative alpha - dicarbonyl cleavage pathway. J. Agric. Food Chem. 54(18):6677-6684.
Drewnowski A (1996). From asparagus to zucchini: mapping cognitive space for vegetable names. J. Am. Coll. Nutr. 15:1147–53.
Engels WJM (2014). Selection of starters for flavor formation in dairy foods. New Food 17(2):16-19.
Farmer LJ (1999). Poultry meat flavour. In: Poultry Meat Science. Richardson RI, Mead GC (Eds.). Wallingford: CABI Publishing. Poult Sci. Symp. Ser. 25:127-158.
FIIRO (Federal Institute of Industrial Research) (2006). Soup Recipe Book. Federal Institute of Industrial Research, Oshodi, Nigeria.
Gasser U, Grosch W (1990). Primary odorants of chicken broth. Z. Lebensm. Unters. Forsch. 190(1):3-8.
Glanz K, Basil M, Maibach E, Goldberg J, Snyder D (1998). Why Americans eat what they do: taste, nutrition, cost, convenience and weight control concerns as influences on food consumption. J. Am. Diet. Assoc. 98:1118-1126.
Guillen MD, Goicoechea E (2008). Toxic oxygenated alpha, beta-unsaturated aldehydes and their study in foods. Crit. Rev. Food Sci. Nutr. (2):119-136.
Izco JM, Torre P (2000). Characterization of volatile flavour compounds in Roncal cheese extracted by the ‘purge and trap’ method and analysed by GC-MS. Food Chem. 70:409-417.
Katanaka A, Kaijawara T (1992). Odor-structure relationships in n-hexanols and n-hexenales . Z Naturforsch. 47:183-189.
Lawless HT, Heymann H (2010). Sensory evaluation of foods: Principles and practices 2
nd ed. Chapman & Hall New York, NY, USA.
pp. 1-18, 125-148. Mottram DS, Whitefield FS (1995). Maillard-lipid interactions in non-
aqueous systems: volatiles from the action of cysteine and ribose with phosphotidylcholine. J. Agric. Food Chem. 43(5):1302-1306.
Madruga MS, Mottram DS (1998). The effect of pH on the volatile compounds produced by heating a model system containing 5-Imp and cysteine. J. Braz. Chem. Soc. 9(3):261-271.
Olabode and Arueya 311 Naknean P, Meenune M (2010). Factors affecting retention and release
of flavor compounds in food carbohydrates. Int. Food Res. J. 17:23-34.
Ney KH (1988). Sensogramme Eine Methodische Erweiterung der Aromagramme. Gordian 88:19-26.
Novotny O, Cejpek K, Velisek J (2008). Formation of carboxylic acid during degradation of monosaccharides. Czech J. Food Sci. 26(2):117-131.
Ojinnaka MTC, Ojimelukwe PC (2013). Study of the volatile compounds and amino acid profile in Bacillus fermented Castor oil bean condiment. J. Food Res. 2(1):191-203
Omah EC, Ajoiyi RA, Nwankwo CS (2015). Proximate composition and sensory properties of freeze dried Nigerian soup. Agro-Sci. 14(1):37-43.
Ólafsdóttir G, Fleurence J (1998). Evaluation of fish freshness using volatile compounds- classification of volatile compounds in fish. In: Methods to Determine the Freshness of Fish in Research and Industry. Proceedings of the Final meeting of the Concerted Action "Evaluation of Fish Freshness" AIR3 CT94 2283. Nantes Nov 12-14, 1997. Int. Ins. Refrig. pp. 55-69
Owens JD, Allangbeny N, Kipping NG. Ames JM (1997). Formation of volatile compounds during Bacillus substilis fermentation of soya beans. J. Sci. Food Agric. 74:132-140.
Pawliszyn J (2001). Solid phase microextraction. Adv. Exp. Med. Biol. 488:73-78.
Pelosi P (1994). Odorant - binding proteins. Crit. Rev. Biochem. Mol. Biol. 3:199-228.
Qin LI, Zhu KX, Zhou HM (2011). Analysis of flavor compounds in button mushroom soup by HS-SPME-GC-MS and GC-O. J. Food Sci. 32(16):300-304.
Reineccius G (1999). Source book of flavors. Gaithersburg: Aspen Publishers. P 928.
Reineccus TA, Reineccius GA, Peppard TL (2003). Flavour release from cyclodextrin complexes: Comparison of alpha, beta and gamma types J. Food Sci. 68(4):1234-1239.
Rocha S, Ramalheira V, Barros A, Delgadillo I, Coimbra MA (2001). Headspace Solid Phase micro-extraction (SPME) analysis of flavor compounds in wines. Effect of the matrix volatile composition in the relative response factors in a wine model. J. Agric. Food Chem. 49(11):5142-5151.
Shahidi F (1998). Flavor of muscle foods - An overview. In: Flavor of Meat, Meat Products, and Sea-foods (2
nd edn.). Blackie Academic
and Professional, London, UK. Smith IF (1982). Leafy vegetables as sources of minerals in southern
Nigeria diets. Nutr. Reports Int. 26(4):679-688. Shaoping N, Huang J, Jiekin H, Yanag X, Sunan W, Chang L, Massimo
M, Mingyong X (2013). Effect of pH, temperature and heating time on the formation of furan in sugar-glycine model systems. Food Sci. Human Wellness 2(2):87-92.
Spracklen DV, Bonn B, Carslaw KS (2008). Boreal forests, aerosols and the impacts on clouds and climate. Philosophical Transactions Royal Society A, 366 (1885): 461326. Bibcode: 2008RSPTA.366.4613S.
Takakura Y, Osanai H, Masuzawa T, Wakabayashi H, Nishimura T (2014). Characterization of the key aroma compounds in pork soup stock by using an aroma extract dilution analysis. Biosci. Biotech. Biochem. 78(1):124-129.
Tamanna N, Mahmood N (2015). Food processing and Maillard reaction products: Effect on Human Health and Nutrition. Int. J. Food Sci. (2015): ID526762, 6 pages.
Teranishi R (1989). Trends and Development. Washington, DC: Am. Chem. Soc. P 682.
Vistoli G, De Maddis
D, Cipak A, Zarkovic N, Carini M, Aldini G
(2013).
Advanced glycoxidation and lipoxidation end products (AGEs and ALEs): an overview of their mechanisms of formation. Free Rad. Res. 47(1): 3-27.
Van Der Sluis AA, Dekker M, Skrede G, Jongen WM (2002). Activity and concentration of polyphenolic antioxidant in apple juice. 1. Effect of existing production methods. J. Agric. Food Chem. 50(25):7211-7219.
Weenen H (1998). Reactive intermediates and carbohydrate

312 Afr. J. Food Sci.
fragmentation in Maillard chemistry. Food Chem. 62(4):393-401. Whitfield FB (1992). Volatiles from interactions of Maillard reactions and
lipids. CRC Crit. Rev. Food Sci. Nutr. 31:1-58 Yaylayan VA (2003) Recent advances in the chemistry of Stecker
Degradation and Amadori rearrangement: Implications to Aroma and Colour formation. Food Sci. Technol. Res. 9(1):1-6.
Zhang Y, Yam-Bin X, Feng-Lian L (2012). Analysis of volatile
compounds in duck soup by SPME-GC-MS. J. Food Sci. 33(6):225-231.

Vol. 10(11) pp. 313-319, November 2016
DOI: 10.5897/AJFS2016.1422
Article Number: 8498B9660707
ISSN 1996-0794
Copyright © 2016
Author(s) retain the copyright of this article
http://www.academicjournals.org/AJFS
African Journal of Food Science
Full Length Research Paper
Chemical, functional, rheological and sensory properties of amaranth flour and amaranth flour
based paste
Tanimola A. R.1*, Otegbayo B.1and Akinoso R. 2
1Department of Food Science and Technology, Bowen University, Iwo, Osun State, Nigeria.
2Department of Food Technology, University of Ibadan, Nigeria.
Received 30 January, 2016; Accepted 15 July, 2016
Amaranth flour was prepared from amaranth grains, and the chemical, functional and rheological properties were investigated by standard methods, as well as the sensory attributes of the resulting amaranth flour based paste. The results of the proximate composition showed that amaranth flour has a protein content of 14.60%, crude fat content of 8.28%, ash content of 1.87%, total carbohydrate of 71.09% and a food calorific value of 417.28 kcal. Mineral analysis showed that the amaranth flour has 6.27 mg/100 g of Zn, 5.96 mg/100 g of Mn, 18.23 mg/100 g of Mg, 11.00 mg/100 g of Fe and 33.29 mg/100 g of Ca. The amylose and amylopectin content was 18.62% and 81.38% respectively. Pasting characteristics showed the Peak viscosity of amaranth flour to be 120.5 RVU. The color parameters of the flour and it resulting paste has the L* value to be 71.26 and 41.98 respectively and the brown index to be 28.74 and 58.02 respectively. Functional properties of the amaranth flour in terms of it water absorption capacity, swelling index, solubility, dispersibility and reconstitution index, showed it suitability for paste, as well as its acceptance in terms of appearance, smoothness, taste, aroma and overall acceptability. The properties of amaranth flour indicate its suitability for use as a substitute for other flour based paste commonly consumed by Nigerians as a staple food, in addition with its high nutritional value, which can help contribute to nutrition and food security in Nigeria. Key words: Amaranth flour, paste, chemical properties, functional properties, sensory attributes.
INTRODUCTION Grains have generally been classified as either cereal or legume grains. However, seeds of some vegetable for example, amaranth are gaining popularity in some countries because of their high nutritional value and properties which can be used in place of cereals. These
seeds are classified as pseudocereals. Pseudocereals are seeds or fruits of plants consumed as cereal grains, but are not derived from grasses. The pseudocereals are also included in the list of grains recognized by the International American Association of Cereal Chemists as
*Corresponding author. E-mail: [email protected]. Tel: +2348057203218.
Author(s) agree that this article remains permanently open access under the terms of the Creative Commons Attribution
License 4.0 International License

314 Afr. J. Food Sci. cereals (Gordon, 2006).
Amaranth originated in the Americas, and has been cultivated for more than 8,000 years (Yarger, 2008). Amaranthus L. Species contains about 60 varieties on the American continent, and the most important varieties are: Amaranthus caudatus, Amaranthus hypochondriacus and Amaranthus cruentus (Kram and Szot, 1999). The seeds are small and mostly spherical, and are majorly classified as grain-type or vegetable-type seeds. The seed of the grain type has a pale colour, varying from off-white to pale pink, while the seed of the vegetable type is black and shiny; both types are edible and may be used as flour sources (Yarger, 2008). The seeds have been reported to be drought tolerant and highly adaptable to the tropics as a potential crop for improving food availability and food security in sub-Saharan Africa (Piha, 1995).
Amaranth grains can be popped like pop corn, or milled into flour (Ronoh et al., 2009; Yarger, 2008). Its high protein content, reported to be about 16 to 18% has attracted increasing interest by the international community (Ronoh et al., 2009), and its relatively well established essential amino acid patterns predict its high protein quality (Mugalavai, 2013). Amaranth protein is rich in lysine (exogenous amino acids), contains significant amounts of iron, calcium, B vitamins, vitamin A, E and C (Kram and Szot, 1999). Mburu et al. (2012) developed a complementary food based on Kenyan Amaranth grain, which had good amount of tocopherol which is important for infant growth and development; thiamine, riboflavin and pyridoxine. The environmental adaptability and nutritional composition of amaranth grain are quality attributes that can be used to attract and promote the utilization of the grain in Nigeria, especially by the vulnerable groups (women and children), to help sustain nutrition security.
In Nigeria, flour based paste is consumed as an important part of the diet. This is prepared by continuous mixing flour in boiling water to make a stretchable paste, which can be eaten with various soups. This is commonly prepared from yam flour, wheat flour, garri or cassava paste. Many researches have been carried out, and are still on-going, with efforts to make available more varieties of flour, as whole or composite flour, for use as a paste, and most importantly improve the nutritional qualities of the resulting paste (Adegunwa et al., 2014; Jimoh and Olatidoye, 2009; Karim et al., 2013; Abioye et al., 2011)
There have been studies on potential use of amaranth grains for composite bread, complementary food (Mburu et al., 2012), popped corn (Yarger, 2008) and some others. However, the potential of amaranth flour as a paste has not been investigated. The study investigates the rheological, functional and chemical properties of grain amaranth flour; and also evaluates the sensory attributes of the amaranth flour based paste, as alternatives to common paste commonly consumed in
Nigeria. MATERIALS AND METHODS A. cruentus L. grains used for this research work was obtained from National Horticultural Research Institute (NIHORT), Idi-ishin, Ibadan, Oyo State, Nigeria. Preparation of grain amaranth flour The amaranth grain seeds were properly cleaned, winnowed and sorted manually for removal of stones, sand and all forms of dirt. The grains were then finely ground using a disc attrition mill (Agrico Model, 0912293, Ibadan, Nigeria) followed by sieving. The flour was packaged in a well-sealed low density polyethylene bag. Chemical composition determination The proximate composition of the amaranth grain flour was determined using AOAC (2005) method for moisture content, crude fat content, ash content and crude protein content. The total carbohydrate was determined by difference (Low, 2002). The energy value of the amaranth grain flour was determined using the bomb calorimeter model method of Passmore and Eastwood (1986). All analyses were carried out in triplicates.
The mineral contents were analysed using AOAC (2005). Using dry ashing, the sample was ashed at 550°C for 3 h. 5 ml of 6N HCl was mixed with the ash and made up to 50 ml with distilled water. Selected minerals including iron (Fe), calcium (Ca), magnesium (Mg), manganese (Mn) and zinc (Zn) were determined by atomic absorption spectrophotometer.
Amylose and amylopectin content were determined using the method of Hoover and Ratnayake (2002). The method of Mbaeyi-Nwaoha and Onweluzo (2013) was used to determine the pH of the flour sample. Functional properties determination
The amaranth flour sample was analyzed for water and oil absorption capacity (Sosulski et al., 1976), Loose and packed bulk density (Asoegwu et al. (2006), swelling index and solubility (Leach et al., 1959 and Kaur et al., 2011), dispersibility (Armstrong et al., 1979), Emulsifying Capacity and Emulsion Stability (Yatsumatsu et al., 1972) and reconstitution index (Makinde and Ladipo, 2012).
The pasting properties of the amaranth flour were determined with the use of a Rapid Visco Analyzer (RVA). The parameters assessed include: pasting temperature, peak time, set back, final viscosity, trough (holding strength) and peak viscosity, which were read using thermocline for windows software connected to a computer, from the pasting profile (Newport Scientific, 1995). Colour parameters determination
The colour parameters of the samples were measured using chroma meter (Color Tec PCMTM Color Tec Associates, Konica Minolta sensing, Inc., Japan). The colorimeter was standardized with a white paper and a black object (Lui-ping et al., 2005). The parameters recorded were *L, *a and *b coordinates of the CIE scale. *L (lightness) axis – 0 is black, while 100 is white; *a (red-green) axis – positive values are red while negative values are green and 0 is neutral; *b (yellow-blue) axis – positive values are yellow, while negative values are blue and 0 is neutral. From the

Table 1. Chemical composition of Amaranth grain flour.
Chemical component Amaranth grain flour (%)
Crude protein content (%) 14.60±0.13
Moisture content (%) 4.17±0.28
Crude fat content (%) 8.28±1.05
Ash content (%) 1.87±0.04
Total carbohydrates (%) 71.09±1.32
Energy (kcal) 417.28
Amylose (%) 18.62
Amylopectin (%) 81.38
pH 5.90 ± 0.10
*Results show means of triplicates ± standard deviation.
data obtained, deltaChroma (ΔC), colour intensity (ΔE) and hue angle were calculated using Eqs. i, ii and iii, respectively (Hunt, 1991), and the brown index (BI) using Eq iv (Babajide et al., 2006).
sΔC = √( ) ( ) (1)
ΔE = √( ) ( ) ( ) (2)
Hue angle Tan-1
(3)
BI = 100 – L* (4) Sensory evaluation The amaranth flour was reconstituted into paste using about 50 g of flour and 150 ml of boiling water. This was thoroughly stirred with a wooden spoon for smooth consistency, covered and cooked for about 5 minutes, stirred and wrapped in polyethylene and then kept in a Styrofoam box prior to sensory evaluation. A control was prepared from wheat flour, using the same preparation method described above. The evaluation was carried out by twenty panelists selected from people conversant with the consumption of pastes. The panelists evaluated the samples using questionnaires for scoring the sensory attributes of appearance, smoothness, taste, aroma and overall acceptability on a 9-point hedonic scale, presented to them in an environment with no interference for bias expression, and under bright lighting. RESULTS AND DISCUSSION Chemical properties of amaranth grain flour The protein content of amaranth grain flour was 14.60% (Table 1) which showed a high level of protein as compared with most other flour used for making paste. Such include: 4.28 – 6.11% protein content reported for yam flour (used for amala) by Ojokoh and Gabriel (2010) and 1.8% by Oyeyiola et al. (2014). Karim et al. (2015) also reported 3.52% for plantain flour, a range of 4.54 - 8.40% for soy-plantain flour blends (Abioye et al., 2011) and also a range of 5.73 – 8.46% for moringa fortified yam flour (Karim et al., 2013). The protein content of the
Tanimola et al. 315 amaranth grain flour is comparable to earlier studies on amaranth grain, 13.57% (Kunyanga et al., 2013) and 14.44% (Njoki et al., 2014). The high protein content of amaranth flour shows that it could be a cheap source of nutrients in a developing country like Nigeria. Moreover, the reconstitution of the amaranth flour to paste may be said to increase its protein quality, according to previous research on effect of thermal processing on amaranth nutritive value. The protein quality of amaranth grain processed by extrusion cooking increased from 17 to 18.1% This increase in its nutritive value was probably because it contains heat-labile growth inhibitors, increase in dry matter or that heat processing increases nutrient availability (Mendoza and Bressani, 1987).
The moisture content of the amaranth flour was determined to be 4.17% (Table 1), which is in the range of acceptable limit for shelf life stability of dry products (Kayisu et al., 1981), hindering the growth of microorganisms. The amaranth flour had a crude fat content of 8.28%, which is similar to that of soy-plantain flour blend (7.05%) for paste (Abioye et al., 2011). This could be said to have a significant effect in contributing to the flavor and palatability of the resulting dough, since dietary fats have a role of increasing food palatability by absorbing and retaining flavors (Lindsay, 1996). The flour had an ash content of 1.87% (Table 1), comparable to amaranth grain grown in Uganda, 2.85% (Muyonga et al., 2008) and similar to that of yam flour, 1.74% (Karim et al., 2013). The total carbohydrate content (71.09%) of amaranth grain flour is similar to that of yam flour observed by Ojokoh and Gabriel (2010) (78.20%) and Oyeyiola et al. (2014). The food calorific value of the amaranth flour was calculated to be 417.28 kcal (Table 1), which could be said to be balance enough to meet the energy requirement of an adult. Similar results were obtained for plantain flour, 384.33 to 394.09 Kcal (Oluwalana and Oluwamukomi, 2011).
The results showed the amylose content and amylopectin content of amaranth grain flour to be 18.62 and 81.38% respectively (Table 1). The amylose fraction in amaranth grain was high when compared with the fraction obtained for white trifoliate yam and yellow trifoliate yam flour (15.38 and 15.51%) (Abiodun and Akinoso, 2014). Amylose content has been observed to have a high effect on the swelling power, viscosity, solubility, pasting and other textural qualities of starchy foods (Otegbayo et al., 2013; Satin, 1998 According to Otegbayo et al. (2011), swelling power increases as amylose content is lowered, implying that the amylose content observed in amaranth flour indicates lower swelling power than white and yellow trifoliate yam flour (Abiodun and Akinoso, 2014) and most other yam flour and starches (Oke et al., 2013; Wireko-Manu et al., 2011). The pH of the amaranth grain flour was 5.90 showing that the amaranth flour is slightly acidic.
Amaranth grain flour has mineral contents of 6.27 mg/100 g for Zinc, 5.96 mg/100 g for manganese, 18.23

316 Afr. J. Food Sci.
Table 2. Mineral composition of Amaranth grain flour.
Minerals Amounts (mg/100 g)
Zn 6.27
Mn 5.96
Mg 18.23
Fe 11.00
Ca 33.29
Table 3. Functional properties of Amaranth grain flour.
Functional parameter Proportion
Water absorption capacity (g/g) 1.60 ± .04
Loose bulk density (g/cm3) 0.45 ± 0.00
Packed bulk density (g/cm3) 0.57 ± 0.00
Swelling index 7.76 ± 0.03
Solubility (%) 6.53 ± 0.81
Dispersibility (%) 14.92 ± 0.25
Reconstitution index (ml/g) 0.40 ± 0.02
Emulsion capacity 0.09 ± 0.01
Emulsion stability 0.07 ± 0.01
*Results show means of triplicates ± standard deviation.
mg/100 g for magnesium, 11.00 mg/100 g for iron and 3.39 mg/100 g for calcium (Table 2). The iron content is five times higher than the one in soy plantain flour, but with similar calcium content (Abioye et al., 2011). Minerals are necessary for normal cellular activity and growth. The results showed that amaranth grain flour can be utilized as a good source of micronutrient to meet the need of the vulnerable groups in Nigeria. Functional properties of amaranth grain flour
The water absorption capacity of amaranth grain flour was determined to be 1.60 g/g (Table 3). Water absorption capacity is the ability of the flour to associate with water under a condition where water is limiting, which is mainly dependent on proteins at room temperature (Otegbayo et al., 2013), and to a lesser extent on starch and cellulose. This relationship is shown in the water absorption capacity (80.05 to 86.50 %) of soy-plantain flour (Abioye et al., 2011) which has lower protein content than amaranth grain flour. The degree of association of starch granules in different flour samples could also cause variation in water absorption capacity (Falade and Kolawole, 2011; Abiodun and Akinoso, observed to be 0.45 g/cm
3 and 0.57 g/cm
3 respectively
Table 4. Pasting properties of Amaranth flour.
RVA parameters Amaranth flour
Peak viscosity (RVU) 120.5 ± 1.00
Trough viscosity (RVU) 112.1 ± 1.15
Breakdown viscosity (RVU) 8.5 ± 1.00
Final viscosity (RVU) 132.2 ± 3.05
Setback viscosity (RVU) 201.4 ± 1.15
Peak time (min) 5.90 ± 0.03
Pasting temperature (°C) 81.47 ± 0.03
*Results show means ± standard deviation.
(Table 3). An understanding of this is useful in determining the packaging requirement, application in wet processing and material handlings of flours (Adebowale et al., 2008). In comparism with other flour for paste preparation, these values are similar to the one observed by Abioye et al. (2011) for soy-plantain flour (0.42 – 0.46 g/cm
3), and higher than those observed by
(Oluwalana and Oluwamukomi, 2011) for plantain flour blanched at different temperature (0.159 – 0.420 g/cm
3).
When compared with yam flour (0.71 – 0.88 g/cm3), the
bulk density of the amaranth flour could be said to be lower, indicating a lesser packaging requirement than yam flour (Adebowale et al., 2008).
The swelling index and solubility of amaranth flour were determined to be 7.76 and 6.53% respectively (Table 3). These values are closely related to those of some other flour for paste: 7.48 – 7.96 swelling index and 6.31 – 6.83 solubility for soy-plantain flour (Abioye et al, 2011). However, the swelling index of trifoliate yam flour was observed to be 1.46 – 2.28 (Abiodun and Akinoso, 2014).The high swelling index of amaranth flour and soy-plantain flour could be as a result of their high protein content, as against that of yam flour. The solubility showed the rate and extent to which the components of the powder particles dissolve in water, which depends on the chemical composition and physical state of the product.
The reconstitution index and dispersibility of amaranth flour were observed to be 0.40 ml/g and 14.92% respectively (Table 3). Reconstitution index and dispersibility are temperature and particle size dependant (Igyor et al., 2011). Dispersibility is the ability of flour to be wet without the formation of lumps, with simultaneous disintegration of agglomerates. The importance of dispersibility is that it indicates the reconstitution ability of the sample (Otegbayo et al., 2013).
Pasting properties of amaranth flour The pasting properties of amaranth flour are shown in
Table 4. The term „pasting‟ is referred to as changes

Table 4. Pasting properties of Amaranth flour.
RVA parameters Amaranth flour
Peak viscosity (RVU) 120.5 ± 1.00
Trough viscosity (RVU) 112.1 ± 1.15
Breakdown viscosity (RVU) 8.5 ± 1.00
Final viscosity (RVU) 132.2 ± 3.05
Setback viscosity (RVU) 201.4 ± 1.15
Peak time (min) 5.90 ± 0.03
Pasting temperature (°C) 81.47 ± 0.03
*Results show means ± standard deviation.
in viscosity during gelation (Zeng et al., 1996), mainly dependent on the starch content of gelatinized food (Adeyemi and Beckley, 1986). The peak viscosity of the flour was 120.5 RVU, trough viscosity was 112.1 RVU, breakdown viscosity was 8.5 RVU, final viscosity was 132.2 RVU, setback viscosity was 201.4 RVU, peak time was 5.9 min and pasting temperature was 81.47°C. Amaranth flour had higher peak viscosity than blanched/soaked white and yellow trifoliate yam flour, 89.50 RVU and 84.08 RVU resp. but lower than those of the unblanched white and yellow trifoliate yam flour, 213.33 RVU and 173.50 RVU resp. (Abiodun and Akinoso, 2014). The peak viscosity points to the water binding capacity and viscosity of the flour sample (Abiodun and Akinoso, 2014), which also reflects the ability of starch granules to swell freely before been broken down physically (Wireko-Manu et al., 2011). The high pasting temperature of amaranth flour, 81.47°C (Table 4) implies longer cooking time, since the onset of rise in viscosity and gelatinization temperature is as a result of the pasting temperature (Otegbayo et al., 2013). The pasting temperature was similar to those of soy plantain mixes, 89.20-92.40°C (Abioye et al., 2011). In the food industry, pasting and gelatinization of flour or starch are important because they influence the texture, stability and digestibility of starchy foods. Hence need for their determination, because they influence the applications and output of flours and starches in various foods (Oke et al., 2013). Colour parameters of amaranth grain flour and paste
Table 5 provided an average evaluation of the colour characteristics of amaranth flour and paste in terms of the CIE tristimulus colour parameters, brown index, and calculated deltachroma (ΔE), colour difference (ΔC) and hue angle. These colour parameters are objective means of evaluating the colour characteristics of the flour and paste. The L* value of the flour (71.26) was higher than that of the paste (41.98) which was is as expected for flour colour the had a light colour and that of the paste,
Tanimola et al. 317
Table 5. Colour parameters of Amaranth grain flour and it reconstituted paste.
Sample Amaranth flour Amaranth paste
L* 71.26 ± 0.03 41.98 ± 0.38
a* 3.75 ± 0.01 4.44 ± 0.08
b* 17.24 ± 0.01 11.36 ± 0.15
Brown index 28.74 58.02
Tan -1 b/a 77.73 68.65
ΔE 23.05 8.56
ΔC 5.62 0.76
*Results show means of triplicates ± standard deviation..
was slightly brown. The „a*‟ and „b*‟ values were 3.75, 17.24 for flour and 4.44 and 11.36 for paste respectively. The brown index of the flour and paste were 28.74 and 58.02 respectively. Brown index shows the extent of discoloration and can be linked to the total phenols of the flour and paste (Babajide et al., 2006). The brown index of the flour increased in the paste during reconstitution as a result of the thermal degradation of the originally colourless complex phenols in the flour to coloured phenols in the paste (Akissoe et al., 2006). The colour of flour as well as that of the resulting dough has high influence on it acceptability. Sensory evaluation of amaranth flour based paste The sensory properties of the paste from amaranth flour and wheat flour (control) are presented in Table 6. The smoothness attribute of amaranth paste (7.05) and control paste (6.45) were closely related. However, the scores of appearance taste, aroma and overall acceptability were also similar. The control sample had the highest score in terms of appearance, smoothness, taste, aroma and overall acceptability, which could be as a result of familiarity of the panelists with the control sample which made a good number of them prefer it than the amaranth paste. However, amaranth paste also received acceptable scores in terms of all the sensory attributes, suggesting its acceptability and suitability for consumption. Conclusion
The chemical, functional and pasting properties of amaranth grain flour were comparable to those of other flour useful for making paste in Nigeria, as stated in literatures, with better protein content and some other functional properties. The sensory evaluation conducted showed moderate acceptability, which can be made better by increasing the awareness about the nutritional

318 Afr. J. Food Sci.
Table 6. Result of sensory evaluation.
Sample Control reconstituted paste Amaranth reconstituted paste
Appearance 7.15±0.81 6.25±1.48
Smoothness 7.05±1.20 6.45±1.80
Taste 7.20±1.36 5.50±1.28
Aroma 7.00±1.41 5.65±1.39
Overall acceptability 7.40±0.82 6.15±0.99
*Results show means of 20 panelists ± standard deviation.
value of the grain flour. The properties of amaranth grain flour showed its suitability for use as a substitute for other paste commonly consumed by Nigerians as a staple food, in addition with its high nutritional value, which can help contribute to nutrition and food security in Nigeria. Conflict of Interests
The authors have not declared any conflict of interest. REFERENCES
Abiodun OA, Akinoso R (2014). Textural and sensory properties of
trifoliate yam (Dioscorea dumetorum) flour and stiff dough „amala. J. Food Sci. Technol. 52(5):2894-2901.
Abioye VF, Ade-Omowaye BIO, Babarinde GO, Adesigbin MK (2011). „Chemical, physico-chemical and sensory properties of soy-plantain flour‟. Afr. J. Food Sci. 5(4):176-180.
Adebowale AA, Sanni, SA, Oladapo FO (2008). Chemical, functional and sensory properties of instant yam bread fruit flour. Niger. Food J. 26(1):2-12.
Adegunwa MO, Adebowale AA, Bakare HA, Ovie SG (2014). Compositional characteristics and functional properties of instant plantain-breadfruit flour. Int. J. Food Res. 1:1-7.
Adeyemi IA, Beckley O (1986). Effect of period of maize fermentation and souring on chemical properties and Amylograph pasting viscosity of ogi. J. Cereal Sci. 4:353-360.
Akissoe N, Akissoes C, Hounhouigan J, Nago, M (2006). Prediction of the sensory texture of a yam thick paste (amala) using instrumental and physicochemical parameters. J. Texture Stud. 37(4):393-402.
AOAC (2005). Official Methods of Analysis of the Association of Analytical Chemists, 18th Ed., Association of Analytical Chemists, Gathersburg, MD., USA.
Armstrong BI, Stanley DW, Maurice TJ (1979). Functionality and protein Structure. Ed. Akiva pour EL ACS Symposium series 92, American Chemical society, Washington. D.C.
Asoegwu SN, Ohanyere SO, Kanu OP, Iwueke CN (2006). Physical properties of African Oil Bean seed (Pentaclethra macrophylla). Agricultural Engineering International: the CIGR Ejournal, Manuscript FP 05 006. Vol. 8.
Babajide JM, Oyewole OB, Henshaw FO, Babajide SO, Olasantan FO (2006). Effect of local preservatives on quality of traditional dry yam slices „Gbodo‟ and its products. World J. Agric. Sci. 2(3):267-273.
Falade KO, Kolawole TA (2011). Effect of Irradiation Dose on Physical, Functional and Pasting Properties of Cowpea (Vigna Unguiculata [L.] Walp) Cultivars. J. Food Process Eng. 36(2):147-59.
Gordon E (2006) Analyzing the versatility and complexity of cereal grains. Food Sci. Newsl. 88:1-5.
Hoover R, Ratnayake WS (2002). Starch characteristics of black bean, chick pea,
lentil, navy bean and pinto bean cultivars. Food Chem. 78:489-498. Hunt RWG (1991). Measuring Colour. Ellis Horwood,New York, NY. 2nd
Ed. pp.75-76. Igyor MA, Yusufu PA, Sengev IA (2011). Functional and Sensory
Properties of fermented fura powder supplemented with soy. Niger. Food J. 29:113-121.
Jimoh KO Olatidoye OP, (2009). Evaluation of physicochemical and rheological characteristics of soybean fortified yam flour. J Appl. Biosci. 13:703-706.
Karim OR, Kayode RMO, Oyeyinka SA, Oyeyinka AT (2013). Proximate, Mineral and Sensory Qualities of „Amala‟ Prepared from Yam flour fortified with Moringa leaf powder. Food Sci. Qual. Manage. 12:10-23.
Karim OR, Kayode, RMO, Oyeyinka SA, Oyeyinka AT (2015). Physicochemical properties of stiff dough “amala” prepared from Plantain (musa paradisca) flour and moringa (moringa oleifera) leaf Powder, Hrana u zdravlju i bolesti, znanstveno-stručni časopis za nutricionizam i dijetetiku 4(1):48-58.
Kaur M, Oberoi DPS, Sogi DS, Gill BS (2011). Physicochemical, morphological and pasting properties of acid treated starches from different botanical sources. J. Food Sci. Technol. 48:460-465.
Kayisu K, Hood LF, Vansoest PJ (1981). Characterization of Starch and Fiber of Banana. Fruit J. Food Sci. 46:1885-1890.
Kram B, Szot B (1999). Aerodynamic and geometric properties of amaranth seeds. Int. Agrophys. 13:227-232.
Kunyanga CN, Imungi JK, Vellingri V (2013). Nutritional evaluation of indigenous foods with potential food-based solution to alleviate hunger and malnutrition in Kenya. J. Appl. Biosci. 67:5277-5288.
Leach HW, McCowen LD, Schoch TJ (1959). Structure of the Starch Granule: Swelling and Solubility Patterns of Various Starches. Cereal Chem. 36:534-544.
Lindsay RC (1996). Flavours. In. Fennema R. O., Karel M, Sanderson, G. W., Tannenbaum S. R., Walstra P., Witaker J. R. (eds). Food Chemistry, Marcel Dekker Inc. New York. pp. 611-612.
Low NH (2002). Carbohydrate Analysis. In. Introduction to the Chemical Analysis of Foods Nielsen SS. ed CBS Publishers and distributors, Daryaganj, New Delhi.
Lui-ping F, Min T, Gong-nian X, Jin-Cai, Qian T (2005). The optimization of vacuum frying to dehydrate carrot chips. Int. J. Food Sci. Technol. 40:911-919.
Makinde FM, Ladipo AT (2012). Physicochemical and Microbiological quality of sorghum-based complementary food enriched with soybean (Glycine max) and sesame (Sesamum indicum). J. Food Technol. 10(2):46-49.
Mbaeyi-Nwaoha IE, Onweluzo JC (2013). Functional Properties of Sorghum (S. Bicolor L.) - Pigeonpea (Cajanus cajan) Flour Blends and Storage Stability of a Flaked Breakfast Formulated from Blends. Pak. J. Nutr. 12(4):382-397.
Mburu MW, Gikonyo NK, Kenji GM, Mwasaru AM (2012). Nutritional and functional properties of a complementary food based on kenyan amaranth grain (Amaranthus cruentus). Afr. J. Food Agric. Nutr. Dev. 12:5959-5977.
Mendoza CM, Bressani R (1987). Nutritional and Functional Characteristics of Extrusion-cooked Amaranht Flour. Cereal Chem. 64(4):218-222.

Mugalavai VK (2013). Effect of Amaranth: Maize Flour Ratio on the
Quality and Acceptability of Ugali and Porridge (Kenyan Cereal Staples). ARPN J. Agric. Biol. Sci. 8(1):6-12.
Muyonga JH, Nabakabya D, Nakinbugwe DN, Masinde D (2008). Efforts to promote amaranth production and consumption in Uganda to fight malnutrition. International Union of Food Science & Technology, Chp. P 8.
Newport Scientific (1995). Operation Manual for the series 4 Rapid Visco Analyzer. Australia Newport Scientific Pty, Ltd, P 93.
Njoki JW, Sila DN, Onyango AN (2014). Impact of Processing Techniques on Nutrient and Anti-Nutrient Content of Grain Amaranth (A. albus). Food Sci. Qual. Manage. 25:10-17.
Ojokoh AO, Gabriel RAO (2010). A comparative study on the storage of yam chips (gbodo) and yam flour (elubo). Afr. J. Biotechnol. 9(21):3175-3177.
Oke MO, Awonorin SO, Workneh TS (2013). Effect of varieties on physicochemical and pasting characteristics of water yam flours and starches. Afr. J. Biotechnol. 12(11):1250-1256.
Oluwalana, IB, Oluwamukomi, MO (2011). Proximate composition, rheological and sensory qualities of plantain (Musa parasidiaca) flour blanched under three temperature regimes. Afr. J. Food Sci. 5(14):769-774.
Otegbayo B, Bokanga M, Asiedu R (2011) Physicochemical properties of yam starch: effect on textural quality of yam food product (pounded yam). J. Food Agric. Environ. 9(1):145-150.
Otegbayo BO, Samuel FO, Alalade T (2013). Functional properties of soy-enriched tapioca. Afr. J. Biotechnol. 12(22):3583-3589.
Oyeyiola GP, Oyeniyi OR, Arekemase MO Ahmed RN (2014). A comparative study on the microbiological and nutritional properties of stored chips and flours. World J. Biol. Res. 6(2):1-6.
Tanimola et al. 319 Passmore R, Eastwood WA (1986). Human Nutrition and Dietetics.
English Language Book Society, Churchill. UK. Piha MI (1995). Yield potential, fertility requirements, and drought
tolerance of grain amaranth compared with maize under Zimbabwean conditions. Trop. Agric. 72:7-12.
Ronoh EK, Kanali CI, Mailutha JT Shitanda D (2009). Modeling Thin Layer Drying of Amaranth Seeds under Open Sun and Natural Convection Solar Tent Dryer. Agricultural Engineering International: the CIGR Ejournal. Manuscript 1420. Vol. 11.
Satin M (1998). Functional properties of starches. In: Spotlight tropical starch misses market. AGSI report, Agriculture 21, FAO-Magazine, pp.1-9.
Sosulski FW, Humbert ES, Bui ES Jones JI (1976). Functional properties of rapeseed flours, concentrates and isolates. J. Food Sci. 41:1349-1351.
Wireko-Manu FD, Ellis WO, Oduro I, Asiedu R, Maziya-Dixon B (2011). Physicochemical and Pasting Characteristics of Water Yam (D. alata) in Comparison with Pona (D. rotundata) from Ghana. Euro. J. Food Res. Rev. 1(3):149-158.
Yarger L (2008). Amaranth grain and vegetable types. Echo Technical Note, 17391 Durance Road, North Fort Myers, FL 33917, USA.
Yasumatsu K, Sawad L, Moritaka LS, Mikasi SM, Wada MT, Ishi K (1972). Whipping and emulsifying properties of soybean products. Agric. Biol. Chem. 36:719-727.
Zeng M, Craig FM, Batey I, Wrigley CW (1996). Sources of variation for starch gelatinization, pasting, and gelation properties in heat. Cereal Chem. 74:63-71.

Vol. 10(11) pp. 320-326, November 2016
DOI: 10.5897/AJFS2016.1471
Article Number: 5CAB0F260709
ISSN 1996-0794
Copyright © 2016
Author(s) retain the copyright of this article
http://www.academicjournals.org/AJFS
African Journal of Food Science
Full Length Research Paper
Evaluation of dry matter, starch and beta-carotene content in orange-fleshed sweet potato (Ipomoea
batatas L.) genotypes tested in three agro-ecological zones of Malawi
D. M. Kathabwalika, E. H. C. Chilembwe and V. M. Mwale*
Lilongwe University of Agriculture and Natural Resources (LUANAR), Bunda College Campus, P.O.Box 219, Lilongwe, Malawi.
Received 31 May, 2016; Accepted 3 August, 2016
Evaluation of dry matter, starch, beta-carotene content and stability of eight orange-fleshed sweet potato genotypes was conducted at Bunda College in Malawi. Genotypes LU06/0527, LU06/0252, LU06/0428, LU06/0299, LU06/0258, BV/009, Kenya and Zondeni were evaluated. The genotypes were grown in three agro-ecological zones of Malawi namely Maseya in Chikhwawa District representing low altitude areas with hot climate; Bunda in Lilongwe District representing medium altitude with warm climate and Bembeke in Dedza District representing high altitude areas with cool climate. Harvested tubers were evaluated for dry matter, starch and beta-carotene content using spectrophotometry. Analysis of variance on the main effects between genotypes and environments as well as Interaction Principle Component Analysis (IPCA) for the residual multiplication interaction between genotypes and environments for beta-carotene content in the eight genotypes were conducted. Results showed significant differences in dry matter, starch and beta-carotene content among genotypes and across sites. Zondeni produced highest dry matter (34.4%) while BV/009 was the least (26.8%). Genotype LU06/0252 produced highest beta-carotene (6793.2 μg/100 g) followed by Zondeni (5620.9 μg/100 g). Beta-carotene content increased significantly with decreasing altitude and was highest at Maseya (4258.5 μg/100 g) followed by Bunda (3556.2 μg/100 g). Stability analysis showed that Kenya (SPN/O) was the most stable genotype in beta-carotene content across the sites. Bembeke was the most stable site while Maseya recorded highest beta-carotene content but was unstable site. Key words: Orange-fleshed sweet potato, agro-ecological zones, beta-carotene content, starch content, dry matter content.
INTRODUCTION Sweet potato (Ipomoea batatas L.) is an important root crop in sub-Saharan Africa (SSA) region and ranks
*Corresponding author. E-mail: [email protected].
Author(s) agree that this article remains permanently open access under the terms of the Creative Commons Attribution
License 4.0 International License

Kathabwalika et al. 321
Table 1. Description of locality and elevation in metres above sea level (masl) of the sites.
Study site Locality Average
temperature (°C) Soil type
Elevation (masl)
Average rainfall (mm/annum)
Maseya 16° 04’ S
34° 80’ E 29.5 Alfisols 200 600
Bunda 14° 12’ S
33° 46’ E 20.0 Lithosols 1200 1030
Bembeke 14° 35’ E
34° 43’ S 15.0 Lithosols 1600 1500
second after cassava in Malawi (Chipungu et al., 1999). Sweetpotato are mainly grown for human consumption and take different forms according to a particular locality. In Malawi, both roots and leaves are extensively utilized. Traditionally, peeled roots are boiled and groundnuts flour is added to produce local food product, futali. Sweet potato also forms part of the breakfast for the majority of both rural and urban dwellers in the country. Harvested leaves are also utilized as delicious relish when cooked after adding groundnuts flour.
Use of orange fleshed sweet potato (OFSP) has become a promising intervention in addressing vitamin A deficiency (VAD) which according to Kapinga et al. (2010) is at 32% level of the population in sub-Saharan Africa. This is mainly due to the fact that sweet potato already exists in consumer diets of most communities and OFSP have wide acceptance among women and children (Kapinga et al., 2010) who are at great risk of VAD (NSO, 2006).
Despite this potential, Malawi as a country faces challenges in successfully benefiting from OFSP. One of the major challenges is lack of improved varieties as the current literature indicates that over 95% of sweet potato produced in Malawi is white or cream fleshed (Chipungu, 2008). These varieties are also responsible for the low beta-carotene as well as dry matter contents (Brabet et al., 1999; Carey et al., 1999; Chipungu, 2009). It is against this background that a series of on-station and on-farm trials on elite orange fleshed sweet potato genotypes was conducted across the country to evaluate growth, yield stability as well as beta-carotene content (Chipungu, 2009; Kathabwalika et al., 2013).
However, there are contradicting findings on trend of beta-carotene content in OFSP grown at different altitudes. Studies conducted elsewhere have shown that an increase in altitude leads to subsequent increase in beta-carotene (Manrique and Hermann, 2000; Ndirigwe et al., 2007). On the other hand, beta-carotene content showed no clear trends with increasing or decreasing altitude in Tanzania (Mbwaga et al., 2007). Additionally, such studies have not been conducted in Malawi. Therefore, the aim of the study was to evaluate dry matter, starch and beta-carotene content in orange- fleshed sweet potato (Ipomoea batatas L.) genotypes in
three agro-ecological zones of Malawi. MATERIALS AND METHODS
Sites and farmers selection
The first phase of this study was conducted at three sites representing three different agro-ecological zones of Malawi. The sites were Bembeke in Dedza District representing the high altitude, cool and wet plateau zone, Bunda in Lilongwe District representing middle altitude warm plain zone and Maseya in Chikhwawa District representing low altitude hot and dry agro ecological zone (Table 1). Classification of the agro ecological zones was based on altitude, soil conditions, temperatures and amount of rainfall (Saka et al., 2006; Kathabwalika et al., 2013).
Three farmers were selected to carry out the study at each site within agro ecological zone. Planting and management of sweet potato genotypes were reported in the previous study by Kathabwalika et al. (2013). During harvesting, fifteen sweet potato tubers for each genotype were randomly sampled and collected from each farmer’s field in the three agro-ecological zones where the genotypes were grown. The samples were transported under cool conditions for laboratory analysis to reduce dehydration.
Sweet potato genotypes used
Eight promising orange fleshed sweet potato (OFSP) genotypes sourced from Kasinthula Agricultural Research Station namely. LU06/0299, LU06/0258, LU06/527, BV/009, LU06/0252, LU06/0428, Zondeni and Kenya, were selected for evaluation of their dry matter, starch and beta-carotene contents. Zondeni and Kenya, both released varieties, were used as checks for beta-carotene content. Table 2 shows descriptions of the genotypes.
Determination of dry matter, starch and β-carotene content
Dry matter content was determined by oven drying triplicates of 5 g samples at 80°C for 24 h and quantified as DM% = dry weight/fresh weight x 100 (Kwach et al., 2010; Yildirim et al., 2011). For beta-carotene content, five roots of each genotype were manually cut into small pieces of about 1 cm and mixed. The pieces were homogenized rapidly (2-3 min) to prevent enzymatic degradation of carotenoids. Celite and petroleum ether (PE) were used for extraction and partitioning of beta-carotene from prepared samples to get the filtrate (Rodriguez-Amaya and Kimura, 2004; Ukpabi and Ekeledo, 2009).
The filtrate for each sample was put in 1 x 1 cm cuvette and absorbance readings were taken at λ = 450 nm to determine beta-carotene content using UV/Vis spectrophotometer (Jenway 6405) and quantified as follows: beta-carotene (μg/100 g) = A x volume

322 Afr. J. Food Sci.
Table 2. Genotype source, growth habit, skin and flesh colours, maturity in months after planting (MAP) and potential yield (t/ha).
Genotype Female parent/source Growth habit Skin colour Flesh colour Maturity (MAP) *
Potential yield (t/ha)*
BV/009 LU96/374 Spreading Cream Deep orange 5 20-25
LU06/0252 Mafutha from RSA Spreading Purple Pale orange 5 25-30
LU06/0258 Kakoma (TIS 3017) from IITA Spreading Cream Yellow 5 20-25
LU06/0299 Kakoma (TIS 3017) Spreading Cream Yellow 5 20-25
LU06/0428 Mugamba (Mogamba, CIP, Nairobi) Spreading Cream Pale orange 3.5 30-35
LU06/0527 Kenya (SPN/O) Spreading Orange Orange 5 30-35
Kenya (SPN/O)
Introduced cultivar Semi-erect Cream Pale yellow 4 to 5 25-30
Zondeni
Local cultivar Erect Orange Deep orange 5 10-15
*Data obtained from on-station results during the initial stages of the genotypes evaluation
(ml) × 104/Ac × sample weight (g) where A is the absorbance, volume is the total volume of extract and Ac is the absorption coefficient of beta-carotene in petroleum ether (2592). For starch extraction, five raw tubers from each genotype were randomly sampled, washed clean and peeled. The peeled sweet potato samples were sliced with a knife and ground into small pieces after recording their initial weight. Thereafter, they were placed in a mixture of water and stirred for one to two minutes. The grinding process was repeated for three to four times till a homogenous suspension was obtained. The suspension was strained through fine cheesecloth into another beaker. Thereafter, the mixture was allowed to stand for few minutes and then the deposition of starch was noted at the bottom. The supernatant fluid was poured out and the beaker, containing the starch, was filled with water. The mixture was stirred well and allowed to settle. The process was repeated four to five times by separating starch that can be washed thoroughly. The compact white starch deposit was collected onto watch glass and dried in an oven. After weighing the sample gravimetrically, the amount was converted into percentage over the initial weight of the extracted potato sample.
Data analysis
Data was analyzed using Genstat 14th Edition statistical package where analysis of variance (ANOVA) was done on treatment means and Additive Main effects and Multiplicative Interaction (AMMI) model (Gauch, 1993) was
used to carry out stability analysis of beta-carotene content for the genotypes and environments.
RESULTS
Dry matter content
The interaction between genotype and environ-ment was significant (p<0.001) on root dry matter. Genotype LU06/0527 was the highest (34.4%) at Bunda, while BV/009 was the least (23.3%) (Table 3).
Genotype LU06/0428 was the highest at Bembeke with 34.1% followed by Zondeni with 33.7%, whereas Kenya was the lowest (27.5%).
The average dry matter content at Maseya was 28.6% with Zondeni being the highest with 35.4%, while LU06/0299 was the lowest with 22.5%. However, Zondeni consistently produced highest dry matter across sites with an average of 34.4%. Starch content
Starch content showed significant differences (p<0.05) across sites. Bembeke recorded the
highest percentage of starch (27.7%) followed by Bunda (22.4%), while Maseya had the lowest percentage (21.5%). Genotypes percentage and the interaction between sites and genotypes were not significantly different (p>0.05) (Table 4). Kenya recorded the highest starch content (27.3%) across the agro ecological zones while the lowest starch percentage (23.5%) was recorded in BV/009 and LU06/0252.
Beta-carotene content Beta carotene content was significantly different (p<0.001) across sites and among genotypes. Beta carotene was highest at Maseya (4258.5 μg/100 g) followed by Bunda (3556.2 μg/100 g), while Bembeke was the least (3104.2 μg/100 g). Genotype LU06/0252 was the highest (6793.2 μg/100 g) followed by Zondeni (5620.9 μg/100 g) and BV/009 (5066.9 μg/100 g) (Table 5).
Kenya variety was the lowest in beta-carotene content. The interaction between sites and geno-types was significant (p<0.001). Genotype LU06/0252 was the best performer at both Bunda and Bembeke, whereas BV/009 was the best at

Table 3. Dry matter (%) content of sweet potato genotypes across sites.
Genotype Site
Mean Bunda Bembeke Maseya
BV/009 23.3 31.7 25.5 26.8
LU06/0252 27.5 31.5 29.9 29.7
LU06/0258 31.2 31.5 23.5 28.7
LU06/0299 28.2 29.9 22.5 26.9
LU06/0428 26.2 34.1 32.8 31.0
LU06/0527 34.4 31.3 27.7 31.1
Zondeni 34.0 33.7 35.4 34.4
Kenya 33.7 27.5 31.5 30.9
Mean 28.8 31.4 28.6 30.0
Genotypes P<0.001 LSD 0.01
Sites P<0.001 LSD 0.01
G x E
CV (%)
P<0.001
5.2 LSD 0.03
Table 4. Starch content (%) of eight orange fleshed sweet potato genotypes across sites.
Genotype Site
Mean Bunda Bembeke Maseya
BV/009 24.6 28.4 17.6 23.5
LU06/0252 20.4 34.1 16.2 23.5
LU06/0258 24.5 25.8 25.3 25.2
LU06/0299 19.9 28.5 28.5 25.6
LU06/0428 20.1 26.9 15.6 20.9
LU06/0527 19.9 25.9 15.8 25.0
Zondeni 21.5 27.0 24.8 24.4
Kenya 28.5 25.3 28.2 27.3
Mean 22.4 27.7 21.5 23.9
Genotypes P= 0.45
Sites P= 0.01 LSD 0.04
G x E
CV (%)
P= 0.41
24.0
Maseya. On Maseya. On the other hand, Kenya was the least performer at Bunda and Maseya, while LU06/0299 performed poorly at Bembeke. Stability of beta-carotene content The variations due to genotypes, environment and interaction between genotype and environment accounted for 76.9, 15.2 and 7.9%, respectively, indicating that beta-carotene differences were mainly due to genotype (Table 6). The decomposition of interaction into principle components showed that IPCA1 and IPCA2 accounted for 78.1 and 21.9%, respectively, as such, IPCA1 was
Kathabwalika et al. 323
Table 5. Beta-carotene content (µg/100 g) of orange-fleshed sweet potato genotypes across the study sites.
Genotype Site
Mean Bunda Bembeke Maseya
BV/009 3441.3 4238.1 7521.3 5066.9
LU06/0252 7869.9 5941.5 6568.3 6793.2
LU06/0258 1480.7 1882.6 2695.1 2019.5
LU06/0299 1241.2 649.4 2578.4 1489.7
LU06/0428 6336.8 3234.3 3234.6 4235.2
LU06/0527 2160.5 3542.9 3674.4 3125.9
Zondeni 5452.5 4446.3 6963.8 5620.9
Kenya 467.0 898.3 932.2 765.8
Mean 3556.2 3104.2 4258.5 3639.64
Genotypes P<0.001 LSD 77.7
Sites P<0.001 LSD 47.6
G x E
CV (%)
P<0.001
2.3 LSD 134.6
used to explain the stability of beta-carotene. Genotypes LU06/0252, Zondeni, BV/009 and LU06/0428 contained higher beta-carotene than LU06/0258, LU06/0299, LU06/0527 and Kenya.
Genotypes LU06/0428 and LU06/0252 showed negative interactions while the rest had positive interactions (Figure 1). However, Zondeni, LU06/0527, LU06/0299 and LU06/ 0299 had low positive interactions than the rest of the genotypes. Kenya had IPCA score close to zero. Bembeke and Maseya showed positive interactions while Bunda had negative interaction. DISCUSSION
Results from this study indicated that dry matter content of most new genotypes, particularly LU06/0527, were comparatively similar to Kenya variety (a released check variety), hence suggesting their potential to be accepted by consumers. Dry matter content is an important quality parameter in sweet potato production as it indicates mealiness in the boiled or roasted sweet potato and is a property most preferred by consumers (Kathabwalika et al., 2013). The combination of high dry matter (>25 %) and starch helps in selection of cultivars (Brabet et al., 1999; Lebot, 2009). One of the major challenges for adoption of OFSP is their low dry matter content (Carey et al., 1999). These results also suggests that current breeding programmes which aim at producing OFSP with high dry matter are able to incorporate desirable traits. In this study, the highest beta-carotene content was produced at Maseya followed by Bunda and Bembeke. The beta-carotene trend could be attributed to prevailing environmental conditions in the study sites. Maseya is located at low altitude and is characterized by high temperatures, high nitrogen and organic matter levels.

324 Afr. J. Food Sci.
Table 6. Analysis of variance according to Additive Main effects and Multiplicative Interactions (AMMI) of beta-carotene (µg/100 g).
Source of variation Degree of freedom Sum of squares Mean square Variation (%)
Total 71 364781123.0 5137762.0
Genotypes (G) 7 288288827.0 41184118.0*** 76.9
Environment (E) 2 16240269.0 8120134.0*** 15.2
Reps (within E) 6 22761.0 3794.0
GxE interaction 14 59929311.0 4280665.0*** 7.9
IPCA1 8 49486262.0 6185783.0*** 78.1
IPCA2 6 10443050.0 1740508.0 21.9
Error 42 299954.0 7142.0
***Denotes significant at 1%.
Figure 1. Biplot of IPCA 1 scores against beta-carotene content (μg/100 g) for eight OFSP genotypes grown in three locations. Genotypes: G1=BV/009, G2=Kenya, G3=LU06/0252, G4=LU06/0258, G5=LU06/0299, G6=LU06/0428, G7=LU06/0527, G8=Zondeni.
Bembeke is at high altitude and is characterized by cold temperatures, high soil nitrogen content and low organic matter. Bunda is at medium altitude and is characterized by warm temperature, moderate soil nitrogen content and moderate organic matter. These results compare well with findings of Ukom et al. (2009) and Nedunchezhiyan et al. (2010) who reported that high nitrogen supply and organic matter increases beta-carotene content in OFSP.
Additionally, sweet potato is a tropical crop (Nedunchezhiyan et al., 2010), the high levels of beta-
carotene at Maseya were in agreement with Rodriguez-Amaya and Kimura (2004) who reported that high temperatures promote synthesis of carotenoids in tropical fruit crops. On the contrary, it is also reported that beta-carotene increases with increasing altitude (Mbwaga et al., 2007; Ndirigwe et al., 2007; Manrique and Hermann, 2000). The variations within genotypes would be a result of genetic make-up of the cultivars in the synthesis of carotenoids (Rodriguez-Amaya and Kimura, 2004). Some genotypes produce more beta-carotene than others due

to the differences in their genetic makeup. For example, LU06/0252 produced highest beta-carotene while Kenya consistently produced low levels of beta-carotene. In this study, the beta-carotene content values were comparatively similar to findings reported by Kapinga et al. (2010) where the OFSP cultivars grown in Eastern and Southern parts of Africa had values ranging from 5 000 to 10 000 µg/100 g.
Stability analysis of beta-carotene showed that Bunda and Maseya were favorable environments for genotypes LU06/0428 and BV/009, respectively while genotypes LU06/0299, LU06/0258 and Zondeni were moderately stable across sites. Kenya variety, though contain low beta-carotene, was the most stable among the genotypes. The differences in stability of genotypes could be attributed to variations in ability to utilize available resources such as temperature, light, soil nutrients and water. The results also revealed that Zondeni and Kenya, which had low tuber yield (Kathabwalika et al., 2013) and beta-carotene content, were most stable, suggesting that genotypes with low yields are not responsive to environmental changes. Differences in beta-carotene stability have also been reported elsewhere (Mbwaga et al., 2007; Ndirigwe et al., 2007; Manrique and Hermann, 2000). Among the production sites, Maseya had the overall highest beta-carotene content as indicated by its position found on the right side of the IPCA1 in the study. This site could, therefore, be suitable for selection of genotypes with high beta-carotene content (Egesi and Asiedu, 2002; Sanni et al. 2009; Tiawari et al. 2011 Mwale et al., 2009).
Conclusion
The study revealed significant differences in dry matter, beta carotene content and stability of OFSP genotypes. Dry matter is one of the most important quality aspects in sweet potato and in this study, most of the OFSP genotypes ranged between 25 and 30%. Beta-carotene content differed within genotypes and across production sites. Genotypes LU06/0252 and Zondeni consistently produced highest amounts of beta-carotene across sites, while Kenya consistently recorded the least amount. Furthermore, the study showed that beta-carotene increased with increasing temperature of the agro ecological zones, indicating that temperature, as one of the crucial environmental factors, should be considered when producing orange-fleshed sweet potato. The findings also indicate that Kenya variety was the most stable variety in beta-carotene content, while LU06/0258, LU06/0299 and Zondeni were moderately stable.
Conflict of interests The authors have not declare any conflict of interest.
Kathabwalika et al. 325 ACKNOWLEDGEMENT This work was funded by Agri-Food Systems Project under International Development Research Center (IDRC).
REFERENCES
Brabet C, Reynoso D, Dufour D, Mestres C, Arredondo J, Scott G
(1999). Starch content and properties of 106 Sweetpotato clones from the World Germaplasm collection held at CIP, Peru. International Potato Center program. Pp.279-286. http://cipotato.org/publications/program_reports/97_98/33starch.pdf.
Carey EE, Hagenimana V, Oyunga MA, Kosambo LS, Obwoya NEJM, Ocitti C, Turymureeba G, Low J (1999). Using orange-fleshed sweetpotato varieties to combat vitamin A deficiency and enhance market opportunities for smallholder farmers in Sub-Saharan Africa. In. M.O. Akoroda and J.M. Teri (Eds). Food Security and crop diversification in SADC countries: the role of cassava and sweetpotato. Proceedings of the scientific workshop of the Southern African Root Crops Research Network (SARRNET) held at Pamodzi Hotel, Lusaka, Zambia, 17-19th August 1998, Sl: SADC. Pp. 157-166.
Chipungu FP (2008). Ethno-botanic and genetic variations among sweetpotato accessions grown in Malawi. A PhD thesis. University of Malawi, Chancellor College, Zomba.
Chipungu FP, Benesi IRM, Moyo CC, Mkumbira J, Sauti RFN, Soko MM, Sandifolo V (1999). Field evaluation of introduced clones in Malawi. In. Akoroda MO, Teri JM (Eds). Food Security and crop diversification in SADC countries: the role of cassava and sweetpotato. Proceedings of the scientific workshop of the Southern African Root Crops Research Network (SARRNET) held at Pamodzi Hotel, Lusaka, Zambia, 17-19th August 1998. P.151.
Chipungu FP, Saka JDK, Ndolo V, Ambali AJD, Mahungu NM (2009). Soliciting farmers` concerns for breeding and increased adoption of orange fleshed sweet potato varieties in Malawi. In. Tropical Roots and Tubers in a Changing Climate: A critical opportunity for the World. 15th Triennial Symposium of the International Society for Tropical Root crops, CIP. Pp. 156-157.
Egesi CN, Asiedu R (2002). Analysis of yam yields using the additive main effects and multiplicative interaction (AMMI) model. Afr. Crop Sci. J. 10(3):195-210.
Gauch HG (1993). MAT MODEL Version 2.0: AMMI and related analysis for two-way data matrices. Micro computer Power, Ithaca, NY. P. 59.
Kapinga R, Tumwengamire S, Ndunguru J, Andrade MI, Agili S, Mwanga ROM, Laurie S, Dapaah H (2010). Catalogue of orange-fleshed sweet potato varieties for Sub-Saharan Africa. International Potato Center (CIP), Lima, Peru. P. 40.
Kathabwalika DM, Chilembwe EHC, Mwale VM, Kambewa D, Njoloma JP (2013). Plant growth and yield stability of orange fleshed sweet potato (Ipomoea batatas) genotypes in three agro-ecological zones of Malawi. Int. Res. J. Agric. Sci. Soil Sci. 3(11):383-392
Kwach JK, Odhiambo GO, Dida MM, Gichuki ST (2010). Participatory consumer evaluation of twelve sweetpotato varieties in Kenya. Afric. J. Biotechnol. 9(11):1600-1609.
Lebot V (2009). Tropical root and tuber crops: cassava, sweet potato, yams and aroids, CABI, Oxfordshire, UK. Pp. 91-274.
Manrique K, Hermann M (2000). Effect of GxE interaction on root yield and beta-carotene content of selected sweet potato (Ipomoea batatas (L) Lam) varieties and breeding clones. In: CIP program report. Pp. 281-287.
Mbwaga Z, Mataa M, Msabaha M (2007). Quality and yield stability of Orange-fleshed sweet potato (Ipomoea batatas (L)) grown in different Agro-ecologies. Afr. Crop Sci. Conf. Proc. 8:339-345
Mwale VM, Bokosi JM, Masangano CM, Kwapata MB, Kabambe VM, Miles C (2009). Performance of climber common bean (Phaseolus vulgaris L.) lines under Reseaercher Designed Farmer Managed (RDFM) system in three bean agro-ecological zones of Malawi. Afr. J.

326 Afr. J. Food Sci.
Biotechnol. 8(11):2460-2468. Nedunchezhiyan M, Byju G, Dash SN (2010). Effects of organic
production of orange fleshed sweetpotato (Ipomoea batatas [L.]) on root yield, quality and soil biological health. Int. Res. J. Plant Sci. 1(6):136-143.
Ndirigwe J, Tukamuhabwa P, Kapinga R, Ndayemeye P (2007). Performance of yellow and orange fleshed sweet potato in three agro-ecological zones of Rwanda. In. Mahungu, N.M. and Manyong, V.M. (Eds.). Advances in Root and Tuber Crops Technologies for Sustainable Food security, Improved Nutrition, Wealth Creation and Environmental Conservation in Africa. Proceedings of 9
th ISTRC-AB
Symposium, Mombasa, Kenya, 1-5 November 2004. Pp. 462-476. National Statistical Office (NSO) (2006). Multiple Indicator Cluster
Survey, Zomba, Malawi. Rodriguez-Amaya DB, Kimura M (2004). Harvest Plus handbook for
carotenoid analysis; Harvestplus Technical Monograph 2. Washington D.C. and Cali, Columbia. P. 3.
Saka AR, Mtukuso AP, Daudi AT, Banda MHP, Mwenda ARE, Phiri IMG (2006). A description of agricultural technologies used by farmers in Malawi. Department of Agricultural Research Services, Lilongwe, Malawi. P. 154.
Sanni KA, Ariyo OJ, Ojo DK, Gregorio G, Somado EA, Sanchez I, Sie
M, Futakuchi K, Ogunbayo SA, Guei RG, Wopereis MCS (2009). Additive main effects and multiplicative interactions (AMMI) analysis of grain yield performances in rice genotypes across environments. Asian J. Plant Sci. 8:48-53.
Tiawari DK, Pandey P, Singh RK, Singh SP, Singh SB (2011). Genotype x Environment interaction and stability analysis in elite clones of sugarcane (Saccharum officinarum L.). Int. J. Plant Breed. Genet. 5:93-98.
Ukom AN, Ojimelukwe PC, Okpara DA (2009). Nutrient composition of selected sweetpotato [Ipomoea batatas (L.)] varieties as influenced by different levels of nitrogen fertilizer application. Pak. J. Nutr. 8(11):1791-1795.
Ukpabi UJ, Ekeledo EN (2009). Feasibility of using orange-fleshed sweet potato as an alternative to carrot in Nigerian salad preparations. Agric. J. 4(5):216-220.
Yildirim Z, Tokusoglu O, Ozturk G. (2011). Determination of sweetpotato [Ipomoea batatas (L.)] genotypes suitable to the Aegean region of Turkey. Turk. J. Field Crops 16(1):48-53.

Vol. 10(11) pp. 327-332, November 2016
DOI: 10.5897/AJFS2016.1472
Article Number: F30F4C160711
ISSN 1996-0794
Copyright © 2016
Author(s) retain the copyright of this article
http://www.academicjournals.org/AJFS
African Journal of Food Science
Full Length Research Paper
Volatile compound analysis of the leaves and seeds of Piper guineense using gas chromatography-mass
spectrometry (GC-MS)
Ojinnaka, M. C.1*, Ubbor, S. C.1, Okudu, H. O.2 and Uga, U.1
1Department of Food Science and Technology, Michael Okpara University of Agriculture, Umudike, Abia State, Nigeria.
2Department of Nutrition and Dietetics, Michael Okpara University of Agriculture, Umudike Abia State, Nigeria.
Received 31 May, 2016; Accepted 5 August, 2016
The volatile compounds in the leaves and seeds of Piper guineense plant from South East Nigeria, were investigated using gas chromatography-mass spectrometry (GC-MS). The analysis was carried out to identify the compounds responsible for the characteristic flavor of the flavouring spices. A total of thirty-three volatile constituents were identified in the leaves and seeds of Piper guineense using GC-MS. The major compounds identified include acids, esters, alcohols, hydrocarbons and others. Acids were found to be the predominant constituent group followed by esters. The leaves and seeds of Piper guineense had acids in the values of 65.56 and 53.72%, respectively. The esters were also found to be more in the leaves (25.63%) than in the seeds (5.22%) of P. guineense. The hydrocarbons identified appeared more in the seeds (11.47%) of P. guineense. The monoterpene (beta-myrcene) and sesquiterpenes (aromadendrene, trans-alpha-bergamotene, copaene) hydrocarbons identified were also present in the seeds than in the leaves of the P. guineense. Gamma-elemene, a sesquiterpene were identified in both the leaves and seeds of P. guineense at the same retention time of 10.242 min but at different concentrations of 0.41 and 0.72%, respectively. Key words: Piper guineense, volatile compounds, leaves, seeds.
INTRODUCTION P. guineense is a spice plant from the family, Piperaceae and from the genus piper. The genus Piper is made up of about 1050 species of tropical shrubs, lianas, and small trees, many of which are important as spices and flavoring agents and medicines (Owolabi et al., 2013; Mabberley, 2008). P. guineense is a climbing plant that can grow up to 20 m in length. The seeds are smooth
and are prolate-elliptically shaped. The seeds of the plant are commonly known in English-speaking countries as “West African black pepper”, “uziza” in Igbo “iyeree” in Yoruba and “poivrie” in French. West African black pepper (Piper guineense) is an important plant used in traditional medicine and as spice. The fruits (the part of the plant traditionally used) are rich in a wide range of
*Corresponding author. E-mail: [email protected].
Author(s) agree that this article remains permanently open access under the terms of the Creative Commons Attribution
License 4.0 International License

328 Afr. J. Food Sci. natural products including volatiles oils, lignans, amides, alkaloids, flavonoids and polyphenols (Rodolfo et al., 2013). The leaves and seeds are usually sold in Nigerian markets as an edible medicinal plant or additive in foods to offer aroma and flavor.
The seeds, leaves and sometimes the stems are used in preparing soup. It imparts “heat” and a spicy pungent aroma to food. The medicinal properties of P. guineese exert bacteriostatic and bacteriocidal effects on some bacteria.The leaves are considered aperitive, carminative and eupeptic. They are also used for the treatment of cough, bronchitis, intestinal disease and rheumatism (Okoye and Ebeledike, 2013; Sumathykutty et al., 1999).The leaves are also used for female infertility while, the fruits are used as an aphrodisiac (Echo et al., 2012). P. guineense has culinary, medicinal, cosmetic and insecticidal uses (Nwinyi et al., 2013; Okwute, 1992). The powder obtained from the ground seeds is used for its stimulating properties (Tchoumbougnang et al., 2009; Sofowora, 1982). P. guineense is added to food meant for pregnant and nursing mothers as a medicinal spice and among the post partum women, it is claimed that it assists in the contraction of the uterus (Achinewhu et al., 1995). Okoye and Ebeledike (2013) reported that the leaf extracts of P. guineese have antimicrobial effect on some test organisms. The leaf extracts exhibited antimicrobial effect activity due to the presence of tannins, saponins, flavonoids and alkaloids (Rabe and Vonstanden, 1987). The essential oils of P. guineense from Cameroon (Tchoumgougnang et al., 2009) and from Nigeria (Oyedeji et al., 2005) have also been studied.
Monoterpenes,sesquiterpenes and benzenoids(e.g. dildillapiole and myristicin) have been identified as the main compounds in P. guineense. In addition to their importance as a spice and for the flavoring of food products, this Piper species is also used in traditional African medicine, because of its various pharmacological effects (e.g. antimicrobial, insecticidal, anticonvulsive, antihypertensive, sedative and tranquillizing activities (Jirovetz et al., 2002). An investigation of the volatile compounds that contribute to the flavor characteristics of P. guineense from South East Nigeria by means of GC-MS has not been performed previously.Therefore, the objective of this study was to identify the entire volatile compounds of the leaves and seeds of P. guineense responsible for the characteristic aroma of these natural flavourings and spices and to compare the volatile constituents in the leaves and seeds of the P. guineense plant. MATERIALS AND METHODS The seeds and leaves of P. guineense were purchased from Umuahia modern market, Urbani Ibeku Abia State, Nigeria. The leaves and seeds of P. guineense were separated from the stem, sorted to remove debris. The leaves and seeds were washed separately and oven dried at 65°C for 4 h and milled into powder before further analysis.
Table 1. Percent composition of the different volatile compounds identified in the leaves and seeds of Piper guineense (%).
S/N Compounds Samples (%)
Uziza leaves Uziza seeds
1 Acids 65.56 53.72
2 Esters 25.63 5.22
3 Alcohol - 1.90
4 Hydrocarbons 6.96 11.47
5 Others 1.88 27.66
Determination of volatile compounds using gas chromatographic-mass spectral analysis
GC-MS analysis was carried out on a GC Clarus 500 Perkin Elmer system comprising of a AOC-20i auto- sampler and gas chromatograph interfaced to a mass spectrometer (GC-MS) instrument employing the following conditions: column Elite-1 fused silica capillary column (30 x 0.25 mm ID x 1 μM df, composed of 100% dimethylpoly diloxane), operating in electron impact mode at 70 eV; helium (99.999%) was used as carrier gas at a constant flow of 1 mL/min and an injection volume of 0.5 μL was employed (split ratio of 10:1) injector temperature 250°C; ion-source temperature of 280°C. The oven temperature was programmed from 110°C (isothermal for 2 min), with an increase of 10°C/min, to 200°C, then 5 C/min to 280°C, ending with a 9 min isothermal at 280°C. Mass spectra were taken at 70 eV; a scan interval of 0.5 s and Fragments from 40 to 450 Da. Total GC running time was 36 min. N/B: Before GC-MS analysis, the plant is subjected to cold extraction process using ethanol as the solvent.
Identification of components
Interpretation on mass spectrum GC-MS was conducted using the database of National Institute Standard and Technology (NIST) having more than 62,000 patterns. The spectrum of the unknown component was compared with the spectrum of the known components stored in the NIST library. The name, molecular weight and structure of the components of the test materials were ascertained. RESULTS AND DISCUSSION
The volatile compounds of the leaves and seeds of P. guineense analyses using GC-MS are shown in Tables 1 and 2. The gas chromatogram showed the relative concentrations of various compounds getting eluted as a function of retention time (Figures 1 and 2). The heights of the peak indicate the relative concentrations of the compounds of the components present in the plant extract (Negbenebor et al., 1999). A total of thirty-three volatile constituents were identified in the leaves and seeds of P. guineense. The compounds which were identified by GC-MS analysis were twenty-two for the leaves and twenty-five for the seeds of P. guineense.

Ojinnaka et al. 329
Table 2. Concentrations of volatile compounds in the leaves and seeds of Piper guineense.
S/N Retention time
(minute) Compounds
Area Normalized
(%)
Formula Uziza leaves Uziza seeds
Acids
1. 11.858 Dodecanoic acid C12H24O2 - 2.48
2. 11.875 Dodecanoic acid C12H24O2 1.47 -
3. 14.258 Tetradecanoic acid C14H28O2 - 3.26
4. 14.267 Tetradecanoic acid C14H28O2 4.03 -
5. 17.942 n-Hexadecanoic acid C16H32O2 - 16.28
6. 17.958 n-Hexadecanoic acid C16H32O2 15.14 -
7. 20.783 Oleic Acid C18H34O2 33.37 -
8. 20.800 Oleic Acid C18H34O2 - 26.09
9. 21.033 Octadecanoic acid C18H36O2 8.22 -
10. 21.042 Octadecanoic acid C18H36O2 - 5.61
11. 23.292 Eicosanoic acid C20H40O2 3.33 -
Esters
12. 13.592 Methyl tetradecanoate C15H30O2 1.19 -
13. 16.883 Pentadecanoic acid,14-methyl-,methyl ester C17H34O2 - 1.28
14. 16.892 Hexadecanoic acid,methyl ester C17H34O2 6.53 -
15. 19.900 9,12-Octadecadienoic acid, methyl ester (E,E) C19H34O2 - 0.74
16. 19.908 9,12-Octadecadienoic acid,methyl ester (E,E)- C19H34O2 3.42 -
17. 19.992 11-Octadecenoic acid, methyl ester C19H36O2 - 2.26
18. 20.008 11-Octadecenoic acid, methyl ester C19H36O2 9.64 -
19. 20.350 Octadecanoic acid methyl ester C19H38O2 3.49 0.94
20. 22.792 Eicosanoic acid, methyl ester C21H42O2 1.36 -
Alcohol
21. 11.617 3,5,7-Cycloheptatriene-1,3-dimethanol C9H12O2 - 1.90
22.
Hydrocarbons
23. 8.967 1, 3, 6-Heptatriene, 2, 5, 5-trimethyl C10H16 - 0.17
24. 9.142 Copaene C15H24 - 0.14
25. 9.542 Cedrene C15H24 0.26 -
26. 9.542 trans-alpha-Bergamotene C15H24 - 0.22
27. 9.717 Cyclohexane,1-ethenyl-1-methyl-2,4-bis(1-methylethenyl) C15H34 0.60 1.00
28. 10.158 1, 3, 6, 10-Dodecatraene,3, 7, 11-trimethyl-,(Z,E) C15H24 0.44 0.62
29. 10.242 gamma-Elemene C15H24 0.41 0.72
30. 10.783 Aromadendrene C15H24 - 0.66
31. 10.925 Tridecane C13H28 1.27 -
32. 10.933 Cyclopropane, 1-(2-methylene-3-butenyl)-1-(1-methylenepropyl
C12H18 - 1.14
33. 11.150 beta-Myrcene C10H16 - 2.26
34. 11.150 Cyclohexene,1-methyl-4-(5-methyl-1-methyl-4-hexenyl) C15H24 1.49 -
35. 11.358 Cyclohexe,3-(1,5-dimethyl-4-hexenyl)-6-methylene,[S-(R*,S*)]-
C15H24 1.43 2.95
36. 12.142 Undecane C11H24 0.56 -
37. 13.375 Heptadecane,2, 6-dimethyl- C19H40 0.50 -
38. 17.325 Cyclohexene,1-nonyl- C15H28 - 1.59
Others
39. 12.125 1-Hydroxyl-1, 7-dimethyl-4-isopropyl-2, 7-cyclodecadiene C15H26O - 1.48
40. 12.550 Pyridine,3-(5-phenyl-4H-1, 2, 4-triazol-3-yl C13H10N4 1.88 2.36
41. 25.917 3-[(4-methoxyl-benzoyl)-hydrazono]-N-(1-phenyl-ethyl)-butyramide
C20H23N3O3 - 15.94
42. 27.508 3-[2-(3, 4-Dimethoxy-phenyl)-2-oxo-ethyl-3H-[1, 3, 4] oxadiazol-2-one
C18H16N2O5 - 7.88

330 Afr. J. Food Sci.
Figure 1. Chromatograms of the volatile compounds in the leaves of Piper guineense.
Figure 2. Chromatograms of the volatile compounds in the seeds of Piper guineense.

The thirty-three volatiles are of various types; acids, esters, alcohol, hydrocarbons (mainly terpenes) and others (Table 1). Acids are the dominant constituent group from the result shown in Table 1 and constitute over 50% of total volatiles in the leaves and seeds of P. guineense. Ali and Ibiam (2014), also identified acids in their work on the phytochemical studies and GC-MS analysis of Gongronema latifolium and P. guineense. Acids identified in the leaves and seeds of P.guineense include dodecanoic acid, tetradecanoic acid, n-hexadecanoic acid, oleic acid, octadecanoic acid and eicosanoic acid. They however occurred at different retention times. The highest concentration of the acids were found in oleic acids - 33.37% in P. guineense leaves and 26.09% in P. guineense seeds at retention time of 20.783 mins and 20.800 mins, respectively. However, oleic acid and hexadecanoic acid have been reported in the leaves of G. latifolium (Ali and Ibiam, 2014). Jirovetz et al. (2002) in their study of the aroma compounds in black Piper nigrum, white P. guineense and black P. guineense also identified some acids (acetic acid, propanoic acid, butanoic acid, nonanoic acid). Some of these acids are used in various industries as flavouring agents. Some organic acids have been determined as major aroma compounds in Korean soy sauces and barley bran sauces (Steinhaus and Schieberle, 2007).
Table 1 also shows that esters were also identified in the volatile compound analysis. The leaves of P. guineense had higher ester concentration than the seeds. Octadecanoic acid methyl ester occurred at the same retention time of 20.350 min in the leaves and seeds of P. guineense. But their concentrations were different; P. guineense leaves had a higher concentration of 3.49%, while the P. guineense seeds had 0.94%. Other ester compounds shown in Table 2 occurred at different time and with different constituents. Jirovetz et al. (2002) also identified esters (benzyl benzoate, phenylethyl benzoate) in P. nigrum and P. guineense. Esters, mainly formed by esterification of carboxylic acids and alcohols were reported to determine the characteristic pleasant aromatic notes (Klesk and Qian, 2003). The importance of ester contributions toward food aroma is undisputed with the fact that esters with low carbon atoms are highly volatile at ambient temperatures and the perception thresholds are ten times lower than their alcohol precursors (Nogueira et al., 2005). In addition to imparting a fruity floral character, esters can diminish or mask the sharpness of unpleasant FFA-derived notes. These esters are formed by esterification between the short-chain FFAs and the alcohols (Qin and Ding, 2007). 3,5,7-Cycloheptatriene-1,3-dimethanol was the only alcohol identified at 1.90% in the seeds of P. guineense at 11.617 min retention time. Alcohols are known to act as antifungal and prevent food spoilage (Onyenekwe et al., 2012).
Hydrocarbons (mainly terpenes) were also identified in
Ojinnaka et al. 331 the leaves and seeds of P. guineense plant. The seeds of P. guineense had higher concentration of the hydrocarbons which were mainly terpenes. Beta-myrcene (monoterpene) was identified only in the seeds of P. guineense at 2.26% concentration at a retention time of 11.150 min. Gamma-elemene (sesquiterpenes) was identified in both the leaves and the seeds of P. guineense at the same retention time of 10.242 min at concentrations of 0.41 and 0.72%, respectively. Other hydrocarbon sesquiterpenes identified only in the seeds of P. guineense include copaene, trans-alpha-bergamotene and aromadendrene. Owolabi et al. (2013) in their study of the aroma chemical composition of P. guineense from Lagos identified myrcene, alpha-copaene and beta-elemene in fruit (berries) of the plant. They also reported linalool as the major oil responsible for their characteristic flavor. Cedrene is a sesquiterpene that was identified only in the leaves of P. guineense at concentration of 0.26%. Jirovetz et al. (2002) reported that monoterpenes, sesquiterpenes and benzenoids have been identified as the main compounds in P. guineense responsible for their characteristic flavor. They also identified similar aroma compounds in their analysis of the seeds of black P. nigrum, white P. guineense and black P. guineense. Some of the similar terpenes identified include myrcene, gamma-elemene, copaene and trans-alpha-mergamotene.
They reported that monoterpenes and sesquiterpenes particularly were found to be of essential importance for the fine and pleasant pepper aroma of the black pepper (P. nigrum) and “Ashanti pepper” (P. guineense). Sruthi et al. (2013) in their study on the correlation between chemical profiles of black pepper (P. nigrum) collected from different locations in India reported the presence of monoterpenes like thujene, alpha-pinene, sabinene, limonene, alpha-phellandrene and linalool in samples collected at relatively higher altitudes as compared to plains. Other volatile compounds that were identified in the leaves and seeds of P. guineense were 1-hydroxyl-1, 7-dimethyl-4-isopropyl-2,7-cyclodecadiene, pyridine,3-(5-phenyl-4H-1, 2, 4-triazol-3-yl, 3-[(4-methoxyl-benzoyl)-hydrazono]-N-(1-phenyl-ethyl)-butyramide and 3-[2-(3, 4-dimethoxy-phenyl)-2-oxo-ethyl-3H-[1, 3, 4] oxadiazol-2-one. Pyridine,3-(5-phenyl-4H-1, 2, 4-triazol-3-yl) occurred in both the leaves and seeds of P. guineense at the same retention time of 12.550 min with concentrations 1.88 and 2.36%, respectively. Conclusion A total of thirty-three volatile compounds were identified in the leaves and seeds of P. guineense comprising acids, esters, alcohols, hydrocarbons (mainly monoterpenes and sesquiterpenes) and others. The different volatile constituents isolated using the gas chromatography-mass spectrometry contributes to the

332 Afr. J. Food Sci. aroma in the leaves and seeds of P. guineense and the final characteristic aroma of P. guineense leaves and seeds depend on the balance and interaction between the different components identified. Conflict of interests This research did not receive any specific grant from funding agencies in the public, commercial or not-for-profit sectors. The authors have not declared any conflict of interests. REFERENCES Achinewhu SC, Ogbonna CC, Hart AD (1995). Chemical composition of
indigenous wild herbs, spices, fruits, nuts and leafy vegetables used as foods. Plant Foods Hum. Nutr. 48(4):341-348.
Ali FU, Ibiam UA (2014). Phytochemical Studies and GC-MS Analysis of Gongronema Latifolium and Piper Guineense, Int. J. Innov. Res. Dev. 3:108-115.
Echo IA, Osuagwu AN, Agbor RB, Okpako EC, Ekanem BE (2012). Phytochemical Composition of Aframomum melegueta and Piper guineense Seeds. World J. Appl. Environ. Chem. 2:17-21.
Jirovetz L, Buchbauer G, Ngassoum MB, Geissler M (2002). Aroma compound analysis of Piper nigrum and Piper guineense essential oils from Cameroon using solid-phase microextraction–gas chromatography, solid-phase microextraction–gas chromatography–mass spectrometry and olfactometry. J. Chromatogr. A 976:265-275.
Klesk K, Qian M (2003). Preliminary aroma comparison of Marion (Rubus spp. Hyb) and Evergreen (R. laciniatus L.) Blackberries by dynamic headspace/OSME Technique (RH Marion and Evergreen Volatiles. J. Food Sci. 68:697-700.
Mabberley DJ (2008). Mabberley’s Plant Book. 3rd Ed. Cambrideg
University Press, U.K. Negbenebor CA, Godiya AA, Igene JO (1999). Evaluation of
Clariasanguillains treated with spice (Piper guinnense) for washed mice and kama book type product. Food Compost. Anal. 2:12-315.
Nogueira MCL, Lubachevsky G, Rankin SA (2005). A study of the volatile composition of Minas cheese. LWT Food Sci. Technol. 38(5):555-563.
Nwinyi OC, Chinedu NS, Ajani, OO, Ikpo CO, Ogunniran KO (2009). Antibacterial effects of extracts of Ocimum gratissimum and piper guineense on Escherichia coli and Staphylococcus aureus. Afr. J. Food Sci. 3(1):22-25.
Okoye EI, Ebeledike AO (2013). Phytochemical constituents of Piper guineense (uziza) and their health implications on some microorganisms. Glob. Res. J. Sci. 2:42-46.
Okwute SK (1992). Plant derived pesticidal and antimicrobial agents for
use in agriculture. A review of phytochemical and biological studies on some Nigerian plants. J. Agric. Sci. Technol. 2(1):62-70.
Onyenekwe PC, Odeh C, Nweze CC (2012). Volatile constituents of ogiri, soybean daddawa and locust bean daddawa, three fermented Nigerian food flavour enhancers. Electronic J. Environ. Agric. Food Chem. 11(1):15-22.
Owolabi MS, Lawal AO, Ogunwande IA, Hauser RM, Setzer WN (2013). Aroma chemical composition of Piper guineense Schumach. & Thonn. From Lagos, Nigeria: a new chemotype. Am. J. Essent. Oils Nat. Prod. 1:37-40.
Oyedeji OA, Adeniyi BA, Ajayi O, König WA (2005). Essential oil composition of Piper guineense and its antimicrobial activity. Another chemotype from Nigeria. Phytother. Res. 19:362-364.
Qin L, Ding X (2007). Evolution of proteolytic tasty components during preparation of douchiba, a traditional Chinese soy-fermented Appetizer. Food Technol. Biotechnol. 45:85-90.
Rabe T, Vonstanden J (1987). Antimicrobial activity of someAfrican plants used for medicinal purposes. J. Ethnopharmacol. 56:81-87.
Rodolfo Juliani H, Koroch AR, Giordano L, Amekuse L, Koffa S, Asante-Dartey J, Simon JE (2013). Piper guineense (Piperaceae): Chemistry,Traditional Uses, and Functional Properties of West African Black Pepper. In. African Natural Plant Products Volume II: Discoveries and Challenges in Chemistry, Health, and Nutrition. Eds. Rodolfo Juliani H, James E. Simon & Chi-Tang Ho. pp. 33-48.
Sofowora A (1982). Medicinal plants and traditional medicine in Africa. John Wiley. Chichester.
Sruthi S, Zachariah TJ, Leela NK, Jayarajan D (2013). Correlation between chemical profiles of black pepper (Piper nigrum L.) var. Panniyur-1 collected from different locations. J. Med. Plants Res. 7:2349-2357.
Steinhaus P, Schieberle P (2007). Characterization of the key aroma compounds in soy sauce using approaches of molecular sensory science. J. Agric. Food Chem. 55:6262-6269.
Sumathykutty MA, Rao JM, Padmakumari KP, Narayanan CS (1999). Essential oil constituents of some piper species. Flavors Fragr. J. 14:279-282.
Tchoumgougnang F, Jazet Dongmo PM, Sameza ML, Fombotioh N, Wouatsa Nangue AV, Amvam Zollo PH, Menut C (2009). Comparative essential oils composition and insecticidal effect of different tissues of Piper capense L., Piper guineense Schum. et Thonn., Piper nigrum L. and Piper umbellatum L. grown in Cameroon. Afr. J. Biotechnol. 8(3):424-431.

Vol. 10(11) pp. 327-339, November 2016
DOI: 10.5897/AJFS2016.1485
Article Number: 5CC7E9560924
ISSN 1996-0794
Copyright © 2016
Author(s) retain the copyright of this article
http://www.academicjournals.org/AJFS
African Journal of Food Science
Full Length Research Paper
Hygienic practices and critical control points along the milk collection chains in smallholder collection and
bulking enterprises in Nakuru and Nyandarua Counties, Kenya
Teresiah W. Ndungu1*, Mary Omwamba1, Patrick S. Muliro1 and Gerard Oosterwijk2
1Department of Dairy and Food Science, Egerton University, P. O. Box 536-20115, Egerton Kenya.
2Happy Cow Limited, P.O Box 558-20100, Nakuru, Kenya.
Received 9 July, 2016; Accepted 25 August, 2016
Dairy value chains link the actors and the activities involved in delivering milk and milk products from production to the final consumer. In every activity, the product increases in value from production, transportation, processing, packaging and storage. The study was designed to evaluate some hygienic practices along the value chain and develop the quality control system (CCPs) in the smallholder supply chain in Nakuru and Nyandarua County, Kenya. To assess the level using critical control points of compliance to hygienic code of practice, the questionnaires were developed and pre-tested before being administered to the selected individuals in the study. Descriptive statistics was used to depict the implementation of the code of hygienic practices in milk handling by the farmers, transporters, collection and bulking enterprises (CBEs) and the processor. Among the various aspects investigated at farm level in this study was, hand washing before milking, use of reusable udder cloth while milking, use of plastic containers in milk delivery, time taken to deliver milk, cleaning of the cow shed and awareness of the antibiotic resides in milk and its effect. The results indicated poor conformance to the hygienic code of practice along the dairy value chain in the smallholder supply system. The various factors that could contribute to raw milk quality deterioration were identified as, the critical control points (CCPs) using the hazard analysis critical control points (HACCP) principles. Seven factors were identified at five critical points along the milk collection chains. The critical control points identified includes milking at the farm level, bulking milk in a fifty liters can at collection points, transportation, at the CBE platform and the cooling tank. The quality of raw cow’s milk produced and marketed from the study areas was low. Key words: Collection and bulking enterprise (CBE’s), critical control points, hygienic practices and smallholder supply chain.
INTRODUCTION Like much of Africa, milk production Nakuru and Nyandarua County, Kenya, is heavily dependent upon smallholder production. The dairy cow is one of the most
important investments a farmer can make to improve their living standards because of their inherent value, the nutritional value associated with milk produced and

328 Afr. J. Food Sci. diversification farming activities (FAO, 2011). Kenya`s dairy production sub-sector is dominated by the smallholder dairy farmers who keep an estimated 3.5 million dairy cattle and produce approximately 5 billion litres of milk annually, therefore leading milk producer in the East Africa region (Muia et al., 2011).
According to Muriuki (2011), the dairy production systems differ in their sizes of operation, level of management and use of inputs and therefore can be classified as large, medium or small scale. Dairy production is dominated by smallholders who own about 98% of the total dairy herd (Peeler and Omore, 1997). Smallholder dairying households estimated to number over 1.5 million households, account for more than 85% of the annual total milk production and 80% of the 1.8 billion litres of milk marketed annually (MoL and FD, 2003; Staal et al., 2001). The smallholders practice zero and semi zero grazing in 3 to 5 acres of land and have about 2 to 5 cattle, each yielding an average of 5kgs of milk per cow per day. The dairy processing sector creates an average of 13 jobs for every 1 000 litres of milk handled while the informal sector accounts for about 70 percent of total jobs in dairy marketing and processing which is an estimate of about 18 employment opportunities for every 1 000 litres of milk a day handled through the informal channel (Muriuki, 2011). Kenya’s dairy industry is dynamic and plays an important economic and nutrition role in the lives of many people ranging from farmers to milk hawkers, processors, and consumers. Kenya is generally self-sufficient in milk and dairy products.
However, the demand for milk and dairy products in developing countries is estimated to increase 25% by 2025 (Delgado et al., 1999), mainly due to human population growth, further urbanization, increased disposable income, greater diversity of food products to meet nutritional needs, and increased opportunities for domestic and external trade. According to Muriuki (2011), the dairy sector creates employment to around 900,000 citizens in total at different stages i.e. at farm level, at the milk handling level and at processing level in the value chain. A value chain describes the chain of steps as a product, like fresh milk, passes along from production to retail down to consumption, considering the various people, places and inputs involved in this process. Poor hygiene at any point from production to consumption can jeopardize final product safety, hence, analogous to Hazard Analysis Critical Control Points (HACCP), a value-chain approach is required to assess, understand and improve food safety (Roesel and Grace, 2014).
Fresh milk is often sold unpasteurized to the public either directly from producers, via informal markets or through dairy farmer cooperatives. Resources are
extremely limited and smallholder production is under-developed with low levels of hygiene and productivity. Dairy value chains link the actors and activities involved in delivering milk and milk products to the final consumer where, with each activity the product increases in value. Activities which require inputs including financing and raw materials are employed to add value and to transport dairy products to consumers. Every actor of the chain should give the product the maximum added value at the minimum possible costs (FAO, 2011), the same time ensuring hygienic handling. Therefore, the dairy industry plays a vital role in food security and enhances the livelihoods of all its stakeholders (Bebe, 2003). Milk safety is crucial for both public health and farmer income, with consumers paying more for safer food (Jabbar et al., 2010; Roesel and Grace, 2014). Furthermore, improved hygiene reduces spoilage and wastage benefitting producers, traders and consumers. When untreated fresh milk is kept at ambient temperature it rapidly turns into sour milk through proliferation of lactic acid producing bacteria (O’Connor and Tripathi, 1992). Furthermore, improved hygiene reduces spoilage and wastage benefitting producers, traders and consumers.
Despite this high volume of production and the extensive formal marketing network in Kenya, estimates show that currently approximately 85 to 90% of marketed milk is not processed or packaged, but instead is bought by the consumer in raw form. The factors driving the continued importance of the informal market are traditional preferences for fresh raw milk, which is boiled before consumption, and unwillingness to pay the costs of processing and packaging. By avoiding pasteurizing and packaging costs, raw milk markets offer both higher prices to producers and lower prices to consumers (Thorpe et al., 2000). The informal market has one main advantage over its formal counterpart; the informal market is a cash-based market, with producers being paid immediately for their goods. Within the formal chain, farmers can wait up to a month to receive payment for their milk. Therefore, smallholder farmers who are largely facing immediate cash flow need the informal market which provides an advantage (EADD, 2008). Tremendous growth in the informal milk trade was realized after milk market liberalization in 1992 which comprised of small scale operators dealing in marketing of raw milk including direct sales to consumers, hawked milk sold by mobile traders, shops and kiosks, and co-operative societies (Muriuki, 2011: Wambugu et al., 2011) and recently milk bars.
Setting up an efficient, hygienic and economic dairy chain is a serious challenge in many developing countries. Among the reasons for this are; difficulties in establishing a viable milk collection and transport system
*Corresponding author. E-mail: [email protected].
Author(s) agree that this article remains permanently open access under the terms of the Creative Commons Attribution
License 4.0 International License
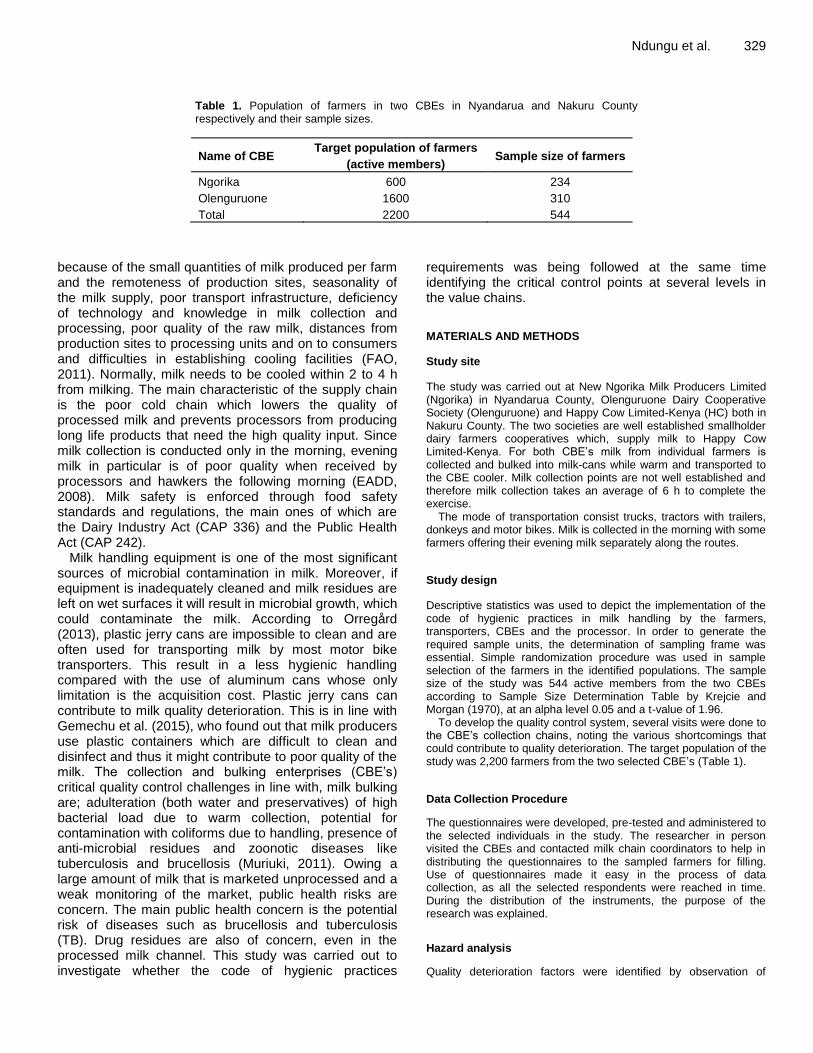
Ndungu et al. 329
Table 1. Population of farmers in two CBEs in Nyandarua and Nakuru County respectively and their sample sizes.
Name of CBE Target population of farmers
(active members) Sample size of farmers
Ngorika 600 234
Olenguruone 1600 310
Total 2200 544
because of the small quantities of milk produced per farm and the remoteness of production sites, seasonality of the milk supply, poor transport infrastructure, deficiency of technology and knowledge in milk collection and processing, poor quality of the raw milk, distances from production sites to processing units and on to consumers and difficulties in establishing cooling facilities (FAO, 2011). Normally, milk needs to be cooled within 2 to 4 h from milking. The main characteristic of the supply chain is the poor cold chain which lowers the quality of processed milk and prevents processors from producing long life products that need the high quality input. Since milk collection is conducted only in the morning, evening milk in particular is of poor quality when received by processors and hawkers the following morning (EADD, 2008). Milk safety is enforced through food safety standards and regulations, the main ones of which are the Dairy Industry Act (CAP 336) and the Public Health Act (CAP 242).
Milk handling equipment is one of the most significant sources of microbial contamination in milk. Moreover, if equipment is inadequately cleaned and milk residues are left on wet surfaces it will result in microbial growth, which could contaminate the milk. According to Orregård (2013), plastic jerry cans are impossible to clean and are often used for transporting milk by most motor bike transporters. This result in a less hygienic handling compared with the use of aluminum cans whose only limitation is the acquisition cost. Plastic jerry cans can contribute to milk quality deterioration. This is in line with Gemechu et al. (2015), who found out that milk producers use plastic containers which are difficult to clean and disinfect and thus it might contribute to poor quality of the milk. The collection and bulking enterprises (CBE’s) critical quality control challenges in line with, milk bulking are; adulteration (both water and preservatives) of high bacterial load due to warm collection, potential for contamination with coliforms due to handling, presence of anti-microbial residues and zoonotic diseases like tuberculosis and brucellosis (Muriuki, 2011). Owing a large amount of milk that is marketed unprocessed and a weak monitoring of the market, public health risks are concern. The main public health concern is the potential risk of diseases such as brucellosis and tuberculosis (TB). Drug residues are also of concern, even in the processed milk channel. This study was carried out to investigate whether the code of hygienic practices
requirements was being followed at the same time identifying the critical control points at several levels in the value chains.
MATERIALS AND METHODS
Study site
The study was carried out at New Ngorika Milk Producers Limited (Ngorika) in Nyandarua County, Olenguruone Dairy Cooperative Society (Olenguruone) and Happy Cow Limited-Kenya (HC) both in Nakuru County. The two societies are well established smallholder dairy farmers cooperatives which, supply milk to Happy Cow Limited-Kenya. For both CBE’s milk from individual farmers is collected and bulked into milk-cans while warm and transported to the CBE cooler. Milk collection points are not well established and therefore milk collection takes an average of 6 h to complete the exercise.
The mode of transportation consist trucks, tractors with trailers, donkeys and motor bikes. Milk is collected in the morning with some farmers offering their evening milk separately along the routes.
Study design
Descriptive statistics was used to depict the implementation of the code of hygienic practices in milk handling by the farmers, transporters, CBEs and the processor. In order to generate the required sample units, the determination of sampling frame was essential. Simple randomization procedure was used in sample selection of the farmers in the identified populations. The sample size of the study was 544 active members from the two CBEs according to Sample Size Determination Table by Krejcie and Morgan (1970), at an alpha level 0.05 and a t-value of 1.96.
To develop the quality control system, several visits were done to the CBE’s collection chains, noting the various shortcomings that could contribute to quality deterioration. The target population of the study was 2,200 farmers from the two selected CBE’s (Table 1).
Data Collection Procedure
The questionnaires were developed, pre-tested and administered to the selected individuals in the study. The researcher in person visited the CBEs and contacted milk chain coordinators to help in distributing the questionnaires to the sampled farmers for filling. Use of questionnaires made it easy in the process of data collection, as all the selected respondents were reached in time. During the distribution of the instruments, the purpose of the research was explained.
Hazard analysis
Quality deterioration factors were identified by observation of

330 Afr. J. Food Sci.
Table 2. The control level and likelihood of occurrence in risk assessment.
Likelihood of occurrence
Level of control
1 (Low) 2 (Moderate) 3(Severe)
1 (Low) 1 2 3
2 (Moderate) 2 4 6
3 (High) 3 6 9
activities in the collection chain. The HACCP principles were employed to identify the quality deteriorating factors along with the value chain as the hazards. Table 2 was used as a key in determining the level of risk at happy cow HACCP documentation. The decision made at a certain level of risk was classified in three stages. They included; 1 to 2 where the impact was termed as negligible, 3 to 4 where the impact was referred as minor and 6 to 9 where the impact was major. The first two stages were defined as the pre- requisite programs while the last stage was defined as critical control points. According to Codex Alimentarius (2003), a decision tree was used to classify the factors as prerequisite programs or critical control points. This was to facilitate a quality control system that would curb quality deterioration at all levels in the dairy value chain. Statistical analysis The questionnaires were first edited and coded to ensure completeness and accuracy. The data was analyzed through the use of descriptive statistics analysis. The Statistical Package for the Social Sciences SPSS (Statistical Package for Social Sciences) version 22 (SPSS Inc., Chicago IL, USA) was used for statistical analysis to depict the implementation of the code of hygienic practices. RESULTS AND DISCUSSION
Dairy farmers and transporters hygienic practices
The poor state of the roads was evident from this study since only 30% of the households had access to good roads and hence, could purchase inputs and market their farm produce throughout the year. During the rain seasons, most of the roads were impassable particularly in the upper highlands with firm clay and clay loam soils hence farmers were unable to sell their farm produce. Due to the poor road network and long distance to markets, cost of transportation was high rendering smallholder dairy production uncompetitive. Most of the milk produced during the wet season was not marketed due to the poor road network and long distance to the markets. Since milk is highly perishable and farmers did not have the means to invest in milk cooling equipment, the high volumes of milk produced during the wet season were therefore associated with high-post harvest losses. Only about 35% total milk production was marketed through the formal sector which is considered by farmers to be more reliable in terms of milk prices and payments for milk delivered than the informal sector.
The transportation of milk depends on the amount and the buyer. Major processors have their own collection, bulking and transportation systems. Stainless steel (seamless) cans, and occasionally plastic cans, are used for bulking milk from individual suppliers and delivering it to processors’ collection, bulking and cooling centers, from where it is transported in cans or by refrigerated tanks to the main processing plants (Muriuki, 2011). In some areas, powerful milk intermediaries (traders) have positioned themselves between, the market and the milk producers. Their presence complicates the traceability of milk and brings a risk of cross-contamination and microbial overload (Muriuki, 2011). Kenyans appear to prefer raw milk. Estimates from various studies indicate that about 85 percent of marketed milk is sold raw. Recently, the Kenya Dairy Board (KDB) and others in the formal milk trade have claimed that the proportion of processed milk has increased to more than 20 percent (Muriuki, 2011).
Farmers should maintain elaborate farm hygiene in the milking parlor and sheds to ensure clean milk production (Gietema, 2002). This will facilitate maintenance of a healthy herd. Results on dairy farmer’s hygienic practices (Figure 3) indicated that, 49% and 51% of the farmers in Olenguruone and Ngorika respectively did not use detergent when washing their hands prior to milking. Similarly, during transportation, poor milk handling hygiene was observed with at least 20% of the transporters from Ngorika, failing to wash their hands before handling the milk along the routes. Milking management and hygiene protocol are important to milk quality because they minimize transmission of mastitis in farms. The quality of milk is refers to milk that is free from pathogenic bacteria and harmful substances, sediment and extraneous substances, of good flavor, with normal composition, adequate in keeping quality and low in bacterial counts. Main factors that determine the quality of milk include microbial results such as somatic cell counts and bacteria contents. However, other factors like added water and solids, percentage of fat and protein, as well as antibiotics and pesticide residues, are important to producers, processors and consumers as well.
Nevertheless, 50.6 and 49.4% of the farmers in Olenguruone and Ngorika respectively, used a reusable udder cloth while milking their animals. The same udder cloth was used to dry their hands before milking. This compromises hygiene milking practices and may
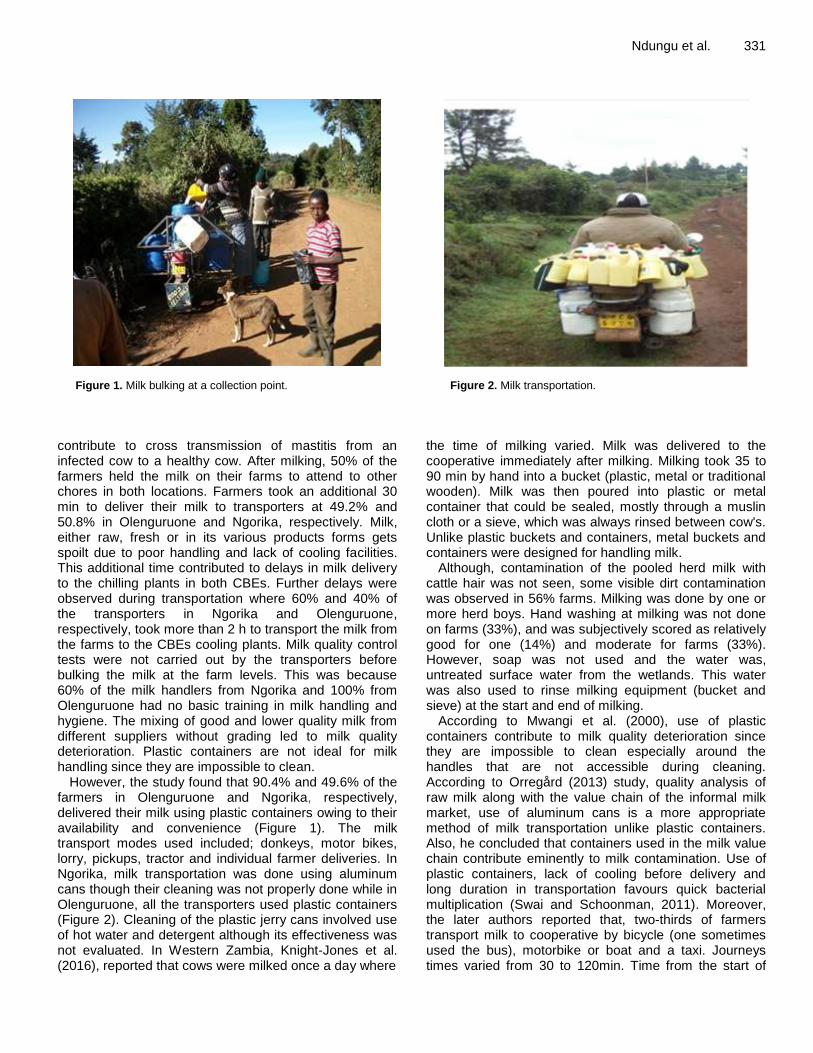
Figure 1. Milk bulking at a collection point.
contribute to cross transmission of mastitis from an infected cow to a healthy cow. After milking, 50% of the farmers held the milk on their farms to attend to other chores in both locations. Farmers took an additional 30 min to deliver their milk to transporters at 49.2% and 50.8% in Olenguruone and Ngorika, respectively. Milk, either raw, fresh or in its various products forms gets spoilt due to poor handling and lack of cooling facilities. This additional time contributed to delays in milk delivery to the chilling plants in both CBEs. Further delays were observed during transportation where 60% and 40% of the transporters in Ngorika and Olenguruone, respectively, took more than 2 h to transport the milk from the farms to the CBEs cooling plants. Milk quality control tests were not carried out by the transporters before bulking the milk at the farm levels. This was because 60% of the milk handlers from Ngorika and 100% from Olenguruone had no basic training in milk handling and hygiene. The mixing of good and lower quality milk from different suppliers without grading led to milk quality deterioration. Plastic containers are not ideal for milk handling since they are impossible to clean.
However, the study found that 90.4% and 49.6% of the farmers in Olenguruone and Ngorika, respectively, delivered their milk using plastic containers owing to their availability and convenience (Figure 1). The milk transport modes used included; donkeys, motor bikes, lorry, pickups, tractor and individual farmer deliveries. In Ngorika, milk transportation was done using aluminum cans though their cleaning was not properly done while in Olenguruone, all the transporters used plastic containers (Figure 2). Cleaning of the plastic jerry cans involved use of hot water and detergent although its effectiveness was not evaluated. In Western Zambia, Knight-Jones et al. (2016), reported that cows were milked once a day where
Ndungu et al. 331
Figure 2. Milk transportation.
the time of milking varied. Milk was delivered to the cooperative immediately after milking. Milking took 35 to 90 min by hand into a bucket (plastic, metal or traditional wooden). Milk was then poured into plastic or metal container that could be sealed, mostly through a muslin cloth or a sieve, which was always rinsed between cow's. Unlike plastic buckets and containers, metal buckets and containers were designed for handling milk.
Although, contamination of the pooled herd milk with cattle hair was not seen, some visible dirt contamination was observed in 56% farms. Milking was done by one or more herd boys. Hand washing at milking was not done on farms (33%), and was subjectively scored as relatively good for one (14%) and moderate for farms (33%). However, soap was not used and the water was, untreated surface water from the wetlands. This water was also used to rinse milking equipment (bucket and sieve) at the start and end of milking.
According to Mwangi et al. (2000), use of plastic containers contribute to milk quality deterioration since they are impossible to clean especially around the handles that are not accessible during cleaning. According to Orregård (2013) study, quality analysis of raw milk along with the value chain of the informal milk market, use of aluminum cans is a more appropriate method of milk transportation unlike plastic containers. Also, he concluded that containers used in the milk value chain contribute eminently to milk contamination. Use of plastic containers, lack of cooling before delivery and long duration in transportation favours quick bacterial multiplication (Swai and Schoonman, 2011). Moreover, the later authors reported that, two-thirds of farmers transport milk to cooperative by bicycle (one sometimes used the bus), motorbike or boat and a taxi. Journeys times varied from 30 to 120min. Time from the start of

332 Afr. J. Food Sci.
Figure 3. Dairy farmer’s practices contributing to raw milk quality deterioration observed at the farm level.
milking to refrigeration upon arrival at the cooperative ranged from 100 to 223min.
Farmer’s awareness concerning antibiotic residues in milk was found to be at 49.7% and 50.3% for Olenguruone and Ngorika, respectively. Additionally, half of the farmers in both CBEs were not aware of the effects of antibiotic residues in milk quality, the withdrawal period required for various antibiotics and their effects on human health. These results was compare to those of Orregård (2013), where farmers did not understand about antibiotic residues and their effect on milk quality. The same author concluded that, antibiotic residues in milk can be traced exclusively from the farms. Further findings from Aboge et al. (2000), indicated that to eliminate the challenge of antibiotic residues in milk, care should be taken at both the farm and market level.
Milk handling and preservation at the CBEs Personnel handling the milk at the cooling plants were qualified for dairy technologist in both CBEs. Cleaning of the cooling tank was done immediately after emptying the milk to the tanker. This compares to a study done by Pandey and Voskuil (2011), which recommends that, the cooler must be cleaned, disinfected and kept in good condition after each milk collection. Maintaining hygiene in Ngorika cooling plant premise is easy. On the other hand, Olenguruone cooling plant premises was a semi-permanent building with a rough floor which compromised on hygiene. Milk at the reception platform was handled in a quality compromising situation. Dirty residues trapped by the muslin cloth used for sieving milk
Figure 4. Milk emptying from the dump tank.
were observed (Figure 4). The tippers at the reception platform (Figure 5) had dirty hands. Rain and borehole were the available sources of water. This water was not treated before use, a factor that could contribute to milk quality deterioration. Ideally, milk should be cooled within 2 to 3 hours after milking. This Quality affects both the processed and cold channel chains. However, the cold channel chain is associated with more issues than the processed one. Although standards for milk and milk products exist in the legal framework, low quality

Figure 5. Hands used in tipping the milk.
milk/milk products continue to find their way to consumers largely, due to low compliance by processors and traders; and poor enforcement of regulations by those charged with enforcement. While consumer awareness of standards as well as the health effects of low quality milk, which is likely that human as well as technical capacity that enforces the standards is lacking. Moreover, due to technical and cost issues, consumers are unable to seek legal redress where necessary (SNV, 2013).
Contrary, in both CBEs some milk delivery exceeded the recommended time which had a negative impact on milk quality. The cooling efficiency in both CBEs was a challenge. The coolers took more than 3h to cool the milk from 18 to 4
°C. The study found that monitoring of the
cooler efficiency to prompt maintenance and repair was hardly done. For instance in Olenguruone, it was done after 3 months or during breakdowns. According to Pandey and Voskuil (2011), milk must be cooled immediately to minimize bacteria multiplication and this should be protected from contamination during transportation and subsequent storage. Poor quality milk cannot be improved by cooling at a later stage (Orregård, 2013), therefore there is a need to improve and hasten the raw milk collection system.
Milk handling at the processor level At the reception platform at Happy Cow Limited, quality control personnel cleaned exit where the milk was to be emptied before connecting the pipes. The quality control personnel are dairy technologists. A sample was then drawn from each compartment separately for quality analysis (% lactic acid, alcohol test, lactometer test, total
Ndungu et al. 333
Figure 6. Flow diagram of steps for raw milk collection to cooling plant.
plate count, 10 minutes Resazurin test and antibiotic residue delvo test). There was no temperature variation observed in the milk after transportation from the CBEs. The tanker was cleaned immediately after emptying the milk. The concentrations of the cleaning detergents used in the tankers were checked before each cleaning procedure in contrast to the practice in the CBEs where the concentration was never checked. Borehole water for general cleaning was treated with 3ppm chlorine while that used for sanitation was at 300 ppm. This showed that the milk processor was careful on matters of regarding milk quality and handling hygiene. Identification of quality control CCPs Characteristics of raw milk During the field visits, eight steps were identified and listed in a flow diagram (Figure 6) to illustrate the occurrence of activities in the delivery of milk from the farm to the cooling plant. The steps involved three participants including farmers, transporters and graders. The farmer handles the milk from milking to the collection point where the transporter collects the milk, bulks and transports to the cooling plant. Subsequently, the milk is

334 Afr. J. Food Sci. graded at the CBE platform and bulked in the cooler by grader.
Milk delivered at the collection chain had a lot of foreign material for instance cow dung, fir and organic matter. Contamination of milk with dirt will most likely occur at the farm level where poor and careless handling can allow mud, dung, dust or other contaminants within the milking area to enter into the milk. The dirt could have originated from poor milking procedure and failure to sieve the milk before delivery. A critical hazard to milk chain is the bacteria especially excessive load of bacteria or presence of the pathogenic ones. Most of the hazards explained above can be the source of excessive bacteria load or pathogenic bacteria in milk. A common way through which to introduce pathogenic bacteria in milk are frequent milk transfers by the market agents, contact with unclean surfaces and unclean handlers. This can happen at farm and market level, when apportioning and transferring milk from milking containers to other containers. Contamination is also most likely to occur at different market level, when transferring milk between traders and where bulking occurs. Presence of foreign material contributes to the increase in microbial contaminants, objectionable odours and appearance. Failure to observe the withdrawal period after treating the animals at the farm level will allow introduction of antibiotic residues into the milk. Critical points for antibiotics or antimicrobials are at the farm level due to none compliance with drug manufacturers withdrawal recommendations and at the market level where it has been alleged that some traders add antimicrobials in the milk to increase its shelf life.
Antibiotic residues in milk is a chemical hazard to milk consumers due the allergic reactions and development of antibiotic resistance in human. Addition of water or adulteration of milk can occur at the farm and at the market level accidentally or deliberately to increase the volume and earn more cash. At the market level, this can happen when raw milk traders may want to stretch their profitability. Adulteration with water and preservatives could be done by farmers/herders, although during transportation; chances of adulteration are also likely. These malpractices could lead to milk safety and quality concerns. The factors affecting milk quality were examined and reported in Table 3 which includes their workable corrective actions.
According to KEBS (2007), milk contains not less than 3.25% milk fat and not less than 8.50% milk solids not fat. This should have a characteristic of creamy-white colour, free from flavours, taints and objectionable matter. This should not clot during boiling and should test negative to the alcohol test. It should not contain added water, preservatives, or other added substances and no proportion of a natural constituent should be removed. The density should be within the range of 1.028 to 1.036 g/ml at 20°C and not more than 0.17% lactic acid. The freezing point depression should be within 0.525 and
0.550°C and it shall conform to maximum limits of pesticides, antibiotic and veterinary drugs residues. Identification of critical control points
The potential milk borne hazards in the chain include dirt, additions such as water, fats or other solids, excessive load of bacteria and presence of antibiotics. These hazards can enter the milk chain at many points along the market chain, depending on handling and the ethical attributes of the actors along the chain.
The critical control points were identified in line with HACCP principles concept using the deteriorating factors identified above (Table 3). To categorize the factors as prerequisite program or CCP as in Table 4, risk assessment was carried out where the likelihood and severity was considered. The microbial contamination, hydrogen peroxide, cleaning detergents residues, exhaust fumes, organic matter and antibiotic residues were identified as factors with high risk in milk quality deterioration. The decision made at a certain level of risk was determined by likelihood of occurrence and severity. Where negligible, or if impact was minor, it will be controllable at a particular step and records will be kept. If the impact was severe, factor will be considered as CCP and therefore control factor will be determined. Based on the identified CCPs, the corrective actions were established, which would ensure the safety and quality of the milk delivered to the CBEs.
According to ISO 22000: 2005 food safety management systems HACCP has been recommended as one of the most effective ways of ensuring high quality and safe food. According to Mwangi et al. (2000), the HACCP system is a preventive approach that identifies the points in a process which are hazardous to their risk factors and potential level of risk, so that critical control points for remedial action can be implemented. Also, according to FAO/WHO (1998), risk is the likelihood of occurrence and it is a function of likelihood of occurrence and the control level (seriousness level).
The decision tree in Figure 6, assisted in identifying CCPs are as shown in Table 5. This identified 6 out of 8 of the processes as CCPs with a significance of 9. During Poor milking procedures, the health of dairy cows and delayed milk delivery are factors under the jurisdiction of the farmers. As the recommendations are presented in Table 4 outline, farmer’s keenness to hygiene milking and prompt delivery of milk should be emphasized. It was identified that due to low milk production in the farms, transporters had to bulk milk from 6 to 9 farms to fill one can. The mixing of the milk gave chance to mixing good quality and poor quality milk, leading to quality deterioration of the bulk. Due to the modes of transport and poor road networks in the rural areas serving the two CBEs, there was delayed delivery of the milk from collection points to the cooling plant. There were chances

Ndungu et al. 335 Table 3. List of possible factors contributing to quality deterioration at each step.
Process Description/Activities Possible factors and their Sources Control Measure
Milking The cow is entered in the parlor and is restrained. Milking takes off.
Physical: Animal fur, dung, personal effects and dirt that may come with the milking procedure.
Chemical: Antibiotics, milking jelly, H2O2, Somatic cell count.
Biological: Bacterial load
Sensitizing farmers on milking hygiene, withdrawal period and mastitis treatment.
Sieving the milk into the delivery cans
The farmer sieves the milk as it’s transferred into the delivery container.
Physical: cleanliness of the sieve. Chemical: detergents residues. Biological: microbial contamination
Sensitize the farmers on hygiene.
Transport to collection points
The milk is taken at the collection point. Biological: microbial multiplication due to time lapse. Sensitize the farmers.
Grading The milk is graded at the collection point before bulking into 50 litres aluminum cans.
Physical: introduced. Chemical: H2O2, antibiotics Proper grading, sensitize the farmers.
Bulking into 50 litres aluminum cans
Graded milk is collected into 50litres aluminum cans.
Chemical: detergents residues. Proper rinsing of the aluminum cans before bulking.
Transport to the cooling center
The bulked milk is transferred to CBE. Biological: multiplication of the microbes due to time lapse
Sensitization of the transporters.
CBE reception plat form
The milk is graded again for acceptance or rejection.
Biological: microbial growth due to time lapse Sensitization of the quality control personnel at the reception.
Cooling tank The milk is pumped into the cooling tank.
Biological: microbial multiplication
Chemical: detergents residues, antibiotics and adulterants due to bulking.
Sensitization of all the stakeholders in the value chain.
of adulteration of the milk in transit by unscrupulous transporters. The last CCP was identified as the inefficiency of the cooler which would take long before cooling the milk, gave chance to further multiplication of microorganisms.
From the identified CCPs for each process, measurable parameters to ascertain quality in the delivery chain were identified as outlined in the
CCP plan in Table 6. The farmer has to deliver the milk promptly and this will be evaluated by the temperature range of the delivered milk. This is done with the background knowledge that, the faster the delivery the more the milk temperature will near the udder temperatures ranges from 25 to 37°C. The thermometer reading should be carried out at collection points and the farmers are
sensitized to adhere to prompt delivery practice. This will eliminate delays in the homes where farmers milk and first attend to other chores. From the transport to the collection point, there were neither measurable parameters nor any corrective action that would be concluded as a CCP.
To ensure bulking of quality milk at the collection points, milk should be tested on density

336 Afr. J. Food Sci.
Table 4. Raw milk quality risk assessment.
Process Factor Likelihood (L) Severity (S) Risk = L × C Significance Recommendation
Milking
Physical: Animal fur, dung, personal effects and dirt. 3 3 9 CCP Sensitize farmer, milkers on clean milk production
Chemical H2O2 1 3 3 PRP Reject milk with H2O2
Antibiotics 3 3 9 CCP Sensitize farmers on the withdrawal period.
Biological Somatic cell count 3 3 9 CCP Sensitize farmers on animal husbandry
Microbial load 3 3 9 CCP Clean milk production and delivery time
Sieving the milk into delivery cans
Physical: dirt from milk 3 1 3 PRP Clean milk production
Chemical: cleaning detergents 2 2 4 PRP Proper rinsing of the milking equipment.
Biological: microbial load 1 3 3 PRP Proper cleaning of the equipment.
Transport to collection points Chemical: H2O2, alkaline 2 3 6 CCP Reject milk with alkaline and H2O2.
Biological: microbial multiplication 2 3 6 CCP Quick delivery to collection point
Grading Physical: introduced 1 2 2 PRP Hygiene
Biological: contamination 3 3 9 CCP Proper sanitation of grading equipment.
Bulking into 50 litres aluminum cans
Physical: introduced dirt 1 3 3 PRP Training and extension
Chemical: H2O2, antibiotics, cleaning detergents 3 3 9 CCP Traceability
Biological: microbial load, somatic cell count. 3 3 9 CCP Quick delivery and good animal husbandry.
Transport to the cooling center
Chemical: H2O2, alkaline 2 3 6 CCP Reject the milk with H2O2 and alkaline.
Biological: microbial multiplication 3 3 9 CCP Quick delivery to CBE
CBE reception plat form
Physical: introduced dirt 2 3 6 CCP Proper hygiene
Chemical: exhaust fumes 2 3 6 CCP Sensitize transporters on GMPs
Biological: microbial multiplication 3 3 9 CCP Proper sensitization of the grading equipment.
Cooling tank Chemical: cleaning detergents 2 3 6 CCP Proper rinsing of the tanks.
Biological: microbial multiplication 3 3 9 CCP Proper maintenance of the cooler.
Table 5. Determination of CCPs (decision tree).
Process Factor Significance Question 1 Question 2 Question 3 Conclusion
Milking Poor milking procedure, utensils, milking bucket, cow health 9 Yes Yes Yes CCP
Transport to collection points Delayed delivery 6 Yes No Yes CCP
Bulking into 50 litres aluminum cans Mixing of 6 to 9 farmer’s milk increases chances of mixing good quality milk with poor quality milk 9 Yes No Yes CCP
Transport to the cooling center Delayed delivery , adulterants 9 Yes Yes Yes CCP
CBE reception platform Delays while grading and dirt from the surrounding. Exhaust fumes collected from delivery vehicles 9 Yes Yes Yes CCP
Cooling tank Poor efficiency of the cooler 9 Yes Yes Yes CCP
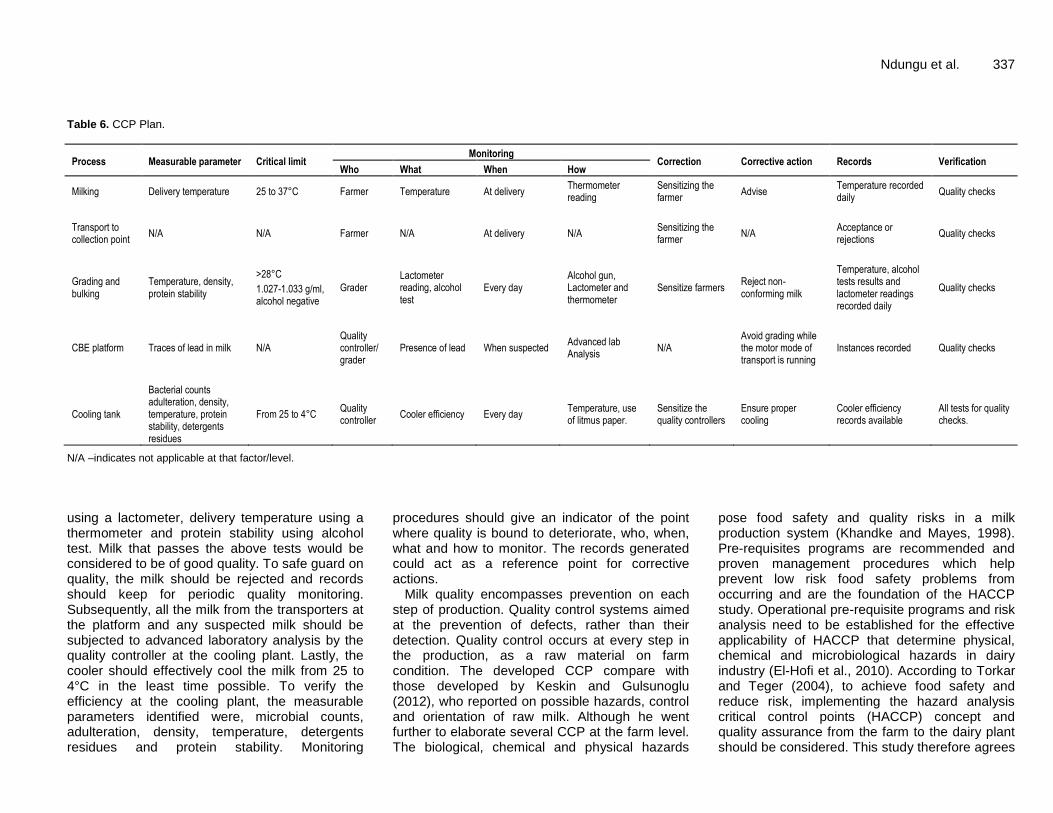
Ndungu et al. 337 Table 6. CCP Plan.
Process Measurable parameter Critical limit Monitoring
Correction Corrective action Records Verification Who What When How
Milking Delivery temperature 25 to 37°C Farmer Temperature At delivery Thermometer reading
Sensitizing the farmer
Advise Temperature recorded daily
Quality checks
Transport to collection point
N/A N/A Farmer N/A At delivery N/A Sensitizing the farmer
N/A Acceptance or rejections
Quality checks
Grading and bulking
Temperature, density, protein stability
>28°C
1.027-1.033 g/ml, alcohol negative
Grader Lactometer reading, alcohol test
Every day Alcohol gun, Lactometer and thermometer
Sensitize farmers Reject non-conforming milk
Temperature, alcohol tests results and lactometer readings recorded daily
Quality checks
CBE platform Traces of lead in milk N/A Quality controller/ grader
Presence of lead When suspected Advanced lab Analysis
N/A Avoid grading while the motor mode of transport is running
Instances recorded Quality checks
Cooling tank
Bacterial counts adulteration, density, temperature, protein stability, detergents residues
From 25 to 4°C Quality controller
Cooler efficiency Every day Temperature, use of litmus paper.
Sensitize the quality controllers
Ensure proper cooling
Cooler efficiency records available
All tests for quality checks.
N/A –indicates not applicable at that factor/level.
using a lactometer, delivery temperature using a thermometer and protein stability using alcohol test. Milk that passes the above tests would be considered to be of good quality. To safe guard on quality, the milk should be rejected and records should keep for periodic quality monitoring. Subsequently, all the milk from the transporters at the platform and any suspected milk should be subjected to advanced laboratory analysis by the quality controller at the cooling plant. Lastly, the cooler should effectively cool the milk from 25 to 4°C in the least time possible. To verify the efficiency at the cooling plant, the measurable parameters identified were, microbial counts, adulteration, density, temperature, detergents residues and protein stability. Monitoring
procedures should give an indicator of the point where quality is bound to deteriorate, who, when, what and how to monitor. The records generated could act as a reference point for corrective actions.
Milk quality encompasses prevention on each step of production. Quality control systems aimed at the prevention of defects, rather than their detection. Quality control occurs at every step in the production, as a raw material on farm condition. The developed CCP compare with those developed by Keskin and Gulsunoglu (2012), who reported on possible hazards, control and orientation of raw milk. Although he went further to elaborate several CCP at the farm level. The biological, chemical and physical hazards
pose food safety and quality risks in a milk production system (Khandke and Mayes, 1998). Pre-requisites programs are recommended and proven management procedures which help prevent low risk food safety problems from occurring and are the foundation of the HACCP study. Operational pre-requisite programs and risk analysis need to be established for the effective applicability of HACCP that determine physical, chemical and microbiological hazards in dairy industry (El-Hofi et al., 2010). According to Torkar and Teger (2004), to achieve food safety and reduce risk, implementing the hazard analysis critical control points (HACCP) concept and quality assurance from the farm to the dairy plant should be considered. This study therefore agrees
338 Afr. J. Food Sci. with (Karakök, 2007), who recommends that, it is paramount for every farm to determine and continuously control critical points of fresh milk production which will prevent possible hazards. The benefits of adhering to the CCPs comprise improved milk quality, which in turn enhance consumer confidence. CONCLUSION AND RECOMMENDATIONS Based on the study findings the farmers did not employ the code of hygiene practice in their routine dairy management. Milk withdrawal periods were not observed and thus the milk had traceable contents of drug residues. Milking was carried out without taking adequate measures that would guarantee quality. For instance, the farmers used a single cloth in washing the udder for several animals and did not thoroughly wash their hands during milking. Additionally, plastic jerry cans which could cause quality deterioration were used in milking and delivering milk to the collection points.
The study found that farmers are used to milking the cows, then perform other household chores which in turn delays milk delivery to the collection points. The milk was being bulked together without initial quality checks and proper recording. Some transporters were bringing the milk to the cooler either with the same farmer’s container or bulked together in a bigger plastic container and no grading was done at the farm level. Factors that have likelihood to cause milk quality deterioration were identified during the research. Controlling drug residues, hygiene, water adulteration, delays in delivery and use of food grade containers would ensure milk quality. In the transportation from collection points to the cooler, there were undue delays and possible adulteration which were identified to likely tamper with milk quality.
Lastly, the coolers were a possible factor in milk deterioration due to poor cooling efficiency and ineffective cleaning. Based on the findings, the critical control points can be identified at the various levels and their subsequent monitoring would enhance milk quality in all the steps. Actions to be taken on each CCP were derived and are expected to guide the milk handlers in ensuring milk quality and safety.
Conflict of Interests The authors have not declared any conflict of interests. REFERENCES
Aboge GO, Kang’ethe EK, Arimi SM, Omore AO, McDermott JJ, Kanja
LW, Macharia JK, Nduhiu JG, Githua A (2000). Antimicrobial agents detected in marketed milk in Kenya. Paper prepared for oral presentation at the 3
rd All Africa Conference on Animal Agriculture,
(AACAA), 6-9 November 2000, Alexandria, Egypt. Bebe BO (2003). Herd dynamics of Smallholder dairy in the Kenya
highlands. PhD. Thesis, Wageningen University, The Netherlands. ISBN: 90-5808-788-3.
Codex Alimentarius (2003). Hazard analysis and critical control point (HACCP) system and guidelines for its application. Annex to CAC/RCP, 1-1969.
Delgado C, Rosegrant M, Steinfield H, Ehui S, Courbois C (1999). Livestock to 2020: the next food revolution. Food, Agriculture, and the Environment discussion Paper 28. Washington, DC: International Food Policy Research Institute (IFPRI), Food and Agriculture Organization (FAO) and International Livestock Research Institute (ILRI). P 83.
EADD (East Africa Dairy Development) (2008). The Dairy Value Chain in Kenya. A report by Techno Serve Kenya for the East Africa Dairy Development Program August 2008.
El-Hofi M, El-Tanboly ES, Ismail A (2010). Implementation of the Hazard Analysis Critical Control Point (HACCP) system to UF white cheese production line. Acta Sci. Pol. Technol. Aliment. 9(3):331-342.
FAO (Food and Agricultural organization) (2011). Accessed on 27/04/2016. Available at: http://www.fao.org/agriculture/dairy-gateway/the-dairy-chain/en/.
FAO/WHO (1998). The application of Risk Communication to Food Standards and safety matters (Joint FAO/WHO Expert consultation).
Gemechu T, Beyene F, Eshetu M (2015). Physical and chemical quality of raw cow’s milk produced and marketed in Shashemene Town, Southern Ethiopia. ISABB J. Food Agric. Sci. 5(2):7-13.
Gietema B (2002). Modern dairy farming in warm climate zones. 1. Farm level information and advice on dairy cattle feeding, pasture and fodder crops. Modern dairy farming in warm climate zones. 1. Farm level information and advice on dairy cattle feeding, pasture and fodder crops.
Jabbar MA, Baker D, Fadiga ML (2010). Demand for Livestock Products in Developing Countries with a Focus on Quality and Safety Attributes: Evidence from Asia and Africa; ILRI Research Report 24; ILRI: Nairobi, Kenya.
Karakök SG (2007). Cow milk quality and critical control points on farm conditions. Hayvansal Üretim 48(2):55-59.
KEBS (Kenya Bureau of Standards) (2007). Kenya standards East African Standards (KS EAS).Raw cow milk specification, 1
st edition,
Arusha. Tanzania. Keskin OY, Gulsunoglu Z (2012). Quality management systems in dairy
industry. International Conference on Industrial Engineering and Operations Management.
Khandke, SS, Mayes T (1998). HACCP implementation: a practical guide to the implementation of the HACCP plan. Food Control 9(2):103-109.
Knight-Jones TJD, Hang’ombe MB, Songe MM, Sinkala Y, Grace D (2016). Microbial Contamination and Hygiene of Fresh Cow’s Milk Produced by Smallholders in Western Zambia. Int. J. Environ. Res. Public Health 13(7):737.
Krejcie RV, Morgan DW (1970). Determining sample size for research activities. Educ. Psychol. Meas. 30:607-610.
MoL & FD-Ministry of Livestock and Fisheries Development (2003). Livestock Production Annual Report 2002. Nairobi, Kenya.
Muia JMK, Kariuki JN, Mbugua PN, Gachuiri CK, Lukibisi LB, Ayako WO, Ngunjiri WV (2011). Smallholder dairy production in high altitude Nyandarua milk-shed in Kenya: Status, challenges and opportunities. Livest. Res. Rural Dev. 23(5):108.
Muriuki H G (2011). Dairy development in Kenya. Food and Agricultural Organization, Rome.
Mwangi A, Arimi SM, Mbugua S, Kang'ethe EK, Omore AO, McDermott JJ (2000). Assurance of marketed milk quality in Kenya. Paper presented at the Faculty of Veterinary Medicine Biennial Scientific Conference, 30-31 August 2000, University of Nairobi, Kenya.
O’Connor CB, Tripathi BR (1992). Milk Processing Techniques- Sour Milk, RURAL Dairy Processing Training Series; International Livestock Centre for Africa: Addis Ababa, Ethiopia.
Orregård M (2013).Quality analysis of raw milk along the value chain of the informal milk market in Kiambu County, Kenya.
Pandey GS, Voskuil GCJ (2011). Manual on milk safety, quality and hygiene. Golden Valley agricultural Research Trust, Zambia, 52.
Peeler EJ, Omore A (1997). Manual of livestock production systems in Kenya. 2
nd Ed. Kenya Agricultural Research Institute (KARI). Nairobi,
Kenya. 138p. Roesel K, Grace D (2014). Food Safety and Informal Markets: Animal
Products in Sub-Saharan Africa; Routledge: London, UK. SNV (SNV Netherlands Development Organization) (2013). Dairy
Sector Policy Study and Capacity Needs Assessment of Stakeholder Associations. Final Report. July 8, 2013. www.ppdconsult.com
Staal SJ, Owango M, Muriuki H, Lukuyu B, Njoroge L, Njubi D, Baltenweck I, Musembi F, Bwana O, Muriuki K, Gichugu G, Omore A, Thorpe W (2001). Dairy systems characterization of the greater Nairobi milk shed. Smallholder Dairy (Research & Development) Project. Kenya Agricultural Research Institute (KARI), Ministry of Agriculture (MoA) and International Livestock Research Institute (ILRI) Collaborative Dairy Research Program, Nairobi, Kenya. 73. http://www.smallholderdairy.org/collaborative res reports.htm
Swai ES, Schoonman L (2011). Microbial quality and associated health risks of raw milk marketed in the Tanga region of Tanzania. Asian Pac. J. Trop. Biomed. 1(3):217-222.
Thorpe W, Muriuki HG, Omore A, Owango MO, Staal S (2000). Dairy development in Kenya: The past, the present and the future. Paper presented at the annual symposium of the Animal Production Society of Kenya, Nairobi, Kenya, 22-23 March 2000.
Ndungu et al. 339 Torkar KG, Teger SG (2004). The microbiological quality of some
critical control points in the cheese production of individual Slovenian cheese-makers. Acta Agric. Slov. 84(1):43-61.
Wambugu S, Kirimi L, Opiyo J (2011). Productivity trends and performance of dairy farming in Kenya. Tegemeo Institute of Agricultural Policy and Development. Available at: http://www.fao.org/agriculture/dairy-gateway/the-dairy-chain./en/
Vol. 10(11) pp. 340-343, November 2016
DOI: 10.5897/AJFS2016.1427
Article Number: 606CF5360926
ISSN 1996-0794
Copyright © 2016
Author(s) retain the copyright of this article
http://www.academicjournals.org/AJFS
African Journal of Food Science
Full Length Research Paper
Nutritive values of some non-conventional leafy vegetables and scarcity food plants of north east India
Chandra K. S.1, Dimple Gogoi2, Gautam K. H.3* and Handique A. K.1
1Department of Biotechnology, Gauhati University ,Guwahati- 781014, India.
2Department of Zoology, Gauhati University ,Guwahati- 781014, India.
3Department of Botany, Nalbari College, Nalbari-781335, India.
Received 21 February, 2016; Accepted 31 August, 2016
Biochemical analysis was made for major nutritional components of eight non-conventional leafy vegetables and scarcity food plants of North East India, most of which occur in the wild. Crude protein content varied from 12.24 to 28.80%. Total carbohydrate varied from 5.35 to 18.80%. Lipid content was found to be low and varied from 2.06 to 6.16%. Total mineral content in the form of ash were found to be impressive and ranged from 11.58 to 24.58% with the exception of Vitex nigando, where it was only 6.05%. Calorific values varied from 108.9 to 215.46 Kcal/100 g. Methionine and tryptophan content varied in the range of 1.28 to 2.62 and 0.81 to 1.36 g/100 g protein respectively. The present findings show that many wild and non-conventional leafy vegetables, which are traditionally used by various ethnic groups of North East India and popularly referred to as “poor man’s food” are in fact nutritionally very rich which necessitate rethinking about these neglected food plants. Key words: Non-conventional food plants, leafy vegetable, nutritive value, crude protein, carbohydrate, lipid, crude fibre, ash.
INTRODUCTION The NE region of india is one of the major biodiversity hotspot in the world. Wild edible plants (WEPs) are widely consumed as part of daily diet by the local people and are part of their traditional culture and food habit. WEPs are critical for the sustenance of ethnic communities and also as a source of income. However, WEPs received little attention in research activities, economic development, biodiversity conservation and sustainable management (Surjata et al., 2016). Majority of the non-conventional food plants are neglected which
grow naturally in the wild and need no input, maintenance or care (FAO - Traditional Food Plants, 1988). Non-conventional food plants have always played a pivotal role as supplement to major food plants in the food security system since time immemorial. In almost all countries of the world which are rich in floral biodiversity and have abundance of vegetation, there are established practices of using Non- conventional food plants as stand-by source of food at times of famine, natural calamity and at times when major crops fail due to local
*Corresponding author. E-mail: [email protected].
Author(s) agree that this article remains permanently open access under the terms of the Creative Commons Attribution
License 4.0 International License
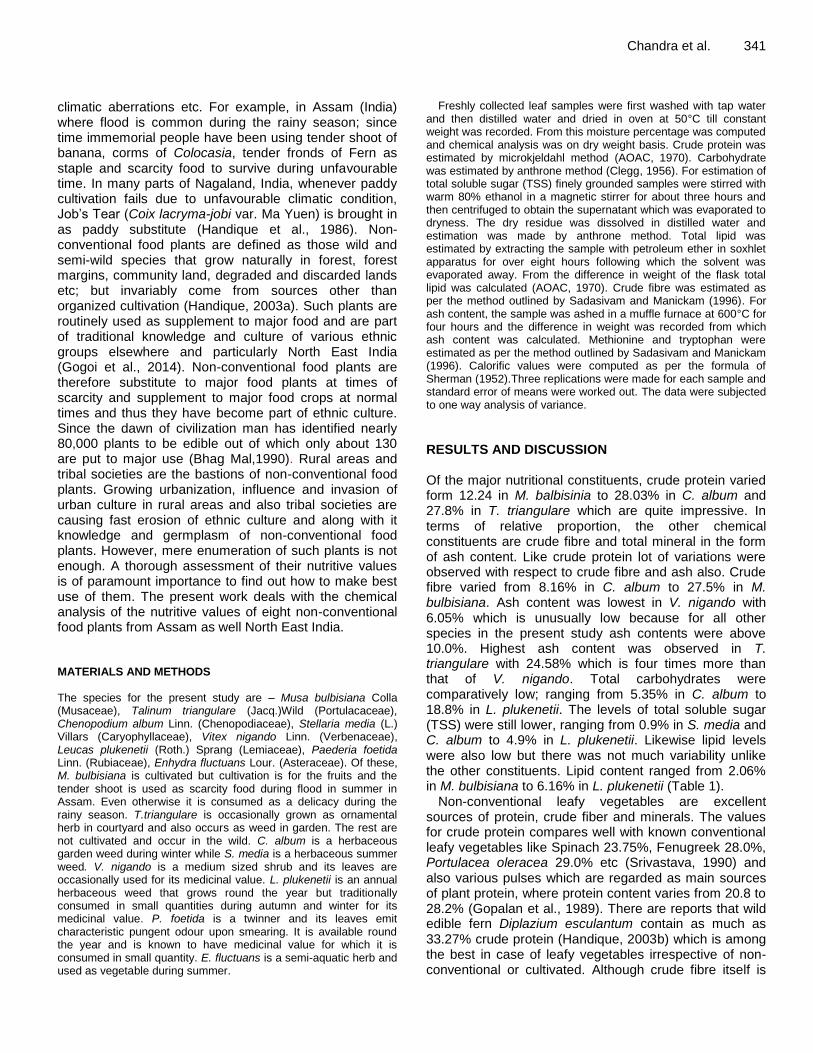
climatic aberrations etc. For example, in Assam (India) where flood is common during the rainy season; since time immemorial people have been using tender shoot of banana, corms of Colocasia, tender fronds of Fern as staple and scarcity food to survive during unfavourable time. In many parts of Nagaland, India, whenever paddy cultivation fails due to unfavourable climatic condition, Job’s Tear (Coix lacryma-jobi var. Ma Yuen) is brought in as paddy substitute (Handique et al., 1986). Non-conventional food plants are defined as those wild and semi-wild species that grow naturally in forest, forest margins, community land, degraded and discarded lands etc; but invariably come from sources other than organized cultivation (Handique, 2003a). Such plants are routinely used as supplement to major food and are part of traditional knowledge and culture of various ethnic groups elsewhere and particularly North East India (Gogoi et al., 2014). Non-conventional food plants are therefore substitute to major food plants at times of scarcity and supplement to major food crops at normal times and thus they have become part of ethnic culture. Since the dawn of civilization man has identified nearly 80,000 plants to be edible out of which only about 130 are put to major use (Bhag Mal,1990). Rural areas and tribal societies are the bastions of non-conventional food plants. Growing urbanization, influence and invasion of urban culture in rural areas and also tribal societies are causing fast erosion of ethnic culture and along with it knowledge and germplasm of non-conventional food plants. However, mere enumeration of such plants is not enough. A thorough assessment of their nutritive values is of paramount importance to find out how to make best use of them. The present work deals with the chemical analysis of the nutritive values of eight non-conventional food plants from Assam as well North East India. MATERIALS AND METHODS The species for the present study are – Musa bulbisiana Colla (Musaceae), Talinum triangulare (Jacq.)Wild (Portulacaceae), Chenopodium album Linn. (Chenopodiaceae), Stellaria media (L.) Villars (Caryophyllaceae), Vitex nigando Linn. (Verbenaceae), Leucas plukenetii (Roth.) Sprang (Lemiaceae), Paederia foetida Linn. (Rubiaceae), Enhydra fluctuans Lour. (Asteraceae). Of these, M. bulbisiana is cultivated but cultivation is for the fruits and the tender shoot is used as scarcity food during flood in summer in Assam. Even otherwise it is consumed as a delicacy during the rainy season. T.triangulare is occasionally grown as ornamental herb in courtyard and also occurs as weed in garden. The rest are not cultivated and occur in the wild. C. album is a herbaceous garden weed during winter while S. media is a herbaceous summer weed. V. nigando is a medium sized shrub and its leaves are occasionally used for its medicinal value. L. plukenetii is an annual herbaceous weed that grows round the year but traditionally consumed in small quantities during autumn and winter for its medicinal value. P. foetida is a twinner and its leaves emit characteristic pungent odour upon smearing. It is available round the year and is known to have medicinal value for which it is consumed in small quantity. E. fluctuans is a semi-aquatic herb and used as vegetable during summer.
Chandra et al. 341
Freshly collected leaf samples were first washed with tap water and then distilled water and dried in oven at 50°C till constant weight was recorded. From this moisture percentage was computed and chemical analysis was on dry weight basis. Crude protein was estimated by microkjeldahl method (AOAC, 1970). Carbohydrate was estimated by anthrone method (Clegg, 1956). For estimation of total soluble sugar (TSS) finely grounded samples were stirred with warm 80% ethanol in a magnetic stirrer for about three hours and then centrifuged to obtain the supernatant which was evaporated to dryness. The dry residue was dissolved in distilled water and estimation was made by anthrone method. Total lipid was estimated by extracting the sample with petroleum ether in soxhlet apparatus for over eight hours following which the solvent was evaporated away. From the difference in weight of the flask total lipid was calculated (AOAC, 1970). Crude fibre was estimated as per the method outlined by Sadasivam and Manickam (1996). For ash content, the sample was ashed in a muffle furnace at 600°C for four hours and the difference in weight was recorded from which ash content was calculated. Methionine and tryptophan were estimated as per the method outlined by Sadasivam and Manickam (1996). Calorific values were computed as per the formula of Sherman (1952).Three replications were made for each sample and standard error of means were worked out. The data were subjected to one way analysis of variance. RESULTS AND DISCUSSION Of the major nutritional constituents, crude protein varied form 12.24 in M. balbisinia to 28.03% in C. album and 27.8% in T. triangulare which are quite impressive. In terms of relative proportion, the other chemical constituents are crude fibre and total mineral in the form of ash content. Like crude protein lot of variations were observed with respect to crude fibre and ash also. Crude fibre varied from 8.16% in C. album to 27.5% in M. bulbisiana. Ash content was lowest in V. nigando with 6.05% which is unusually low because for all other species in the present study ash contents were above 10.0%. Highest ash content was observed in T. triangulare with 24.58% which is four times more than that of V. nigando. Total carbohydrates were comparatively low; ranging from 5.35% in C. album to 18.8% in L. plukenetii. The levels of total soluble sugar (TSS) were still lower, ranging from 0.9% in S. media and C. album to 4.9% in L. plukenetii. Likewise lipid levels were also low but there was not much variability unlike the other constituents. Lipid content ranged from 2.06% in M. bulbisiana to 6.16% in L. plukenetii (Table 1).
Non-conventional leafy vegetables are excellent sources of protein, crude fiber and minerals. The values for crude protein compares well with known conventional leafy vegetables like Spinach 23.75%, Fenugreek 28.0%, Portulacea oleracea 29.0% etc (Srivastava, 1990) and also various pulses which are regarded as main sources of plant protein, where protein content varies from 20.8 to 28.2% (Gopalan et al., 1989). There are reports that wild edible fern Diplazium esculantum contain as much as 33.27% crude protein (Handique, 2003b) which is among the best in case of leafy vegetables irrespective of non-conventional or cultivated. Although crude fibre itself is
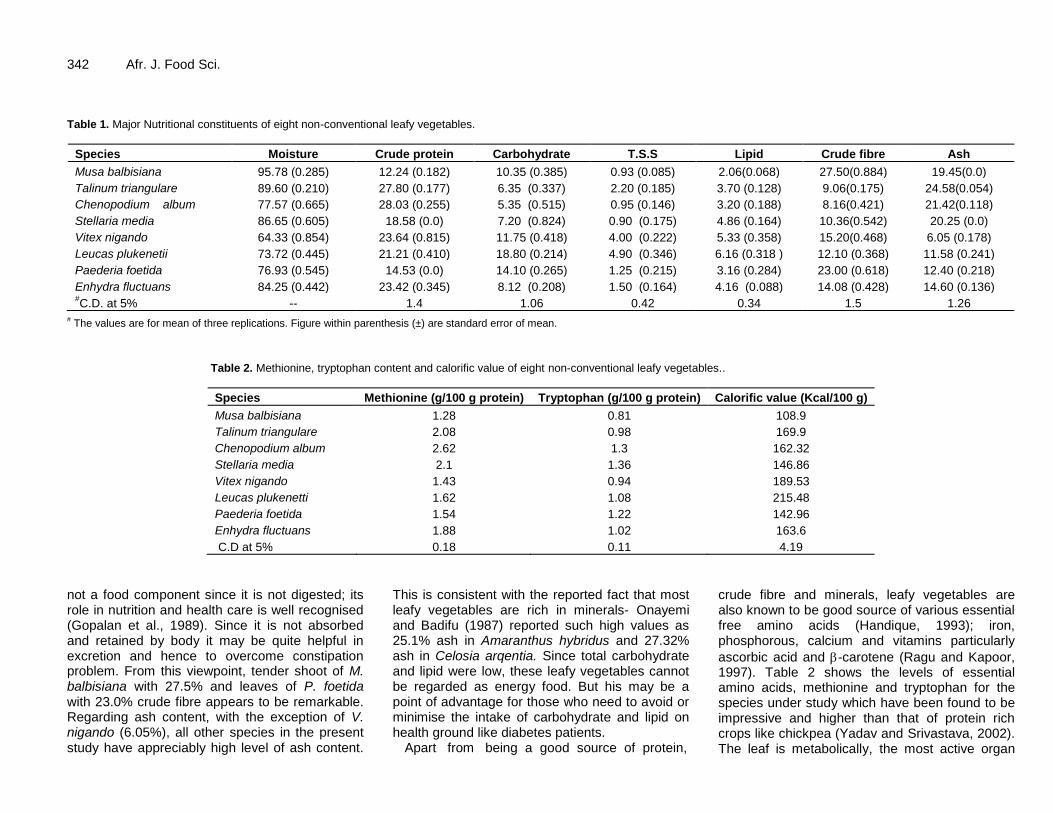
342 Afr. J. Food Sci. Table 1. Major Nutritional constituents of eight non-conventional leafy vegetables.
Species Moisture Crude protein Carbohydrate T.S.S Lipid Crude fibre Ash
Musa balbisiana 95.78 (0.285) 12.24 (0.182) 10.35 (0.385) 0.93 (0.085) 2.06(0.068) 27.50(0.884) 19.45(0.0)
Talinum triangulare 89.60 (0.210) 27.80 (0.177) 6.35 (0.337) 2.20 (0.185) 3.70 (0.128) 9.06(0.175) 24.58(0.054)
Chenopodium album 77.57 (0.665) 28.03 (0.255) 5.35 (0.515) 0.95 (0.146) 3.20 (0.188) 8.16(0.421) 21.42(0.118)
Stellaria media 86.65 (0.605) 18.58 (0.0) 7.20 (0.824) 0.90 (0.175) 4.86 (0.164) 10.36(0.542) 20.25 (0.0)
Vitex nigando 64.33 (0.854) 23.64 (0.815) 11.75 (0.418) 4.00 (0.222) 5.33 (0.358) 15.20(0.468) 6.05 (0.178)
Leucas plukenetii 73.72 (0.445) 21.21 (0.410) 18.80 (0.214) 4.90 (0.346) 6.16 (0.318 ) 12.10 (0.368) 11.58 (0.241)
Paederia foetida 76.93 (0.545) 14.53 (0.0) 14.10 (0.265) 1.25 (0.215) 3.16 (0.284) 23.00 (0.618) 12.40 (0.218)
Enhydra fluctuans 84.25 (0.442) 23.42 (0.345) 8.12 (0.208) 1.50 (0.164) 4.16 (0.088) 14.08 (0.428) 14.60 (0.136) #C.D. at 5%
-- 1.4 1.06 0.42 0.34 1.5 1.26
# The values are for mean of three replications. Figure within parenthesis (±) are standard error of mean.
Table 2. Methionine, tryptophan content and calorific value of eight non-conventional leafy vegetables..
Species Methionine (g/100 g protein) Tryptophan (g/100 g protein) Calorific value (Kcal/100 g)
Musa balbisiana 1.28 0.81 108.9
Talinum triangulare 2.08 0.98 169.9
Chenopodium album 2.62 1.3 162.32
Stellaria media 2.1 1.36 146.86
Vitex nigando 1.43 0.94 189.53
Leucas plukenetti 1.62 1.08 215.48
Paederia foetida 1.54 1.22 142.96
Enhydra fluctuans 1.88 1.02 163.6
C.D at 5% 0.18 0.11 4.19
not a food component since it is not digested; its role in nutrition and health care is well recognised (Gopalan et al., 1989). Since it is not absorbed and retained by body it may be quite helpful in excretion and hence to overcome constipation problem. From this viewpoint, tender shoot of M. balbisiana with 27.5% and leaves of P. foetida with 23.0% crude fibre appears to be remarkable. Regarding ash content, with the exception of V. nigando (6.05%), all other species in the present study have appreciably high level of ash content.
This is consistent with the reported fact that most leafy vegetables are rich in minerals- Onayemi and Badifu (1987) reported such high values as 25.1% ash in Amaranthus hybridus and 27.32% ash in Celosia arqentia. Since total carbohydrate and lipid were low, these leafy vegetables cannot be regarded as energy food. But his may be a point of advantage for those who need to avoid or minimise the intake of carbohydrate and lipid on health ground like diabetes patients.
Apart from being a good source of protein,
crude fibre and minerals, leafy vegetables are also known to be good source of various essential free amino acids (Handique, 1993); iron, phosphorous, calcium and vitamins particularly
ascorbic acid and -carotene (Ragu and Kapoor, 1997). Table 2 shows the levels of essential amino acids, methionine and tryptophan for the species under study which have been found to be impressive and higher than that of protein rich crops like chickpea (Yadav and Srivastava, 2002). The leaf is metabolically, the most active organ

and appears to be in abundance in areas with free amino acid. Impressive amount of various acids were also reported in several non-conventional leafy vegetables from Africa (Nkafamiya et al., 2010; Kubmarawa et al., 2008). Some non-conventional leafy vegetables are known to be rich in dietary antioxidants like flavonoids, tannins etc. and in vitro assay show that they are very efficient in scavenging free radicals (Salam et al., 2011). Since nutritional components are highly variable, calorific values also exhibited wide variation in the range of 108.9 Kcal/100 g in M. bulbisiana to 215.48 Kcal/100 g in L. plukenetii.
It is noteworthy that as per ethnic knowledge and practice particularly in North East India four species in the present study viz: S. media, V. nigando, L. plukenetti and P. foetida are known to have medicinal values as remedies for various stomach ailment. Accordingly they offer dual benefit of nutrition as well medicinal value. Conclusion The present study revealed that T. triangulare, C. album and S. media are excellent sources of protein and minerals with moderate level of crude fibre. On the other hand species like M. bulbisiana, P. foetida are excellent sources of crude fibre with good amount of minerals. There is a general misconception that non-conventional leafy vegetables as well as other edible plants are nutritionally poor and hence unimportant. However, the present study as well as other studies (Handique and Handique, 2005; Gogoi et al., 2014) show that contrary to general belief they are nutritionally very rich which necessitate rethinking about these neglected food plants. Since these leafy vegetables are readily available at nominal or no cost, they are promising low cost food supplement and substitute for major food in times of scarcity. Therefore, they should be considered as reliable ingredients of food security system.
Conflict of Interests
The authors have not declared any conflict of interest.
ACKNOWLEDGEMENT
This work was financed by G.B Pant Institute of Himalayan Environmental and Development, Almora; and Ministry of Environment and Forests, Government of India. The authors are also grateful to Dr. S. Choudhury retired Professor of Botany, Gauhati University for identification of plant species.
Chandra et al. 343 REFERENCES AOAC (1970). Official Methods of Analysis of the Association of Official
Analytical Chemists, 11th Ed. Washington DC. Bhag M (1990). Under–Utilised plants: A treasure house unexplored.
Indian Farming 40:19-24. Clegg KM (1956). The application of anthrone reagent to the estimation
of starch in cereals. J. Food Sci. Agric. 7:40-44. FAO-Traditional Food Plants (1988). A Resource Book for Promoting
the Exploitation and Consumption of Food plants in Arid, semi-arid and Sub humid Lands of Eastern Africa, Food and nutrition paper 4-2. Rome: FAO.
Gogoi D, Rajkhowa RC, Handique AK (2014). Nutritive values of some non-conventional leafy vegetables of ethnic sources from Nagaland, NE India. Int. J. Emerg. Sci. Eng. 2(5):78-79.
Gopalan C, Rama Sastri BV, Balasubramanium SC (1989). Nutritive value of Indian Foods. National Institute of Nutrition, Hyderabad. pp. 25-26, 47-48.
Handique AK (1993). Free amino acid content of some non-conventional leafy vegetables. Crop Res. 6(1):189-193.
Handique AK (2003a) Nutritive values of some non-conventional leafy vegetables from ethnic sources of North East India. Crop Res. 26(2):361-364.
Handique AK (2003b) Nutritive values of five wild edible ferns of North East India-Underutilised plant genetic resources. Indian J. Plant Genet. Resour 16(3):26-28.
Handique AK, Mallick AS, Singh KK (1986). Coix lacryma: A substituted for rice in Nagaland . Indian Farming 36(4):23-26.
Handique GK, Handique AK (2005). Nutritive values of some non-conventional leafy vegetables. Indian J. Agric. Biochem. 18(1):47-49.
Kubmarawa D, Andenyang IFH, Magomya AM (2008). Amino acid profile of two non-conventional leafy vegetables, Sesamum indicum and Balanites aegyptiaca. Afr. J. Biotechnol. 7(19):3502-3504.
Nkafamiya I, Osemeahon SA, Modibbo UU, Aminu A (2010). Nutritional status of non-conventional leafy vegetables,Ficus asperifolia and Ficus sycomorus. Afr. J. Food Sci. 4(3):104-108.
Onayemi O, Badifu GIO (1987). Effect of blanching and drying methods on the nutritional and sensory quality of leafy vegetables. Plant Food Hum. Nutr. 37(4):291-298.
Ragu SL, Kapoor R (1997). Nutritional evaluation of some unconventional greenleafy vegetables of South India. Int. J. Trop. Agric. 15(14):143-148.
Sadasivam S, Manickam A (1996). Biochemical Methods for Agricultural Science. Wiley Eastern Limited, New Delhi. P 18.
Salam SJ, Joylani SD, Rebika ND, Priyadarshini S (2011). Secondary metabolites, antioxidant status and nutritive composition of two non-conventional leafy vegetables-Stellaria media and Chenopodium album L. Indian J. Agric. Biochem. 24(2):136-140.
Sherman HC (1952). Chemistry of Food and Nutrition. The MacMilan Company, New York.
Srivastava GP (1990). Leaf protein: Afuture food source for human nutrition. Indian Farming 40:20-23.
Surjata K, Biseshwori T, Arun KH (2016). Assessment of wild leafy vegetables traditionally consumed by the ethniccommunities of Manipur, northeast India. J. Ethnobiol. Ethnomed. 12:9.
Yadav V, Srivastava GP (2002). Biochemical composition and nutritive value of important genotypes of gram (Cicer arietinum L.). Indian J. Agric. Biochem. 15(2):45-50.

African Journal of
Food Science
Related Journals Published by Academic Journals African Journal of Microbiology Research African Journal of Plant Science International Journal of Genetics and Molecular Biology Journal of Cell and Animal Biology