VOLUME 1 OF 2 - GRANIT
76
VOLUME 1 OF 2 Merrimack County MERRIMACK COUNTY, NEW HAMPSHIRE (ALL JURISDICTIONS) COMMUNITY NAME COMMUNITY NUMBER ALLENSTOWN, TOWN OF 330103 ANDOVER, TOWN OF 330104 BOSCAWEN, TOWN OF 330105 BOW, TOWN OF 330107 BRADFORD, TOWN OF 330106 CANTERBURY, TOWN OF 330108 CHICHESTER, TOWN OF 330109 CONCORD, CITY OF 330110 DANBURY, TOWN OF 330111 DUNBARTON, TOWN OF 330202 EPSOM, TOWN OF 330112 FRANKLIN, CITY OF 330113 HENNIKER, TOWN OF 330114 HILL, TOWN OF 330214 HOOKSETT, TOWN OF 330115 HOPKINTON, TOWN OF 330116 LOUDON, TOWN OF 330117 NEW LONDON, TOWN OF 330230 NEWBURY, TOWN OF 330226 NORTHFIELD, TOWN OF 330118 PEMBROKE, TOWN OF 330119 PITTSFIELD, TOWN OF 330120 SALISBURY, TOWN OF 330121 SUTTON, TOWN OF 330122 WARNER, TOWN OF 330123 WEBSTER, TOWN OF 330236 WILMOT, TOWN OF 330124 EFFECTIVE: APRIL 19, 2010 Federal Emergency Management Agency FLOOD INSURANCE STUDY NUMBER 33013CV001A
Transcript of VOLUME 1 OF 2 - GRANIT
VOLUME 1 OF 2
Merrimack County MERRIMACK COUNTY, NEW HAMPSHIRE (ALL JURISDICTIONS) COMMUNITY NAME COMMUNITY NUMBER ALLENSTOWN, TOWN OF 330103 ANDOVER, TOWN OF 330104 BOSCAWEN, TOWN OF 330105 BOW, TOWN OF 330107 BRADFORD, TOWN OF 330106 CANTERBURY, TOWN OF 330108 CHICHESTER, TOWN OF 330109 CONCORD, CITY OF 330110 DANBURY, TOWN OF 330111 DUNBARTON, TOWN OF 330202 EPSOM, TOWN OF 330112 FRANKLIN, CITY OF 330113 HENNIKER, TOWN OF 330114 HILL, TOWN OF 330214 HOOKSETT, TOWN OF 330115 HOPKINTON, TOWN OF 330116 LOUDON, TOWN OF 330117 NEW LONDON, TOWN OF 330230 NEWBURY, TOWN OF 330226 NORTHFIELD, TOWN OF 330118 PEMBROKE, TOWN OF 330119 PITTSFIELD, TOWN OF 330120 SALISBURY, TOWN OF 330121 SUTTON, TOWN OF 330122 WARNER, TOWN OF 330123 WEBSTER, TOWN OF 330236 WILMOT, TOWN OF 330124
EFFECTIVE: APRIL 19, 2010
Federal Emergency Management Agency FLOOD INSURANCE STUDY NUMBER
33013CV001A
NOTICE TO FLOOD INSURANCE STUDY USERS Communities participating in the National Flood Insurance Program have established repositories of flood hazard data for floodplain management and flood insurance purposes. This Flood Insurance Study (FIS) may not contain all data available within the repository. It is advisable to contact the community repository for any additional data. Part or all of this FIS may be revised and republished at any time. In addition, part of this FIS may be revised by the Letter of Map Revision process, which does not involve republication or redistribution of the FIS. It is, therefore, the responsibility of the user to consult with community officials and to check the community repository to obtain the most current FIS components. Initial Countywide FIS Effective Date: April 19, 2010 Revised Countywide FIS Date:
i
TABLE OF CONTENTS
Page
1.0 INTRODUCTION 1 1.1 Purpose of Study 1 1.2 Authority and Acknowledgments 1 1.3 Coordination 5
2.0 AREA STUDIED 7 2.1 Scope of Study 7 2.2 Community Description 8 2.3 Principal Flood Problems 13 2.4 Flood Protection Measures 14
3.0 ENGINEERING METHODS 17 3.1 Hydrologic Analyses 17 3.2 Hydraulic Analyses 28 3.3 Vertical Datum 35
4.0 FLOODPLAIN MANAGEMENT APPLICATIONS 36 4.1 Floodplain Boundaries 36 4.2 Floodways 37
5.0 INSURANCE APPLICATIONS 59
6.0 FLOOD INSURANCE RATE MAP 60
7.0 OTHER STUDIES 61
8.0 LOCATION OF DATA 61
9.0 BIBLIOGRAPHY AND REFERENCES 65
ii
TABLE OF CONTENTS – continued
VOLUME 1 :
Page
FIGURES Figure 1 - Floodway Schematic 40 TABLES Table 1 - Initial and Final CCO Meetings 6 Table 2 - Flooding Sources Studied by Detailed Methods 7 Table 3 - Summary of Discharges 22-26 Table 4 - Summary of Stillwater Elevations 28 Table 5 - Manning's "n" Values 35 Table 6 - Floodway Data 41-58 Table 7 - Community Map History 62-64
iii
TABLE OF CONTENTS – continued VOLUME 2:
EXHIBITS Exhibit 1 - Flood Profiles Blackwater River Panel 1P-08P Chance Pond Brook Panel 9P-16P Contoocook River Panel 17P-29P Dalton Brook Panel 30P-36P Glines Brook Panel 37P Little Suncook River Panel 38P-41P Merrimack River Panel 42P-48P Messer Brook Panel 49P-53P Pemigewasset River Panel 54P Peters Brook Panel 55P-61P Sanders Brook Panel 62P Soucook River Panel 63P-65P Suncook River Panel 66P-83P Tannery Brook Panel 84P-86P The Outlet Panel 87P-89P Tioga River Panel 90P Tributary A Panel 91P-92P Warner River Panel 93P-100P West Channel Suncook River Panel 101P Williams Brook Panel 102P-104P Winnipesaukee River Panel 105P-112P Exhibit 2 - Flood Insurance Rate Map Index Flood Insurance Rate Map

1
FLOOD INSURANCE STUDY MERRIMACK COUNTY, NEW HAMPSHIRE (ALL JURISDICTIONS)
1.0 INTRODUCTION
1.1 Purpose of Study This countywide Flood Insurance Study (FIS) investigates the existence and
severity of flood hazards in, or revises and updates previous FISs/Flood Insurance Rate Maps (FIRMs) for the geographic area of Merrimack County, New Hampshire, including: the Towns of Allenstown, Andover, Boscawen, Bow, Bradford, Canterbury, Chichester, Danbury, Dunbarton, Epsom, Henniker, Hill, Hooksett, Hopkinton, Loudon, Newbury, New London, Northfield, Pembroke, Pittsfield, Salisbury, Sutton, Warner, Webster, and Wilmot; and the Cities of Concord and Franklin (hereinafter referred to collectively as Merrimack County).
This FIS aids in the administration of the National Flood Insurance Act of 1968 and
the Flood Disaster Protection Act of 1973. This FIS has developed flood risk data for various areas of the county that will be used to establish actuarial flood insurance rates. This information will also be used by Merrimack County to update existing floodplain regulations as part of the Regular Phase of the National Flood Insurance Program (NFIP), and will also be used by local and regional planners to further promote sound land use and floodplain development. Minimum floodplain management requirements for participation in the NFIP are set forth in the Code of Federal Regulations at 44 CFR, 60.3.
In some States or communities, floodplain management criteria or regulations may
exist that are more restrictive or comprehensive than the minimum Federal requirements. In such cases, the more restrictive criteria take precedence and the State (or other jurisdictional agency) will be able to explain them.
1.2 Authority and Acknowledgments
The sources of authority for this FIS are the National Flood Insurance Act of 1968
and the Flood Disaster Protection Act of 1973. This FIS was prepared to include the incorporated communities within Merrimack
County in a countywide format. Information on the authority and acknowledgments for each jurisdiction included in this countywide FIS, as compiled from their previously printed FIS reports, is shown below.
Allenstown, Town of: the hydrologic and hydraulic analyses from the
FIS report dated October 1978 were performed by Anderson-Nichols & Company, Inc., for the Federal Insurance Administration (FIA), under Contract No. H-3862. That work, which was completed in August 1977, covered all
2
significant flooding sources affecting the Town of Allenstown.
Boscawen, Town of: the hydrologic and hydraulic analyses from the
FIS report dated January 1979 were performed by Anderson-Nichols & Company, Inc., for the FIA under Contract No. H-3862. That work, which was completed in October 1977, covered all significant flooding sources in the Town of Boscawen.
Bow, Town of: the hydrologic and hydraulic analyses from the
original October 1978 FIS report and April 16, 1979, FIRM (hereinafter referred to as the 1979 FIS), were prepared by Anderson-Nichols & Company, Inc., for the FIA, under Contract No. H-3862. That work was completed in July 1977.
The hydraulic analyses for the Merrimack River
from the FIS report dated November 20, 2000, were prepared by Roald Haestad, Inc., for the Federal Emergency Management Agency (FEMA), under Contract No. EMB-96-CO-0405. That work was completed in June 1997.
Bradford, Town of: the hydrologic and hydraulic analyses from the
FIS report dated April 15, 1992, were prepared by the U.S. Geological Survey (USGS) for FEMA, under Inter-Agency Agreement No. EMW-88-E-2738, Project Order No. 4. That work was completed in December 1989.
Canterbury, Town of: the hydrologic and hydraulic analyses from the
FIS report dated November 1978 were performed by Anderson-Nichols and Company, Inc., for the FIA under Contract No. H-3862. That work, which was completed in September 1977, covered all significant flooding sources affecting the Town of Canterbury.
Chichester, Town of: the hydrologic and hydraulic analyses from the
FIS report dated March 1978 were performed by Hamilton Engineering Associates, Inc., for the FIA under Contract No. H-3990. That work, which was completed in April 1977, covered all significant flooding sources affecting the Town of Chichester.
3
Concord, City of: the hydrologic and hydraulic analyses from the FIS report dated September 1979 and the FIRM dated March 4, 1980 (hereinafter referred to as the 1980 FIS), were prepared by Anderson-Nichols & Company, Inc., for the FIA, under Contract No. H-3862. That work was completed in September 1977.
the hydrologic and hydraulic analyses for the
Merrimack River from the FIS report dated August 23, 1999, were prepared by Roald Haestad, Inc., for FEMA, under Contract No. EMB-96-CO-0405. That work was completed in June 1997.
Epsom, Town of: the hydrologic and hydraulic analyses from the
FIS report dated January 1978 were performed by Hamilton Engineering Associates, Inc., for the FIA under Contract No. H-3990. That work, which was completed in April 1977, covered all significant flooding sources affecting the Town of Epsom.
Franklin, City of: the hydrologic and hydraulic analyses from the
FIS report dated March 1979 were performed by Anderson-Nichols for the FIA, under Contract No. H-3862. That work, which was completed in October 1977, covered all significant flooding sources in the City of Franklin.
Henniker, Town of: the hydrologic and hydraulic analyses from the
FIS report dated November 1977 were performed by Hamilton Engineering Associates, Inc., for the FIA, under Contract No. H-3990. That work, which was completed in December 1976, covered all significant flooding sources affecting the Town of Henniker.
Hooksett, Town of: the hydrologic and hydraulic analyses from the
FIS report dated March 1982 were performed by Anderson-Nichols & Company, Inc., for the FIA, under Contract No. H-3862. That work, which was completed in July 1977, covered all significant flooding sources affecting the Town of Hooksett.
Hopkinton, Town of: the hydrologic and hydraulic analyses from the
FIS report dated May 17, 1988, were prepared by
4
Costello, Lomasney & deNapoli, Inc., for FEMA, under Contract No. EMW-84-R-1600. That work was completed in March 1986.
New London, Town of: the hydrologic and hydraulic analyses from the
FIS report dated July 16, 1991, were prepared by the Soil Conservation Service (SCS) during the preparation of the FIS for the Town of Sunapee.
Northfield, Town of: the hydrologic and hydraulic analyses from the
FIS report dated December 1978 were performed by Anderson-Nichols & Company, Inc., for the FIA, under Contract No. H-3862. That work, which was completed in October 1977, covered all significant flooding sources affecting the Town of Northfield.
Pembroke, Town of: the hydrologic and hydraulic analyses from the
FIS report dated October 1978 were performed by Anderson-Nichols & Company, Inc., for the FIA, under Contract No. H-3862. That work, which was completed in August 1977, covered all significant flooding sources affecting the Town of Pembroke.
Pittsfield, Town of: the hydrologic and hydraulic analyses from the
FIS report dated January 1978 were performed by Hamilton Engineering Associates, Inc., for the FIA under Contract No. H-3990. That work, which was completed in April 1977, covered all significant flooding sources affecting the Town of Pittsfield.
Warner, Town of: the hydrologic and hydraulic analyses from the
FIS report dated June 4, 1987, were prepared by Costello, Lomasney & deNapoli, Inc., for FEMA under Contract No. EMW-84-R-1600. That work was completed in January 1986.
Webster, Town of: the hydrologic and hydraulic analyses from the
FIS report dated June 2, 1993, were prepared by the USGS for FEMA, under Inter-Agency Agreement No. EMW-91-3535, Project Order No. 5. That work was completed in January 1992.
5
The authority and acknowledgments for the Towns of Andover, Danbury, Dunbarton, Hill, Loudon, Newbury, Salisbury, Sutton, and Wilmot are not available because no FIS reports were ever published for those communities.
Base map information for surface water features was derived from digital orthophoto quadrangles (DOQs) at an approximate scale of 1:1,000. Further information was derived from U.S. Geological Survey (USGS) Digital Line Graphs. Additional information may have been derived from other sources. Users of this FIRM should be aware that minor adjustments may have been made to specific base map features. The coordinate system used for the production of this FIRM is Universal Transverse Mercator (UTM), North American Datum of 1983 (NAD 83), Clarke 1866 spheroid. Corner coordinates shown on the FIRM are in latitude and longitude referenced to the UTM projection, NAD 83. Differences in the datum and spheroid used in the production of FIRMs for adjacent counties may result in slight positional differences in map features at the county boundaries. These differences do not affect the accuracy of information shown on the FIRM.
1.3 Coordination Consultation Coordination Officer’s (CCO) meetings may be held for each
jurisdiction in this countywide FIS. An initial CCO meeting is held typically with representatives of FEMA, the community, and the study contractor to explain the nature and purpose of a FIS, and to identify the streams to be studied by detailed methods. A final CCO meeting is held typically with representatives of FEMA, the community, and the study contractor to review the results of the study.
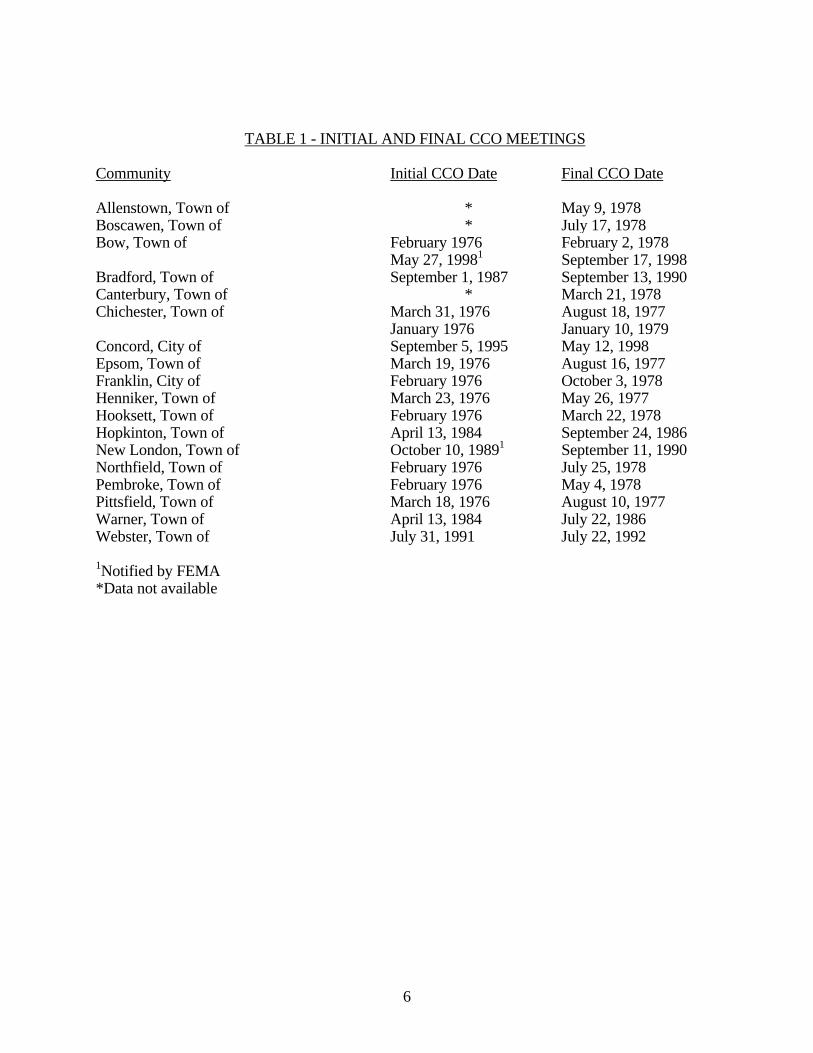
The dates of the initial and final CCO meetings held for the incorporated
communities within Merrimack County are shown in Table 1, "Initial and Final CCO Meetings."
The results of this countywide study were reviewed at the final CCO meeting held on January 17, 2008, and attended by representatives of FEMA, Code Enforcement Officers, Planning Board members, Zoning Board members and Town Administrators of several jurisdictions. All problems raised at that meeting have been addressed in this study.
6
TABLE 1 - INITIAL AND FINAL CCO MEETINGS Community Initial CCO Date Final CCO Date
Allenstown, Town of * May 9, 1978 Boscawen, Town of * July 17, 1978 Bow, Town of February 1976
May 27, 19981February 2, 1978September 17, 1998
Bradford, Town of September 1, 1987 September 13, 1990Canterbury, Town of * March 21, 1978Chichester, Town of March 31, 1976 August 18, 1977 Concord, City of
January 1976September 5, 1995
January 10, 1979May 12, 1998
Epsom, Town of March 19, 1976 August 16, 1977Franklin, City of February 1976 October 3, 1978Henniker, Town of March 23, 1976 May 26, 1977 Hooksett, Town of February 1976 March 22, 1978Hopkinton, Town of April 13, 1984 September 24, 1986New London, Town of October 10, 19891 September 11, 1990Northfield, Town of February 1976 July 25, 1978 Pembroke, Town of February 1976 May 4, 1978 Pittsfield, Town of March 18, 1976 August 10, 1977Warner, Town of April 13, 1984 July 22, 1986 Webster, Town of July 31, 1991 July 22, 1992 1Notified by FEMA *Data not available
7
2.0 AREA STUDIED
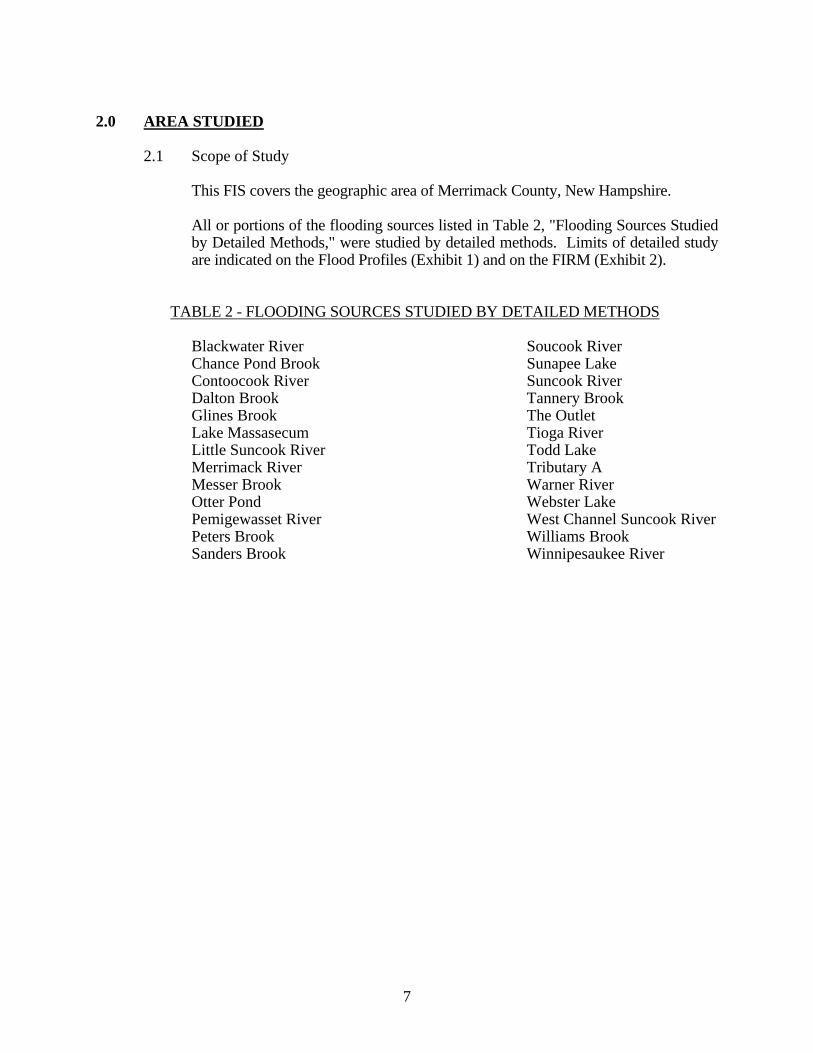
2.1 Scope of Study This FIS covers the geographic area of Merrimack County, New Hampshire. All or portions of the flooding sources listed in Table 2, "Flooding Sources Studied
by Detailed Methods," were studied by detailed methods. Limits of detailed study are indicated on the Flood Profiles (Exhibit 1) and on the FIRM (Exhibit 2).
TABLE 2 - FLOODING SOURCES STUDIED BY DETAILED METHODS
Blackwater River Chance Pond Brook Contoocook River Dalton Brook Glines Brook Lake Massasecum Little Suncook River Merrimack River Messer Brook Otter Pond Pemigewasset River Peters Brook Sanders Brook
Soucook River Sunapee Lake Suncook River Tannery Brook The Outlet Tioga River Todd Lake Tributary A Warner River Webster Lake West Channel Suncook River Williams Brook Winnipesaukee River
8
The areas studied by detailed methods were selected with priority given to all
known flood hazard areas and areas of projected development and proposed construction.
All or portions of numerous flooding sources in the county were studied by
approximate methods. Approximate analyses were used to study those areas having a low development potential or minimal flood hazards. The scope and methods of study were proposed to, and agreed upon by, FEMA and Merrimack County.
2.2 Community Description
Merrimack County is located in the south-central part of New Hampshire. The 2000 population of Merrimack County was 136,225. The population increased
13.3 percent from 1990 to 2000.
The climate of Merrimack County is typical of the Merrimack Valley with warm summers and cool winters. Temperatures during the month of July range from an average high of 82 degrees Fahrenheit (°F) to an average low of 58°F. Temperatures in January range from an average high of 32°F to an average low of 11°F. Prolonged periods of severe cold are rare. Average annual precipitation is 38 inches, of which approximately 17 percent is in the form of snow (U.S. Department of Commerce, 1975; U.S. Department of Commerce, 1968). The hilly topography of Merrimack County is characterized by stratified and unstratified material transported by a retreating glacial ice sheet. Along the streams, alluvial silt covers the glacial outwash deposits to form the floodplains. The predominant soil group is comprised mainly of well-drained sandy loam in glacial till. Several glacial landforms are found in the area such as kames, terraces, deltas, and outwash plains. Elevations above the North American Vertical Datum (NAVD) range from approximately 200 feet at the Merrimack River to 830 feet at Bear Hill. The principal stream in the Town of Allenstown is the Merrimack River, which originates at the confluence of the Pemigewasset and Winnipesaukee Rivers in the City of Franklin, New Hampshire, approximately 31 miles north of Allenstown. It flows in a southerly direction from Franklin through south-central New Hampshire and northeastern Massachusetts until it empties into the Atlantic Ocean near Newburyport, Massachusetts, a distance of 116 miles. The Suncook River originates at the outlet of the Upper and Lower Suncook Lakes in Barnstead and flows in a southwesterly direction to form the boundary between Allenstown and Pembroke before emptying into the Merrimack River below Suncook. The Merrimack River floodplain ranges in width from 800 to 1,900 feet through the study area. This floodplain consists primarily of agricultural areas. The floodplain of the Suncook River ranges in width from 60 to 2,200 feet. This latter floodplain is generally open or wooded, with sparse development consisting of residential and some industrial buildings.
9
The principal stream in the Town of Boscawen is the Merrimack River, which enters Boscawen from the north and flows southeasterly through the town. The centerline of the river serves as the boundary between Boscawen and Canterbury. The Contoocook River originates at Contoocook Lake in the southeastern part of Jaffrey, New Hampshire. In the Town of Boscawen, the Contoocook River is located in the extreme southeastern corner of Boscawen at its confluence with the Merrimack River. Tannery Brook originates in the northwestern corner of Boscawen and flows in a southeasterly direction to its confluence with the Merrimack River. Tributary A originates in Boscawen and flows to the north and east until it empties into the Merrimack River. Glines Brook originates in northern Boscawen and flows east to the Merrimack River. The Merrimack River floodplain varies in width from approximately 200 to 6,600 feet through the study area. Agriculture is the principal land use in the floodplain; however, some of the land is devoted to residential and commercial development. The heavily developed Penacook area occupies the floodplain of the Contoocook River between Concord and Boscawen. Tanneries and general retail commercial establishments are the principal industries. The floodplains of all other detail streams are wooded with sparse residential and commercial development. The topography of Boscawen is dominated by three major hills: Knowlton Hill, Choate Hill, and the hill southeast of Walker Pond. Low-lying bogs extend between intermittent outwash terraces located parallel to the hills. Runoff from these low-lying bogs supply Tannery Brook, Glines Brook, and Tributary A. The soil complexes in the Boscawen area were developed from the past glacial action in the Merrimack River valley. In general, these soils are well drained, sorted sands with silt and gravel overlying glacial till. Because of glaciation, the floodplains contain greater accumulation of soils in the low areas with shallow mantles overlying the hillside slopes (Edwards and Kelcey, Inc., 1964; U.S. Department of Agriculture, 1965). The hilly topography of the Town of Bow is characterized by stratified and unstratified material transported by a retreating glacial ice sheet. The predominant soil group is comprised mainly of well-draining sandy loam in glacial till. Several glacial land forms are found in the area such as kames, terraces, deltas, and outwash plains. Elevations range from approximately 195 feet NAVD at the Merrimack River to a high of over 910 feet NAVD on Picked Hill in the southwestern area of the town. Wet, swampy areas that serve as the headwaters for many of the streams in the area are scattered throughout the town. Streams flow from these high-lying bogs, but turn to steeper grades early in their courses. These bogs provide significant floodwater storage and tend to reduce the peak discharges on the streams in Bow (U.S. Department of Agriculture, 1965; U.S. Department of Agriculture, 1968).
10
Topography within the Town of Bradford varies widely. The town is located just east of the Lovewell Mountain-Sunapee Mountain area. Several locations within the town have elevations that approach or are slightly greater than 2,000 feet NAVD. In contrast, significant low-lying areas surround reaches of the Warner River and Lake Massasecum. The Warner River, Todd Lake, and Lake Massasecum are the most significant water bodies in the town. The Warner River originates in the Sunapee Mountain area just northwest of Bradford. The river has an average slope of 100 feet per mile from its headwaters to State Route 114. Downstream of the State Route 114 bridge, the river has a mild gradient. In the vicinity of the Warner-Bradford corporate limits, the gradient of the river increases sharply. The principal tributary streams to the Warner River in Bradford include Todd Lake outlet, Lake Massasecum outlet, and Hoyt Brook. The drainage area of the Warner River at the downstream Warner-Bradford corporate limits is approximately 58.9 square miles. In the Town of Warner, the Warner River flows in an eastern direction through the southern part of Warner and through Webster until it reaches its confluence with the Contoocook River in Hopkinton, New Hampshire. The Warner River floodplain ranges in width from 45 to 1,050 feet throughout the Town of Warner. The floodplain contains swampy wetlands that provide natural storage areas. Elevations range from approximately 350 feet NAVD at the eastern end of the town to approximately 2,937 feet NAVD at the summit of Mount Kearsarge, the highest point in the town (U.S. Department of the Interior, 1949, et cetera). Todd Lake has a drainage area of approximately 19.2 square miles at its outlet. Andrew Brook, the principal inlet stream to the lake, originates at Lake Solitude in the Sunapee Mountain area. Elevations on Todd Lake are controlled by the dam at its outlet. Lake Massasecum outlet stream has a drainage area of approximately 10.0 square miles at its mouth. Flood elevations on Lake Massasecum are controlled by backwater from the Warner River. In the Town of Chichester, the principal watercourse is the Suncook River. Originating to the south of Lake Winnipesaukee in Gilford, New Hampshire, the Suncook River flows in a southerly direction entering Chichester at an elevation of approximately 415 feet NAVD, with a drainage area of approximately 145 square miles. After forming a portion of Chichester’s eastern boundary, the Suncook River exits at an elevation of approximately 325 feet NAVD, with a drainage area of approximately 161 square miles. From this point, the river flows south for approximately 13 miles to its confluence with the Merrimack River below the Village of Suncook, New Hampshire. Sanders Brook begins near Bear Hill, and flows in a generally southeasterly direction to its confluence with the Suncook River below the State Route 28 bridge, a short distance away from the Chichester-Epsom town boundary. The stream has a drainage area of just under 3 square
11
miles. In addition to the Suncook River and Sanders Brook, there are numerous smaller watercourses in the town which flow into these two streams. The floodplains along the study streams are generally sparsely developed. Some development is present in North Chichester and at Websters Mill adjacent to the Suncook River. Soils in the floodplain areas are primarily of the Ondawa-Windsor-Agawam association, and are characterized by rapid permeability and moderate susceptibility to frost action. Soils within the drainage basin are mostly made up of these from the Paxton-Shapleigh-Woodbridge or Gloucester-Shapleigh-Whitman associations noted for moderate to rapid permeability and moderate frost susceptibility. Approximately 80 percent of Merrimack County is forested with transition hardwood, white pine and hemlock vegetation. Trees include sugar and red maples, beech, red and white pine, hemlock, red and white oak, paper and gray birch, balsam fir and hickory. In the City of Concord, the Soucook River originates in Loudon, New Hampshire, at the confluence of Clark Brook and Gues Meadow Brook. It flows in a southwesterly direction until it empties into the Merrimack River at the Concord-Pembroke-Bow town boundary. The Outlet originates from its diversion with the Contoocook River and runs generally parallel to the river until it reunites with the Contoocook River. The floodplains of the Contoocook and Soucook Rivers and The Outlet range in width from 90 to 2,400 feet. These floodplains are generally wooded, and their development consists of residential and agricultural areas with some industrial development. In the Town of Epsom, the Suncook River enters at an elevation of approximately 325 feet NAVD, with a drainage area of approximately 161 square miles. The river flows through the western portion of the town and exits to the south at an elevation of approximately 280 feet NAVD with a drainage area of approximately 225 square miles. The Suncook River continues in a southwesterly direction for approximately 5 miles, and converges with the Merrimack River below the Village of Suncook, New Hampshire. The Little Suncook River originates at Northwood Lake just to the west of the Epsom-Northwood town boundary. Flowing in a westerly direction, the Little Suncook River almost bisects Epsom as it converges with the Suncook River near Gossville. At this confluence, the river has a drainage area of approximately 41 square miles. In addition to the Suncook and Little Suncook Rivers, there are numerous smaller streams in the town which flow into these two rivers. The floodplains along the Suncook and Little Suncook Rivers are generally sparsely developed. Exceptions are areas near the intersection of State Routes 4, 202, and 9 adjacent to the Suncook River and near Gossville and Epsom Center along the Little Suncook River.
12
The principal streams in the City of Franklin are the Merrimack, Winnipesaukee, and Pemigewasset Rivers and Chance Pond Brook. The Pemigewasset River originates at Profile Lake in Franconia, New Hampshire. It flows in a southerly direction through central New Hampshire to its confluence with the Winnipesaukee River, where they combine to form the Merrimack River. Chance Pond Brook originates at the outlet of Webster Lake in Franklin, New Hampshire. It flows in a southeasterly direction to its confluence with the Pemigewasset River in Franklin. In the Town of Henniker, the Contoocook River flows in a northeasterly direction through Hillsborough, entering Henniker on the west, at an approximate elevation of 540 feet NAVD. The Contoocook River continues flowing in an easterly direction through the center of Henniker, where it has a drainage area of approximately 378 square miles (at the State Route 114 bridge). Entering Hopkinton at an approximate elevation of 360 feet NAVD, the Contoocook River flows in a northeasterly direction until it joins the Merrimack River in the City of Concord and the Town of Boscawen. Henniker has certain natural features which affect flood conditions. Topographic maps indicate that there are no less than 30 distinct peaks within the town, the highest being Carter Hill at over 1,500 feet NAVD. Nearly 17% of Henniker consists of slopes greater than 25% and another 36% consists of slopes from 15 to 25%. These steep slopes produce land which is unsuitable for farming or residential use; consequently, the area is largely wooded, but has some pastureland. The principal stream in the Town of Northfield is the Winnipesaukee River which originates at the outlet of Lake Winnipesaukee in Laconia. It flows in a southerly direction through Paugus and Opechee Bays and Winnisquam and Silver Lakes for a distance of approximately 12 miles, then in a westerly direction for 11 miles to its confluence with the Pemigewasset River in Franklin. The centerline of the stream serves as the boundary between Northfield and Tilton and then Northfield and Franklin. The Tioga River originates northeast of Belmont center and flows in a westerly and then northwesterly direction to its mouth at the Winnipesaukee River. Williams Brook originates near Bean Hill in south-central Northfield and flows in a northwesterly direction to its mouth at the Winnipesaukee River. The Winnipesaukee River floodplain ranges in width from 100 to 900 feet through the study area. This floodplain is generally open or wooded, with some residential development in the area of Northfield Center. The floodplain of the Merrimack River ranges in width from 100 to 750 feet through the study area. This latter floodplain is primarily wooded although there are some open areas. The Tioga River floodplain ranges in width from 300 to 1,300 feet through the study area and is primarily wooded. The floodplain of Williams Brook ranges in width from 80 to
13
400 feet through the study area and is generally open or wooded with some residential development.
2.3 Principal Flood Problems
In the Towns of Allenstown, Boscawen, Bow, Canterbury, Hooksett, and Pembroke, and the Cities of Concord and Franklin major floods occur on the Merrimack River during the spring, fall, and winter seasons. Some of the more severe flooding occurs in early spring as a result of snowmelt and heavy rains in conjunction with ice jams. Autumn is another critical season for flood danger because of heavy rainfall associated with storms of tropical origin. Minor flooding incidences in the Towns of Allenstown, Boscawen, Bow, Canterbury, Hooksett, Northfield, and Pembroke, and the Cities of Concord and Franklin can occur at any time of the year, as even heavy thunderstorms can result in rapid runoff and flooding in the downstream portion of the small streams. Repeated damage to structures in the floodplains has occurred in 1936, 1938, 1951, 1953, and 1960; with the 1936 flood being the largest of these floods (USGS, 1974). Analysis of USGS gage station records for the Merrimack River at Goffs Falls (No. 01092000) and other stages (discharge record maintained by Public Service Company of New Hampshire for Garvins Falls) indicates that this 1936 flood exceeded the 100-year event for the Towns of Allenstown, Boscawen, Bow, Canterbury, Hooksett, and Pembroke, and the City of Concord. This same 1936 flood was a 90-year event for the City of Franklin and the Town of Northfield. The estimated frequency of this flood was based on natural discharges, unmodified for the effects of upstream flood control structures built after 1936. Damage due to the 1936 flood was estimated (1936 dollars) at 35 million dollars over the entire Merrimack River watershed (USACE, 1973). The USGS has operated 2 stream gage stations in the Warner River basin. Gage station No. 01085800 on the West Branch of Warner River near Bradford (drainage area 5.75 square miles) started operating in 1962. During the period from 1962 to 1988, the maximum flood peak recorded was 800 cubic feet per second (cfs). This flood occurred on May 29, 1984. Gage station No. 01086000, on the Warner River at Davisville (drainage area 146 square miles) was operated from 1939 through 1978. During the period of record, the maximum flood peak recorded was 4,510 cfs. This flood occurred on March 27, 1953. Notable flooding occurred in the Town of Bradford in 1987. According to local residents and officials at the New Hampshire Department of Water Resources, peak elevations of 674.3 feet NAVD and 642.5 feet NAVD occurred on Todd Lake and Lake Massasecum, respectively. The 1987 flood elevations on Todd Lake and Lake Massasecum are less than those expected for a flood with a recurrence interval of 100 years. During flood events extensive low-lying areas along the shores of the Warner River, Todd Lake, and Lake Massasecum are subject to flooding. In the Town of Chichester, flooding along the Suncook River may occur during all seasons of the year. Frequent flooding occurs along the Suncook River at its
14
junctions with Perry Brook and Sanders Brook. At these locations, water overflows the banks of the Suncook River, flooding the surrounding lowlands. In March 1936, two floods occurred resulting in one of the largest floods of record for the Towns of Chichester and Pittsfield. The second of these floods was larger and produced the more severe flood conditions. A combination of saturated ground, warm temperatures, melting snow, filled lakes and reservoirs, high river flows from the past storm, and heavy rains from the second storm resulted in a peak discharge of 12,900 cfs at a gage station in North Chichester along the Suncook River. Train service in the area was disrupted and the Suncook Bridge was destroyed. Another large flood resulted from hurricane rains falling on saturated ground in September of 1938. This produced a peak discharge of 12,100 cfs at the gage station. The earliest recorded major flood occurred in 1896. In the Town of Epsom, flooding along the Suncook and Little Suncook Rivers may occur during all seasons of the year. Some natural floodwater storage exists in the upper portions of the Suncook River. Considerable storage exists in drainage areas contributing to the Little Suncook River. However, at the Little Suncook River confluence with the Suncook River there is considerable flooding. Flood problems also exist at the outlet of Northwood Lake. Flooding occurred in Epsom on March 13 and 14, 1977, along the Suncook River at Bear Island Park, Epsom-Four Corners, and at the camps along Buck Street Extension. In the Town of Henniker, flooding along the Contoocook River may occur throughout the year. River stages can rise from normal elevations to extreme flood stages in a relatively short period of time, due to the numerous steep tributaries. The watershed is hilly and largely forest-covered; other than the Edward MacDowell Reservoir on Nubanusit Brook, there is little effective pond or valley storage. During the 1936 flood, the USACE records at the USGS gage in Penacook indicate the Contoocook River was approximately an 80-year event. One of the largest floods of record occurred along the Contoocook River, which resulted from the September 1938 hurricane (USGS, 1940). Another large flood occurred in March 1936, which resulted from two closely occurring storms combined with considerable snowmelt. In addition, huge ice flows jammed at bridges and dams, with devastating effects (USGS, 1937). Extensive flooding occurred in the flat area surrounding the Contoocook Valley Paper Company during both these floods. The State Route 114 bridge in the center of Henniker was destroyed during the 1938 flood.
2.4 Flood Protection Measures There are five dams designed for flood control on the Merrimack River. They were
constructed and are being operated by the New England Division, U.S. Army Corps
15
of Engineers (USACE). These structures are the Franklin Falls Dam on the Pemigewasset River, the Edward MacDowell Dam on Nubanusit Brook, the Blackwater Dam on the Blackwater River, and two dams controlling Hopkinton-Everett Reservoir: Everett Dam on the Piscataquog River and the Hopkinton Flood Control Dam on the Contoocook River.
In 1950, the USACE completed the Edward MacDowell Dam, thereby creating MacDowell Reservoir, most of which lies in the Town of Peterborough, Hillsborough County. The Reservoir was built to protect properties along Nubanusit Brook, the Contoocook River, and the Merrimack River from extensive floodflows. In 1962, the USACE completed the Hopkinton-Everett Reservoir, consisting of a dam, a canal, two large dikes, and a spillway in the Contoocook River watershed; and a dam, a spillway, and two large dikes in the Piscataquog River watershed. The two storage areas formed have a capacity of 70,800 acre-feet in the Contoocook River watershed and 86,500 acre-feet in the Piscataquog River watershed. These areas are connected by a second canal, 13,900 feet long, so that the floodwaters may be transferred. The project provided general protection for property along the Contoocook, Piscataquog, and Merrimack Rivers. The Hopkinton-Everett Reservoir provides no flood protection for the Town of Henniker, with the exception of the reservoir easement. The reservoir easement prevents the building of homes and businesses in areas which would be inundated if the reservoir reaches full capacity. No flood protection measures exist on the Suncook River in the Towns of Allenstown and Pembroke and no plans have been disclosed for the implementation of any future flood protection measures. In addition, no flood protection measures exist on the Soucook River in the Town of Pembroke and no plans have been disclosed for the implementation of any future flood protection measures. There are no formal flood fighting or emergency evacuation plans for the Town of Boscawen. The town’s Civil Defense Office is responsible for alerting residents of impending disasters and coordinating any emergency operations with town and state public service agencies. No flood protection measures exist on Tannery Brook, Glines Brook, Tributary A, or Allen Brook in the Town of Boscawen and no plans were disclosed for the implementation of any future flood protection measures. The Garvins Falls Dam in the Town of Bow is not a flood control structure. There are no flood protection measures in or affecting the Town of Bradford. There are no formal flood fighting or emergency evacuation plans for the Town of Canterbury.
16
There are no flood protection measures on streams in the Town of Chichester. Some natural floodwater storage would occur, however, where wide floodplains or swamp areas exist along the Suncook River and Sanders Brook. In the City of Concord, no flood protection measures exist on the Soucook River or on streams studied by approximate methods, and no plans have been disclosed for the implementation of any future flood protection measures. However, the city has prepared an emergency evacuation plan for the protection of its residents. There are no significant flood protection structures on streams in the Town of Epsom. Although not a flood control structure, the dam on Northwood Lake could offer some degree of flood storage on the Little Suncook River. The rivers and lakes of the Winnipesaukee River Basin undergo an intense degree of recreational usage. The New Hampshire Water Resources Board operates dams at Lakeport, Laconia, and Lochmere in order to regulate flow in the Winnipesaukee River and maintain the levels of Silver Lake, Lake Winnisquam, and Lake Winnipesaukee for recreational uses. Thus, natural flow conditions on the Winnipesaukee River are significantly modified by the interaction of these dams and lakes. No flood protection measures other than this regulation exist on the Winnipesaukee River. Chance Pond Brook in the City of Franklin also has no flood protection measures. No plans have been disclosed for the implementation of any future flood protection measures on either of these streams. In the Town of Hookset, no flood protection measures exist on Messer Brook, Dalton Brook, or Peters Brook, and no plans have been disclosed for the implementation of any future flood protection measures. In the Town of New London, the dam at Sunapee Lake is operated and maintained by the Water Resources Division of the New Hampshire Department of Environmental Services. Sunapee Lake is used for recreational purposes and does not have flood control storage. However, the lake is drawn down in anticipation of floods to maintain the integrity of the structure. Conversion of Wendall Marsh Dam to hydropower will have a negligible effect on flood control. No other major structural flood protection measures exist or are planned for the Town of New London. In the Town of Northfield, no flood protection measures exist on the Tioga River or Williams Brook, and no plans have been disclosed for the implementation of any future flood protection measures. The Town of Northfield has no formal flood fighting or emergency evacuation plans. There are no flood protection measures on streams in the Town of Pittsfield. The Pittsfield Dam, located on the Suncook River above the Main Street Bridge, is not a flood control structure and affords only a small degree of flood storage.
17
There are no structural flood protection measures in the Town of Warner. The Wagner Dam and an unnamed dam located on the Warner River are recreational and were constructed for hydro-power for mills. They do not act as flood control structures or provide additional storage area. In the Town of Webster, a major flood protection measure existing at this time, which affects flooding along the Blackwater River, is the Blackwater Reservoir. Built in 1941 by the USACE, this Flood Control Reservoir has a capacity of 1.5 billion gallons.
3.0 ENGINEERING METHODS For the flooding sources studied in detail in the county, standard hydrologic and hydraulic
study methods were used to determine the flood hazard data required for this FIS. Flood events of a magnitude which are expected to be equaled or exceeded once on the average during any 10-, 50-, 100-, or 500-year period (recurrence interval) have been selected as having special significance for floodplain management and for flood insurance rates. These events, commonly termed the 10-, 50-, 100-, and 500-year floods, have a 10-, 2-, 1-, and 0.2-percent chance, respectively, of being equaled or exceeded during any year. Although the recurrence interval represents the long term average period between floods of a specific magnitude, rare floods could occur at short intervals or even within the same year. The risk of experiencing a rare flood increases when periods greater than 1 year are considered. For example, the risk of having a flood which equals or exceeds the 100-year flood (1-percent chance of annual exceedence) in any 50-year period is approximately 40 percent (4 in 10), and, for any 90-year period, the risk increases to approximately 60 percent (6 in 10). The analyses reported herein reflect flooding potentials based on conditions existing in the county at the time of completion of this FIS. Maps and flood elevations will be amended periodically to reflect future changes.
3.1 Hydrologic Analyses
Hydrologic analyses were carried out to establish the peak discharge-frequency
relationships for the flooding sources studied in detail affecting the county. Precountywide Analyses Each incorporated community within Merrimack County, with the exceptions of the
Towns of Andover, Danbury, Dunbarton, Hill, Loudon, Newbury, Salisbury, Sutton, and Wilmot, has a previously printed FIS report. The hydrologic analyses described in those reports have been compiled and are summarized below.
In the Towns of Allenstown, Bow, Hooksett, and Pembroke the principal sources of
information for the Merrimack River were the discharges used in the Floodplain Information studies published by the USACE (USACE, 1972; USACE, 1976), the rating curves from the Master Regulation Manual for flood control reservoirs (USACE, 1953), and the Water Resources Investigation publication for the Merrimack River (USACE, 1972). The discharge values were developed by a log-Pearson Type III analysis using the 39-year record of flood data from the USGS
18
Goffs Falls gage station (No. 01092000) in Manchester, New Hampshire. The period of record for the Goffs Falls gage station was from 1936 to 1975. All discharge values were modified to reflect the effect of the four existing flood control structures.
Discharges for the Suncook River were derived from the transposition of flood
discharges published in the Towns of Epsom and Pembroke FISs (U.S. Department of Housing and Urban Development, 1978). This river has no flood protection measures affecting it.
In the Town of Boscawen, discharges for the Contoocook River were obtained from information supplied by the New England Division of the USACE (USACE, 1972; USACE, July 23, 1975; USACE, March 10, 1975). These discharges were verified by comparing them to the modified peak discharges at the Contoocook River gage station at Penacook, New Hampshire. Discharges for Glines Brook, Tannery Brook, and Tributary A were principally derived from regional discharge-frequency equations developed by Manuel Benson (U.S. Department of the Interior, 1962) in conjunction with comparisons to discharge-frequency relationships from stream gage records of nearby basins with similar hydrologic characteristics. The regional equations relate topographical and precipitation characteristics to streamflows. These streams have no flood protection measures affecting them. In the Town of Bradford, the primary sources of peak flow data used to determine flood discharges for the Warner River, Todd Lake, and Lake Massasecum in Bradford were stream records from the USGS stream gage stations on the West Branch of the Warner River near Bradford (No. 01085800 – drainage area 5.75 square miles) and the Warner River at Davisville (No. 01086000 – drainage area 146 square miles) (U.S. Department of the Interior, published annually). These stations have operated at least 26 and 40 years, respectively. Peak discharges were developed for these stations using a log-Pearson Type III analysis of annual peak flow data (U.S. Department of the Interior, 1981). In addition, the same peak discharge methodology was used for the Warner River in the Town of Warner. Peak discharges for the Warner River basin at intermediate sites in Bradford were established by adjusting the peak discharges computed for either the Bradford or Davisville gage stations using the following formula:
Q = Qg (A/Ag)b
Where Q is the drainage at the intermediate site, Qg is the peak discharge as computed for either the Bradford or Davisville gage stations, A and Ag are the drainage areas at the intermediate site and the selected gage station, and b is an exponent (U.S. Department of the Interior, 1975). The exponent, b, was computed based on the 1-percent annual chance recurrence interval peak discharges and drainage areas for the Bradford and Davisville gage stations. For the 1-percent annual chance recurrence interval peak discharges, b is 0.49.
19
In the Town of Canterbury, discharges for approximate study streams were developed using Manuel Benson’s regional discharge-frequency equation (USGS, 1962). In the Town of Chichester, USGS gage station No. 895 on the Suncook River, located in North Chichester, was the principal source for defining discharge-frequency relationships for the river. This gage station first began operating in 1919. Values of the 10-, 2-, 1-, and 0.2-percent annual chance peak discharges were obtained from a log-Pearson Type III distribution of annual peak flow data (U.S. Water Resources Council, 1976). Discharge data for Sanders Brook were determined through transposition of annual peak flow data from a nearby gage station with similar hydrologic characteristics. The gage station used is on Mohawk Brook in Center Strafford, New Hampshire, where yearly maximum discharge records are available from 1964 to the present. A discharge-drainage area ratio formula was used to obtain the discharges at various points on Sanders Brook (Johnson, Don, and Cross, W. P., 1949). In the City of Concord, discharges for the Soucook River were derived from a weighted average between those predicted by Manuel Benson’s regional discharge frequency equations and “WRC Adjusted” log-Pearson results from the Soucook River gage records (U.S. Department of the Interior, 1962; U.S. Department of the Interior, 1977). Discharges for the Contoocook River were obtained from the New England Division of the USACE (USACE, 1972; USACE, July 23, 1975; USACE, March 10, 1975). These discharges were verified by comparing them with the modified peak discharges at the Contoocook River gage station at Penacook, New Hampshire. Discharges for The Outlet were determined from a hydraulic analysis of the divergence of The Outlet from the Contoocook River. The analysis consisted of an iterative calculation to determine the flow in both the river and the diversion channel that would achieve a hydraulic balance with the discharges for the selected recurrence intervals of the Contoocook River just upstream of the diversion. These discharges were verified from information obtained from a report by Haynes Engineering Consultants, Inc. (Haynes Engineering Consultants, Inc., 1976). Discharge data for the Little Suncook River were determined through transposition of annual peak flow data from a nearby gage station with hydrologically similar characteristics. The gage station used is on Big Brook in Pittsbury, New Hampshire, where yearly maximum discharges were measured starting in 1964. From these data, the inflow into Northwood Lake was determined for floods at various recurrence intervals. Maximum flood discharges at Northwood Lake Dam and flood storage in that lake were calculated using a flood routing technique (U.S. Department of the Interior, 1974). A discharge-drainage area ratio formula was used to obtain the discharge data at various points on the Little Suncook River downstream of the dam (Johnston, Don, and W. P. Cross, 1949).
20
In the City of Franklin, discharges for the Winnipesaukee River were determined from a log-Pearson Type III analysis of historic streamflow data recorded at the USGS gage station No. 810 at Tilton, New Hampshire (Water Resources Council, 1976). These discharges were modified to account for the present operating procedures of the New Hampshire Water Resources Board. Discharges for the Pemigewasset River were determined using gaging information on the Winnipesaukee River at Tilton, the Merrimack River at Franklin Junction, and flood discharge rates through Franklin Falls Dam (USACE, March 3, 1976). A reservoir routing using a numerical iteration method was performed on Webster Lake (Warren J. Viessman, 1972). The results of this routing were used to establish the water-surface elevations of Webster Lake for the 10-, 2-, 1-, and 0.2-percent annual chance floods. In the Town of Henniker, a gage station on the Contoocook River, located 2.5 miles southwest of Henniker, was the principal source of data for defining discharge-frequency relationships for the river. The gage station started in operation in 1939. Values of the 10-, 2-, 1-, and 0.2-percent annual chance peak discharges were based on statistical analyses of past recorded flows at the gage station prepared by the USACE (USACE, 1974). In the Town of Hopkinton, discharges for the Contoocook River and Blackwater River were obtained from information supplied by the New England Division of the USACE (USACE, 1977; USACE, 1985). These discharges were verified by comparing them to the FIS for the City of Concord (FEMA, 1980). Flood discharge frequencies for the Warner River were computed using a historically adjusted log-Pearson Type III statistical analysis of peak discharges at USGS gage station No. 01086000, located on the Warner River downstream from the State Route 127 bridge at Davisville (U.S. Water Resources Council, 1976; U.S. Department of the Interior, 1976). The gage station used a recording duration of 39 years from 1940 to 1978 and with the additional consideration of two historic floods in 1936 and 1938. In the Town of New London, hydrologic and hydraulic analyses for this study were taken from the FIS for the Town of Sunapee, Sullivan County, New Hampshire (FEMA, 1991). Elevations for Sunapee Lake are based on statistical analysis of gage station records covering a 52-year period at gage station No. 01152000 (U.S. Department of the Interior, 1936-1987). This analysis followed the standard log-Pearson Type III Method (U.S. Department of the Interior, 1981). Discharges from Sunapee Lake for the elevations determined by the above method were determined from stage-discharge curves developed by the SCS at the outlet gates for Sunapee Lake. Elevation-frequency data for Otter Pond were developed using a synthetic rainfall runoff procedure that relies on regionalized climatological data coupled with
21
physical characteristics of the individual streams for input (U.S. Department of Agriculture, 1965). In the Town of Northfield, discharges for the Winnipesaukee River were determined from a log-Pearson Type III analysis of historic streamflow data recorded at the USGS gage station No. 810 at Tilton, New Hampshire (U.S. Water Resources Council, 1976).
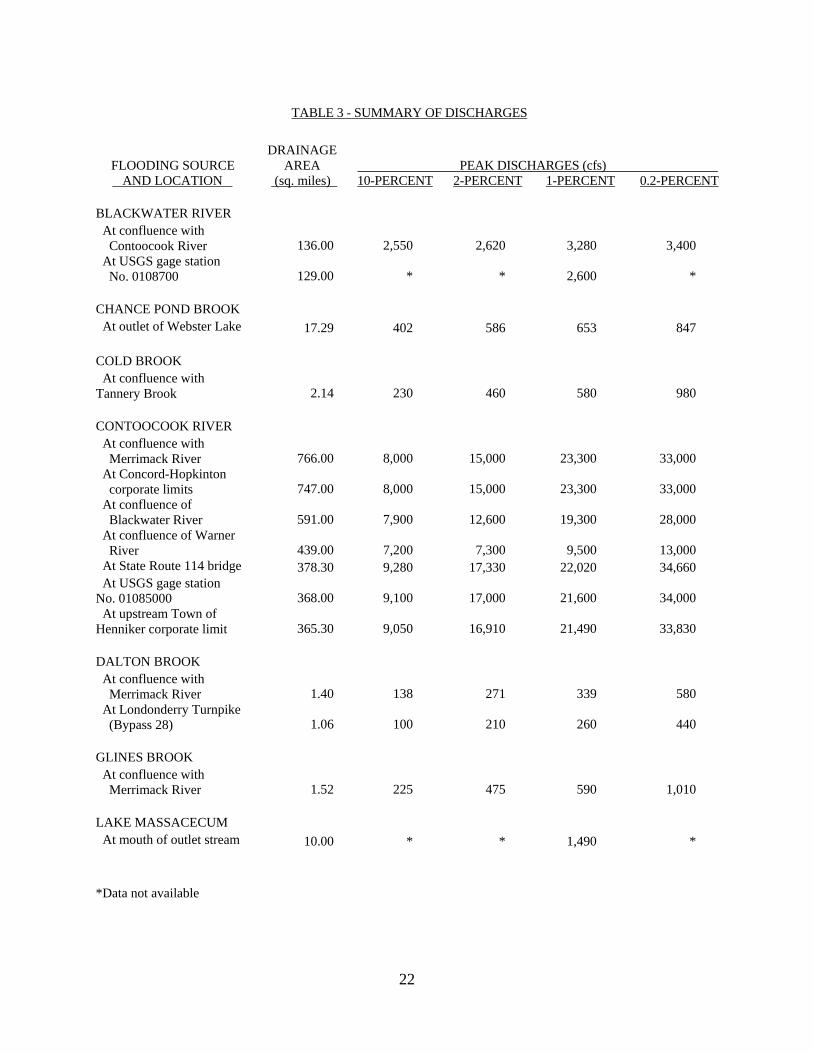
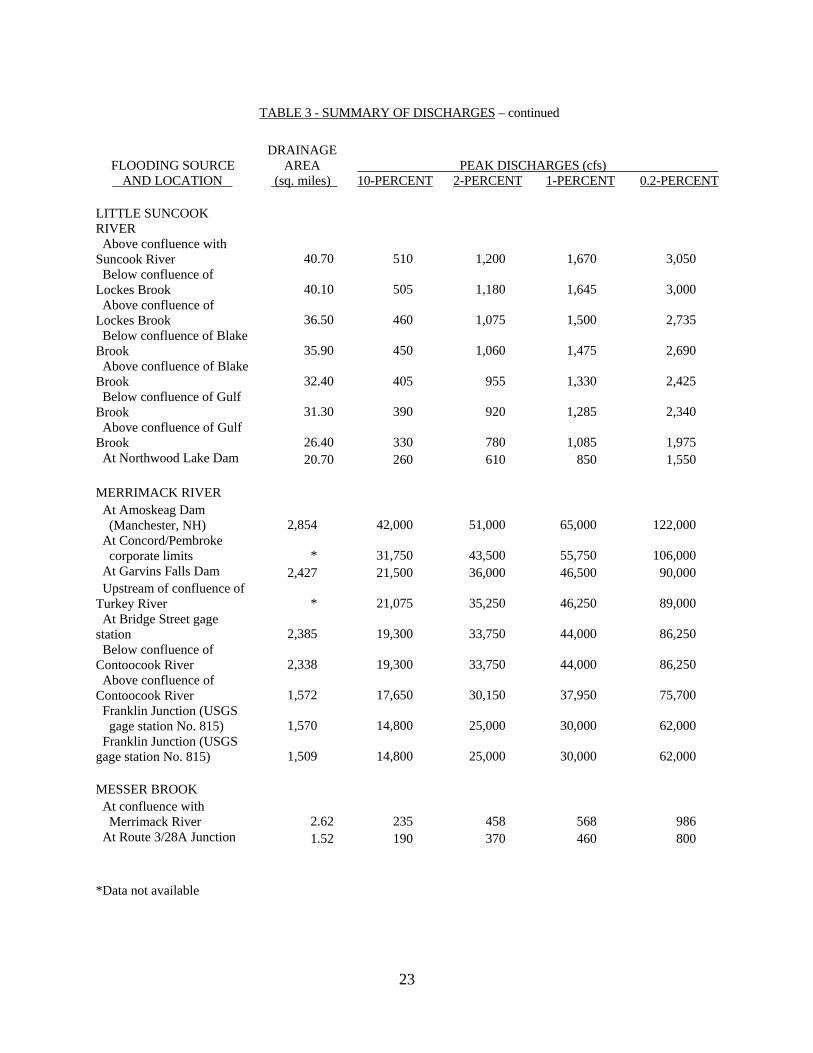
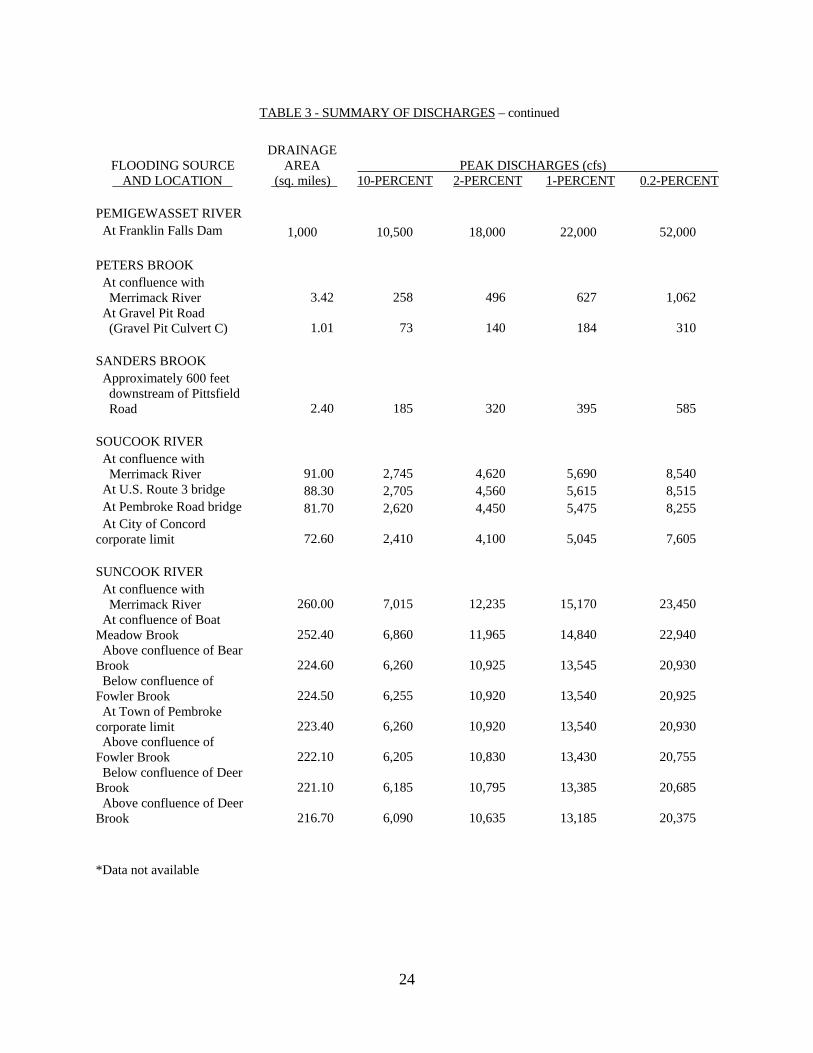
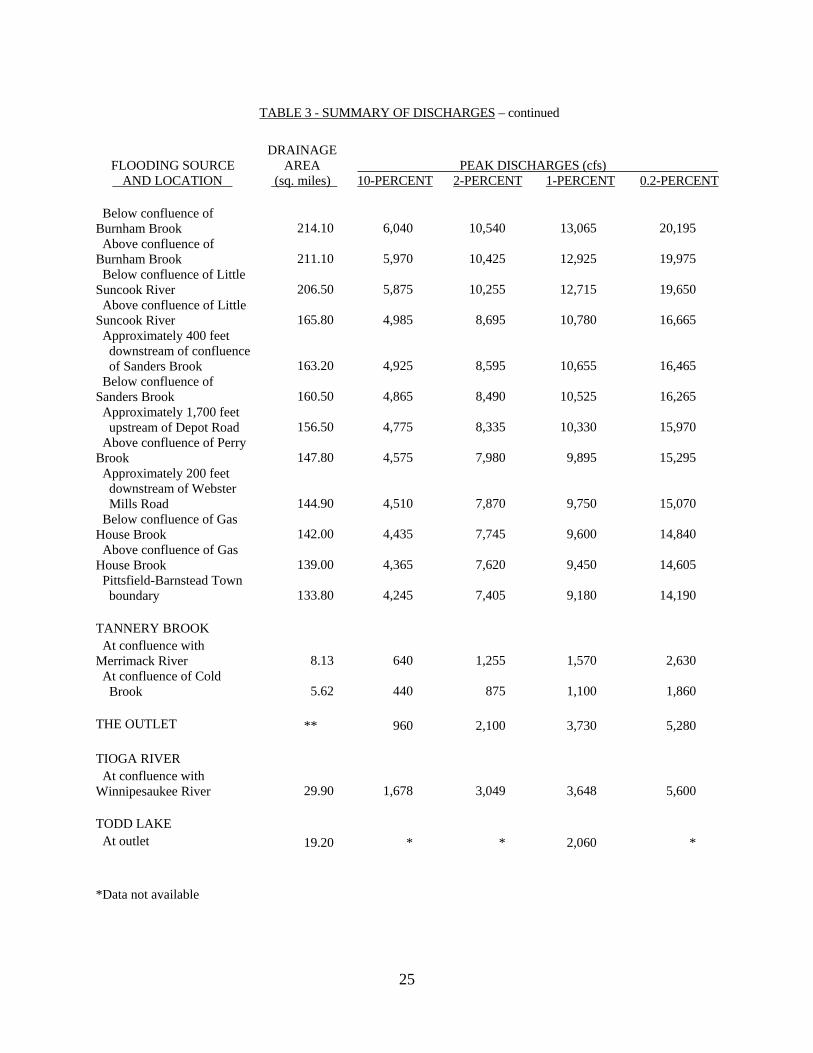
A summary of the drainage area-peak discharge relationships for all the streams
studied by detailed methods is shown in Table 3, "Summary of Discharges."
22
TABLE 3 - SUMMARY OF DISCHARGES
FLOODING SOURCE AND LOCATION
DRAINAGEAREA
(sq. miles)
PEAK DISCHARGES (cfs)
10-PERCENT 2-PERCENT 1-PERCENT 0.2-PERCENT
BLACKWATER RIVER At confluence with Contoocook River 136.00 2,550 2,620 3,280 3,400 At USGS gage station No. 0108700 129.00 * * 2,600 * CHANCE POND BROOK At outlet of Webster Lake 17.29 402 586 653 847 COLD BROOK At confluence with Tannery Brook 2.14 230 460 580 980 CONTOOCOOK RIVER At confluence with Merrimack River 766.00 8,000 15,000 23,300 33,000 At Concord-Hopkinton corporate limits 747.00 8,000 15,000 23,300 33,000 At confluence of Blackwater River 591.00 7,900 12,600 19,300 28,000 At confluence of Warner River 439.00 7,200 7,300 9,500 13,000 At State Route 114 bridge 378.30 9,280 17,330 22,020 34,660 At USGS gage station No. 01085000 368.00 9,100 17,000 21,600 34,000 At upstream Town of Henniker corporate limit 365.30 9,050 16,910 21,490 33,830 DALTON BROOK At confluence with Merrimack River 1.40 138 271 339 580 At Londonderry Turnpike (Bypass 28) 1.06 100 210 260 440 GLINES BROOK At confluence with Merrimack River 1.52 225 475 590 1,010 LAKE MASSACECUM At mouth of outlet stream 10.00 * * 1,490 * *Data not available
23
TABLE 3 - SUMMARY OF DISCHARGES – continued
FLOODING SOURCE AND LOCATION
DRAINAGEAREA
(sq. miles)
PEAK DISCHARGES (cfs)
10-PERCENT 2-PERCENT 1-PERCENT 0.2-PERCENT
LITTLE SUNCOOK RIVER Above confluence with Suncook River 40.70 510 1,200 1,670 3,050 Below confluence of Lockes Brook 40.10 505 1,180 1,645 3,000 Above confluence of Lockes Brook 36.50 460 1,075 1,500 2,735 Below confluence of Blake Brook 35.90 450 1,060 1,475 2,690 Above confluence of Blake Brook 32.40 405 955 1,330 2,425 Below confluence of Gulf Brook 31.30 390 920 1,285 2,340 Above confluence of Gulf Brook 26.40 330 780 1,085 1,975 At Northwood Lake Dam 20.70 260 610 850 1,550 MERRIMACK RIVER At Amoskeag Dam (Manchester, NH) 2,854 42,000 51,000 65,000 122,000 At Concord/Pembroke corporate limits * 31,750 43,500 55,750 106,000 At Garvins Falls Dam 2,427 21,500 36,000 46,500 90,000 Upstream of confluence of Turkey River * 21,075 35,250 46,250 89,000 At Bridge Street gage station 2,385 19,300 33,750 44,000 86,250 Below confluence of Contoocook River 2,338 19,300 33,750 44,000 86,250 Above confluence of Contoocook River 1,572 17,650 30,150 37,950 75,700 Franklin Junction (USGS gage station No. 815) 1,570 14,800 25,000 30,000 62,000 Franklin Junction (USGS gage station No. 815) 1,509 14,800 25,000 30,000 62,000 MESSER BROOK At confluence with Merrimack River 2.62 235 458 568 986 At Route 3/28A Junction 1.52 190 370 460 800
*Data not available
24
TABLE 3 - SUMMARY OF DISCHARGES – continued
FLOODING SOURCE AND LOCATION
DRAINAGEAREA
(sq. miles)
PEAK DISCHARGES (cfs)
10-PERCENT 2-PERCENT 1-PERCENT 0.2-PERCENT
PEMIGEWASSET RIVER At Franklin Falls Dam 1,000 10,500 18,000 22,000 52,000 PETERS BROOK At confluence with Merrimack River 3.42 258 496 627 1,062 At Gravel Pit Road (Gravel Pit Culvert C) 1.01 73 140 184 310 SANDERS BROOK Approximately 600 feet downstream of Pittsfield Road 2.40 185 320 395 585 SOUCOOK RIVER At confluence with Merrimack River 91.00 2,745 4,620 5,690 8,540 At U.S. Route 3 bridge 88.30 2,705 4,560 5,615 8,515 At Pembroke Road bridge 81.70 2,620 4,450 5,475 8,255 At City of Concord corporate limit 72.60 2,410 4,100 5,045 7,605 SUNCOOK RIVER At confluence with Merrimack River 260.00 7,015 12,235 15,170 23,450 At confluence of Boat Meadow Brook 252.40 6,860 11,965 14,840 22,940 Above confluence of Bear Brook 224.60 6,260 10,925 13,545 20,930 Below confluence of Fowler Brook 224.50 6,255 10,920 13,540 20,925 At Town of Pembroke corporate limit 223.40 6,260 10,920 13,540 20,930 Above confluence of Fowler Brook 222.10 6,205 10,830 13,430 20,755 Below confluence of Deer Brook 221.10 6,185 10,795 13,385 20,685 Above confluence of Deer Brook 216.70 6,090 10,635 13,185 20,375 *Data not available
25
TABLE 3 - SUMMARY OF DISCHARGES – continued
FLOODING SOURCE AND LOCATION
DRAINAGEAREA
(sq. miles)
PEAK DISCHARGES (cfs)
10-PERCENT 2-PERCENT 1-PERCENT 0.2-PERCENT
Below confluence of Burnham Brook 214.10 6,040 10,540 13,065 20,195 Above confluence of Burnham Brook 211.10 5,970 10,425 12,925 19,975 Below confluence of Little Suncook River 206.50 5,875 10,255 12,715 19,650 Above confluence of Little Suncook River 165.80 4,985 8,695 10,780 16,665 Approximately 400 feet downstream of confluence of Sanders Brook 163.20 4,925 8,595 10,655 16,465 Below confluence of Sanders Brook 160.50 4,865 8,490 10,525 16,265 Approximately 1,700 feet upstream of Depot Road 156.50 4,775 8,335 10,330 15,970 Above confluence of Perry Brook 147.80 4,575 7,980 9,895 15,295 Approximately 200 feet downstream of Webster Mills Road 144.90 4,510 7,870 9,750 15,070 Below confluence of Gas House Brook 142.00 4,435 7,745 9,600 14,840 Above confluence of Gas House Brook 139.00 4,365 7,620 9,450 14,605 Pittsfield-Barnstead Town boundary 133.80 4,245 7,405 9,180 14,190 TANNERY BROOK At confluence with Merrimack River 8.13 640 1,255 1,570 2,630 At confluence of Cold Brook 5.62 440 875 1,100 1,860 THE OUTLET ** 960 2,100 3,730 5,280 TIOGA RIVER At confluence with Winnipesaukee River 29.90 1,678 3,049 3,648 5,600 TODD LAKE At outlet 19.20 * * 2,060 * *Data not available

26
TABLE 3 - SUMMARY OF DISCHARGES – continued
FLOODING SOURCE AND LOCATION
DRAINAGEAREA
(sq. miles)
PEAK DISCHARGES (cfs)
10-PERCENT 2-PERCENT 1-PERCENT 0.2-PERCENT
TRIBUTARY A At confluence with Merrimack River 1.25 145 290 370 630 WARNER RIVER At confluence with Contoocook River 150.00 4,690 7,960 9,700 14,850 At USGS gage station No. 01086000 in Warner, New Hampshire, on Warner River downstream from State Route 127 bridge 146.00 4,600 7,800 9,500 14,550 Upstream of confluence of Schoodac Brook 120.60 3,990 6,760 8,230 12,610 Upstream of confluence of Stevens Brook 83.30 3,020 5,120 6,240 9,550 Upstream of confluence of Lane River 53.30 2,160 3,660 4,460 6,830 At the Town of Bradford downstream corporate limits 58.90 * * 3,580 * At State Route 114 44.30 * * 3,100 * WEST CHANNEL SUNCOOK RIVER At confluence with Suncook River *** 1,715 2,920 3,675 5,790 WILLIAMS BROOK At confluence with Winnipesaukee River 8.00 704 1,334 1,572 2,500 WINNIPESAUKEE RIVER At Tilton Gage (Tilton, NH; USGS gage station No. 810) 471.00 3,420 4,900 5,640 7,570 At Lakeport Dam 363.00 2,600 2,600 3,500 4,300 *Data not available **Not applicable (The Outlet is a diversion channel to the Contoocook River) ***Discharges for West Channel Suncook River were determined by Weir Equation for Huckins Mill Dam
27
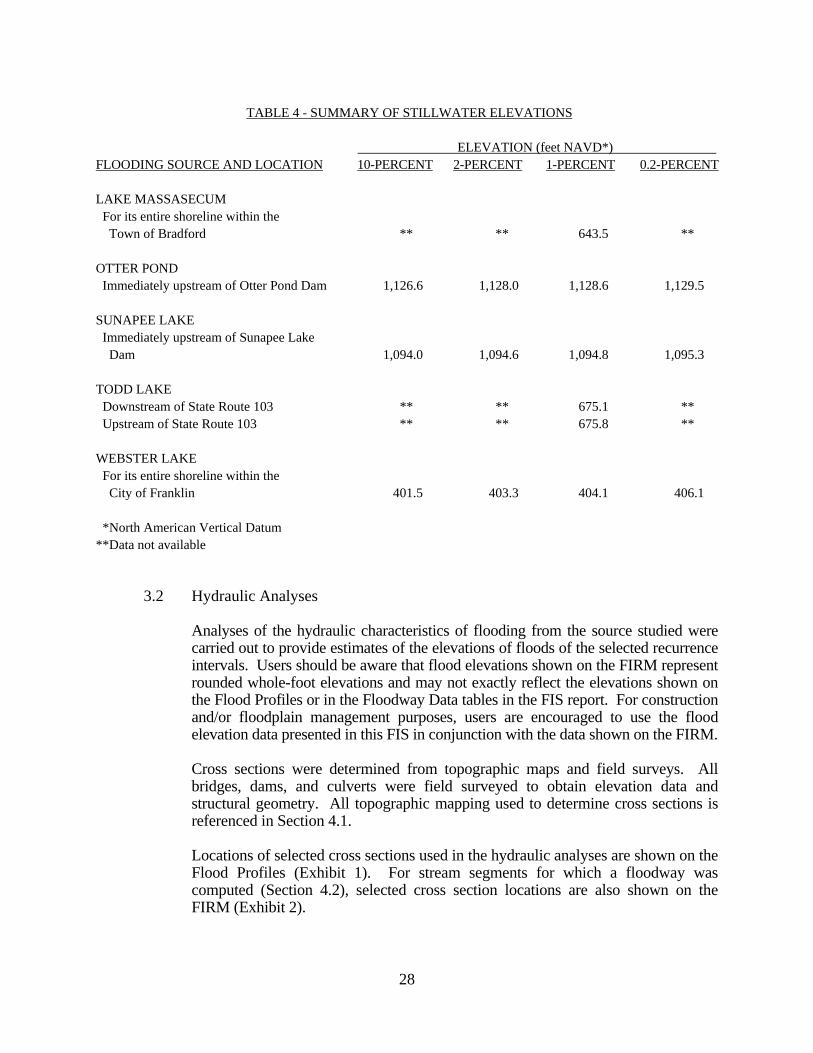
In the Town of Bradford, the 1-percent annual chance flood elevation for Todd Lake downstream of the State Route 103 bridge was determined by rating the dam at the outlet of the pond. For the purposes of this analysis, it was assumed that any and all flashboards on the dam would fail prior to the peak discharge. The 1-percent annual chance flood elevation was determined by applying appropriate flow over weir equations documented in a USGS publication (U.S. Department of the Interior, 1967). The 1-percent annual chance flood elevation for Todd Lake upstream of the State Route 103 bridge is controlled by the dam at the outlet of the pond and the constriction caused by the State Route 103 bridge opening. Using a step-backwater model, the 1-percent annual chance peak discharge and the 1-percent annual chance flood elevation determined for the dam at the outlet of the lake, were routed through the bridge opening to the upper part of Todd Lake to calculate the 1-percent annual elevation. The 1-percent annual chance flood elevation for Lake Massasecum is controlled by backwater from the Warner River. As a result, the elevation of the Warner River at the confluence of Lake Massasecum outlet stream represents the 1-percent annual chance flood elevation for the lake.
The stillwater elevations have been determined for the 10-, 2-, 1-, and 0.2-percent annual chance floods for the flooding sources studied by detailed methods and are summarized in Table 4, "Summary of Stillwater Elevations."
28
TABLE 4 - SUMMARY OF STILLWATER ELEVATIONS
FLOODING SOURCE AND LOCATION
ELEVATION (feet NAVD*)
10-PERCENT 2-PERCENT 1-PERCENT 0.2-PERCENT
LAKE MASSASECUM For its entire shoreline within the Town of Bradford ** ** 643.5 ** OTTER POND Immediately upstream of Otter Pond Dam 1,126.6 1,128.0 1,128.6 1,129.5 SUNAPEE LAKE Immediately upstream of Sunapee Lake Dam 1,094.0 1,094.6 1,094.8 1,095.3 TODD LAKE Downstream of State Route 103 ** ** 675.1 ** Upstream of State Route 103 ** ** 675.8 ** WEBSTER LAKE For its entire shoreline within the City of Franklin 401.5 403.3 404.1 406.1 *North American Vertical Datum **Data not available
3.2 Hydraulic Analyses
Analyses of the hydraulic characteristics of flooding from the source studied were carried out to provide estimates of the elevations of floods of the selected recurrence intervals. Users should be aware that flood elevations shown on the FIRM represent rounded whole-foot elevations and may not exactly reflect the elevations shown on the Flood Profiles or in the Floodway Data tables in the FIS report. For construction and/or floodplain management purposes, users are encouraged to use the flood elevation data presented in this FIS in conjunction with the data shown on the FIRM.
Cross sections were determined from topographic maps and field surveys. All
bridges, dams, and culverts were field surveyed to obtain elevation data and structural geometry. All topographic mapping used to determine cross sections is referenced in Section 4.1.
Locations of selected cross sections used in the hydraulic analyses are shown on the
Flood Profiles (Exhibit 1). For stream segments for which a floodway was computed (Section 4.2), selected cross section locations are also shown on the FIRM (Exhibit 2).
29
The hydraulic analyses for this FIS were based on unobstructed flow. The flood elevations shown on the profiles are thus considered valid only if hydraulic structures remain unobstructed, operate properly, and do not fail. All elevations are referenced to the North American Vertical Datum of 1988 (NAVD). Elevation reference marks (ERMs) used in this study, and their descriptions, are shown on the FIRM. ERMs shown on the FIRM represent those used during the preparation of this and previous FISs. The elevations associated with each ERM were obtained and/or developed during FIS production to establish vertical control for determination of flood elevations and floodplain boundaries shown on the FIRM. Users should be aware that these ERM elevations may have changed since the publication of this FIS. To obtain up-to-date elevation information on National Geodetic Survey (NGS) ERMs shown on the FIRM, please contact the Information Services Branch of the NGS at (301) 713-3242, or visit their website at www.ngs.noaa.gov. Map users should seek verification of non-NGS ERM monument elevations when using these elevations for construction or floodplain management purposes.
All qualifying bench marks within a given jurisdiction that are cataloged by the National Geodetic Survey (NGS) and entered into the National Spatial Reference System (NSRS) as First or Second Order Vertical and have a vertical stability classification of A, B, or C are shown and labeled on the FIRM with their 6-character NSRS Permanent Identifier. Bench marks cataloged by the NGS and entered into the NSRS vary widely in vertical stability classification. NSRS vertical stability classifications are as follows:
• Stability A: Monuments of the most reliable nature, expected to hold
position/elevation well (e.g., mounted in bedrock) • Stability B: Monuments which generally hold their position/elevation
well (e.g., concrete bridge abutment) • Stability C: Monuments which may be affected by surface ground
movements (e.g., concrete monument below frost line) • Stability D: Mark of questionable or unknown vertical stability (e.g.,
concrete monument above frost line, or steel witness post) In addition to NSRS bench marks, the FIRM may also show vertical control monuments established by a local jurisdiction; these monuments will be shown on the FIRM with the appropriate designations. Local monuments will only be placed on the FIRM if the community has requested that they be included, and if the monuments meet the aforementioned NSRS inclusion criteria. To obtain current elevation, description, and/or location information for bench marks shown on the FIRM for any jurisdiction, please contact the Information
30
Services Branch of the NGS at (301) 713-3242, or visit their Web site at www.ngs.noaa.gov. It is important to note that temporary vertical monuments are often established during the preparation of a flood hazard analysis for the purpose of establishing local vertical control. Although these monuments are not shown on the FIRM, they may be found in the Technical Support Data Notebook associated with this FIS and FIRM. Interested individuals may contact FEMA to access this data.
Precountywide Analyses Each incorporated community within Merrimack County, with the exceptions of the
Towns of Andover, Danbury, Dunbarton, Hill, Loudon, Newbury, Salisbury, Sutton, and Wilmot, has a previously printed FIS report. The hydraulic analyses described in those reports have been compiled and are summarized below.
In the Towns of Allenstown, Canterbury, and Pembroke the valley portions of the
cross-section data for the Merrimack and Suncook Rivers were obtained from topographic maps photogrammetrically prepared by Geod Aerial Mapping, Inc. (Geod Aerial Mapping, Inc., 1977); the below-water portions were obtained by field measurement. Bridge plans were utilized to obtain elevation data and structural geometry. Bridges for which plans were unavailable or out-of-date were surveyed.
In the Town of Boscawen, the valley portions of the cross-section data for all detail study streams were obtained photogrammetrically by Geod Aerial Mapping, Inc. (Geod Aerial Mapping, Inc., February 1977). The below-water cross-section data were obtained by field measurements by Thos. F. Moran, Inc. (Thos. F. Moran, Inc., 1977 and 1976). In the Town of Bow, the geometric data for Garvins Falls Dam was compiled from the topographic mapping and design drawings for the dam prepared by the Public Service Company of New Hampshire (Public Service Company of New Hampshire). The 1-percent annual chance flood boundaries for approximate studies were determined using normal depth analyses. Cross-sectional geometry for these streams were obtained from USGS quadrangle maps (U.S. Department of the Interior, 1967, et cetera). In the Town of Bradford, cross sections and structural geometry of hydraulic structures for the Warner River were obtained from field surveys conducted during the 1988 field season by the USGS. Upper-end extensions of cross sections and basin characteristics were based on information contained on USGS topographic maps (U.S. Department of the Interior, 1987, et cetera). In the City of Concord, in the 1999 FIS, the study area for the Merrimack River was subdivided into two reaches for the analysis. The lower reach is from the Concord/Pembroke corporate limits to the upstream side of Interstate Route 93.
31
The upper reach is from the upstream side of Interstate Route 93 to the Concord/ Boscawen corporate limits. Cross-section data for the backwater analyses of the lower reach of the Merrimack River were compiled using contour information from the digital topographic maps with a contour interval of 2 feet and field-surveyed data (Liu Aerial Surveys, 1996). The Manchester Street bridge and embankments were modeled using information from New Hampshire Department of Transportation (NHDOT) project construction drawings because a new bridge and approaches are currently under construction (New Hampshire Department of Transportation, Construction Drawings for the Bridge Structures Within the Study Reach). Cross-section data for the backwater analyses of the upper reach of the Merrimack River were taken from the HEC-2 data set prepared for the 1980 FIS for Concord. The only change made to the data set was at Sewalls Falls Dam, because the dam has been partially breached. Existing conditions for Sewalls Falls Dam were taken from construction drawings prepared by Kimball Chase for the stabilization of the remaining sections of the dam and field survey data provided by the New Hampshire Fish and Game Department (New Hampshire Department of Environmental Services, 1990; New Hampshire Fish and Game Department, 1997). The New Hampshire Fish and Game Department reported that as-built drawings were never prepared. The construction drawings and the field survey data do not provide specific elevation data for the breached section of the dam; however, a channel invert elevation of 227.0 feet NAVD was deemed to be appropriate. In the Town of Epsom, rating curves were developed over both sections of the Huckins Mill Dam on the Suncook River at the north end of Bear Island. Channel discharges were obtained from the rating curves, with the major portion of the flow occurring in the easterly channel. Backwaters were calculated for both the channels of the Suncook River around Bear Island, starting just downstream of the Island at cross section AD. In the Town of Henniker, for the reach between the State Route 114 bridge and the Contoocook Valley Paper Company Dam, cross-section data were obtained by field measurement. For the reach upstream from the Contoocook Valley Paper Company Dam, cross-section data developed by the USACE were used (USACE, 1974). In the Town of Hopkinton, cross sections for the backwater analyses for the streams studied in detail were obtained from topographic maps at a scale of 1:4,800 with a contour interval of 4 feet and supplemented by field surveys and bridge plans (Quinn Associates, Inc., 1985). In the Town of Warner, cross sections for the backwater analyses of the Warner River were obtained from aerial photographs flown in May 1984 at a scale of
32
1:4,800 with a contour interval of 4 feet and supplemented by field surveys and bridge plans (Quinn Associates, Inc., 1985)
In the Town of Allenstown, water-surface elevations of floods of the selected recurrence intervals were computed for the Merrimack and Suncook Rivers through use of the USACE HEC-2 step-backwater computer program (USACE, 1973). Flood profiles were developed showing computed water-surface elevation to an accuracy of 0.5 foot for these selected floods (Exhibit 1). Starting water-surface elevations for the Merrimack River were obtained from stage-discharge curves published by the USACE for the Amoskeag Dam in Manchester, New Hampshire (USACE, 1976). For the Suncook River, starting water-surface elevations were taken from corresponding Merrimack River flood profiles. In the Town of Boscawen, starting water-surface elevations for the Merrimack River were obtained from the City of Concord FIS (U.S. Department of Housing and Urban Development, 1977). For the Contoocook River, Tannery Brook, Glines Brook, and Tributary A starting water-surface elevations were determined by normal depth analysis. In the Town of Bradford, water-surface elevations of floods of the selected recurrence intervals for the Warner River were computed using a Federal Highway Administration step-backwater computer program (U.S. Federal Highway Administration, 1986). Starting water-surface elevations for the Warner River were taken from the FIS for the Town of Warner (FEMA, 1987). In the Town of Canterbury, starting water-surface elevations for the Merrimack River were obtained from the Concord FIS (U.S. Department of Housing and Urban Development, 1977). In the Town of Chichester, starting water-surface elevations for the Suncook River were obtained from water surfaces for the backwaters of the Suncook River that appear in the Town of Epsom FIS. The starting water surfaces for Sanders Brook were taken from the Suncook River at their confluence. Records of river stages at the gage station in Chichester for the period 1919 through 1973 and historic data for 1936 and 1938 floods were evaluated to determine flood stages for the Suncook River. For streams studied by approximate methods, the 1-percent annual chance flood was estimated at culverts using standard nomographs (New Hampshire Department of Public Works & Highways, 1976). Historic accounts and interpretation of topographic mapping were also used to estimate the 1-percent annual chance flood. In the City of Concord, in the 1980 FIS, for the Soucook River, starting water-surface elevations were taken from the Merrimack River flood profiles and determined to be reasonable that flood peaks on these two rivers would coincide. Starting water-surface elevations for the Contoocook River were determined by normal depth analysis. Starting water-surface elevations for The Outlet were taken from the Contoocook River flood profiles.
33
In the City of Concord, in the 1999 FIS, the computed water-surface elevations for the upper reach were delineated using the contours on the digital aerial topographic mapping (Liu Aerial Surveys, 1996). Starting water-surface elevations for the Merrimack River were taken from the FIS for the Town of Pembroke (FEMA, 1979). Some modeling errors in the 1980 FIS for the City of Concord account for some of the changes in the 1999 revision. The HEC-2 data sets for the 1980 FIS stopped at the toe of Garvins Falls Dam and restarted upstream of the dam with an undocumented starting water-surface elevation. The water-surface elevations for the 1999 revision were calculated using the special bridge option with a discharge coefficient of 3.8 for the ogee spillway section. The computed water-surface elevations are slightly lower than those published in the 1980 FIS. No calibration runs were made of the 1936 and 1938 high-water marks because of changes that have occurred in the floodplain since the flood events occurred. The 1936 peak discharge at Bridge Street and Garvins Falls Dam is equal to approximately 122,000 cubic feet per second (cfs), and the 1938 peak discharge at Bridge Street is equal to approximately 98,000 cfs. The 0.2-percent annual chance flood water-surface profile was calculated using a peak discharge of 90,000 cfs at Garvins Falls Dam and 86,250 cfs at Bridge Street. The computed 0.2-percent annual chance flood water-surface profile is slightly higher than the 1938 high-water marks below Manchester Street and slightly lower above Manchester Street. The new bridge at Manchester Street may account for some of the reduction in water-surface elevation. Upstream of Sewalls Falls Dam, the computed water-surface elevations deviate from the 1938 high-water marks because of the partial breach of the dam. In the Town of Epsom, the flood profile for the Suncook River in the area of Bear Island reflects the water-surface elevations of the easterly channel. An additional flood profile shows the water-surface elevations of the westerly channel. Starting water-surface elevations for the Suncook River were determined by calculating a normal depth water-surface elevations some distance downstream of the town boundary and running the backwater elevations upstream from that point. Elevations from the Suncook River at the confluence of the Little Suncook River were used for starting water-surface elevations on that stream. In the City of Franklin, starting water-surface elevations for the Merrimack River were obtained from the FIS for the Town of Boscawen (U.S. Department of Housing and Urban Development, 1979). Starting water-surface elevations for the Winnipesaukee and Pemigewasset Rivers were obtained from backwater from the Merrimack River. For Chance Pond Brook, starting water-surface elevations were determined by normal depth analysis. In the Town of Henniker, analyses of tailwater elevations from the Hopkinton-Everett Reservoir were coordinated with the USACE. The elevations determined served as starting water-surface elevations for the Contoocook River below the
34
State Route 114 bridge. Records of river stages at the gage station in Henniker for the period 1939 through 1973 and historic data of floods of 1936 and 1938 were evaluated to determine flood stages for the Contoocook River. In the Town of Hooksett, starting water-surface elevations for the Merrimack River were obtained from stage-discharge curves published by the USACE for the Amoskeag Dam in Manchester, New Hampshire (USACE, 1953). For Messer Brook, Dalton Brook, and Peters Brook, starting water-surface elevations were taken from the Merrimack River flood profiles. In the Town of Hopkinton, starting water-surface elevations for the Contoocook River were taken from known elevations in the FIS for the City of Concord (FEMA, 1980). Starting water-surface elevations for the Warner River and the Blackwater River were calculated using the slope/area method. In the Town of New London, hydrologic and hydraulic analyses were taken from the FIS for the Town of Sunapee (FEMA, 1991). In the Town of Northfield, starting water-surface elevations for the Winnipesaukee River were obtained from the City of Franklin FIS (U.S. Department of Housing and Urban Development, 1977). For the Merrimack River, starting water-surface elevations were taken from the Town of Boscawen FIS (U.S. Department of Housing and Urban Development, 1977). For the Tioga River and Williams Brook, starting water-surface elevations were determined by normal depth analysis. In the Town of Warner, starting water-surface elevations for the Warner River were calculated by the slope/area method at the confluence with the Contoocook River in Hopkinton, New Hampshire. In the Town of Webster, the water-surface elevation for the Blackwater River was computed using the USGS step-backwater computer program (U.S. Department of the Interior, 1976). Starting water-surface elevations were obtained from the FIS for the Town of Hopkinton (FEMA, 1988).
Flood profiles were drawn showing computed water-surface elevations for floods of
the selected recurrence intervals. Roughness factors (Manning's "n") used in the hydraulic computations were chosen
by engineering judgment and were based on field observations of the streams and floodplain areas. For some reaches of the Contoocook and Merrimack Rivers, roughness factors were determined by calibrating high water marks from historic floods. Roughness factors for all streams studied by detailed methods are shown in Table 5, "Manning's "n" Values."
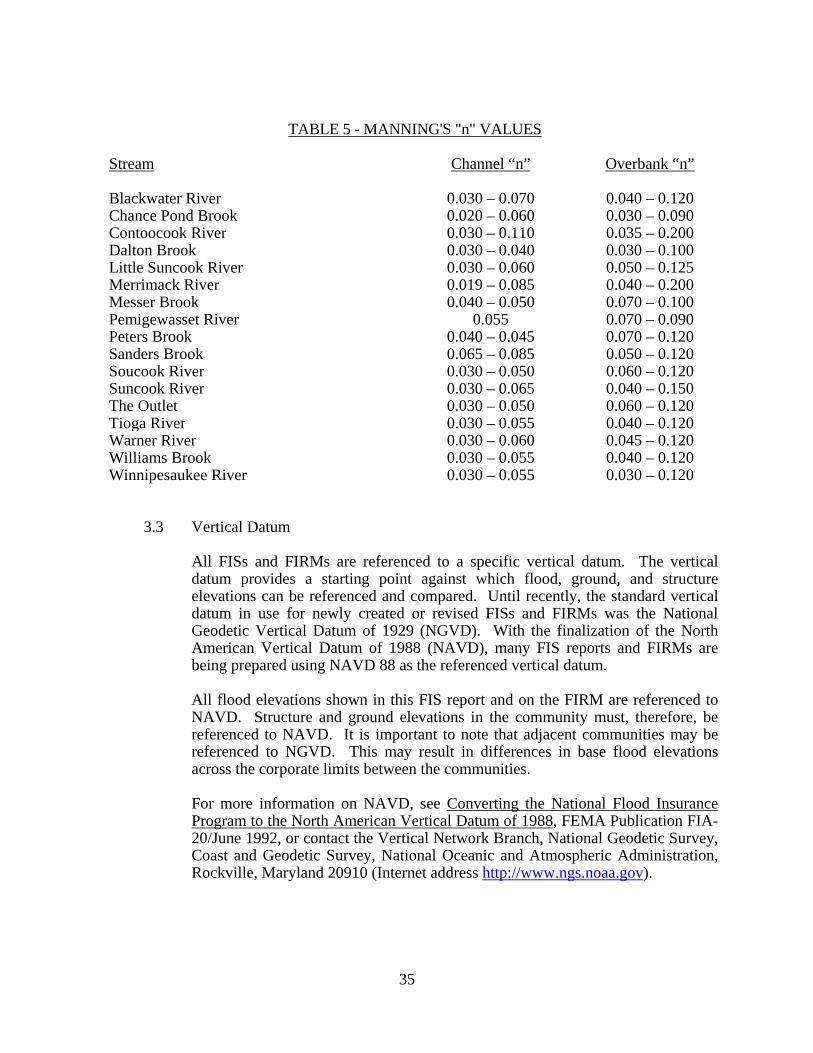
35
TABLE 5 - MANNING'S "n" VALUES
Stream Channel “n” Overbank “n”
Blackwater River 0.030 – 0.070 0.040 – 0.120Chance Pond Brook 0.020 – 0.060 0.030 – 0.090Contoocook River 0.030 – 0.110 0.035 – 0.200Dalton Brook 0.030 – 0.040 0.030 – 0.100Little Suncook River 0.030 – 0.060 0.050 – 0.125Merrimack River 0.019 – 0.085 0.040 – 0.200Messer Brook 0.040 – 0.050 0.070 – 0.100Pemigewasset River 0.055 0.070 – 0.090Peters Brook 0.040 – 0.045 0.070 – 0.120Sanders Brook 0.065 – 0.085 0.050 – 0.120Soucook River 0.030 – 0.050 0.060 – 0.120Suncook River 0.030 – 0.065 0.040 – 0.150The Outlet 0.030 – 0.050 0.060 – 0.120Tioga River 0.030 – 0.055 0.040 – 0.120Warner River 0.030 – 0.060 0.045 – 0.120Williams Brook 0.030 – 0.055 0.040 – 0.120Winnipesaukee River 0.030 – 0.055 0.030 – 0.120
3.3 Vertical Datum
All FISs and FIRMs are referenced to a specific vertical datum. The vertical datum provides a starting point against which flood, ground, and structure elevations can be referenced and compared. Until recently, the standard vertical datum in use for newly created or revised FISs and FIRMs was the National Geodetic Vertical Datum of 1929 (NGVD). With the finalization of the North American Vertical Datum of 1988 (NAVD), many FIS reports and FIRMs are being prepared using NAVD 88 as the referenced vertical datum. All flood elevations shown in this FIS report and on the FIRM are referenced to NAVD. Structure and ground elevations in the community must, therefore, be referenced to NAVD. It is important to note that adjacent communities may be referenced to NGVD. This may result in differences in base flood elevations across the corporate limits between the communities. For more information on NAVD, see Converting the National Flood Insurance Program to the North American Vertical Datum of 1988, FEMA Publication FIA-20/June 1992, or contact the Vertical Network Branch, National Geodetic Survey, Coast and Geodetic Survey, National Oceanic and Atmospheric Administration, Rockville, Maryland 20910 (Internet address http://www.ngs.noaa.gov).
36
4.0 FLOODPLAIN MANAGEMENT APPLICATIONS The NFIP encourages State and local governments to adopt sound floodplain management
programs. To assist in this endeavor, each FIS provides 1-percent annual chance floodplain data, which may include a combination of the following: 10-, 2-, 1-, and 0.2-percent annual chance flood elevations; delineations of the 1- and 0.2-percent annual chance floodplains; and 1-percent annual chance floodway. This information is presented on the FIRM and in many components of the FIS, including Flood Profiles, Floodway Data tables, and Summary of Stillwater Elevation tables. Users should reference the data presented in the FIS as well as additional information that may be available at the local community map repository before making flood elevation and/or floodplain boundary determinations.
4.1 Floodplain Boundaries
To provide a national standard without regional discrimination, the 1-percent
annual chance flood has been adopted by FEMA as the base flood for floodplain management purposes. The 0.2-percent annual chance flood is employed to indicate additional areas of flood risk in the county. For the streams studied in detail, the 1- and 0.2-percent annual chance floodplain boundaries have been delineated using the flood elevations determined at each cross section. Between cross sections, the boundaries were interpolated using topographic maps at scales of 1:4,800 and 1:2,400 with contour intervals of 5 feet (Geod Aerial Mapping, Inc., 1977; State of New Hampshire Department of Public Works and Highways, 1967); 1"=400' with a contour interval of 5 feet (Geod Aerial Mapping, Inc., 1977); 1:24,000 and 1:25,000 with contour intervals of 20 feet and 6 meters (U.S. Department of the Interior, 1987, et cetera); 1"=400' with a contour interval of 20 feet (USGS, 1957); 1"=100' with a contour interval of 2 feet (Concord, New Hampshire, Department of Public Works, 1966, et cetera); 1:4,800 with a contour interval of 4 feet (Quinn Associates, Inc., 1985); boundaries were interpolated using digital topographic maps with a contour interval of 2 feet (Liu Aerial Surveys, 1996); boundaries were interpolated using photo-enlarged topographic maps at a scale of 1:4,800, with a contour interval of 20 feet (USGS, 1957); boundaries were interpolated using topographic maps.
For each area studied by approximate methods, the boundary of the 1-percent
annual chance flood was delineated on USGS quadrangle maps that were photographically enlarged to scales of 1:12,000 or 1:4,800, where available (USGS, 1968, et cetera; Geod Aerial Mapping, Inc., 1977); 1:1,000 or 1:400, where available (USGS, 1956); or 1:24,000, enlarged to a scale of 1:12,000 (U.S. Department of the Interior, 1967, et cetera). Additional approximate studied areas on several unnamed swamps and ponds were taken from the FIRM for the Town of Bow (FEMA, 2000). The boundaries of the 1-percent annual chance floodplain were delineated using the FIRM for the Town of Bradford (FEMA, 1992). The 1-percent annual chance floodplain boundaries were delineated using topographic maps at scales of 1"=400' and 1"=100' where these 2 coverages were available (Geod Aerial Mapping, Inc., 1977; USACE, 1973; Concord, New Hampshire, Department of Public Works, 1966, et cetera). In the Town of Henniker, for the Tributary from Morrill Pond, the 1-percent annual chance flood has been
37
delineated using the estimated flood elevations determined at culverts; between culverts, the boundaries were interpolated using topographic maps at a scale of 1:12,000, with a contour interval of 20 feet (New Hampshire Department of Resources and Economic Development, 1972). The 1-percent annual chance flood boundaries were delineated using topographic maps and the FIRM for the Town of Hopkinton (Quinn Associates, Inc., 1985; U.S. Department of the Interior, 1949, et cetera; FEMA, 1988). The 1-percent annual chance floodplain boundaries were delineated using the FIRMs for the Town of New London and the Town of Warner (FEMA, 1991; FEMA, 1987).
In the Town of Webster, the 1-percent annual chance floodplain boundary
remains essentially unchanged from the delineation shown on the previously printed FIS for the Town of Webster (FEMA, 1993).
In the Town of Northfield, Knowles Pond and several small swamps in the
southeastern portion of the town were delineated from the FIRM (U.S. Department of Housing and Urban Development, 1979).
For the flooding sources studied by approximate methods, the boundaries of the
1-percent annual chance floodplains were delineated using topographic maps referenced within the previously printed FIS reports for the incorporated jurisdictions within Merrimack County, with the exception of the Towns of Andover, Danbury, Dunbarton, Hill, Loudon, Newbury, Salisbury, Sutton, and Wilmot.
The 1- and 0.2-percent annual chance floodplain boundaries are shown on the
FIRM (Exhibit 2). On this map, the 1-percent annual chance floodplain boundary corresponds to the boundary of the areas of special flood hazards (Zones A and AE), and the 0.2-percent annual chance floodplain boundary corresponds to the boundary of areas of moderate flood hazards. In cases where the 1- and 0.2-percent annual chance floodplain boundaries are close together, only the 1-percent annual chance floodplain boundary has been shown. Small areas within the floodplain boundaries may lie above the flood elevations but cannot be shown due to limitations of the map scale and/or lack of detailed topographic data.
For the streams studied by approximate methods, only the 1-percent annual chance
floodplain boundary is shown on the FIRM (Exhibit 2).
4.2 Floodways
Encroachment on floodplains, such as structures and fill, reduces flood-carrying
capacity, increases flood heights and velocities, and increases flood hazards in areas beyond the encroachment itself. One aspect of floodplain management involves balancing the economic gain from floodplain development against the resulting increase in flood hazard. For purposes of the NFIP, a floodway is used as a tool to assist local communities in this aspect of floodplain management. Under this concept, the area of the 1-percent annual chance floodplain is divided into a floodway and a floodway fringe. The floodway is the channel of a stream, plus any
38
adjacent floodplain areas, that must be kept free of encroachment so that the 1-percent annual chance flood can be carried without substantial increases in flood heights. Minimum federal standards limit such increases to 1.0 foot, provided that hazardous velocities are not produced. The floodways in this FIS are presented to local agencies as minimum standards that can be adopted directly or that can be used as a basis for additional floodway studies.
In the Town of Allenstown, the floodways were determined using Method 4 and Method 1 encroachment analysis of the USACE HEC-2 computer program. No encroachment was attempted for cross sections at bridges. Encroachment limits were based on equal conveyance reduction of a magnitude that would produce a surcharge in water surface related to a corresponding maximum one foot surcharge in energy grade line or water-surface elevation. Because of the effects of downstream encroachment on energy grade line and water-surface elevations upstream, there may be numerous cross sections where minimal encroachment can be permitted without upstream energy grade line or water-surface elevation increases of more than one foot. This “domino” effect, therefore, imposes an additional constraint on floodplain encroachment. Under certain flow conditions, as the cross-sectional flow area is reduced, the local effect is to lower the water-surface elevation and increase the velocity. The water surface drops due to the conversion of potential energy to kinetic energy as flow is accelerated through the restrictive section. Although the local effect of such an encroachment is a reduction of water-surface elevation, the increased velocity usually results in an increase in water-surface elevations at some point upstream. If further encroachment were allowed at the restrictive section, the water-surface elevation would continue to drop and the velocity would increase, causing a rise greater than one foot at upstream sections. The floodways along the Merrimack and Suncook Rivers were computed on the basis of an equal conveyance reduction. For the Merrimack River, the floodway limits were determined to be at the limits of the natural stream channel. In the Town of Boscawen, the floodways along the Contoocook River, Glines Brook, Tannery Brook, and Tributary A were computed on the basis of an equal conveyance reduction without consideration of backwater flooding from their respective confluent streams. In the Town of Hooksett, a portion of the floodway at cross section A on the Merrimack River lies outside of the county boundary of Merrimack County. Some floodways, which closely follow stream courses, have not been delineated due to scale limitations. In special cases of divided flow, the Winnipesaukee River floodway takes the most efficient path and consequently crosses the stream boundaries. Portions of the floodway for the Winnipesaukee River lie outside the county boundary. In the Town of Northfield, the floodways along the Tioga River and Williams Brook were computed on the basis of an equal conveyance reduction without
39
consideration of backwater flooding from its confluent stream, the Winnipesaukee River. In the Town of Pembroke, the floodways along the Suncook and Soucook Rivers were computed on the basis of an equal conveyance reduction with consideration given to backwater flooding from their confluent stream, the Merrimack River.
The floodways presented in this FIS were computed for certain stream segments on the basis of equal conveyance reduction from each side of the floodplain.
Floodway widths were computed at cross sections. Between cross sections, the
floodway boundaries were interpolated. The results of the floodway computations are tabulated for selected cross sections (Table 6). The computed floodways are shown on the FIRM (Exhibit 2). In cases where the floodway and 1-percent annual chance floodplain boundaries are either close together or collinear, only the floodway boundary is shown.
Encroachment into areas subject to inundation by floodwaters having hazardous
velocities aggravates the risk of flood damage, and heightens potential flood hazards by further increasing velocities. A listing of stream velocities at selected cross sections is provided in Table 6, "Floodway Data." In order to reduce the risk of property damage in areas where the stream velocities are high, the community may wish to restrict development in areas outside the floodway.
The area between the floodway and 1-percent annual chance floodplain boundaries
is termed the floodway fringe. The floodway fringe encompasses the portion of the floodplain that could be completely obstructed without increasing the water-surface elevation of the 1-percent annual chance flood by more than 1.0 foot at any point. Typical relationships between the floodway and the floodway fringe and their significance to floodplain development are shown in Figure 1.
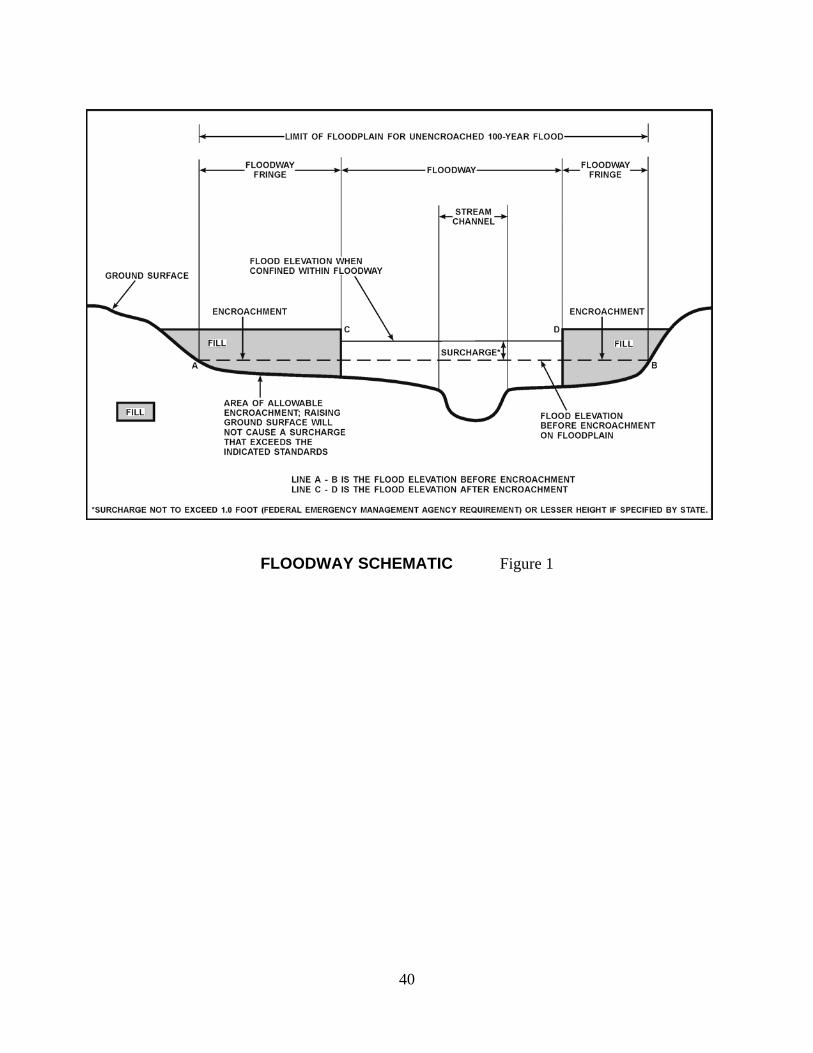
40
FLOODWAY SCHEMATIC Figure 1
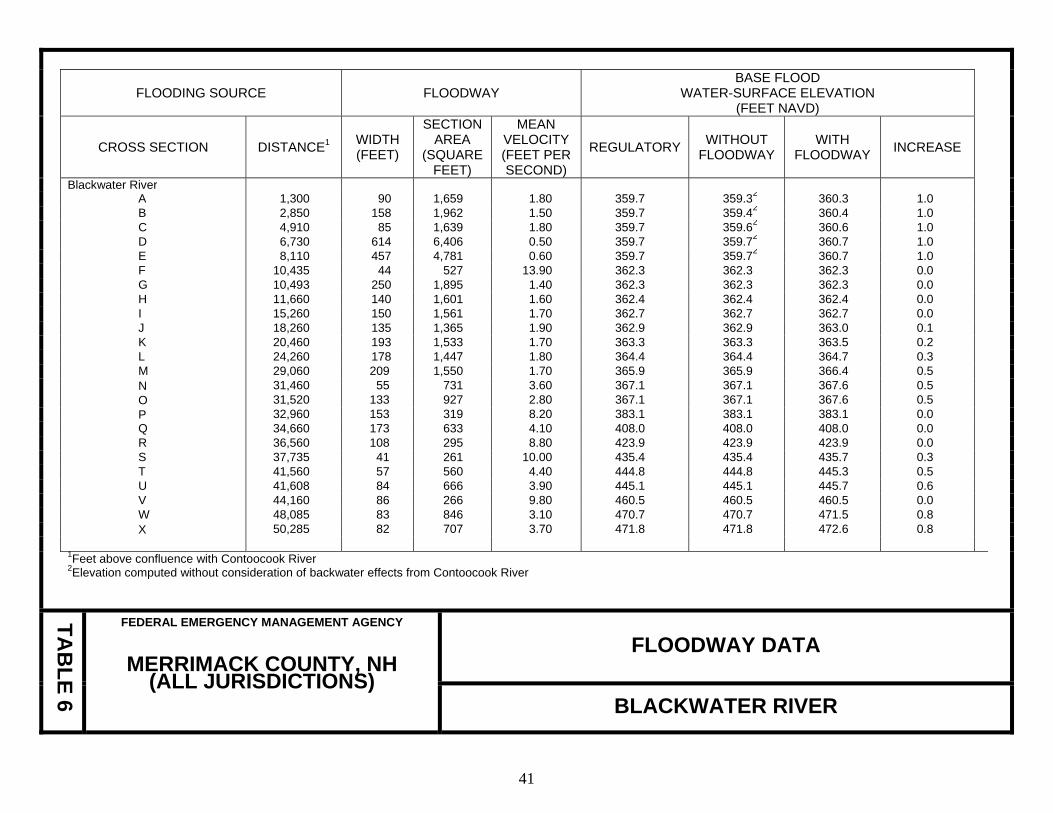
FLOODING SOURCE FLOODWAY BASE FLOOD
WATER-SURFACE ELEVATION (FEET NAVD)
CROSS SECTION DISTANCE1 WIDTH
(FEET)
SECTIONAREA
(SQUAREFEET)
MEAN VELOCITY(FEET PERSECOND)
REGULATORY WITHOUT FLOODWAY
WITH FLOODWAY INCREASE
Blackwater River A 1,300 90 1,659 1.80 359.7 359.32 360.3 1.0 B 2,850 158 1,962 1.50 359.7 359.42 360.4 1.0 C 4,910 85 1,639 1.80 359.7 359.62 360.6 1.0 D 6,730 614 6,406 0.50 359.7 359.72 360.7 1.0 E 8,110 457 4,781 0.60 359.7 359.72 360.7 1.0 F 10,435 44 527 13.90 362.3 362.3 362.3 0.0 G 10,493 250 1,895 1.40 362.3 362.3 362.3 0.0 H 11,660 140 1,601 1.60 362.4 362.4 362.4 0.0 I 15,260 150 1,561 1.70 362.7 362.7 362.7 0.0 J 18,260 135 1,365 1.90 362.9 362.9 363.0 0.1 K 20,460 193 1,533 1.70 363.3 363.3 363.5 0.2 L 24,260 178 1,447 1.80 364.4 364.4 364.7 0.3 M 29,060 209 1,550 1.70 365.9 365.9 366.4 0.5 N 31,460 55 731 3.60 367.1 367.1 367.6 0.5 O 31,520 133 927 2.80 367.1 367.1 367.6 0.5 P 32,960 153 319 8.20 383.1 383.1 383.1 0.0 Q 34,660 173 633 4.10 408.0 408.0 408.0 0.0 R 36,560 108 295 8.80 423.9 423.9 423.9 0.0 S 37,735 41 261 10.00 435.4 435.4 435.7 0.3 T 41,560 57 560 4.40 444.8 444.8 445.3 0.5 U 41,608 84 666 3.90 445.1 445.1 445.7 0.6 V 44,160 86 266 9.80 460.5 460.5 460.5 0.0 W 48,085 83 846 3.10 470.7 470.7 471.5 0.8 X 50,285 82 707 3.70 471.8 471.8 472.6 0.8 1Feet above confluence with Contoocook River
2Elevation computed without consideration of backwater effects from Contoocook River
TAB
LE 6
FEDERAL EMERGENCY MANAGEMENT AGENCY
MERRIMACK COUNTY, NH (ALL JURISDICTIONS)
FLOODWAY DATA
BLACKWATER RIVER
41
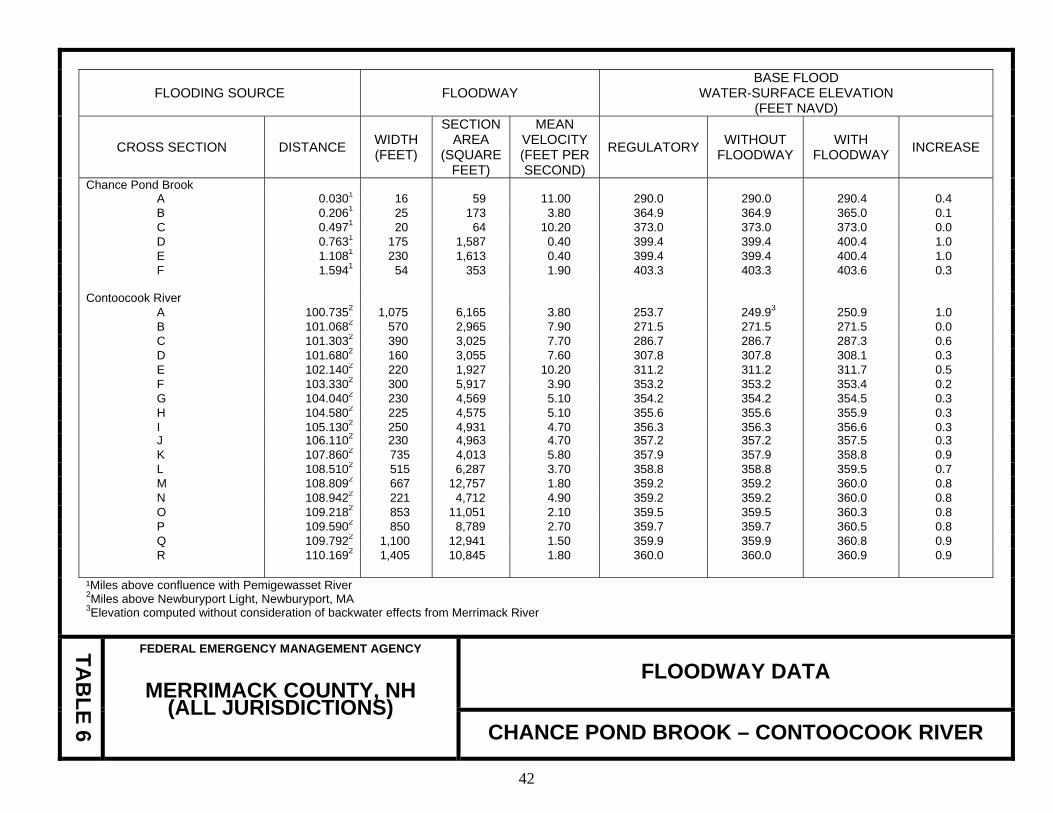
FLOODING SOURCE FLOODWAY BASE FLOOD
WATER-SURFACE ELEVATION (FEET NAVD)
CROSS SECTION DISTANCE WIDTH
(FEET)
SECTIONAREA
(SQUAREFEET)
MEAN VELOCITY(FEET PERSECOND)
REGULATORY WITHOUT FLOODWAY
WITH FLOODWAY INCREASE
Chance Pond Brook A 0.0301 16 59 11.00 290.0 290.0 290.4 0.4 B 0.2061 25 173 3.80 364.9 364.9 365.0 0.1 C 0.4971 20 64 10.20 373.0 373.0 373.0 0.0 D 0.7631 175 1,587 0.40 399.4 399.4 400.4 1.0 E 1.1081 230 1,613 0.40 399.4 399.4 400.4 1.0 F 1.5941 54 353 1.90 403.3 403.3 403.6 0.3 Contoocook River A 100.7352 1,075 6,165 3.80 253.7 249.93 250.9 1.0 B 101.0682 570 2,965 7.90 271.5 271.5 271.5 0.0 C 101.3032 390 3,025 7.70 286.7 286.7 287.3 0.6 D 101.6802 160 3,055 7.60 307.8 307.8 308.1 0.3 E 102.1402 220 1,927 10.20 311.2 311.2 311.7 0.5 F 103.3302 300 5,917 3.90 353.2 353.2 353.4 0.2 G 104.0402 230 4,569 5.10 354.2 354.2 354.5 0.3 H 104.5802 225 4,575 5.10 355.6 355.6 355.9 0.3 I 105.1302 250 4,931 4.70 356.3 356.3 356.6 0.3 J 106.1102 230 4,963 4.70 357.2 357.2 357.5 0.3 K 107.8602 735 4,013 5.80 357.9 357.9 358.8 0.9 L 108.5102 515 6,287 3.70 358.8 358.8 359.5 0.7 M 108.8092 667 12,757 1.80 359.2 359.2 360.0 0.8 N 108.9422 221 4,712 4.90 359.2 359.2 360.0 0.8 O 109.2182 853 11,051 2.10 359.5 359.5 360.3 0.8 P 109.5902 850 8,789 2.70 359.7 359.7 360.5 0.8 Q 109.7922 1,100 12,941 1.50 359.9 359.9 360.8 0.9 R 110.1692 1,405 10,845 1.80 360.0 360.0 360.9 0.9 ¹Miles above confluence with Pemigewasset River
2Miles above Newburyport Light, Newburyport, MA 3Elevation computed without consideration of backwater effects from Merrimack River
TAB
LE 6
FEDERAL EMERGENCY MANAGEMENT AGENCY
MERRIMACK COUNTY, NH (ALL JURISDICTIONS)
FLOODWAY DATA
CHANCE POND BROOK – CONTOOCOOK RIVER
42
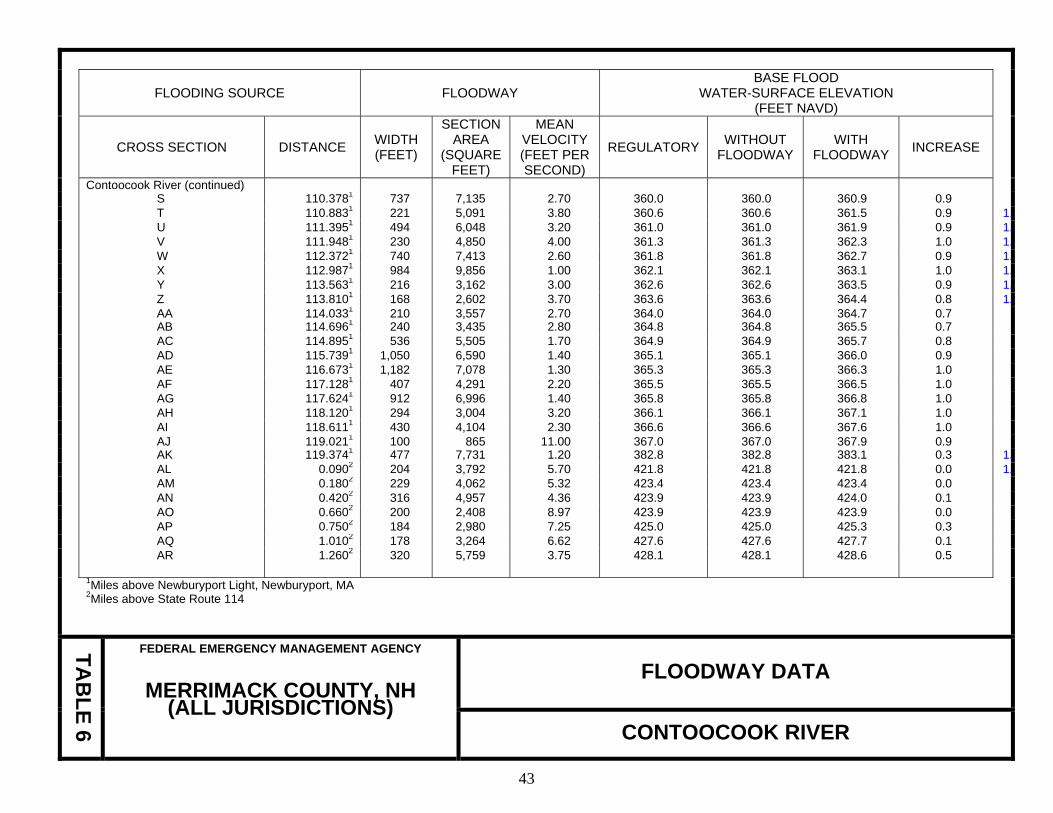
FLOODING SOURCE FLOODWAY BASE FLOOD
WATER-SURFACE ELEVATION (FEET NAVD)
CROSS SECTION DISTANCE WIDTH
(FEET)
SECTIONAREA
(SQUAREFEET)
MEAN VELOCITY(FEET PERSECOND)
REGULATORY WITHOUT FLOODWAY
WITH FLOODWAY INCREASE
Contoocook River (continued) S 110.3781 737 7,135 2.70 360.0 360.0 360.9 0.9 T 110.8831 221 5,091 3.80 360.6 360.6 361.5 0.9 1. U 111.3951 494 6,048 3.20 361.0 361.0 361.9 0.9 1. V 111.9481 230 4,850 4.00 361.3 361.3 362.3 1.0 1. W 112.3721 740 7,413 2.60 361.8 361.8 362.7 0.9 1. X 112.9871 984 9,856 1.00 362.1 362.1 363.1 1.0 1. Y 113.5631 216 3,162 3.00 362.6 362.6 363.5 0.9 1. Z 113.8101 168 2,602 3.70 363.6 363.6 364.4 0.8 1. AA 114.0331 210 3,557 2.70 364.0 364.0 364.7 0.7 AB 114.6961 240 3,435 2.80 364.8 364.8 365.5 0.7 AC 114.8951 536 5,505 1.70 364.9 364.9 365.7 0.8 AD 115.7391 1,050 6,590 1.40 365.1 365.1 366.0 0.9 AE 116.6731 1,182 7,078 1.30 365.3 365.3 366.3 1.0 AF 117.1281 407 4,291 2.20 365.5 365.5 366.5 1.0 AG 117.6241 912 6,996 1.40 365.8 365.8 366.8 1.0 AH 118.1201 294 3,004 3.20 366.1 366.1 367.1 1.0 AI 118.6111 430 4,104 2.30 366.6 366.6 367.6 1.0 AJ 119.0211 100 865 11.00 367.0 367.0 367.9 0.9 AK 119.3741 477 7,731 1.20 382.8 382.8 383.1 0.3 1. AL 0.0902 204 3,792 5.70 421.8 421.8 421.8 0.0 1. AM 0.1802 229 4,062 5.32 423.4 423.4 423.4 0.0 AN 0.4202 316 4,957 4.36 423.9 423.9 424.0 0.1 AO 0.6602 200 2,408 8.97 423.9 423.9 423.9 0.0 AP 0.7502 184 2,980 7.25 425.0 425.0 425.3 0.3 AQ 1.0102 178 3,264 6.62 427.6 427.6 427.7 0.1 AR 1.2602 320 5,759 3.75 428.1 428.1 428.6 0.5 1Miles above Newburyport Light, Newburyport, MA
2Miles above State Route 114
TAB
LE 6
FEDERAL EMERGENCY MANAGEMENT AGENCY
MERRIMACK COUNTY, NH (ALL JURISDICTIONS)
FLOODWAY DATA
CONTOOCOOK RIVER
43

FLOODING SOURCE FLOODWAY BASE FLOOD
WATER-SURFACE ELEVATION (FEET NAVD)
CROSS SECTION DISTANCE WIDTH
(FEET)
SECTIONAREA
(SQUAREFEET)
MEAN VELOCITY(FEET PERSECOND)
REGULATORY WITHOUT FLOODWAY
WITH FLOODWAY INCREASE
Contoocook River (continued) AS 1.4701 219 3,392 6.37 428.1 428.1 428.7 0.6 AT 1.5801 212 2,471 8.74 431.0 431.0 431.0 0.0 1. AU 1.6701 236 2,171 9.95 431.8 431.8 432.5 0.7 1. AV 1.7001 323 2,233 9.67 438.3 438.3 438.3 0.0 1. AW 1.9601 313 5,218 4.14 440.9 440.9 440.9 0.0 1. AX 2.1501 209 2,434 8.88 440.9 440.9 440.9 0.0 1. AY 2.4001 180 1,388 15.56 451.0 451.0 451.1 0.1 1. AZ 2.6201 242 1,985 10.88 464.5 464.5 464.5 0.0 1. BA 2.7901 306 2,469 8.75 471.6 471.6 471.7 0.1 BB 3.2401 215 2,784 7.76 491.1 491.1 491.1 0.0 BC 3.8201 244 2,353 9.18 522.2 522.2 522.2 0.0 BD 4.0901 158 1,546 13.97 538.0 538.0 538.0 0.0 BE 4.4201 186 1,570 13.76 550.4 550.4 550.4 0.0 Dalton Brook A 0.0202 10 41 8.30 186.7 182.43 182.4 0.0 B 0.6002 35 99 3.40 241.7 241.7 242.3 0.6 C 1.2102 20 43 6.00 289.8 289.8 290.0 0.2 D 1.3162 25 79 3.30 294.6 294.6 295.0 0.4 1. E 1.4092 8 45 5.80 297.6 297.6 297.7 0.1 1. Glines Brook A 0.1242 30 250 2.40 264.5 260.73 261.7 1.0 B 0.2452 20 65 9.10 284.5 284.5 284.7 0.2 1Miles above State Route 114
2Miles above confluence with Merrimack River 3Elevation computed without consideration of backwater effects from Merrimack River
TAB
LE 6
FEDERAL EMERGENCY MANAGEMENT AGENCY
MERRIMACK COUNTY, NH (ALL JURISDICTIONS)
FLOODWAY DATA
CONTOOCOOK RIVER – DALTON BROOK – GLINES BROOK
44

FLOODING SOURCE FLOODWAY BASE FLOOD
WATER-SURFACE ELEVATION (FEET NAVD)
CROSS SECTION DISTANCE1 WIDTH
(FEET)
SECTIONAREA
(SQUAREFEET)
MEAN VELOCITY(FEET PERSECOND)
REGULATORY WITHOUT FLOODWAY
WITH FLOODWAY INCREASE
Little Suncook River A 0.000 766 1,361 1.20 338.4 326.02 326.9 0.9 B 0.070 800 3,899 0.40 338.4 333.82 333.9 0.1 C 0.380 48 159 10.44 339.5 339.5 340.0 0.5 D 0.470 49 208 7.98 344.1 344.1 345.1 1.0 E 0.510 49 295 5.63 346.7 346.7 346.9 0.2 F 0.640 51 174 9.54 349.9 349.9 350.1 0.2 G 0.770 60 280 5.93 356.7 356.7 356.7 0.0 H 0.920 53 176 8.47 362.0 362.0 362.2 0.2 I 1.050 65 271 5.50 370.0 370.0 370.0 0.0 J 1.130 57 157 9.49 377.6 377.6 377.6 0.0 K 1.320 79 301 4.95 388.9 388.9 389.0 0.1 L 1.420 80 175 8.51 394.4 394.4 394.4 0.0 M 1.480 67 187 7.97 398.3 398.3 398.5 0.2 N 1.640 28 190 7.84 408.8 408.8 409.0 0.2 O 1.720 128 518 2.88 410.9 410.9 411.2 0.3 P 1.760 190 701 2.13 411.5 411.5 411.8 0.3 Q 1.880 45 234 6.37 415.5 415.5 416.4 0.9 R 2.020 77 221 6.74 424.5 424.5 424.5 0.0 S 2.100 83 242 6.16 429.8 429.8 429.9 0.1 T 2.150 90 943 1.58 436.7 436.7 436.7 0.0 U 2.490 58 144 9.06 439.5 439.5 439.5 0.0 V 2.600 66 299 3.23 442.8 442.8 443.1 0.3 W 2.760 284 1,045 0.92 443.5 443.5 444.2 0.7 X 3.000 36 121 7.98 444.8 444.8 445.4 0.6 Y 3.230 55 210 4.60 460.7 460.7 461.1 0.4 ¹Miles above confluence with Suncook River
2Elevation computed without consideration of backwater effects from Suncook River
TAB
LE 6
FEDERAL EMERGENCY MANAGEMENT AGENCY
MERRIMACK COUNTY, NH (ALL JURISDICTIONS)
FLOODWAY DATA
LITTLE SUNCOOK RIVER
45
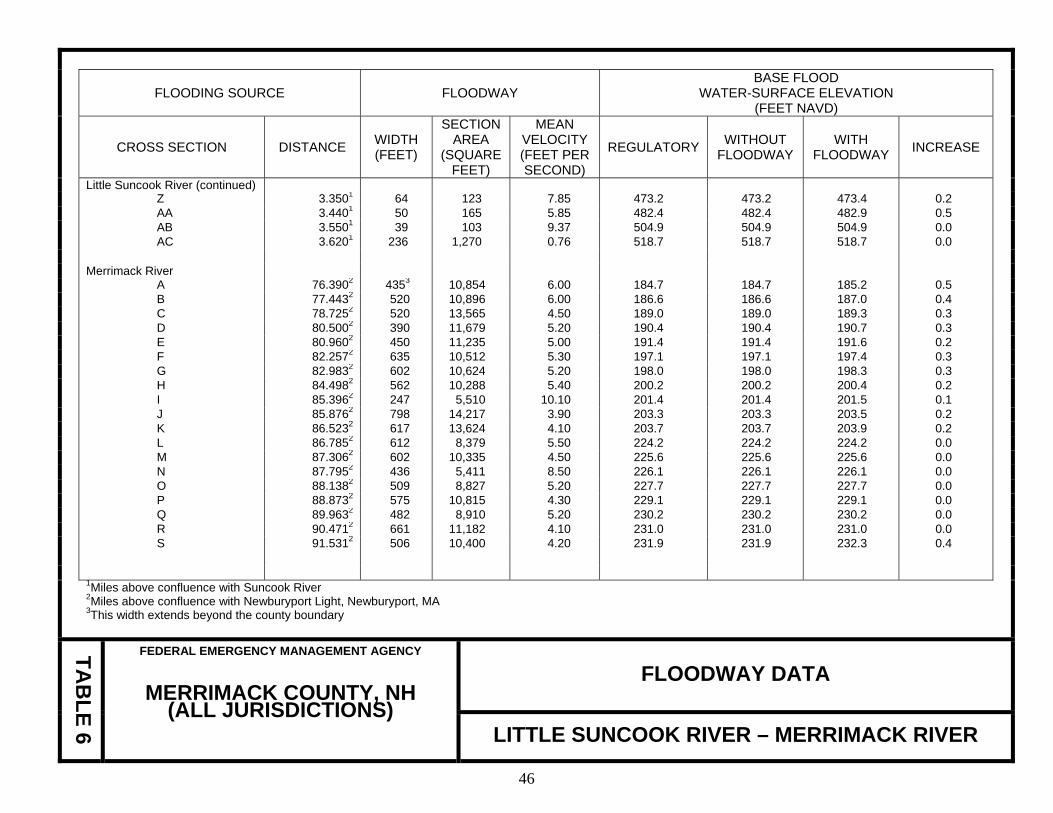
FLOODING SOURCE FLOODWAY BASE FLOOD
WATER-SURFACE ELEVATION (FEET NAVD)
CROSS SECTION DISTANCE WIDTH
(FEET)
SECTIONAREA
(SQUAREFEET)
MEAN VELOCITY(FEET PERSECOND)
REGULATORY WITHOUT FLOODWAY
WITH FLOODWAY INCREASE
Little Suncook River (continued) Z 3.3501 64 123 7.85 473.2 473.2 473.4 0.2 AA 3.4401 50 165 5.85 482.4 482.4 482.9 0.5 AB 3.5501 39 103 9.37 504.9 504.9 504.9 0.0 AC 3.6201 236 1,270 0.76 518.7 518.7 518.7 0.0 Merrimack River A 76.3902 4353 10,854 6.00 184.7 184.7 185.2 0.5 B 77.4432 520 10,896 6.00 186.6 186.6 187.0 0.4 C 78.7252 520 13,565 4.50 189.0 189.0 189.3 0.3 D 80.5002 390 11,679 5.20 190.4 190.4 190.7 0.3 E 80.9602 450 11,235 5.00 191.4 191.4 191.6 0.2 F 82.2572 635 10,512 5.30 197.1 197.1 197.4 0.3 G 82.9832 602 10,624 5.20 198.0 198.0 198.3 0.3 H 84.4982 562 10,288 5.40 200.2 200.2 200.4 0.2 I 85.3962 247 5,510 10.10 201.4 201.4 201.5 0.1 J 85.8762 798 14,217 3.90 203.3 203.3 203.5 0.2 K 86.5232 617 13,624 4.10 203.7 203.7 203.9 0.2 L 86.7852 612 8,379 5.50 224.2 224.2 224.2 0.0 M 87.3062 602 10,335 4.50 225.6 225.6 225.6 0.0 N 87.7952 436 5,411 8.50 226.1 226.1 226.1 0.0 O 88.1382 509 8,827 5.20 227.7 227.7 227.7 0.0 P 88.8732 575 10,815 4.30 229.1 229.1 229.1 0.0 Q 89.9632 482 8,910 5.20 230.2 230.2 230.2 0.0 R 90.4712 661 11,182 4.10 231.0 231.0 231.0 0.0 S 91.5312 506 10,400 4.20 231.9 231.9 232.3 0.4 1Miles above confluence with Suncook River
2Miles above confluence with Newburyport Light, Newburyport, MA 3This width extends beyond the county boundary
TAB
LE 6
FEDERAL EMERGENCY MANAGEMENT AGENCY
MERRIMACK COUNTY, NH (ALL JURISDICTIONS)
FLOODWAY DATA
LITTLE SUNCOOK RIVER – MERRIMACK RIVER
46
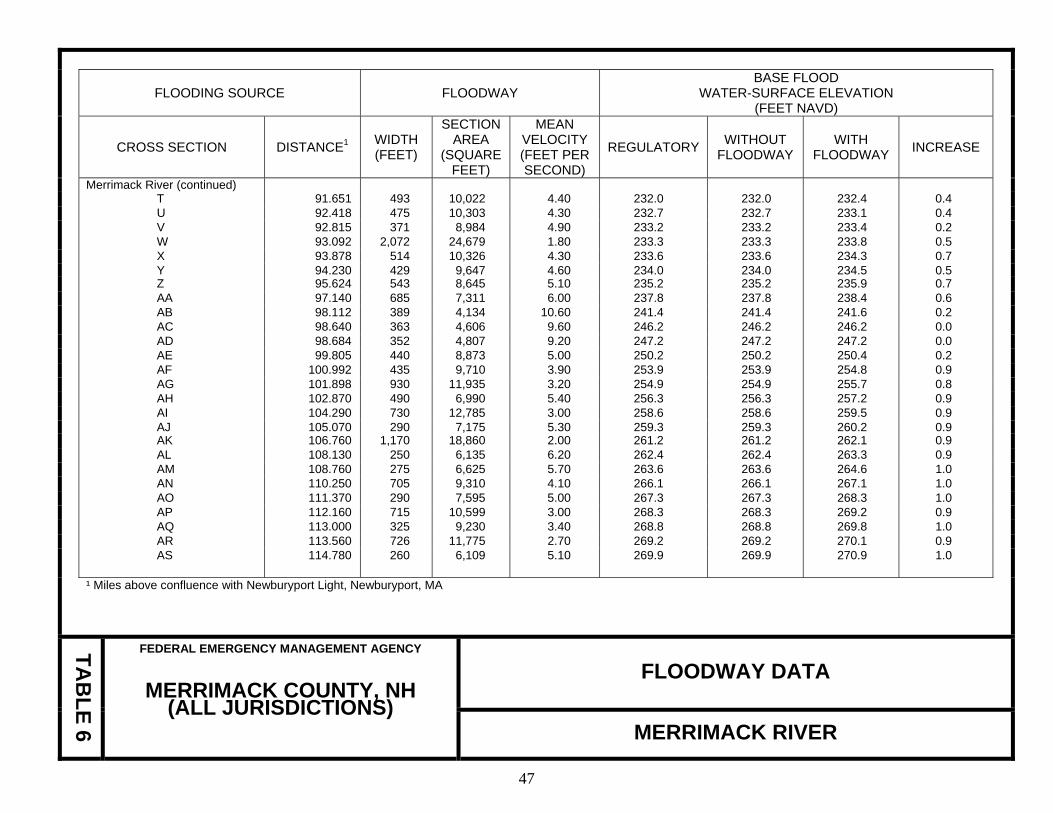
FLOODING SOURCE FLOODWAY BASE FLOOD
WATER-SURFACE ELEVATION (FEET NAVD)
CROSS SECTION DISTANCE1 WIDTH
(FEET)
SECTIONAREA
(SQUAREFEET)
MEAN VELOCITY(FEET PERSECOND)
REGULATORY WITHOUT FLOODWAY
WITH FLOODWAY INCREASE
Merrimack River (continued) T 91.651 493 10,022 4.40 232.0 232.0 232.4 0.4 U 92.418 475 10,303 4.30 232.7 232.7 233.1 0.4 V 92.815 371 8,984 4.90 233.2 233.2 233.4 0.2 W 93.092 2,072 24,679 1.80 233.3 233.3 233.8 0.5 X 93.878 514 10,326 4.30 233.6 233.6 234.3 0.7 Y 94.230 429 9,647 4.60 234.0 234.0 234.5 0.5 Z 95.624 543 8,645 5.10 235.2 235.2 235.9 0.7 AA 97.140 685 7,311 6.00 237.8 237.8 238.4 0.6 AB 98.112 389 4,134 10.60 241.4 241.4 241.6 0.2 AC 98.640 363 4,606 9.60 246.2 246.2 246.2 0.0 AD 98.684 352 4,807 9.20 247.2 247.2 247.2 0.0 AE 99.805 440 8,873 5.00 250.2 250.2 250.4 0.2 AF 100.992 435 9,710 3.90 253.9 253.9 254.8 0.9 AG 101.898 930 11,935 3.20 254.9 254.9 255.7 0.8 AH 102.870 490 6,990 5.40 256.3 256.3 257.2 0.9 AI 104.290 730 12,785 3.00 258.6 258.6 259.5 0.9 AJ 105.070 290 7,175 5.30 259.3 259.3 260.2 0.9 AK 106.760 1,170 18,860 2.00 261.2 261.2 262.1 0.9 AL 108.130 250 6,135 6.20 262.4 262.4 263.3 0.9 AM 108.760 275 6,625 5.70 263.6 263.6 264.6 1.0 AN 110.250 705 9,310 4.10 266.1 266.1 267.1 1.0 AO 111.370 290 7,595 5.00 267.3 267.3 268.3 1.0 AP 112.160 715 10,599 3.00 268.3 268.3 269.2 0.9 AQ 113.000 325 9,230 3.40 268.8 268.8 269.8 1.0 AR 113.560 726 11,775 2.70 269.2 269.2 270.1 0.9 AS 114.780 260 6,109 5.10 269.9 269.9 270.9 1.0 ¹ Miles above confluence with Newburyport Light, Newburyport, MA
TAB
LE 6
FEDERAL EMERGENCY MANAGEMENT AGENCY
MERRIMACK COUNTY, NH (ALL JURISDICTIONS)
FLOODWAY DATA
MERRIMACK RIVER
47
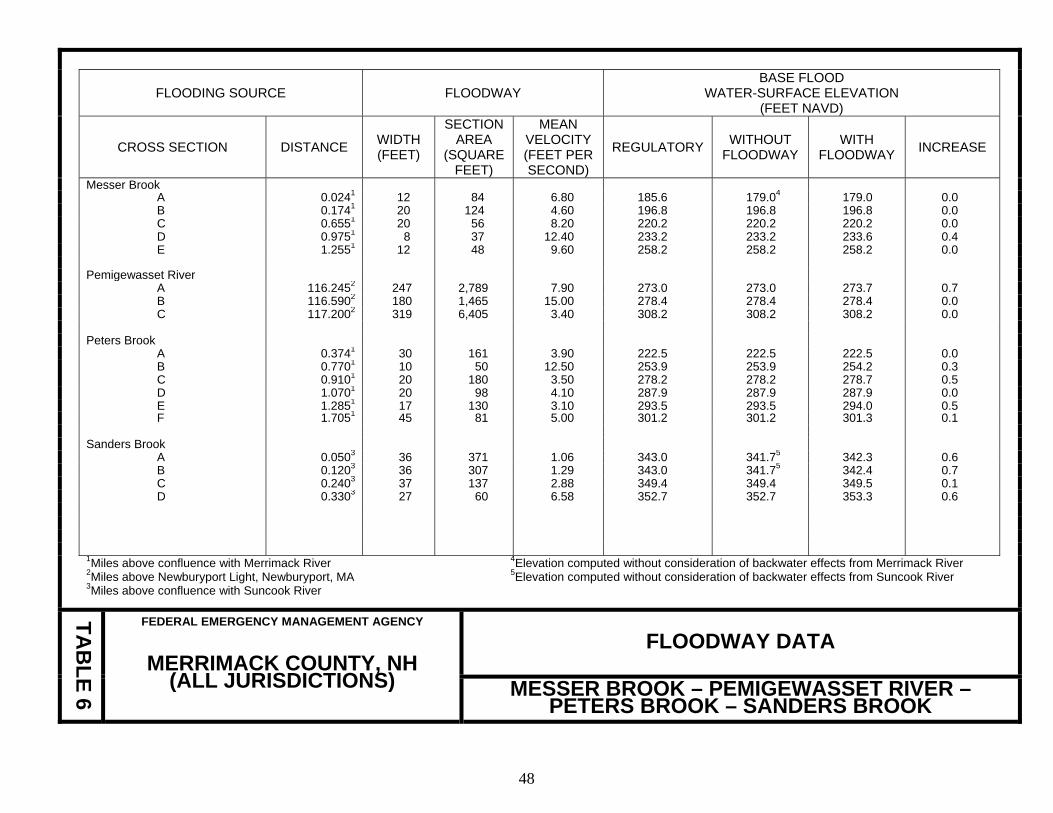
FLOODING SOURCE FLOODWAY BASE FLOOD
WATER-SURFACE ELEVATION (FEET NAVD)
CROSS SECTION DISTANCE WIDTH
(FEET)
SECTIONAREA
(SQUAREFEET)
MEAN VELOCITY (FEET PERSECOND)
REGULATORY WITHOUT FLOODWAY
WITH FLOODWAY INCREASE
Messer Brook A 0.0241 12 84 6.80 185.6 179.04 179.0 0.0 B 0.1741 20 124 4.60 196.8 196.8 196.8 0.0 C 0.6551 20 56 8.20 220.2 220.2 220.2 0.0 D 0.9751 8 37 12.40 233.2 233.2 233.6 0.4 E 1.2551 12 48 9.60 258.2 258.2 258.2 0.0 Pemigewasset River A 116.2452 247 2,789 7.90 273.0 273.0 273.7 0.7 B 116.5902 180 1,465 15.00 278.4 278.4 278.4 0.0 C 117.2002 319 6,405 3.40 308.2 308.2 308.2 0.0 Peters Brook A 0.3741 30 161 3.90 222.5 222.5 222.5 0.0 B 0.7701 10 50 12.50 253.9 253.9 254.2 0.3 C 0.9101 20 180 3.50 278.2 278.2 278.7 0.5 D 1.0701 20 98 4.10 287.9 287.9 287.9 0.0 E 1.2851 17 130 3.10 293.5 293.5 294.0 0.5 F 1.7051 45 81 5.00 301.2 301.2 301.3 0.1 Sanders Brook A 0.0503 36 371 1.06 343.0 341.75 342.3 0.6 B 0.1203 36 307 1.29 343.0 341.75 342.4 0.7 C 0.2403 37 137 2.88 349.4 349.4 349.5 0.1 D 0.3303 27 60 6.58 352.7 352.7 353.3 0.6 1Miles above confluence with Merrimack River 4Elevation computed without consideration of backwater effects from Merrimack River
2Miles above Newburyport Light, Newburyport, MA 5Elevation computed without consideration of backwater effects from Suncook River 3Miles above confluence with Suncook River
TAB
LE 6
FEDERAL EMERGENCY MANAGEMENT AGENCY
MERRIMACK COUNTY, NH (ALL JURISDICTIONS)
FLOODWAY DATA
MESSER BROOK – PEMIGEWASSET RIVER –PETERS BROOK – SANDERS BROOK
48
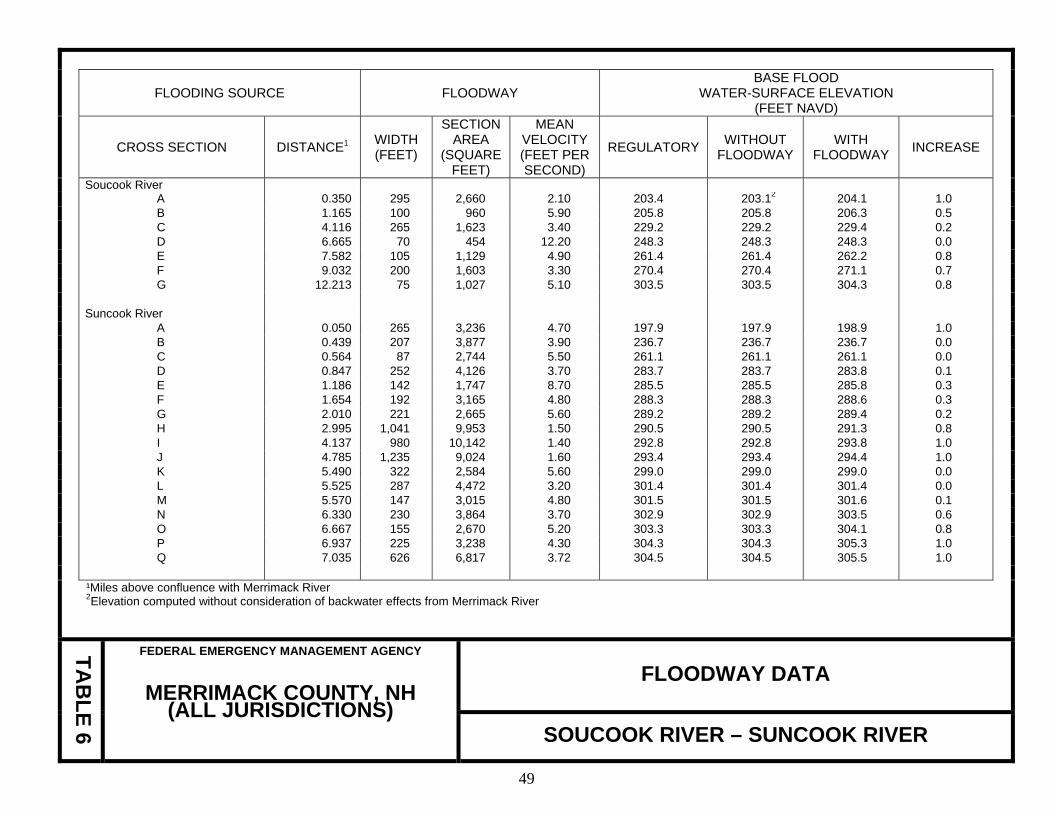
FLOODING SOURCE FLOODWAY BASE FLOOD
WATER-SURFACE ELEVATION (FEET NAVD)
CROSS SECTION DISTANCE1 WIDTH
(FEET)
SECTIONAREA
(SQUAREFEET)
MEAN VELOCITY(FEET PERSECOND)
REGULATORY WITHOUT FLOODWAY
WITH FLOODWAY INCREASE
Soucook River A 0.350 295 2,660 2.10 203.4 203.12 204.1 1.0 B 1.165 100 960 5.90 205.8 205.8 206.3 0.5 C 4.116 265 1,623 3.40 229.2 229.2 229.4 0.2 D 6.665 70 454 12.20 248.3 248.3 248.3 0.0 E 7.582 105 1,129 4.90 261.4 261.4 262.2 0.8 F 9.032 200 1,603 3.30 270.4 270.4 271.1 0.7 G 12.213 75 1,027 5.10 303.5 303.5 304.3 0.8 Suncook River A 0.050 265 3,236 4.70 197.9 197.9 198.9 1.0 B 0.439 207 3,877 3.90 236.7 236.7 236.7 0.0 C 0.564 87 2,744 5.50 261.1 261.1 261.1 0.0 D 0.847 252 4,126 3.70 283.7 283.7 283.8 0.1 E 1.186 142 1,747 8.70 285.5 285.5 285.8 0.3 F 1.654 192 3,165 4.80 288.3 288.3 288.6 0.3 G 2.010 221 2,665 5.60 289.2 289.2 289.4 0.2 H 2.995 1,041 9,953 1.50 290.5 290.5 291.3 0.8 I 4.137 980 10,142 1.40 292.8 292.8 293.8 1.0 J 4.785 1,235 9,024 1.60 293.4 293.4 294.4 1.0 K 5.490 322 2,584 5.60 299.0 299.0 299.0 0.0 L 5.525 287 4,472 3.20 301.4 301.4 301.4 0.0 M 5.570 147 3,015 4.80 301.5 301.5 301.6 0.1 N 6.330 230 3,864 3.70 302.9 302.9 303.5 0.6 O 6.667 155 2,670 5.20 303.3 303.3 304.1 0.8 P 6.937 225 3,238 4.30 304.3 304.3 305.3 1.0 Q 7.035 626 6,817 3.72 304.5 304.5 305.5 1.0 ¹Miles above confluence with Merrimack River
2Elevation computed without consideration of backwater effects from Merrimack River
TAB
LE 6
FEDERAL EMERGENCY MANAGEMENT AGENCY
MERRIMACK COUNTY, NH (ALL JURISDICTIONS)
FLOODWAY DATA
SOUCOOK RIVER – SUNCOOK RIVER
49
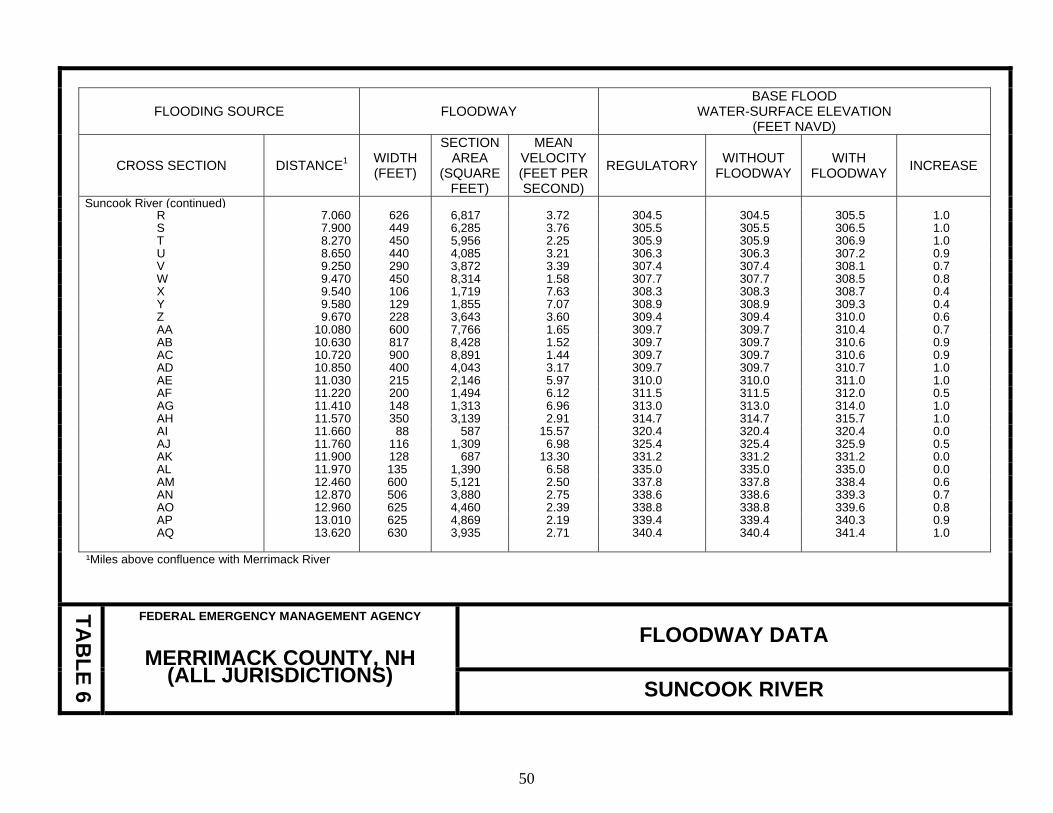
FLOODING SOURCE FLOODWAY BASE FLOOD
WATER-SURFACE ELEVATION (FEET NAVD)
CROSS SECTION DISTANCE1 WIDTH
(FEET)
SECTIONAREA
(SQUAREFEET)
MEAN VELOCITY(FEET PERSECOND)
REGULATORY WITHOUT FLOODWAY
WITH FLOODWAY INCREASE
Suncook River (continued) R 7.060 626 6,817 3.72 304.5 304.5 305.5 1.0 S 7.900 449 6,285 3.76 305.5 305.5 306.5 1.0 T 8.270 450 5,956 2.25 305.9 305.9 306.9 1.0 U 8.650 440 4,085 3.21 306.3 306.3 307.2 0.9 V 9.250 290 3,872 3.39 307.4 307.4 308.1 0.7 W 9.470 450 8,314 1.58 307.7 307.7 308.5 0.8 X 9.540 106 1,719 7.63 308.3 308.3 308.7 0.4 Y 9.580 129 1,855 7.07 308.9 308.9 309.3 0.4 Z 9.670 228 3,643 3.60 309.4 309.4 310.0 0.6 AA 10.080 600 7,766 1.65 309.7 309.7 310.4 0.7 AB 10.630 817 8,428 1.52 309.7 309.7 310.6 0.9 AC 10.720 900 8,891 1.44 309.7 309.7 310.6 0.9 AD 10.850 400 4,043 3.17 309.7 309.7 310.7 1.0 AE 11.030 215 2,146 5.97 310.0 310.0 311.0 1.0 AF 11.220 200 1,494 6.12 311.5 311.5 312.0 0.5 AG 11.410 148 1,313 6.96 313.0 313.0 314.0 1.0 AH 11.570 350 3,139 2.91 314.7 314.7 315.7 1.0 AI 11.660 88 587 15.57 320.4 320.4 320.4 0.0 AJ 11.760 116 1,309 6.98 325.4 325.4 325.9 0.5 AK 11.900 128 687 13.30 331.2 331.2 331.2 0.0 AL 11.970 135 1,390 6.58 335.0 335.0 335.0 0.0 AM 12.460 600 5,121 2.50 337.8 337.8 338.4 0.6 AN 12.870 506 3,880 2.75 338.6 338.6 339.3 0.7 AO 12.960 625 4,460 2.39 338.8 338.8 339.6 0.8 AP 13.010 625 4,869 2.19 339.4 339.4 340.3 0.9 AQ 13.620 630 3,935 2.71 340.4 340.4 341.4 1.0 ¹Miles above confluence with Merrimack River
TAB
LE 6
FEDERAL EMERGENCY MANAGEMENT AGENCY
MERRIMACK COUNTY, NH (ALL JURISDICTIONS)
FLOODWAY DATA
SUNCOOK RIVER
50
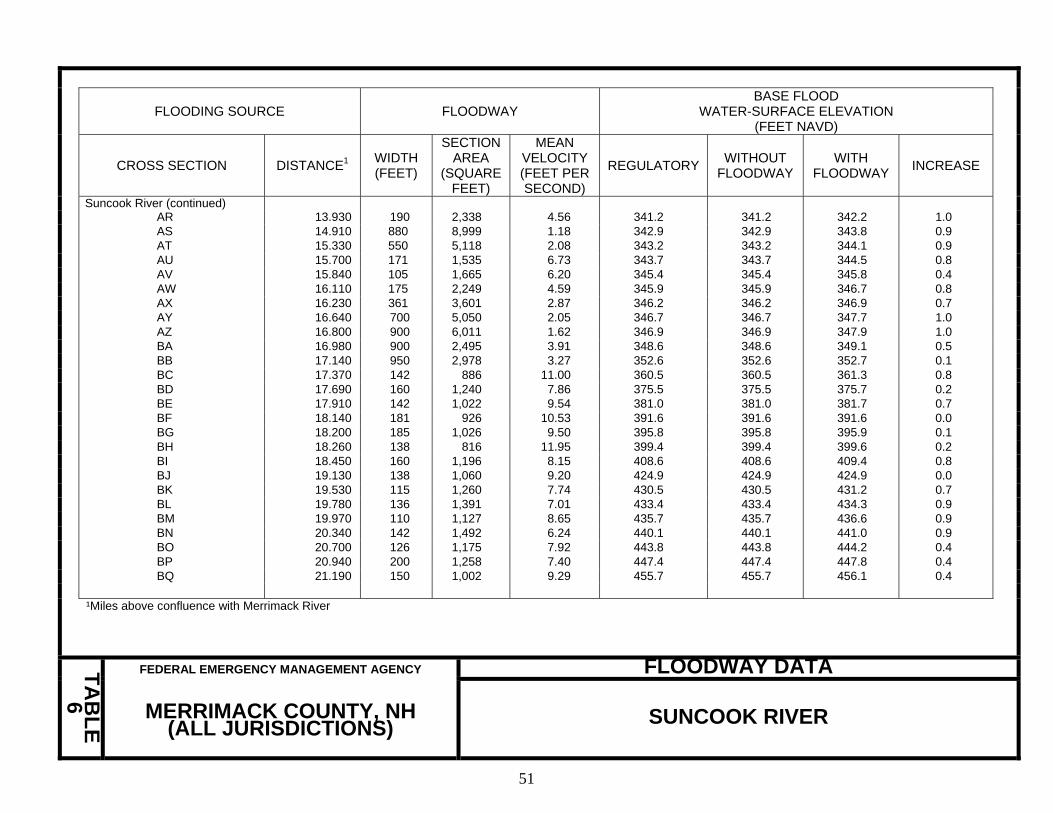
FLOODING SOURCE FLOODWAY BASE FLOOD
WATER-SURFACE ELEVATION (FEET NAVD)
CROSS SECTION DISTANCE1 WIDTH
(FEET)
SECTIONAREA
(SQUAREFEET)
MEAN VELOCITY(FEET PERSECOND)
REGULATORY WITHOUT FLOODWAY
WITH FLOODWAY INCREASE
Suncook River (continued) AR 13.930 190 2,338 4.56 341.2 341.2 342.2 1.0 AS 14.910 880 8,999 1.18 342.9 342.9 343.8 0.9 AT 15.330 550 5,118 2.08 343.2 343.2 344.1 0.9 AU 15.700 171 1,535 6.73 343.7 343.7 344.5 0.8 AV 15.840 105 1,665 6.20 345.4 345.4 345.8 0.4 AW 16.110 175 2,249 4.59 345.9 345.9 346.7 0.8 AX 16.230 361 3,601 2.87 346.2 346.2 346.9 0.7 AY 16.640 700 5,050 2.05 346.7 346.7 347.7 1.0 AZ 16.800 900 6,011 1.62 346.9 346.9 347.9 1.0 BA 16.980 900 2,495 3.91 348.6 348.6 349.1 0.5 BB 17.140 950 2,978 3.27 352.6 352.6 352.7 0.1 BC 17.370 142 886 11.00 360.5 360.5 361.3 0.8 BD 17.690 160 1,240 7.86 375.5 375.5 375.7 0.2 BE 17.910 142 1,022 9.54 381.0 381.0 381.7 0.7 BF 18.140 181 926 10.53 391.6 391.6 391.6 0.0 BG 18.200 185 1,026 9.50 395.8 395.8 395.9 0.1 BH 18.260 138 816 11.95 399.4 399.4 399.6 0.2 BI 18.450 160 1,196 8.15 408.6 408.6 409.4 0.8 BJ 19.130 138 1,060 9.20 424.9 424.9 424.9 0.0 BK 19.530 115 1,260 7.74 430.5 430.5 431.2 0.7 BL 19.780 136 1,391 7.01 433.4 433.4 434.3 0.9 BM 19.970 110 1,127 8.65 435.7 435.7 436.6 0.9 BN 20.340 142 1,492 6.24 440.1 440.1 441.0 0.9 BO 20.700 126 1,175 7.92 443.8 443.8 444.2 0.4 BP 20.940 200 1,258 7.40 447.4 447.4 447.8 0.4 BQ 21.190 150 1,002 9.29 455.7 455.7 456.1 0.4 ¹Miles above confluence with Merrimack River
FLOODWAY DATATAB
LE 6
FEDERAL EMERGENCY MANAGEMENT AGENCY
MERRIMACK COUNTY, NH (ALL JURISDICTIONS)
SUNCOOK RIVER
51
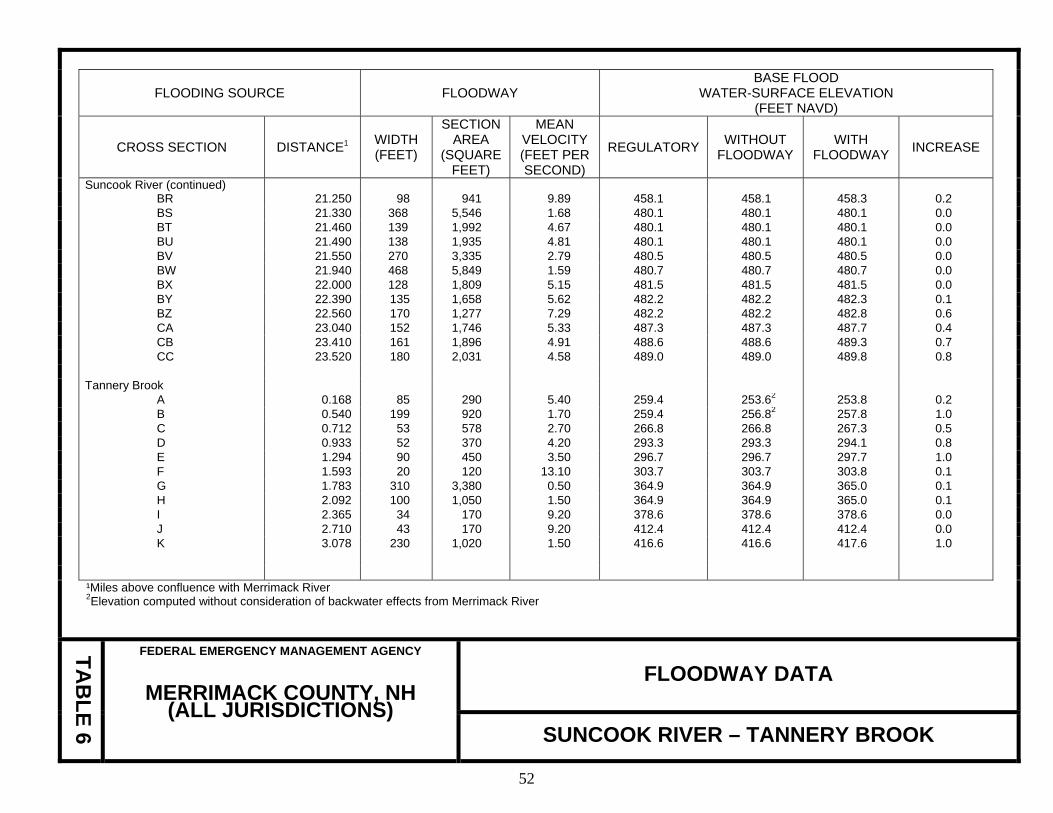
FLOODING SOURCE FLOODWAY BASE FLOOD
WATER-SURFACE ELEVATION (FEET NAVD)
CROSS SECTION DISTANCE1 WIDTH
(FEET)
SECTIONAREA
(SQUAREFEET)
MEAN VELOCITY(FEET PERSECOND)
REGULATORY WITHOUT FLOODWAY
WITH FLOODWAY INCREASE
Suncook River (continued) BR 21.250 98 941 9.89 458.1 458.1 458.3 0.2 BS 21.330 368 5,546 1.68 480.1 480.1 480.1 0.0 BT 21.460 139 1,992 4.67 480.1 480.1 480.1 0.0 BU 21.490 138 1,935 4.81 480.1 480.1 480.1 0.0 BV 21.550 270 3,335 2.79 480.5 480.5 480.5 0.0 BW 21.940 468 5,849 1.59 480.7 480.7 480.7 0.0 BX 22.000 128 1,809 5.15 481.5 481.5 481.5 0.0 BY 22.390 135 1,658 5.62 482.2 482.2 482.3 0.1 BZ 22.560 170 1,277 7.29 482.2 482.2 482.8 0.6 CA 23.040 152 1,746 5.33 487.3 487.3 487.7 0.4 CB 23.410 161 1,896 4.91 488.6 488.6 489.3 0.7 CC 23.520 180 2,031 4.58 489.0 489.0 489.8 0.8 Tannery Brook A 0.168 85 290 5.40 259.4 253.62 253.8 0.2 B 0.540 199 920 1.70 259.4 256.82 257.8 1.0 C 0.712 53 578 2.70 266.8 266.8 267.3 0.5 D 0.933 52 370 4.20 293.3 293.3 294.1 0.8 E 1.294 90 450 3.50 296.7 296.7 297.7 1.0 F 1.593 20 120 13.10 303.7 303.7 303.8 0.1 G 1.783 310 3,380 0.50 364.9 364.9 365.0 0.1 H 2.092 100 1,050 1.50 364.9 364.9 365.0 0.1 I 2.365 34 170 9.20 378.6 378.6 378.6 0.0 J 2.710 43 170 9.20 412.4 412.4 412.4 0.0 K 3.078 230 1,020 1.50 416.6 416.6 417.6 1.0 ¹Miles above confluence with Merrimack River
2Elevation computed without consideration of backwater effects from Merrimack River
TAB
LE 6
FEDERAL EMERGENCY MANAGEMENT AGENCY
MERRIMACK COUNTY, NH (ALL JURISDICTIONS)
FLOODWAY DATA
SUNCOOK RIVER – TANNERY BROOK
52
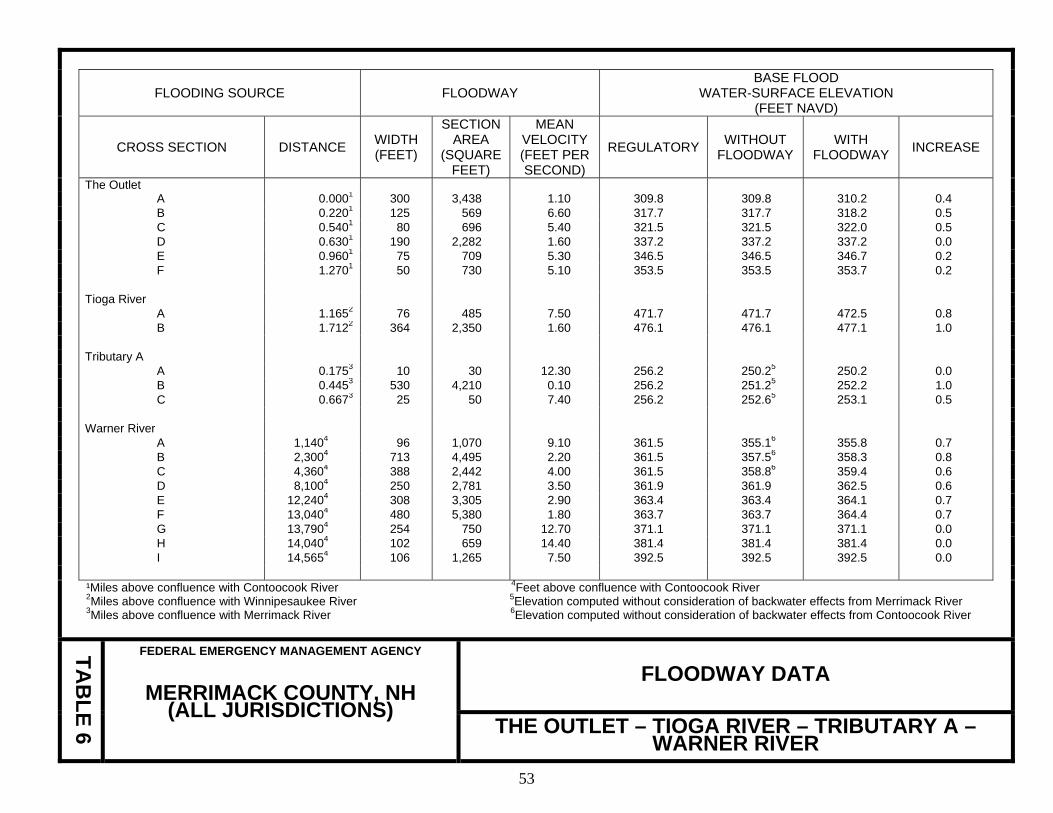
FLOODING SOURCE FLOODWAY BASE FLOOD
WATER-SURFACE ELEVATION (FEET NAVD)
CROSS SECTION DISTANCE WIDTH
(FEET)
SECTIONAREA
(SQUAREFEET)
MEAN VELOCITY(FEET PERSECOND)
REGULATORY WITHOUT FLOODWAY
WITH FLOODWAY INCREASE
The Outlet A 0.0001 300 3,438 1.10 309.8 309.8 310.2 0.4 B 0.2201 125 569 6.60 317.7 317.7 318.2 0.5 C 0.5401 80 696 5.40 321.5 321.5 322.0 0.5 D 0.6301 190 2,282 1.60 337.2 337.2 337.2 0.0 E 0.9601 75 709 5.30 346.5 346.5 346.7 0.2 F 1.2701 50 730 5.10 353.5 353.5 353.7 0.2 Tioga River A 1.1652 76 485 7.50 471.7 471.7 472.5 0.8 B 1.7122 364 2,350 1.60 476.1 476.1 477.1 1.0 Tributary A A 0.1753 10 30 12.30 256.2 250.25 250.2 0.0 B 0.4453 530 4,210 0.10 256.2 251.25 252.2 1.0 C 0.6673 25 50 7.40 256.2 252.65 253.1 0.5 Warner River A 1,1404 96 1,070 9.10 361.5 355.16 355.8 0.7 B 2,3004 713 4,495 2.20 361.5 357.56 358.3 0.8 C 4,3604 388 2,442 4.00 361.5 358.86 359.4 0.6 D 8,1004 250 2,781 3.50 361.9 361.9 362.5 0.6 E 12,2404 308 3,305 2.90 363.4 363.4 364.1 0.7 F 13,0404 480 5,380 1.80 363.7 363.7 364.4 0.7 G 13,7904 254 750 12.70 371.1 371.1 371.1 0.0 H 14,0404 102 659 14.40 381.4 381.4 381.4 0.0 I 14,5654 106 1,265 7.50 392.5 392.5 392.5 0.0 ¹Miles above confluence with Contoocook River 4Feet above confluence with Contoocook River
2Miles above confluence with Winnipesaukee River 5Elevation computed without consideration of backwater effects from Merrimack River 3Miles above confluence with Merrimack River 6Elevation computed without consideration of backwater effects from Contoocook River
TAB
LE 6
FEDERAL EMERGENCY MANAGEMENT AGENCY
MERRIMACK COUNTY, NH (ALL JURISDICTIONS)
FLOODWAY DATA
THE OUTLET – TIOGA RIVER – TRIBUTARY A –WARNER RIVER
53
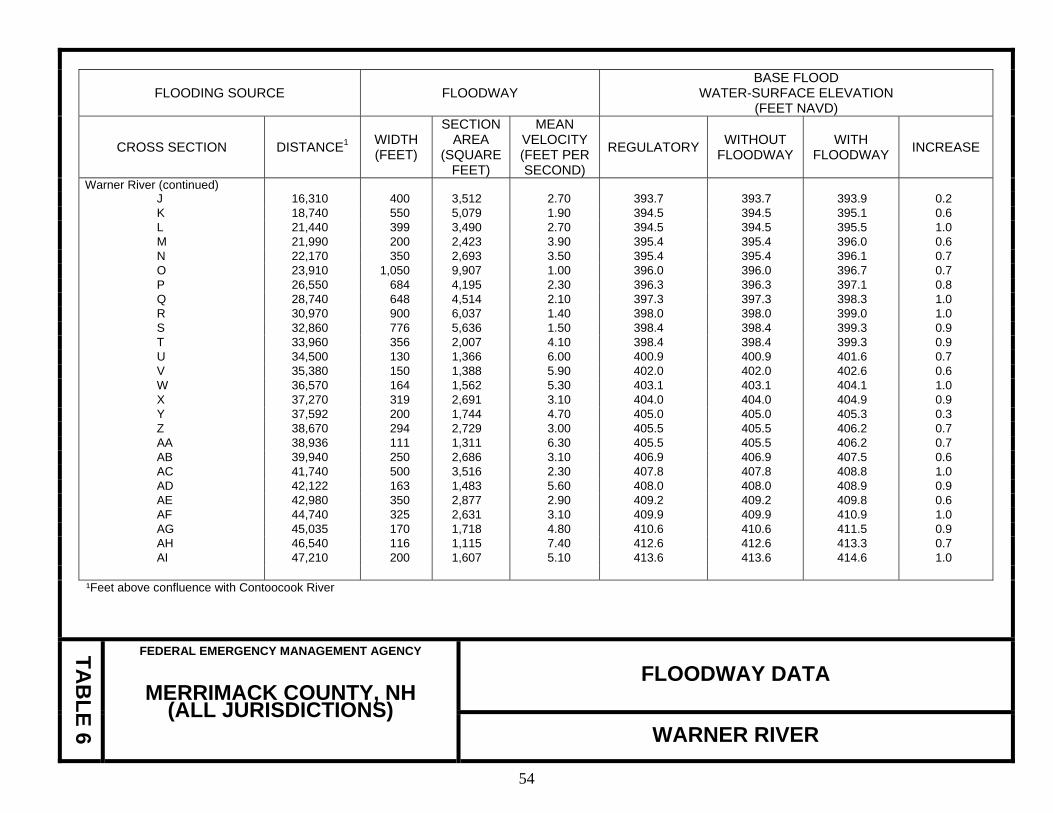
FLOODING SOURCE FLOODWAY BASE FLOOD
WATER-SURFACE ELEVATION (FEET NAVD)
CROSS SECTION DISTANCE1 WIDTH
(FEET)
SECTIONAREA
(SQUAREFEET)
MEAN VELOCITY(FEET PERSECOND)
REGULATORY WITHOUT FLOODWAY
WITH FLOODWAY INCREASE
Warner River (continued) J 16,310 400 3,512 2.70 393.7 393.7 393.9 0.2 K 18,740 550 5,079 1.90 394.5 394.5 395.1 0.6 L 21,440 399 3,490 2.70 394.5 394.5 395.5 1.0 M 21,990 200 2,423 3.90 395.4 395.4 396.0 0.6 N 22,170 350 2,693 3.50 395.4 395.4 396.1 0.7 O 23,910 1,050 9,907 1.00 396.0 396.0 396.7 0.7 P 26,550 684 4,195 2.30 396.3 396.3 397.1 0.8 Q 28,740 648 4,514 2.10 397.3 397.3 398.3 1.0 R 30,970 900 6,037 1.40 398.0 398.0 399.0 1.0 S 32,860 776 5,636 1.50 398.4 398.4 399.3 0.9 T 33,960 356 2,007 4.10 398.4 398.4 399.3 0.9 U 34,500 130 1,366 6.00 400.9 400.9 401.6 0.7 V 35,380 150 1,388 5.90 402.0 402.0 402.6 0.6 W 36,570 164 1,562 5.30 403.1 403.1 404.1 1.0 X 37,270 319 2,691 3.10 404.0 404.0 404.9 0.9 Y 37,592 200 1,744 4.70 405.0 405.0 405.3 0.3 Z 38,670 294 2,729 3.00 405.5 405.5 406.2 0.7 AA 38,936 111 1,311 6.30 405.5 405.5 406.2 0.7 AB 39,940 250 2,686 3.10 406.9 406.9 407.5 0.6 AC 41,740 500 3,516 2.30 407.8 407.8 408.8 1.0 AD 42,122 163 1,483 5.60 408.0 408.0 408.9 0.9 AE 42,980 350 2,877 2.90 409.2 409.2 409.8 0.6 AF 44,740 325 2,631 3.10 409.9 409.9 410.9 1.0 AG 45,035 170 1,718 4.80 410.6 410.6 411.5 0.9 AH 46,540 116 1,115 7.40 412.6 412.6 413.3 0.7 AI 47,210 200 1,607 5.10 413.6 413.6 414.6 1.0 ¹Feet above confluence with Contoocook River
TAB
LE 6
FEDERAL EMERGENCY MANAGEMENT AGENCY
MERRIMACK COUNTY, NH (ALL JURISDICTIONS)
FLOODWAY DATA
WARNER RIVER
54
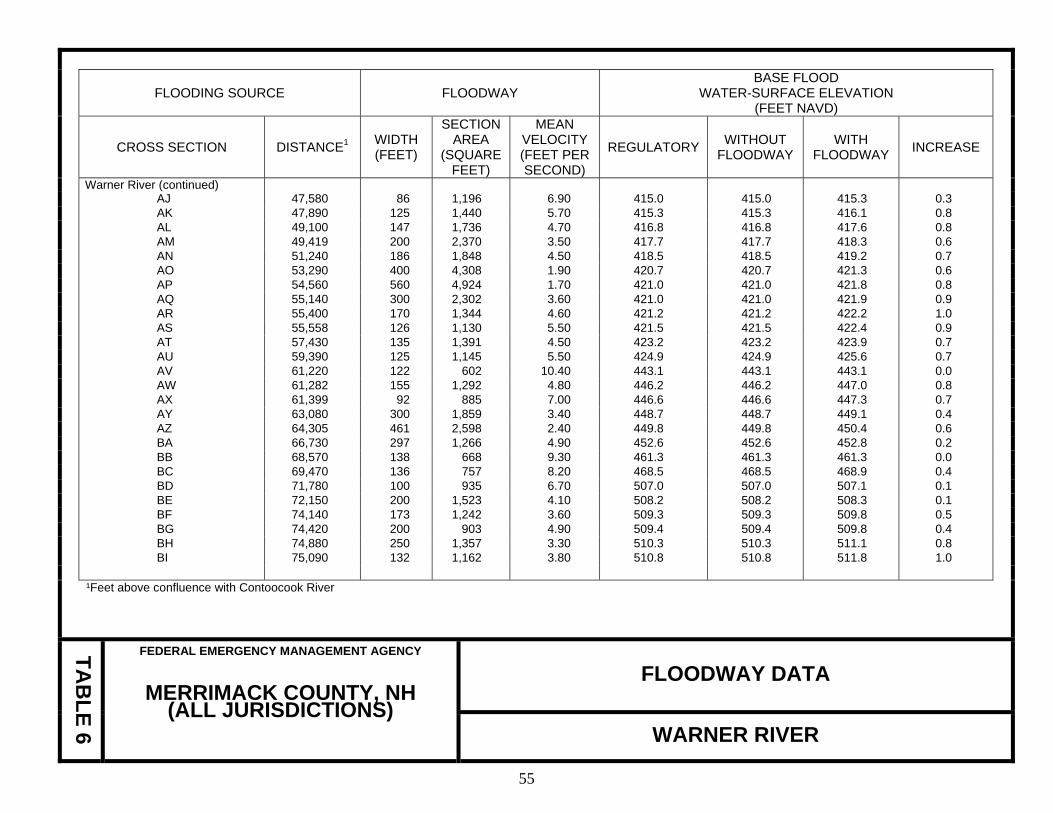
FLOODING SOURCE FLOODWAY BASE FLOOD
WATER-SURFACE ELEVATION (FEET NAVD)
CROSS SECTION DISTANCE1 WIDTH
(FEET)
SECTIONAREA
(SQUAREFEET)
MEAN VELOCITY(FEET PERSECOND)
REGULATORY WITHOUT FLOODWAY
WITH FLOODWAY INCREASE
Warner River (continued) AJ 47,580 86 1,196 6.90 415.0 415.0 415.3 0.3 AK 47,890 125 1,440 5.70 415.3 415.3 416.1 0.8 AL 49,100 147 1,736 4.70 416.8 416.8 417.6 0.8 AM 49,419 200 2,370 3.50 417.7 417.7 418.3 0.6 AN 51,240 186 1,848 4.50 418.5 418.5 419.2 0.7 AO 53,290 400 4,308 1.90 420.7 420.7 421.3 0.6 AP 54,560 560 4,924 1.70 421.0 421.0 421.8 0.8 AQ 55,140 300 2,302 3.60 421.0 421.0 421.9 0.9 AR 55,400 170 1,344 4.60 421.2 421.2 422.2 1.0 AS 55,558 126 1,130 5.50 421.5 421.5 422.4 0.9 AT 57,430 135 1,391 4.50 423.2 423.2 423.9 0.7 AU 59,390 125 1,145 5.50 424.9 424.9 425.6 0.7 AV 61,220 122 602 10.40 443.1 443.1 443.1 0.0 AW 61,282 155 1,292 4.80 446.2 446.2 447.0 0.8 AX 61,399 92 885 7.00 446.6 446.6 447.3 0.7 AY 63,080 300 1,859 3.40 448.7 448.7 449.1 0.4 AZ 64,305 461 2,598 2.40 449.8 449.8 450.4 0.6 BA 66,730 297 1,266 4.90 452.6 452.6 452.8 0.2 BB 68,570 138 668 9.30 461.3 461.3 461.3 0.0 BC 69,470 136 757 8.20 468.5 468.5 468.9 0.4 BD 71,780 100 935 6.70 507.0 507.0 507.1 0.1 BE 72,150 200 1,523 4.10 508.2 508.2 508.3 0.1 BF 74,140 173 1,242 3.60 509.3 509.3 509.8 0.5 BG 74,420 200 903 4.90 509.4 509.4 509.8 0.4 BH 74,880 250 1,357 3.30 510.3 510.3 511.1 0.8 BI 75,090 132 1,162 3.80 510.8 510.8 511.8 1.0 ¹Feet above confluence with Contoocook River
TAB
LE 6
FEDERAL EMERGENCY MANAGEMENT AGENCY
MERRIMACK COUNTY, NH (ALL JURISDICTIONS)
FLOODWAY DATA
WARNER RIVER
55

FLOODING SOURCE FLOODWAY BASE FLOOD
WATER-SURFACE ELEVATION (FEET NAVD)
CROSS SECTION DISTANCE1 WIDTH
(FEET)
SECTIONAREA
(SQUAREFEET)
MEAN VELOCITY(FEET PERSECOND)
REGULATORY WITHOUT FLOODWAY
WITH FLOODWAY INCREASE
Warner River (continued) BJ 75,340 80 919 4.90 511.6 511.6 512.6 1.0 BK 75,690 70 924 4.80 511.9 511.9 512.8 0.9 BL 77,044 80 702 6.40 519.4 519.4 520.3 0.9 BM 77,155 150 1,358 3.30 520.1 520.1 521.0 0.9 BN 77,490 146 1,628 2.70 520.5 520.5 521.3 0.8 BO 78,810 200 1,558 2.90 520.9 520.9 521.6 0.7 BP 80,520 45 301 14.80 544.9 544.9 544.9 0.0 BQ 81,640 83 757 5.90 558.0 558.0 558.1 0.1 BR 81,897 48 387 11.50 562.4 562.4 562.4 0.0 BS 83,260 57 446 10.00 589.1 589.1 589.9 0.8 BT 85,060 61 504 8.80 612.4 612.4 612.8 0.4 BU 85,890 50 439 10.20 624.8 624.8 625.8 1.0 BV 87,020 55 322 13.90 628.3 628.3 628.3 0.0 BW 87,190 71 884 5.00 638.3 638.3 638.3 0.0 BX 89,750 492 1,750 2.00 641.9 641.9 * * BY 89,823 485 2,600 1.40 642.2 642.2 * * BZ 91,780 221 1,790 2.00 642.6 642.6 * * CA 94,078 352 2,010 1.80 643.1 643.1 * * CB 94,160 297 2,050 1.70 643.3 643.3 * * CC 100,353 699 4,240 0.70 643.9 643.9 * * CD 100,552 86 723 4.30 643.9 643.9 * * ¹Feet above confluence with Contoocook River *Data not available
TAB
LE 6
FEDERAL EMERGENCY MANAGEMENT AGENCY
MERRIMACK COUNTY, NH (ALL JURISDICTIONS)
FLOODWAY DATA
WARNER RIVER
56
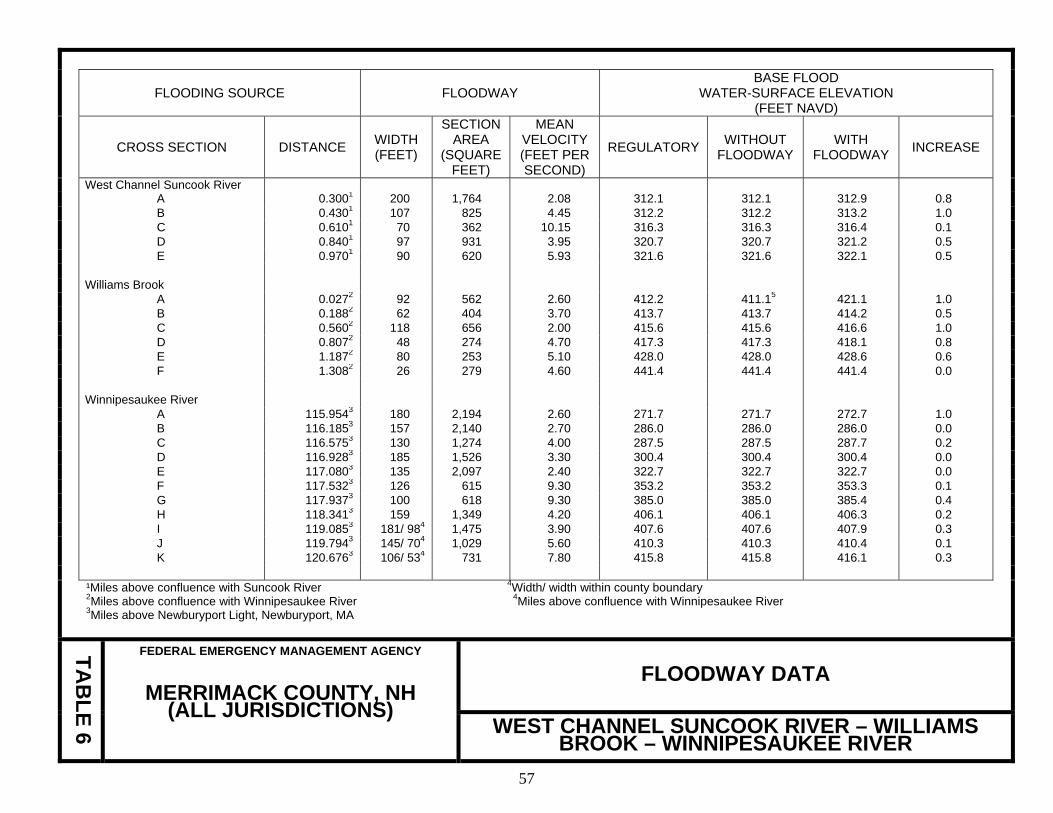
FLOODING SOURCE FLOODWAY BASE FLOOD
WATER-SURFACE ELEVATION (FEET NAVD)
CROSS SECTION DISTANCE WIDTH
(FEET)
SECTIONAREA
(SQUAREFEET)
MEAN VELOCITY(FEET PERSECOND)
REGULATORY WITHOUT FLOODWAY
WITH FLOODWAY INCREASE
West Channel Suncook River A 0.3001 200 1,764 2.08 312.1 312.1 312.9 0.8 B 0.4301 107 825 4.45 312.2 312.2 313.2 1.0 C 0.6101 70 362 10.15 316.3 316.3 316.4 0.1 D 0.8401 97 931 3.95 320.7 320.7 321.2 0.5 E 0.9701 90 620 5.93 321.6 321.6 322.1 0.5 Williams Brook A 0.0272 92 562 2.60 412.2 411.15 421.1 1.0 B 0.1882 62 404 3.70 413.7 413.7 414.2 0.5 C 0.5602 118 656 2.00 415.6 415.6 416.6 1.0 D 0.8072 48 274 4.70 417.3 417.3 418.1 0.8 E 1.1872 80 253 5.10 428.0 428.0 428.6 0.6 F 1.3082 26 279 4.60 441.4 441.4 441.4 0.0 Winnipesaukee River A 115.9543 180 2,194 2.60 271.7 271.7 272.7 1.0 B 116.1853 157 2,140 2.70 286.0 286.0 286.0 0.0 C 116.5753 130 1,274 4.00 287.5 287.5 287.7 0.2 D 116.9283 185 1,526 3.30 300.4 300.4 300.4 0.0 E 117.0803 135 2,097 2.40 322.7 322.7 322.7 0.0 F 117.5323 126 615 9.30 353.2 353.2 353.3 0.1 G 117.9373 100 618 9.30 385.0 385.0 385.4 0.4 H 118.3413 159 1,349 4.20 406.1 406.1 406.3 0.2 I 119.0853 181/ 984 1,475 3.90 407.6 407.6 407.9 0.3 J 119.7943 145/ 704 1,029 5.60 410.3 410.3 410.4 0.1 K 120.6763 106/ 534 731 7.80 415.8 415.8 416.1 0.3 ¹Miles above confluence with Suncook River 4Width/ width within county boundary
2Miles above confluence with Winnipesaukee River 4Miles above confluence with Winnipesaukee River 3Miles above Newburyport Light, Newburyport, MA
TAB
LE 6
FEDERAL EMERGENCY MANAGEMENT AGENCY
MERRIMACK COUNTY, NH (ALL JURISDICTIONS)
FLOODWAY DATA
WEST CHANNEL SUNCOOK RIVER – WILLIAMS BROOK – WINNIPESAUKEE RIVER
57
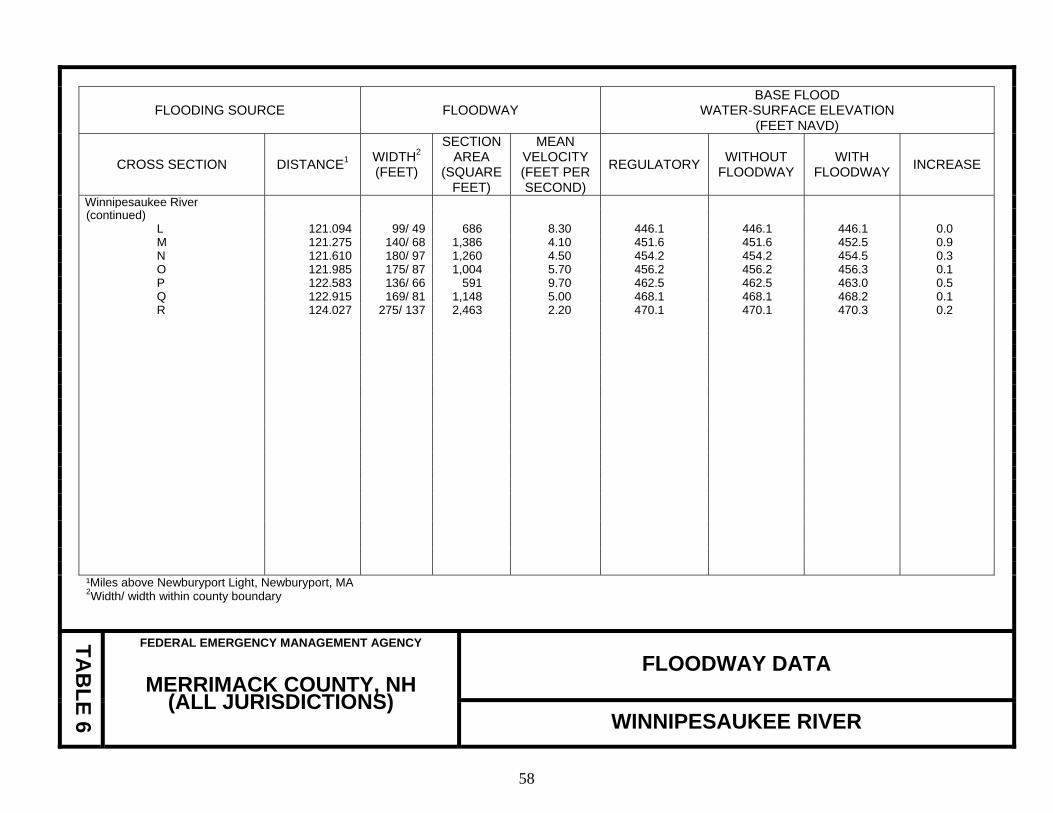
58
FLOODING SOURCE FLOODWAY BASE FLOOD
WATER-SURFACE ELEVATION (FEET NAVD)
CROSS SECTION DISTANCE1 WIDTH2
(FEET)
SECTIONAREA
(SQUAREFEET)
MEAN VELOCITY(FEET PERSECOND)
REGULATORY WITHOUT FLOODWAY
WITH FLOODWAY INCREASE
Winnipesaukee River (continued) L 121.094 99/ 49 686 8.30 446.1 446.1 446.1 0.0 M 121.275 140/ 68 1,386 4.10 451.6 451.6 452.5 0.9 N 121.610 180/ 97 1,260 4.50 454.2 454.2 454.5 0.3 O 121.985 175/ 87 1,004 5.70 456.2 456.2 456.3 0.1 P 122.583 136/ 66 591 9.70 462.5 462.5 463.0 0.5 Q 122.915 169/ 81 1,148 5.00 468.1 468.1 468.2 0.1 R 124.027 275/ 137 2,463 2.20 470.1 470.1 470.3 0.2 ¹Miles above Newburyport Light, Newburyport, MA
2Width/ width within county boundary
TAB
LE 6
FEDERAL EMERGENCY MANAGEMENT AGENCY
MERRIMACK COUNTY, NH (ALL JURISDICTIONS)
FLOODWAY DATA
WINNIPESAUKEE RIVER
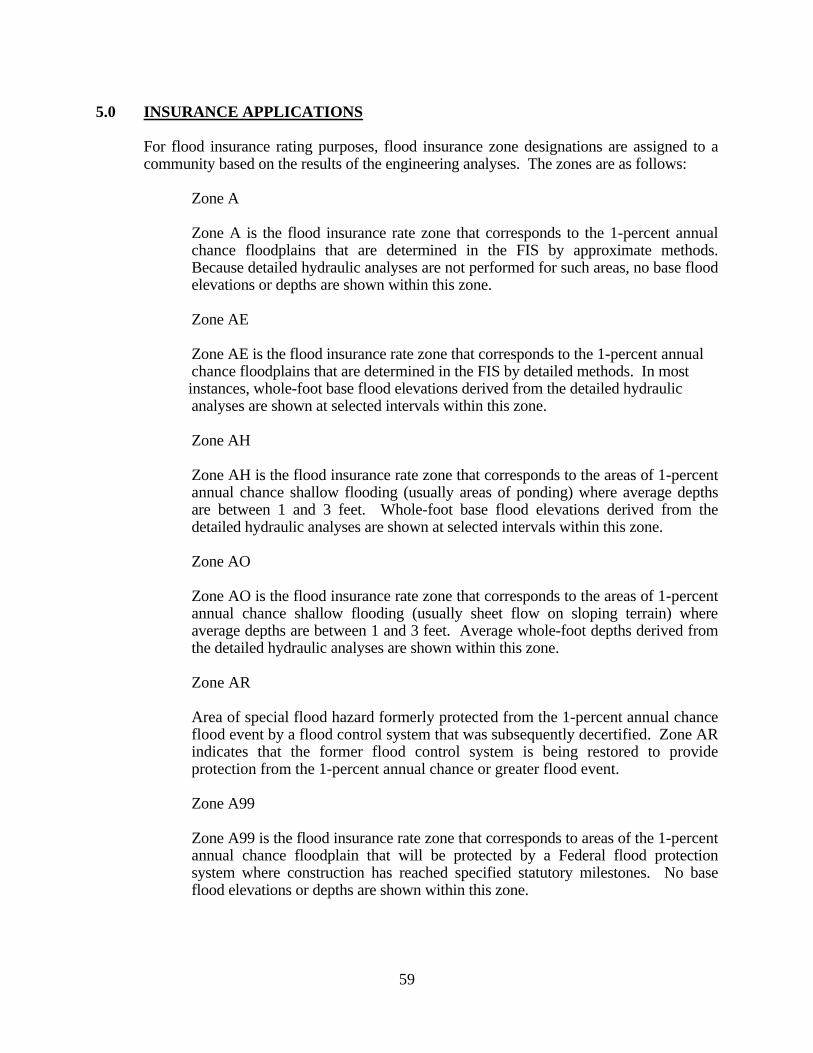
59
5.0 INSURANCE APPLICATIONS For flood insurance rating purposes, flood insurance zone designations are assigned to a
community based on the results of the engineering analyses. The zones are as follows: Zone A Zone A is the flood insurance rate zone that corresponds to the 1-percent annual
chance floodplains that are determined in the FIS by approximate methods. Because detailed hydraulic analyses are not performed for such areas, no base flood elevations or depths are shown within this zone.
Zone AE Zone AE is the flood insurance rate zone that corresponds to the 1-percent annual chance floodplains that are determined in the FIS by detailed methods. In most instances, whole-foot base flood elevations derived from the detailed hydraulic analyses are shown at selected intervals within this zone. Zone AH Zone AH is the flood insurance rate zone that corresponds to the areas of 1-percent
annual chance shallow flooding (usually areas of ponding) where average depths are between 1 and 3 feet. Whole-foot base flood elevations derived from the detailed hydraulic analyses are shown at selected intervals within this zone.
Zone AO Zone AO is the flood insurance rate zone that corresponds to the areas of 1-percent
annual chance shallow flooding (usually sheet flow on sloping terrain) where average depths are between 1 and 3 feet. Average whole-foot depths derived from the detailed hydraulic analyses are shown within this zone.
Zone AR
Area of special flood hazard formerly protected from the 1-percent annual chance flood event by a flood control system that was subsequently decertified. Zone AR indicates that the former flood control system is being restored to provide protection from the 1-percent annual chance or greater flood event.
Zone A99 Zone A99 is the flood insurance rate zone that corresponds to areas of the 1-percent
annual chance floodplain that will be protected by a Federal flood protection system where construction has reached specified statutory milestones. No base flood elevations or depths are shown within this zone.
60
Zone V Zone V is the flood insurance rate zone that corresponds to the 1-percent annual
chance coastal floodplains that have additional hazards associated with storm waves. Because approximate hydraulic analyses are performed for such areas, no base flood elevations are shown within this zone.
Zone VE Zone VE is the flood insurance rate zone that corresponds to the 1-percent annual
chance coastal floodplains that have additional hazards associated with storm waves. Whole-foot base flood elevations derived from the detailed hydraulic analyses are shown at selected intervals within this zone.
Zone X Zone X is the flood insurance rate zone that corresponds to areas outside the 0.2-
percent annual chance floodplain, areas within the 0.2-percent annual chance floodplain, and to areas of 1-percent annual chance flooding where average depths are less than 1 foot, areas of 1-percent annual chance flooding where the contributing drainage area is less than 1 square mile, and areas protected from the 1-percent annual chance flood by levees. No base flood elevations or depths are shown within this zone.
Zone D Zone D is the flood insurance rate zone that corresponds to unstudied areas where
flood hazards are undetermined, but possible. 6.0 FLOOD INSURANCE RATE MAP The FIRM is designed for flood insurance and floodplain management applications. For flood insurance applications, the map designates flood insurance rate zones as
described in Section 5.0 and, in the 1-percent annual chance floodplains that were studied by detailed methods, shows selected whole-foot base flood elevations or average depths. Insurance agents use the zones and base flood elevations in conjunction with information on structures and their contents to assign premium rates for flood insurance policies.
For floodplain management applications, the map shows by tints, screens, and symbols, the
1- and 0.2-percent annual chance floodplains. Floodways and the locations of selected cross sections used in the hydraulic analyses and floodway computations are shown where applicable.
The current FIRM presents flooding information for the entire geographic area of
Merrimack County. Previously, separate Flood Hazard Boundary Maps and/or FIRMs were prepared for each identified flood-prone incorporated community of the county. This countywide FIRM also includes flood hazard information that was presented separately on
61
Flood Boundary and Floodway Maps (FBFMs), where applicable. Historical data relating to the maps prepared for each community, up to and including this countywide FIS, are presented in Table 7, "Community Map History."
7.0 OTHER STUDIES FISs have been prepared for the Town of Allenstown (U.S. Department of Housing and
Urban Development, 1978); Town of Boscawen (U.S. Department of Housing and Urban Development, 1979); Town of Bow (FEMA, 2000); Town of Bradford (FEMA, 1992); Town of Canterbury (U.S. Department of Housing and Urban Development, 1978); Town of Chichester (U.S. Department of Housing and Urban Development, 1978); City of Concord (FEMA, 1999); Town of Epsom (U.S. Department of Housing and Urban Development, 1978); City of Franklin (U.S. Department of Housing and Urban Development, 1979); Town of Henniker (U.S. Department of Housing and Urban Development, 1977); Town of Hooksett (FEMA, 1982); Town of Hopkinton (FEMA, 1988); Town of New London (FEMA, 1991); Town of Northfield (U.S. Department of Housing and Urban Development, 1978); Town of Pembroke (U.S. Department of Housing and Urban Development, 1978); Town of Pittsfield (U.S. Department of Housing and Urban Development, 1978); Town of Warner (FEMA, 1987); Town of Webster (FEMA, 1993); Town of Hillsborough (U.S. Department of Housing and Urban Development, 1978); and Town of Sunapee (FEMA, 1991). The previously published FIS for the Town of Dunbarton was rescinded.
This FIS also supersedes the FBFM for the Town of Allenstown; Town of Boscawen;
Town of Canterbury; Town of Chichester; Town of Epsom; City of Franklin; Town of Henniker; Town of Hooksett; Town of Northfield; Town of Pembroke; and Town of Pittsfield which was published as part of the previously printed FIS. This study supersedes the FHBM for the Town of Loudon (U.S. Department of Housing and Urban Development, 1979).
Information pertaining to revised and unrevised flood hazards for each jurisdiction within
Merrimack County has been compiled into this FIS. Therefore, this FIS supersedes all previously printed FIS Reports, FHBMs, FBFMs, and FIRMs for the incorporated jurisdictions within Merrimack County.
8.0 LOCATION OF DATA Information concerning the pertinent data used in preparation of this FIS can be obtained
by contacting FEMA, Federal Insurance and Mitigation Division, 99 High Street, 6th Floor, Boston, Massachusetts 02110.
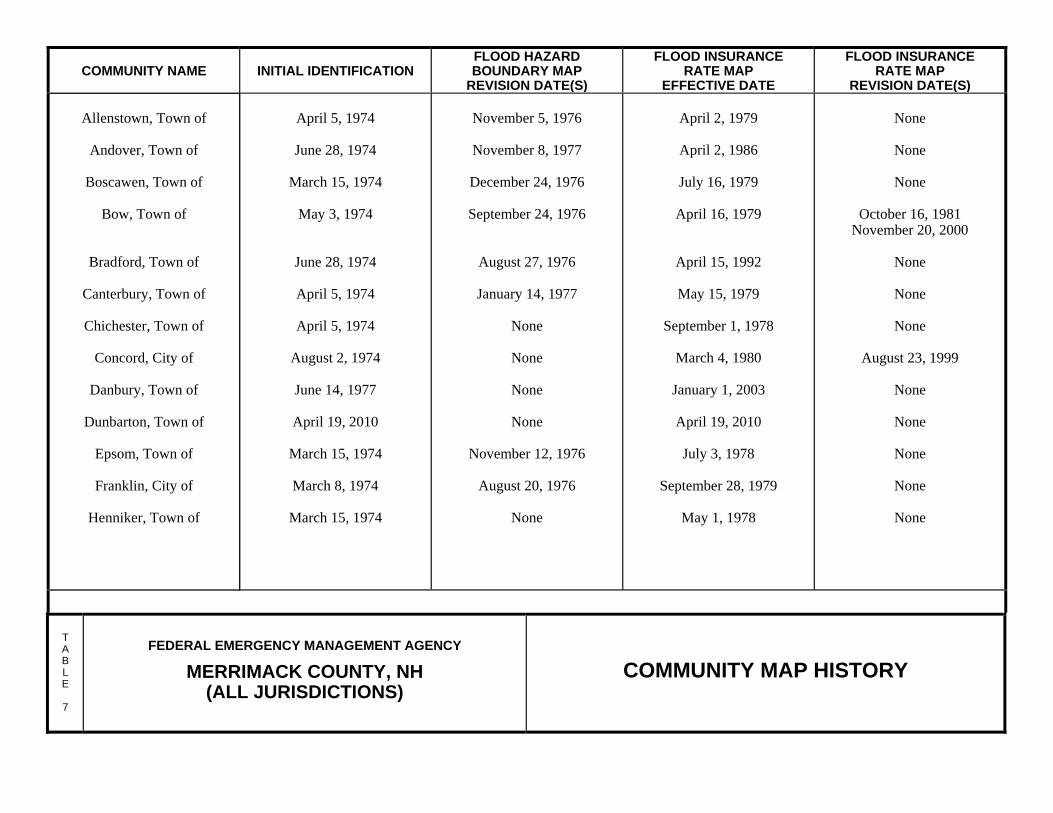
COMMUNITY NAME INITIAL IDENTIFICATION FLOOD HAZARD BOUNDARY MAP
REVISION DATE(S)
FLOOD INSURANCERATE MAP
EFFECTIVE DATE
FLOOD INSURANCERATE MAP
REVISION DATE(S)
Allenstown, Town of
Andover, Town of
Boscawen, Town of
Bow, Town of
Bradford, Town of
Canterbury, Town of
Chichester, Town of
Concord, City of
Danbury, Town of
Dunbarton, Town of
Epsom, Town of
Franklin, City of
Henniker, Town of
April 5, 1974
June 28, 1974
March 15, 1974
May 3, 1974
June 28, 1974
April 5, 1974
April 5, 1974
August 2, 1974
June 14, 1977
April 19, 2010
March 15, 1974
March 8, 1974
March 15, 1974
November 5, 1976
November 8, 1977
December 24, 1976
September 24, 1976
August 27, 1976
January 14, 1977
None
None
None
None
November 12, 1976
August 20, 1976
None
April 2, 1979
April 2, 1986
July 16, 1979
April 16, 1979
April 15, 1992
May 15, 1979
September 1, 1978
March 4, 1980
January 1, 2003
April 19, 2010
July 3, 1978
September 28, 1979
May 1, 1978
None
None
None
October 16, 1981 November 20, 2000
None
None
None
August 23, 1999
None
None
None
None
None
T A B L E
7
FEDERAL EMERGENCY MANAGEMENT AGENCY
MERRIMACK COUNTY, NH (ALL JURISDICTIONS)
COMMUNITY MAP HISTORY
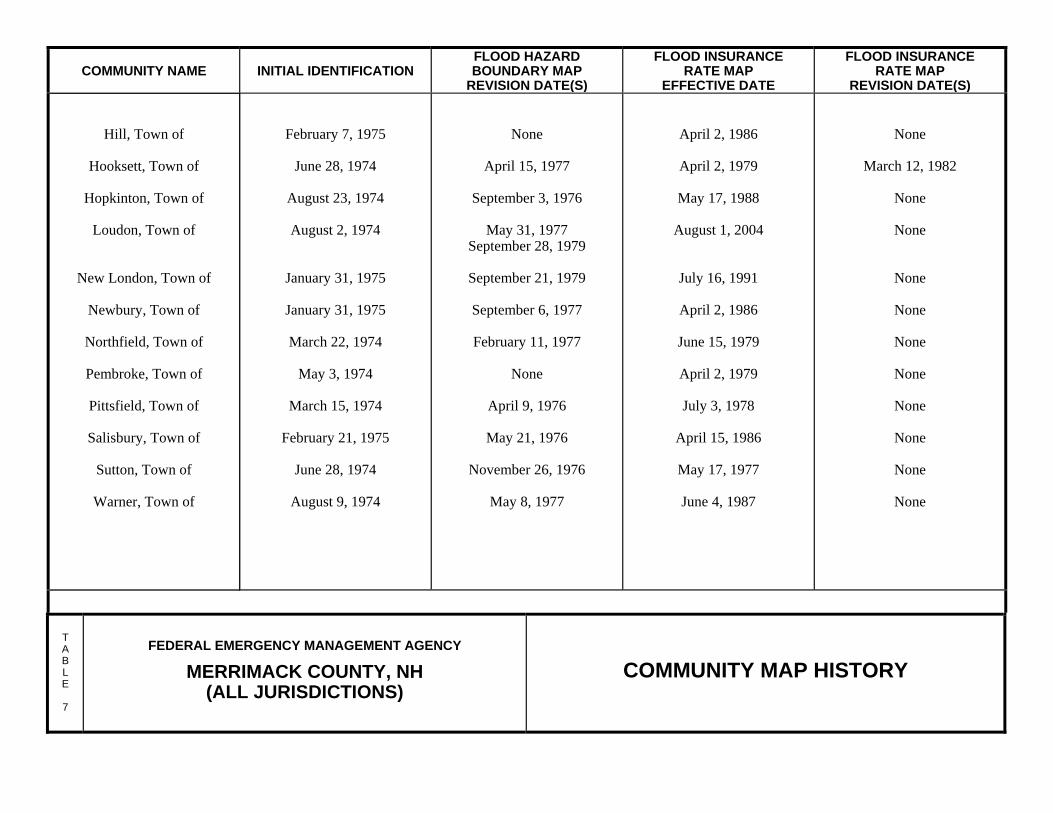
COMMUNITY NAME INITIAL IDENTIFICATION FLOOD HAZARD BOUNDARY MAP
REVISION DATE(S)
FLOOD INSURANCERATE MAP
EFFECTIVE DATE
FLOOD INSURANCERATE MAP
REVISION DATE(S)
Hill, Town of
Hooksett, Town of
Hopkinton, Town of
Loudon, Town of
New London, Town of
Newbury, Town of
Northfield, Town of
Pembroke, Town of
Pittsfield, Town of
Salisbury, Town of
Sutton, Town of
Warner, Town of
February 7, 1975
June 28, 1974
August 23, 1974
August 2, 1974
January 31, 1975
January 31, 1975
March 22, 1974
May 3, 1974
March 15, 1974
February 21, 1975
June 28, 1974
August 9, 1974
None
April 15, 1977
September 3, 1976
May 31, 1977
September 28, 1979
September 21, 1979
September 6, 1977
February 11, 1977
None
April 9, 1976
May 21, 1976
November 26, 1976
May 8, 1977
April 2, 1986
April 2, 1979
May 17, 1988
August 1, 2004
July 16, 1991
April 2, 1986
June 15, 1979
April 2, 1979
July 3, 1978
April 15, 1986
May 17, 1977
June 4, 1987
None
March 12, 1982
None
None
None
None
None
None
None
None
None
None
T A B L E
7
FEDERAL EMERGENCY MANAGEMENT AGENCY
MERRIMACK COUNTY, NH (ALL JURISDICTIONS)
COMMUNITY MAP HISTORY
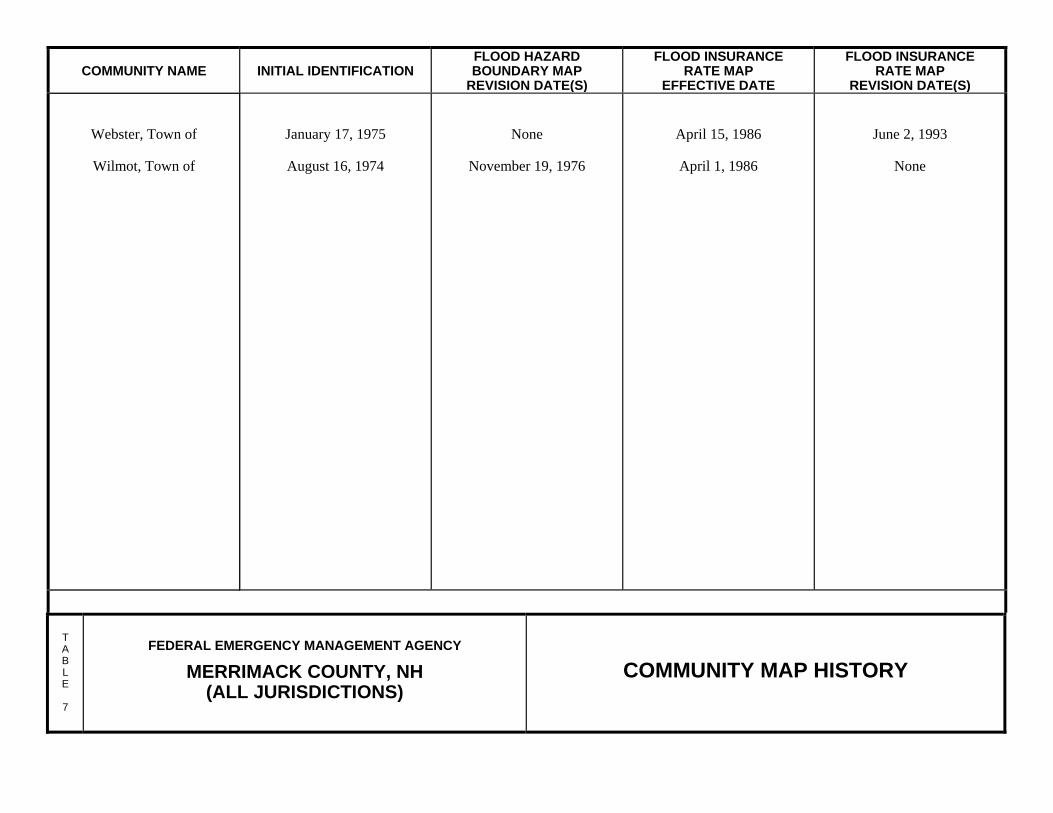
COMMUNITY NAME INITIAL IDENTIFICATION FLOOD HAZARD BOUNDARY MAP
REVISION DATE(S)
FLOOD INSURANCERATE MAP
EFFECTIVE DATE
FLOOD INSURANCERATE MAP
REVISION DATE(S)
Webster, Town of
Wilmot, Town of
January 17, 1975
August 16, 1974
None
November 19, 1976
April 15, 1986
April 1, 1986
June 2, 1993
None
T A B L E
7
FEDERAL EMERGENCY MANAGEMENT AGENCY
MERRIMACK COUNTY, NH (ALL JURISDICTIONS)
COMMUNITY MAP HISTORY
9.0 BIBLIOGRAPHY AND REFERENCES
Concord, New Hampshire, Department of Public Works. (Concord, Penacook, 1966, 1967, 1968, 1970). Topographic Maps, Scale 1"=100', Contour Interval 2 feet. Edwards and Kelcey, Inc. (1964). “Boscawen, New Hampshire General Plan Report.” Federal Emergency Management Agency. (August 23, 1999). Flood Insurance Study, City of Concord, Merrimack County, New Hampshire. Washington, D.C. Federal Emergency Management Agency. (June 2, 1993). Flood Insurance Study, Town of Webster, Merrimack County, New Hampshire. Washington, D.C. Federal Emergency Management Agency. (May 15, 1991). Flood Insurance Study, Town of Sunapee, Sullivan County, New Hampshire. Washington, D.C. Federal Emergency Management Agency. (May 17, 1988). Flood Insurance Study, Town of Hopkinton, Merrimack County, New Hampshire. Washington, D.C. Federal Emergency Management Agency. (June 4, 1987). Flood Insurance Study, Town of Warner, Merrimack County, New Hampshire. Washington, D.C. Federal Emergency Management Agency. (April 15, 1986). Flood Insurance Study, Town of Webster, Merrimack County, New Hampshire. Washington, D.C. Federal Emergency Management Agency. (April 2, 1986). Flood Insurance Study, Town of Newbury, Merrimack County, New Hampshire. Washington, D.C. Federal Emergency Management Agency. (March 12, 1982). Flood Insurance Study, Town of Hooksett, Merrimack County, New Hampshire. Washington, D.C. Federal Emergency Management Agency, Federal Insurance Administration. (October 16, 1981, Flood Insurance Rate Map; October 1978, Flood Insurance Study report). Flood Insurance Study, Town of Bow, Merrimack County, New Hampshire. Washington, D.C. Federal Emergency Management Agency. (March 4, 1980). Flood Insurance Study, City of Concord, Merrimack County, New Hampshire. Washington, D.C. Federal Emergency Management Agency, Federal Insurance Administration. (July 16, 1979, Flood Insurance Rate Map; January 1979, Flood Insurance Study report). Flood Insurance Study, Town of Boscawen, Merrimack County, New Hampshire. Washington, D.C. Federal Emergency Management Agency, Federal Insurance Administration. (June 15, 1979). Flood Insurance Study, Town of Hillsborough, Hillsborough County, New Hampshire. Washington, D.C.
65
Federal Emergency Management Agency, Federal Insurance Administration. (June 15, 1979). Flood Insurance Study, Hillsborough County, New Hampshire (Unincorporated Areas). Washington, D.C. Federal Emergency Management Agency, Federal Insurance Administration. (May 15, 1979). Flood Insurance Study, Town of Canterbury, Merrimack County, New Hampshire. Washington, D.C. Federal Emergency Management Agency, Federal Insurance Administration. (April 2, 1979, Flood Insurance Rate Map; October 1978, Flood Insurance Study report). Flood Insurance Study, Town of Pembroke, Merrimack County, New Hampshire. Washington, D.C. Federal Emergency Management Agency, Federal Insurance Administration. (April 2, 1979, Flood Insurance Rate Map; October 1978, Flood Insurance Study report). Flood Insurance Study, Town of Allenstown, Merrimack County, New Hampshire. Washington, D.C. Geod Aerial Mapping, Inc. (March 1977). Topographic Maps, Scale 1:4,800, Contour Interval 5 feet. Geod Aerial Mapping, Inc. (February 1977). 1" = 400', 5-foot contour interval maps. Haynes Engineering Consultants, Inc. (October 5, 1976). “Flood Hazard Investigation,” for Riverside Millwork Company, Inc. Johnson, Don, and Cross, W. P. (authors). (1949). Elements of Applied Hydrology. Ronald Press Company. New York. Liu Aerial Surveys. (Date of photography November 1996, date of mapping December 1996). Digital Topographic Map of the Merrimack River Floodplain, Contour Interval 2 feet (NGVD 1929). New Hampshire Department of Environmental Services. (February 1990). Construction Drawings for Sewall’s Falls Dam, Public Access Improvements. New Hampshire Department of Fish and Game Department. (June 1997). Field Survey Notes for Sewalls Falls Dam Concrete Wall. New Hampshire Department of Public Works & Highways. (1976). Manual on Drainage Design for Highways. New Hampshire Department of Resources and Economic Development. (U.S. Geological Survey Microline Enlargement, February 1972). Topographic Maps, Scale 1:12,000, Contour Interval 20 feet. New Hampshire Department of Transportation, Construction Drawings for the Bridge Structures Within the Study Reach
66
Public Service Company of New Hampshire. Garvins Falls Hydro Electric Project, General Design Drawing. Quinn Associates, Inc., of Horsham, Pennsylvania. (Hopkinton, New Hampshire, 1985; Town of Warner, New Hampshire, 1985). Topographic Maps, compiled from aerial photographs, Scale 1:4,800, Contour Interval 4 feet. State of New Hampshire Department of Public Works and Highways. (Hooksett, New Hampshire, April 1967). Topographic Maps, Scale 1:2,400, Contour Interval 5 feet. Thos. F. Moran, Inc. (January 1977 and September 1976). “Field Survey Notes for Contoocook and Merrimack Rivers.” U.S. Army Corps of Engineers, New England Division. (June 7, 1985). “Blackwater and Hopkinton Dam Discharges.” Richard L. Reardon, Chief, Engineering Division (author). U.S. Army Corps of Engineers, New England Division. (1953, revised August 1977). Merrimack River Basin Master Water Control Manual. Waltham, Massachusetts. U.S. Army Corps of Engineers, New England Division. (August 1976). Flood Plain Information, Merrimack and Piscataquog Rivers, Manchester, New Hampshire. U.S. Army Corps of Engineers. (March 3, 1976). Letter from John Wm. Leslie, Chief, Engineering Division, to Michael Baker, Jr., Inc., Harrisburg, Pennsylvania, concerning the 1-percent annual chance flood elevations at the Army Corps of Engineers Reservoirs. Waltham, Massachusetts. U.S. Army Corps of Engineers, New England Division. (July 23, 1975). “Letter from John Wm. Leslie, Chief, Engineering Division to State of New Hampshire, Department of Public Works and Highways concerning Contoocook River Discharges.” U.S. Army Corps of Engineers, New England Division. (March 10, 1975). “Letter from John Wm. Leslie, Chief, Engineering Division to J&S Leasing Co., Penacook, New Hampshire concerning Contoocook River discharges.” U.S. Army Corps of Engineers. (October 1974). Flood Plain Information Report, Contoocook River and Beards Brook, Henniker and Hillsborough, New Hampshire. U.S. Army Corps of Engineers. (October 1973). Flood Plain Information Report. Litchfield, New Hampshire. U.S. Army Corps of Engineers, Hydrologic Engineering Center. (October 1973). HEC-2 Water-Surface Profiles, Generalized Computer Program. Davis, California. U.S. Army Corps of Engineers, New England Division. (August 1972). Flood Plain Information, Merrimack River, City of Concord, New Hampshire.
67
U.S. Army Corps of Engineers, New England Division. (August 1972). Water Resources Investigation Merrimack River Basin – New Hampshire and Massachusetts. Appendices. U.S. Army Corps of Engineers, New England Division. (June 1953). Merrimack River Flood Control, Master Regulation Manual. U.S. Department of Agriculture. (October 1968). Research Report No. 3, New Hampshire Soils and Their Interpretations for Various Uses, prepared by New Hampshire Agriculture Experiment Station at Durham, New Hampshire. U.S. Department of Agriculture, Soil Conservation Service. (1965). Merrimack County Soil Survey. U.S. Department of Agriculture, Soil Conservation Service. (June 1965). Soil Survey, Merrimack County, New Hampshire, Series 1961, No. 22. Washington, D.C. U.S. Department of Agriculture, Soil Conservation Service. (1965). Technical Release No. 20, Computer Program, Project Formulation, Hydrology. Washington, D.C. U.S. Department of Commerce, National Oceanic and Atmospheric Administration. (1975). Local Climatological Data, Annual Summary with Comparative Data. Concord, New Hampshire. U.S. Department of Commerce, Environmental Science Services Administration. (June 1968). Climate Atlas of the U.S. U.S. Department of Housing and Urban Development, Federal Insurance Administration. (September 24, 1979). Flood Hazard Boundary Map, Town of Bow, Merrimack County, New Hampshire. Washington, D.C. U.S. Department of Housing and Urban Development, Federal Insurance Administration. (September 21, 1979). Flood Hazard Boundary Map, Town of New London, Merrimack County, New Hampshire. U.S. Department of Housing and Urban Development, Federal Insurance Administration. (May 1, 1978). Flood Insurance Study, Town of Henniker, Merrimack County, New Hampshire. Washington, D.C. U.S. Department of Housing and Urban Development, Federal Insurance Administration. (October 1977). Flood Insurance Study, Town of Franklin, New Hampshire. U.S. Department of Housing and Urban Development, Federal Insurance Administration. (October 1977). Flood Insurance Study, Town of Boscawen, New Hampshire. U.S. Department of Housing and Urban Development, Federal Insurance Administration. (September 1977). Flood Insurance Study, Town of Concord, Merrimack County, New Hampshire.
68
U.S. Department of Housing and Urban Development, Federal Insurance Administration. (June 1977). Flood Insurance Study, Epsom, New Hampshire. U.S. Department of Housing and Urban Development, Federal Insurance Administration. (April 8, 1977). Flood Hazard Boundary Map, Town of Warner, New Hampshire. U.S. Department of Housing and Urban Development, Federal Insurance Administration. (March 17, 1977). Flood Insurance Study, Town of Sutton, Merrimack County, New Hampshire. Washington, D.C. U.S. Department of Housing and Urban Development, Federal Insurance Administration. (March 1974, Revised February 1977). Flood Hazard Boundary Map. U.S. Department of Housing and Urban Development, Federal Insurance Administration. (September 3, 1976). Flood Hazard Boundary Map, Town of Hopkinton, Merrimack County, New Hampshire. U.S. Department of Housing and Urban Development, Federal Insurance Administration. (August 27, 1976). Flood Hazard Boundary Map, Town of Bradford, Merrimack County, New Hampshire. U.S. Department of Housing and Urban Development, Federal Insurance Administration. (Unpublished). Flood Insurance Study, Town of Boscawen, Merrimack County, New Hampshire. U.S. Department of the Interior, Geological Survey. (Bradford, New Hampshire, 1987, provisional; Henniker, New Hampshire, 1987, provisional; Hillsborough Upper Village, New Hampshire, 1987, provisional; and Warner, New Hampshire, 1987, provisional, Scale 1:24,000, Contour Interval 20 feet; Lovewell Mountain, New Hampshire, 1984, provisional; and Newport, New Hampshire, 1984, provisional, Scale 1:25,000, Contour Interval 6 meters). 7.5-Minute Series Topographic Maps,. U.S. Department of the Interior, Geological Survey, Office of Water Data Collection, Interagency Advisory Committee on Water Data. (Revised September 1981). “Guidelines for Determining Flood Flow Frequency,” Bulletin 17B. Reston, Virginia. U.S. Department of the Interior, Geological Survey. (January 3, 1977). Log-Pearson Type III Flood Frequency Analysis Following WRC Guidelines. Soucook River near Concord, New Hampshire. Station 01089000. U.S. Department of the Interior, Geological Survey. (1976). Water Resources Data for New Hampshire and Vermont Water Year 1975. Washington, D.C. U.S. Department of the Interior, Geological Survey. (1976). Open-File Report 76-499, Computer Applications for Step-Backwater and Floodway Analyses. James O. Shearman (author). Washington, D.C.
69

U.S. Department of the Interior, Geological Survey. (1975). Open-File Report 75-292, A Technique for Estimating the Magnitude and Frequency of Floods in Maine. Augusta, Maine. U.S. Department of the Interior, Bureau of Reclamation. (1974). Design of Small Dams. U.S. Government Printing Office. Washington, D.C. U.S. Department of the Interior, Geological Survey. (1967). Techniques of Water-Resources Investigations, Book 3, Chapter A5, Measurement of Peak Discharge at Dams by Indirect Methods. Washington, D.C. U.S. Department of the Interior, Geological Survey. (Concord, New Hampshire, 1967; Goffstown, New Hampshire, 1969; Hopkinton, New Hampshire, 1967; Manchester North, New Hampshire, 1968; Suncook, New Hampshire, 1967). 7.5-Minute Series Topographic Maps, Scale 1:24,000, Contour Interval 10 feet. U.S. Department of the Interior, Geological Survey. (1962). Water Supply Paper 1580-B, “Factors Influencing the Occurrence of Floods in a Humid Region of Diverse Terrain.” Manual A. Benson (author). U.S. Department of the Interior, Geological Survey. (Concord, New Hampshire, 1949; Hillsboro, New Hampshire, 1957; Mt. Kearsarge, New Hampshire, 1956; Penacook, New Hampshire, 1956). 15-Minute Series Topographic Maps, Scale 1:62,500, Contour Interval 20 feet. U.S. Department of the Interior, Geological Survey. (May 1936-1987). Water-Supply Papers, Surface Water Supply of the United States. Washington, D.C. U.S. Department of the Interior, Geological Survey. (Published annually). Water Resources Data for New Hampshire and Vermont. Bow, New Hampshire. U.S. Federal Highway Administration. (1986). Report FHWA/RD-86/109, Bridge Waterways Analysis Model/Research Report. J. S. Shearman, W. H. Kirby, V. R. Schneider, and H. N. Flippo, Jr. (authors). Washington, D.C. U.S. Geological Survey. (1974). Water Resources Data for Massachusetts, New Hampshire, Rhode Island, and Vermont. U.S. Geological Survey. (Manchester North, New Hampshire, 1968; Suncook, New Hampshire, 1967). 7.5-Minute Series Topographic Maps, Scale 1:24,000, Contour Interval 10 feet. U.S. Geological Survey. (1962). Water-Supply Paper 1580-B, Factors Influencing the Occurrence of Floods in a Humid Region of Diverse Terrain. Manuel A. Benson (author). U.S. Geological Survey. (Suncook, New Hampshire, 1957; Gilmanton, New Hampshire, 1957). 15-Minute Series Topographic Maps, Scale 1:62,500, Contour Interval 20 feet.
70
71
U.S. Geological Survey. (Penacook, New Hampshire, 1956). 15-Minute Topographic Maps, Scale 1:62,500, Contour Interval 20 feet. U.S. Geological Survey. (1940). Water Supply Paper No. 867, Hurricane Floods of September 1938. U.S. Geological Survey. (1937). Water Supply Paper No. 798, The Floods of March 1936. U.S. Water Resources Council. (March 1976). Guidelines for Determining Flood Flow Frequency, Bulletin 17A. Warren J. Viessman, Terence E. Harbaugh, and John W. Knapp (authors). (1972). Introduction to Hydrology.