Voltage Stability - US Department of Energy · Project Objective • Synchrophasor‐based voltage...
13
Voltage Stability Scott Ghiocel and Joe Chow Rensselaer Polytechnic Institute [email protected], [email protected] June 3‐4, 2013 Washington, DC DOE/OE Transmission Reliability Program
Transcript of Voltage Stability - US Department of Energy · Project Objective • Synchrophasor‐based voltage...

Voltage Stability
Scott Ghiocel and Joe ChowRensselaer Polytechnic Institute
[email protected], [email protected] June 3‐4, 2013Washington, DC
DOE/OE Transmission Reliability Program
Project Objective
• Synchrophasor‐based voltage stability (VS) analysis• Real‐time monitoring of VS margins considering:
– Actual system conditions (adjusting the model using online measurements)
– Complex power transfer paths (instead of radial)– Contingencies– Computational efficiency
• Project Status – near completion– Started January 2013– Scheduled completion by end of July 2014

New Idea: The AQ‐Bus Type• Eliminates the Jacobian singularity at the maximum power transfer point• Specify the voltage angle for the load bus (remove 1 unknown)• Remove load P equation (load power not enforced)
• No load parameter required• This reduced Jacobian matrix is nonsingular at the maximum loading
point [1]
Specified bus angle
Removed P equation
Reduced Jacobian
[1] Ghiocel, S.G.; Chow, J.H., "A Power Flow Method Using a New Bus Type for Computing Steady-State Voltage Stability Margins," IEEE Transactions on Power Systems, vol.29, no.2, pp.958-965, March 2014

Features of the AQ‐Bus Method• Includes all features of conventional power flow:
– Tap‐changing transformers– Shunt compensation– Reactive power limits
• Compute VS margins by adjusting the AQ bus voltage angle relative to the swing (AV) bus indirectly increases power transfer
• Accommodates multiple loads and generators• Useful for fast contingency‐based voltage stability analysis• Can be generalized to large power systems:
Bus types Bus representation Fixed values
PV Generator buses Fixed active power generation and bus voltage
PQ Load buses Fixed active and reactive power consumption
AV Swing bus (generator) Fixed angle (A) and voltage magnitude
AQ Load bus Fixed voltage angle and reactive power consumption

Hybrid VSA Example: Central NY
• Phasor data from 6 PMUs provided by New York Power Authority (NYPA)
• 13‐bus observable subnetwork• Pseudo‐PMU data calculated on
the non‐PMU buses using a phasor‐only state estimator (PSE)
• Power flows from West and North towards NYC
• Critical power transfer interfaces • Weaker ties to ISO‐New England
and other neighboring control areas Oakdale
OswegoComplex
Clay
Marcy 765
Edic
Massena
Chateauguay
NewScotland
Gilboa
Alps
Leeds
Fraser
RockTavern
Roseton E. Fishkill
PleasantValley
Marcy 345
Moses
(with synchrophasors shown)NYS TRANSMISSION SYSTEM
PMU Location
Scott Ghiocel – Rensselaer Polytechnic Institute
345 kV
765 kV Est. Location
Unmeasured Current
230 kV
CSCVolney
CoopersCorners
Marcy SouthInterface
Central EastInterface
Total EastInterface
New EnglandInterface

• Calculated PV curves based on actual system conditions• Measurement‐adjusted
model• Includes SVC equipment
limits• Multiple generation
sources based oninformation from PMU data
Computed PV Curves for NY System

Credit: E. Heredia, D. Kosterev, M. Donnelly, “Wind Hub Reactive Resource Coordination and Voltage Control Study by Sequence Power Flow, 2013 IEEE PES General Meeting, July 2013.
Unobservable
Measurements
G
GThévenin equiv.
(swing bus)
PQ PQ PV PQ PQ PV
Edge of the observable
networkAQ bus (negative load)
BPA Wind Hub Diagram

• 600 MW wind interconnection • Huge voltage variations• Weak system (line outage)• Wind plant curtailment• Shunt capacitor issues
0 1000 2000 3000 4000 5000 6000 7000 8000 9000
1.2
1.4
1.6
1.8
2
2.2
P (p
.u.)
Wind Farm Response (at point of connection)
0 1000 2000 3000 4000 5000 6000 7000 8000 9000
-0.25
-0.2
-0.15
-0.1
-0.05
0
0.05
Q (p
.u.)
0 1000 2000 3000 4000 5000 6000 7000 8000 90000.94
0.96
0.98
1
1.02
1.04
1.06
Time (s)
V (p
.u.)
P
V
Q
~14%variation
Time (s)
Wind plantcurtailment
0 100 200 300 400 500 600
0
0.1
0.2
0.3
0.4
0.5
0.6
0.7
0.8
0.9
1
Time (min)
Pow
er (p
.u.)
WP 1WP 2WP 3WP 4WP 5WP 6
Voltage Issues at a BPA Wind Hub
Wind turbine output over 10 hrs
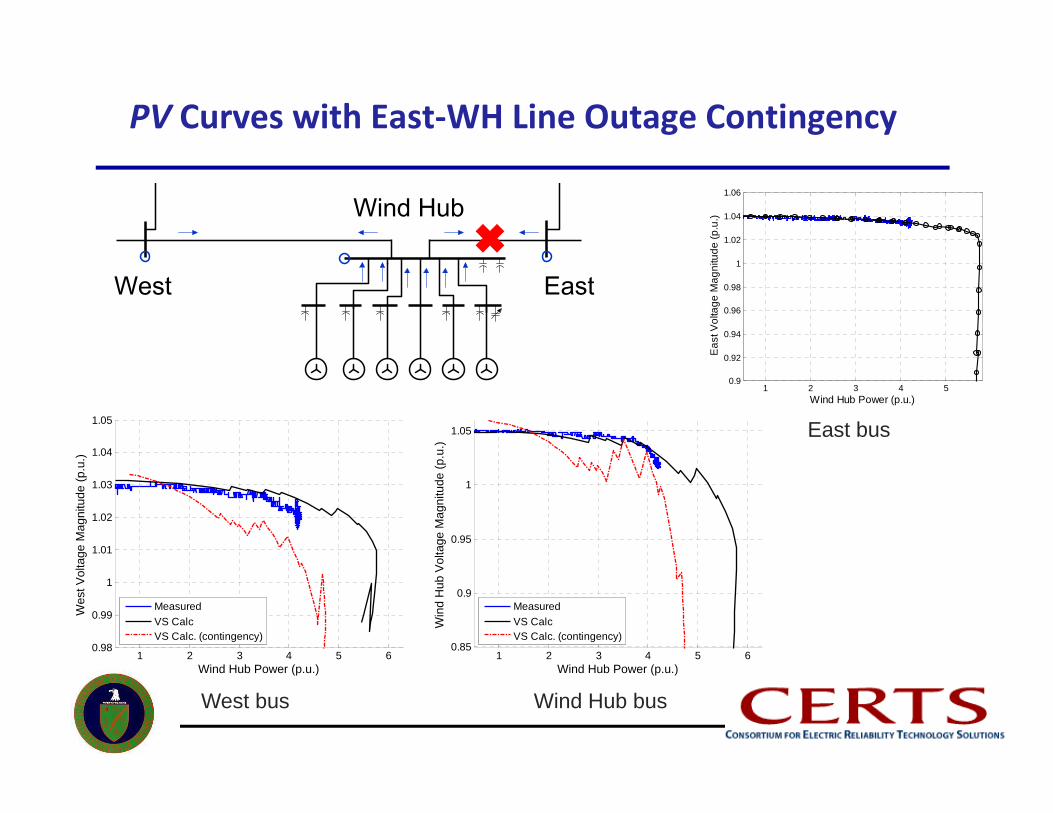
PV Curves with East‐WH Line Outage Contingency
1 2 3 4 5 60.85
0.9
0.95
1
1.05
Wind Hub Power (p.u.)
Win
d H
ub V
olta
ge M
agni
tude
(p.u
.)
MeasuredVS CalcVS Calc. (contingency)
1 2 3 4 5 60.98
0.99
1
1.01
1.02
1.03
1.04
1.05
Wind Hub Power (p.u.)
Wes
t Vol
tage
Mag
nitu
de (p
.u.)
MeasuredVS CalcVS Calc. (contingency)
1 2 3 4 50.9
0.92
0.94
0.96
0.98
1
1.02
1.04
1.06
Wind Hub Power (p.u.)
Eas
t Vol
tage
Mag
nitu
de (p
.u.)
West bus Wind Hub bus
East bus

• Local voltage issues on 230 kV system
• Some stiff buses (Big Creek generators) and weak buses (particularly Bus 11)
• Reactive power support and series compensation on high‐voltage lines
• Some wind generation around Bus 17
• PMU data – one data point per minute
Ongoing Analysis: Southern California

Accomplishments• Development of AQ‐bus method for VS analysis:
– Publications• S.G. Ghiocel, J.H. Chow, “A Power Flow Method Using a New Bus Type for Computing
Steady‐State Voltage Stability Margins,” IEEE Transactions on Power Systems, vol.29, no.2, pp.958‐965, March 2014
• S.G. Ghiocel, J.H. Chow, R. Quint, D. Kosterev, D.J. Sobajic, “Computing measurement‐based voltage stability margins for a wind power hub using the AQ‐bus method,” Power and Energy Conference at Illinois (PECI), March 2014
• S.G. Ghiocel, J.H. Chow, G. Stefopoulos, B. Fardanesh, D. Maragal, D.B. Bertagnolli, M. Swider, M. Razanousky, D.J. Sobajic, “Phasor‐measurement‐based Voltage Stability Margin Calculation for a Power Transfer Interface with Multiple Injections and Transfer Paths,” Power Systems Computation Conference, August 2014 (accepted)
– Patent application filed (May 2014)• Interest from a commercial software vendor
• Measurement‐based VS analysis development and demonstration:– Central NY power transfer interfaces– BPA wind hub

Project Status
• Deliverables for FY14:– Application installation and testing at BPA
• Installation – June 2014• Testing – June‐July 2014• Report – July 2014
– SCE voltage stability analysis report – June 2014– Final report – July 2014– Demonstrate the online application at NASPI VSA Workshop
(tentative) – October 2014
• Risk Factors:– Data availability– Data accuracy

Follow‐on Work• New PMU data
– Increased BPA PMU availability for wide‐area VS assessment– New wind and solar plant PMU data from Southern California– Wind turbine PMU data from NY North Country from NYPA
• Multiple voltage collapse scenarios and cascading failures– Considering multiple load areas– Sensitivity of the maximum loadability to outages, wind turbine type, etc.
• Extend to system‐wide voltage stability analysis– Implementation in commercial power system software – Implementation in EMS for real‐time contingency analysis
• Moving from stability assessment to decision support– Evaluating and recommending preventative/remedial actions using
online PMU data