
Voltage Stability Considerations in Composite Power System Reliability Evaluation
6
IEEE Transactions on Power Systems, Vol. 13, No . 2 , May 1998 VOLTAGE STABILITY CONSIDERATIONS IN COMPO SITE POWER SYSTEM RELIABILITY EVALUATION Roy Billinton, Fellow, IEEE Saleh Aboreshaid, Student Member, IEEE Power Systems Research Group University of Saskatchewan Saskatoon, Canada 655 Abstract - This paper presents an approach which includes voltage st ability considerations in the adequacy assessm ent of a composite power system. A fast technique for the probabilisti c assessment of voltage stability is presented which can be used in conjunction with detailed contingency evaluation in a composite system adequacy assessment. Voltage stabilit y is quantified using an indicator that can be easily included in the framework of an existing composite power system adequacy program. The effect on the adequacy indices (load point and system indices) of incorporating voltage stability con straints is illustrated b y application t o the IEE E-Reliability Test S ystem. I. INTRODUCTION Voltage stability has been defined by the System Dynamic Performance Subcommittee of the IEEE Power Engineering Committee as being the ability of a system to main tain voltage so that when load admittance is increased, load power will increase, and both power and voltage are controllable [ 11. voltage collapse may be caused by a variety of single or multiple contingencies such as a sudden removal of real or reactive power generation or a transmission element (a transf ormer or a transmission line), an increase of load w ithout an adequate increase of react ive power. The voltage stability of a power system is greatly dependen t upon the amount, location and type of reactive power sources available in the system. If the reactive power support is insufficient in quantity or physically far away then a relatively normal contingency such as a line outage or a sudden increase in load can trigger a large system voltage drop. Voltage stability is a serious problem that power utilities usually explore in the planning stage. It is essential that techniques to protect a pow er system fiom a voltage collapse be investi gated, taking into account all contingencies hat cause the system to lose voltage stabilit y. Significant progress has been made in the last decade in the development of methods to analyze and evaluate power system voltage stability [ 1-12]. There is no consensus on whether the voltage collapse PE-051-PWRS-2-06-1997 A paper recommended and approved by th e IEEE Power System Planning and Implementation Committee of the IEEE Power Engineering Society for publication in the IEEE Transactions on Power Systems. Manuscript submitted January 31, 1997; made available for printing June 9, 1997. mechanism is a steady-state [2-51 or dynamic [6-81 phenomena and therefore whether it should be analyzed by the relevant methods. This is perhaps due to the fact that voltage instability is a dynamic phenomena that possibly lends itself nicely to static analytical approaches. Most of the computational tools de velop ed so far are based on determinis tic criteria, i.e., on the analysis of a predetermined set of severe but credible situations. Deterministic techniques usually result in effective designs, as they are based on engineering experience and on the analysts knowledge of the system. The essential wea kness of such techn iques is that they do not and cannot account for the probabilistic or stochastic nature of system behavior, of customer demands or of compo nent failures. In recent years, voltage collapse has been considered r ecognizing he uncertainty associated wth practical system operation [9-121. Adequacy evaluation of a composite generation and transmission s ystem in a complete sense involves the simulation and load flow ana lysis of each possible outage condition in the system in order to determine the inability to supply load, voltage violations, line generator overloads, violations of generator War, etc. and to quantitatively express the deficiencies, f any, in terms of reliability indices. Reference 13 presents an approach to calcula te voltage collapse related bulk reliabili ty indices as well as their impact on composite power system adequacy indices based on restoring system solvability by load shedding. This paper presents a fast technique to incorporate voltage stability considerations in the adequacy assessment of a composite power system. The voltage stability indicators developed in [3] are calculated for all possible system contingencies. A bisection algorithm is then used to determine the amount of load which m ust be shed to alleviate all voltage stability violations. The impact of considering voltage stability constraints on the adequacy indices is illustrated by application to the IEEE-RTS [ 141. The proposed technique can be easily included in an existing composite power system adequacy program to monitor the effect on the adequacy indices of incorporating voltage stability constraints. 11. VOLTAGE STABILITY CONSIDERATIONS IN COMPOSI TE POWER SYSTEM RE LWIL ITY E VALUATION There are two fundamental approaches to composite power system adequacy evaluation: analytical enumeration and Monte Carlo simulat ion. There is a wide ran e of co mputer programs 0885-8950/98/$10.00 0 1997 IEEE
-
Upload
dragos-bizu -
Category
Documents
-
view
226 -
download
0
Transcript of Voltage Stability Considerations in Composite Power System Reliability Evaluation

7/28/2019 Voltage Stability Considerations in Composite Power System Reliability Evaluation
http://slidepdf.com/reader/full/voltage-stability-considerations-in-composite-power-system-reliability-evaluation 1/6
IEEE Transactions on Power Systems, Vol. 13,No. 2, May 1998
VOLTAG E STAB ILITY CONSIDERATIONS IN
COMPO SITE POWER SYSTEM RELIABILITY EVALUATION
Roy B illinton, Fellow, IEEE Saleh Aboreshaid, Student Member, IEEE
Power Systems Research GroupUniversity of Saskatchewan
Saskatoon, Canada
655
Abstract -This paper presents an approach wh ich includesvoltage stability considerations in the a dequ acy assessm ent
of a composite power system. A fast technique for the
probabilistic assessment of voltage stability is presented
which can be u sed in conjunction with detailed contingency
evaluation in a composite system adequacy assessment.
Voltage stability is quantified using an indicator that can be
easily included in the framew ork of an existing composite
power system adequacy program. The effect on the
adequacy indices (load point and system indices) of
incorporating voltage stability con straints is illustrated b y
application to the IEE E-Reliability Test S ystem.
I. INTRODUCTION
Voltage stability has been defined by the System DynamicPerformance Subcommittee of the IEEE Power EngineeringCommitteeasbeing the ability of a system to main tain voltageso that when load admittance is increased, load power willincrease, and both power and voltage are controllable [11. Avoltage collapse may be caused by a variety of single ormultiple contingencies such as a sudden removal of real orreactive power generation or a transmission element (a
transformer or a transmission line), an increase of load w ithout
an adequate increase of reactive power. The voltage stability ofa power system is greatly dependen t upon the amount, loca tionand type of reactive power sources available in the system. Ifthe reactive power support is insufficient in quantity orphysically far away then a rela tively normal contingency suchas a line outage or a sudden increase in load can trigger a largesystem voltage drop.
Voltage stability is a serious problem that power utilitiesusually explore in the planning stage. It is essential that
techniques to protect a pow er system fiom a voltage collapse be
investigated, taking into account all contingencies hat cause thesystem to lose voltage stability. Significant progress has beenmade in the last decade in the development of methods toanalyze and evaluate power system voltage stability [1-12].There is no consensus on whether the voltage collapse
PE-051-PWRS-2-06-1997 A paper recommended and approved bythe IEEE Power System Planning and Implementation Committee ofthe IEEE Power Engineering Society for publication in the IEEE
Transactions on Power Systems. Manuscript submitted January 31,1997; mad e available fo r printing June 9, 1997.
mechanism is a steady-state [2-51 or dynamic [6-81 phenomenaand therefore whether it should be analyzed by the relevant
methods. This is perhaps due to the fact that voltage instabilityis a dynamic phenomena that possibly lends itself nicely tostatic analytical approaches.
Most of the computational tools de velop ed so far are based ondeterministic criteria, i.e., on the analysis of a predetermined setof severe but credible situations. Deterministic techniquesusually result in effective designs, as they are based onengineering experience and on the analysts knowledge of thesystem. The essential wea kness of such techn iques is that they
do not and cannot account for the probabilistic or stochastic
nature of system behavior, of customer demands or ofcompo nent failures. In recent years, voltage collapse has beenconsidered recognizing he uncertainty associatedwthpracticalsystem operatio n [9-121.
Adequacy evaluation of a composite generation andtransmission system in a complete sense involves the simulationand load flow ana lysis of each possible outage c ondition in thesystem in order to determine the inability to supply load,voltage violations, line generator overloads, violations of
generator W a r , etc. and to quantitatively express the
deficiencies, f any, in terms of reliability indices. Reference 13
presents an approach to calcula te voltage collapse related bulkreliability indices as well as their impact on composite powersystem adequacy indices based on restoring system solvabilityby load shedding. This paper presents a fast technique toincorporate voltage stability considerations in the adequacyassessmentof a com posite power system. The voltage stabilityindicators developed in [3] are calculated for all possiblesystem contingencies. A bisection algorithm is then used todetermine the amount of load which m ust be shed to alleviate
all voltage stability violations. The impact of considering
voltage stability constraints on the adequacy indices isillustrated by application to the IEEE-RTS [141. The proposedtechnique can be easily included in an existing compositepower system adequacy program to monitor the effect on theadequacy indices of incorporating voltage stability constraints.
11. VOLTAGE STABILITY CONSIDERATIONS IN
COMPOSITE POWER SYSTEM RELWILIT Y
E VALUATION
There are two fundamental approaches to composite powersystem adequacy evaluation: analytical enumeration and MonteCarlo simulation. There is a wide ran ge of co mputer programs
0885-8950/98/$10.00 0 1997 IEEE

7/28/2019 Voltage Stability Considerations in Composite Power System Reliability Evaluation
http://slidepdf.com/reader/full/voltage-stability-considerations-in-composite-power-system-reliability-evaluation 2/6
656
available for composite power system adequacy evaluation.These programs are briefly described in Reference 15,including a list of the calculated indices and the factorsinvolved in the assessment. The approach presented in this
paper is based on an analytical enumeration procedure for
composite system evaluation. It can be also incorporate d in a
Monte Carlo simulation program.
1 . C a ~ c u ~ a ~ i o nf voltage stab ility indicators
For a given system contingency, voltage stability indicatorscan be calculated using the AC load flow results as follows:
The hybrid representation of a transm ission system is given by
the following equation:
[ z [ GLL L y G G""1 [$where VL, IL are the vectors of voltage and currents at
customer nodes,VG,IG are the vectors of voltage and currents at
generator nodes,zLL,", KG",YGG ar e sub matrices of the hybridmatrix.
Reference 3 defines the indicator L , to assess the voltage
stability of load bus K under a given outage condition j as
follows:
K IThe indicator at each bus varies between zero (no load) and one
(voltage collapse). The superscript (B) or any of the submatrices' elements and the bus voltages represents the adjusted
value a fter modifying the hybrid matrix and the bus vo ltagesdue to outage j .
2. in corpora tin^ voltage stability considerations in
ower system adequacy evaluation
There is no consensus among pow er utilities regarding uniformfailure criteria and therefore all utilities do not use the samefimdamentalnetwork solution technique to calculate the systemadequ acy. The basic justification for these differences lies inthe intent behind the adequacy studies. This paper deals withthe problem of incorporating voltage stability conside rations in
composite power system reliability evaluation. The utilizationof AC load flow is therefore an integral part of the solutionprocess.
It should be noted that the occurrence of a system problem maybe itself recorded as a failure event. In many cases, however, itis possible to eliminate a system problem by taking approp riatecorrective action. It is, therefore, of interest to determine
whether it is possible to eliminate a system problem byemploying proper corrective actions such as generation
rescheduling, correction ofWar limit violations, allevia tion of
line overloads, the solution of ill-conditioned networksituations and or load curtailment.
The basic structure of the contingency enumeration approach&er incorporating voltage stability considerations is sho wn inFigure 1.In this figure, load is curtailed, if necessa ry, for somecontingency due to violating the operational constraints
(capacity deficiency in the system, bus isolation, networkislanding and line/transformeroverloads) or due to violating thevoltage stability constraints. Load curtailments due to violatingoperational constraints are discussed in detail in manycomposite power system reliability publication and are notrepeated in this paper. If the voltage stability constraints areviolated, load is curtailed to ensure that the voltage stabilityindicators at all system load buses are less than or equal anacceptable threshold value.
Select a contingency
1 Load flow with corrective action if necessary I
N o
L Jalculate adequacy indices
Figure 1: Basic structure of the contingency enumeration approach.
If the voltage stability constraints are violated, the load buswhich h as the hig hest voltage stability indicator is selected toca ny out load shedding using a bisection algorithm as shownin Figure 2. Load shedding at this bus is an efficient way toreduce the vo ltage stability indicators. In this case, the systemis initially operating at point 1 which has a voltage stability
indicator of L,. A bisection algorithm [16] can be used todetermine the minimum amount of load to be shed (AP) to
reduce the value of the voltage stability indicator at the selectedbus fiom L, to b,where L, is the minimum ac ceptable voltagestability indicator "threshold value". In itial load limits [PI,P2 ]
are defined for the selec ted bus load w here PI equals zero andP, equals the original load at the selected load bus (P,). Voltagestability violation is then checked at the mid point of theselimits, ,. If it is found that the voltage stab ility constraints are
satisfied, then the lower load limit of the interval is replaced bythe mid point value, P,. Otherwise, the upper value is rep laced

7/28/2019 Voltage Stability Considerations in Composite Power System Reliability Evaluation
http://slidepdf.com/reader/full/voltage-stability-considerations-in-composite-power-system-reliability-evaluation 3/6
657
2, Effect on the loadpoint indices o f ncorDoratinp voltagestabilitv considera tions
by the mid-point value, P,. The procedure is repeated until the
required minimum load (AP=Po-P,) which must be she d at theselected bus to reduce the value of the voltage stabilityindicator at this bus from L, to L, is determined. The voltage
stability indicators are then recalculated for all the system loadbuses, using the procedure described in [3], and the bisectionprocess is repeated in the case of ano ther voltage violation untilall buses do no t are violate the voltage stability constraints.
The threshold value of the vo ltage stability indicator is less thanone and sho uld be selected for a given system in such a waythat the power system is far from a voltage instability point. Itis worthwhile noting that the threshold values are nearly thesame for every power system. Such a value can b e obtained inthe state where the voltage profile is higher than or eq ual to theminimum acceptable voltage and at the same time all thegenerators are operating within their reactive p ower limits [5].
The lo ad power factor is assumed to be constant at each loadbus after shedding a portion of the load.
Vo!tage stability indi cato r
i
/I Bisection algorithm /
4A PLoad
Figure 2: Functional description of the load-shedding calculationprocess using the bisection algorithm.
111. ADEQUACY INDICES FOR THE IEEE-RTS
CONSIDERING VOLTAGE STABILITY
CONSTRAINTS
The single line diagram of the 24-bus EEE -RT S is shown inFigure 3 [141. The system has 10 generator (PV) buses, 10 load(PQ) buses, 33 transmission lines and 5 transformers. The totalnumber of generating units is 32 with a minimum andmaximum rating of 12 MW and 400 MW respectively. Thesystem can be divided into two subsystems on the bases of
voltage levels. The north subsystem is at 230 KV and the southsubsystem is at 138 KV . The northern region has a surplus in
power while the southern region is a power deficient area. The
north subsystem load is 1518 MW while that of the southsubsystem is 1332 MW. The installed capacity in the northregion is 2721 MW and that of the south is 684 MW . In theanalysis conducted in this section, independent overlappingoutages up to the fourth level for generating units and up to thethird level for transmission lines and/or generating units areconsidered.
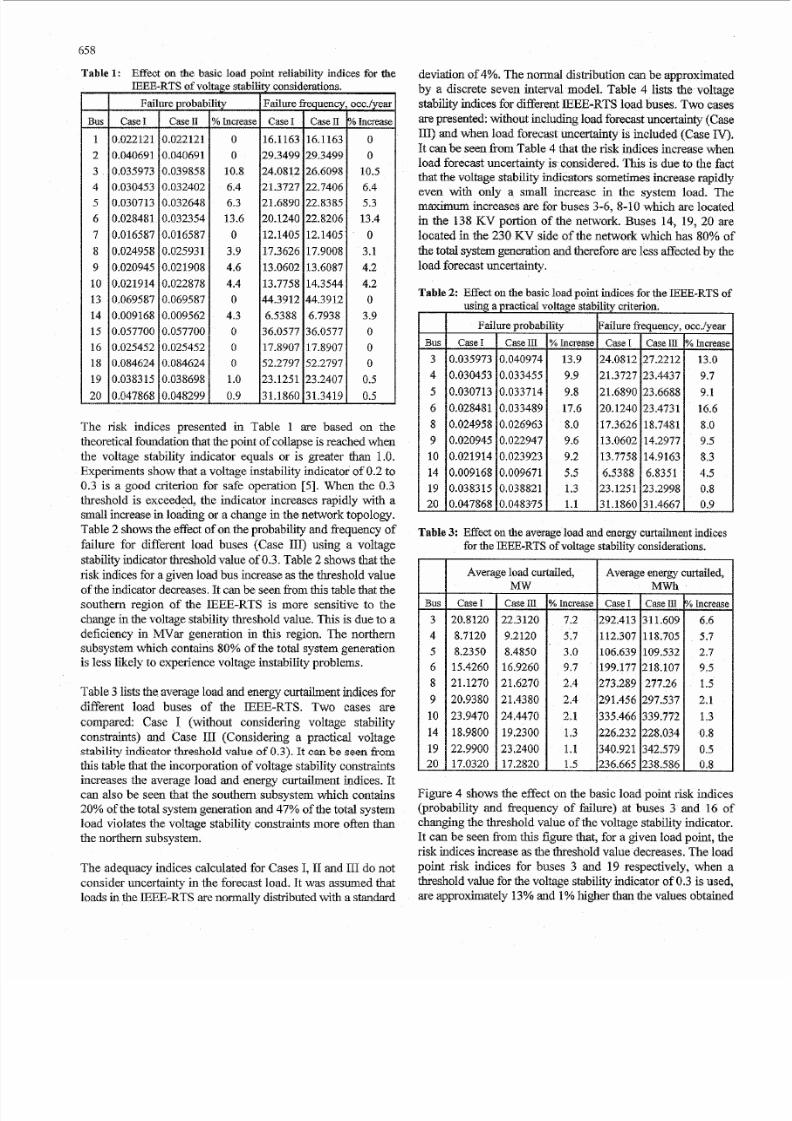
Table 1 lists the probability and frequency of failure for thedifferent buses in the IEEE-RTS. Two cases are presented:Ca se I is the traditional adequacy evaluation (without voltagestability considerations, i.e., only operational constraintsviolations are considered) and Case I1 presents the indices after
con side ring voltage stability constraints. It can be seen fromthis table that an increase in the failure probability andfrequency occurs when voltage stability constraints areconsidered. The highest percentage increase in the indiceswhen considering voltage stability constraints are for buses 3-6,8-10, which are located in the 1 38 KV portion of the networkand has inadequate MVar g eneration. On the other hand buses19 and 20 wh ich have the low est percentage increase in theindices are located in the 230 KV side of the network which
has 80% of the total system generation. It should be noted thatthe inclusion of voltage stability considerations do not affectthe indices of buses 1, 2, 7 and 15-18 since these buses arevoltage controlled buses.
2
I4- 3 0 K V buses 13 8 K V buses
Figure 3: Single line diagram of the IEEE-RTS.
7/28/2019 Voltage Stability Considerations in Composite Power System Reliability Evaluation
http://slidepdf.com/reader/full/voltage-stability-considerations-in-composite-power-system-reliability-evaluation 4/6
658
Table 1: Effect on the basic load p
we probaI
ease il
0,022121
0.040691
0.039858
0.0324020.032648
0,032354
0,016587
0.025931
0.021908
0.022XTX
0.069587
0.009562
0.057700
0.025452
0.084624
0.0386980.048299
5"
b hmease
0
0
10.8
6.46.3
13.6
0
3.9
4.6
4.4
0
4.3
0
0
0
1o0.9
Int reliability indices for thep ooz1siderations.
lccc./year
I h m
0
0
10.5
6.45.3
13.4
0
3.1
4.2
4.2
0
3.9
0
0
0
0.50.5
Th e risk indices presented in Table 1 are based on the
theoretical fomidation that the point of collapse is reached when
the voltage shbility indicator equals or is greater than 1.0.Experiments show that a vo ltage instability Indicator of 0.2 to0.3 is a good criterion for safe operation [SI. When the 0.3
tiweshold is exceeded, the indicator increases rapidly with asmall increase in lo&ng or a change in the network topology.Table 2 shows the effect:of on the probability and 5equency offailure for different load buses (Case ID) using a voltage
stability iiidiclatorthreshold value of0.3. Table 2 shows that the
iisk indices for a given load bus ittcrease as the thresholdvdueof the indicator decreases.It cm be seen from this table that thesouthern region of th e IEEE-RTS Is more sensitive to the
change in the voltage stability threshold value . This is due to a
deficiency in M V a generation in this region. The northem
subsystem which contains 80% ofthe total system generationis less likely to exp erienc e voltage instability problems .
Table3 lists the avemge load and mer# curtailment: ndices fordifferent load buses of the EEE-RTS. Tw o cases arecompared: Case I (without considering voltage stability
constraints) and Case 111 (Considering a practical voltagestability itidicstlor threshold value o f0 .3 ) . It can e seen &om
this table that the incorporationof voltage stability constraintsincreases the a verage load and energy c.llrtailment indices. Itcitn also be seen that the southern subsystem which contains20% ofehetotal system generation and 47% ofthe total systemload violates the voltage stability eomtralnts more often t han
die northern subsystem.
The adequacy indices calculated for Case s I, II and 111do notconside r uncertainty in the forecast load, It was assumed that
loads iu he IEEE-RTS are ~io nna lly istributedwth a standard
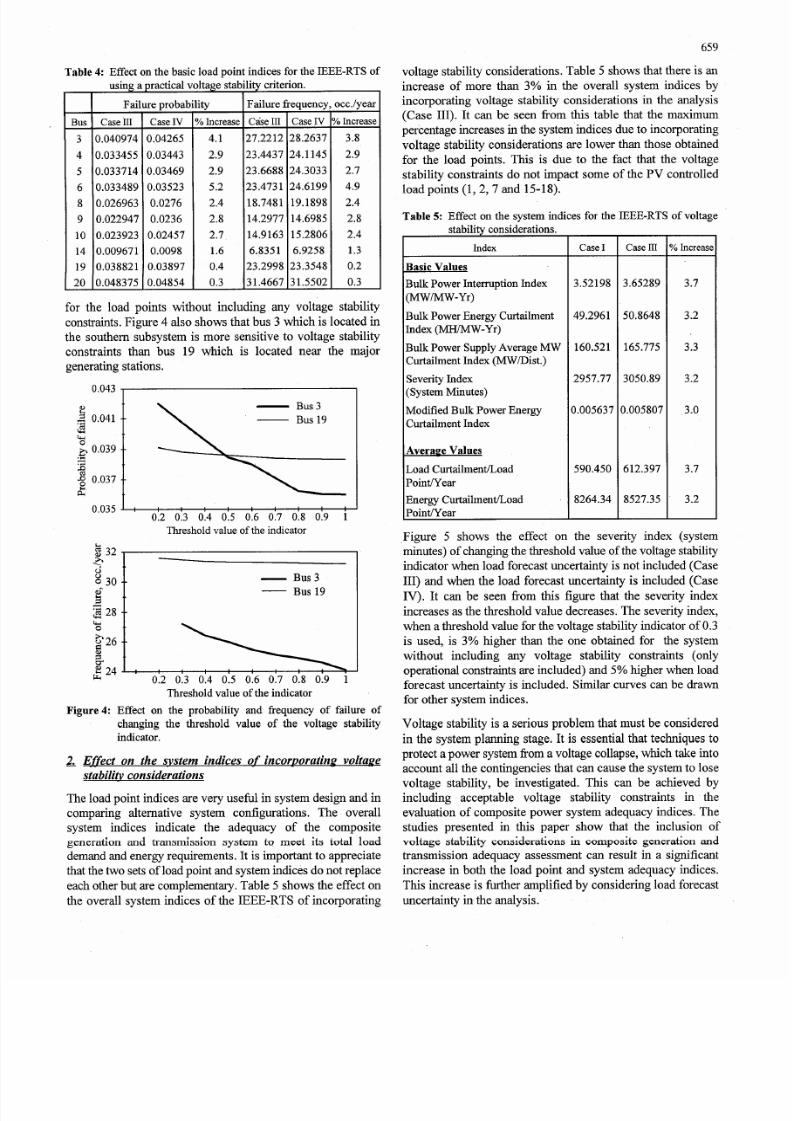
devi&on of4%. Th e normal distribution can be approximatedby a discrete seven hterv al model. Table 4 lists the voltagestability indices €or diAFarmt EEE-RTS load buses. Tw o cases
arepresentd without including load forecast wr&inty Caseur>and when load forecast uncertainty is included (Case IV).It c m be stfen from Table 4 that the risk indices increase whenload forecast uncertainty sidered. This i s due to th e factthatthe v&ige stability s S Q I I X ~ ~ ~ ~ Sncrease rapidly
even wth only a small increase in the system load. Th erami" increasesare for buses 3-6, 8-10 which are located
in the 138 KV portion of the tietivork. Buses 14, 19, 20 are
h a t e d in th e 230 KV side ofthe network which has 80% of&e totaI system generatlion md therefore are less affected by the
load fore cast Uncel2&1ty.
Table2: Effect outhe basic loadpoint itldices for the IEEE-RTSof
9
10
14
19
20
Case1 CaseNI
0.035973 0.040974
0.030453 0.0334550.030713 0.033714
0.028481 0.033489
0.024958 0,026963
0.020945 0.023947
0.021914 0.023923
0.009168 0.009671
0.038315 0.038821
0.047868 0,04835'5
Table 3: Effect on the average laad atid energy curtailmentindicesfar the IEEE-RTS of voltage stability considerations.
Average load cuftailed,Mw
Average e m r e curtailed,
Bus
3
4
5
6
8
9
10
14
19
20
_.
-
Case I
20.8120
8.7120
8.2350
15.4250
21.1270
20.9380
23.9470
18.9800
22.9900
17,0320
Case ll
22.3120
9.2120
8.4850
16.9260
21.6270
21.4380
24.4470
19.2300
23.2400
17.2820
Case Iff311,609
118.705
109.532
218.107
277.26
297.537
339.772
228.034
342.579
238.586
9" Increase
6.6
5.7
2.7
9.5
1.5
2.1
1" 3
0.8
0.5
0.8
Figure 4 shows the e&ct on the basic load point ksk indices(probability and fjrequency of fdm)t buses 3 and 15 ofchanging the threshold value of th e voltage stability indicator.It can be seen from this figurethat, or a given load point, therisk itldices increase as the threshold value decmses. The loadpoint risk indices for buses 3 an d 19 respectively, when a
threshold value for the voltage stability indicator of 0. 3 is used,areapproximately 13% and 1%higher than the values obtained
7/28/2019 Voltage Stability Considerations in Composite Power System Reliability Evaluation
http://slidepdf.com/reader/full/voltage-stability-considerations-in-composite-power-system-reliability-evaluation 5/6
, Bus CaseIII
3 0.040974
4 0.033455
5 0.033714
6 0.0334898 0.026963
9 0.022947
10 0.023923
14 0.009671
19 0.038821
20 0.048375
Case IV
0.04265
0.03443
0.03469
0.035230.0276
0.0236
0.02457
0.0098
0.03897
0.04854
Cake II I
27.2212
23.4437
23.6688
23.473118.7481
14.2977
14.9163
6.8351
23.2998
%Increase
4.1
2.9
2.9
5.22.4
2.8
2.7
1.6
0.4
0.3
CaseIV
28.2637
24.1145
24.3033
24.619919.1898
14.6985
15.2806
6.9258
23.3548
31.5502
for the load points without including any voltage stabilityconstraints. Figure 4 also sho ws that b us 3 which is located in
the southern subsystem is more sensitive to voltage stabilityconstraints than bus 19 which is located near the majorgenerating stations.
%Increase
3.8
2.9
2.7
4.92.4
2.8
2.4
1.3
0.2
0.3
0.043 1
0.035’ : : : : : : : : : : I0.2 0 .3 0.4 0.5 0.6 0.7 0.8 0.9 1
Threshold value of the indicator
- us3- US193
3 8
- us3- US193
3 8
$’26P)Y + 2 h L J+s24 0.2 0.3 0.4 0.5 0.6 0.7 0.8 0.9 1
Threshold value of the indicator
Figure4: Effect on the probability and frequency of failure of
changing the threshold value of the voltage stability
indicator.
Effect on the svstem indices o f incorporating voltagestabilih, consid erations
The load point indices are very useful in system design and incomparing alternative system configurations. The overallsystem indices indicate the adequacy of the compositegeneration and transmission system to meet its total loaddemand and energy requirements. It is important to appreciatethat the two sets of load point and system indices do not replace
each other but are complementary. Table 5 shows the effect onthe overall system indices of the IEEE -RTS of incorporating
659
voltage stability considerations. Table 5 shows that there is an
increase of more than 3% in the overall system indices byincorporating voltage stability considerations in the analysis(Case 111). It can be seen fkom this table that the maximumpercentage increases in the system indices due to incorporating
voltage stability considerations are low er than those obtainedfor the load points. This is due to the fact that the voltagestability constraints do not impact some of the PV controlled
load points (1,2, 7 and 15-18).
Table 5: Effect on the system indices for the EEE-RTS of voltage
stability considerations.
Index
Basic Values
Bulk Power Interruption Index
(MW/MW-Yr)
Bulk Power Energy Curtailment
Index (MWMW-Yr)
Bulk Power Supply Average MW
Curtailment Index (MW/Dist.)
Severity Index(System Minutes)
Modified Bulk Power Energy
Curtailment Index
Averave Values
Load CurtailmentLoad
Poinuyear
Energy CurtailmentLoad
PointlYear
Case I
3.52198
49.2961
160.521
2957.77
1.005637
590.450
8264.34
Case Ill
3.65289
50.8648
165.775
3050.89
1.005807
612.397
8527.35
b Increasc
3.7
3.2
3.3
3.2
3.0
3.7
3.2
Figure 5 shows the effect on the severity index (systemminutes) of chang ing the threshold value of the voltage stability
indicator when load forecast uncertainty is not included (Case111) and when the load forecast uncertainty is included (Case
IV). It can be seen fiom this figure that the severity indexincreases as he threshold value decreases. The severity index,when a threshold value for the voltage stability indicator of 0.3
is used, is 3% higher than the one obtained for the systemwithout including any voltage stability constraints (onlyoperational constraints are included) and 5% higher when loadforecast uncertainty is included. Similar curves can be draw nfor other system indices.
Voltage stability is a serious problem that m ust be considered
in the system planning stage. It is essential that techniques to
protect a power system from a voltage collapse, which tak e intoaccount all the contingencies that can cause the system to losevoltage stability, be investigated. This can be achieved byincluding acceptable voltage stability constraints in theevaluation of composite power system adequacy indices. Thestudies presented in this paper show that the inclusion ofvoltage stability considerations in composite generation and
transmission adequacy assessment can result in a significantincrease in both the load point and system adequacy indices.
This inc rease is further amplified by considering load forecastuncertainty in the analysis.

7/28/2019 Voltage Stability Considerations in Composite Power System Reliability Evaluation
http://slidepdf.com/reader/full/voltage-stability-considerations-in-composite-power-system-reliability-evaluation 6/6
660
m
5 3150
8 3100
'050
$3000
3
.fla,c
a
.e I. -Case I V- Case III
6 2950 I IVI 0.2 0.3 0.4 0.5 0.6 0.7 0.8 0.9 1
Threshold value of the indicator
Figure 5: Effect of changing the threshold value of the voltage
stability indicator on the severity index.
IV.CONCLUSIONS
This paper presents an effective and fast technique to
incorporate voltage stability considerations in composite
generation an d transmission system adequacy evaluation. In
this technique, load shedding is performed in two stages. In the
first stage, load is curtailed, if necessary, to eliminate anyoperational constraint violations and in the second stage load is
curtailed, also if necessary, to restore the system to a voltage-
stable operating point using a s imple voltage stability indicator
derived from the AC load flow results. A fast bisectionalgorithm is used to calculate the amount of load to be shed in
the case of voltage stability violations.The proposed technique
can be easily incorporated in an existing composite power
system adequacy program. The numerical results show that the
proposed technique suitably reflects the effects of voltagestability constraints on the composite generation and
transmission system adequacy indices.
V. REFERENCESSystem Dynamic Performance Subcommittee of the IEEE
Power System Engineering Committee, "Voltage Stability of
Power Systems: Concepts, Analytical tools and Industry
Experience", IEEE Publication No. 90-THO358-2-PWR.
Y. Tamura, H. Mori and S. Iwamoto, "Relationship between
voltage instability and multiple load flow solutionsin electric
power systems", IEEE Trans. on Power Apparatus and
Systems, Vol. 102,No . 5, May 1983, pp. 1115-1125.
P. Kessel and H. Glavitch, "Estimating he Voltage Stability ofa Power System", IEEE Trans. on Power Delivery, Vol. 1,No.
3, Jul. 1986, pp. 346-354.
A. Tlranuchlt and R.J. Thomas, "A Posturmg Strategy Agamst
Voltage InstabilityinElectric Power Systems",EE E Trans. onPower Systems, Vol. 3, No. 1, Feb. 1988, pp. 87-93.
T. Quoc Tuan, J. Fandino, N. Hadjsaid, J.C., Sabonnadiere and
H. Vu, "Emergency Load Shedding to Avoid Risks of Voltage
Instability Using Indicators", IEEE Trans. on Power Systems,
Vol. 9, No . 1,Feb. 1994, pp. 341-351.
M.S. Calovic , "Modeling and Analysis of Under Load Tap
Changing Transformer Control Systems", IEEE Trans. on
Power Apparatus and Systems, Vol. 103, No . 7, Jul. 1984, pp.
1909-1915.
A.E. Hammad and W. Kuhn, "A Computation Algorithm for
Assessing Voltage Stability at ACDC Interconnections", E E E
Trans. on Power Systems, Vol. 1,No. 1, Feb. 1986, pp. 209-
216.
C.W. Taylor ,"Concepts of Undervoltage Load Shedding for
Voltage stability", IEEE Trans.on Power Delivev, Vol. 7, No.
2, Apr. 1992, pp. 480-488.
K.L. Loparo and G.L. Blankenship, "ProbabilisticMechanism
for Small DisturbancesInstabilities in Electric Power Systems",IEEE Trans. on Circuits and Systems, Vol. 32, No. 2, Feb.
1985, pp. 177-184.
C.L. DeMarco and A.R. Bergen, "A Security Measure for
Random Load Disturbances in Non Linear Power System
Models", EE E Trans. on Circuits and Systems, Vol. 34, No.
12, Dec. 1987, pp. 1546-1557.
C.O. Nwankpa, S.M. Shahidehpour and Z. Schuss "A
StochasticApproach to Small Disturbance Stability Analysis",
IEEE Trans. on Power Systems, Vol. 7, No. 4, Nov. 1992, pp.
1519-1528.
C.O. Nwankpa and R.M. Hassan "A StochasticBased Voltage
Collapse Indicator", IEEE Trans. on Power Systems, Vol. 8,
A.C.G. Melo, J.C.O. Mello and S. Granville, "The Effect of
Voltage Collapse Problems in the Reliability Evaluation ofComposite Systems", IEEEPES Winter Meeting, Paper # 96
IEEE Committee Report, "IEEE Reliability Test System", IEEE
Trans. on Power Apparatus and Systems, Vol. 98, Nov.iDec.
R. Billinton and E. Khan, "A Comparison of Existing Computer
Programs for Composite System Adequacy Evaluation",
Canadian Electrical Association Trans., Vol. 28, Part 3, Mar.
1989.
S. Aboreshaid, R. Billinton and M. Fotuhi-Firuzabad,
"Probabilistic Transient Stability Studies Using the Method ofBisection", IEEE Trans. on Power Systems, Vol 11, No. 4,
NO.3, Aug. 1993, pp. 1187-1193.
WM 316-0 PWRS, Jan 21-25, 1996.
1979, pp. 2047-2054.
NOV.1996, pp. 1990-1995.
VI. BIOGRAPHIES
RoyBillinton (F'78) came to Canada from England in 1952. Obtained
B.Sc. and M.Sc. Degrees from the University of Manitoba and Ph.D.
and D.Sc. Degrees from the University of Saskatchewan. Worked for
Manitoba Hydro in the System Planning and Production Divisions.
Joined the University of Saskatchewanin 1964. Formerly Head of the
ElectricalEngineeringDepartment. Presently C.J. Mackenzie Professor
of Engineering and Associate Dean, Graduate Studies, Research and
Extension of the College of Engineering.
Author of papers on Power System Analysis, Stability, Economic
System Operation and Reliability. Author or co-author of eight books
on reliability. Fellow of the IEEE, the EIC and the Royal Society of
Canada and a Professional Engineer in the Province of Saskatchewan.
SalehAboreshaid (S'92) was bom in Saudi Arabia. Received his BSc.
Degree from King Saud University in 1990. Obtained an M.Sc. Degree
fromthe University of Saskatchewan in 1993. He is currently working
towards a Ph.D. degree in the area of power system reliability
evaluation.


