A Call to Action: Improving Breastfeeding Initiation and Duration in the Hudson Valley.
International Journal of Electrical and Computer Engineering (IJECE) Vol. 6, No. 3, June 2016, pp. 1305 ~ 1318 ISSN: 2088-8708, DOI: 10.11591/ijece.v6i3.10163 1305
Journal homepage: http://iaesjournal.com/online/index.php/IJECE
Voltage Instability of Initiation Fault Duration as Influenced by Nodes Short Circuit Levels NSCL
Youssef Mobarak1,2, Mahmoud Hussein2
1Departement of Electrical Engineering, Faculty of Engineering, Rabigh, King Abdulaziz University, Saudi Arabia 2Departement of Electrical Engineering, Faculty of Energy Engineering, Aswan University, Egypt
Article Info ABSTRACT
Article history:
Received Jan 20, 2016 Revised Mar 12, 2016 Accepted Mar 29, 2016
The occurrence of voltage instabilities or voltage collapses depend on the duration of the persistence of the fault and on the type of fault, some faults lead to voltage instabilities, others lead to voltage collapse. Evaluation of fault durations causing occurrence of voltage instabilities is the main goal of this paper. This paper searches for the effect of nodes short circuit levels NSCL and its duration periods initiation of voltage instability, at certain loads buses. The fault which leads to voltage instability is found to be short circuits at certain nodes cleared without any variation in the transmission system elements, the post-fault conditions will be the same as the pre-fault conditions. The power system dynamic simulation program is developed for dynamic analysis of voltage stability. Models for loads, in this study are induction motors with three different shaft mechanical loads, constant impedance CZ loads, constant current CI loads and constant power CP loads are used, as they depict the behavior of most power system loads. The influence of the transmission network impedances, which are nearly the inverse of the NSCL, on the fault duration which lead to the occurrence of voltage instabilities, are studied and evaluated using various load representations.
Keyword:
Power system stability Voltage instability Voltage collapse Nodes short circuit levels Different loads
Copyright © 2016 Institute of Advanced Engineering and Science. All rights reserved.
Corresponding Author:
Youssef Mobarak, Electrical Engineering Department, Faculty of Engineering, Rabigh, King Abdulaziz University, Rabigh, 21911, Saudi Arabia. Email: [email protected]
1. INTRODUCTION
Voltage instabilities or voltage collapses depend on the duration of the persistence of the fault and on the type of fault, some faults lead to voltage instabilities, others lead to voltage collapse. Evaluation of fault durations causing occurrence of voltage instabilities or collapse is discussed in [1]-[3]. Voltage collapse has recently gained increasing attention, this phenomenon is characterized by progressive fall in voltage magnitude at a particular location finally spread out in the network causing a complete system voltage failure or a blackout [4]-[6]. The phenomenon has been attributed mainly to the inability of power system to meet a certain load demand of reactive power [7]-[9]. The effects of the excitation system control parameters on fault duration causing voltage instability initiation [10]. Also, the effects of the excitation system control parameters on fault duration causing to reach voltage collapse initiation [11]. Voltage stability is tightly related to load characteristics and to voltage magnitudes [12]. It is directly dependent on load behavior with voltage and frequency variations [13]. The exact detection of the occurrence of voltage instability phenomena is mainly dependent on the correctness of the loads power/voltage and reactive power/voltage relations [14]-[15]. Recently it has been suggested to represent these relations in polynomial forms with certain orders, which led to coincidence of results of voltage stability criteria [16]. The load power/voltage characteristics
ISSN: 2088-8708
IJECE Vol. 6, No. 3, June 2016 : 1305 – 1318
1306
can be derived from the load/time and voltage/time characteristics, usually recorded in all power stations and transformer substations [17]-[20].
The best method for load representation at any load bus is to observe and record the change in the active and reactive power when voltage and frequency are changed. The availability of new computers with large facilities has encouraged the new load powers representation to be established. It is based on practical or experimental measurements and extrapolation technique to determine the appropriate polynomial exponents and after which the voltage stability results rest unchanged or be coincident [21]-[22]. Usually time records for power, reactive power/voltage are readily available by getting the values of the power, reactive power and voltage at each discrete time interval [23]. The polynomial load models for induction motors with various mechanical loads are displayed [24]-[25]. The package of the characteristics of the induction motor with normalized P/V and Q/V characteristics with constant mechanical load torque (T=constant). Mechanical load torque as function in speed (Tαω), and mechanical load torque as function in the square of the speed (Tαω2) are considered [26]-[28]. Using extrapolation technique, the equations were derived for the motor powers and reactive powers as a function of the load terminal voltages. Using different powers of the polynomials of the power/voltage (P/V) and the reactive power/voltage (Q/V), the derived models [29]-[30]. The effect of the peak inrush currents on the fault duration voltage collapse, when after certain steady state is reached, the line between two buses is opened, with different lagging and leading loads power factors [31]-[33]. 2. POWER SYSTEM MODEL REPRESENTATION
In order to study the critical clearing time for voltage instability, and to perform comparative studies, various types of loads such as CZ, CI, CP loads, and three types of induction motor loads are considered [34]-[35]. A multi-machine power system, which consists of 9-buses, 3-machines of Western States Coordinating Council (WSCC) in United States is used in the analysis and evaluation of the fault duration for voltage instabilities initiation or what can be called the critical clearing time for voltage instability [36]. Also, we searches about the fault duration which cause initiation of voltage instability. The influence of the transmission system impedances, which represent the reciprocal of the system nodes short-circuit levels NSCL is studied in this paper. As this system will be used throughout the study its modeling and solution technique are given in details in this section, together with its data and its principal equations.
2.1. Loads Mathematical Modelling:
In this paper, we concerned with the study of the quasi static loads which it consists of heating and lighting equipment’s. Also, three quasi static models are used for induction motor load representation. The commonly used representations of static loads are either CZ to ground, CI and CP. These load models are given in the following, where PL, QL and VL are the load active power, reactive power, and bus voltage, respectively (their initial values are PLo, QLo and VLo).
Constant Impedance Model (CZ):
, (1)
Constant Current Model (CI):
, (2)
Constant Power Model (CP):
, (3)
Three models are used for induction motor load, and the active and reactive power has expressed by
the 4th order polynomials representation [37]: Induction motors with constant mechanical loads torque (T=Constant):
8.02 23.23 23.27 8.79 0.76 (4)
44.76 148.56 179.72 92.94 16.11 (5)
IJECE ISSN: 2088-8708
Voltage Instability of Initiation Fault Duration as Influenced by Nodes Short Circuit .... (Youssef Mobarak)
1307
Induction motors with mechanical load torque proportional to speed (Tαω):
64.67 233.03 268.03 161.67 33 (6)
32.56 142.22 273.50 175.67 48.83 (7)
Induction motors with mechanical load torque proportional to square of speed (Tαω2):
75.97 342.0 627.97 598.5 309.9 81.57 9.23 (8)
422.04 1900.0 3488.7 325.0 1721.67 53.15 46.74 (9)
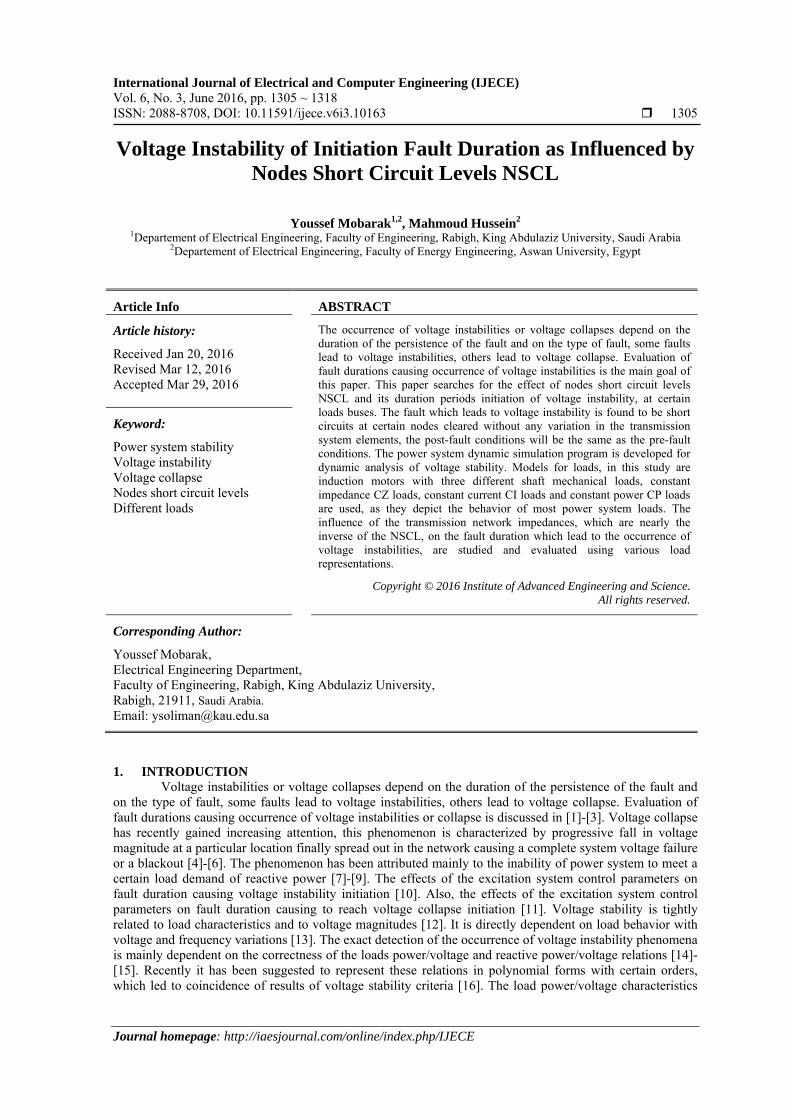
2.2. Generators Mathematical Modelling: For transient stability studies, there are many models to represent the synchronous generator
dynamics [38]-[40]. The one of these models used in this study is the one-axis model. In this model the transient effects are accounted for, while the subtransient effects are neglected. The transient effects dominated by the rotor circuits, which are the field circuit in the d-axis and an equivalent circuit in the q-axis formed by the solid rotor is neglected. Figure 1 shows the generator model in block diagram form. The model equations are summarized below [41]-[43].
Figure 1. Synchronous generator model For each generator electrical equations are q-axis stator equation,
(10)
(11) The power system considered consisting of n synchronous generators feeding through a
transmission network, a number of loads. The system motion using one-axis generator model, under a disturbance, the following set of differential equations described for each generator [44]-[47]:
2 (12)
(13)
ISSN: 2088-8708
IJECE Vol. 6, No. 3, June 2016 : 1305 – 1318
1308
(14)
Where: δ, f0, ω, H, D, and E’qi are the rotor angle, initial frequency, speed deviation, inertia constant, mechanical damping coefficient, and the q-axis voltage component, respectively. Pm, Pe, Efd, Id, and T’
d0 are the generator input mechanical power, output electrical power, excitation voltage, d-axis current component, and d-axis transient open-circuit time constant, respectively. Finally, Xd and X’
d are the d-axis and transient d-axis reactance’s. Note that, Pe is computed as:
(15)
Where, E’d is the d-axis component of the voltage E’, and Iq is the q-axis component of the generator current,
which is given as:
(16)
Where, E’ is the voltage behind the reactance X’
d, and V is the generator terminal voltage.
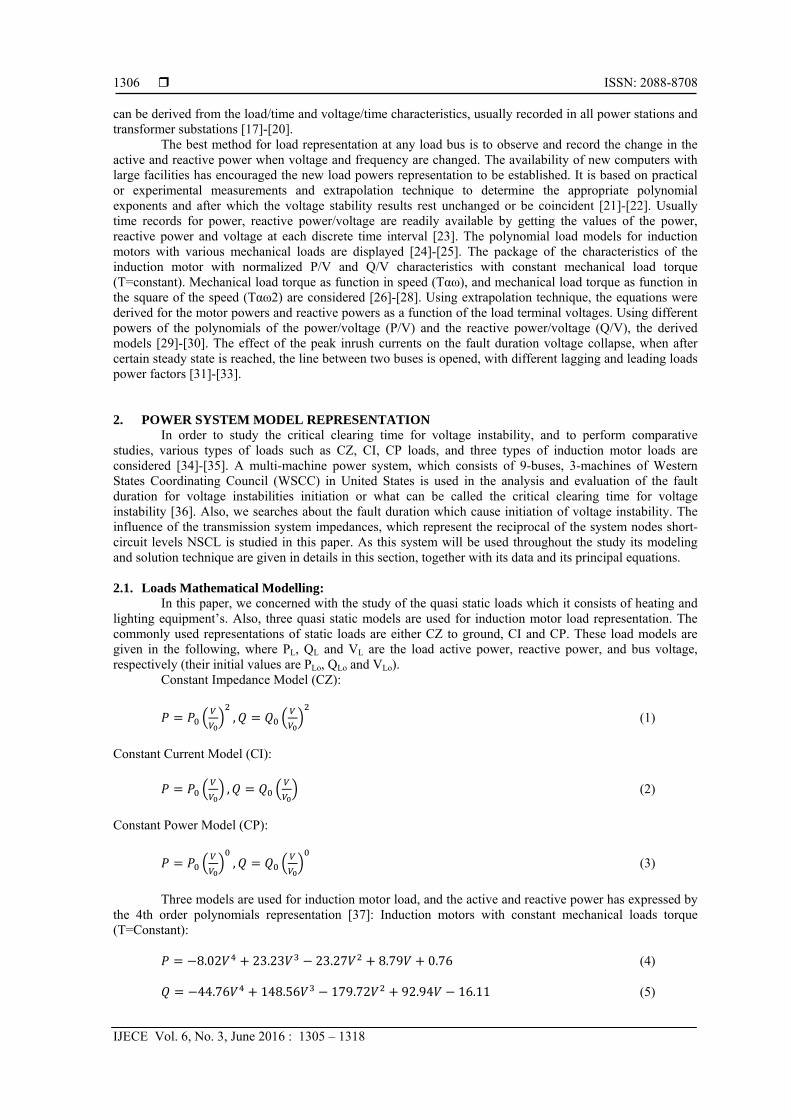
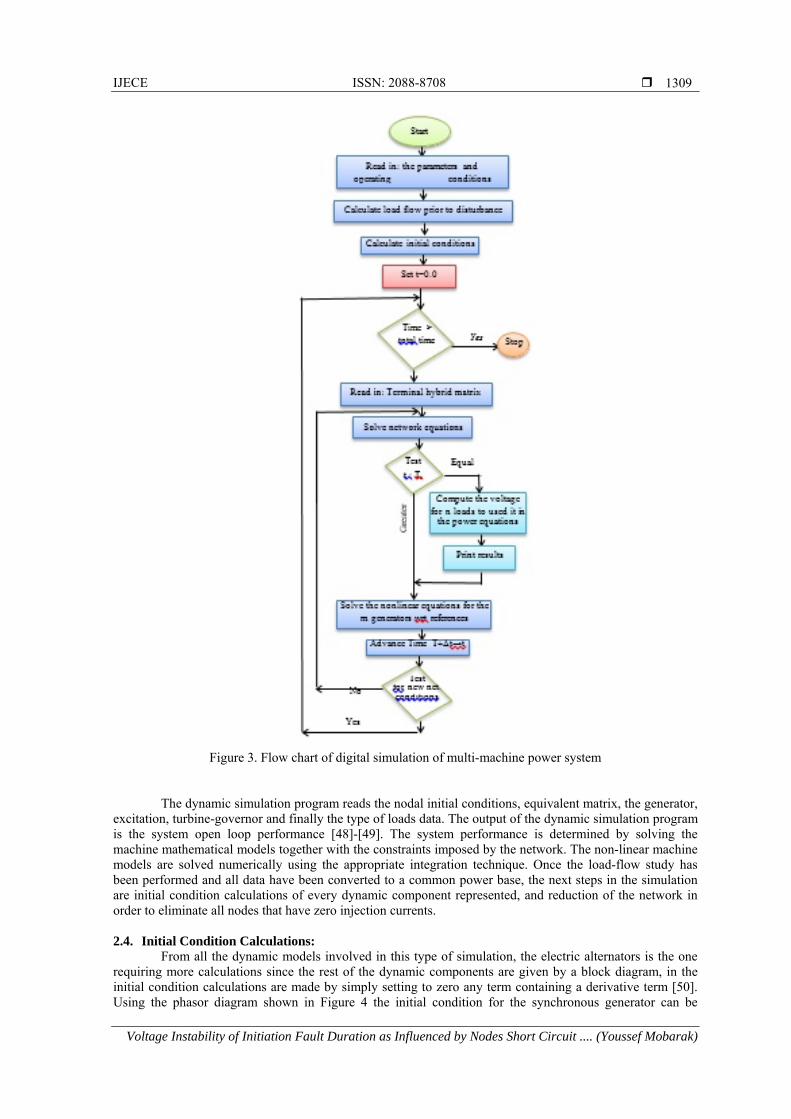
2.3. Multi-machine Aggregated System: The interrelation of the system elements is shown in Figure 2. The three system solution system are
the dynamic simulation program, the network reduction program and the load flow program with loads represented by polynomial models. They should be used in sequence to solve the system equations. A flow chart of multi-machine power systems written in Matlab Tool Box, is shown in Figure 3.
Figure 2. Simulation power system program
IJECE ISSN: 2088-8708
Voltage Instability of Initiation Fault Duration as Influenced by Nodes Short Circuit .... (Youssef Mobarak)
1309
Figure 3. Flow chart of digital simulation of multi-machine power system
The dynamic simulation program reads the nodal initial conditions, equivalent matrix, the generator, excitation, turbine-governor and finally the type of loads data. The output of the dynamic simulation program is the system open loop performance [48]-[49]. The system performance is determined by solving the machine mathematical models together with the constraints imposed by the network. The non-linear machine models are solved numerically using the appropriate integration technique. Once the load-flow study has been performed and all data have been converted to a common power base, the next steps in the simulation are initial condition calculations of every dynamic component represented, and reduction of the network in order to eliminate all nodes that have zero injection currents.
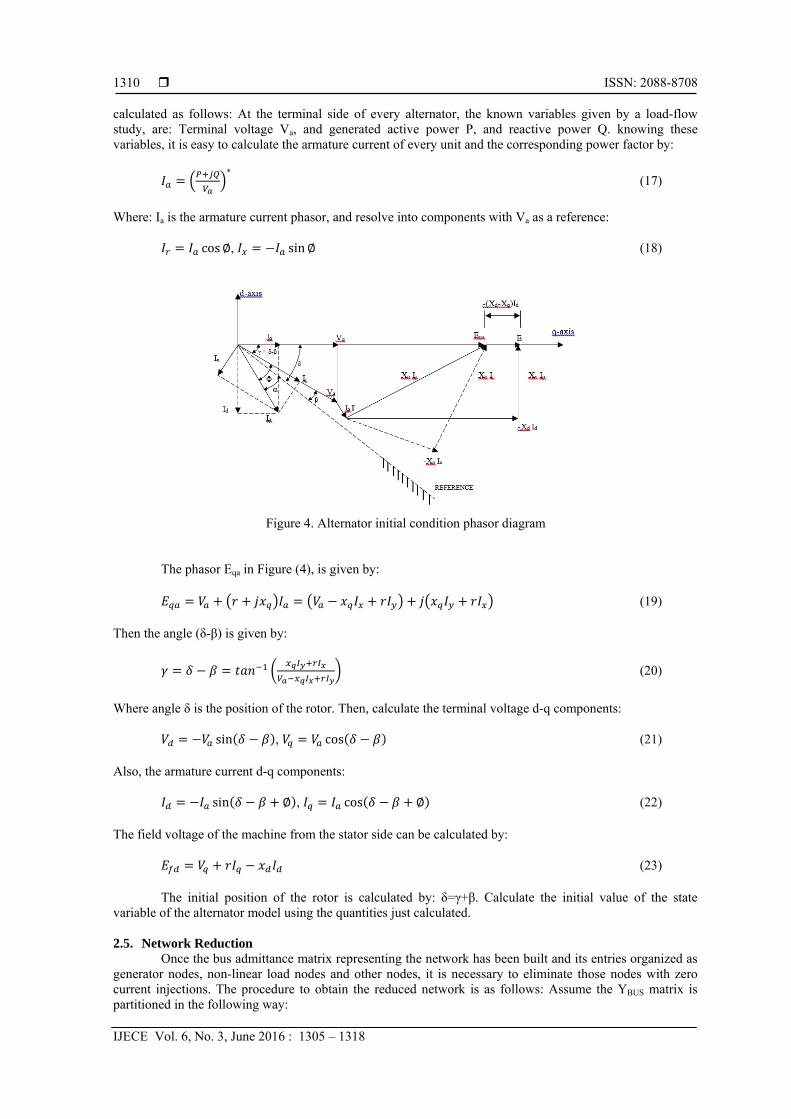
2.4. Initial Condition Calculations:
From all the dynamic models involved in this type of simulation, the electric alternators is the one requiring more calculations since the rest of the dynamic components are given by a block diagram, in the initial condition calculations are made by simply setting to zero any term containing a derivative term [50]. Using the phasor diagram shown in Figure 4 the initial condition for the synchronous generator can be
ISSN: 2088-8708
IJECE Vol. 6, No. 3, June 2016 : 1305 – 1318
1310
calculated as follows: At the terminal side of every alternator, the known variables given by a load-flow study, are: Terminal voltage Va, and generated active power P, and reactive power Q. knowing these variables, it is easy to calculate the armature current of every unit and the corresponding power factor by:
∗ (17)
Where: Ia is the armature current phasor, and resolve into components with Va as a reference:
cos∅, sin∅ (18)
Figure 4. Alternator initial condition phasor diagram The phasor Eqa in Figure (4), is given by:
(19)
Then the angle (δ-β) is given by:
(20)
Where angle δ is the position of the rotor. Then, calculate the terminal voltage d-q components:
sin , cos (21)
Also, the armature current d-q components:
sin ∅ , cos ∅ (22)
The field voltage of the machine from the stator side can be calculated by:
(23)
The initial position of the rotor is calculated by: δ=γ+β. Calculate the initial value of the state
variable of the alternator model using the quantities just calculated.
2.5. Network Reduction Once the bus admittance matrix representing the network has been built and its entries organized as
generator nodes, non-linear load nodes and other nodes, it is necessary to eliminate those nodes with zero current injections. The procedure to obtain the reduced network is as follows: Assume the YBUS matrix is partitioned in the following way:

IJECE ISSN: 2088-8708
Voltage Instability of Initiation Fault Duration as Influenced by Nodes Short Circuit .... (Youssef Mobarak)
1311
0 (24)
Where: G means generator nodes, L means non-linear load nodes, R means remaining nodes. Eliminate the remaining nodes by successive elimination procedure:
(25)
Where:
After adding the internal impedance of each generator to new admittance matrix, the equation (25) becomes re-arranged as follows:
(26)
Where just Y’
GG change to Y”GG, and E’
G means the voltage behind the transient reactance. The equation (26) can be re-arranged as follows, this is because the initial load current at load buses are known, and it is used to determine the load voltage at load buses respectively at the next step.
∗
(27)
Where: Y*
GG New admittance matrix, KGL, HLG Non-dimensional matrices, ZLL Load impedance matrix. The equivalent matrix for the entire network is represented by the single line diagram of power system operating at the nominal loading condition is found as:
∗ (28)
Where:
The system differential equations are depicts:
, 0 (29)
, (30)
Network general features:
(31)
cos sinsin cos
or cos sinsin cos
(32)
ISSN: 2088-8708
IJECE Vol. 6, No. 3, June 2016 : 1305 – 1318
1312
Also. steady-state equations solution:
(33)
(34)
(35)
cos sinsin cos
cos sinsin cos
(36)
(37)
∗ ∗ (38)
0 (39)
(40)
3. STUDIED SYSTEM
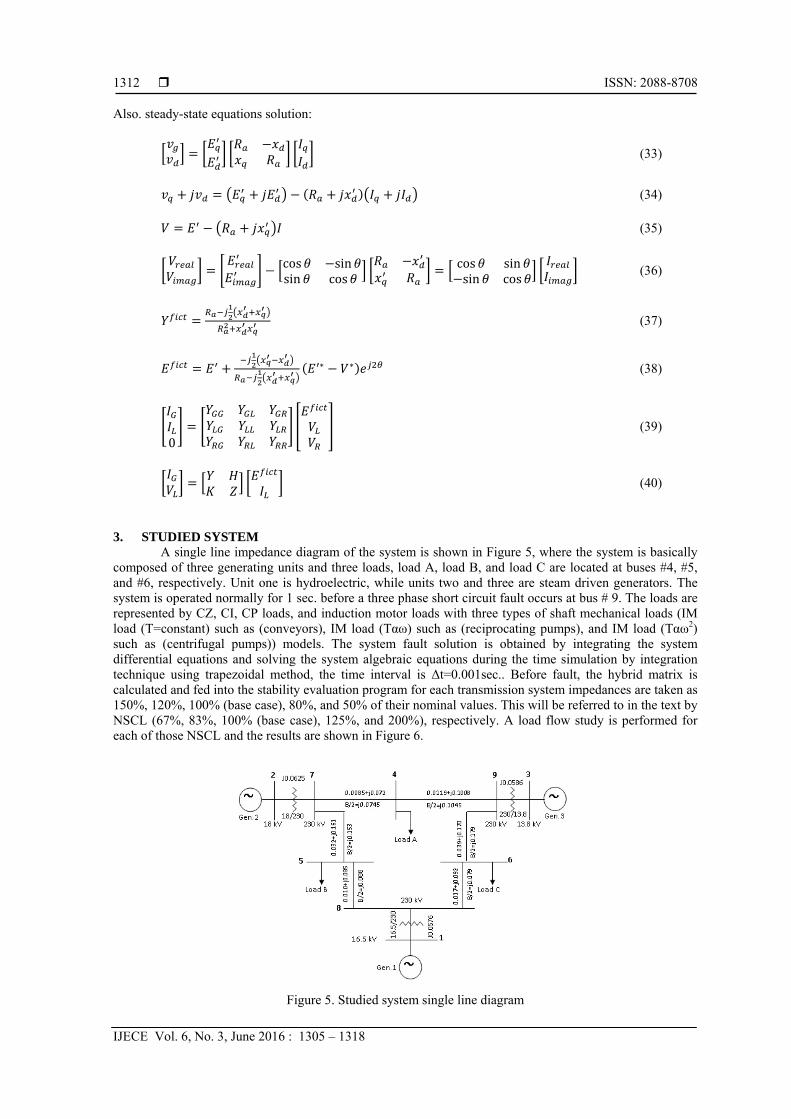
A single line impedance diagram of the system is shown in Figure 5, where the system is basically composed of three generating units and three loads, load A, load B, and load C are located at buses #4, #5, and #6, respectively. Unit one is hydroelectric, while units two and three are steam driven generators. The system is operated normally for 1 sec. before a three phase short circuit fault occurs at bus # 9. The loads are represented by CZ, CI, CP loads, and induction motor loads with three types of shaft mechanical loads (IM load (T=constant) such as (conveyors), IM load (Tαω) such as (reciprocating pumps), and IM load (Tαω2) such as (centrifugal pumps)) models. The system fault solution is obtained by integrating the system differential equations and solving the system algebraic equations during the time simulation by integration technique using trapezoidal method, the time interval is Δt=0.001sec.. Before fault, the hybrid matrix is calculated and fed into the stability evaluation program for each transmission system impedances are taken as 150%, 120%, 100% (base case), 80%, and 50% of their nominal values. This will be referred to in the text by NSCL (67%, 83%, 100% (base case), 125%, and 200%), respectively. A load flow study is performed for each of those NSCL and the results are shown in Figure 6.
Figure 5. Studied system single line diagram
IJECE ISSN: 2088-8708
Voltage Instability of Initiation Fault Duration as Influenced by Nodes Short Circuit .... (Youssef Mobarak)
1313
Figure 6. A load flow study is performed for each of those NSCL%
4. RESULTS AND DISCUSSION 4.1. Fault Duration for Voltage Instability as Influenced by Varying of the NSCL:
This will be referred to in the study by NSCL (67%, 83%, 100% (base case), 125%, and 200%), respectively. Table (1) indicate the fault duration which cause voltage instability when a three-phase short-circuit occurs at node (9) at t=1 sec., with the NSCL varies by a certain percentage such as (67%, 83%, 100%, 125%, and 200%) These variations are applied when the loads are CZ load, CI load, CP load, at all load buses, this is because increasing the NSCL means more parallel lines and more corridors for power flow. Also, IM load (T=constant), IM load (Tαω) and IM load (Tαω2) at load bus (4) only with the load at load buses (5) and (6) having CZ loads. The system cannot operate stably when all loads are assumed pure induction motor loads. Those networks are considered strong power systems. They allow longer fault times before announcing voltage instability states.
Table 1. Effect of NSCL on the fault duration for voltage instability at different loads
% NSCL
Fault duration for voltage instability (msec.)
CZ loads CI loads CP loads IM load
T=constant IM Tαω
I.M. load Tαω2
67% 291 273 220 253 262 268 83% 300 281 237 274 279 285 100 304 285 243 279 290 293 125 307 289 284 284 294 302 200 316 299 260 296 298 310
Denoting the fault duration which cause voltage instability initiation by TFault and the percentage
NSCL, the polynomial equation of third order found by MATLAB program indicate the relation between Fault duration which cause voltage instability and percentage of NSCL They are displayed:
For CZ loads at all load buses: 193.77 243.71 174.74 41.72 For CI loads at all load buses: 195.78 188.18N 128.77 30.24 For CP loads at all load buses: 38.00 459.12 331.64 78.79 For IM load at node (4), nodes (5) and (6) are constant impedance loads: For IM load (T=constant) 25.90 581.12 428.66 102.82 For IM load (Tαω): 64.47 487.06 338.57 76.71 For IM load (Tαω2): 119.28 253.07 225.94 48.79
Where: TFault is measured by msec., and these equations have some errors with respect to exact values of TFault
ISSN: 2088-8708
IJECE Vol. 6, No. 3, June 2016 : 1305 – 1318
1314
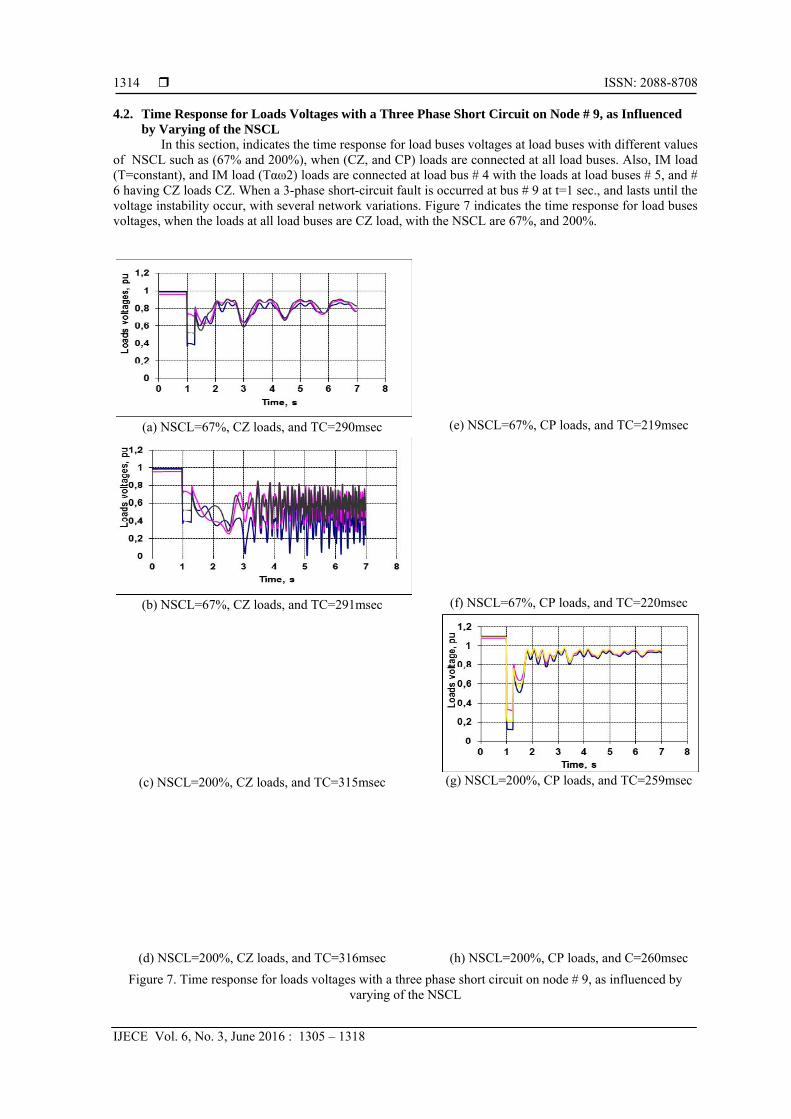
4.2. Time Response for Loads Voltages with a Three Phase Short Circuit on Node # 9, as Influenced by Varying of the NSCL
In this section, indicates the time response for load buses voltages at load buses with different values of NSCL such as (67% and 200%), when (CZ, and CP) loads are connected at all load buses. Also, IM load (T=constant), and IM load (Tαω2) loads are connected at load bus # 4 with the loads at load buses # 5, and # 6 having CZ loads CZ. When a 3-phase short-circuit fault is occurred at bus # 9 at t=1 sec., and lasts until the voltage instability occur, with several network variations. Figure 7 indicates the time response for load buses voltages, when the loads at all load buses are CZ load, with the NSCL are 67%, and 200%.
(a) NSCL=67%, CZ loads, and TC=290msec (e) NSCL=67%, CP loads, and TC=219msec
(b) NSCL=67%, CZ loads, and TC=291msec (f) NSCL=67%, CP loads, and TC=220msec
(c) NSCL=200%, CZ loads, and TC=315msec (g) NSCL=200%, CP loads, and TC=259msec
(d) NSCL=200%, CZ loads, and TC=316msec (h) NSCL=200%, CP loads, and C=260msec
Figure 7. Time response for loads voltages with a three phase short circuit on node # 9, as influenced by varying of the NSCL

IJECE ISSN: 2088-8708
Voltage Instability of Initiation Fault Duration as Influenced by Nodes Short Circuit .... (Youssef Mobarak)
1315
(a) NSCL=67%, IM (T=const.), TC=252msec (e) NSCL=67%, IM(Tαω2), TC=267msec
(b) NSCL= 67%, IM (T=const), TC=253msec (f) NSCL=67%, IM (Tαω2), TC=268msec
(c) NSCL=200%, IM (T=const.) TC=295msec (g) NSCL=200%, IM (Tαω2), TC=309msec
(d) NSCL=67%, IM (T=constant) TC=296msec (h) NSCL=200%, IM (Tαω2), TC=310msec
Figure 8. Time response for loads voltages with a three phase short circuit on node # 9, as influenced by varying of the NSCL

ISSN: 2088-8708
IJECE Vol. 6, No. 3, June 2016 : 1305 – 1318
1316
Where when the NSCL is 67% with the fault duration equal 290 msec, the system is stable and when the fault duration equal 291 msec, the system becomes unstable, as shown in Figure 7 (a), (b) respectively. When the NSCL is 200% with the fault duration equal 315 msec., the system is stable and when the fault duration equal 316 msec., the system becomes unstable, as shown in Figure 7 (c), (d) respectively. Also, Figure 7 indicates the time response for load buses voltages, when the loads at all load buses are CP load, with the NSCL are 67%, and 200%, where, when the NSCL is 67% with the fault duration equal 219 msec., the system is stable and when the fault duration equal 220 msec., the system starts to be unstable, as shown in Fig. 7 (e, f) respectively, and when the NSCL is 200% with the fault duration will jump to 259 msec., the system is stable and when the fault duration equal 260 msec., the system becomes unstable, as shown in Fig. 7 (g, h) respectively.
Figure 8 indicates the time response for load buses voltages, when the load at load bus (4) is IM load (T=constant) with the loads at load buses (5), and (6) are CZ loads, with the NSCL are 67%, and 200%, where, when the NSCL is 67% with the fault duration equal 252 msec., the system is stable and when the fault duration equal 253 msec., the system becomes unstable, as shown in Figure 8 (a), (b) respectively. For NSCL is 200% with the fault duration equal 295 msec., the system is stable and when the fault duration equal 296 msec., the system becomes unstable, as shown in Figure 8 (c), (d) respectively. Also, Figure 8 indicates the time response for load buses voltages, when the load at load bus (4) is IM load (Tαω2) with the loads at load buses (5), and (6) are CZ loads, with the NSCL are 67%, and 200%, where, when the NSCL is 67% with the fault duration equal 267 msec., the system is stable and when the fault duration equal 268 msec., the system becomes unstable, as shown in Figure 8 (e), (f) respectively, and when the NSCL is 200% with the fault duration equal 309 msec., the system is stable and when the fault duration equal 310 msec., the system becomes unstable, as shown in Figure 8 (g), (h) respectively, where Tc refers to fault duration. 5. CONCLUSION
The fault duration which cause initiation of voltage instability increases by increasing the percentage of the NSCL for each types of loads, with a 3-phase short-circuit at node # 9. This is due to presence of several lines in parallel with higher short-circuit conditions. When the load is CZ load connected at all load buses, the fault duration which cause voltage instability is greater than the fault duration which cause voltage instability when the load is CI load, and both of them are greater than the fault duration which cause voltage instability when the load is CP load. When the load is an IM is connected at certain load bus, with the load at reminder load buses are CZ loads, the IM load type is (Tαω2), the fault duration which cause voltage instability is greater than the fault duration which cause voltage instability while the IM load type is at (Tαω), and both of them are greater than the fault duration which cause voltage instability when IM load type is (T=constant). A general formula for the fault duration for voltage instability initiation as a function in the network NSCL is deduced for all types of adopted loads. REFERENCES [1] Survey of the voltage collapse phenomenon, “North American Electric Reliability Council Report,” 1991. [2] P. Kundur, “Power System Stability and Control,” McGraw Hill, 1994. [3] C. W. Taylor, “Power System Voltage Stability,” New York: McGraw-Hill, 1994. [4] P. Kundur, et al., “Definition and Classification of Power System Stability,” IEEE/CIGRE Joint Task Force on
Stability Terms and Definitions, 1994. [5] R. A. Schlueter, et al., “Methods for determining proximity to voltage collapse,” IEEE Transactions on Power
Systems, vol. 6, pp. 285- 292, 1991. [6] T. Lie, et al., “Method of identifying weak transmission network stability boundaries,” IEEE Transactions on
Power Systems, vol. 8, pp. 293-301, 1993. [7] R. A. Schlueter, “A voltage stability security assessment method,” IEEE Transactions on Power Systems, vol. 13,
pp. 1423-1438, 1998. [8] C. A. Aumuller and T. K. Saha, “Determination of Power System Coherent Bus Groups by Novel Sensitivity-Based
Method for Voltage Stability Assessment,” IEEE Transactions on Power Systems, vol. 18, pp. 1157-1164, 2003. [9] L. Sandberg, et al., “Security assessment against voltage collapse based on real-time data including generator
reactive capacity,” CIGRE, Paper 39/11-03, 1994. [10] W. R. Lachs and D. Sutanto, “Rotor heating as an indicator of system voltage instability,” IEEE Trans. Power
Systems, vol. 10, pp. 175–181, 1995. [11] C. W. Taylor and R. Ramanathan, “BPA reactive power monitoring and control following the August 10, 1996
power failure,” Symp. Specialists Elect. Oper. Expansion Planning, Salvador, Brazil, 1998. [12] IEEE/CIGRE Joint Task Force on Stability Terms and Definitions, “Definition and Classification of Power System
Stability,” IEEE Trans. on Power Systems, vol/issue: 19(3), pp. 1387-1401, 2004.
IJECE ISSN: 2088-8708
Voltage Instability of Initiation Fault Duration as Influenced by Nodes Short Circuit .... (Youssef Mobarak)
1317
[13] C. A. Anyanwu, “State of Power System Operation and Planning the Nigerian Power System,” International Conference on Power Systems Operations and Planning (ICPSOP), Universidade Jean Piaget, Praia, SA, pp. 103–108, 2005.
[14] A. M. Hemeida, et al., “Fault Duration for Voltage Instability and Voltage Collapse Initiation as Influenced by Load Window,” International Review on Modelling and Simulations (IREMOS), Praise Worthy Prize, vol/issue: 3(5), pp. 911-917, 2010.
[15] G. Andersson, et al., “Causes of the 2003 Major Grid Blackouts in North America and Europe, and Recommended Means to Improve System Dynamic Performance,” Administrative Committee of the Power System Dynamic Performance Committee, IEEE Power Engineering Society, 2003.
[16] Youssef A. M. and M. M. Hussein, “Voltage Instability and Voltage Collapse as Influenced by Cold Inrush Current,” ICGST International Journal on Automatic Control and System Engineering (ACSE), vol/issue: 12(1), pp. 21-30, 2012.
[17] P. Kaur, et al., “Review and Analysis of Voltage Collapse in Power System,” International Journal of Scientific and Research, vol/issue: 2(1), 2012.
[18] Z. Jia and Jeyasurya B., “Contingency Ranking for On-Line Voltage Stability Assessment,” IEEE Transactions on Power Systems, vol/issue: 15(3), 2000.
[19] C. Canizares, et al., “Comparison of Voltage Security Constrained Optimal Power Flow Techniques,” IEEE –PES Summer Meeting, Vancouver, BC, 2001.
[20] L. Qi, et al., “Applying a STATCOM for Stability Improvement to an Existing Wind Farm With Fixed-Speed Induction Generators,” IEEE/PES, 2008.
[21] W. Qiao, et al., “Real-Time Implementation of a STATCOM on a Wind Farm EquipedWith Doubly Fed Induction Generators,” IEEE Ttrans. On Industry Applications, vol/issue: 45(1), 2009.
[22] W. Qiao, et al., “Coordinated Reactive Power Control of a Large Wind Farm and a STATCOM Using Heuristic Dynamic Programming,” IEEE Ttrans. On Energy Conversion, vol/issue: 24(2), 2009.
[23] A. M. Hemeida, et al., “Fault Duration for Voltage Instability and Voltage Collapse Initiation as Influenced By Duration of Cold Inrush Current Magnitudes,” Al-Azhar University Engineering Journal (JAUES), vol/issue: 2(5), pp. 551-562, 2007.
[24] J. V. Rao and S. Sivanagaraju, “Voltage regulator placement in radial distribution system using discrete particle swarm optimization,” International Review of Electrical Engineering, vol. 3, pp. 525-531, 2008.
[25] W. Nakawiro and I. Erlich, “Online voltage stability monitoring using artificial neural network,” 3rd International Conference on Electric utility Deregulation and Restructuring and Power technologies, Nanjing, China, April 6–9, 2008.
[26] P. Li, et al., “Research on order reduction of power system modeling for dynamic voltage stability analysis,” IEEE Transmission and Distribution Conference and Exposition, pp. 1-5, 2010.
[27] Annual Report, “Egyptian Electricity Holding Company,” Ministry of Electricity and Energy, 2008-2009. [28] S. Sreejith, et al., “Power flow analysis incorporating firing angle model based TCSC,” 5th International
Conference on Industrial and Information Systems (ICIIS 2010), India, Jul 29 – Aug 01, pp. 496-501, 2010. [29] T. Datta, et al., “An Integrated model of modern power system in the presence of TCSC and STATCOM
controllers to assess global voltage stability,” International Conference on Power Electronics, Drives and Energy Systems (PEDES), New Delhi, India, pp. 1-6, 2010.
[30] A. Adamczyk, et al., “Overview of FACTS devices for wind power plants directly connected to the transmission network,” Industrial Electronics (ISIE), IEEE International Symposium on 4-7 July 2010, pp. 3742-3748.
[31] S. Meikandasivam, et al., “Behavioral study of TCSC device – A MATLAB/Simulink implementation,” International Journal of Electronics and Electrical Engineering, vol/issue: 2(10), pp. 151– 161, 2011.
[32] B. Singh, “Utilities of differential algebraic equations (DAE) model of SVC and TCSC for operation, control, planning & protection of power system environments,” International Journal of Reviews in Computing, vol. 7, pp. 55– 63, 2011.
[33] Y. A. Mobarak, “Fault Duration for Voltage Instability and Voltage Collapse Initiation as Influenced by Generator Voltage Magnitudes (GVM),” Journal of Engineering Sciences (JES), Assiut University, Egypt, vol/issue: 40(3), 2012.
[34] Mahmoud A. A., et al., “Optimal Allocation of FACTS Devices in Electrical Power Systems: A Genetic Algorithm Based Approach,” LAP LAMBERT Academic Publishing, 2013.
[35] A. Alshehri, et al., “Energy-conversion measures in the industries of Saudi Arabia and development of methodology forcertification of energy personnel in the Kingdom,” Energy Policy, vol. 64, pp. 203-208, 2014.
[36] A. Sode, et al., “A Maximum Loading Margin Method for Static Voltage Stability in Power Systems,” IEEE Trans. On Power Systems, vol/issue: 21(2), pp. 799-808, 2006.
[37] Badru H. C. and C. W. Taylor, “Voltage Stability Analysis - V-Q Power Flow Simulation versus Dynamic Simulation,” IEEE Trans. On Power Systems, vol/issue: 15(4), pp. 1354-1359, 2000.
[38] A. M. Hemeida, and M. M. Hussien, “Fault Duration for Voltage Collapse Initiation as a Node Short Circuit Levels (NSCL),” International Review on Modelling & Simulations, 2012.
[39] Q. H. Li, “A New Pole-Placement Method for Excitation Control Design to Damp SSR of a Nonidentical Two-Machine System,” IEEE Power Engineering Review, 1989.
[40] M. K. Nigam and V. K. Sethi, “Optimal Location of Distributed Generation and its Impacts on Voltage Stability,” International Journal of Electrical and Computer Engineering (IJECE), vol/issue: 6(2), pp. 504~511, 2016.
ISSN: 2088-8708
IJECE Vol. 6, No. 3, June 2016 : 1305 – 1318
1318
[41] A. Y. Abdelaziz, “Dynamic load modeling of an Egyptian primary distribution system using neural networks,” International Journal of Electrical Power and Energy Systems, 2007.
[42] L. Lin, et al., “Clustering wind turbines for a large wind farm using spectral clustering approach based on diffusion mapping theory,” IEEE International Conference on Power System Technology, 2012.
[43] M. Z. El-Sadek, “Load representation for steadystate voltage stability studies,” Electric Power Systems Research, 1997.
[44] G. Radman, “A study of multivariable supplementary power system stabilizers,” Proceedings of the 37th Annual North American Power Symposium 2005, 2005.
[45] M. A Tabrizi, “Participation of nonconventional energy resources in power system frequency control,” Proquest, 2014.
[46] Y. A. Mobarak, “Voltage Collapse Prediction for Egyptian Interconnected Electrical Grid EIEG,” International Journal on Electrical Engineering and Informatics, vol/issue: 7(1), pp. 79-88, 2015.
[47] A. Sassi and A. Abdelkrim, “New Stability Conditions for Nonlinear Systems Described by Multiple Model Approach,” International Journal of Electrical and Computer Engineering (IJECE), vol/issue: 6(1), pp. 177~187, 2016.
[48] H. Marefatjou and M. Sarvi, “Power Flow Study and Performance of STATCOM and TCSC in Improvement Voltage Stability and Loadability Amplification in Power System,” International Journal of Applied Power Engineering (IJAPE), vol/issue: 2(1), pp. 15-26, 2013.
[49] Y. Tao, et al., “The Calculation of Voltage Collapse Point by Introducing Branch Current,” TELKOMNIKA Indonesian Journal of Electrical Engineering, vol/issue: 12(2), pp. 1077-1085, 2014.
[50] Y. A. Mobarak, “Effects of the Droop Speed Governor and Automatic Generation Control AGC on Generator Load Sharing of Power System,” International Journal of Applied Power Engineering (IJAPE), vol/issue: 4(3), pp. 21-30, 2015.
BIOGRAPHIES OF AUTHORS
Youssef A. Mobarak was born in Luxor, Egypt in 1971. He received his B.Sc. and M.Sc. degrees in Electrical Engineering from Faculty of Energy Engineering, Aswan University, Egypt, in 1997 and 2001 respectively and Ph.D. from Faculty of Engineering, Cairo University, Egypt, in 2005. He joined Electrical Engineering Department, Faculty of Energy Engineering, Aswan University as a Demonstrator, as an Assistant Lecturer, and as an Assistant Professor during the periods of 1998–2001, 2001–2005, and 2005–2009 respectively. He joined Artificial Complex Systems, Hiroshima University, Japan as a Researcher 2007–2008. Also, he joined King Abdulaziz University, Rabigh, Faculty of Engineering 2010 to present, and Associate Professor Position at April 2014 up to date. His research interests are power system planning, operation, and optimization techniques applied to power systems. Also, his research interests are Nanotechnology materials via addition nano-scale particles and additives for usage in industrial field.
Mahmoud M. Hussein was born in Egypt. He received his B.Sc. and M.Sc. degrees in Electrical Engineering from South Valley University, Aswan, Egypt, in 2000 and 2006 respectively. He is currently a Ph.D. student in Minia University, Egypt, from 2008. He joined Electrical Engineering Department, High Institute of Energy, South Valley University as a Demonstrator, and as an Assistant Lecturer during the periods of 2002–2006, 2006–2008. He joined Aswan Power Electronics Applications Research Center, South Valley University as an Assistant Researcher 2009-2011, Also, he is joining Graduation School of Engineering and Science, Ryukyus University, Okinawa, Japan, as a Researcher 2011 to present. His special fields of interests include distributed generation, renewable energy, power system planning, power quality, and reliability.


![Social-Cognitive Predictors of Exclusive Breastfeeding ... · breastfeeding initiation, methods and duration [7, 10–13]. Studies evaluating these aspects are well documented in](https://static.fdocuments.us/doc/165x107/60a83e6704dd6b42b8214999/social-cognitive-predictors-of-exclusive-breastfeeding-breastfeeding-initiation.jpg)