Volt VAR Control Optimization Bob Uluski Quanta Technology
68
Volt ‐ VAR Control & Optimization Bob Uluski Quanta Technology © 2010 Quanta Technology LLC
Transcript of Volt VAR Control Optimization Bob Uluski Quanta Technology

Volt ‐ VARControl & Optimization
Bob UluskiQuanta Technology
© 2010 Quanta Technology LLC

What is Volt‐VAR control?• Volt‐VAR control (VVC) is a fundamental operating requirement of all
electric distribution systems
• The prime purpose of VVC is to maintain acceptable voltage at all points along the distribution feeder under all loading conditions
LTC
Primary Feeder
SUBSTATION
Primary Feeder
Secondary
Distribution Transformer
Service Drop WiresFirst
Customer
Last Customer
Customer
Voltage
3 volts Primary
2 volts distribution transformer
1 volt secondary
1 volt service drop
122
119117116
First Customer
© 2010 Quanta Technology LLC
Distance
115 Last CustomerANSI C84.1 Lower Limit (114 volts)114

What is Volt‐VAR control?• Without VVC:
– Voltage might be okay during average load
Transformer T P i i
120V
126VTap Position
114V
D�������
S���������E�� �� F�����
F���� C������� L��� C�������
© 2010 Quanta Technology LLC
��� S���������

What is Volt‐VAR control?• Without VVC:
– voltage might droop below the minimum acceptable level for some customers during heavy load periods
Transformer T P i i
120V
126VTap Position
114VLow Voltage
D�������
S���������E�� �� F�����
F���� C������� L��� C�������
© 2010 Quanta Technology LLC
��� S���������

What is Volt‐VAR control?• Without VVC:
– Could raise the manual tap setting on the substation transformer to correct the peak load problemcorrect the peak load problem
Transformer Tap Position
120V
126V
114V
D�������
S���������E�� �� F�����
F���� C������� L��� C�������
© 2010 Quanta Technology LLC
��� S���������

What is Volt‐VAR control?• Without VVC:
– But when feeder loading in light, high voltage could be a problem at the substation end of the feederproblem at the substation end of the feeder
Transformer Tap Position High Voltage
120V
126V
114V
D�������
S���������E�� �� F�����
F���� C������� L��� C�������
© 2010 Quanta Technology LLC
��� S���������

What is Volt‐VAR control?• Without VVC:
– But when feeder loading in light, high voltage could be a problem at the substation end of the feeder
N��� � V����VAR
C������ S����� ����
�������� ������������� ��
�������� ���� ����������be a problem at the substation end of the feeder
Transformer Tap Position
120V
126V
114V
D�������
S���������E�� �� F�����
F���� C������� L��� C�������
© 2010 Quanta Technology LLC
��� S���������
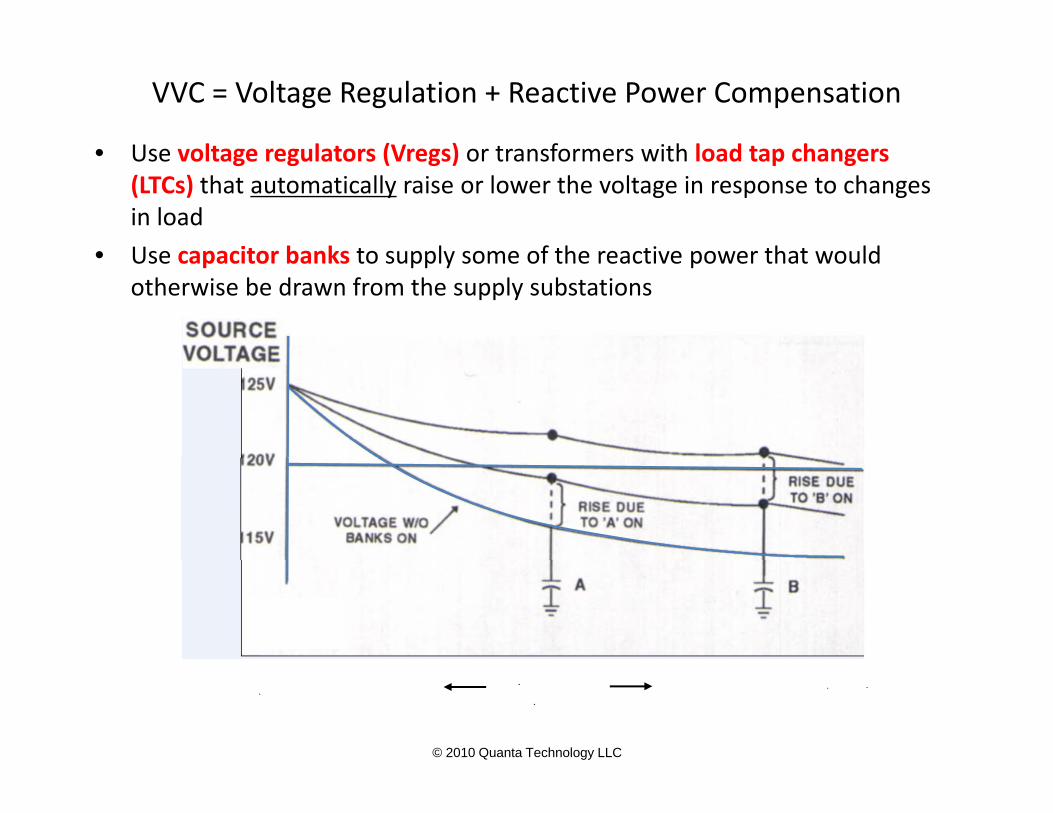
VVC = Voltage Regulation + Reactive Power Compensation
• Use voltage regulators (Vregs) or transformers with load tap changers• Use voltage regulators (Vregs) or transformers with load tap changers (LTCs) that automatically raise or lower the voltage in response to changes in load
• Use capacitor banks to supply some of the reactive power that would• Use capacitor banks to supply some of the reactive power that would otherwise be drawn from the supply substations
© 2010 Quanta Technology LLC
D�������
���� S���������
S���������
E�� �� F�����

VVC in Today’s Operating Environment(and Tomorrow’s Operating Environment Too!)
• Maintaining the status quo no longer acceptable
• Utilities are seeking to do more with VVC than just keeping voltage within the allowable limits
S t ti i ti i i t t t f th l• System optimization is an important part of the normal operating strategy under smart grid
• As penetration of intermittent renewable generating As penetration of intermittent renewable generatingresources grows in future, high‐speed dynamic volt VAR control will play a significant role in maintaining power quality and voltage stability on the distribution feedersquality and voltage stability on the distribution feeders
© 2010 Quanta Technology LLC

Volt‐VAR Control in a Smart Grid World
• Expanded objectives for Volt‐VAR control include– Basic requirement – maintain acceptable voltageBasic requirement maintain acceptable voltage
– Support major “Smart Grid” objectives:• Accomplish energy conservation
ff ( d h l l )• Improve efficiency (reduce technical losses)
• Promote a “self healing” grid (VVC plays a role in maintaining voltage after “self healing” has occurred)
• Enable idespread deplo ment of Distrib ted generation Rene ables• Enable widespread deployment of Distributed generation, Renewables, Energy storage, and other distributed energy resources
© 2010 Quanta Technology LLC

Requirements for the “Ideal” Volt‐VAR System
• Maintain Acceptable Voltage Profile at all points along the distribution feeder under all loading conditions
• Maintain Acceptable Power Factor under all loading conditions
• Provide Self Monitoring – alert dispatcher when a volt‐VAR device f ilfails
• Allow Operator Override during system emergencies
• Work correctly following Feeder ReconfigurationWork correctly following Feeder Reconfiguration
• Accommodate Distributed Energy Resources
• Provide Optimal Coordinated Control of all Volt VAR devices
• Allow Selectable Operating Objectives as different needs arise
© 2010 Quanta Technology LLC

Approaches to Volt VAR ControlApproaches to Volt VAR Control
• Traditional ApproachTraditional Approach
DLA Master Station
Switched Capacitor Bank
• SCADA Volt VARDistribution
SCADA
Distribution Power Flow
p
• SCADA Volt VAR
• Integrated Volt VAR
IVVCApplication
Substation RTU
Line Regulator
• Integrated Volt VARSubstationCapacitor Bank
Substation TransformerWith Load
Tap Changer
© 2010 Quanta Technology LLC

Traditional Volt‐VAR Control
Current/VoltageSensor
CapacitorBank
Distribution Primary LineCurrent/Voltage
Sensor
Voltage R l tBank
"Local" Current/Voltage
Measurements On/Off Control Command
Regulator
"Local" Current/Voltage
Measurements On/Off Control Command
Standalone Controller
CommandSignal Standalone
Controller
CommandSignal
• Volt‐VAR flows managed by individual, independent, standalone volt‐VAR regulating devices:
Substation transformer load tap changers (LTCs)– Substation transformer load tap changers (LTCs)– Line voltage regulators
– Fixed and switched capacitor banks
© 2010 Quanta Technology LLC

Limitations of Traditional ApproachLimitations of Traditional Approach
• Power factor correction/loss reductionPower factor correction/loss reduction– Many traditional cap bank controllers have voltage control (switch on when voltage is low)control (switch on when voltage is low)
• Reactive power controllers available, but expensive (need to add CT)
• Good at maintaining acceptable voltage
• Good at PF correction during peak load seasons may not come on at all• Good at PF correction during peak load seasons –may not come on at all during off peak seasons
• Result is that PF is usually great (near unity) during peak load periods and low during off peak seasons (higher electrical losses)g p ( g )
© 2010 Quanta Technology LLC

Monitoring of Switched Capacitor Bank fPerformance
• Switched capacitor banks are notorious forSwitched capacitor banks are notorious for being out of service due to blown fuses, etc.
• With traditional scheme switched capacitor• With traditional scheme, switched capacitor bank could be out of service for extended periods without operator knowingperiods without operator knowing– Losses higher if cap bank is out of service
R i i i d d?– Routine inspections needed?
© 2010 Quanta Technology LLC

Traditional Voltage Regulation Strategy
• “Line Drop Compensation” accounts for varying load
Wh l d th h ltLTC
– When load through voltage regulator is high, voltage dropalong the feeder will be high
LTC i lt t
SUBSTATION
Primary Feeder
Secondary
Distribution Transformer
Service Drop WiresFirst
– LTC raises voltage to “compensate”
• This approach works well when ll f d l d th h th
Last Customer
Customer
Voltage
all feeder load passes through the voltage regulator
3 volts Primary
2 volts distribution transformer
1 volt secondary
1 volt service drop
122
119117116115
First Customer
Last Customer
Distance
Last CustomerANSI C84.1 Lower Limit (114 volts)114
© 2010 Quanta Technology LLC

Voltage Regulation Problem When Large DG Unit is Introduced
• With a large DR out on the feeder load throughthe feeder, load through Vreg will be reduced
• Vreq thinks load is light on the feeder
• Vreg lowers tap setting to avoid “light load, high voltage” condition
• This action makes theThis action makes the actual “heavy load, low voltage” condition even worse
• DMS that accounts for• DMS that accounts for DG affects can make the proper raise/lower decision based on total feeder conditions
© 2010 Quanta Technology LLC
feeder conditions

Voltage Regulation During Alternate Feed Configuration
• Older style voltage regulators were often designed to handle a purely radial situation – power flow always from the same direction (from the substation)
• Older style Vregs may not work correctly if power flow is from the opposite direction (see example)
– Could raise voltage when during light load, creating high voltage situation– Could lower voltage when during heavy load, creating low voltage situation
• Feeder reconfiguration may become a more frequent occurrence due to– Load transferred to another feeder during service restoration (FLISR)g ( )
– Optimal network reconfiguration to reduce losses (DMS application)
Vreg not bi-directional
© 2010 Quanta Technology LLC
Incorrect Operation!

Use of “Bidirectional” Voltage Regulator
• Can Use “Bidirectional” voltage regulator controller to handle feeder reconfiguration
• These make the opposite tap position movement when flow is from the reverse directiondirection
Vreg bi-directional
© 2010 Quanta Technology LLC
Correct Operation!

Reverse Power Flow with DGReverse Power Flow with DG• A DG of sufficient size can reverse
power flow• Bidirectional Voltage Regulator
Vreg bi-directional
g gmay not work correctly
• DG does not typically provide a source strength stronger than the substation
Direction of Power Flow
1.0 1.0
Normal Load
DG
substation. – Substation side voltage does not
change, – DG side changesE ith Bidi ti l V
Direction of Power Flow
Normal Load
VsVl
Vl = Vs
• Even with Bidirectional Vreg, could wind up lowering the voltage on a portion or the feeder during heavy load
diti
.901.0Increased
Load
Vs VlVl = Vs x .90
DG
conditions• Conclusion: Need a more
sophisticated voltage control strategy when DG penetration is
Vl
Incorrect Operation!
© 2010 Quanta Technology LLC
large enough to reverse power flow

Limitations of Traditional Volt‐VAR Control
Current/VoltageSensor
CapacitorBank
Distribution Primary LineCurrent/Voltage
Sensor
Voltage R l tBank
"Local" Current/Voltage
Measurements On/Off Control Command
Regulator
"Local" Current/Voltage
Measurements On/Off Control Command
Standalone Controller
CommandSignal Standalone
Controller
CommandSignal
• The system is not continuously monitored• The system lacks flexibility to respond to changing conditions out on the
distribution feeders can misoperate following automatic reconfigurationdistribution feeders – can misoperate following automatic reconfiguration• System operation may not be “optimal” under all conditions
• Cannot override traditional operation during power system emergencies
© 2010 Quanta Technology LLC
• System may misoperate when modern grid devices (e.g., distributed generators) are present – reverse power flow from DG can “trick” standalone controller to believe feeder has been reconfigured

“Scorecard” for Traditional Volt VAR
V lt VAR R i t Traditional Volt-Volt VAR Requirements Traditional VoltVAR
Acceptable Voltage Profile XAcceptable Power Factor XSelf MonitoringOperator OverridepFeeder Reconfiguration SmartGrid DevicesOptimal Coordinated ControlOptimal Coordinated ControlSelectable Operating Objectives
© 2010 Quanta Technology LLC

“SCADA” Controlled Volt‐VARSCADA Controlled Volt VAR
• Volt‐VAR power apparatus monitored and controlled by p pp ySupervisory Control and Data Acquisition (SCADA)
• Volt‐VAR Control typically handled by two separate (i d d t) t(independent) systems:– VAR Dispatch – controls capacitor banks to improve power factor,
reduce electrical losses, etc
– Voltage Control – controls LTCs and/or voltage regulators to reduce demand and/or energy consumption (aka, Conservation Voltage Reduction)
• Operation of these systems is primarily based on a stored set of predetermined rules (e.g., “if power factor is less than 0 95 then switch capacitor bank #1 off”)
© 2010 Quanta Technology LLC
0.95, then switch capacitor bank #1 off )

Overall Objective of VAR dispatchOverall Objective of VAR dispatch
M������� ����� ������
�� ����� �� ����� �� ���
���� ��� �� ��� ������
������� ������� �������
����� ������
© 2010 Quanta Technology LLC

VAR Dispatch Components
• Switched & fixed feeder capacitor banks
• Capacitor bank control interfacep
• Communications facility ‐ one‐way paging or load management communications is sufficient
• Means of monitoring 3‐phase var flow at the substation
© 2010 Quanta Technology LLC
substation
• Master station running VAR dispatch software

Monitoring Real and Reactive Power Flow
© 2010 Quanta Technology LLC

VAR Dispatch Rules Applied
© 2010 Quanta Technology LLC

Real and Reactive Load Increases
© 2010 Quanta Technology LLC

Reactive Power Flow Exceeds Threshold
© 2010 Quanta Technology LLC

Capacitor Switched On
© 2010 Quanta Technology LLC

Change in Reactive Power Detected
© 2010 Quanta Technology LLC

Change in Reactive Power Detected
Change detected by Substation
RTU
© 2010 Quanta Technology LLC
RTU

Benefits of VAR Dispatch vs Traditional
• Self Monitoring
• Operator override capability
© 2010 Quanta Technology LLC
• Some improvement in efficiency

Objectives for SCADA Voltage Control
• Maintain acceptable voltage at all locationsMaintain acceptable voltage at all locations under all loading conditions
• Operate at as low as voltage as possible to• Operate at as low as voltage as possible to reduce power consumption (aka Conservation Voltage Reduction)Voltage Reduction)
© 2010 Quanta Technology LLC

Conservation Voltage Reduction
© 2010 Quanta Technology LLC
Source: Tom Wilson PCS Utilidata

Benefits of Voltage Reduction for Various Types of Loads
• Constant impedance (power consumed is proportional to voltage squared)
– Incandescent lighting, resistive water heaters, stovetop and over cooking loads
• Constant power (demand is constant regardless of voltage)
– Electric motors, regulated power supplies
• Constant current (demand is proportional to voltage) (few of this type of load)
– Welding units, smelting, electroplating processes
• Feeder load is always a mix of the different load types
• Rules of thumb:• Rules of thumb:– 60/40 split (constant power/constant
impedance) for summer peak loads
– 40/60 split for winter peak loads
– 80/20 for industrial areas
– 70/30 for residential load in residential with summer peaking
– 30/70 for res load with winter peaking
– Commercial loads: 50/50 or 60/40
• Source: Power Distribution Planning
© 2010 Quanta Technology LLC
Source: Power Distribution Planning Reference Book”, H. Lee Willis

Benefits of Voltage Reduction
• Works best with resistive load (lighting and resistive heating) because power drawn decreases with the voltage squared .
P = V 2 ÷ RConstant
Impedance load
• Devices that operate using a thermostatgenerally do not reduce energy – the devices
© 2010 Quanta Technology LLC
just run longer

Benefits of Voltage Reduction
Efficiency improve for small voltage reduction
Incremental change in efficiency drops off and then turns negative as voltage is reduced
Negative effect occurs sooner for heavily loaded motors
© 2010 Quanta Technology LLC

Benefits of Voltage Reduction on motors• Motor loss reduction is a balancing act between magnetic
effects and electrical effects:– Magnetic losses (Iron Losses) are reduced when voltage is lowered
– Motor current increases as voltage is decreased (constant power effect) – but if motor loading is light, current increases gradually
– Initial effect is reduced energy assumption, but as voltage is deceased further, copper loss increases and motor becomes less efficient
“Power Savings Obtained from Supply VoltageVariation on Squirrel Cage Induction Motors”
C. D. Pitis, BC Hydro Power Smart, and M. W. Zeller, BC Hydro Power Smart
© 2010 Quanta Technology LLC
BC Hydro Power Smart

Emerging Load Characteristics• Digital Devices:
– Typically have a universal power supply covering a wide‐range of input voltage variations (e.g.: LCD/Plasma TV & VCRs = 80‐240 V)g ( g )
– Constant power behavior
• Electric Vehicle Chargers:C– Constant power
– Constant Voltage (regulated output, during maintenance charge)
– Constant current (Low state of charge and fast charging type) NiMH Charging Profile
© 2010 Quanta Technology LLC
Example charging curves for two EV chargers

Voltage Control ComponentsVoltage Control Components
EOF V ltEOF Voltage measurement126V
Actual
114V
116VCVR
Cutoff
Voltage
EOF = End of feeder
© 2010 Quanta Technology LLC

EOF Voltage Below Voltage Control Threshold (No Control Actions)(No Control Actions)
EOF V ltVoltage Control
ProcessorComm
Interface
EOF Voltage measurement126V
Actual
LTCSubstation
RTUVolt Meter
or AMRComm Interface
LTCController
Substation Transformer
114V
116VCVR
Cutoff
Voltage
OO
Reactive Power (MVAR)
Real Power (MW) End ofFeeder
OOOOOO
OO Voltage Transformer
Reactive Power (MVAR)EOF = End of feeder
© 2010 Quanta Technology LLC

EOF Voltage Above Voltage Control h h ldThreshold
EOF V ltVoltage Control
ProcessorComm
Interface
EOF Voltage measurement126V
Actual Voltage
LTCSubstation
RTUVolt Meter
or AMRComm Interface
LTCController
Substation Transformer
114V
116VCVR
Cutoff
OOEnd ofFeeder
OOOOOO
OO
EOF = End of feeder
© 2010 Quanta Technology LLC

EOF Voltage Above Voltage Control Threshold (lower tap setting)(lower tap setting)
EOF V lt
Voltage Control Processor
Comm Interface
Lower Tap
EOF Voltage measurement126V
Actual Voltage
LTCSubstation
RTUVolt Meter
or AMRComm Interface
LTCController
Substation Transformer
Setting
114V
116VCVR
Cutoff
OOEnd ofFeeder
OOOOOO
OOTransformer
• Self Monitoring
• Operator override capability
© 2010 Quanta Technology LLC
• CVR function not available with traditional

CVR based on Voltage measurementsCVR based on Voltage measurements
• Hydro Quebec Results:– Simple but not fully effective. Demonstration project gained
only 30% of the estimated energy consumption.only 30% of the estimated energy consumption.• Volt meters not really at the end of the feeders. Volt meters installed only on 3 phases circuits. Targets need to cover also the worst case voltage drop of the single phase networks.
• Network topology during the demonstration project (1 year average) was not in its normal state 40% of the time.
Volt Meter
Communication network
Substation
End of Feeder
Regulationllcontroller
A local regulation controller monitors the end of feeder’s voltage and
© 2010 Quanta Technology LLC
Source: ”Volt-VAR Control Implementation at Hydro Québec”; Presented by Herve Delmas to IEEE Smart Distribution Volt Var
Task Force, January 2010
A local regulation controller monitors the end of feeder s voltage and sets the tap to maintain this voltage at 115V.

Lack of Coordination between Volt and lVAR control
• Switching a capacitor bank on raises theSwitching a capacitor bank on raises the voltage, which:– Increases no load losses in distribution– Increases no‐load losses in distribution transformers
– Increases energy consumption and possiblyIncreases energy consumption and possibly demand
• Lowering the voltage through CVR:Lowering the voltage through CVR:– Makes the capacitor banks less effective (lower voltage means less capacitive current delivered by
© 2010 Quanta Technology LLC
voltage means less capacitive current delivered by the cap banks)

SCADA Volt VAR Summaryy• Does not adapt to changing feeder configuration (rules are fixed in advance)configuration (rules are fixed in advance)
• Does not adapt to varying operating needs(rules are fixed in advance)(rules are fixed in advance)
• Overall efficiency is improved versus traditional approach but is not necessarilytraditional approach, but is not necessarily optimal under all conditions
• Operation of VAR and Volt devices is not• Operation of VAR and Volt devices is not coordinated
• Does not adapt well to presence of modern
© 2010 Quanta Technology LLC
• Does not adapt well to presence of modern grid devices such as DG

Sample Calc: kWh Loss Savings Due to VAR DispatchVAR Dispatch
Sample Calculation 2: Savings Due to kWh Reduction Input Values: Target power factor (TPF) = 1 00 usefulTarget power factor (TPF) = 1.00 Average power factor (AVGPF) = .95 Peak load on feeder (PKLOAD) = 8,000 kilowatts Distribution losses (% of peak load) = 4.0% Average cost to purchase one kilowatt-hour = 0.04 $/kWh
useful formula
g p $ Annual savings per feeder = 8760 x .456 x DLOSS x PKLOAD x (1 – AVGPF2 / TPF2) x .04 kWh per year = 8760 x 0.456 x 4% x 8000 x (1 - .952 / 1.02) * .04
$ f = $4,985 per year per feeder
© 2010 Quanta Technology LLC

Sample Calculation: Demand Reduction Due to VAR DispatchDue to VAR Dispatch
Sample Calculation 3: Savings in Energy Supplier Demand ChargesSample Calculation 3: Savings in Energy Supplier Demand Charges Input Values: Target power factor (TPF) = 1.00g p ( )Power factor at peak load (PKPF) = .98 Peak load on feeder (PKLOAD) = 8,000 kilowatts Energy supplier demand charge (DEMCHG) = 20 $/kW
useful formula
Annual savings per feeder = (1/PKPF - 1/TPF) x 100 % x PKLOAD x DMDCHG = (1 / 0.98 – 1 / 1.00) x 100% x 8,000 x 20
$3 265 f d = $3,265 per year per feeder
© 2010 Quanta Technology LLC

Volt VAR “Scorecard”Volt VAR Scorecard
Volt-VAR Approach
Volt VAR Requirements Traditional Volt-VAR
SCADA Volt- VAR
A t bl V lt P fil X X
pp
Acceptable Voltage Profile X XAcceptable Power Factor X XSelf Monitoring XOperator Override XOperator Override XFeeder Reconfiguration SmartGrid DevicesOptimal Coordinated ControlSelectable Operating Objectives
© 2010 Quanta Technology LLC

Volt VAR Optimization (Centralized Approach)
• Develops and executes a coordinated “optimal” switching plan for all voltage control devices
• Uses optimal power flow program to decide what to• Uses optimal power flow program to decide what to do
• Achieves utility‐specified objective functions:Achieves utility specified objective functions:– Minimize distribution system power loss– Minimize power demand (sum of distribution power loss and
customer demand)customer demand)– Maximize revenue (the difference between energy sales and energy
prime cost)– Combination of the above
• Can bias the results to minimize tap changermovement and other equipment control actions that
ddi i l “ d ” h h i l
© 2010 Quanta Technology LLC
put additional “wear and tear” on the physicalequipment

Modeling Load Voltage Sensitivity
• Accurate load model for IVVC:
• Determine appropriate values for coefficients on above formula using field experiments andabove formula using field experiments and regression analysis
© 2010 Quanta Technology LLC

Volt VAR Optimization (VVO) System fi iConfiguration
Temp Changes
MDMSAMI Line Switch
Distribution System Model
Geographic Information
System (GIS)
Perm Changes
Dynamic Changes
Switched Cap
Bank
Distribution SCADA
On-Line Power Flow (OLPF)
IVVC Optimizing
Engine
Line Voltage
RegulatorDevelops a coordinated
“optimal”Substation RTU
Substation Transformer with TCUL
Substation Capacitor
B k
optimal switching plan for all voltage control
devices and executes the plan
© 2010 Quanta Technology LLC
with TCUL Bankexecutes the plan

Volt VAR Optimization (VVO) System Operation
Voltage Feedback
Temp Changes
MDMSAMI Line Switch
Switch Status
Voltage Feedback, Accurate load data
Bank voltage & status, switch control
Distribution System Model
Geographic Information
System (GIS)
Perm Changes
Dynamic Changes Switched
Cap Bank
switch control
Distribution SCADA
On-Line Power Flow (OLPF)IVVC requires real-
time monitoring & control of sub &
IVVC Optimizing
Engine
Line Voltage Regulator
Monitor & control tap
control of sub & feeder devices
Substation RTU
Substation Transformer with TCUL
Substation Capacitor
Bank Bank voltage & status
pposition, measure load
voltage and loadMonitor & control tap position, measure load
voltage and load
© 2010 Quanta Technology LLC
Bank voltage & status, switch control

Volt VAR Optimization (VVO) System Operation
Temp Changes
MDMSAMI Line Switch
Cuts, jumpers, manual switching
Real-Time Updates
Distribution System Model
Geographic Information
System (GIS)
Perm Changes
Dynamic Changes Switched
Cap Bank
Distribution SCADA
On-Line Power Flow (OLPF)Permanent asset changes
(line extension, d t )
IVVC Optimizing
Engine
Line Voltage Regulator
reconductor)
Substation RTU
Substation Transformer with TCUL
Substation Capacitor
Bank
IVVC requires an accurate, up-to date
electrical model
© 2010 Quanta Technology LLC
Bank

Volt VAR Optimization (VVO) System OperationOperation
Temp Changes
MDMSAMI Line Switch
Distribution System Model
Geographic Information
System (GIS)
Perm Changes
Dynamic Changes Switched
Cap Bank
Distribution SCADA
On-Line Power Flow (OLPF)
OLPF calculates losses, voltage
profile, etc
IVVC Optimizing
Engine
Line Voltage Regulator
PowerflowSubstation RTU
Substation Transformer with TCUL
Substation Capacitor
Bank
Powerflow Results
© 2010 Quanta Technology LLC
Bank

Volt VAR Optimization (VVO) System OperationOperation
Temp Changes
MDMSAMI Line Switch
Distribution System Model
Geographic Information
System (GIS)
Perm Changes
Dynamic Changes Switched
Cap Bank
Distribution SCADA
On-Line Power Flow (OLPF)
Determines optimal set of control
actions to achieve a desired objective
IVVC Optimizing
Engine
Line Voltage Regulator
Powerflow
j
Substation RTU
Substation Transformer with TCUL
Substation Capacitor
Bank
Powerflow Results
Alternative Switching
© 2010 Quanta Technology LLC
BankSwitching Plan

Volt VAR Optimization (VVO) System OperationOperation
Temp Changes
MDMSAMI Line Switch
Distribution System Model
Geographic Information
System (GIS)
Perm Changes
Dynamic Changes Switched
Cap Bank
Distribution SCADA
On-Line Power Flow (OLPF)
Determines optimal set of control
actions to achieve a desired objective
IVVC Optimizing
Engine
Line Voltage Regulator
j
Substation RTU
Substation Transformer with TCUL
Substation Capacitor
Bank
Optimal Switching
© 2010 Quanta Technology LLC
BankSwitching Plan

Impact of Voltage Reduction on Customers
• In most cases, voltage reduction does not impactIn most cases, voltage reduction does not impact customer equipment, but…..
• Some customers are aware of the principle of voltage p p greduction and gave already taken steps to lower their voltage via individual service voltage regulators (e.g. Smart motor controllers)
• When utility lowers the voltage on the feeder, h l d l hcustomers who are already lowering their own
voltage will go below the minimum
© 2010 Quanta Technology LLC

Voltage Reduction LimitationsVoltage Reduction Limitations• Feeders voltage limited?
– May not be able to reduce voltage at all
– May need to “flatten” the voltage profile (Progress energy, Georgia Power, etc)
© 2010 Quanta Technology LLC

Current Technologies, LLC
© 2010 Quanta Technology LLC

Time Decay of CVR Effects• The most reduction occurs right when the voltage is reduced and then some of the reduction is lost as some loads j st r n longersome loads just run longer
© 2010 Quanta Technology LLC

IVVC Benefits D i d l d t t ti ll h• Dynamic model updates automatically when reconfiguration occurs
• Volt – VAR control actions are coordinated
• System can model the effects of Distributed Generation and other modern grid elements
• Produces “optimal” results
• Accommodates varying operating objectives d di t d
© 2010 Quanta Technology LLC
depending on present need

Benefits of Volt VAR OptimizationBenefits of Volt VAR Optimization• CVR Factor = ΔP / ΔV basic on actual CVR experience:
BC H d CVR 0 7– BC Hydro CVRf = 0.7
– Progress Energy CVRf = 0.8
– Georgia Power CVRf = 0 8Georgia Power CVRf = 0.8
• Annual Energy Savings = Average Load x #Hours per year x % voltage reduction x CVRf x value of energy conservation ‐Lost revenue from kWh sales
• CVR performed during peak load period can be viewed as demand (capacity) reductiondemand (capacity) reduction
© 2010 Quanta Technology LLC

Final Volt‐VAR “Scorecard”Final Volt VAR Scorecard
Volt VAR Approach
Volt VAR Requirements Traditional Volt-VAR
SCADA Volt- VAR
Integrated Volt-VAR
A t bl V lt P fil X X X
Volt-VAR Approach
Acceptable Voltage Profile X X XAcceptable Power Factor X X XSelf Monitoring X XOperator Override X XF d R fi tiFeeder Reconfiguration XSmartGrid Devices XOptimal Coordinated Control XSelectable Operating Objectives X
© 2010 Quanta Technology LLC

Volt VAR Optimization – Next Steps
SUBSTATION
PV Inverter PV
Inverter
SUBSTATION
PV Inverter PV
Inverter
SUBSTATION
FEEDER
Supplementary Regulators
Supplementary Regulators
Rotating DG
SUBSTATION
FEEDER
Supplementary Regulators
Supplementary Regulators
Rotating DG
Rotating DG
Rotating
Capacitor ControlLTC Control
PF Rotating
Rotating DG
PV Inverter PV
Inverter
RotatingRotating
Capacitor ControlLTC Control
PF RotatingRotating
Rotating DG
Rotating DG
PV Inverter PV
Inverter
Rotating DG Capacit
or
Rotating DG
Rotating DG
Rotating DG Capacit
or
Rotating DG
Rotating DG
Voltage and VAR Regulation
Coordination Al ith
Manages tap changer settings, inverter and rotating machine VAR levels, and capacitors to regulate voltage, reduce l d
Communication Link
Voltage and VAR Regulation
Coordination Al ith
Manages tap changer settings, inverter and rotating machine VAR levels, and capacitors to regulate voltage, reduce l d
Communication Link
© 2010 Quanta Technology LLC
Algorithm losses, conserve energy, and system resources
Algorithm losses, conserve energy, and system resources

Feeder Flow and Resource Control (DG+ES)
ES
DR
Utility grid
DR
ΔPG
DG
RES
• Constant power flow or firming up ΔPW
rate of change at PCC– Eliminate adverse impact
Reduce reserve capacity requirement
© 2010 Quanta Technology LLC
– Reduce reserve capacity requirement