VOLCANIC HAZARDS ON THE ISLAND OF HAWAII Work done in ... · \Vhile the threat from volcanoes is...
66
VOLCANIC HAZARDS ON THE ISLAND OF HAWAII Work done in cooperation with the Department of Housing and Urban Development, Office of the Assistant Secretary for Policy Development and Research Geological Survey Open-File Report 74-239
Transcript of VOLCANIC HAZARDS ON THE ISLAND OF HAWAII Work done in ... · \Vhile the threat from volcanoes is...

VOLCANIC HAZARDS ON THE
ISLAND OF HAWAII
Work done in cooperation with the Department of Housing and Urban Development, Office of the Assistant Secretary
for Policy Development and Research
Geological Survey Open-File Report 74-239

VOLCANIC HAZARDS ON TilE ISLAND OP HAWAII
By
OONAL R. ~~LLINEAUX and OONALD W. PETERSON
Open-file report 74-239
1974
This report is preliminary and has not been edited or reviewed for conformity with Geological Survey standards or nomenclature

FOREWORD
This report by the United States Geological Survey provides
scientific data and interpretations to assist the Department of
Housing and Urban Development in establishing criteria for guiding
its participation in areas exposed to volcanic hazards on the Island
of Hawaii. The technical information and the accompanying volcanic
hazards risk map also provide valuable information to other uaers
for determining the nature and extent of the hazard on the Island
and for planning appropriate land uses. The study focuses on the
Island of Hawaii, but volcanic hazards are found in several other
areas of the continental United States. Accordingly, many of' the
hazard risk evaluation techniques developed and the findings are of
immediate value to other Federal, State and local governmental
agencies and the private sector.
The report, "VOLCANIC HAZARDS ON THE ISlAND OF HAWAII" results
from a cooperative effort by the two participating agencies to help
insure that HOD's policy and program decisions are supported by the
best available scientific and technical information. The study was
initiated and funded by HUD's Office of Policy Development and
Research and carried out by the Geological Survey. We hope that the
approach illustrated by this report encourages others to consider
physical environmental factors, particularly geologic hazards, in
their land use planning and decision-making process.
Assistant Secretary for Policy Development and Research Department of Housing and Urban Development
Director U. S. Geological Survey Department of the Interior

CONTENTS
Page
ABSTRACT--------------------------------------------------------- 1 INTRODUCTION----------------------------------------------------- 2
Background-------------------------------------------------- 2 Content, arrangement, and use of report--------------------- 3
PRINCIPAL RESULTS------------------------------------------------ 4 Kinds of hazards-------------------------------------------- 4 Risks to life and property---------------------------------- 4 Location and degree of risks-------------------------------- 4 Zones of relative risk-------------------------------------- 5
HAWAIIAN VOLCA'HC ACTIVITY--------------------------------------- 7 The Hawaiian Island chain----------------------------------- 7 The Island of Hawaii---------------------------------------- 7 Behavior of Hawaiian eruptions------------------------------ 14 Products of Hawaiian eruptions------------------------------ 16 Hypotheses on the behavior of Hawaiian volcanoes------------ 23 Prediction of future volcanic activity---------------------- 24 Possibility of control of volcanic products----------------- 26
DESCRIPTION OF VOLCA~IC HAZARDS---------------------------------- 28 Classification---------------------------------------------- 28 Direct volcanic hazards------------------------------------- 29
Lava flows--------------------------------------------- 29 Effects------------------------------------------- 29 Criteria used in definition of zones-------------- 29 Description of zones------------------------------ 33
Rock fragments----------------------------------------- 35 Effects------------------------------------------- 35 Criteria and description of risk zones------------ 36
Gases-------------------------------------------------- 38 Particle-and-gas clouds-------------------------------- 38
Effects------------------------------------------- 39 Criteria, and description of risk areas----------- 39
Indirect hazards-------------------------------------------- 40 Subsidence--------------------------------------------- 40
Effects------------------------------------------- 41 Criteria, and description of risk areas----------- 41
Surface rupture---------------------------------------- 45 Earthquake shaking------------------------------------- 47 Tsunamis----------------------------------------------- 48
Effects------------------------------------------- 49 Criteria for extent of hazard--------------------- 49
Zones of overall relative risk------------------------------ 51 01HER AREAS AT RISK FROH VOLCANIC ERUPTIONS---------------------- 54 ACKNOWLEDGMENTS-------------------------------------------------- 59 REFERENCES CITED------------------------------------------------- 60
i
I LLUSTRJ\TIONS
Plate I. Zones of overall relative risk from volcanic hazards, Island of llm;aii---------------------- In pocket
Figure 1. 2. 3.
4.
5. 6.
7.
8. 9.
10.
11.
12.
~lap of the Hawaiian Islands--------------------------Tile five volcanoes that form the Island of Hawaii----Mokuaweoweo caldera and adjacent pit craters on the
summit of ~huna Loa--------------------------------Fissure and cones along the northeast rift zone of
Mauna Loa volcano----------------------------------Lava flo1vs on the southeast flank of Kilauea---------~hp of the Kilauea summit area, showing extent of
pumice blanket-------------------------------------Volcanic gases streaming from Mauna Ulu vent on
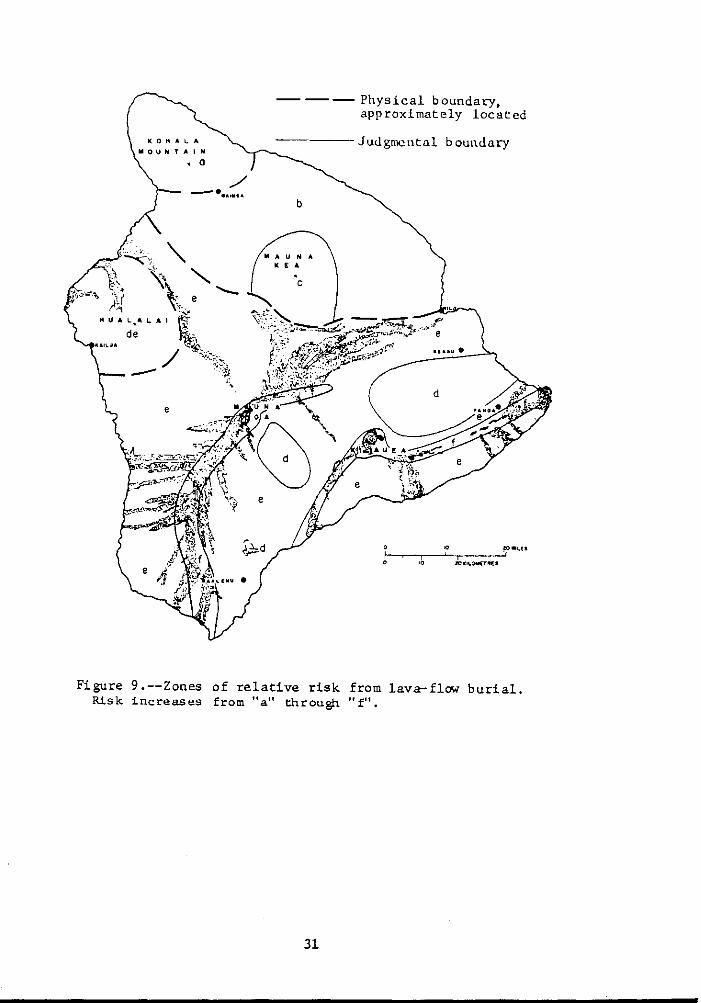
Kilauea-----------------------------~·---------------Flow of aa lava advancing toward village of Hoopuloa-Zones of relative risk from lava-flow burial---------Zones of relative risk from falling volcanic
fragments-------------------------------------------Steep slopes (palis) formed by slump-block
subsidence------------------------------------------Volcano rift and shoreline zones subject to
relatively high risk from subsidence----------------13. A small subsidence block bounded by a fault-----------14. General areas of risk from surface ruptures-----------15. Zones of overall relative risk from volcanic hazards--16. Locations of historically active volcanoes in Alaska--17. Major volcanoes in the Cascade Range------------------
Table l. 2. 3. 4.
TABLES
Historic eruptions of Mauna Loa----------------------Historic eruptions of Kilauea------------------------Elastic properties of some Ha1vaiian basalts----------Recorded or estimated number of eruptions of
volcanoes on Hawaii during written historic, recent prehistoric, and postglacial time-------------------
ii
Page
8 9
13
15 18
21
22 30 31
37
42
43 44 46 52 55 56
Page
10 12 19
32
\ I
'[
y
z l
cl 0
t 11
p t: ar cr f, c;
ICI
U.'
S!
ti \'iC
pc er In
;e
')
VOLCANIC HAZARDS ON THE ISLAND OF HAWAII
By DONAL R. MULLINEAUX and DONALD W. PETERSON
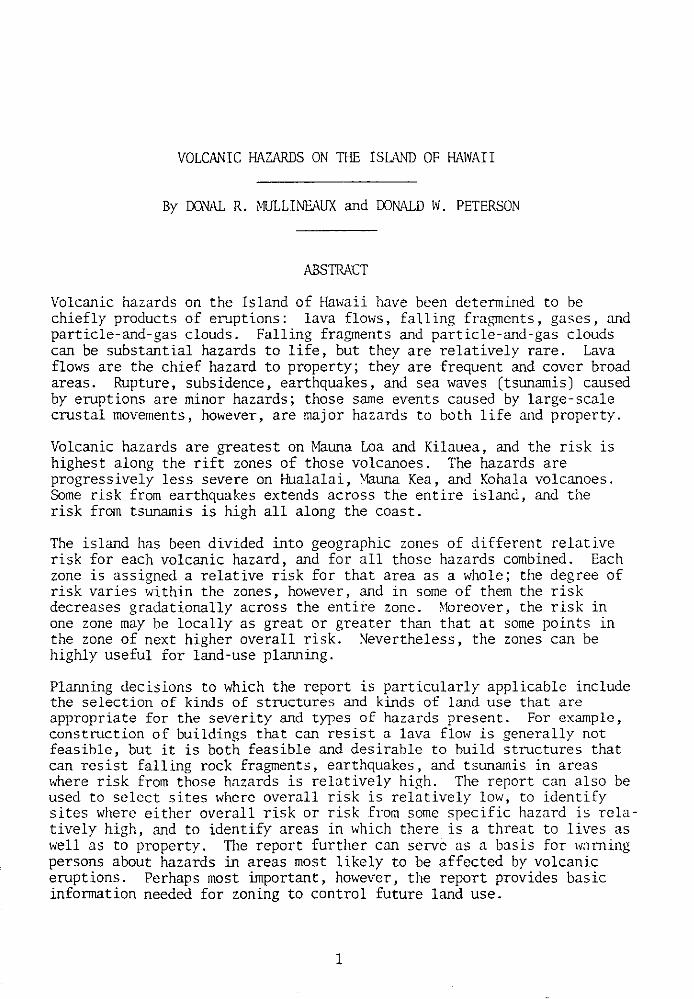
ABSTRACT
Volcanic hazards on the Island of Hawaii have been determined to be chiefly products of eruptions: lava flows, falling fragments, gases, and particle-and-gas clouds. Falling fragments and particle-and-gas clouds can be substantial hazards to life, but they are relatively rare. Lava flows are the chief hazard to property; they are frequent and cover broad areas. Rupture, subsidence, earthquakes, and sea waves (tsunamis) caused by eruptions are minor hazards; those same events caused by large-scale crustal movements, however, are major hazards to both life and property.
Volcanic hazards are greatest on Mauna Loa and Kilauea, and the risk is highest along the rift zones of those volcanoes. The hazards are progressively less severe on Hualalai, Mauna Kea, and Kohala volcanoes. Some risk from earthquakes extends across the entire island, and the risk from tsunamis is high all along the coast.
The island has been divided into geographic zones of different relative risk for each volcanic hazard, and for all those hazards combined. Each zone is assigned a relative risk for that area as a whole; the degree of risk varies within the zones, however, and in some of them the risk decreases gradationally across the entire zone. ~loreover, the risk in one zone may be locally as great or greater than that at some points in the zone of next higher overall risk. Nevertheless, the zones can be highly useful for land-use planning.
Planning decisions to which the report is particularly applicable include the selection of kinds of structures and kinds of land use that are appropriate for the severity and types of hazards present. For example, construction of buildings that can resist a lava flow is generally not feasible, but it is both feasible and desirable to build structures that can resist falling rock fragments, earthquakes, and tsunamis in areas where risk from those hazards is relatively high. The report can also be used to select sites where overall risk is relatively low, to identify sites where either overall risk or risk from some specific hazard is relatively high, and to identify areas in .vhich there is a threat to lives as .vell as to property. TI1e report further can serve as a basis for w~ming persons about hazards in areas most likely to be affected by volcanic eruptions. Perhaps most important, however, the report provides basic information needed for zoning to control future land use.
1
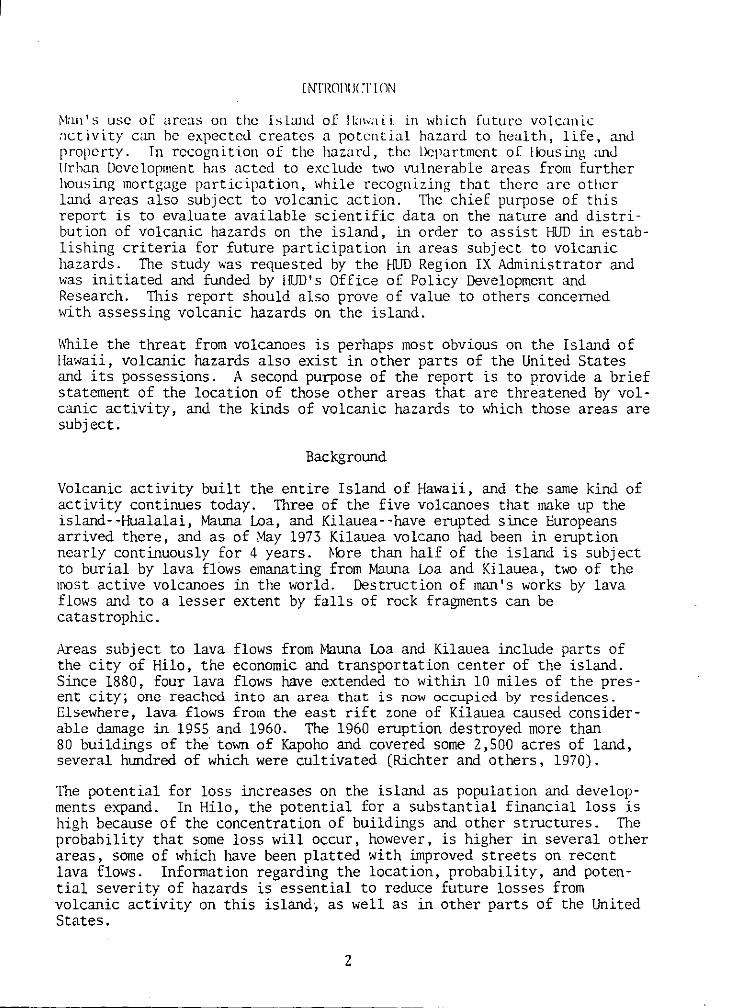
[ NTRO!liJ(:J' !ON
~~Ul' s usc of areas on the Is Lanu of ll;nv;, L i in which future volcanic :1ctivity em be expecteu creates a potential hazard to health, life, anu property. In recognition of the hawru, the Department of llous ing anu IJrhan Development has acted to exclude two vulnerable areas from further housing mortgage participation, while recognizing that there arc other land areas also subject to volcanic action. TI1e chief purpose of this report is to evaluate available scientific data on the nature and distribution of volcanic hazards on the island, in order to assist HUD in establishing criteria for future participation in areas subject to volcanic hazards. The study was requested by the HUD Region IX Administrator and was initiated and funded by HUD's Office of Policy Development and Research. This report should also prove of value to others concerned with assessing volcanic hazards on the island.
\Vhile the threat from volcanoes is perhaps most obvious on the Island of Hawaii, volcanic hazards also exist in other parts of the United States and its possessions. A second purpose of the report is to provide a brief statement of the location of those other areas that are threatened by volcanic activity, and the kinds of volcanic hazards to which those areas are subject.
Background
Volcanic activity built the entire Island of Hawaii, and the same kind of activity continues today. Three of the five volcanoes that make up the island--Hualalai, Mauna Loa, and Kilauea--have erupted since Europeans arrived there, and as of May 1973 Kilauea volcano had been in eruption nearly continuously for 4 years. ~lore than half of the island is subject to burial by lava flows emanating from Mauna Loa and Kilauea, two of the most active volcanoes in the world. Destruction of man's works by lava flows and to a lesser extent by falls of rock fragments can be catastrophic.
Areas subject to lava flows from Mauna Loa and Kilauea include parts of the city of Hila, the economic and transportation center of the island. Since 1880, four lava flows have extended to within 10 miles of the present city; one reached into an area that is now occupied by residences. Elsewhere, lava flows from the east rift zone of Kilauea caused considerable damage in 1955 and 1960. The 1960 eruption destroyed more than 80 buildings of the town of Kapoho and covered some 2,500 acres of land, several hundred of which were cultivated (Richter and others, 1970).
The potential for loss increases on the islanu as population and developments expand. In Hila, the potential for a substantial financial loss is high because of the concentration of buildings and other structures. The probability that some loss will occur, however, is higher in several other areas, some of which have been platted with improved streets on recent lava flows. Information regarding the location, probability, and potential severity of hazards is essential to reduce future losses from volcanic activity on this island, as well as in other parts of the United States.
2

ttl '·
n.tab-
of :s >rief val; are
d of he s {l
•jecc the lva
of 1d. tlress. ider-
and,
elop>SS is
The . other )nt )ten·
Jnited
Content, arrangement, and use of report
This report consists of a large-scale map (1:125,000, pl. I) and an explanatory text accompanied by several small-scale maps. The largescale map shows the extent and dates of historic flows on the Island of Hawaii, the location of known eruptive vents, and several zones of relative overall risk from volcanic hazards on the island.
The text to follow describes (1) the results of the study in brief, (2) basic information concerning volcanic activity in fbwaii, and (3) volcanic products and events that constitute the hazards. The description of volcanic activity discusses the construction of the volcanoes that form the islands, their developmental stages, and the kinds of eruptions that are typical of these volcanoes. It also includes an evaluation of current ability to predict the times and locations of future volcanic eruptions, and of the possibility of controlling those eruptions or the distribution of the eruptive products.
The next part of the text describes each hazard individually, its effects on people and property, criteria that were used to determine the location and extent of the hazard, and zones of relative risk that are recognized. Accompanying small-scale maps (about 1:750,000) show the distribution of relative risk from some hazards.
The third section of the report describes the interpretation of relative risk from all volcanic hazards, which is presented on the large-scale map, and the final section treats volcanic hazards elsewhere in the United States.
The report and maps should be useful in understanding the or1gLn and character of volcanic hazards on the island, and as a guide to evaluation of relative risk from those hazards. The maps should be used only with great caution, however, in comparison of the risk at one site to the risk at another, especially if the sites are either close together or on different volcanoes. Caution is needed because the risks from these hazards are, in detail, neither uniform nor regularly gradational >;ithin or between areas.
Even on a single volcano, the lack of uniformity or regular gradation of risks exists, because (1) not all eruptions occur from the same vent, (2) not all vents erupt with the same frequency, and (3) local topographic variations prevent uniform distribution of the effects of the eruptions. Zones are established only for an average risk, and the range of risk in a zone can be considerable. Moreover, the range of risk in one area can overlap that in an adjacent zone of different average risk.
3

PRINCIPAL RESULTS
Kinds of h;~zarJs
Volemic h;~zards th;.~t a[[ect persons :md property on 1/:nvai i bland arc c;~tcgorizcd broadly into two types, called "direct" ;md "indirect" h;.~zanb. Direct hazards arc the products oC volcanic eruptions; namely, l:wa Clo~Vs, falling rock fragments, drifting volcanic gases, and particle-and-gas clouds. Indirect hazards include ground movements that accompany eruptions, such as subsidence, surf;.~ce ruptures, and earthquakes, and also certain unusual sea waves called tsunamis.
Ground movements and tsunamis can be caused not only by volcanic enrptions but also by shifting of large parts of the earth's crust ("tectonic" movements). The effects are similar regardless of cause, but effects of tectonic movements can be more violent and widespread. Some tectonic movements that affect Hawaii occur at great distances from the island and are clearly unrelated to volcanism on the island. Some tectonic movements that occur beneath the island or adjacent to it also have no apparent relation to volcanism on the island. Other such movements, however, may be caused by the subsurface movement of molten rock; thus, in a sense, they could be regarded as related to volcanic activity even though no eruption occurred. For the sake of simplicity, all ground movements and tsunamis are described together in this report, regardless of their origin.
Risks to life and property
Products of eruptions on the island endanger people only slightly, but some can be highly destructive of property. The main risk is from burial by lava flows, which move so slowly that people can avoid them, yet the flows can bury large tracts of land and demolish all structures on that land.
Ground movements and tsunamis caused by eruptions on Hawaii also do not significantly endanger people, because those events are of such small magnitude. The ground movements can damage property severely, but that damage generally is very localized.
In contrast, some ground movements and tsunamis that result from tectonic activity significantly endanger both people and property. The main danger from these tectonic events comes from earthquake shaking and from tsunamis; the potential danger to life from tsunamis generated by tectonic movements probably is greater than that from all the volcanic hazards combined.
Location and degree of risks
'l1JC distribution of each of these hazards on HaiVaii Island is related to the activity of the various volcanoes and locations of their caldera and rift zones, and to the proximity of certain fault zones and the seacoast. Consequently, risk from certain hazards exists in some areas and not in others, and the degree of risk from some hazards varies from place to place. The highest degree of risk from direct volcanic hazards is on volcanoes that are most likely to erupt in the future, because di-rect hazards affect chiefly the surface of the volcano that erupted them. The
4
I' /'· } h.
t, ti Ol
de Z\
aJ
Tl· Sli
fn WI' Tl
st di
an, se: ts: sc: Cl<
The ha; the haz the
As arc dif Moe: bin, MJU
jun, the uni'
The the vole vole most no til

trds. )WS,
ions ,ave-
and 1ents
nay
and rig in.
.t -''lle
b)' flows
ld.
tonic danger unamis; ements
·d to t anJ :oast. tin to Jn volilazards
probability that a volcano will erupt in the future is judged from its past activity. Kohala and Mauna Kea have not erupted for thousands of years, and the risk on them is relatively low. Mauna Loa and Kilauea have erupted throughout the time of 1vritten history in Hawaii, about 200 years; risk on them is relatively high, because they must be expecteJ to erupt repeatedly in the future. Hualalai. has erupted only once during the last 200 years, and risk on it is judged to be intermediate. On each of the last three named volcanoes, the risk is highest within their caldera and rift zones and decreases gradationally downslope from those zones. Zones of relative risk and criteria on which the zones are based are discussed for each direct hazard.
The highest degree of risk from subsidence and ruptures of the ground surface is within the rift zones of ~~una Loa and Kilauea, along other fault zones, 'l.11d along the southwest and southeast coasts of the island where coastal blocks might subside below sea level. Zones of relative risk from subsidence and rupture are mapped and discussed. Risk from strong earthquake shaking extends over the entire island, and zones of different risk are not mapped.
The highest degree of risk from tsunamis is obviously near the shoreline, and the risk decreases inland with increasing distance and height above sea level. The total area subject to tsunami damage is small; reported tsunamis on Hawaii have reached no more than about 60 feet above normal sea level, and no more than a mile or so inland even on land that is close to sea level.
Zones of relative risk
The island has been subdivided into zones of relative risk for most direct hazards, for subsidence, and for surface rupture. The greatest risk over the island except for narrow coastal strips is judged to be from direct hazards. Consequently, the distribution of direct hazards nearly defines the pattern of cumulative risk from all volcanic hazards.
A5 a first step, the island can be subdivided into three areal units that are distinguished by relatively well defined boundaries and significantly different risks from direct volcanic hazards. These units are (l) Kohala Mountain, (2) t-~w1a Kea, and (3) Hualalai, Maw1a Loa, and Kilauea combined. Each unit thus consists of one or more volcanoes whose slopes v.ould receive the main effects of their products of eruption. The slope jllilctions between adjacent volcanoes form natural physical barriers to the spread of lava flows, and the probability of an eruption within each unit is very different from that in the other llilits.
The third unit is sulxliviJeJ, because the risk 1vithin it ts clearLy not the same everywhere. llualalai volcano is separateJ from the other two volcanoes because it has erupted less frequently. On each of these three volcanoes, the risk is highest within its calJera and rift zones where most eruptions occur. Historic evidence indicates that the risk also is notably different from place to place on the slopes of Mauna Loa.
5

The junction he tween llualalai and Mauna Loa is not conspicuous or well defined, because those slopes arc gentle, and lava flows from the two volcanoes may overlap. That risk-zone boundary is based on a physical feature but is only approximately located. Tn contrast, most boundaries between risk zones on llualalai, Mauna Loa, and Kilauea arc based on judgments of different overall risk between areas that are not separated by physical boundaries, and the risk generally grades with little or no obvious break across the boundaries. Consequently, those zones are relatively subjective, and the boundaries beh1een them are arbitrary.
There is an important difference bet~;een boundaries controlled by surface features and those ~;hose positions are arbitrarily placed. For the former, the risk at a site barely on one side of the boundary may be far greater than the risk barely on the other side; in addition, the accuracy of the position of that boundary might be improved by a site investigation. For the latter, the risk just on one side of the boundary is not substantially different from the risk just on the other side, and the position of the boundary probably cannot be refined by a detailed investigation.
The extents of zones of overall risk are influenced very little by consideration of indirect hazards, because subsidence and rupture occur chiefly in the very same caldera and rift zones in which direct hazards are greatest, and the hazard of strong earthquake shaking extends over the ~;hole island. The risk from subsidence is regarded as great enough along t1~ shoreline strips in the southern part of the island to show an increase in overall risk in those areas.
Although the risk from tsunamis caused by eruptions is slight, the risk from tsunamis caused by tectonic events is great. TI1e risk decreases gradationally but not uniformly inland from the shore. TI1e endangered area is not mapped because it cannot accurately be determined at the present time.
6
('
t
l 1
il<
II lh s ill
5. yc hi p: ti \~ j
pr WI
b A<> ,, en
en em: en hal th: en:

ll )
< tl ri.o" j uclg-
by
rela-
trface fonner,
cater f the
For ntially
the
consid·hiefly ) greatihole ~ two rease in
ri"\ se·_ .creel he
HAWAIIAN VOLCANIC ACfiVITY
The Hawaiian Island chain
All the islands of the Hawaiian Archipelago were fonned by constntction of volcanoes. The islands are part of a mountain chain that rises from the sea floor, approximately 15,000 feet below sea level, to reach a maximum height at the summit of Mauna Kea on the Island of Hawaii at 13,784 feet above sea level. The archipelago extends in a west-northwest to eastsoutheast direction, and the total mountain chain, including the lmdersea portion, is about 1,600 miles long and averages about 125 miles wide. However, the part that comprises the eight main islands at the southeast end of the archipelago is only about 400 miles long (fig. 1).
Throughout several tens of millions of years, the center of volcanic activity seems to have migrated from northwest to southeast. Overall, the oldest islands of the chain are at the northwest, and the volcanoes that rise above the sea are progressively younger toward the southeast. !{awaii, the southeasternmost island, is the site of the only current volcanic activity and is the only island upon which frequent future activity is likely, although sporadic eruptive activity may possibly occur on other islands. Since the Island of Hawaii is still growing, future volcanic activity can be expected to affect large areas there.
The Island of Hawaii
Hawaii Island is made up of five individual volcanoes: Kohala, Mauna Kea, Hualalai, ~~una Loa, and Kilauea (fig. 2). The island has a maximum northsouth length of 93 miles, an east-west length of 76 miles, and covers an area of 4,030 square miles. Kohala, whose summit has an elevation of 5,480 feet, probably has not erupted for several tens of thousands of years. Mauna Kea, whose summit is at 13,784 feet, has had no cntptions in historic time, but shows evidence of having erupted a fet< times t<i thin the past five thousand years. Based on the infrequency of ~1auna Kea' s eruptions in the recent past, the probability is very low that any activity will occur during the next several decades, but the possibility cannot be completely dismissed. It will, however, probably erupt again at some time in the future; these eruptions will likely be of an explosive type that produces abundant blocks and ash that cover areas near the eruptive site with large and small fragments. Hualalai, whose swmnit is at 8,271 feet, last erupted during 1800 and 1801 and can be ex~ected to erupt again. Again, based on the infrequency of recent activity, the probability of an eruption in the immediate future is low.
~una Loa, 13,677 feet, and Kilauea, 4,090 feet, are both highly active volcanoes. Between the years 1830. and 1950, Mauna Loa erupted on the average of once every 3 1/2 years (table 1). The volcano is said to be erupting at any time molten lava can be observed, even when none is being emitted from the vent. During the period from 1830 to 1950, Mauna Loa erupted a greater volume of lava than any other volcano on earth. About half of its historic eruptions were confined to the caldera itself, so that lava did not affect the adjacent flanks of the volcano. During other eruptions, lava either overflowed the caldera or was emitted from rift
7

\60" 1 ~a· 1">1" l.,b.
~r --·· ·- -- - ~------- ·-~- -
XAUA
~HAU Llhu•
~4c/~ OAH / C
~lulu oc .una~ MOLOJtAl ' '"" p
~4
"" < b~ LANAI
c:JJtAHOOLAWI:
22
21
20 ~ v HI~
HAWAII D '? (
19
0 100 1~0 MILES
0 50 100 1~0 1<\LOMETRES
Figure 1.--Map of the Hawaiian Islands.
8

I I
I I I
0 10 20 MILES
0 10 20 KILOMETRES
Figure 2. The five volcanoes that form the Island of Hawaii: Kohala, Mauna Kea, Hualalai, Mauna Loa, and Kilauea. Contour interval 1,000 feet. Dash lines separate named volcanoes.
9
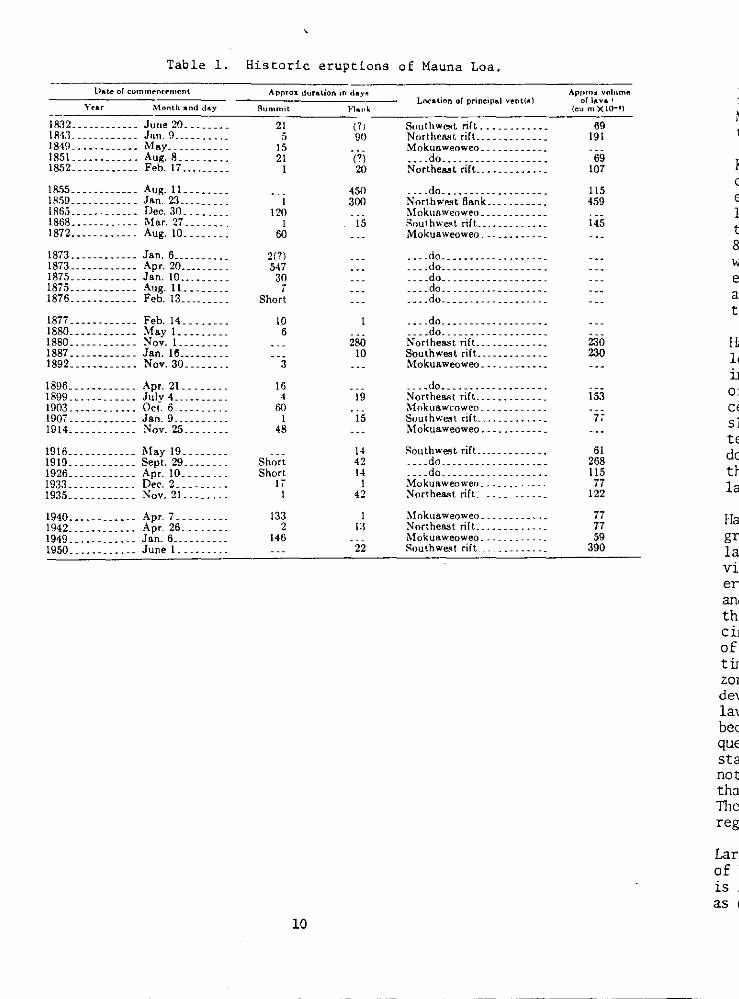
Table 1.
Dat..e of comm~ncf'ment
Year Month ""d d11.y
18.12~·---------- June 20 _______ _ 1fH.1 ____________ J1m. H ......... . 184tL ___________ May __________ _ 1R5L ___________ Aug. 8 ________ _ 1852 ____________ Feb. 17 ________ _
18.55 ____________ Aug.]!_ ______ _ 1859.----------- J&n. 23 ________ _ 1865 _____ - _ _ _ _ _ _ Dec. 30 ____ . __ . 1868 ____________ Mar. 27 _______ _ 1872 ____________ Aug. ]Q _______ _
1873 ____________ J&n. 6 _________ _ 1873 .. ---------- Apr. 20 ________ _ 1875 ____________ J&n. ]Q ________ _
1875 •• ---------- Aug.!!_ ______ _ 1876 ____________ Feb. 13 ________ _
187i ____________ Feb.l4 _______ _ 1880.----------- M&y !_ _______ _ 1880 ____________ Nov.!_ _______ _ 1887 ____________ J&n. !6 ________ _ 1892 ____________ Nov. 30 _______ _
1896 ____________ Apr. 2L ______ _ 1899.~---------- Jtlly 4 _________ _ 1903 ____________ Oct. 6--------·-1907 ____________ Jan. 9 _________ _ 19]4 ____________ Nov. 25 _______ _
1916 ____________ M&y 19 _______ _ 19!9 ____________ Sept. 29------·-1926 ____________ Apr. JO _______ _ 1933 ____________ Dec. 2 ________ _ 1935 ____________ :-!ov. 2L ______ _
1940 ____________ Apr. 7 ________ _ 1942 ____________ Apr. 26.-------1949 ____________ J&n. 6 _________ _ 1950 ____________ June!_ _______ _
Historic eruptions of Mauna Loa.
Appro:t duration in day~
Summit }o'\ouok
21 (11 5 90
15 21 (?)
I 20
450 I 300
120 I 15
60
2(?) 547
30 7
Short
10 6
280 10
3
16 4 19
60 I 15
48
14 Short 42 Short 14
17 I 1 42
133 1 2 1:1
146 22
10
Location or principal vent(R)
Southwest. rift. ........... . Northcn..'!t rift_ ___________ _ Mokuaweoweo. ___ . __ .. __ _ _ ___ do __________________ _ Northeast rift_ __ . __ ----.-~
~~~~do~~~~~~~~-~-----·~-~ Northwest flank .......... . Mokuaweoweo. _. ___ ... _. _ Southwe.'11. rift_ _______ --~--Mokuaweoweo~ ___ ~ ... ___ _
____ do __________________ _
__ .~do .......... __ .. _._ .. _~ .. do. __ ~ ... _ .. ___ ..... _ __ .. do~ ....... --------- .. ... . do .................. _
... . do .... ___ ~ ..... ____ .. ___ .do. _________________ _ Northeast rift_ ___________ _ Southwest rift_ ___________ _ Mokuaweoweo ... _. ___ ....
.... do ... ~------~--------Northea..<~t rift. ___________ _ Mokuawcowe-o. _____ . ____ _ Southwest rifL.-------~--Mokua.weoweo. __ . ~ .... _. _
Southwest rift. ... _. __ ..... ___ .do .... ____ ...... __ -~~ . --.do._------.----------Mokua.weoweo .. ___ , _____ _ Northe&tit rift_ ___________ _
Mokuaweoweo. _______ .... :"l'ortheast rift. ....... ~----Mokuaweoweo _ .. ____ . - - - _ Southwe.~t rift.-------~---
Appros volllmfl of lava 1
(eu m XI0-1)
69 191
69 107
115 459
145
230 230
153
61 268 115 77
122
77 77 59
390
zo: 1 (': til< 1'-bt till
Kii cen en: la~ the 80 Wei esse abo the
Ha\,, len: ind of, ceni sloJ ter d0\\1
the lav:
1-!a,,: gre:: lav;' vise erur and thi~ cind of t time zone devc lava be COl
quen stag, not , that 11JC I<
rega1
Large of br lS 3 as 6(
, '·olume '"a.' XI<>
69 07
15 .-)9
45
230 230
153
7;
61 2tl8 liS 77
122
r 7 5!)
390
zones or other points lower on the mountain. These eruptions produced at least 40 separate lava tongues that extended several miles or more down the volcano slopes, and at least eight of these reached the sea. Although Mauna Loa has not erupted since 1950, it could reswne its activity at any time on rather short notice.
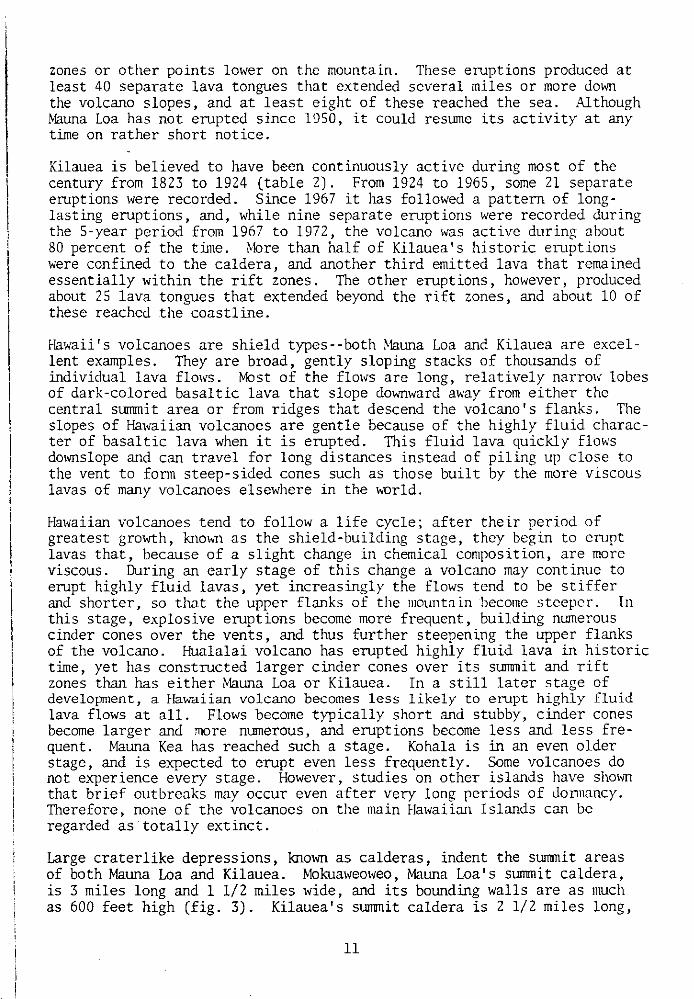
Kilauea is believed to have been continuously active during most of the century from 1823 to 1924 (table 2). From 1924 to 1965, some 21 separate eruptions were recorded. Since 1967 it has followed a pattern of longlasting eruptions, and, while nine separate eruptions were recorded during the 5-year period from 1967 to 1972, the volcano was active during about 80 percent of the time. More than half of Kilauea's historic eruptions were confined to the caldera, and another third emitted lava that remained essentially within the rift zones. The other eruptions, however, produced about 25 lava tongues that extended beyond the rift zones, and about 10 of these reached the coastline.
Hawaii's volcanoes are shield types--both ~muna Loa and Kilauea are excellent examples. They are broad, gently sloping stacks of thousands of individual lava flows. Most of the flows are long, relatively narrow lobes of dark-colored basaltic lava that slope downward away from either the central swrnnit area or from ridges that descend the volcano's flanks. The slopes of Hawaiian volcanoes are gentle because of the highly fluid character of basaltic lava when it is erupted. This fluid lava quickly flows dmvnslope and can travel for long distances instead of piling up close to the vent to form steep-sided cones such as those built by the more viscous lavas of many volcanoes elsewhere in the wurld.
Hawaiian volcanoes tend to follow a life cycle; after their period of greatest growth, known as the shield-building stage, they begin to erupt lavas that, because of a slight change in chemical composition, are more viscous. During an early stage of this change a volcano may continue to erupt highly fluid lavas, yet increasingly the flows tend to be stiffer and shorter, so that the upper flanks of the mowJtain become steeper. In this stage, explosive eruptions become more frequent, building numerous cinder cones over the vents, and thus further steepening the upper flanks of the volcano. Hualalai volcano has erupted highly fluid lava in historic time, yet has constructed larger cinder cones over its swrnnit and rift zones than has either Mauna Loa or Kilauea. In a still later stage of development, a Hawaiian volcano becomes less likely to erupt highly fluid lava flows at all. Flows become typically short and stubby, cinder cones become larger and more numerous, and eruptions become less and less frequent. Mauna Kea has reached such a stage. Kohala is in an even older stage, and is expected to erupt even less frequently. Some volcanoes do not experience every stage. However, studies on other islands have shown that brief outbreaks may occur even after very long periods of Jonnancy. Therefore, none of the volcanoes on the main Hawaiian Islands can be regarded as totally extinct.
Large craterlike depressions, known as calderas, indent the swrnnit areas of both Mauna Loa and Kilauea. Mokuaweoweo, Mauna Loa's swrnni t caldera, is 3 miles long and 1 1/2 miles wide, and its bounding walls are as much as 600 feet high (fig. 3). Kilauea's swrnnit caldera is 2 1/2 miles long,
11
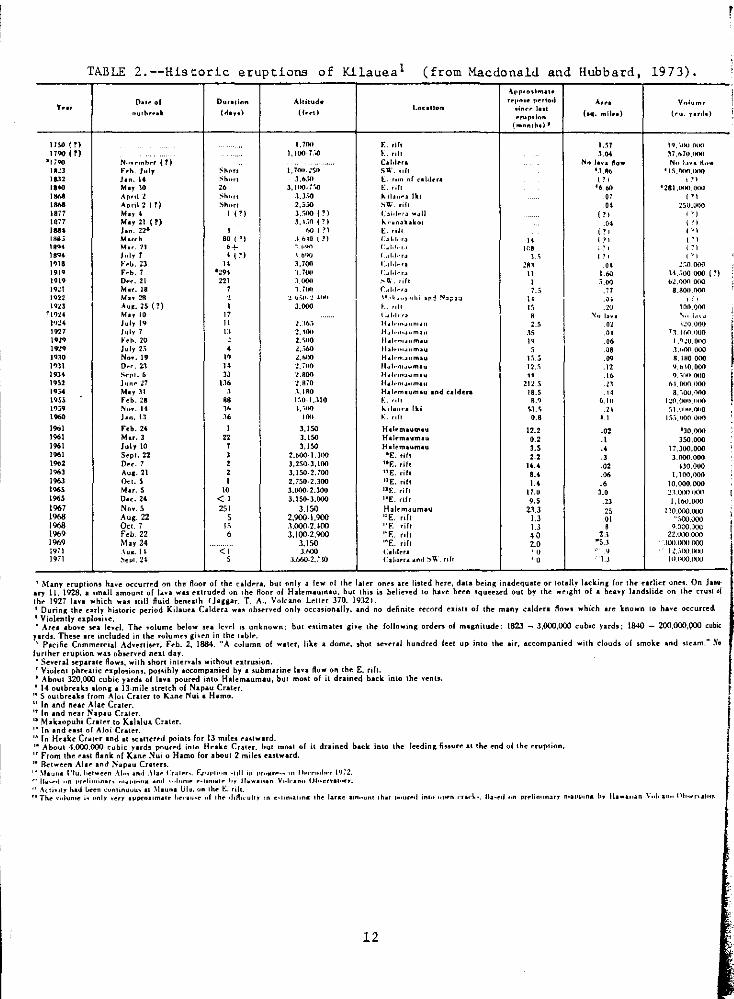
TABLE 2. --His to ric eruptions of Kilauea 1 (from Macdonald and Hubbard, 19 7 3).
At'P""Im•l•
y .... [h•~ of Ouutinn Ahllude '"'I""" f>"rlod "'"' Volum~
(rl•yo) Loc:otlon ...... ~ ....
nurhrnlt (lr .. t) r"'pHnn
(.q. mllu) t~ ... , ..... ) (rnnntho) I
11SD(r) 1.10n r.. rUt UJ l'J, '•IIU,!\1~1
1100(l) 1' 100.7:.0 L r~h 1.G4 n.nm.non •t;oo N ..... mh .. r { l) c.t,, .... Nn lha Ito• Nn l.ovll 1\.,,.
18:1 t" .. b. J.,,, ~h<>fl 1,70u.~S!I S\\' flh '1.A6 'IS,OOO_IKIO 1&.12 }u. 14 ~""" J.o.;n l. rom of c•ltln• l ~ I t'l .... fl.hy 10 " 3.1110-t"iQ E ... h 'b.60 '28l,Ui10.(1011
I"" A!'tol Z ~'"''' .l,J.>O lo.ilou .. >llu " 1'1 ,,.. Apnl:Z(r) Sh"r! 2,5,;(1 S\\i. roil " ~SO,liOO
1817 fl.hy 4 1 PI 3,.'",00{?) c~,.~~, .. ~u (?I I!) 11117 May 21 ( ,, l. t.;n 1 ?I lo.r•n~kakoi .0. (!) .... hn. 22• ' 1>0 (?I E. roll (?I l''l 1118:> Much 80 ( ~) .1.1>10 l!) c~ ,,,..,,
" (?l ,,, 1 ... M ... 11 •+ ·: ,.un ('~1-1.-r' 1C8 ' ~ I I ~I
"'" July 1 4 Ul '""" '-··'·'···~ 1.1 ,,, ('.'1 l'll8 t' .. i>. 23 " 3,700 l,ol·lo·•• 281 .. ~'.0.000 11119 r .. b. r 1tll1 1. 70u r:dlol•·ra " '"' H.:.oo.ooo ( n 111\'J o .. ~. 21 "' .1.000 .... a.· . .,(! I ~.00 b~.OOfi.OOO
1921 Mu.\8 1 1. TI-l f:~ld•·n 7.~ .77 a.11ou.oon 11J22 M .. 21'1 ·~ ~,;, .. ~ "'"" "-·~, .. , .. ,),; ~n:! !'h;;>:J " .J-9 ' \9:ll Au,.2S(?) J.OOO ~ .. roh ,, .~IJ \00.000
11'l:l4 M~, 10 " 1.~1·1···· ' ~" IHa ~ .. 1."~ \<1:!4 July \9 " 2.'lt..i 11.1, '"~""'"" 2.5 .Ol 120 000
"" July 1 n '!.,Oil Hdlo·oh~umou .1:; " 11.1W.IIUO 19:l'J r ..... 20 2. ~110 llalnn•umJu " .. I .'l2U.I)H0 \9'l'J July 2.'> ~ •. >t.O ll•h•ou~.,m•u 5 .. .l.hOO,OOO 1•no Now. Ill " :l,f>llll H•l•·"·•nmau \~ ... ·" II. IHO.OOO I'll\ o~ ... 2.1 .. :!. ;,If) H.J,·nOJuma" 12.~ .12 'l.b\0.000 IIIJ4 S<"pl, 6 JJ :l.IIOO llolo-ma.,mo., " ·" ?. ;!KI.OUO IIIS2 Jun,. ~7 \.16 :l.lliO II,.Jo·•to•umau 2\Ll II h\,0110.1100 \9.>4 Moy .ll ' .1.1110 Hal .. moumou and uldua 18.5 .H II. ·.ou.ooo 1115:; r~b. ~~ .. \;";0-1 •. 110 L "h '·' 6.111 1:;0,(101111110 l'l~9 N .. w. 11 "• L,:;uo !.. ,lau•·• lki '>.1 .. ~ .21 -;),1\IMI,I)IJ()
1 ... Jon. 1.1 " '" ~:. rdt '·' '·' J<,;_oi()O OliO
l%1 feb. 24 3.150 Htl~lniUGIIII 12.2 ·" 130.000 1961 Mu.l " l.l50 Hah·maumou '·' .I 350.000 1961 Julp 10 T J.I.SO Hal~moumtu l.5 .. 17.300.000 1961 Sept. 22 J 2.b00-I.JOO 1E. rifT .., .l 3.000.000 1962 Dee. 1 ' 3.250-3.100 10f.. rift 14.4 .o: 430.000
'"'' Auc. 21 2 3.150-2.700 "E. rift ••• ·"" 1.100.000 196J o~t. s I 2.iS0-2.300 11 E. roll ... .. 10.000.000 1965 Mar. S " 3.000-2.300 1>£. rih \1.0 J.O 2~.000 000 1965 Dee. 24 <• 3.150-3.000 14 E. riff 9.5 .23 ],lbll,OOO 1967 Now. 5 251 3.150 Halrmaumau 2.1.3 25 110.0\)).0IJO 1968 Aug. 22 5 2,900-1.900 "E. n£t 1.3 " ··;,oo.ooo 1968 Occ 7 ,, -~.000-2 . .m:l "F. rih 1.3 • ')_30Q.OOC 1969 fdl. 22 6 3,100·2.900 "f.. roll "
,, 22.0.)0.000 1969 May 24 3.150 "£ nh 2.0 "'5.J - "JOO.OOO.OOO ]90] \u&. I ~ « J.hOO Col•l~r• "() ' 1 ~ .. ;no t~lll 1971 ~eJ>t. 2l 5 .1.660-2.7."10 i:al.l~r" ~nd :,\\ nh "U ·-u 10 t~JO.OOO
' Many eruptioM have occurred on the floor of the cald..ra, but only a lew l'f the laler onn are listed here, dona being inadequate or totally lacking lor the earlier ones. On hnu· .If)" II. 1928, a •mall amount of [ava was e~trud<"d un the floor of Halem.1umau, but 1his is belie"Ved to have been squeezed out by the weight of a heawy landslide on the crust oi the 1927 lava which was •1111 fluid bennth fhggar. T. A .. Volcano Letter 370. 19321. ' During the e:nh historic period Kilauea C;;oldera wa~ observed only occuionally, and no definite record e~ists of the many caldera flows which ue known to h.1ve occurred. 1 Violently e~plo•i•e. 'Area above ~a level. The volume below •ea levd is unknown; but e!limates give the follow>ng orden of magnitude: 1821- 3,000,000 cubic yards; UWO- 200.000,000 cubic
yards. Thne 1re included in the volumu giv~n in the table. ' Pac1fic Commerc1al Adverli~r. feb. 2, 1884. "A culumn of water, like a dome, shot •even! hundred feet up into the air. accompanied with cl.,uds uf sm.,ke ud $team." No
furl her erup1ion was "b~r"l!'d next day. • Seweral separate flow•. with short inlerub without e~trusion. 'VioleOI phreatic ~~plosions, pos~ibly accompanied by a submarine lava fl.,w on the E. rift. • Aboul 320,000 cubic yards ollawa poured into Halemaumau, but most of il drained back. into the vents. • 14 "utbreaks along a 13-mile stretch of Napau Cr.1ter.
•• 5 I)Utbreoks from Aloi Crater ((I Kane Nui a H01mo. "In and near . .o\lae Craler. "In and near Napau Crater. "Makaopuhi Cnter to Kalalua Crater. "In and eosl of Aloi Crater. " In Huke Crat<'r and at Kattend points for 13 miles !"astward. •a About 4.000.000 cubic yard• pnurrd into Healr.e Crater. but most of it droined bock into the feeding fiuure at the end olthe eruption. " F'rom the rut flank of Kane Nui o Hamo for about 2 miles easlwud. oa Retwe~n Ala.- and Napau Craten. '" \huno J'lu. between \1,, and .\Ia,. t:r41rr•. f..rut•l1"n •loll 111 I''""'"" 111 !lnrudwr] 11~2. '"'11~·,.•1 "" ,,,,.l;,.,nar, '"~1'1'"'" ~nol ,.,1.,,.,,. "'""'~t,. h, u ... antn Vulo-anu Oh•eru1nry. ".\<·U.,ty ha..J i>~en <:unhnuvu~ at \huna l.ttu. un the~- nh. "Tf>e ,·,]ume ;, un\y very a1Jprosoma1e ],~··•u•e nf th~ do flu uhy in ~-l•noalln& 1he lar&e lln .. unt th~t t~•ur"d inl" "'"'n ,...,.~ •. lla•r•l un Pr<"linllnary nolt>!-lln& by ilawa .. an \',j, """ CJJ,,,.rnl•~•·
12
r
i
l I

H3).
l<J.·.oo.ono 37./>;"0.000
N, "'"~ How 'I~.{)I)(IJ~IO
\'I ':U.!"Ml.!IOO ,.,
z~.n.1"10 1:)
'') I~~
1n 1?1 ) ')
~-.o.J)(Hl
H. -.oo.ooo (?l li2.ilOU.tlHO
8.8011.000 ,,, lilH.OOO
"" 1." ~ I.W 000
11.11.11.0110 l.'l~O.GUO
.l.foOO.OUO M.IMfl.O!lO 11.1>10.000 9.~!JII.OUO
b\.000.!100 a.~oo.I"MlO
l:!ll.!}OO.IWIO ~1.110~1.0110
i.;.· •. lf00.0110
1)().000 350.000
17.300.000 3.000.000
.uo.ooo 1.100.000
10.000.000 21.000 000 1.160.000
I 10.000.000 '"'"'1000
'OC
' .00 JOO . .......v.ooo ILiOOUOO IUWO.IJOO
lier onu. ,.Je on Jhe
. ,,1, ~"" lll,....-n al..,_
~~~~~~~~,-~-~ r('
~ ..-... (. ( - -~ ... -~ __ ,-=---~
0 I MILE
0 I KILOMETRE
Figure 3.--Mokuaweoweo caldera and adjacent pit craters on the summit of Mauna Loa. View from the southwest. The large caldera is about 9,000 feet from left to right. From Wentworth and Macdonald (1953).
13
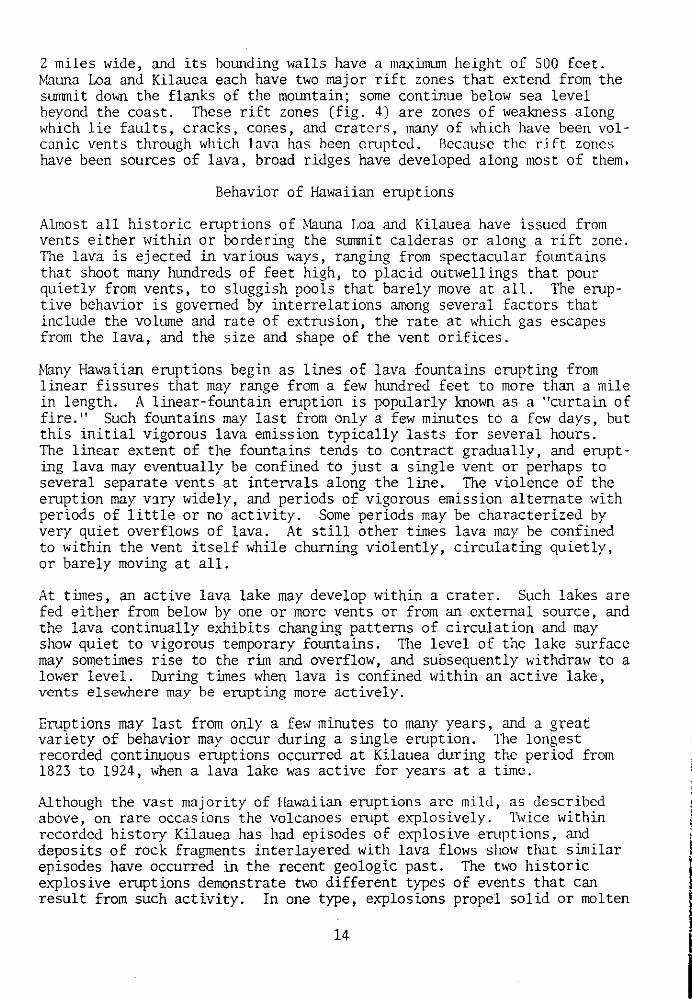
2 miles wide, and its bow1ding walls have a maximwn height of 500 feet. ~huna Loa and Kilauea each have two major rift zones that extend from the summit down the flanks of the mountain; some continue below sea level beyond the coast. These rift zones (fig. 4) are zones of weakness along which lie faults, cracks, cones, and craters, many of which have been volcanic vents through which lava has been entpted. Because the ri rt zones have been sources of lava, broad ridges have developed along most of them.
Behavior of Hawaiian eruptions
Almost all historic eruptions of ~hWla Loa and Kilauea have issued from vents either within or bordering the summit calderas or along a rift zone. The lava is ejected in various ways, ranging from spectacular fountains that shoot many hWldreds of feet high, to placid outwellings that pour quietly from vents, to sluggish pools that barely move at all. The eruptive behavior is governed by interrelations among several factors that include the volume and rate of extfltsion, the rate at which gas escapes from the lava, and the size and shape of the vent orifices.
Many Hawaiian eruptions begin as lines of lava fountains erupting from linear fissures that may range from a few hundred feet to more than a mile in length. A linear-fountain eruption is popularly known as a "curtain of fire." Such fountains may last from only a few minutes to a few days, but this initial vigorous lava emission typically lasts for several hours. The linear extent of the fountains tends to contract gradually, and erupting lava may eventually be confined to just a single vent or perhaps to several separate vents at intervals along the line. The violence of the eruption may v:uy widely, and periods of vigorous emission alternate with periods of little or no activity. Some periods may be characterized by very quiet overflows of lava. At still other times lava may be confined to within the vent itself while churning violently, circulating quietly, or barely moving at all.
At times, an active lava lake may develop within a crater. Such lakes are fed either from below by one or more vents or from an external source, and the lava continually exhibits changing patterns of circulation and may show quiet to vigorous temporary fountains. The level of the lake surface may sometimes rise to the rim and overflow, and subsequently withdraw to a lower level. During times when lava is confined within an active lake, vents elsewhere may be erupting more actively.
Eruptions may last from only a few minutes to many years, and a great variety of behavior may occur during a single eruption. The longest recorded continuous eruptions occurred at Kilauea during the period from 1823 to 1924, when a lava lake was active for years at a time.
Although the vast majority of Hawaiian eruptions are mild, as described above, on rare occasions the volcanoes er11pt explosively. 1\;ice within recorded history Kilauea has had episodes of explosive entptions, and deposits of rock fragments interlayered with lava flows show that similar episodes have occurred in the recent geologic past. The two historic explosive eruptions demonstrate two different types of events that can result from such activity. In one type, explosions propel solid or molten
14
. '
J,
' '

e [
t
,·e nd
ce a
ar
Figure 4 .--Fissure and cones along the northeast rift zone of Mauna Loa volcano. Puu Ulaula, in the upper right corner, is a cinder cone about 0. 4 mile across. The general slope of the ground surface is toward the left, Vertical air photo by 18th Air Base Photo Laboratory, Air Corps, U.S. Army.
I.
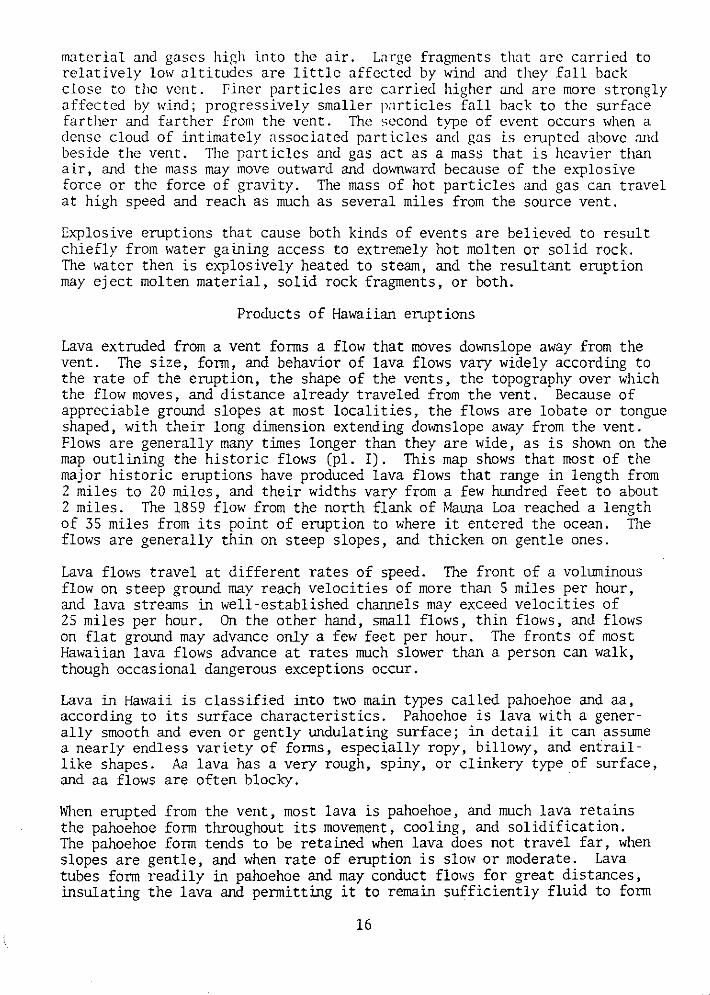
material and gases high into the air. Large fragments that nrc cnrried to relatively lmv altitudes are little affected by wind and they fall back close to the vent. riner particles arc cnrried higher and are more strongly affected by wind; progressively smaller particles fall back to the surface farther and farther from the vent. The second type of event occurs when a dense cloud of intimately associated particles and gas is erupted above and beside the vent. The particles and gas act as a mass that is heavier than air, and the mass may move outward and downward because of the explosive force or the force of gravity. The mass of hot particles and gas can travel at high speed and reach as much as several miles from the source vent.
Explosive eruptions that cause both kinds of events are believed to result chiefly from water gaining access to extremely hot molten or solid rock. The water then is explosively heated to steam, and the resultant eruption may eject molten material, solid rock fragments, or both.
Products of Hawaiian eruptions
Lava extruded from a vent forms a flow that moves downslope away from the vent. The size, form, and behavior of lava flows vary widely according to the rate of the eruption, the shape of the vents, the topography over which the flow moves, and distance already traveled from the vent. Because of appreciable ground slopes at most localities, the flows are lobate or tongue shaped, with their long dimension extending downslope away from the vent. Flows are generally many times longer than they are wide, as is shown on the map outlining the historic flows (pl. I). This map shows that most of the major historic eruptions have produced lava flows that range in length from 2 miles to 20 miles, and their widths vary from a few hundred feet to about 2 miles. The 1859 flow from the north flank of Mauna Loa reached a length of 35 miles from its point of eruption to where it entered the ocean. The flows are generally thin on steep slopes, and thicken on gentle ones.
Lava flows travel at different rates of speed. The front of a voluminous flow on steep ground may reach velocities of more than 5 miles per hour, and lava streams in well-established channels may exceed velocities of 25 miles per hour. On the other hand, small flows, thin flows, and flows on flat ground may advance only a few feet per hour. The fronts of most Hawaiian lava flows advance at rates much slower than a person can walk, though occasional dangerous exceptions occur.
Lava in Hawaii is classified into two main types called pahoehoe and aa, according to its surface characteristics. Pahoehoe is lava with a generally smooth and even or gently undulating surface; in detail it cru1 assume a nearly endless variety of forms, especially ropy, billowy, and entraillike shapes. Aa lava has a very rough, spiny, or clinkery type of surface, and aa flows are often blocky.
When erupted from the vent, most lava is pahoehoe, and much lava retains the pahoehoe form throughout its movement, cooling, illld solidification. The pahoehoe form tends to be retained when lava does not travel far, when slopes are gentle, illld when rate of eruption is slow or moderate. Lava tubes form readily in pahoehoe illld may conduct flows for great distances, insulating the lava ruld permitting it to remain sufficiently fluid to form
16
i ;
\ ' ~
t
' i ~. ' b
' ' l
I '
r !
' '
t il
0
gly e a nd n
vel
t
:o .ch
the 1e ~om
JUt
th 1e
ne
ce,
en
nn
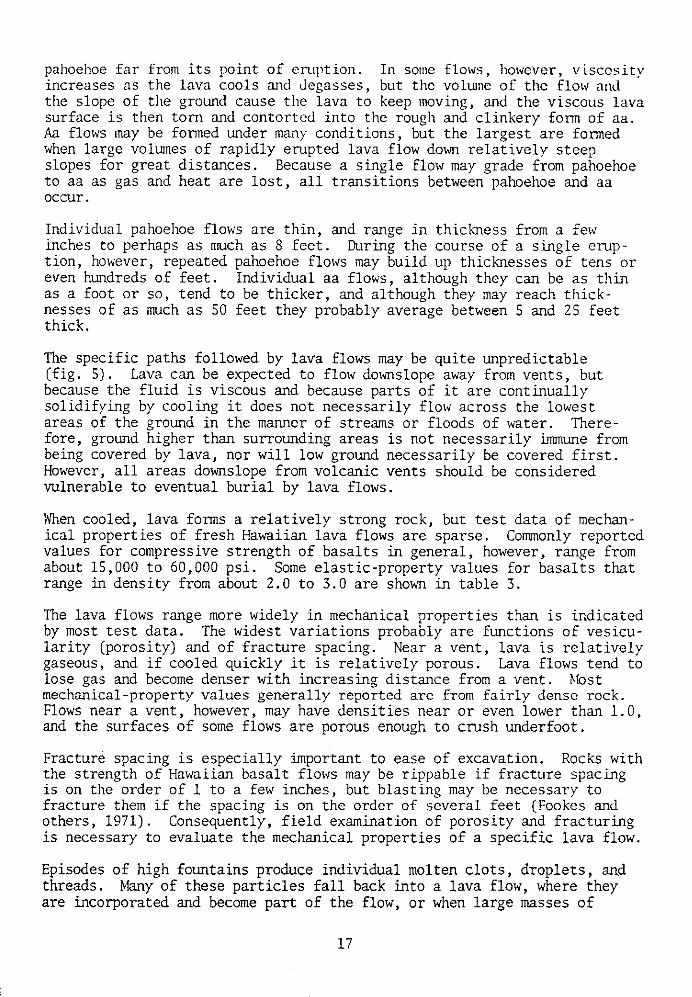
pahoehoe far from its point of en1ption. In some flows, however, vlsco5ity increases as the lava cools and degasses, but the volume of the flo1v and the slope of the ground cause the lava to keep moving, and the viscous lava surface is then torn and contorted into the rough and clinkery fonn of aa. Aa flows may be fonned under many conditions, but the largest are fonned when large volumes of rapidly erupted lava flow down relatively steep slopes for great distances. Because a single flow may grade from pahoehoe to aa as gas and heat are lost, all transitions between pahoehoe and aa occur.
Individual pahoehoe flows are thin, and range in thickness from a few inches to perhaps as much as 8 feet. During the course of a single eruption, however, repeated pahoehoe flows may build up thicknesses of tens or even hundreds of feet. Individual aa flows, although they can be as thin as a foot or so, tend to be thicker, and although they may reach thicknesses of as much as 50 feet they probably average between 5 and 25 feet thick.
The specific paths followed by lava flows may be quite unpredictable (fig. 5). Lava can be expected to flow downslope away from vents, but because the fluid is viscous and because parts of it are continually solidifying by cooling it does not necessarily flow across the lowest areas of the ground in the manner of streams or floods of water. Therefore, ground higher than surrounding areas is not necessarily immune from being covered by lava, nor will low ground necessarily be covered first. However, all areas downslope from volcanic vents should be considered vulnerable to eventual burial by lava flows.
l~en cooled, lava fonns a relatively strong rock, but test data of mechanical properties of fresh Hawaiian lava flows are sparse. Commonly reported values for compressive strength of basalts in general, however, range from about 15,000 to 60,000 psi. Some elastic-property values for basalts that range in density from about 2.0 to 3.0 are shown in table 3.
The lava flows range more widely in mechanical properties than is indicated by most test data. The widest variations probably are functions of vesicularity (porosity) and of fracture spacing. Near a vent, lava is relatively gaseous, and if cooled quickly it is relatively porous. Lava flows tend to lose gas and become denser with increasing distance from a vent. ~lost mechanical-property values generally reported are from fairly dense rock. Flows near a vent, however, may have densities near or even lower than 1.0, and the surfaces of some flows are porous enough to crush underfoot.
Fracture spacing is especially important to ease of excavation. Rocks with the strength of Hawaiian basalt flows may be rippable if fracture spacing is on the order of 1 to a few inches, but blasting may be necessary to fracture them if the spacing is on the order of several feet (Fookes and others, 1971). Consequently, field examination of porosity and fracturing is necessary to evaluate the mechanical properties of a specific lava flow.
Episodes of high fountains produce individual molten clots, droplets, and threads. Many of these particles fall back into a lava flow, where they are incorporated and become part of the flow, or when large masses of
17

Figure 5.--Lava flows on the southeast flank of Kilauea. Flows branch and rejoin, leaving areas surrounded but not covered (kipukas).
18
l
' ~·
! t f •
(. I' '
' I
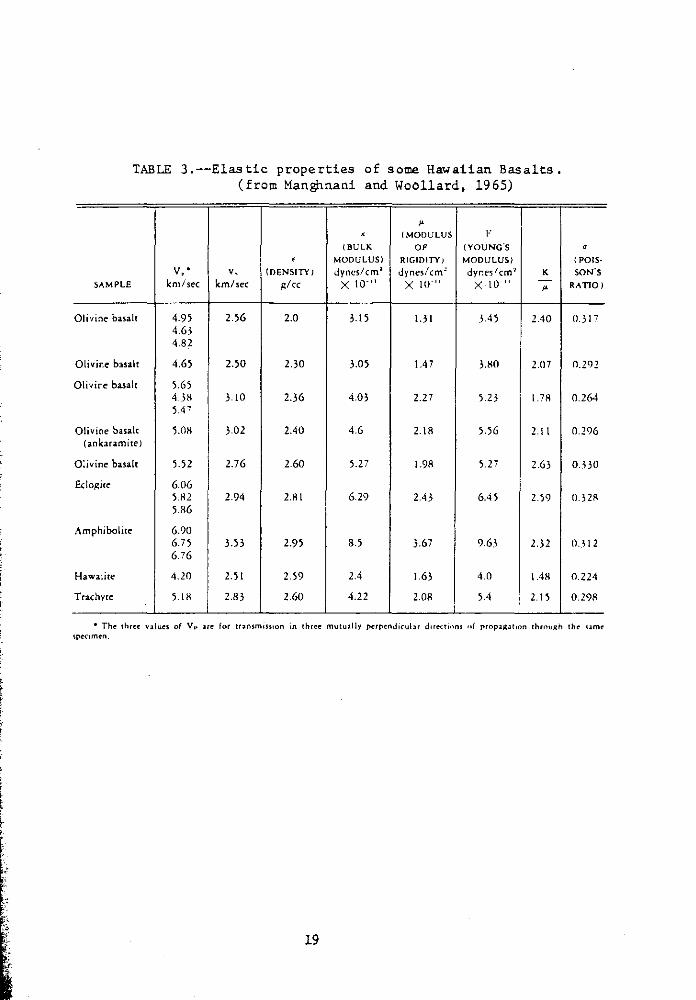
TABLE 3.--Elastic properties of some Hawaiian Basalts. (from Manghnani and Woollard, 1965)
" ' (MODULUS F (BULK OF (YOUNG'S
• MODULUS) RIGIDin') MODULUS) VI .• v. (DENSITI J dynes/cm2 dynes/em~ dyr.es I em~ K
SAMPLE km/sec km/sec ;:.Icc X 10-11 XIW" X lO-" -"
Oli·,ine basalt 4.95 2.56 2.0 3.D 1.31 3.45 2.40 4.63 4.82
Olivine basalt 4.65 2.50 2.30 3.D5 1.47 3.HO 2.07
0\i'lire basalt 5.65 4 3H 3.10 2.36 4.03 2.27 5.23 l.?R 5.41'
Olivine basalt 5.0H 3.02 2.40 4.6 2.18 5.56 2.11 (ankaramite)
o:ivine basalt 5.52 2.76 2.60 5.27 1.98 5.27 2.63
Ec!o~":ite 6.06 5.H2 2.94 2.81 6.29 2.43 6.4 5 2.59 5.86
Amphibolite 6.90 6. 75 3.53 2.95 8.5 3.67 9.6.\ 2.32 6.76
Hawaiite 4.20 2.5 I 2.59 2.4 1.63 4.0 1.4H
Trachyte 5.1H 2.83 2.60 4.22 2.08 5.4 2.1 j
a
{POlS-
SON'S
R..\110)
0.317
0.292
0.264
0.296
0.\30
0.32R
0 .. \12
0.224
0.29R
• Th~ three: v,[ues o( Vc• Jre for tnrumiss10n in three mutually pc:rptndicubr d.rtctu>ns nf propa,IIJI<On throu.~~:h the: ume ~pc:nmc:n.
19
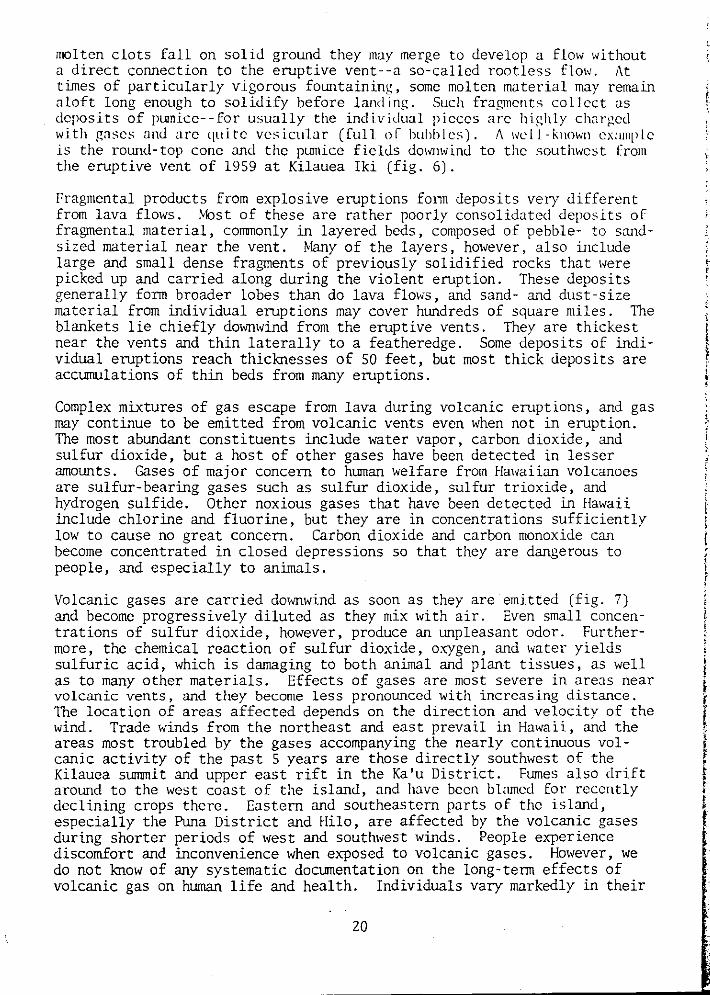
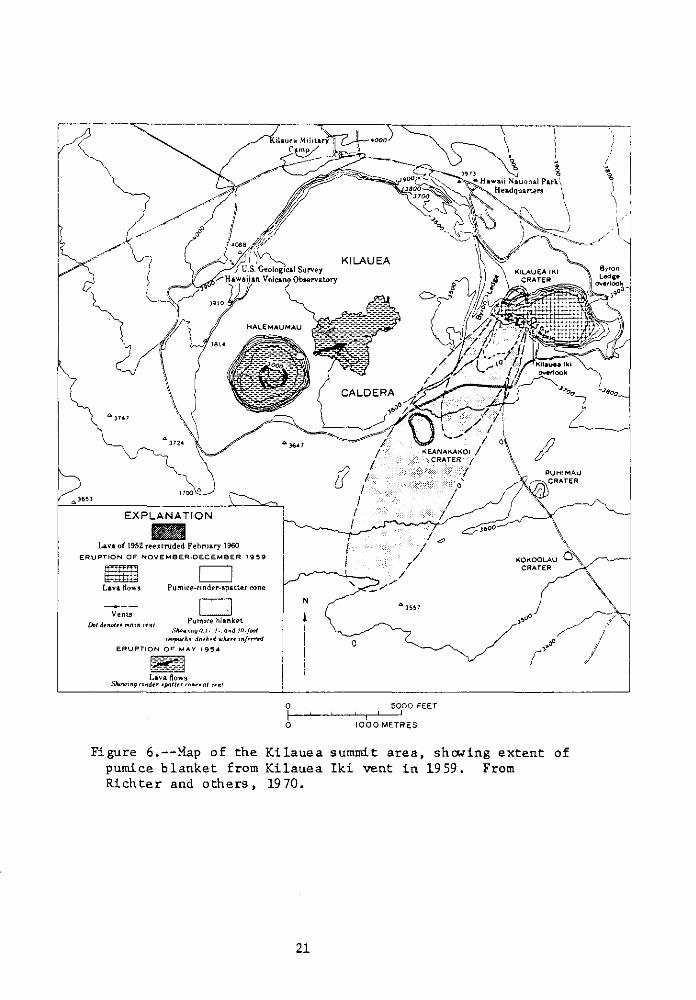
molten clots fall on solid groW1d they may merge to develop a fl01; without a direct connection to the eruptive vent--a so-called rootless flow. At times of particularly vigorous foW1taining, some molten material may remain aloft long enough to solidify before landing. Such fragments collect as deposits of pumice--for usually the individual pieces arc highly charged with gases and arc quite vesicular (full ol bubbles). A "ell-known cx,unplc is the roW1d-top cone and the pumice fields dOI,'ll\<ind to the southwest from the eruptive vent of 1959 at Kilauea Iki (fig. 6).
Fragmental products from explosive eruptions form deposits very different from lava flows. Most of these are rather poorly consolidated deposits of fragmental material, commonly in layered beds, composed of pebble- to sandsized material near the vent. Many of the layers, however, also include large and small dense fragments of previously solidified rocks that were picked up and carried along during the violent eruption. These deposits generally form broader lobes than do lava flows, and sand- and dust-size material from individual eruptions may cover hW1dreds of square miles. The blankets lie chiefly downwind from the eruptive vents. They are thickest near the vents and thin laterally to a featheredge. Some deposits of individual eruptions reach thicknesses of 50 feet, but most thick deposits are accumulations of thin beds from many eruptions.
Complex mixtures of gas escape from lava during volcanic eruptions, and gas may continue to be emitted from volcanic vents even when not in eruption. The most abW1dant constituents include water vapor, carbon dioxide, and sulfur dioxide, but a host of other gases have been detected in lesser amoW1ts. Gases of major concern to human welfare from Ha11aiian volcanoes are sulfur-bearing gases such as sulfur dioxide, sulfur trioxide, and hydrogen sulfide. Other noxious gases that have been detected in Hawaii include chlorine and fluorine, but they are in concentrations sufficiently low to cause no great concern. Carbon dioxide and carbon monoxide can become concentrated in closed depressions so that they are dangerous to people, and especially to animals.
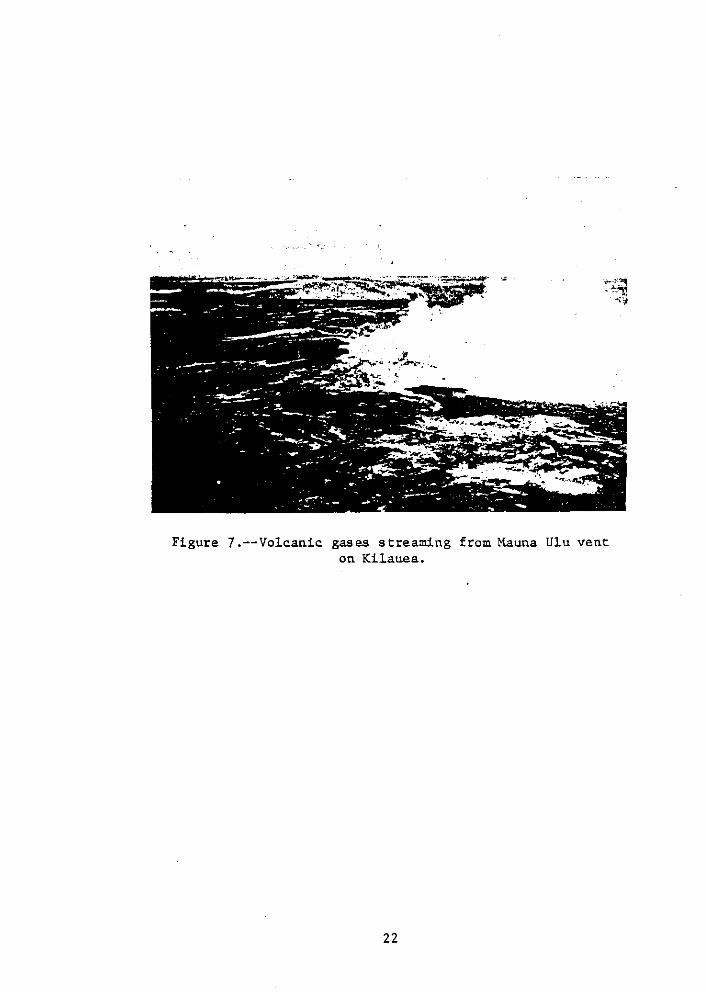
Volcanic gases are carried downwind as soon as they are emitted (fig. 7) and become progressively diluted as they mix with air. Even small concentrations of sulfur dioxide, however, produce an unpleasant odor. Furthermore, the chemical reaction of sulfur dioxide, oxygen, and 11a ter yields sulfuric acid, which is damaging to both animal and plant tissues, as well as to many other materials. Effects of gases are most severe in areas near volcanic vents, and they become less pronounced with increasing distance. The location of areas affected depends on the direction and velocity of the wind. Trade winds from the northeast and east prevail in Hawaii, and the areas most troubled by the gases accompanying the nearly continuous volcanic activity of the past 5 years are those directly southwest of the Kilauea summit and upper east rift in the Ka'u District. Fumes also drift aroW1d to the west coast of the island, and have been bLuncd for recently declining crops there. Eastern and southeastern parts of the island, especially the Puna District and Hila, are affected by the volcanic gases during shorter periods of west and southwest winds. People experience discomfort and inconvenience when exposed to volcanic gases. Hm;ever, we do not know of any systematic documentation on the long-term effects of volcanic gas on human life and health. Individuals vary markedly in their
20
' F '
I !
11
e
s
r
e
Lava o( \952 ree~truded February 1960 ERUPTION OF NOVEMBER-DECEMBER 1959
f8ffil D Lava ftows Pumke-cindt>r-spatter oone
Vent.:l D Pum1re hlankl't
Siomnng fl I·, /-.and 10-fMI. ,...,..../t,, dn•h"f ..,,v,... '"f~rt'rd
ERUPTION OF' MAY 19!54
~ ~ Lava ftows
SNnt'l'~g ro,.dtr-•p<JIIu rn,.,. at ,.,,.,
KILAUEA
N
Q
r
0 5000 FEET i--~~'-r-~ 0 1000 METRES
Figure 6.--Map of the Kilauea summit area, sha-ring extent of pumice blanket from Kilauea Iki vent in 1959. From Richter and others, 1970.
21
, I
I
''
Figure 7 .--Volcanic gases streaming from Mauna Ulu vent on Kilauea.
' ' ~'
i ' 1
,, ('
c c c d
F 0
t T t: c IT m:

sensitivity to sulfur gases, and some people, especially those with respiratory difficulties, have suffered severe discomfort, illness, and even death when exposed to the volemic fumes.
Explosive eruptions can produce r3pidly moving clouds th3t arc mixtures of solid or liquid particles and gases. Gases in these clouds may be of high concentrations, and these gases often are not quickly diluted by mixing with the atmosphere. The combination of heat, particles, and gas in such a cloud may be even more dangerous to human life than the shock of the explosion or impact of fragments. According to rather sketchy accounts, the positions and condition of bodies of persons killed during the 1790 eruption indicated asphyxiation and burning rather than injuries caused by flying debris (Swanson and Christiansen, 1973). Such particle-and-gas clouds are rare, and should not be confused with the gas that constantly issues and drifts away from active and recently active vents.
Hypotheses on the behavior of Hawaiian volcanoes
Even though the ultimate reasons for volcanic activity cannot be explained, much is known about the behavior of Hawaiian volcanoes and reasonable explanations for this behavior can be advanced. \~en basaltic lava is erupted, it tends to be much more fluid than andesitic and rhyolitic lavas erupted by certain other volcanoes. This high degree of fluidity explains the characteristically quiet eruptive behavior of Hawaiian volcanoes as well as their relatively gentle slopes. Fluid lava spreads easily, permitting any given volume to travel farther laterally than it would if it were more viscous. This ability to spread out is a major reason that the slopes of Hawaiian volcanoes average only 5°-15°, in contrast with volcanoes of other compositions whose slopes reach angles of as much as 20°-40°.
The fluidity of basalt also explains the relative rarity of explosive eruptions. Gas 1s constantly escaping from magma within the conduit under the vent. It forms bubbles which rise through the liquid and escape at the upper surface. If the liquid is quite fluid, the gas bubbles can readily escape, so the internal pressure of the gas within the conduit remains low. However, if the magma is very viscous, the gas is not able to escape so readily, and gas pressures within the conduit may become very high. Then, when the external seal is broken for any reason, gas escapes suddenly and violently, causing a volcanic explosion. Many of the cones on the upper parts of ~nuna Kea and Hualalai are the products of explosive eruptions, and if these volcanoes should again become active, similar eruptions can be anticipated. Such explosions, hm;ever, would be minor compared to some catastrophic volcanic explosions ·elsewhere in the world during historic time.
Returning to the more common type of !lawai ian volcanic activity, the nature of a particular eruptive episode, ~;hether it is high fow1tains, lo~; fotmtains, or quiet outwelling, is determined by several interrelated factors. The most important of these are the amount of magma, the amount of gas and the gas pressure ~;ithin the magma, and the size, shape, and number of the eruptive vents. Each of these factors may change as an eruption progresses. Initial outbreaks are often the most vigorous, involving large amounts of magma with a high gas content, and, furthermore, vents may be rather

con,.;tricted. These conditions tend to produce copious voltuncs of l;.~va as fountains. \\'hen magma volume cmLl gas pressure decl inc, enrptivc vigor also tlccl ines. i\s vent ol"iCices chcmgc their :;izc cmd sh;qll', the velocity of [;iVil pa,.;sing through them changes. i\ giVl'fl VO[WJIC oC lava passing through a vent within a ccr·tni_n tiJnc ntust travel rapidly if the vent is sm:rll hut can move more slowly if the vent is large. Constant changes among all of these factors produce the vnrying types of behavior th<1t characterize any emption.
Features such as viscosity, volwnc, m1d gas content play a part in Jctcmtining the eruptive beh;.~vior of a volcano. The precise conditions that deterndne that behavior arc not readily apparent, m1d the following ideas have gradually developed from the careful studies, observations, m1d measurements made by scientists of the Hawaiian Volcano Observatory throughout the past several decades. The hypotheses developed from these studies propose that magma is being generated at some level within the earth, probably at a depth exceeding 25 or 30 miles, at a rather consta11t rate. The magma gradually works its way up1vard, a11d it may be collected a11d temporarily stored in reservoirs at depths below the surface varying from one-half to perhaps as much as 3 miles. As the shallow reservoirs swell with increased 311\ounts of magma, the actual shape of the volcano changes--the slope of the ground increases and points on the surface spread apart. These changes in shape are very small; people CaJIDot see them by watching, but the amount a11d direction of these changes ca11 be detected by sensitive equipment. A study of these changes through several years has clearly sh01vn that the volca11o inflates with magma prior to eruption and that the inflation stops 1<hen the eruption begins. During some eruptions, when magma is rapidly evacuated from the reservoir, the measured changes indicate that the volcano deflates as a result of the eruption, a11d some deflations are large and rapid. CertaiJ1 other eruptions more moderate in rate a11d volume, such as those at llalemaumau in 1967-1968 aJ1d ~fauna Ulu in 1972, cause little change in the stnte of swelling of the volcano. This is evidently caused by the rate of lava extrusion being nearly equal to the rate at which mab'llla is supplied from below. Several times Kilauea volca11o has abruptly deflated without aJ1 entption, generally as a result of withdrawal of magma from the near-surmnit reservoirs and lateral movement to other reservoirs within a rift zone. Such migration of magma may be confirmed by study of seismic records. TI1e changes in shape of the volca11o as revealed by deformation studies seem to be closely related to the eruptive behavior. The overall rate of magma supply from depth seems to remain about constant at about 400,000 cubic yards per day (/'loore, 1970; Swanson, 1972), whether or not there is eruptive activity. During noneruptive periods, upward-moving magma is stored in reservoirs, causing a corresponding deformation of the volca11o.
Prediction of future volcanic activity
Frequent eruptions can be expected from both KilaueCt imd ~launa Loa in the future. Based on past experience, erupt ions will vary from hrief voltnninous outpourings of lava to long-lived eruptions that produce lava at moderate rates. It is unlikely that a11y periods longer than 5 or 10 years will elapse without an eruption at one or the other of the tlvo volca11oes. Lava will be emitted chiefly from vents in the summit areas and from along the rift zones. VcntiJ1g from other areas is much less 1 i kely, but the
24
,.
'·

0
I I
rnr-
nts t t pth
IS
of
i.tdy 0
t.he
.tes :cr
\e of I : an nmit
lhe to
pcd
. he :n-
-~ars
~s.
long
entire flanks of hath volcanoes arc subject to hejng covered by lnva flmvs. During each 20-year period from 1830 to the present, a total area ranging from about 25 to 75 square miles was innndated with lava from Kilauea and Manna Loa. There is no reason to expect a decline in this rate during the next 20 years. llmvcver, it is impossible to predict specific:.~lly 1vherc eruptions 1vill occur next, how frequent eruptions will be in a given area, or what specific areas 1vill be covered by lava.
Explosive eruptions have occurred from Kilauea at infrequent and irreh~lar intervals during the past several thousand years. Coarse volcanic fragments from some of these eruptions fell copiously near the vent, and thin deposits of ash settled over hnndreds of square miles. It is possible that such eruptions will occur again, but episodes of explosive activity will probably occur only at intervals of a few tens to a few hundreds of years--too infrequently to provide a basis for any numerical predictive probability. The hazards from explosive activity at Kilauea and Mauna Loa in the near future are regarded as small but appreciable near the vent.
Hualalai volcano, older than either ~1anna Loa or Kilauea, has progressed to a different stage in its life cycle. Its lava has the same general appearance as the lava from Mauna Loa and Kilauea, but chemical analysis shows it to be of a somewhat different type. The recent lava flows from Hualalai were highly fluid, but recent eruptions have also built cinder cones and spatter cones that are larger and more abundant than those on Mauna Loa and Kilauea; explosive eruptions evidently have been more common on Hualalai. Future eruptions of Hualalai will probably include lava flows, similar to those of 1800 and 1801, and explosive activity will produce new cinder cones and spatter cones. Eruptions can be expected to originate in the summit area and along the northwest and southeast rift zones, and areas downslope from the erupting vents will be subject to inundation by lava flows.
Because of the lack of dates for any lava flows or pyroclastic products earlier than 1800, it is very difficult to state the probable frequency of Hualalai eruptions. It likely does not follow any regular schedule, but in vie1v of its quiescence for more than 170 years its eruptive interval may be on the order of two hundred to several hundred years. The next eruption of Hualalai could conceivably occur within the lifespan of persons now living.
Mauna Kea and Kohala have not been active within the last 200 years. The probability that Kohala will erupt again during the next few hundred years is very small. The yonngest flow of Kohala has been dated at about 60,000 years, and future activity of this volcano is less likely than of any other on the island. The most recent activity of Matma Kea, though not precisely dated, occurred less than 5,000 years ago (Porter, 1971) . This is recent enough to suggest the possibility that activity could recur within the next few hundred years. Future eruptions will prohably be mildly or moderately explosive, and fine volcanic ash may travel considerable distances downwind from the vent. Coarse ash and cinders will likely build large cones similar to those of the summit area and upper flanks. Lava flows may also be erupted; they would likely be relatively viscous and thick, and probably would not travel more than a few miles from their

cn1pt ivc vent~. Young cones on ~t:Juna 1\ca :1re ahund:Jnt only :Jbove about 6,1100 feet, and any acttvlty would most likely originate within that same zone high on the mountain.
l'ossibil ity of control or volcanic pmuucts
At the present state of knowledge and teclmology, there is no practical 1vay to slow or stop a volcanic eruption. The total <mlounts of energy involved 1n an en1ption arc vast, and the specific locations and details of behavior of any outbreak arc highly variable. Any measures m<m might take in attempting to plug or block an eruptive outbreak would be futile.
In contrast, it may be possible to divert floHing lava from its path and to dam flows when destruction of property is imminent. Several such attempts have been made, and although most efforts have not been successful, in certain cases barriers have temporarily impeded lava flows. Where a floH subsequently stopped at its source by natural means, the delay was effective in saving property.
1\<o major methods have been considered in Hawaii as possible ways to control the paths of lava flows: (1) use of normal engineering means to construct barriers and diversion channels, and (2) use of explosives to obstruct established channels.
(1) ~bst efforts to stop flows by erecting barriers have not been successful. If a floH is small and short lived, barriers may be temporarily effective, and even old stone walls have been observed to divert thin flows from their paths. Theoretically, structures of sufficient size and strength could be constructed to divert lava flows as large as any historic flow. For such barriers to be effective, wide smooth channels Hould have to be provided to accommodate the lava flow in the selected path. Without such diversion channels, a prolonged flow would merely thicken behind the barrier and ul t imatcly either overflow or break it. Lava flmvs erupted in the past few years at Kilauea, when crossing highways of appropriate gradient, have been readily diverted and have traveled appreciable distances along the smooth road1vay. Several years ago, a project was proposed and designs submitted to protect the city of Hila by a system of barriers and diversion channels. l!mvever, the economics of construction costs, price of land, and commitments to existing land usc in relation to the value of the property to be protecteel prevented the project from being carried out. Such problems make it Lmlikely that this method will be attempted on any but a very small scale, but if the need were great enough a carefully planned, small-scale system might be feasible and effective.
(2) Efforts were m;1dc in 1935 and 1942 to divert Mauna I.m flm<s by bombing, bec;1use the flOI>S were threatening ll ilo. ll11cn casually cons ide red, bombing may seem to be an effort of futility and desperation. llmvever, sound reasoning lay behind the plan. Long-lived, long-distance flows travel most of their length through lava tubes or \veil-established open chwmelways that develop and grow as an eruption continues. If a feeding tube or channel could be breached near its source, and the old tube or channel blocked, the distant advancing lava front would lose its source of supply, and newly erupted lava would have to build a new tube and channel system. It might
26
y
'r lpt-
:o
ive
rol t
ful. , ir 'e I
to :han-
~en
l
i to
e, 11
ing, ing a-of
ct
the
lt
take considerable time for the new tube system to reach areas of habitation. The bombings of 1935 and 1942 may have been partly successful, and they demonstrated the feasibility of the method; in both cases, however, the flows stopped by natural causes before the method had received a full test. Bombs or artillery fire might effectively divert future flows from important areas if the configuration of the flow were appropriate.
A third method of controlling lava flows is currently (1973) being tried on the island of Heimaey in Iceland, where large amounts of sea water are being sprayed on flows advancing toward the important harbor. As the water chills the lava, it piles up to form a dam, which, it is hoped, will divert additional lava away from the harbor. Although it is still too early to determine whether the effort will ultimately succeed, the present outlook is favorable.
If one of the Hawaiian volcanoes should erupt explosively, small amounts of fine particles might be projected over great areas. No methods are known for controlling or preventing this kind of action or the distribution of the erupted products.
27
lli:SCRll'TION Of V(1l.CAN!C I 11\ZJ\RilS
Classific:Ition
The ~<ord hc1Za1·d is u~ccl in this report in the sense o[ ;1 snul·cc o[ risk to persons nnd property. Volcanoes en1pt materials aml Glusc ground movements, both or "hich arc called hnzards because they can affect man Gdvcrscly. lla:ards considered to be "volcanic" in this report Gre those cGuscd by surface eruptions or by movement of molten rock close to the surface.
Volcanic hGzards described as "direct" are products of volcanic eruptions that cause danger by actual contact with the erupted materials. n1cse products are (1) molten lava flows, (2) rock fragments propelled through the air, (3) volcanic gases (fumes), and (4) particle-and-gas clouds that flow as a mass at high speed.
Volcanic hazards described as "indirect" are chiefly movements of the ground; they include (1) subsidence, (2) surface ruptures, and (3) earthquake shaking. Another hazard described as "indirect" consists of (4) ocean waves that can result from submarine volcanic explosions or from crustal movements that displace parts of the ocean floor; these are called seismic sea waves or "tsunamis." Still another indirect volcanic hazard that can result from volcanic eruptions is (5) fire started by hot lava flows or fragments.
Ground movements and tsunamis that result directly from volcanic eruptions are generally of small magnitude; overall, they pose only a minor risk, mainly to property, even though locally the effects may be severe.
f~JCh more severe ground movements and tsunamis result from crustal (tectonic) movements that have no direct connection 1;ith eruptions; these more severe events can present major risks to both life and property on the island. Some of these movements may be caused by adjustment of the earth's cn1st to the load of the volcanoes on the sea floor, or to relative downward and outward slumping of outer parts of the volca.;1ic pile tm<ard the sea floor. Other movements result from shifts of parts of the earth's crust that have nothing to do with the island. Still others probably result from movements of molten rock deep undergrotmd, and so may be related to volcanic activity. The cause of a specific ground movement may not be knoh~ and is not essential to this evaluation of hazards. To avoid that problem, and to avoid underemphasis of some important geologic hazards by describing only those that are related to volcanic en1ptions, the following descriptions of both ground movement and tsunami hazards treat some events of nonvolcanic as well as volcanic origin.
In general, the ground-movement hazards result from geologic events that occur within, tmcler, or near the island. In contrast, the most damaging tstmcunis of the [Klst, 1;ith one exception, originated thousands of miles away, in South America, Alaska, and the Far East.
,.

L)
ts,
Jm
Jd
ns
e
;e 11ay 1id
t
(
Direct volcanic hazards
Lava flows
Lava flows ongmate in mild welling or foillltaining eruptions from a pipelike vent or from long linear cracks (see p. 14 for general descrip· tion). From the point of eruption, the molten lava moves generally down the steepest gradient available, but it does not necessarily flow in the manner of water. Instead, it may build ridges along its sides and front that locally cause it to cross slopes diagonally, or to pond and flow over obstacles. Natural and artificial obstacles may cause flmvs to change direction; the diversion may be pennanent if the course the lava is diverted into remains clear, or if little or no additional lava is erupted. But if the new course becomes filled or clogged, the obstacle that caused the diversion can be overridden.
Although lava flows assume an overall lobate shape in plan view, they may leave "islands" or "kipukas" within their overall margins (fig. 5), and the margins can be highly digitate. Distinct ridges (levees) may form along the sides and front. Longitudinal tunnels that form within the flow (lava tubes, p. 16-17) may be preserved or collapse to form steepsided channels.
A lava flow obviously raises the level of the land surface by the mnoilllt of its thickness. A fairly common assumption is that the next lava flow will not inillldate that smne area. However, if one lava flow has formed distinct levees, the next flow that comes from the smne vent is likely to take the smne path as its predecessor, even though the adjacent land surface is lower.
Effects
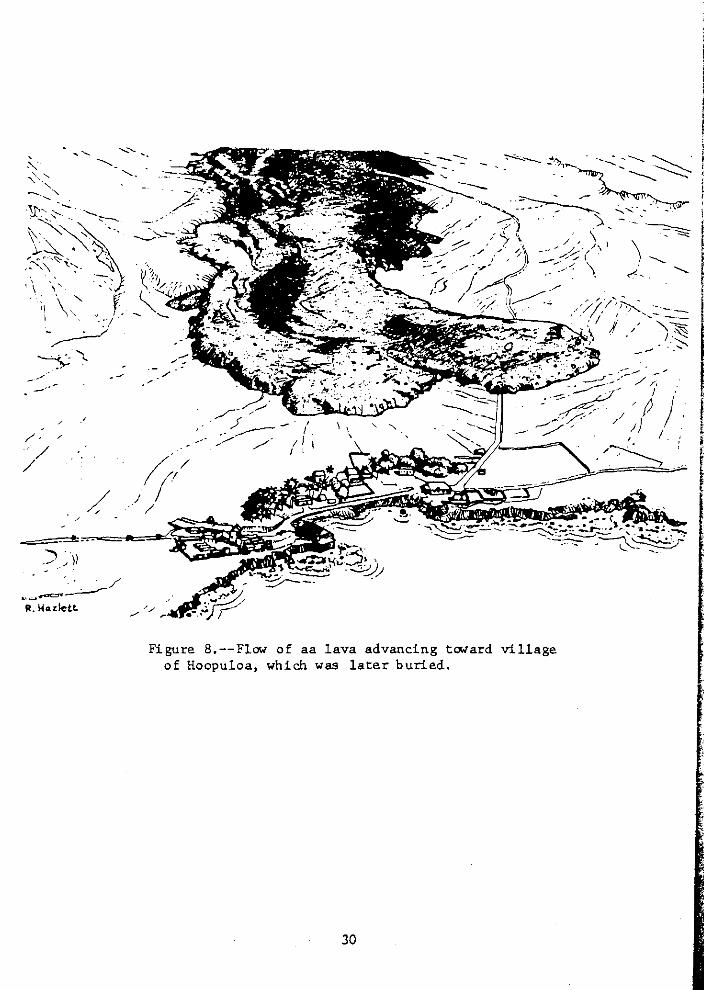
~blten lava flows endanger lives only if approached too closely, although they may start fires that could endanger lives. Lava flows pose a great danger to property because they burn, crush, or bury structures in their paths (fig. 8). The lava then cools and hardens to rock that can be removed only with great difficulty (see p. 17). Burial by a lava flmv virtually terminates the previous use of the land, and, because of the character of its surface, use of the lava flow may be severely limited for a long period of time.
Criteria used in definition of zones
The chief criteria used to establish zones of relative risk from lava flows (fig. 9) are, for each volcano, (1) number of eruptions, (2) proportion of area covered, and (3) causes of distribution of flows. These criteria are evaluated for certain recognizable periods of time in the past: (1) man's written historic record, about ZOO years; (2) the recent prehistoric geologic record, covering the last few thousand years; and (3) an older (postglacial) interval that extends over the last 10,000-15,000 years (table 4).
29
--~--
/
/
··~--=~/ Ft. ~o.rJett.
Figu re B.--Flow of Hoo 1 of aa la pu oa, which va advancin was later b g toward uried.
village
r ~:
t r i 1 ' • f
--:__~
~~
\ \--..._
./;
/1/ , I
~--""-
I( 0 H A l.. A
MOUNTAIN
• 0
./ -• ..... .
e
-----Physical boundary, approximately located
---Judgmental boundary
b
IIIII A U H A . ' . c
~d
Figure 9 .--Zones of relative risk. from lava-flow burial. Risk increases from ''a'' through''£''.
31
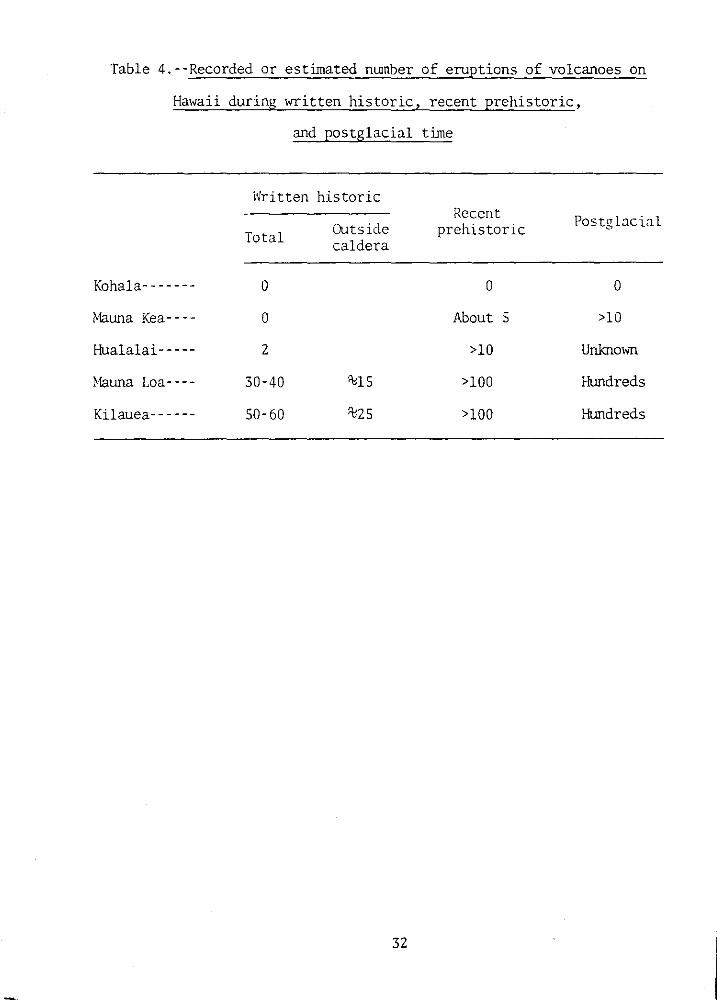
Table 4.--Recorded or estimated number of eruptions of volcanoes on
Hawaii during written historic, recent prehistoric,
and postglacial time
Written historic Recent Postglacial Outside prehistoric Total caldera
Kohala------- 0 0 0
Mauna Kea---- 0 About 5 >10
Hualalai----- 2 >10 Unknown
Hauna Loa---- 30-40 %15 >100 Hundreds
Kilauea------ 50-60 %25 >100 Hundreds
32

These past events are reviewed with resrect to the stage of develormcnt of each volcano (seep. 11), to judge ~<hether or not similar events can be expected to continue. If they can, the past frequency is used to estimate the likelihood of future eruptions, the proportion of each zone covered by lava flows is used to judge the probability of burial on each volcano as a whole, and the controls of distribution of past flows are evaluated to judge what parts of the volcanoes are most susceptible to burial.
These same criteria are used to judge the extent of zones, except where physical (topographic) features can be used to locate more definite limits. Thus, zone boundaries on the map are of two types, judgmental and physical. Those called physical are defined by topographic features that would control the extent of future lava flows. Such a boundary would enclose all slopes of any one volcano down which future lava flows erupted from it could move, plus parts of adjacent slopes as high as those lava flows would be expected to rise on them. Boundaries called judgmental, in contrast, are established arbitrarily from estimates of the probable maximum extent as well as frequency of future lava flows.
Use of these criteria shows that the risk on a few volcanoes is everywhere recognizably higher than on an adjacent volcano. Further, distinct topographic boundaries separate some adjacent volcanoes. nvo such distinctly different zones of risk are those that encompass Mauna Kea and ~1auna Loa. In other places, the degree of risk grades imperceptibly from one zone to another; generally these zones have less distinct differences in frequency of eruption and extent of flow coverage, and have judgmental boundaries. The several zones on the flank of Mauna Loa illustrate these characteristics.
Most zones of risk clearly do not have a uniform risk throughout their extent. The severity of risk in some varies from their center to their boundaries, and in others the risk grades all the way across the zone from one boundary to another. In still others, especially rift zones, the risk differs from point to point within the zone. The risk is highest in rift zones next to repeatedly active vents, which are scattered, and is somewhat less between those vents.
Variations in risk are more complex than are sho~n on the map, chiefly because of lack of adequate information. The ranking of risk zones.from one volcano to another, for example, requires comparison of the severity of risk between volcanoes whose eruptions are not recognizably related, and the data are too few for satisfactory comparison by statistical means. As a result, the risk at every place in a given zone is not necessarily less than the risk at every place in the zone of next higher risk. At present, there seems to be no way to remedy this situation.
Description of zones
As a first step, three large well-defined zones on the island are distinguished on the bases of clear differences in eruptive frequency of separate volcanoes, and boundaries that are defined by distinct physical features. They are (1) Kohala Mountain, (2) ~muna Kea, and (3) a zone that includes Hualalai, Mauna Loa, and Kilauea (fig. 9). A small zone
33
that consists of several small topographically high renmants of an older 1-launa Loa volcano is similarly well defined.
The degree of risk in most of these zones varies considerably from place to place, and further divisions could be usef-ul. ~lost lava flows originate in stumni t calderas of a volcano, or in rift zones that rndia te from the stmm1i t; almost all flows, large or small, inundate some pnrt of these caldera or rift-zone areas. Also, because of ground subsidence 1;ithin these zones, many flows tend to pond there and be confined to the zone. Thus, cnlclera and rift zones are assigned relatively high risk classifications (fig. 9).
l\ohala ~lountain, however, is not subdivided because the probability of er-uption is so low even in the rift zone. It is classified as zone a. ~muna l\ea is divided into only two risk zones (fig. 9): an upper zone that includes the most recently active vents (zone c), and the lo1;er flanks (zone b). Linear rifts in the upper zone of higher risk are not well defined, and ring fractures encircling the summit may control the positions of some vents. Thus, no areas of higher risk along linear rifts are distinguished in the upper-mountain area that includes the newer vents.
Hualalai volcano is differentiated from ~uuna Loa and Kilauea because its frequency of eruption is much lower (table 3). The degree of risk on Hualalai as a whole is less than on most of ~fauna Loa, yet is greater than at some places on Mauna Loa. The degree of risk on Hualalai is judged to range from equivalent to that in a relatively low risk part of one zone on 1-muna Loa to that in a relatively high risk part of another zone there. It is consequently classified as zone de.
Vents on Mauna Loa and Kilauea are clustered in relatively well defined caldera and rift zones. Both frequency of eruption and amount of area covered by lava flows in historic time are higher in these zones than at any other place on the island (zone f).
Three other zones of different relative risk are outlined on the flanks of Mauna Loa (fig. 9), all on the basis of extent of lava flows during historic <md recent prehistoric time. Zone d, southeast of the sUimnit, lS
distinguished from adjacent areas because it has not been invaded by any historic flows. Lava flows from summit eruptions seem to have been kept out of this zone by a high caldera wall upslope from the zone, and flows erupted from vents at lower altitudes along the rifts have not angled across the slope enough to enter the area.
A large area on the east flank of ~launa Loa is also distinguished as zone d on figure 9, because it has not been invaded by any historic lava flows. 111is large area seems to have been spared because the northeast rift zone of illauna Loa has been closed off by the grm;th of Kilauea volcano, and because the east rift zone of Kilauea has migrated southward away from that locality.
34
()
:n : t;
:tt
1\S
in-
n
8 d
e
hat
(
Roc·k fragments
Eruptions eject rock fragments ol· ""UlY :;i:e:; and t>·pc•:;. ~lildly CXI>lo:;ivc· lava "fountains" cast up blobs and threads of mol ten lava; more highly explosive en1ptions may throt; large solid and mol ten fragments thro<<gh the air separately, hut more coliDnonly the cn<ptcd fr:tgmcnts :n·c cncloscd in :1 colwnn of ~;ater vapor and other gases th:<t moves UJManl at :1 high velocity. The colLnnn can carry the debris high into the air, ~;hereupon it can then be moved laterally by wind. The larger and denser fragments fall close to the vent, and the smaller and less dense particles are carried farther :n,•ay.
The large fragments build cinder or pumice cones that may be tens or hundreds of feet thick over the vent. Beyond the cones, broad deposits of smaller particles many feet thick can be spread in a long lobe dmmwind from the vent (fig. 6). The distance to tvhich particles of any given size are carried depends on the height to which they are carried by the eruption and the wind speed. The thickness to which the fragments accumulate at any point is a function of the amount of material erupted, the distance to which it is carried, and the uniformity of 1Vind direction and speed. Steady 1Vinds during an erupt ion tend to cause fragments to accumulate in a relatively narrow but thick deposit directly downwind from the vent. Shifting 1Vinds, in contrast, spread the material more broadly and less thickly for a given amount of debris. Particles that are fine enough to remain suspended in the air for a long time can be carried great distances. Deposits of such material are very thin beyond a fe"' tens of miles from the source vent.
As a lava flow enters the ocean, steam explosions may shatter the snout of the flo"', throw lava fragments into the air, and build a so-called "littoral" cone along the shore. Because the area covered by such a cone is nearly the same as that covered by the lava flow itself, construction of littoral cones is not treated as a hazard different from that presented by the lava flo1V.
Effects
Falling rock fragments pose only a slight danger to lives from impact or heat, because escape usually is possible. Inhalation of fine rock particles could cause lung irritation and thereby endanger the health and perhaps lives of ill persons. Other dangers could be related to reduced mobility owing to poor visibility or physical blockage of escape routes, and anxiety or panic caused by an eruption. Wilcox (1959) has pointed out that the psychological effects of an eruption may be more serious than its physical effects.
Rock partie] es also endanger property. Near the vent, coarse or thick debris may batter or bury stntctures; thinner acctunulnt ions c:m kill or injure animals, crops, and beneficial birds and insects, and have other adverse effects. Such accumulations can cause collapse of structures from load, clog \vater and sewage systems, and cause severe cleanup problems. Property can also be abraded by particles that remain suspended in air or water for a long time. ~lachinery that utilizes air or water intemally is especially susceptible to damage. Even small ~nounts of particles
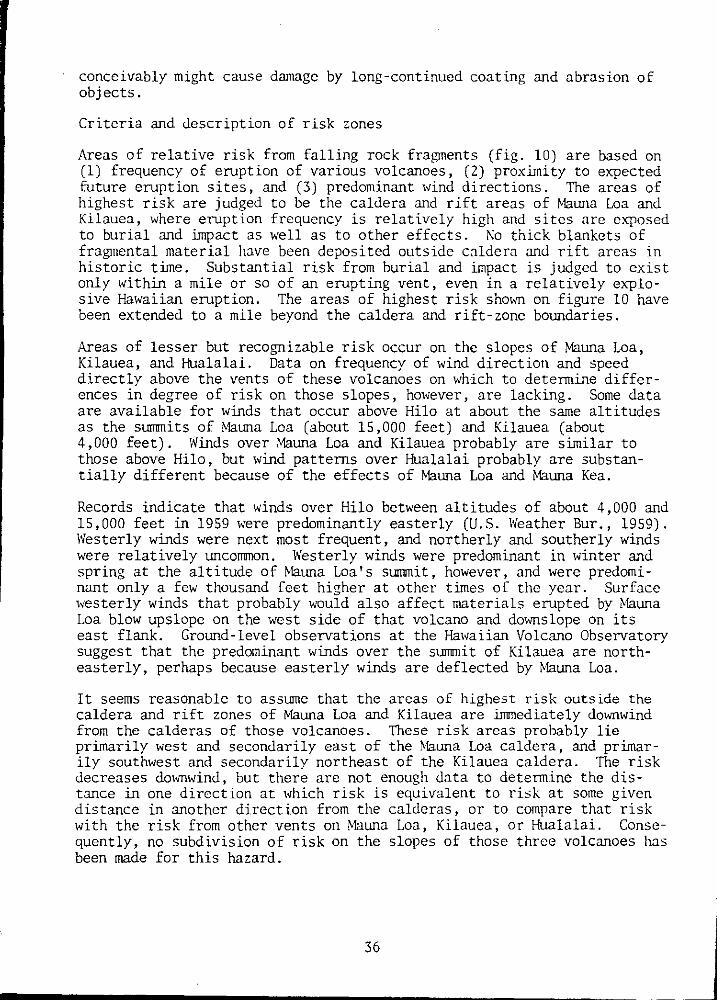
conceivably might cause damage by long-continued coating and abrasion of objects.
Criteria and description of risk zones
Areas of relative risk from falling rock fragments (fig. 10) are based on (1) frequency of eruption of various volcanoes, (2) proximity to expected future eruption sites, and (3) predominant 1vind directions. The areas of highest risk are judged to be the caldera and rift areas of ~uuna Loa and Kilauea, where eruption frequency is relatively high and sites are exposed to burial and impact as well as to other effects. No thick blankets of fragmental material have been deposited outside caldera and rift areas in historic time. Substantial risk from burial and impact is judged to exist only within a mile or so of an erupting vent, even in a relatively explosive Hawaiian eruption. The areas of highest risk shown on figure 10 have been extended to a mile beyond the caldera and rift-zone boundaries.
Areas of lesser but recognizable risk occur on the slopes of ~una Loa, Kilauea, and Hualalai. Data on frequency of 1vind direction and speed directly above the vents of these volcanoes on which to determine differences in degree of risk on those slopes, however, are lacking. Some data are available for winds that occur above Hila at about the same altitudes as the summits of ~una Loa (about 15,000 feet) and Kilauea (about 4,000 feet). Winds over ~una Loa and Kilauea probably are similar to those above Hila, but wind patterns over Hualalai probably are substantially different because of the effects of ~una Loa and ~una Kea.
Records indicate that winds over Hila between altitudes of about 4,000 and 15,000 feet in 1959 were predominantly easterly (U.S. Weather Bur., 1959). Westerly winds were next most frequent, and northerly and southerly winds were relatively uncommon. Westerly winds were predominant in winter and spring at the altitude of ~uuna Loa's summit, however, and were predominant only a few thousand feet higher at other times of the year. Surface westerly winds that probably would also affect materials erupted by ~uuna Loa blow upslope on the west side of that volcano and downslope on its east flank. Ground-level observations at the Hawaiian Volcano Observatory suggest that the predominant winds over the summit of Kilauea are northeasterly, perhaps because easterly winds are deflected by ~uuna Loa.
It seems reasonable to assume that the areas of highest risk outside the caldera and rift zones of ~una Loa and Kilauea are immediately downwind from the calderas of those volcanoes. These risk areas probably lie primarily west and secondarily east of the ~uuna Loa caldera, and primarily southwest and secondarily northeast of the Kilauea caldera. The risk decreases downwind, but there are not enough data to determine the distance in one direction at which risk is equivalent to risk at some given distance in another direction from the calderas, or to compare that risk with the risk from other vents on ~t>una Loa, Kilauea, or Hualalai. Consequently, no subdivision of risk on the slopes of those three volcanoes has been made for this hazard.
36

'11
'cl ,f td ed
n st
ve
J.
s
nd ) . s
e J.
ry
<
15
-..; \) ~·' ·-. J
/~ " " • ' .
•••~u
I( 0 H A 1.. A
MOUIYTAIN
-~ ., .. \·
• ' • ' i.." '
M
"i~: "-:.<'~
---Judgmental boundary
L
• ...... .
L
M
·""-·-
0 10 w ... us ~---.------,-___.__._----...J o •o lO•~<O"E'•ts
Figure 10.--Zones of relative risk from falling volcanic fragments: H, high; M, medium; L, low.
37

Because of the scarcity of southerly winds, much of the northern part of the island seems to have significantly less risk from eruptions of fragments than the rest of the island.
Gases
Volcanic gases commonly are emitted along with rock materials, and also may be erupted for long periods when little or no solid material is being ejected. The gases consist largely of water vapor, but contain substantial amounts of sulfur compounds, carbon dioxide, and nitrogen, and lesser amounts of carbon monoxide, argon, and chlorine. Fluorine, a dangerous component of gases from some volcanoes, is sparse in gas from Hawaiian volcanoes.
1he volcanic gases are distributed downwind in the same manner as fine rock particles, and they become progressively less concentrated do1vnwind. They can be spread over much of the island, however, and can even be carried far out to sea. Volcanic gases adhere to fine-grained erupted particles, so that gas commonly is retained in accumulations of volcanic ash. Under gentle wind conditions, some gases may flaw do1vnslope, and accumulate in closed depressions.
Drifting gases are a relatively mild danger to persons and property, but one which can become severe if continued over a long period of time. The effects of drifting gas should not be confused with the more local and much more severe effects of particle-and-gas clouds described in the next section. Drifting gases cause a choking sensation, and could endanger health and perhaps lives of some people by lung irritation, especially with prolonged exposure. The sensations caused by the gases might also contribute to panic, and accumulations in closed depressions can endanger animals and perhaps people as well. Gases can cause chemical deterioration of manmade objects and of natural materials used for decorative or utilitarian purposes. They also can damage growing crops and decorative plants.
Zones of relative risk from drifting volcanic gases are the same as the zones of risk from falling rock fragments, and are based on the same criteria. Caldera and rift areas are zones of highest risk because they include most gas-emitting vents. Areas of only slightly lesser risk probably extend from the calderas of ~!anna Loa and Kilauea in the directions of the most frequent winds (seep. 36, 38), but no data are available to compare the risk in these areas Hith that on other parts of Hualalai, Mauna Loa, and Kilauea. Most of Mauna Kea and Kohala seem to be markedly less likely to be affected by volcanic gases.
Particle-and-gas clouds
Rock fragments and gases may be thrown out together by highly explosive eruptions that produce hot particle-and-gas clouds that move laterally away from the vent at high speed. The clouds may be initially ejected laterally, or ejected nearly vertically and then fall back and spread out under the influence of gravity. Such clouds can move at speeds of several tens of miles per hour, and their temperatures may be as high
as several htmdrcds of degrees r. The effects of particle-;:md-gas clouds erupted by the volc:mo Taal in the Philippine TsLmds, which is simil;1r to the volcnnoes of llawaii, were abundant at a distance of almost 3 miles, and 1vere identified as much as 4 miles from the erupting vent (Moore and others, 1966).
Particle-and-gas clouds have occurred on the island, but they have not been common. The only such en1ption recorded on Hawaii Island occurred at the stnmnit caldera of Kilauea, where one or more particle-and-gas clouds probably were erupted in about 1790. Theoretically, such clouds should be possible at any vent whose feeding conduit can he reached hy abundant water, and they are thought to be especially likely at vents near sea level. No cones of rock fragments that were built by particleand-gas cloud eruptions are known on Hawaii Island, but such cones are present on other islands in the chain.
Effects
Hot particle-and-gas clouds can cause mJury and death from asphyxiation and burning. Surface burns have caused severe injury to persons caught by such clouds, but greater damage and many deaths probably have been caused by inhalation of the hot particles and gases. Large fragments can be carried in these kinds of clouds, but the danger from impact probably is less than that from asphyxiation and burning.
A well- knmvn event on Hawaii that may have resulted from such a cloud was the destruction, probably by an eruption of Kilauea in about 1790, of part of an amy then contending for control of the island (Swanson and Christiansen, 1973). Hot particle-and-gas clouds from Hawaiian volcanoes, however, have been small compared to similar clouds from more explosive volcanoes elsewhere in the world, and have extended only a few miles from the vent that erupted them.
Criteria, and description of risk areas
Areas of relatively high risk from particle-and-gas clouds are identified by frequency of eruption of the various volcanoes, proximity to emptive vents, and location of topographic barriers that prob<1bly would inhibit the spread of the clouds. Wind has a relatively minor influence on the distribution of such clouds.
Particle-and-gas clouds are regarded as most likely to occur in the foreseeable future on ~fauna Loa, Kilauea, and Hualalai. The conditions for such eruptions seem to he fulfilled chiefly <lt sununit c:~ldcras, hut conceivably could occur anywhere else along rift zones. Areas of relatively high risk arc judged to exist for about 4 miles in all directions from the rift zones of Mmma J.oa, Kilauea, :~ncl llual:~lai, except where steep slopes, as are present around the northern margin of Kilauea caldera, would be expected to limit the spread of the particle-and-gas clouds.
Because only one episode of particle-and-g;rs cloud eruption is kilOMl on Hawaii Island, and that one seemingly was limited to one site, an evaluation of degree of risk and location of areas of risk from future

entptions of that kind is highly speculative. Even in the zone of relatively high risk, the probability i~ very low that a particle-and-gas cloud would affect any given area. 11\c ri"k to 1 ire locally could be high, hm.;ever, if one did occur.
Indirect hazards
Indirect hazards described in this section are (l) subsidence, (2) surface ntpture, (3) earthquakes, and (4) tsllllarnis. All these indirect hazards result from movement of large or small masses of the earth's crust. Eruptions cause small ground movements, but movements of large and small masses of the crust that are not specifically caused by eruptions are called tectonic events. Vertical and horizontal movements can cause the crust to bend or to break as one rock mass shifts relative to another. Such rock fractures, which are called faults, may reach and break the grolllld surface. Movements along faults commonly cause the grolllld to vibrate rapidly (an earthquake), even if the fault does not break the grolllld surface. On Hawaii, active volcanoes commonly swell as magma rises into them, and this may cause cracking of the grolllld. Downward movements occur as large and small blocks settle between and along faults, especially within the caldera and rift zones of Mauna Loa and Kilauea. Large slump blocks also subside along the southeast and southwest coasts of the island.
All of these indirect hazards can result from eruptions or from tectonic events, some of which occur within or below the mass of the island. Risk to life is very low and only moderate to property from all the indirect hazards that result from actual eruptions. Risk to life is also lm.; from breaks in the ground surface caused by tectonic faults. In contrast, there are considerable risks to both life and property from subsidence, earthquakes, and tSllllainis that result from tectonic events.
Subsidence
Subsidence on the island consists chiefly of (1) settling of the island as a whole, (2) dol'i!lward movement of discrete blocks as a result of subsurface withdrawal of magma, (3) relative dm'illward and outward slumping of huge blocks along the margins of the island, and (4) local small-scale collapse of lava tubes.
The island as a whole is settling at a rate of about a foot per century. The settling may not be lllliform over all parts of the island, and rates ranging from about 8 to 16 inches per century have been reported (Apple and ~1acdonald, 1966; Moore, 1970).
Settling of discrete masses or blocks because of magma withdrawal occurs in and near calderas and along rift zones. Subsidence at any one time connnonly ranges from a fraction of an inch to a few feet, but cumulative settling mnounting to tens of feet is common. During the formation of calderas or pit craters, local settling may aiTiount to hundreds of feet. Settling caused by magma withdrawal commonly occurs in nearly

)-
~s
s
(
equidi.mcnsional, often ncar-circular blocks, or in elongate blocb approximately parallel to the trend of rift zones or caldera walls; they conrnonly are bounded by faults that reach the surface.
Downward and outward movement or large sltunp blocks has occurred chicliy on the south [Lmk of Kilauea and the \vest flank of ~buna Lo;I. ~!any ol· these huge slump blocks are bounded by steep fault sca~Js (palis) along their upslope margins. Several such blocks fom a distinct "stair-step" surface on the south flank of Kilauea (fig. ll). Similar sltnnp blocks fom the coastal zone along much of both the southwest and southeast coasts of the island.
Lava tubes are common in pahoehoe flows but generally not in aa flows. Most tubes are difficult to find, but some have holes in the tube roof ("skylights"). Continuation of a tube upslope and downslope from such an opening should be expected.
Effects
Lives are not significantly endangered by regional subsidence, and rarely are endangered by subsidence in rift zones. Slump-block subsidence seems to represent a risk of low frequency but possible high danger to life if it occurs along a coastline. If such a subsidence occurred suddenly and lowered a coastal block below sea level, inhabitants could be endangered by drowning not only from the immediate submergence but also from a tsunami if one were generated. Collapse of lava tubes would endanger very few persons, but such collapses have occurred, especially where the roof has been weighted by use of heavy construction or excavation equipment.
Danger to property is low from regional subsidence, but should be taken into account for long-term use. Subsidence in rift zones increases the risk to property chiefly by increasing its susceptibility to inundation by lava flows and by the ocean where the rift zones pass under the sea. Slump-block subsidence represents a minor risk to property except along the coast, where settling could drop property below sea level, or down enough to increase risk of damage from storms or even normal waves. Damage to property from a tsunami generated by slump-block movement could also be great. Damage to property from collapse of lava tubes is highly local, but can be severe for the small areas involved.
Criteria, and description of risk areas
Areas of relatively high risk from future subsidence (fig. 12) are identified from the location and frequency of past subsidence, and from susceptibility of the subsided lanrl to flooding by lava or 1vater. The overall subsidence of the island slowly increases the risk of submergence all along the coast, but is not portrayed on the map.
Most differential subsidence in historic time has occurred in ami next to the calderas and along the rift zones of Kilauea and ~1auna Loa; these areas are subject to preferential lava flooding as a result of subsidence (fig. 13), and are therefore assigned to a high risk zone. Historic block slumping along the southeast margin of the island has been
41
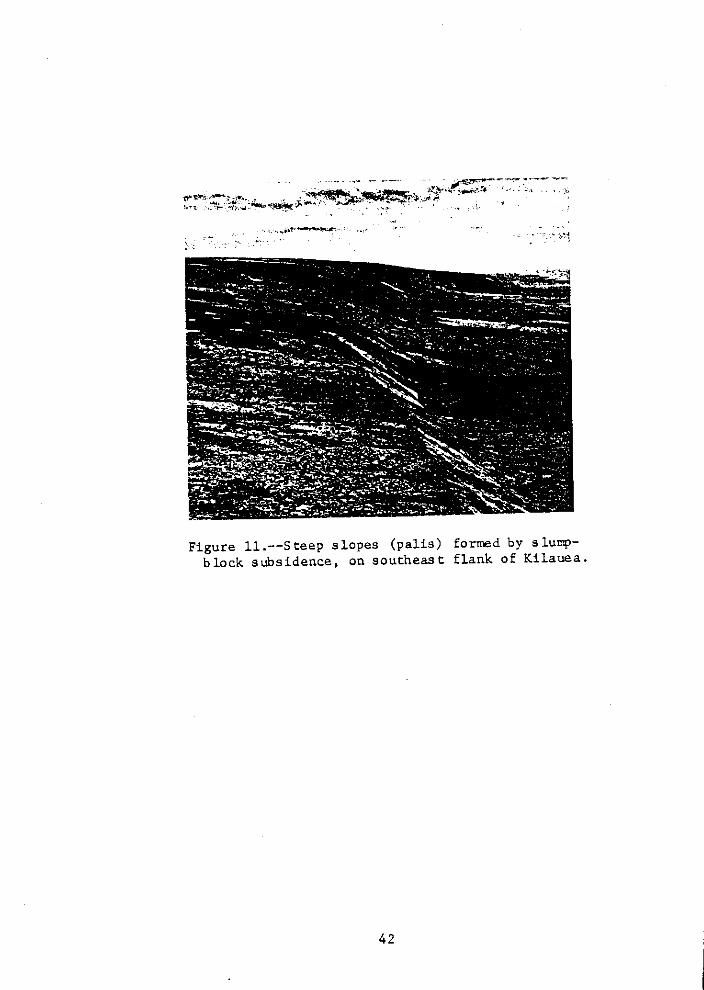
Figure 11.--Steep slopes (palis) block subsidence, on southeast
formed by slumpflank of Kilauea.
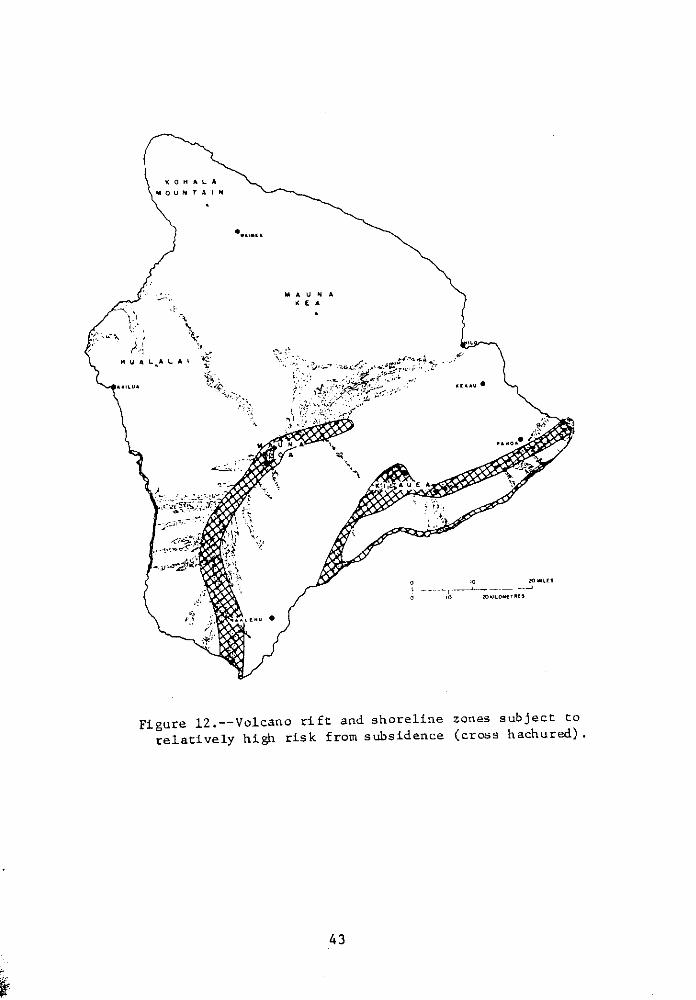
(
1111 A U "' A < E A
.... u.
<0 lO ••11.£1 --1·------"--f--~ __ _J
00 20~0~0M(UU
Figure 12.--Volcano rift and shoreline zones subject to relatively high risk from subsidence (cross hachured).
43

. -: -.:-·~~.: --·-: _, ..
Figure 13.--A small subsidence block bounded by a fault along the east rift zone of Kilauea, covered by fresh lava.

infrequent but of greater extent, and some submergence is certain if such a block along the coast is lowered in the future. That coastal area is assigned to the same high risk zone, although the risk there cannot be satisfactorily compared with that of the rift zones. The coastal area on the southwest side of Matma Loa is also assigned to the high risk zone, because evidence of much prehistoric block subsidence there suggests that the probability of future subsidence along that coast is similar to that on the southeast side of Kilauea. Risk from differential subsidence on other parts of the island is not regarded as significant enough to map.
The locations of at least 35 lava tubes are known (State of Hawaii, Dept. Transportation, 1962). These tubes are small and are not portrayed on the hazards map. ~!any other tubes might possibly be located, but the cost of finding them and determining their extent in order to delineate areas of possible collapse would be very high, probably prohibitively so.
Surface rupture
Rupture occurs wherever fractures extend to the ground surface (fig. 13). The rock mass on one side of the rupture may move in a direction away from, or transverse to, the mass on the other side, or in some combination of those directions. Some cracks open up to widths of as much as several feet and depths of several tens of feet, but others remain closed.
Historic ruptures have been virtually restricted to Mauna Loa and Kilauea volcanoes, and have occurred most frequently in their caldera and rift zones. Outside those areas, active fault zones lie along both the southwest and southeast flanks of ~Buna Loa, and along the southeast flank of Kilauea. The most frequent surface ruptures on the flanks of the volcanoes have occurred along the fault zones on the southeast flank of Kilauea. Recent measurements across some ground cracks there show displacements of as much as 4 feet within a few years. The displacement is believed to result from seaward movement of the flank of the volcano caused by magma forcing its way into fissures along the east rift zone.
Surface ruptures rarely endanger lives, although people and animals have fallen into cracks, but they can be highly destructive of property. Structures that lie across ruptures may be pulled or sheared apart. Utilities such as water, sewage, transportation, and communication systems are highly susceptible to disruption by surface breaks.
Criteria for definition of zones subject to surface rupture are the locations and frequency of historic and prehistoric surface breaks, and recent subsurface fault activity as evidenced by earthquakes. Most historic surface ruptures, including both open and closed cracks, have occurred in the caldera and rift zones of Mauna Loa and Kilauea; consequently, these areas arc regarded as having the h ighcst risk from that hazard (fig. 14). !lund reds of small cracks have been observed in these zones in historic time, and displacement along many of them has been 1 to several feet.
45
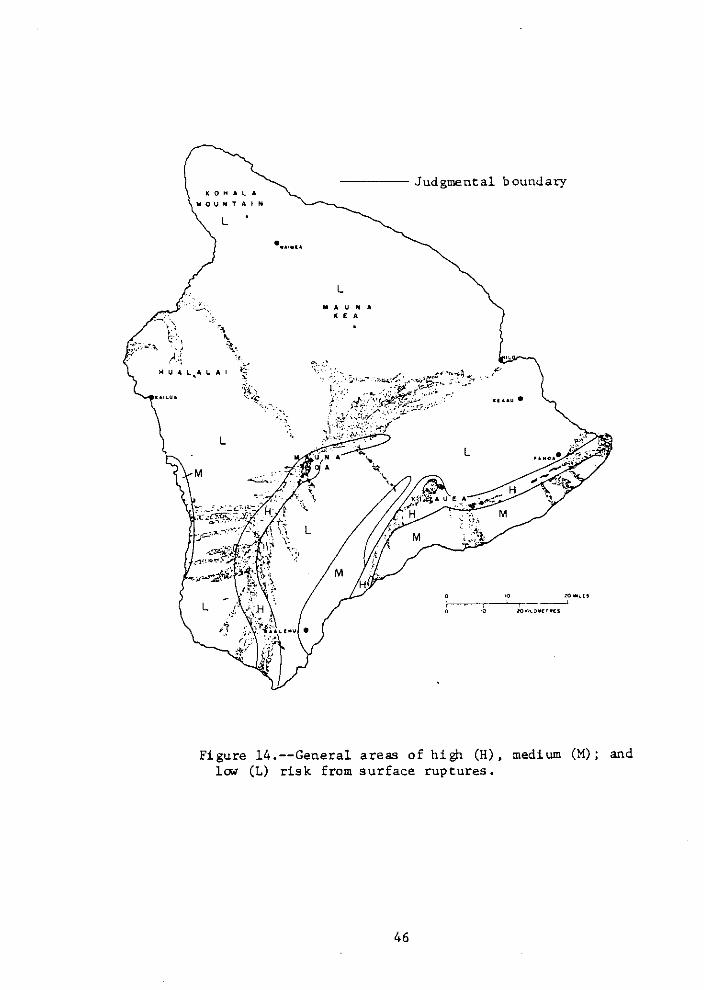
-----Judgmental boundary
...... <.) ~:,
t~~
KOHALA
IIIOU!rtTAIN
L
.,
L
Ill A U H A < £ A
14 U A L,A L. A I ;-'·'
.....
L
Figure 14.--General areas of high (H) le>J (L) risk from surface ruptures.
46
medium (M) and

The next highest zone of risk includes an area of numerous faults along the southeast flank of elauna Loa, and two areas along the island margins. Historic surface ruptures of as much as several feet displacement have been reported along the southeast flanks of ~fauna Loa, and numerous earthquakes record continued subsurface movement in that area. The tl\'O other areas are along the southeast margin of Kilauea and the southwest margin of ~fauna Loa. Steep slopes that have resulted from fault displacement, as well as open ground cracks, record many prehistoric surface ntptures, and earthquakes indicate that fault activity continues in both these zones.
Earthquake shaking
Earthquakes occur very frequently on the island. '!any ongmate within the structure of the island itself, but many others are generated far below the island mass.
Earthquake (seismic) shaking consists of actual vibration of the ground. Movement along faults below the ground surface generally causes the vibration, which spreads upward and outward in all directions from the place of origin. The vibration energy is greatest at the point or zone of fault movement, and lessens gradually with increasing distance. Locally, the severity and characteristics of the ground shaking can be strongly influenced by other variables, especially the way in which different geologic materials respond. However, these variables have not been evaluated in this study.
The ground vibration may in turn cause ground failures, such as local landslides and compaction, but those are individual site problems on the island and are not within the scope of this report.
A multitude of small earthquakes is associated with surface eruptions of lava. These include relatively continuous tremors, probably caused by actual movement of the magma, and shocks that result from adjustment of rock masses at or near the ground surface to displacement by the e1~pting magma. Explosive eruptions can also produce seismic waves. No strong earthquakes were reported during the 1924 explosive eruptions, however, and future explosions of Hm;aiian volcanoes arc not expected to generate strong earthquakes. The kinds of earthquakes described above, "hich result directly from eruptions, are regarded as volcanic in this report. In contrast, earthquakes that originate far belm; the island, even though they may be associated with movement or generation of magma, are considered to be tectonic.
Still other large :u1d ~mall earthquakes occur hec:;tusc oC ;tdjustmcnts oC rock masses 1vithin the volcanoes that make up the island, probably in response not only to magma movement hut also to other f"orccs. These earthquakes occur along fault zones that are within or extend up into the volcanoes, ancl include those associated with slLunp-block subsidence. These earthquakes are regarded as tectonic earthquakes in this discussion, even though they may result from displacement of rock by magma, because their character is similar to tectonic earthquakes elsewhere.

Even the strongest volcanic earthquakes in historic time have produced very little damage, and such events would not he expected to be more damaging in the future. In contrast, both deep and shallow tectonic earthquakes have caused major damage. The strongest, in 1868, apparently resulted from slump-block movement on the southeast fl~mk of the island; the intensity of that earthquake was rated hy Wood (1914) at X, the highest grade on the Rossi-Forel scale, over nearly the southern half of the island, and at IX over the rest of the island. The next strongest, in 1951, may have been associated with sltnnp-block movement of part of the soutln;est flank of the island. Other damaging earthquakes have occurred under the northern as well as the southern part of the island and at widely varying depths, although they have been more frequent under the southern part. The damaging earthquake of April 26, 1973, occurred under the northeastern part of the island mass at considerable depth, about 40 miles.
Because of the high frequency of moderately strong earthquakes in kno1;11 fault zones, the risk of repeated minor damage over kno1;11 fault zones probably is higher than elsewhere on the island. But the risk of major damage from stronger earthquakes extends over the entire island, and therefore zones of different risk have not been sho1;11 on a map.
Tsnnamis
A special type of large sea wave can be generated by abrupt movement of rock masses under the sea floor or into the sea, and by submarine volcanic eruptions. The Japanese word "tsnnami" is used herein for this type of wave; "seismic sea wave" is used in places to describe those caused by fault movements. The term "tidal wave," which is used in some reports, is not used here because of confusion with normal tides.
Tsunamis commonly are long, low, and travel at high speed--between 400 and 500 miles per hour--as they cross the open ocean, but become shorter, higher, and slower as they move onshore. A wave moving onshore may either rise quietly, or form a turbulent, rapidly advancing wall of water. The height and extent inland to which a given wave moves are strongly influenced by many variables, especially by local bottom and shoreline features and by the direction of travel of the wave; runup of a given wave at one site may differ markedly from the rnnup only a short distance away. Locally, headlands are selectively battered, but elsewhere factors such as refraction and resonance can amplify a wave so as to increase its destructiveness within a bay, as has happened at Hilo.
On Hawaii, tsnnamis should be regarded as an important hazard that involves high risks to both life and property. Most of the tsnnamis that have affected the island have been generated by fault movements far from Hawaii and were not associated with volcanism. No tsnnamis in Hawaii are kno1;11 to have been generated by local submarine volcanic eruptions, and the likelihood of such events producing damaging waves seems to be very low. At least two tsunamis, however, including the wave reported to have had the highest rnnup, were associated with earthquakes nnder or near the
48
c
td
lS
t
e
c e
island. Since the early 1800's, about 85 tsunamis have been observed in the Hawaiian Islands, and of these 15 have caused significant damage (Pararas-Carayannis, 1969).
A tsunami is not generated during every major earthquake under the ocean. Generation of a tsunami is related to actual displacement of the ocean floor, which in turn displaces large amounts of water upward or laterally to start the wave. i\n international tsunami evaluation and warning network has been established to determine when an earthquake actually has generated a tsunami in the Pacific Ocean.
The highest historic wave reported on Hawaii Island, in 1868, was said to have reached 60 feet above sea level. At one point, the 1946 tsunami reportedly reached 55 feet above normal sea level. Three well-documented tsunamis since 1945 reached heights of more than 10 feet above normal sea level at several places along the coast of the island. All of these mentioned except the 1868 event were generated thousands of miles from Hawaii; the time lapse between generation of similar waves and their arrival at Hawaii should allow adequate time for the tsunami warning system to operate. TI1e 1868 wave was locally generated, and, if repeated, would reach the adjacent coast of Hawaii before the warning system could function. For locally generated tsunamis, the earthquake itself must presently serve as the warning, although a fast-acting system for warning of locally generated tsunamis is now being developed.
Effects
Tstmami effects are confined to coastal zones that can be reached by the highest waves. Overall, the risk is highest at the shoreline, and it decreases progressively with increase of altitude and distance inland. Along the coast, tsunami waves can sweep inland with great force and cause damage to people and to natural and artificial structures. Persons can be battered and drowned, and structures smashed, moved off foundations, and otherwise damaged. In contrast, there may be little lateral force on objects if a tsunami wave rises quietly. Sea 1vater reaches far above normal tide heights, however, spreading salt water over structures and the land itself.
Risk to lives can be small for waves generated far from the island, because several hours are generally available for warning and evacuating people from endangered zones. In contrast, risk to lives is much greater from a tsunami generated by a local earthquake, because not enough time--not more than a few minutes--is generally available for warning and evacuation. Risk to property except for movable items, however, is virtually the same for inundation of a given extent, regardless of where the tsunami originated.
Criteria for extent of hazard
A wide variety of opinion exists among investigators of tsunami hazards as to valid and useful criteria for defining a zone of risk from tsunamis. Predicting the extent of future tsunami inundation is difficult, because very little information is available on which to estimate what height and
49
(
direction of waves should be expected, and because runup of a wave of even an asstnned height involves so many variables that reliable predictions are not now possible. Calculations of expected frequency and heights of 1vaves at Hila have been made (D. C. Cox, unpub. data, 1964), but no published or unpublished predictions of frequency of waves from various directions were discovered during this project. Many studies of potential runup and inundation areas have been made for the islands, some of them based on recorded runup of past waves modified by factors deemed appropriate.
One widely used formula for potential runup height and distance inland is that of Cox (1961). Cox chose a maximum wave height of 30 feet for southwest-facing coasts and SO feet for other coasts to outline zones in which runup potential was sufficient to justify evacuation. He projected a decrease in maximum inundation height of 1 foot for every 100 feet inland from a selected near-shore line. The potential inundation zones that result from use of this formula are regarded by some other investigators as too large to be useful, because the zones include broad areas that have never been affected by historical tsunamis. Cox (unpub. data, 1964) calculated the frequency of a 50-foot tsunami wave at Hilo to be only about once every thousand years. Even so, zones calculated on Cox's formula would not have included small areas reached by the maximum runups of about 60 and 55 feet that were reported during the 1868 and 1946 waves, respectively.
U.S. Army Corps of Engineers' studies of potential tsunami inundation zones in the islands generally are based on much lower maximum wave heights; the zones are regarded as pertaining to an intermediate-height wave that represents a 100-year-design tsunami. One such study for a part of Hm;aii Island uses a 15-foot maximum "normal" wave height to outline a potential inundation zone. Another study, at the University of Hawaii, outlines less extensive inundation zones for evacuation purposes (IV. M. Adams, written commun., 1973), based on certain information available after a tsunami has been generated.
In brief, the problem of what potential tsunami inundation zone is valid and useful is highly unsettled, and tsunamis even remotely associated with volcanism are a very small part of the problem. Consequently, no potential tsunami inundation zone is drawn for this report. An evaluation based on only the two tsunamis of local origin would indicate that the entire south coast of the island and the west coast south of Keahole Point should be regarded as having a higher risk, especially to life, than other coastal zones of the island. But any specific predictions of inundation based on only two events would necessarily be highly intuitive. ~breover, it could be highly misleading and even dangerous to show a tsunami hazard zone in only the southen1 part of the island when the historical record indicates that the risk is equal or greater along other coastlines. Treatment of the overall tsunami inundation problem, however, is far beyond the scope of this report.
One or more potential hazard zones could be outlined by assuming certain wave heights and applying the formula proposed by Cox (1961). Such a study could outline a single zone (or a family of zones) that would show, at least roughly, areas of decreasing risk inland. One hazard zone might
so

cd
e
th
ilt cr
r, d
\t (
be based on the highest known tslmami nmup anywhere in the world (slightly more than 100 feet vertically); areas outside such a zone Hould be safe from a tsunami equal to the largest known to man. There is no certainty, however, that future waves would not exceed that height. Another useful zone might be based on the highest runup reported in the Ha1;aiian Islands (about 60 feet). Both of these zones, h01;cver, would include very large areas, only a small fraction of which would be affected by a tsunami that locally reached even the maximum height. Still other zones could be based on Cox's 50-foot and 30-foot values, on the Corps of Engineers' 100-year-design tsunami values, and on even lesser wave heights. Establishment of a family of zones rather than only one might significantly increase the value of any such study by avoiding loss of future usefulness if new wave-height or runup information made the single value used for one line obsolete.
Zones of overall relative risk
Plate I and figure 15 show zones of overall relative risk from volcanic hazards on the island; they represent a summation of most risks that are portrayed on maps and described in previous sections of this report. An attempt has been made on these maps to represent risks from several hazards and on all the volcanoes on a single scale of progressive increase in overall risk. However, the data available are not adequate to make rigorous comparisons of severity of one kind of hazard to another, or from one volcano to another. Consequently, the maps must be regarded as highly interpretive, and to include some intuitive, subjective judgments of those factors. In addition, summation of risk worsens the problem of overlap of risk in adjacent zones (seep. 3); that is, not all places in one risk zone have a lower risk than every place in zones assigned to the next higher risk category.
Most boundaries shown on figure 15 are judgmental (p. 33), and do not outline areally well defined zones of risk. Instead, they separate general areas of overall greater or lesser risk and indicate the direction of increase or decrease of risk. One important boundary is based on a physical feature--the junction of the slopes of Mauna Kea and Mauna Loa. This boundary is relatively well defined, and separates zones of significantly different risk. The boundary represents more than one step in the scale of overall risks; the missing zone exists but would be narroh', and site investigations probably could delineate it if necessary. The topographic margin of Kohala Mountain also is fairly well defined by a physical feature, but the boundary is less important because the risk on both sides is judged to be low.
The risk from particle-and-gas clouds was not considered in outlining the zones of overall risk. Particle-and-gas clouds can be a severe threat to life, but they would only mildly endanger property. Thus, that hazard cannot satisfactorily be compared to other hazards that are chiefly threats to property. Furthermore, evidence of past frequency and location of particle-and-gas clouds is so meager that the severity of the danger they represent is virtually indeterminable. Consequently, the areas judged to be potentially endangered by particle-and-gas clouds are sho1;n by a pattern on figure 15 and plate I.
51
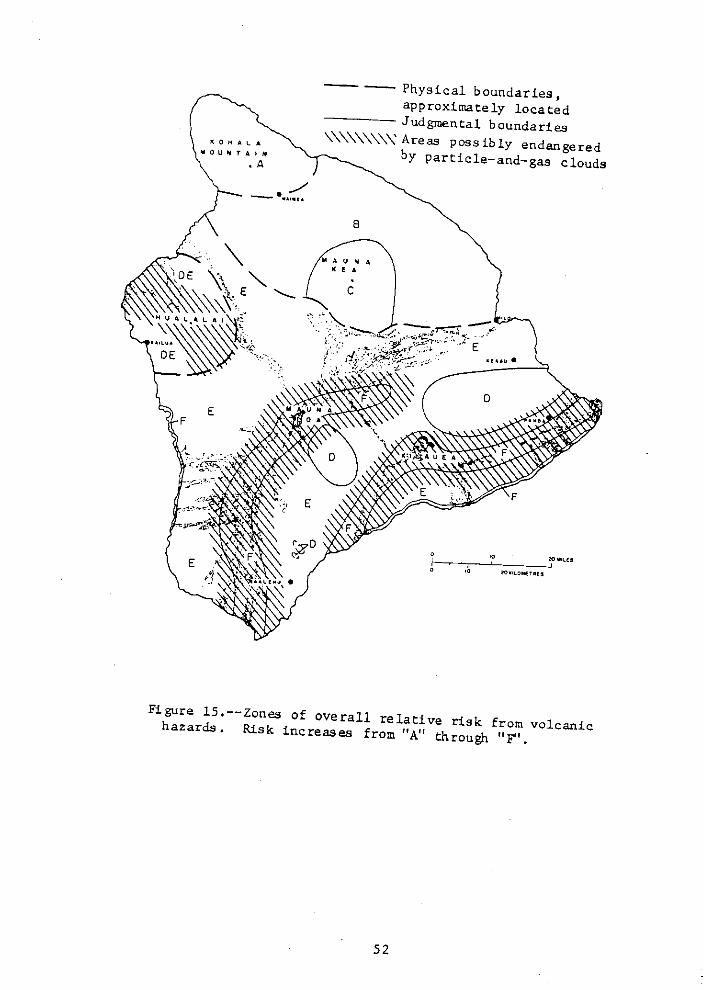
!(0HALA
IIIIOU~TAIH
• A
-· .. ~
--Physical boundaries, approximately located
---------Judgmental boundaries
\\\\\\\\\'Areas possibly endangered by particle-and-gas clouds
8
Figure 15.--Zones of overall relative risk from volcanic hazards • Risk increases from "A" through "F".
52
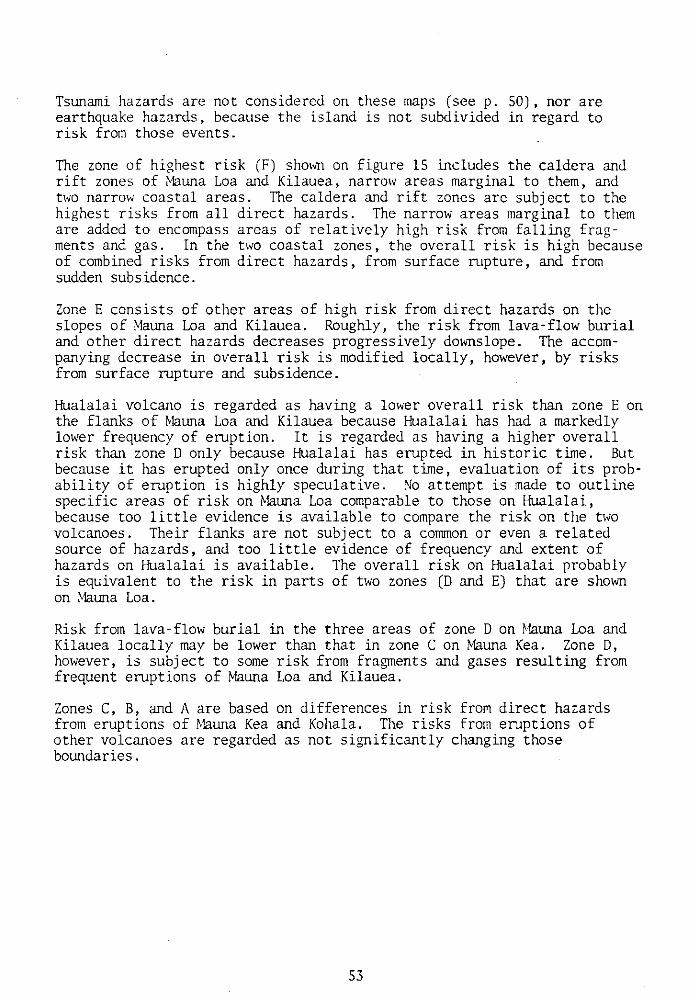
Tsunami hazards are not considered on these maps (seep. 50), nor are earthquake hazards, because the island is not subdivided in regard to risk from those events.
The zone of highest risk (F) sho1<n on figure 15 includes the caldera and rift zones of Mauna Loa and Kilauea, narrow areas marginal to them, and two narrow coastal areas. The caldera and rift zones are subject to the highest risks from all direct hazards. The narrow areas marginal to them are added to encompass areas of relatively high risk from falling fragments and gas. In the two coastal zones, the overall risk is high because of combined risks from direct hazards, from surface rupture, and from sudden subsidence.
Zone E consists of other areas of high risk from direct hazards on the slopes of ~launa Loa and Kilauea. Roughly, the risk from lava-flow burial and other direct hazards decreases progressively downslope. The accompanying decrease in overall risk is modified locally, however, by risks from surface rupture and subsidence.
Hualalai volcano is regarded as having a lower overall risk than zone E on the flanks of ~~una Loa and Kilauea because Hualalai has had a markedly lower frequency of eruption. It is regarded as having a higher overall risk than zone D only because Hualalai has erupted in historic time. But because it has erupted only once during that time, evaluation of its probability of eruption is highly speculative. No attempt is made to outline specific areas of risk on ~~una Loa comparable to those on Hualalai, because too little evidence is available to compare the risk on the two volcanoes. Their flanks are not subject to a common or even a related source of hazards, and too little evidence of frequency and extent of hazards on Hualalai is available. The overall risk on Hualalai probably is equivalent to the risk in parts of two zones (D and E) that are shown on Mauna Loa.
Risk from lava-flow burial in the three areas of zone D on Hauna Loa and Kilauea locally may be lower than that in zone C on Mauna Kea. Zone D, however, is subject to some risk from fragments and gases resulting from frequent eruptions of Mauna Loa and Kilauea.
Zones C, B, and A are based on differences in risk fro~ direct hazards from eruptions of r.~una Kea and Kohala. The risks from eruptions of other volcanoes are regarded as not significantly changing those boundaries.
53
011!ER AREJ\S J\T RISK FRCA\1 VOLCANIC ERUPTIONS
Other areas at risk include other isLmJs in the Hawaiian chain anJ several areas in the continental United States. At least one en1ption he~s occurreJ within the le~st ZllO years on the volcano llaleakala on the isL!nd of 1-!;-~ui, and future activity of that volcano should he ·expected. A few eruptions have also occurred on Oahu within about .the last 12,000 years; future eruptions there seem possible, but with a low frequency--probably less than one per thousand years. Future eruptions on the other islands also seem possible, but with an even lower frequency.
In the continental United States, areas of significant potential volcanic hazard are identified from the locations of volcanoes that have erupted t<ithin the last 10,000 years, and the most critical areas are judged to be adjacent to those volcanoes that have been active within the last few centuries. Volcanoes that have been active within the last 10,000 years are located principally in Alaska and in the Cascade Range of Washington, Oregon, and northern California (figs. 16, 17). The volcanoes most active in historic time are in a belt that extends from the Aleutian Islands to southeastern Alaska (fig. 16). Moreover, at least six volcanoes in the Cascade Range have been active in historic time. Elsewhere, scattered volcanoes in \vashington, Oregon, and California, and also in Idaho, Nevada, Arizona, New Mexico, and northwestern Texas, have been active in recent geologic time. Areas farther to the east are not likely to be affected appreciably by volcanic activity in the foreseeable future.
TI1us, important areas of volcanic hazards exist in both Alaska and in the Cascade Range, and the predominant hazards there are very different from those on the Island of Hawaii. Most of the major volcanoes on the mainland are relatively explosive; although lava flows are a recognizable danger, more significant hazards are represented by fragmental (pyroclastic) material that is erupted into the air or that flm<s dmm the flanks of a volcano as a suspension of particles and gas (a pyroclastic flow), and by volcanic mudflows and floods started by eruptions. All of these phenomena can seriously endanger both life and property by burial, dislocation, or other effects, and all except lava flows can extend many tens of miles beyond the source volcano.
TI1e areas most endangered by these hazards are dowm;ind and downvalley from large, potentially active volcanoes. The probable locations and extent of specific endangered areas can be identified by the locations of individual volcanoes, the nature of previous eruptions, the direction and strength of winds, and the topography of the surrounding country. The distribution of pyroclastic fragments thrown into the air depends on the height to which they arc carried and the strength and direction of winds. Coarse, thick deposits accwnulate near the vent, hut fine volcanic ash can cause problems in areas that are hundreds of miles m<ay. These materials are spread over the landscape downwind from the volcano without regard to the topography.
54
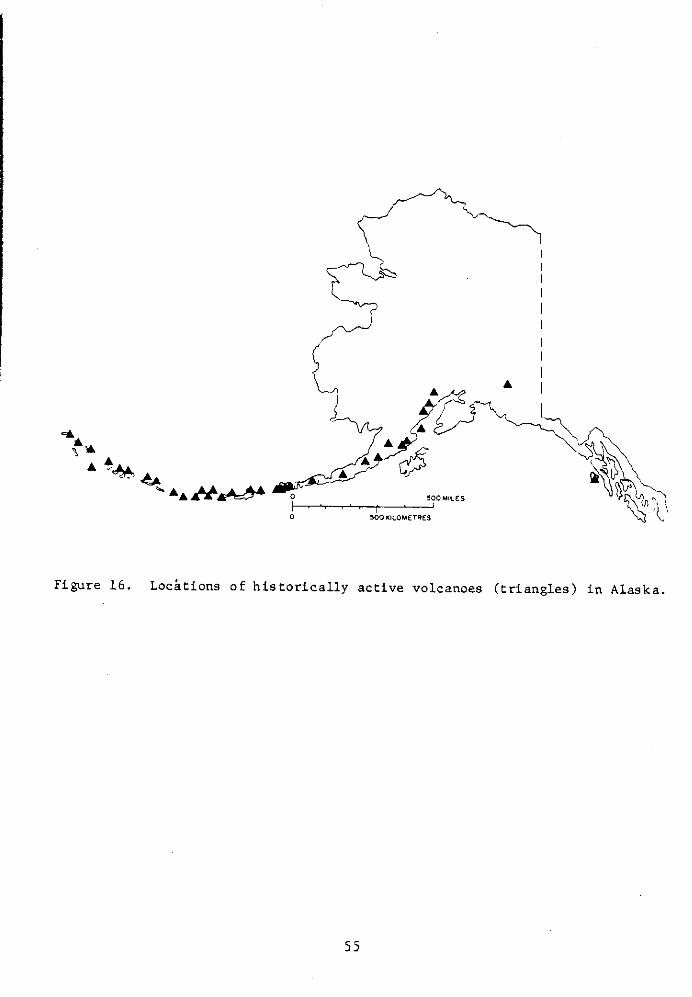
has nu
v 5
LC
be cnre
ive J
:da,
e 0 500 I(ILOMET~ES
Figure 16. Locations of historically active volcanoes (triangles) in Alaska.
55
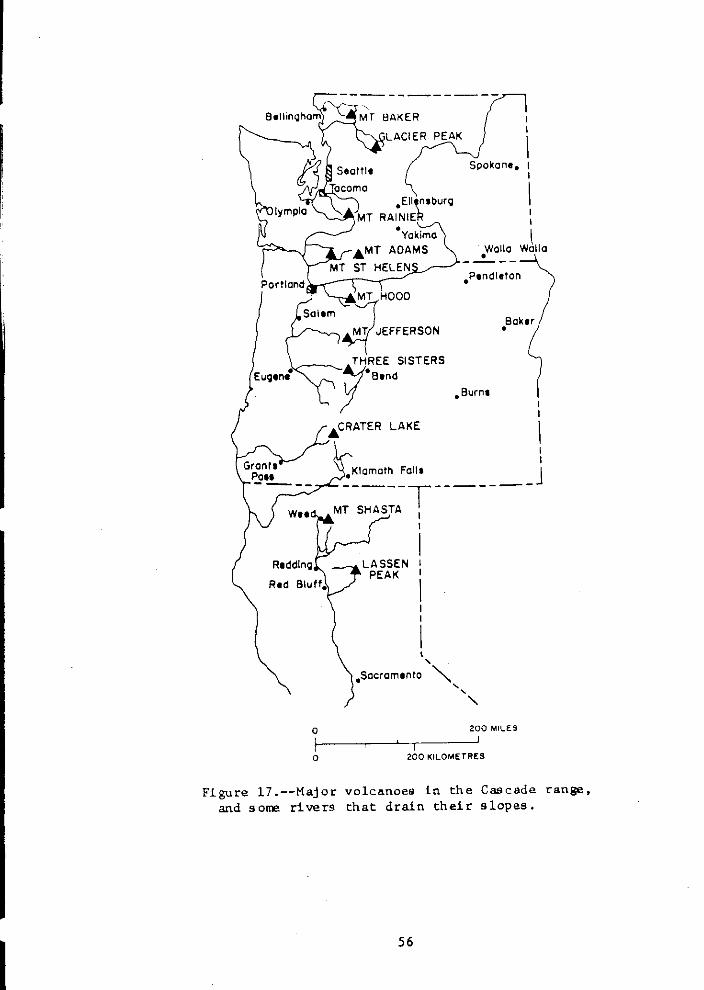
wu
Roddln~
Rtd Bluff.
0
0
PEAK
• Yakima
Spokane.
I I
ADAMS Walla • l
Wallo
• Pendleton
Baker •
• Burna
I I
.Klamath Falls J _____ T ______ _ MT SHASTA
1
LASSEN PEAK
I
I
' .sacramento'~
' ' " 2:00 MILES
2:00 KILOMETRES
Figure 17.--Major volcanoeo in the Cascade range, and some rivers that drain their slopes.
56
(
I I I I I
In contrast, the distribution patterns of lava flows, pyroclastic flows, mudflows, and floods are contro11ed chiefly by locations of valleys. TI1e danger from these volcanic events can be great to both life and property, but the events are relatively restricted in areal extent. Even though they may spread widely on the flanks of the volcano itself, they become increasingly restricted to valley bottoms as they move away from the source. Lava flows are generally short and affect only parts of valleys closely adjacent to a volcano. Pyroclastic flows, however, extend much farther, and mudflows and floods farther yet, to distances of many tens of miles from the source volcano. The lowest parts of a valley are most endangered by these events, and increasingly higher parts of valley sides are progressively less threatened. Pyroclastic flows, however, may be accompanied by clouds of hot gas and volcanic ash that can cause death and destroy property; these clouds may reach much higher up the sides of a valley than does the pyroclastic flow itself. Lava flows, pyroclastic flows, and mudflows could also affect water-storage reservoirs in valleys, the failure of which could endanger a much larger area downstream than could the volcanic phenomena themselves.
Prevention of volcanic eruptions is not feasible, nor 1s any substantial control of the eruptive products. Eruptions near populated areas of the continental United States have been so infrequent that reliable prediction of the times and places of future volcanic activity is not yet possible. Thus, construction of effective diversion dikes or dams to deflect phenomena such as mudflows or pyroclastic flows does not seem to be economically feasible. Measures that could prevent or mitigate damage and death from eruptions, therefore, are now largely limited to land-use zoning, and to evacuation in the event of an impending or actual eruption. The effecc tiveness of these measures depends on detailed knowledge of the characteristics of volcanoes that endanger the areas in question.
Volcanic-hazard zoning consists of outlining areas near a volcano that are judged to have significantly different degrees of risk, or different kinds of risk, from eruptions of the volcano. The risk from airborne fragments, for example, is highest immediately next to the vent. The risk decreases rather gradually downwind in the direction of predominant 1;inds, but decreases much more abruptly in other directions from the vent. It may even be low closely adjacent to the volcano in an upwind direction. For the other volcanic hazards described, the risk generally is high on flanks of the volcano. Beyond the flanks, the risk decreases abruptly except in valleys that head on the erupting volcano. A high degree of risk extends down those valleys and decreases very gradually with distance. At any given distance, however, the risk decreases much more abruptly with increasing height above the valley floor.
Effective evacuation of people from a threatened area requires installation of volcano-monitoring systems by which impending eruptions can be detected, development of communications and warning systems by which people in threatened areas could be advised of danger, determination of safe routes for evacuation, and preparation for the rapid drawd01m of reservoirs 1vhich could be endangered by an eruption. tifonitoring devices of several kinds (seismographs, seismic-event counters, thermistors) are now operating on several potentially dangerous volcanoes in the Cascade
Range, and on a.t least one volcano in southern J\la.ska. (~lount Augustine). Other surveillance methods nm; being used or tested include repeated geodetic mea.surements to detect the SHelling of a volcano that commonly precedes an eruption, a.nd repeated infra.red surveys from the ground and from aircraft and sa.telli tes so as to detect changes in emission of heat from the volcano that might indicate an impending eruption.
Evaluation of the relative degree of volcanic hazards in various locations around a specific volcano, for planning of both zoning and evacuation, requires detailed knowledge concerning the likelihood of various kinds of eruptions, their relative frequency, amounts of materials that might be erupted or shaken dmvn from the volcano, and areas affected in the past. 1l1is information can be gained only from comprehensive geologic investigations of a volcano. At present, it is adequate for only ~lount Rainier, Washington, and the Lassen Peak area in California. Such an investigation is now undeT"!;ay at '''lount St. Helens, Washington, but the extent and kinds of danger from other volcanoes in the Cascade Range and in Alaska are poorly knmVIl. Some potentia.lly dangerous volcanoes about Hhich too little is ~lOHn for a.n adequa.te a.ssessment of potentia.l volcanic ha.zards, and which are situa.ted near a substantial population, include ~lount Baker in Washington, 1-lount Hood in Oregon, and Mount Shasta in California. These volcanoes will eventually be studied under the USGS program of volcanic hazards investigations, but evaluations of the nature and extent of their haza.rds will not be available for many years with the existing program. The program could be expanded to provide evaluations of the volcanoes that appear most critica.l at this time within a few years, depending on the availability of people and funds.
58
•
t
ACKNOWLEIXMENTS
This report has been based chiefly on published and unpublished information gathered by past and present scientists at the Hawaiian Volcano Observatory and on geologic mapping by H. T. Stearns and G. A. Macdonald. Sources of much of that information, especially if it is relatively well known or is available in recent publications of the U.S. Geological Survey, are not specifically cited. General texts that describe the Hawaiian Islands, volcanic activity, and hazards are Stearns and ~~cdonald (1946), Macdonald and Abbott (1970), and ~~cdonald (1972).
Much information regarding tsunamis has been derived from sources outside the U.S. Geological Survey, and tsunami literature is cited more abundantly. Several people have also provided unpublished information, including G. R. Miller of the National Oceanic and Atmospheric Administration, W. M. Adams of the University of Hawaii, and R. R. Pulfrey, U.S. Army Corps of Engineers.

REFERENCES CITED
Apple, R. A., and Macdonald, G. A., lflbli, The para ry times at r fonaunau, Kana, rrawa i i : p. 125-136.
rise of sea level 1n contcmPacific Sci., v. 20, no. l,
Cox, D. C., 1961, Potential tsunami inundation areas in Hawaii: Hawaii Inst. Geophysics Rept. 14, 26 p.
Fookes, P. G., Dearman, W. R., and Franklin, J. A., 1971, Some engineering aspects of rock \veathering with field examples from Dartmoor and elsewhere: Quart. Jour. Eng. Geology, v. 4, p. 139-185.
Jaggar, T. A., 1926, Journal of Mauna Loa eruption: Hawaiian Volcano Observatory Monthly Bull., v. 14, no. 4, p. 31-47.
~~cdonald, G. A., 1972, Volcanoes: Englewood Cliffs, N.J., Prentice-Hall, 510 p.
Macdonald, G. A., and Abbott, A. T., 1970, Volcanoes in the sea; the geology of Hawaii: Honolulu, Hawaii Univ. Press, 441 p.
Macdonald, G. A., and Hubbard, D. H., 1973, Volcanoes of the National Parks in Hawaii (6th ed.]: Honolulu, Hawaii Nat. History Assoc. Ltd., 56 p.
~ghnani, M. H., and Woollard, G. P., 1965, Ultrasonic velocities and related elastic properties of Hawaiian basaltic rocks: Pacific Sci., v. 19, no. 3, p. 291-295.
Moore, J. G., 1970, Relationship between subsidence and volcano load, Hawaii: Bull. Volcanol., v. 34-2, p. 562-576.
~bore, J. G., Nakamura, Kazuaki, and Alcaraz, Arturo, 1966, The 1965 eruption of Taal volcano: Science, v. 151, no. 3713, p. 955-960.
Pararas-Carayannis, George, 1969, Catalog of tsunamis in the Hawaiian Islands: U.S. Dept. Commerce, Environmental Services Adm. World Data Center Rept. \"/DCA-T 69-2, 94 p.
Porter, S. C., 1971, Holocene eruptions of Mauna Kea volcano, Hawaii: Science, v. 172, no. 3981, p. 375-377.
Richter, D. H., Eaton, J.P., M..lrata, K. J., Ault, W. U., and Krivoy, H. L., 1970, Chronological narrative of the 1959-60 eruption of Kilauea volcano, Hawaii: U.S. Geol. Survey Prof. Paper 537-E, 73 p. [1971].
State of Hawaii, Department of Transportation, 1962, Community fallout shelter map, County of Hawaii, Island of Hawaii: Hawaii Civil Defense Agency.
Stearns, H. T., and Macdonald, G. A., 1946, Geology and ground-water resources of the Island of Hawaii: Hawaii Div. Hydrography Bull. 9, 363 p.
60
Clf\1
l.
mg
ll,
trks ) p .
. '
tp-
ta
L.,
Swanson, 0. i\., 1972, Magma supply rate at Kilauea volcano, 1952-1971: Science, v. 175, no. 4018, p. 169-170.
Swanson, D. A., and Christiansen, R. L., 1973, Tragic base surge In 17'10 at Kilauea volcano: Geology, v. l, no. 2, p. 83·8b.
U.S. Weather Bureau, 1959, Climatological data--National summary: Washington, U.S. Govt. Printing Office, v. 10, 520 p.
1Vent1;orth, C. K., and ~lacdonald, G. A., 1953, Structures and foi11IS of basaltic rocks in Hawaii: U.S. Geol. Survey !lull. ')'14, <JR p. [\<15•1].
Wilcox, R. E., 1959, Some effects special reference to Alaska: p. 409-476.
of recent volcanic ash falls, with U.S. Geol. Survey Bull. 1028-N,
Wood, H. 0., 1914, On the earthquakes of 1868 in Hawaii: Seismol. Soc. America Bull., v. 4, no. 4, p. 169-203.
Wright, T. L. , 1971, Chemistry of Kilauea and ~launa Loa lava m space and time: U.S. Geol. Survey Prof. Paper 735, 40 p.
61