Vol Risk Premia in Equities
30
Connecting Markets East & West © Nomura International plc “Selling Vol” or Earning a Risk Premium? May 2015 Vol Risk Premia in Equities Dr Nick Firoozye Derivative Research +44-207-102-1660 [email protected] See Disclosure Appendix A1 for analyst certifications and important disclaimers.
Transcript of Vol Risk Premia in Equities

Connecting Markets East & West
© Nomura International plc
“Selling Vol” or Earning a Risk Premium?
May 2015
Vol Risk Premia in Equities
Dr Nick Firoozye
Derivative Research
+44-207-102-1660
See Disclosure Appendix A1 for analyst certifications and important disclaimers.

1
Table of Contents
Everyone is short vol
Smart money sells vol
Vol as insurance: when should you sell vol and which vol should you sell?
Vol risk premia are pervasive
Closing thoughts
Everyone is short vol
But not everyone is getting paid for it!

3
Almost all asset classes are short vol
Credit is short vol
Equities are also short vol
In low rates, govies are short vol
MBS is short vol
General Rule :
if you’re making a return, you probably sold someone some sort of option
You’re short even if you don’t know it!
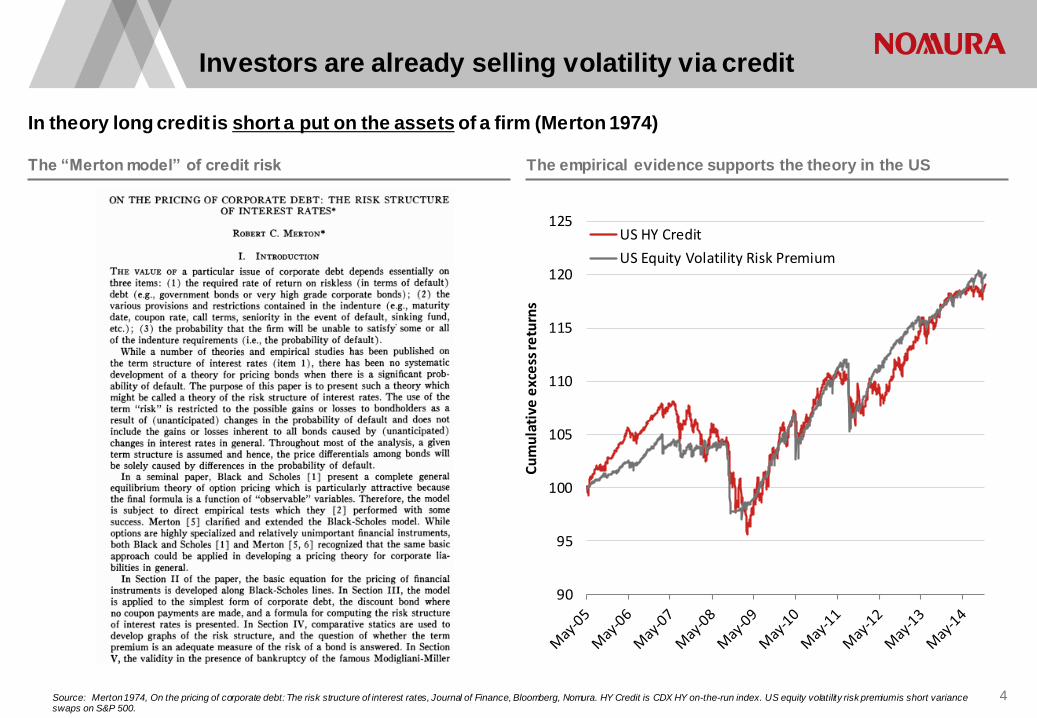
Investors are already selling volatility via credit
Source: Merton 1974, On the pricing of corporate debt: The risk structure of interest rates, Journal of Finance, Bloomberg, Nomura. HY Credit is CDX HY on-the-run index. US equity volatility risk premium is short variance swaps on S&P 500.
In theory long credit is short a put on the assets of a firm (Merton 1974)
The “Merton model” of credit risk The empirical evidence supports the theory in the US
4
90
95
100
105
110
115
120
125
Cu
mu
lati
ve e
xce
ss re
turn
s
US HY Credit
US Equity Volatility Risk Premium

Going short volatility has a very similar performance to going long equities.
Empirically, equities are short vol
Source: Bloomberg 5
Same Risk, Different Premia
96
98
100
102
104
106
108
Jan-05 Jan-06 Jan-07 Jan-08 Jan-09 Jan-10 Jan-11 Jan-12 Jan-13 Jan-14 Jan-15
Short VIX vs Long S&P 500
S&P 500 Short VIX

In low rates environments, govies are short vol
Source: Nomura Research, Bloomberg 1: Shadow rate is defined as the short rate without cash-and-carry constraints
6
USD front-ends showed a strong comovement in low rates Comovement is even stronger in low yield market like Japan
0
50
100
150
200
250
300
0
1
2
3
4
5
6
7
2001 2003 2005 2007 2009 2011 2013
Ba
sis
Po
int V
ola
tility
Sw
ap
ra
te (%
)
Low rates periods USD 1m2y Swap (lhs) USD 1m2y Vol (rhs)
0
40
80
120
160
0
0.4
0.8
1.2
1.6
2
2001 2003 2005 2007 2009 2011 2013
Ba
sis
Po
int V
ola
tility
Sw
ap
ra
te (%
)
JPY 1m5y Swap (lhs) JPY 1m5y Vol (rhs)
Fisher Black suggested at ZIRP bonds turn into options on future
policy rates
Say x(t) is the shadow rate1 and r(t) is the short rate.
),0max(
),(
tt
tt
xr
dWdttxdx
Hence, ZCB yield slope depends on the volatility:
TdsrEy sTT ~)])[exp(log(
)(~ 2121TTyy TT
Higher vol = higher rates and steeper curves
0
0.2
0.4
0.6
0.8
1
1.2
0 1Y 2Y 3Y 4Y 5Y 6Y 7Y 8Y 9Y 10Y
Yie
ld (%
)
ZCB Yield Curve Simulation
Volatility = 2%
Volatility = 1%

Optionality drives the outperformance of MBS
Mortgages (MBS) – also short volatility
Source: Citi Yieldbook, Nomura Research * Agency non-callables returns are adjusted to match the same duration as MBS.
7
-1%
0%
1%
2%
3%
4%
5%
MBS Decomposition
Ave
rag
e r
etu
rns (p
.a.)
MBS Returns Decomposition
Unexplained
Vega
Gamma
Credit
Duration
-10%
-5%
0%
5%
10%
15%
Ro
llin
g 1
y M
BS
re
turn
s
(an
nu
alize
d)
Unexplained 3y10y1m10y CreditDuration
* Sample period: Aug 2005 – Jul 2014
Duration is the main component in MBS returns
Duration and optionality help to replicate MBS returns MBS optionality replaced by iVRP outperforms
95
105
115
125
135
145
155
Cu
mu
lati
ve e
xces
s re
turn
s (b
ase
ind
ex
= 1
00
)
MBSAgency non-callablesAgency non-callables + 1m10y + 3y10y
90
110
130
150
170
190
210
Jan-02 Jan-04 Jan-06 Jan-08 Jan-10 Jan-12 Jan-14
Cu
mu
lati
ve e
xces
s re
turn
s (b
ase
ind
ex
= 1
00
)
MBS Agency non-callables + iVRP USD Select

Smart money sells vol!

9 Source: Wikimedia (http://commons.wikimedia.org/wiki/File:Warren_Buffett_KU_Visit.jpg) and WikiMedia (http://commons.wikimedia.org/wiki/File:Lehman_Brothers.svg)
Didn’t Buffett call Derivatives “Financial Weapons of
Mass Destruction”?
Wait a second!
Didn’t Lehman fall because they were
short vol?

10 Source: see Matt Levine, Lehman Brothers Maybe Sold Warren Buffett a Rainbow, Bloomberg View, 6 Feb 2014 and quoted sources.
Lehman Bought Vol
The insider’s story
$4.2bn
OTM puts “worst of”
(SPX, NKY,SX5E) basket
Buffett Sold Vol

Why did Buffett sell vol?
Source: Nomura Research 11
Our insurance-like derivatives contracts*, … are coming to a
close…….almost certain to realize a final ‘underwriting profit’
- Warren Buffett
“
”
Derivatives = Insurance!
* Equities puts, CDO Tranches, CDS, etc

Vol as Insurance
When should you sell it and which vol should you sell?

Selling vol usually makes money
Source: Bloomberg, Nomura. The 1m10y swaption straddle implied volatility used in the above analysis is derived from the price of an ATMF 1m10y swaption, and the realised volatility is computed as being the actual realised volatility of the underlying 10y forward swap from the start date to the expiry date of the corresponding swaption straddle. The analysis is done on a daily basis and based on historical data from May1994 to Sep 2014.
13
0
50
100
150
200
250
300
Bas
is P
oin
t V
ola
tility
USD 1m10y
1m implied volatility
1m actual realised volatility
• Historically, implied volatility
tends to exceed realized volatility over the long term.
• In more than 70% of cases,
implied volatility was greater than realized volatility.
• Average gain is 11.3bp and
positive as well
-100
-80
-60
-40
-20
0
20
40
60
80
100
1994 1996 1998 2000 2002 2004 2006 2008 2010 2012 2014
Bas
is P
oin
t V
ola
tility
1m implied volatility - 1m actual realised volatility
Underwriting Profit
Payout on Policy
0%10%20%30%40%
<-80
(-80,-60)
(-60,-40)
(-40,-20)
(-20,0)
(0,20)
(20,40)
(40,60)
(60,80)
(80,100)
Observations (%)
Positive risk
premia

Simple indicators improve the short gamma performance consistently
When should you sell vol?
Source: Nomura Research. The global portfolio consists of 33% S&P 500, 33% EuroStoxx and 33% Nikkei. The sample period is Jan 2002 to Dec 2014. For comparison purpose, the volatility of returns are rescaled to 5%.
14
99
100
101
102
103
104
105
2002 2004 2006 2008 2010 2012 2014
Cu
mu
lative e
xcess
re
turn
Global Equity Volatility Risk Premia
Short only Short using Indicator A Short using Indicator B Short using Indicator C
0.0
0.2
0.4
0.6
0.8
1.0
1.2
1.4
1.6
Short only Short using Indicator A Short using Indicator B Short using Indicator C
Sh
arp
e r
atio
S&P 500
EuroStoxx
Nikkei
Global

Styles make everything better!
Source: Nomura Research. The sample period is Jan 2001 to Jan 2015. The iVRP Aggregate index sells straddles on 1m/3m expiries + 2y/5y/10y/20y/30y tails across USD/EUR/JPY, and delta-hedged until expiry. The FX VRP Aggregate index. The FX VRP Aggregate index sells straddles on 1w/1m/3m/6m expiries and delta-hedged until expiry.
15
0
0.5
1
1.5
2
USD iVRP EUR iVRP JPY iVRP Global iVRP
Sh
arp
e r
atio
Aggregate Select
Styles without timing improves diversified portfolio in rates
Styles without timing improves diversified portfolio in FX
75
85
95
105
115
125
135
145
155
165
01 02 03 04 05 06 07 08 09 10 11 12 13 14 15
Cu
mu
lati
ve e
xces
s re
turn
s
Global FX VRP Select Index
Global FX VRP Aggregate Index
85
95
105
115
125
135
145
155
165
01 02 03 04 05 06 07 08 09 10 11 12 13 14 15
Cu
mu
lati
ve e
xces
s re
turn
s
Global iVRP Select Index
Global iVRP Aggregate Index
0.0
0.1
0.2
0.3
0.4
0.5
0.6
0.7
0.8
0.9
EURUSD VRP USDJPY VRP GBPUSD VRP Global VRP
Sh
arp
e r
atio
Aggregate Select

80
81
82
83
84
85
86
87
88
89
90
91
-2
-1.5
-1
-0.5
0
0.5
1
1.5
-50 -25 0 25 50
Imp
lied
Vol (b
ps)
Sh
arp
e R
atio
s
Strike
Short Receiver Sharpe Ratio (LHS)
Short Payer Sharpe Ratio (LHS)
Short Straddle Sharpe Ratio (LHS)
Implied Vol (RHS)0%
5%
10%
15%
20%
25%
30%
0.00
0.20
0.40
0.60
0.80
1.00
90 95 100 105 110
Imp
lied
Vola
tility
Sh
arp
e R
atio
Strike
Short Calls Sharpe Ratio (LHS)
Short Puts Sharpe Ratio (LHS)
SPX Sharpe Ratio (LHS)
Average Implied Vol (RHS)
S&P 500 OTM call outperformed
Which vol should you sell?
Source: Nomura Research. The sample period for equities vol/ underlying is1998 to 2015. The sample period for rates vol/ underlying is 2010 to 2015. 16
OTM Puts
USD 1m10y ATM straddle swaption outperformed
OTM Receivers OTM Payers OTM Calls

Do NOT sell vol when vol is high!
Source: Nomura Research, Bloomberg. The sample period is Jan 2006 to Jan 2015 across equities, rates and FX. Sharpe ratio is calculated by monthly data. 17
0.0
0.2
0.4
0.6
0.8
1.0
1.2
1.4
Low-vol Bucket Mid-vol Bucket High-vol Bucket
Sh
ap
re r
ati
o
Performance of USD 1m10y Swaption (Rates) VRP
-0.20
0.00
0.20
0.40
0.60
0.80
1.00
Low-vol Bucket Mid-vol Bucket High-vol Bucket
Sh
arp
e r
ati
o
Performance of EURUSD 1m (FX) VRP
-0.5
0.0
0.5
1.0
1.5
2.0
2.5
3.0
Low-vol Bucket Mid-vol Bucket High-vol Bucket
Sh
arp
e r
ati
o
Performance of Equities VRP
Moderate vol does best
Now:
• FX is High
• Rates is Mid
• Equities is Low

Vol Risk Premia are Pervasive
Diversification and outperformance

Vol risk premia exist across equity markets
Source: Nomura Research, Bloomberg. For comparison purpose, the volatility of returns are rescaled to 1%. 19
In Europe as well, VRP outperformed significantly
95
100
105
110
115
120
Mar-01 Mar-03 Mar-05 Mar-07 Mar-09 Mar-11 Mar-13
EuroStoxx 50
Vol Risk Premia Long Only

Vol risk premia exist across equity markets
Source: Nomura Research, Bloomberg. For comparison purpose, the volatility of returns are rescaled to 1%. 20
Short gamma strategies outperformed across equity markets (vol scaled and centered indices)
95
100
105
110
115
120
Cu
mu
lati
ve e
xce
ss r
etu
rns
S&P 500
Vol Risk Premia
Long Only
95
100
105
110
115
120EuroStoxx 50
Vol Risk PremiaLong Only
96
98
100
102
104
106
108
110
112Nikkei 225
Vol Risk Premia
Long Only
98
100
102
104
106
108
110
Kospi 200
Vol Risk Premia
Long Only
97
101
105
109
113
Cu
mu
lati
ve e
xce
ss r
etu
rns
Hang Seng
Vol Risk Premia
Long Only
96
98
100
102
104
106
108
Nifty 50
Vol Risk Premia
Long Only
96
101
106
111
116
ASX 200
Vol Risk Premia
Long Only
98
99
100
101
102
103
104
105
106
Mar-11 Mar-12 Mar-13 Mar-14
MSCI EM
Vol Risk Premia
Long Only
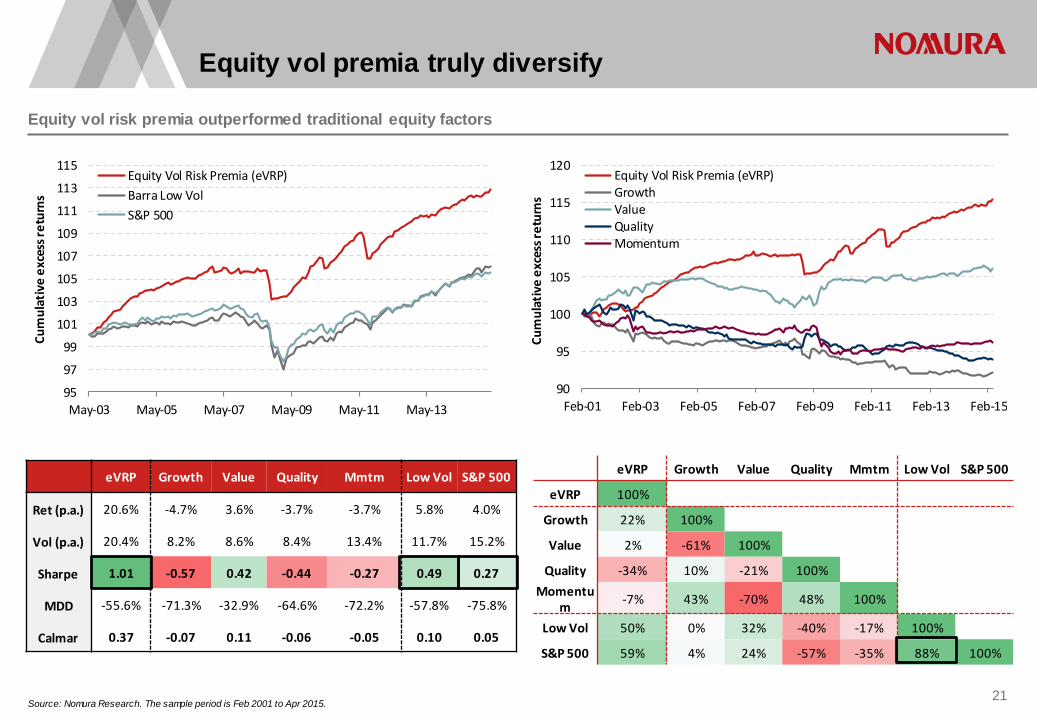
Equity vol premia truly diversify
Source: Nomura Research. The sample period is Feb 2001 to Apr 2015. 21
Equity vol risk premia outperformed traditional equity factors
eVRP Growth Value Quality Mmtm Low Vol S&P 500
eVRP 100%
Growth 22% 100%
Value 2% -61% 100%
Quality -34% 10% -21% 100%
Momentum
-7% 43% -70% 48% 100%
Low Vol 50% 0% 32% -40% -17% 100%
S&P 500 59% 4% 24% -57% -35% 88% 100%
90
95
100
105
110
115
120
Feb-01 Feb-03 Feb-05 Feb-07 Feb-09 Feb-11 Feb-13 Feb-15
Cu
mu
lati
ve e
xces
s re
turn
s
Equity Vol Risk Premia (eVRP)GrowthValueQualityMomentum
95
97
99
101
103
105
107
109
111
113
115
May-03 May-05 May-07 May-09 May-11 May-13
Cu
mu
lati
ve e
xces
s re
turn
s
Equity Vol Risk Premia (eVRP)
Barra Low Vol
S&P 500
eVRP Growth Value Quality Mmtm Low Vol S&P 500
Ret (p.a.) 20.6% -4.7% 3.6% -3.7% -3.7% 5.8% 4.0%
Vol (p.a.) 20.4% 8.2% 8.6% 8.4% 13.4% 11.7% 15.2%
Sharpe 1.01 -0.57 0.42 -0.44 -0.27 0.49 0.27
MDD -55.6% -71.3% -32.9% -64.6% -72.2% -57.8% -75.8%
Calmar 0.37 -0.07 0.11 -0.06 -0.05 0.10 0.05

Vol risk premia exist across asset classes
Source: Nomura Research. G10 FX Carry is the Nomura G10 FX Carry Index. Correlation is calculated based on Jan 2001 to Jan 2015. 22
Short gamma strategies outperformed across asset classes and are decorrelated
40
400
01 02 03 04 05 06 07 08 09 10 11 12 13 14
Cu
mu
lati
ve e
xces
s re
turn
s (l
og-
scal
ed
)
eVRP S&P 500
90
120
150
180
210
240
270
300
95 97 99 01 03 05 07 09 11 13 15
Cu
mu
lati
ve e
xces
s re
turn
s
iVRP (USD) US 10Y Treasury
90
100
110
120
130
140
150
10 11 12 13 14 15
Cu
mu
lati
ve e
xces
s re
turn
s
FX Global VRP
G10 FX Carry
Correlation eVRP iVRP (USD) FX VRP S&P 500 Treasury FX Carry
eVRP 100%
iVRP (USD) 16% 100%
FX VRP 23% 28% 100%
S&P 500 52% 16% 25% 100%
Treasury -20% 3% -16% -35% 100%
FX Carry 21% 9% 27% 23% -18% 100%
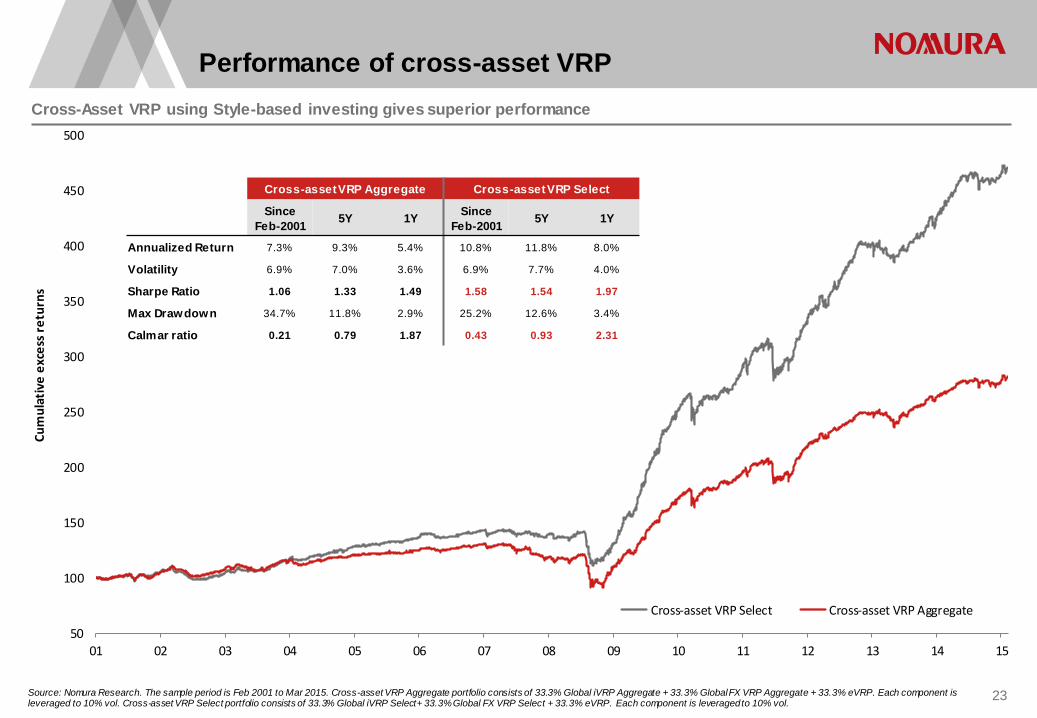
Performance of cross-asset VRP
Source: Nomura Research. The sample period is Feb 2001 to Mar 2015. Cross-asset VRP Aggregate portfolio consists of 33.3% Global iVRP Aggregate + 33.3% Global FX VRP Aggregate + 33.3% eVRP. Each component is leveraged to 10% vol. Cross-asset VRP Select portfolio consists of 33.3% Global iVRP Select+ 33.3% Global FX VRP Select + 33.3% eVRP. Each component is leveraged to 10% vol.
23
50
100
150
200
250
300
350
400
450
500
01 02 03 04 05 06 07 08 09 10 11 12 13 14 15
Cu
mu
lati
ve e
xce
ss r
etu
rns
Cross-asset VRP Select Cross-asset VRP Aggregate
Cross-asset VRP Aggregate Cross-asset VRP Select
Since
Feb-2001 5Y 1Y
Since
Feb-2001 5Y 1Y
Annualized Return 7.3% 9.3% 5.4% 10.8% 11.8% 8.0%
Volatility 6.9% 7.0% 3.6% 6.9% 7.7% 4.0%
Sharpe Ratio 1.06 1.33 1.49 1.58 1.54 1.97
Max Drawdown 34.7% 11.8% 2.9% 25.2% 12.6% 3.4%
Calmar ratio 0.21 0.79 1.87 0.43 0.93 2.31
Cross-Asset VRP using Style-based investing gives superior performance

Closing thoughts

25
Conclusions
Volatility = Insurance
Everybody is short – not everybody is getting paid for it.
Not a question of whether to sell vol, but when to sell it
Some vols are better than others
Vol Risk Premia are pervasive
Vol is an asset class you should not ignore

Appendix: Vol Risk Premia – Selling Gamma
Source: Nomura Research 26
We can sell options, and delta hedge, mark-to-market regularly
This is called “shorting Gamma” or obtaining the Volatility Risk Premia
Effectively, we sell insurance to the market – tail-risk insurance. In general, it is commensurate with the risk.
Note that Gamma, 𝛤 𝑡 = 𝜕2𝐶(𝑆,𝑡)
𝜕𝑆2 is positive for a long call or put position, and negative for a short position.
According to the Black-Scholes robustness theory, a short variance swap
position has the following theoretical PnL (right)
Hence, selling variance swap allows to capture the Volatility Risk Premia.
For a variance swap 𝛤 𝑡 =constant, so it captures the pure vol risk premium.
For other markets where variance swaps do not exist, we have to carefully
balance risk across entry points (although we cannot alter positions after entry
due to transaction costs).
Black-Scholes Theory
Gamma:
Risk/Exposure
Volatility Risk Premia
VRP
Selling vol—short gamma strategies,.
𝐸[𝑃&𝐿] = 1
2Γ 𝑡 𝜎𝐼𝑚𝑝
2 𝑡 − 𝜎𝑅𝑒𝑎𝑙2 𝑡 𝑑𝑡
𝑇
0

Appendix A-1
Analyst Certification
I, Nick Firoozye, hereby certify (1) that the views expressed in this Research report accurately reflect my personal views about any or all of the subject securities or issuers referred to in this Research report,
(2) no part of my compensation was, is or will be directly or indirectly related to the specific recommendations or views expre ssed in this Research report and (3) no part of my compensation is tied to any
specific investment banking transactions performed by Nomura Securities International, Inc., Nomura International plc or any other Nomura Group company.
Important Disclosures Online availability of research and conflict-of-interest disclosures
Nomura research is available on www.nomuranow.com/research, Bloomberg, Capital IQ, Factset, MarkitHub, Reuters and ThomsonOne.
Important disclosures may be read at http://go.nomuranow.com/research/globalresearchportal/pages/disclosures/disclosures.aspx or requested from Nomura Securities International, Inc., on 1-877-865-5752.
If you have any difficulties with the website, please email [email protected] for help.
The analysts responsible for preparing this report have received compensation based upon various factors including the firm's total revenues, a portion of which is generated by Investment Banking activities.
Unless otherwise noted, the non-US analysts listed at the front of this report are not registered/qualified as research analysts under FINRA/NYSE rules, may not be associated persons of NSI, and may not be
subject to FINRA Rule 2711 and NYSE Rule 472 restrictions on communications with covered companies, public appearances, and t rading securities held by a research analyst account.
Nomura Global Financial Products Inc. (“NGFP”) Nomura Derivative Products Inc. (“NDPI”) and Nomura International plc. (“NIplc ”) are registered with the Commodities Futures Trading Commission and the
National Futures Association (NFA) as swap dealers. NGFP, NDPI, and NIplc are generally engaged in the trading of swaps and o ther derivative products, any of which may be the subject of this report.
ADDITIONAL DISCLOSURES REQUIRED IN THE U.S.
Principal Trading: Nomura Securities International, Inc and its affi l iates will usually trade as principal in the fixed income securities (or in related derivatives) that are the subject of this research report. Analyst
Interactions with other Nomura Securities International, Inc. Personnel: The fixed income research analysts of Nomura Securit ies International, Inc and its affi l iates regularly interact with sales and trading desk
personnel in connection with obtaining liquidity and pricing information for their respective coverage universe .
Valuation methodology - Fixed Income
Nomura’s Fixed Income Strategists express views on the price of securities and financial markets by providing trade recommendations. These can be relative value recommendations, directional trade
recommendations, asset allocation recommendations, or a mixture of all three.
The analysis which is embedded in a trade recommendation would include, but not be limited to:
• Fundamental analysis regarding whether a security’s price deviates from its underlying macro - or micro-economic fundamentals.
• Quantitative analysis of price variations.
• Technical factors such as regulatory changes, changes to risk appetite in the market, unexpected rating actions, primary ma rket activity and supply/ demand considerations.
The timeframe for a trade recommendation is variable. Tactical ideas have a short timeframe, typically less than three months. Strategic trade ideas have a longer timeframe of typically more than three
months.
Disclaimers This document contains material that has been prepared by the Nomura entity identified on page 1 and/or with the sole or join t contributions of one or more Nomura entities whose employees and their
respective affi l iations are also specified on page 1 or identified elsewhere in the document. The term "Nomura Group" used he rein refers to Nomura Holdings, Inc. or any of its affi l iates or subsidiaries and may
refer to one or more Nomura Group companies including: Nomura Securities Co., Ltd. ('NSC') Tokyo, Japan; Nomura International plc ('NIplc'), UK; Nomura Securities International, Inc. ('NSI'), New York, US;
Nomura International (Hong Kong) Ltd. (‘NIHK’), Hong Kong; Nomura Financial Investment (Korea) Co., Ltd. (‘NFIK’), Korea (Inf ormation on Nomura analysts registered with the Korea Financial Investment
Association ('KOFIA') can be found on the KOFIA Intranet at http://dis.kofia.or.kr); Nomura Singapore Ltd. (‘NSL’), Singapore (Registration number 197201440E, regulated by the Monetary Authority of
Singapore); Nomura Australia Ltd. (‘NAL’), Australia (ABN 48 003 032 513), regulated by the Australian Securities and Investm ent Commission ('ASIC') and holder of an Australian financial services licence
number 246412; P.T. Nomura Indonesia (‘PTNI’), Indonesia; Nomura Securities Malaysia Sdn. Bhd. (‘NSM’), Malaysia; NIHK, Taipe i Branch (‘NITB’), Taiwan; Nomura Financial Advisory and Securities (India)
Private Limited (‘NFASL’), Mumbai, India (Registered Address:

Ceejay House, Level 11, Plot F, Shivsagar Estate, Dr. Annie Besant Road, Worli, Mumbai - 400 018, India; Tel: +91 22 4037 4037, Fax: +91 22 4037 4111; CIN No : U74140MH2007PTC169116, SEBI
Registration No: BSE INB011299030, NSE INB231299034, INF231299034, INE 231299034, MCX: INE261299034) and NIplc, Madrid Branch (‘NIplc, Madrid’). ‘CNS Thailand’ next to an analyst’s name on the
front page of a research report indicates that the analyst is employed by Capital Nomura Securities Public Company Limited (‘CNS’) to provide research assistance services to NSL under a Research
Assistance Agreement. ‘NSFSPL’ next to an employee’s name on the front page of a research report indicates that the individua l is employed by Nomura Structured Finance Services Private Limited to
provide assistance to certain Nomura entities under inter-company agreements.
THIS MATERIAL IS: (I) FOR YOUR PRIVATE INFORMATION, AND WE ARE NOT SOLICITING ANY ACTION BASED UPON IT; (II) NOT TO BE CONSTRUED AS AN OFFER TO SELL OR A
SOLICITATION OF AN OFFER TO BUY ANY SECURITY IN ANY JURISDICTION WHERE SUCH OFFER OR SOLICITATION WOULD BE ILLEGAL; AND (III) BASED UPON INFORMATION FROM
SOURCES THAT WE CONSIDER RELIABLE, BUT HAS NOT BEEN INDEPENDENTLY VERIFIED BY NOMURA GROUP.
Nomura Group does not warrant or represent that the document is accurate, complete, reliable, fit for any particular purpose or merchantable and does not accept l iability for any act (or decision not to act)
resulting from use of this document and related data. To the maximum extent permissible all warranties and other assurances b y Nomura group are hereby excluded and Nomura Group shall have no liability
for the use, misuse, or distribution of this information.
Opinions or estimates expressed are current opinions as of the original publication date appearing on this material and the i nformation, including the opinions and estimates contained herein, are subject to
change without notice. Nomura Group is under no duty to update this document. Any comments or statements made herein are those of the author(s) and may differ from views held by other parties within
Nomura Group. Clients should consider whether any advice or recommendation in this report is suitable for their particular ci rcumstances and, if appropriate, seek professional advice, including tax advice.
Nomura Group does not provide tax advice.
Nomura Group, and/or its officers, directors and employees, may, to the extent permitted by applicable law and/or regulation, deal as principal, agent, or otherwise, or have long or short positions in, or buy or
sell, the securities, commodities or instruments, or options or other derivative instruments based thereon, of issuers or sec urities mentioned herein. Nomura Group companies may also act as market maker or
l iquidity provider (within the meaning of applicable regulations in the UK) in the financial instruments of the issuer. Where the activity of market maker is carried out in accordance with the definition given to it
by specific laws and regulations of the US or other jurisdictions, this will be separately disclosed within the specific issu er disclosures.
This document may contain information obtained from third parties, including ratings from credit ratings agencies such as Sta ndard & Poor’s. Reproduction and distribution of third-party content in any form is
prohibited except with the prior written permission of the related third -party. Third-party content providers do not guarantee the accuracy, completeness, timeliness or availability of any information, including
ratings, and are not responsible for any errors or omissions (negligent or otherwise), regardless of the cause, or for the re sults obtained from the use of such content. Third-party content providers give no
express or implied warranties, including, but not l imited to, any warranties of merchantability or fitness for a particular p urpose or use. Third-party content providers shall not be liable for any direct, indirect,
incidental, exemplary, compensatory, punitive, special or consequential damages, costs, expenses, legal fees, or losses (incl uding lost income or profits and opportunity costs) in connection with any use of
their content, including ratings. Credit ratings are statements of opinions and are not statements of fact or recommendations to purchase hold or sell securities. They do not address the suitabil ity of securities
or the suitabil ity of securities for investment purposes, and should not be relied on as investment advice.
Any MSCI sourced information in this document is the exclusive property of MSCI Inc. (‘MSCI’). Without prior written permissi on of MSCI, this information and any other MSCI intellectual property may not be
reproduced, re-disseminated or used to create any financial products, including any indices. This information is provided on an "as is" basis. The user assumes the entire risk of any use made of this
information. MSCI, its affi liates and any third party involved in, or related to, computing or compiling the information here by expressly disclaim all warranties of originality, accuracy, completeness,
merchantability or fitness for a particular purpose with respect to any of this information. Without l imiting any of the fore going, in no event shall MSCI, any of its affi liates or any third party involved in, or related
to, computing or compiling the information have any liability for any damages of any kind. MSCI and the MSCI indexes are serv ices marks of MSCI and its affi l iates.
Russell/Nomura Japan Equity Indexes are protected by certain intellectual property rights of Nomura Securities Co., Ltd. and Russell Investments. Nomura Securities Co., Ltd. and Russell Investments do not
guarantee the accuracy, completeness, reliability, or usefulness thereof and do not account for business activities and servi ces that any index user and its affi l iates undertake with the use of the Indexes.
Investors should consider this document as only a single factor in making their investment decision and, as such, the report should not be viewed as identifying or suggesting all risks, direct or indirect, that
may be associated with any investment decision. Nomura Group produces a number of different types of research product including, among others, fundamental analysis and quantitative analysis;
recommendations contained in one type of research product may differ from recommendations contained in other types of researc h product, whether as a result of differing time horizons, methodologies or
otherwise. Nomura Group publishes research product in a number of different ways including the posting of product on Nomura G roup portals and/or distribution directly to clients. Different groups of clients
may receive different products and services from the research department depending on their individual requirements.
Figures presented herein may refer to past performance or simulations based on past performance which are not reliable indicators of future performance. Where the information contains an indication of
future performance, such forecasts may not be a reliable indicator of future performance. Moreover, simulations are based on models and simplifying assumptions which may oversimplify and not reflect the
future distribution of returns.
Certain securities are subject to fluctuations in exchange rates that could have an adverse effect on the value or price of, or income derived from, the investment.
The securities described herein may not have been registered under the US Securities Act of 1933 (the ‘1933 Act’), and, in such case, may not be offered or sold in the US or to US persons

unless they have been registered under the 1933 Act, or except in compliance with an exemption from the registration requirements of the 1933 Act. Unless governing law permits otherwise, any transaction
should be executed via a Nomura entity in your home jurisdiction.
This document has been approved for distribution in the UK and European Economic Area as investment research by NIplc. NIplc is authorised by the Prudential Regulation Authority and regulated by the
Financial Conduct Authority and the Prudential Regulation Authority. NIplc is a member of the London Stock Exchange. This document does not constitute a personal recommendation within the meaning of
applicable regulations in the UK, or take into account the particular investment objectives, financial situations, or needs o f individual investors. This document is intended only for investors who are 'eligible
counterparties' or 'professional clients' for the purposes of applicable regulations in the UK, and may not, therefore, be re distributed to persons who are 'retail clients' for such purposes. This document has
been approved by NIHK, which is regulated by the Hong Kong Securities and Futures Commission, for distribution in Hong Kong b y NIHK. This document has been approved for distribution in Australia by
NAL, which is authorized and regulated in Australia by the ASIC. This document has also been approved for distribution in Malaysia by NSM. In Singapore, this document has been distributed by NSL. NSL
accepts legal responsibil ity for the content of this document, where it concerns securities, futures and foreign exchange, issued by their foreign affi liates in respect of recipients who are not accredited, expert
or institutional investors as defined by the Securities and Futures Act (Chapter 289). Recipients of this document in Singapore should contact NSL in respect of matters arising from, or in connection with, thi s
document. Unless prohibited by the provisions of Regulation S of the 1933 Act, this material is distributed in the US, by NSI, a US-registered broker-dealer, which accepts responsibil ity for its contents in
accordance with the provisions of Rule 15a-6, under the US Securities Exchange Act of 1934. The entity that prepared this document permits its separately operated affiliates within the Nomura Group to
make copies of such documents available to their clients.
This document has not been approved for distribution to persons other than ‘Authorised Persons’, ‘Exempt Persons’ or ‘Institu tions’ (as defined by the Capital Markets Authority) in the Kingdom of Saudi Arabia
(‘Saudi Arabia’) or 'professional clients' (as defined by the Dubai Financial Services Authority) in the United Arab Emirates (‘UAE’) or a ‘Market Counterparty’ or ‘Business Customers’ (as defined by the Qatar
Financial Centre Regulatory Authority) in the State of Qatar (‘Qatar’) by Nomura Saudi Arabia, NIplc or any other member of Nomura Group, as the case may be. Neither this document nor any copy thereof
may be taken or transmitted or distributed, directly or indirectly, by any person other than those authorised to do so into S audi Arabia or in the UAE or in Qatar or to any person other than ‘Authorised Persons’,
‘Exempt Persons’ or ‘Institutions’ located in Saudi Arabia or 'professional clients' in the UAE or a ‘Market Counterparty’ or ‘Business Customers’ in Qatar . By accepting to receive this document, you represent
that you are not located in Saudi Arabia or that you are an ‘Authorised Person’, an ‘Exempt Person’ or an ‘Institution’ in Sa udi Arabia or that you are a 'professional client' in the UAE or a ‘Market Counterparty’
or ‘Business Customers’ in Qatar and agree to comply with these restrictions. Any failure to comply with these restrictions m ay constitute a violation of the laws of the UAE or Saudi Arabia or Qatar.
NO PART OF THIS MATERIAL MAY BE (I) COPIED, PHOTOCOPIED, OR DUPLICATED IN ANY FORM, BY ANY MEANS; OR (II) REDISTRIBUTED WITHO UT THE PRIOR WRITTEN CONSENT OF A
MEMBER OF NOMURA GROUP. If this document has been distributed by electronic transmission, such as e -mail, then such transmission cannot be guaranteed to be secure or error-free as information could
be intercepted, corrupted, lost, destroyed, arrive late or incomplete, or contain viruses. The sender therefore does not acce pt l iability for any errors or omissions in the contents of this document, which may
arise as a result of electronic transmission. If verification is required, please request a hard -copy version.
Nomura Group manages conflicts with respect to the production of research through its compliance policies and procedures (inc luding, but not l imited to, Conflicts of Interest, Chinese Wall and Confidentiality
policies) as well as through the maintenance of Chinese walls and employee training.
Additional information is av ailable upon request and disclosure information is av ailable at the Nomura Disclosure web page:
http://go.nomuranow.com/research/globalresearchportal/pages/disclosures/disclosures.aspx
Copyright © 2015 Nomura International plc. All rights reserved.
Disclosures as of 16-Feb-2015.


![Vol Risk Premia in Equities - nomura.com · T log( E T [exp( ³ r s ds)]) ~ V T ~ (1 2) 1 2 y T y ... 0.20 0.40 0.60 0.80 1.00 Low-vol Bucket Mid-vol Bucket High-vol Bucket o Performance](https://static.fdocuments.us/doc/165x107/5b08659a7f8b9a992a8c32b2/vol-risk-premia-in-equities-log-e-t-exp-r-s-ds-v-t-1-2-1-2-y-t-y-.jpg)