Vol. 7 Issue 2 - IIM Indore · Kadapa, Kurnool and Tirupati of Rayalaseema Region of Andhra...
78
Transcript of Vol. 7 Issue 2 - IIM Indore · Kadapa, Kurnool and Tirupati of Rayalaseema Region of Andhra...

IMJ 73
Volume 7 Issue 2 July - December 2015
Editorial
We are happy to present the second issue of the seventh volume of the Indore
Management Journal. This is a special issue on the domain of marketing management.
The present issue tries to focus on understanding and improving quality of products
and services in emerging markets.
The first article discussed the factors affecting the competitiveness and survivability
of unorganized retail outlets in the dynamic retail environment. The influence of
employer branding on employee’s attitude has been reported in second article.The
third article investigated that service innovation must perform a mediating role
in the relationship between market orientation and organization performance. The
fourth article focuses on the consideration of ethics in marketing communication.
The fifth article highlights the major issues in penetrating into new market segments
of different sectors and suggests ways to overcome problems related to market
penetration. The sixth article explores the four store characteristics which may lead
to trust and, in turn, facilitate formation of willingness to purchase, electronic word
of mouth and social capital in consumer's social networks. Last article measures
and compares the perception of customers in the customer service practices of the
two sectors.
We are confident that the articles presented in this issue will be useful to current
management researchers and practitioners.
Editorial TeamIndore Management Journal (IMJ)
EDITORIAL
1 Factors Affecting the Competitiveness of Unorganized Retail Outlets inRayalaseema Region of Andhra PradeshG. Somasekhar, M. Suresh Babu, Shaik Saleem and R. Madhu
14 Impact of Employer Branding on Employees' AttitudeVijay Rathee and Ritu
22 Market Orientation and Service Innovation: Examining the Linkages to Organisation PerformanceGarima Gupta and Sanjeewani Sehgal
36 Ethical Marketing Communication in the Era of DigitizationKuldeep Brahmbhatt
45 Market Penetration Through Sales Promotion: A ReviewSubhasis Sen and Kannan Rajagopal
52 Role of Trust in Perceived Store Characteristics and Consumer Behavioural Outcome inthe Context of Online Social Media MarketingNirankush Dutta and Anil Bhat
63 Way to Customer Delight: Interpreting the Role of Dimensions of Service Quality for EffectiveCRM in Banking and Insurance SectorsCharu Upadhyaya and V.K. Jain
CONTENTS
IMJ ii

IMJ 1
Volume 7 Issue 2 July - December 2015
Abstract
The present study was conducted on unorganised retailoutlets in the major towns of Anantapur, Chittoor,Kadapa, Kurnool and Tirupati in Rayalaseema Regionof Andhra Pradesh. These locations have seen significantdevelopments with respect to retailing, both organisedand unorganised retailing outlets in equal measure.However, unorganised retail outlets have their ownstrategies and have to regulate their operationalstrategies to remain competitive. Twenty-one storeattributes have been extracted from previous studieswhich are suitable to shoppers of Rayalaseema regionof Andhra Pradesh. The study found that merchandisemix, ambience, and smooth transaction and exchangeare the top three factors preferred by the shoppers fromthe unorganised retail outlets. Thus, it can be concludedthat these factors affect the competitiveness and abilityto survive of unorganised retail outlets in the dynamicretail environment.
Key words: Unorganised retail outlets, Factor analysis,Store attributes, Competitiveness.
1. Introduction
Retailing in India has been growing faster than Chinaand accounts for 35 % of GDP. According to Technopakreport (2011), Indian retail market was predicted at US$ 470 billion in 2011 and is projected to grow to US $675 billion by 2016, with CAGR of 7.5%. Organisedretail market in India was estimated at US$ 26 billionin 2011 and is projected to grow to US$ 84 billion by2016, with CAGR of 26% for the period 2011-16. Theunorganised retail market also is expected to grow from$ 495 billion to $ 729 billion during the next three years.It shows that organised retail penetration is growingfaster than unorganised retail penetration. In India,there are over 12 million mom-and-pop stores (familyowned Kirana stores), and they occupy around 92 percentof the retail share.
Factors Affecting the Competitiveness of UnorganisedRetail Outlets in Rayalaseema Region of Andhra PradeshG. Somasekhar, M. Suresh Babu, Shaik Saleem and R. Madhu
The disposable income of the middle and upperhouseholds in India went up on a regular basis in thepast decade and contributed in the rapid growth ofretail trade in India. The retail revolution has alreadybrought many positive changes in the lifestyle ofconsumers residing in metro cities; it is slowly affectingthe lifestyle of consumers in the two-tier cities and smalltowns too. Today there is not much differences inspending between shoppers of cities and small towns(Srivastava, 2008) due to many reasons such as higherliteracy rate, high disposable income, increasedawareness level through media, presence andaccessibility of a variety of consumer products. Due tothe emergence of modern retail systems likesupermarkets and hypermarkets in India, local stores(Kirana Stores) are facing severe competition with respectto pricing strategy, quality and availability of a varietyof products. Retailing in the unorganised sector aimsto earn something for livelihood rather than for makinghuge profits. Further, the growth in organised retailingin recent years may have adversely affected unorganisedretailing. Further, the recent signal of reforms by theGovernment to incentivize Foreign Direct Investment(FDI) in various sectors has prompted positivesentiments in organised retail but at the same time hascreated negative sentiments in unorganised retail outlets(Agarwal and Tyagi, 2011).
Establishments in small towns such as hypermarkets,megastores and supermarkets backed by corporates insmall towns are affecting the buying pattern of theconsumers, and slowly these consumers are movingtowards organised retailing. In addition, organisedretailers are promptly coping with changes in the buyingbehaviour of consumers and taking suitable measures.It is essential for unorganised retailers to understandthe buying behaviour of consumers and adaptaccordingly. So, it is clear that various factors influencingthe shoppers' behaviour may influence competitivenessin retailing. Moreover, factors influencing buying
An Earlier version of the manuscript was accepted for presentation at World Management Conference (WMC) 2015.
G. Somasekhar, M. Suresh Babu, Shaik Saleem and R. Madhu
IMJ 2
Volume 7 Issue 2 July - December 2015
behaviour of shoppers are similar for both organisedand unorganised retailing. It is vital for unorganisedretailers to understand the changing buying behaviourof consumers in order to be more competitive in smalltowns where organised retailing is in its nascent stage.In this context the present study attempts to understandshoppers' behaviour in towns like Anantapur, Chittoor,Kadapa, Kurnool and Tirupati of Rayalaseema Regionof Andhra Pradesh.
2. Review of Literature
South (1980) illustrated that management of competitiveadvantage is possible by, identifying, developing, andtaking advantage of the enclaves through which atangible and sustainable business edge can be achieved.According to Porter (1990) competitive advantage growsfrom the value a firm is able to create for its buyers overand above the firm's cost of creating the product orservice. Day et al. (1988) focused on the state of theadvantage of competitiveness along with how theadvantage was gained by successful industries in variouscountries based on past cases. In their view competitiveadvantage consists of positional and performancesuperiority with an outcome relative to the competitionwith respect to skills and resources a business deploys.These skills and resources (Barney, 1991; Lado & Wilson,1994)bring out positional advantages like cost anddifferentiation, by stressing on productivity. Accordingto Porter (1992)there are three generic competitivestrategies such as, cost, differentiation and focusstrategy. It is to be noted that most of the firms usedgeneric competitive strategy to differentiate themselvesfrom the competitor.
Fulmer et al., (1998) study reveals that the significanceof developing and sustaining competitive advantage isimportant if competitive conditions grow ever moreturbulent. McGahan & Porter, (1997) reveal that it isessential to sustain competitive advantage for longerperiods across industrial contexts. A number ofresearchers have pointed out that sustainablecompetitive advantage provides a fertile domain ofstudy to reveal the peculiarities of retail industry(Greenley & Shipley, 1995; Hawes & Crittenden, 1984).Some researchers have opined that industry-levelattributes and firm-level attributes are the two bestcategories of determinants influencing the competitive
advantage of organizations(Amit & Schoemaker, 1993;Dyer & Singh, 1998; Lado et al., 1992; Rumelt, 1991).Others highlighted the distinctive attributes of firms asdistinctive competencies (Fiol, 1991; Reed & DeFillippi,1990). Empirical studies have also found that firmattributes play a significant role in the study ofcompetitive advantage (Amit & Schoemaker, 1993;Hansen & Wernerfelt, 1989; Hooley et al., 1998; Ladoand Wilson, 1994; Rumelt, 1991).
Some of the authors reveal that location emerged as aconcentric variable of competitive strategy and wasextensively viewed as a significant path for firms toachieve strategic advantage, firm success and to improvefinancial results (Bharadwaj et al., 1993; Fernie, 1995;Shiret, 1992; Wrigley, 1994 ). The impact of low pricesin retail can attract customers very fast than competitiveretailers and it forces other retailers to change their ownprices(Howe, 1992). Swinyard (1997) reveals that the in-store use of developed technologies like self-scanningdevices, customer and staff touch screen appliances,intelligent trolleys and consumer smart cards areresources exploited for developing competitiveadvantage in retail outlets. Numerous retail companiesdominate retailing, threatening the survivalofunorganised retailers (Shaw et al., 1992 & Arnold et al.,1998).If conventional unorganised retailers mustcontinue to exist in the competitive environment, theyneed to identify, understand and then fulfil customers'needs more effectively than the competitors(Mishra &Dash, 2008). A study by Sinha and Banerjee (2004)analysed 43 variables on store choice behaviour in anevolving market. These variables are grouped asproximity, merchandise, ambience, service, patronizedand others.
Study by Goswami and Mishra (2008) had the objectiveof ascertaining the differences in shopping betweenKirana stores and Supermarkets. This study measured44 variables and extracted 11 factors these were labelledas: 1. Store cleanliness, store offers and product quality;2. Store brands, family grocery shopping and parkingfacilities; 3. Hedonic shopping; 4. Location; 5. Specificday shopping; 6. Multiple stores; 7. Planned shopping;8. In-store conveniences: 9. Helpful and trustworthysalespeople; 10. Travel convenience; 11. Unplannedpurchases. Oppewal & Timmermans (1997) carried outa study on 183 retailers in a European town to know
G. Somasekhar, M. Suresh Babu, Shaik Saleem and R. Madhu

IMJ 3
Volume 7 Issue 2 July - December 2015
the importance of self perceived image and competitivepositioning for the retailers. The study revealed thataverage retailers think of service as the key dimensionto differentiate themselves from the competitors. Priceand promotion factors have theleast impact on perceivedimage of the stores. The study further suggested thatsix dimensions underlie retailer's self perceived storeimage such as, Price, Location, Interior, Selection, Serviceand Product Quality.
A study by Ramakrishnan (2010) tried to explore thecompetitive response of small retailers with increasedcompetition from organised retailers in the emergingIndian economy. In his study retailers were clusteredinto groups on the basis of the success strategiesfollowed. The research brings out key findings regardingstrategies such as, maintaining a personal relationshipwith the customers, providing additional services whichare valued by the customers, and assessing the impactof adopted strategies identified by the retailers. Shah(2009) focused on the importance of understandingconsumer preferences as a key to success in any businessorganization. The study was conducted in Rajkot andJamnagar cities in Gujarat state. Customers who visitedmalls and 'mom and pop stores' on a regular basis werethe major respondents for the study. The studyhighlighted various suggestions for 'mom and pop stores'to remain competitive in the fast changing world ofretail such as, they need to improve the processes;careful inventory management needs to be done toreduce losses; stores need to improve the display ofgoods so as to have an aesthetic appeal to the customers;and, maintain customer relationship effectively.
Chattopadhyay and colleagues (2010) described theretail sector in India as undergoing transformation dueto emerging economies and fast growing markets. Theirresearch revealed that the traditional retail storesmaintain their competitiveness and remain resilientwith their service mix even in the presence of organisedretailers. The study also indicated that even in thepresence of large retail stores in metros, customers stillretain loyalty towards neighbourhood stores due todistinctive strategies like credit facility, home deliveryand facility to place orders over phone.Gupta andTandon (2013) did a study based in Jammu city withan objective to identify the factors that influence
consumers to visit organised retailers and vice versa,and also issues faced by the consumers with organisedand unorganised retailers. The major finding of thestudy was that approximately 87 percent of consumersare willing to shop with unorganised retail outlets. Atthe same time this format needs to find ways to retainthe customers, as modern formats are being continuouslyestablished (Uusitalo, 2001).
Reforms in Foreign Direct Investment (FDI), constantimprovements in supply chain and logistics, changingpreferences of consumer from traditional to modernstores etc. forced the unorganised retail outlets to changetheir operational strategies to gain competiveness acrossretailing. The area of unorganised retail is an unexploredarea of research.Very few studies have concentrated onstore attributes and there are no studies regardingcompetitiveness of unorganised retailing in Rayalaseemaregion of Andhra Pradesh. In this context, this studyis a significant contribution to the research on factorsaffecting the competitiveness of unorganised retailoutlets in Rayalaseema region of Andhra Pradesh.
Based on the above discussion we propose the followinghypotheses
H1: Region of residence and living affect the prefer-ence of shoppers for store attributes inunorganised retail outlets.
H2: Age affects the preference of shoppers towardsunorganised retail outlets.
H3: Gender affects the preference of shoppers towardsunorganised retail outlets.
H4: Monthly household income affects the preferenceof shoppers towards unorganised retail outlets.
3. Research Methodology
The study is basically descriptive in nature.Data werecollected from shoppers who visited unorganised retailstores of Rayalaseema region in Andhra Pradesh. Pilotstudy was carried out during May 2014 and the actualsurvey was conducted from June 2014 to November2014.Questions were posed relating to demographicssuch as age, gender, monthly household income,occupation and education, of the respondents. 21 storeattributes suitable to Rayalaseema region were extractedfrom previous studies.These store attributes were
G. Somasekhar, M. Suresh Babu, Shaik Saleem and R. Madhu

IMJ 4
Volume 7 Issue 2 July - December 2015
measured on a five-point rating scale. The respondentsare above 20 years of age. The study was conducted infive major towns like Anantapur, Chittoor, Kadapa,Kurnool and Tirupati. 1250 questionnaires weredistributed in all, which constitute 250 questionnairesfor each town 1152 questionnaires were received backand were used for analysis of data. Response rates are87.6%, 96.4%, 94.4%, 85.6% and 96.8%, respectively.Overall response rate is 92.2%. Care has been taken tokeep the response rate as high as possible. ANOVAand Factor Analysis was conducted to analyse the data(Table 1).
4. Results and Discussion
4.1 Analysis of Shoppers' Profile
Table 2 shows the demographic profile of the shoppersscattered across Rayalaseema region of Andhra Pradesh.Out of 1152 respondents surveyed, majority of theshoppers (48 percent) are of age between 30-39 years.Further, majority of the shoppers (61 percent) are male.A majority of shoppers (32.5 percent) have incomebetween Rs. 20001 to Rs. 30000.
4.2 Shoppers' Perception Level on Store Attributes
Shoppers' perception level towards various storeattributes affects competitiveness in the unorganisedretail outlets in Rayalaseemaregion. 21 items were listout from previous studies and preferences of shopperstowards these items were rated usinga five-point ratingscale.
Table 3 shows that most of the shoppers in Rayalaseemaregion give higher importance to products stocked withfreshness followed by convenient store timings, fast &efficient billing, availability of variety of brands &products and Promptness in handling shoppercomplaints with mean scores of 4.57, 4.13, 4.04, 4.01 and4.00 respectively. Again, it observed that most of theshoppers in the region gave lesser importance toavailability of global products and loyalty programmembership with mean scores of 3.28 and 3.39respectively.
Table 4 reveals the difference in the opinion of shoppersliving in five towns of Rayalaseema region for variousstore attributes. It is found that shoppers from Anantapur
indicated preference for availability of variety of brands& products and nearness to residence attributes.Shoppers from Chittoor highly preferred product stockedwith freshness. Spacious & clean environment, error-free sales transactions & records, quick handling ofcomplaints, exchange policy, all modes of paymentaccepted, relationship with the store and brandimagewere highly preferred by shoppers from Kadapa.Shoppers from Kurnool preferred prompt & efficientstaff. Availability of global products, availability ofproducts in desired pack sizes, discounts & promotionschemes, fast & efficient billing, free home delivery,credit availability, error-free sales transactions & records,loyalty program membership, convenient store timings,order is taken over phone and parking facilities werepreferred by shoppers from Tirupati.
Overall, shoppers from Tirupati preferred 11 attributesfollowed by Kadapa on 7 attributes. People of Tirupatiand Kadapatowns expect more from unorganised retailoutlets as compared to other towns. However, theperception of the shoppers living in these towns do notdiffer significantly for store attributes except loyaltyprogram, exchange policy and order is taken over phone.Thus, regional location does not affect the store attributespreferences since for most store attributes there is nosignificant difference for the perception of shoppersliving in these towns. But for retailers to have acompetitive advantage in these regions they have tofocus on all attributes except loyalty program, exchangepolicy and order is taken over phone.
The above mean scores reveal the shoppers' preferencelevel based on each attribute.The factor analysis hasbeen carried out to ascertain the bundle of attributespreferred by shoppers from unorganised retail outlets.
4.3 Factor Analysis
Factor analysis was performed on the explanatoryvariables with the primary goal of data reduction.
4.3.1 Explanation of the factors derived for unorganisedformats
Table 5 reveals that 'smooth transaction & exchange'showed the highest degree of variance (12.525%). Hence,it was labelled as the first factor followed by the second
G. Somasekhar, M. Suresh Babu, Shaik Saleem and R. Madhu

IMJ 5
Volume 7 Issue 2 July - December 2015
factor was 'convenience & comfort' with second highestdegree of variance (11.766), the third factor was foundto be 'ambience' that displayed 10.499 % variation, thefourth factor was tagged as 'attractive promotions'at9.999% of variance, the fifth factor was 'merchandisemix'with 9.650% variance, the sixth factor was 'valueadded facilities'with 8.316% variance and while theseventh factor was tagged as 'store relationship'with6.226% variance. A value of more than 0.6 Cronbach'salpha is considered a good measure of scale of reliability(Nunnally, 1978). Table 5 indicates that for all six factors,Cronbach's alpha values were more than 0.6. In caseof the seventh factor it was nearer to 0.6.
Table 6 reveals shoppers' preferences towards factorsbased on rankings of unorganised retail outlets.Ithighlights that merchandise mix was the most preferredfactor with a mean score of 4.07, followed by ambiencewith score of 3.84, smooth transaction & exchange withscore of 3.82, convenience & comfort with score of 3.79,value added facilities with score of 3.71, storerelationship with score of 3.64 and attractive promotionswith score of 3.63. Hence, it was observed thatmerchandise mix, ambience and smooth transaction &exchange were the top three factors preferred or expectedby respondents from unorganised retail outlets. Thusthese factors affect the competitiveness of unorganisedretail outlets in Rayalaseema region and they contributeto survival inthe changing retail landscape.
Table 7 reveals that smooth transaction & exchange wasthe preferred factor for shoppers of age group 20-29years, followed by shoppers of age groups 30-39, 40-49 and 50 & above years, with mean scores of 4.05, 3.92,3.61 and 3.52 respectively. The mean scores forconvenience & comfort for age groups 20-29, 30-39, 40-49 and 50 & above are 4.03, 3.72, 3.59 and 3.89respectively, indicating that age group of 20-29 is morecautious about convenience & comfort. The age group20-29 is more concentrated on ambience with a meanscore of 3.91. Shoppers of lower age groups are morecautions towards attractive promotions in comparisonto shoppers of higher age groups. The mean score formerchandise mix for age group 20-29, 30-39, 40-49 and50 & above years are 4.34, 4.10, 4.10 and 3.67 respectively,indicating that age group of 20-29 is more cautiousabout merchandise mix. Value added facilities factor ismore considered by the age group of 20-29 followed by
40-49, with mean scores 4.05 and 3.65respectively. ismore concentrated by 40-49 age group with the meanscore 3.72. Hence it is observed that lower age groupswere highly concentrated on maximum factors comparedto higher age groups in unorganised retail outlets inRayalaseema region.
From Table 7 it is concluded that age influences theimportance of smooth transaction & exchange,convenience & comfort and merchandise mix. Therefore,smooth transaction & exchange, convenience & comfortand merchandise mix factors are influenced by differentage groups towards unorganised retail outlets in theselected region.
Table 8 reveals that female shoppers are moreconcentrated on all the seven factors compared to maleshoppers in unorganised retail outlets in Rayalaseemaregion. Further the factors preferences differ significantlyfor smooth transaction & exchange . Therefore genderdoes not have much impact on preference for variousfactors except smooth transaction & exchange inunorganised retail outlets in Rayalaseema region.
Table 9 brings out that smooth transaction & exchangefactor is highly preferred by shoppers with incomeabove Rs 40, 000, followed by shoppers with incomeRs 10,001-20,000 with the mean scores of 4.10 and 3.90respectively. Further shoppers having income above Rs40,000 are more cautious about the convenience &comfort, ambience and value added facilities with meanscores of 4.27, 4.35 and 3.87 respectively. Shoppershaving income between Rs 20,001-30,000 look more forattractive promotions with a mean score of 3.71.Merchandise mix is highly focused by shoppers havingincome between Rs 10,001-20,000 with a mean score of4.20, followed by shoppers having income between Rs30001-40,000 with mean score of 4.10 and so on. Lowincome group shoppers are keen about store relationshipwith mean scores of 3.93 and 3.73 respectively.
From Table 9 it is seen that income influences theimportance for smooth transaction & exchange,convenience & comfort and merchandise mix. Therefore,the smooth transaction & exchange, convenience &comfort and merchandise mix factors influence differentincome groups in unorganised retail outlets inRayalaseema region.
G. Somasekhar, M. Suresh Babu, Shaik Saleem and R. Madhu

IMJ 6
Volume 7 Issue 2 July - December 2015
Table 10 explains that smooth transaction & exchangefactor is greatly preferred by shoppers with graduationfollowed by shoppers with post graduation, shopperswith SSC and shoppers with intermediate. Thus shopperswith UG & PG qualifications are more cautious aboutconvenience & comfort. Shoppers with intermediatequalification highly prefer ambience and storerelationshi.Attractive promotions factor is moreconcentrated by shoppers with under graduatequalification, with SSC qualification prefer merchandisemix and value added facilities.
It is observed that shoppers with different qualificationshave given distinctive opinion for the different factors.
Table 11 reveals that smooth transaction & exchange,convenience & comfort,ambience, attractive promotionsand merchandise mix factors are highly preferred byshoppers with business occupatio. Value added facilitiesand store relationship factors seem most significant forshoppers who are housewives. Thus it is found thatoccupation influences the importance for merchandisemix.
5. Limitations and Future Research
The research has some limitations such as, the datacollected views of shoppers from five locations only.Future research covering more number of locations canprovide better understanding and clearer picture of theshoppers in Rayalaseema region. Another limitation isthat the study was based on non probability andsampling. So, the possibility of generalization of resultsis limited. This limitation may be addressed by the useof probability sampling in future studies.
6. Conclusions
The study was conducted in unorganised retail outletsin the major towns of Anantapur, Chittoor, Kadapa,Kurnool and Tirupati in Rayalaseema region of AndhraPradesh. These locations have shown significantdevelopments with respect to retailing. However, inthese locations unorganised retail outlets have theirown strategies; still they have to regulate theiroperational strategies to remain competitive.
The first objective is to examine the preference of
shoppers living in different regions of Rayalaseema forstore attributes in unorganised retail outlets. The studyreveals that the shoppers from Anantapur preferavailability of variety of brands & products and nearnessto residence attributes more. Shoppers from Chittoorhighly preferred product stocked with freshness.Spacious & clean environment, error-free salestransactions & records, quick handling of complaints,exchange policy, all modes of payment accepted,relationship with the store and brand image were highlypreferred by shoppers from Kadapa. Shoppers fromKurnool preferred more the factor prompt & efficientstaff. Availability of global products, availability ofproducts in desired pack sizes, discounts & promotionschemes, fast & efficient billing, free home delivery,credit availability, error-free sales transactions & records,loyalty program membership, convenient store timings,order is taken over phone and parking facilities attributeswere highly preferred by shoppers from Tirupati.Overall, the shoppers from Tirupati have shown highpreference for 11 attributes, followed by shoppers fromKadapa with high preference for seven attributes. Itshows that people of Tirupati and Kadapa region expectmore from unorganised retail outlets as compared topeople from other regions.However, the perception ofshoppers living in these regions do not differ significantlyfor all the store attributes except loyalty program,exchange policy and order is taken over phone.
The second objective is to examine various factorsaffecting unorganised retail stores competitiveness inRayalaseema region of Andhra Pradesh. As a result ofthis research, seven factors were extracted from 21 storeattributes by conducting factor analysis. These factorsare in the order of smooth transaction & exchange,convenience & comfort, ambience, attractive promotions,merchandise mix, value added facilities and storerelationship.This study clearly indicates thatmerchandise mix, ambience and smooth transaction &exchange were the top three factors preferred or expectedby respondents from unorganised retail outlets inRayalaseema region of Andhra Pradesh. The study alsohighlights different demographic group's influence onthe seven factors. This study helps to understand thepreferences of shoppers in the unorganised retail storesin the Rayalaseema region of Andhra Pradesh.
G. Somasekhar, M. Suresh Babu, Shaik Saleem and R. Madhu

IMJ 7
Volume 7 Issue 2 July - December 2015
Table 1: Sample Size by Location
Anantapur Chittoor Kadapa Kurnool Tirupati
Respondents Approached 250 250 250 250 250
Valid Responses 219 241 236 214 242
Table 2:Demographic Profile of Shoppers
Demographic ResponsesProfile
Age20-29 20430-39 54940-49 18850 and above 211Total 1152
Gender
Male 701Female 451Total 1152
Monthly Household Income
Less than Rs. 10,000 134Rs. 10,001-Rs. 20,000 330Rs. 20,001-Rs. 30,000 374Rs. 30,001-Rs. 40,000 199Above Rs. 40,000 115Total 1152
Education
SSC 125Intermediate 89UG 544PG 394Total 1152
Occupation
Student 18Housewife 149Businessman 24Service 852Self employed 109Total 1152
Table 3: Shoppers' Preference Level TowardsVarious Attributes Inunorganised Stores
Attributes Mean Std.(Unorganised) Deviation
Spacious & clean environment 3.77 1.06
Products stocked with freshness 4.57 0.88
Availability of global products 3.28 1.04
Availability of products indesired pack sizes 3.96 0.95
Availability of variety ofbrands and products 4.01 1.06
Discounts & promotion schemes 3.97 1.03
Fast & efficient billing 4.04 1.04
Prompt& efficient staff 3.69 1.07
Free home delivery 3.75 1.15
Credit availability 3.66 1.00
Error-free sales transactionsand records 3.81 1.07
Loyalty program membership 3.39 1.13
Quick handling of complaints 4.00 0.95
Exchange policy 3.59 1.11
All modes of payment accepted 3.92 1.01
Relationship with the store 3.58 1.00
Brand image 3.73 1.17
Nearness to residence 3.86 0.95
Convenient store timings 4.13 0.98
Order is taken over phone 3.55 1.05
Parkingfacilities 3.84 1.08
G. Somasekhar, M. Suresh Babu, Shaik Saleem and R. Madhu

IMJ 8
Volume 7 Issue 2 July - December 2015
Table 4: ANOVA Results for Store Attributes Preferences at Five Towns inRayalaseema Region of Andhra Pradesh
Anantapur Chittoor Kadapa Kurnool Tirupati Total
Spacious & clean environment 3.73 3.73 3.83 3.75 3.79 0.35
Products stocked with freshness 4.55 4.62 4.52 4.54 4.60 0.55
Availability of global products 3.21 3.23 3.36 3.20 3.40 1.80
Availability of products in desiredpack sizes 3.94 3.89 3.95 3.99 4.02 0.62
Availability of variety of brandsand products 4.04 3.99 4.00 4.00 4.03 0.09
Discounts & promotion schemes 3.94 3.98 3.83 3.99 4.10 2.00
Fast & efficient billing 4.02 4.04 4.03 4.02 4.07 0.09
Prompt & efficient staff 3.63 3.61 3.74 3.75 3.74 0.99
Free home delivery 3.72 3.66 3.71 3.81 3.86 1.18
Credit availability 3.58 3.62 3.64 3.64 3.82 2.10
Error-free sales transactions and records 3.82 3.75 3.88 3.83 3.80 0.46
Loyalty program membership 3.35 3.23 3.44 3.38 3.54 2.47*
Quick handling of complaints 4.00 3.95 4.05 4.00 4.02 0.38
Exchange policy 3.67 3.51 3.74 3.60 3.45 2.61*
All modes of payment accepted 3.91 3.79 3.99 3.93 3.96 1.37
Relationship with the store 3.54 3.55 3.69 3.54 3.58 1.01
Brand image 3.72 3.68 3.81 3.67 3.74 0.53
Nearness to residence 3.89 3.88 3.86 3.88 3.79 0.49
Convenient store timings 4.11 4.16 3.98 4.15 4.23 2.08
Order is taken over phone 3.51 3.42 3.56 3.57 3.71 2.45*
Parking facilities 3.80 3.78 3.78 3.85 3.96 1.22
Note : *significant at 5 % level
G. Somasekhar, M. Suresh Babu, Shaik Saleem and R. Madhu

IMJ 9
Volume 7 Issue 2 July - December 2015
Table 5 : Factors Based on Store Attributes Preferences
Factors Loading Eigen value % of Cronbach'svariance alpha
Factor 1: Smooth transaction & exchange 5.732 12.525 0.715
Fast & efficient billing 0.663Error free sales transactions and records 0.811Exchange policy 0.654Parking facilities 0.621
Factor 2: Convenience & Comfort 1.804 11.766 0.765
Loyalty program membership 0.523Quick handling of complaints 0.531Nearness to residence 0.641Convenient store timings 0.791Order is taken over phone 0.704
Factor 3: Ambience 1.769 10.499 0.628
Store spacious & clean environment 0.815All modes of payment accepted 0.735
Factor 4: Attractive Promotions
Availability of global products 0.640Discounts & promotion schemes 0.769 1.756 9.999 0.604
Factor 5: Merchandise mix 1.282 9.650 0.729
Products stocked with freshness 0.835Availability of products in desired pack sizes 0.743Availability of variety of brands and products 0.543Store image 0.571
Factor 6: Value added facilities 1.111 8.316 0.618
Free home delivery 0.724Credit availability 0.648
Factor 7: Store relationship 1.033 6.226 0.589
Prompt & efficient staff 0.632Relationship 0.810
G. Somasekhar, M. Suresh Babu, Shaik Saleem and R. Madhu

IMJ 10
Volume 7 Issue 2 July - December 2015
Table 6: Store Factor Rankings of Unorganised Retail Outlets
Factors Overall Mean Scores Rank
Factor 1: Smooth transaction & exchange 3.82 III
Fast & efficient billing 4.04Error free sales transactions and records 3.81Exchange policy 3.59Parking facilities 3.84
Factor 2: Convenience & Comfort 3.79 IV
Loyalty program membership 3.39Quick handling of complaints 4.00Nearness to residence 3.86Convenient store timings 4.13Order is taken over phone 3.55
Factor 3: Ambience 3.84 II
Store spacious & clean environment 3.77All modes of payment accepted 3.92
Factor 4: Attractive Promotions 3.63 VII
Availability of global products 3.28Discounts & promotion schemes 3.97
Factor 5: Merchandise mix 4.07 IProducts stocked with freshness 4.57Availability of products in desired pack sizes 3.96Availability of variety of brands and products 4.01Store image 3.73
Factor 6: Value added facilities 3.71 V
Free home delivery 3.75Credit availability 3.66
Factor 7: Store relationship 3.64 VI
Prompt & efficient staff 3.69Relationship 3.58
Table 7: ANOVA Results for Shoppers'age Groups and Factors Preference
Factors /Age 20-29 30-39 40-49 50 and above F-Value
Mean
Smooth transaction & exchange 4.05 3.92 3.61 3.52 5.95*
Convenience & Comfort 4.03 3.72 3.59 3.89 5.27*
Ambience 3.91 3.84 3.77 3.84 0.18
Attractive Promotions 3.93 3.63 3.45 3.45 5.26
Merchandise mix 4.34 4.10 4.10 3.67 9.62*
Value added facilities 4.05 3.62 3.65 3.64 3.76
Store relationship 3.60 3.62 3.72 3.58 1.41
Note: *significant at 5 % level
G. Somasekhar, M. Suresh Babu, Shaik Saleem and R. Madhu

IMJ 11
Volume 7 Issue 2 July - December 2015
Table 8 : ANOVA Results for Shoppers' GenderGroups and Factors Preference
Factors /Gender Male Female F-Value
Mean
Smooth transaction &exchange 3.69 4.02 17.75*
Convenience & Comfort 3.71 3.91 5.08
Ambience 3.69 4.07 18.15
Attractive Promotions 3.50 3.82 2.20
Merchandise mix 4.00 4.16 1.33
Value added facilities 3.59 3.90 8.96
Store relationship 3.52 3.82 0.92
Note: *significant at 5 % level
Table 9 : ANOVA Results for Shoppers' Income Groups and Factors Preference
Factors /Income >10,000 10,001 to 20,001 to 30,001 to >40,000 F-Value
20, 000 30,000 40,000
Mean
Smooth transaction & exchange 3.32 3.90 3.88 3.74 4.10 11.13*
Convenience & Comfort 3.45 3.63 3.89 3.78 4.27 7.95*
Ambience 3.46 3.82 3.81 3.89 4.35 5.15
Attractive Promotions 3.63 3.52 3.71 3.66 3.60 0.32
Merchandise mix 3.68 4.20 4.08 4.10 4.03 11.02*
Value added facilities 3.56 3.66 3.71 3.78 3.87 3.05
Store relationship 3.93 3.73 3.40 3.70 3.69 1.49
Note: *significant at 5 % level
Table 10 : ANOVA Results for Shoppers' Qualification Groups and Factors Preference
Factors /Qualification SSC Intermediate UG PG F-Value
Mean
Smooth transaction & exchange 3.56 3.11 4.17 3.88 9.38*
Convenience & Comfort 3.47 3.69 3.84 3.84 1.82
Ambience 4.10 4.28 3.92 3.74 2.17
Attractive Promotions 3.56 3.57 3.85 3.60 0.26
Merchandise mix 4.13 3.89 3.90 4.10 1.28
Value added facilities 4.22 3.37 4.03 3.61 19.71*
Store relationship 3.42 3.96 3.75 3.62 6.19
Note: *significant at 5 % level’
G. Somasekhar, M. Suresh Babu, Shaik Saleem and R. Madhu

IMJ 12
Volume 7 Issue 2 July - December 2015
Table 11: ANOVA Results for Shoppers' Occupational Groups and Factors Preference
Factors /Occupation Student Housewife Business Service Self employed F-Value
Mean
Smooth transaction & exchange 4.01 3.83 4.26 3.79 3.95 1.20
Convenience & Comfort 4.02 3.83 4.10 3.77 3.75 1.35
Ambience 3.06 4.27 4.83 3.78 3.65 2.20
Attractive Promotions 3.11 4.01 4.52 3.51 3.88 2.52
Merchandise mix 3.79 4.11 4.76 4.04 4.10 8.30*
Value added facilities 3.92 4.51 3.83 3.63 3.21 4.90
Store relationship 3.97 3.99 3.90 3.56 3.69 0.93
Note: *significant at 5 % level
References
Agarwal, P. &Tyagi, E. (2011). Foreign direct investment inIndian retail sector- An analysis. RetrievedJuly, 28, 2012fromhttp://www.legalindia.in/foreign-direct-investment-in-indian-retail-sector-%E2%80%93-an-analysis.
Amit, R., & Schoemaker, P. (1993). Strategic assets andorganizational rent. Strategic Management Journal, 14(1), 33-46.
Arnold, S., Handelman, J., & Tigert. (1998). The impact ofa market spoiler on consumer preference structures.Journal of Retailing and Consumer Services, 5 (1), 1-13.
Barney, J. (1991). Firm resources and sustained competitiveadvantage. Journal of Management, 17 (1), 99-120.
Bharadwaj, S.G., Varadarajan, P.R., & Fahy, J. (1993).Sustainable competitive advantage in service industries:A conceptual model and research propositions. Journalof Marketing, 57, 83-99.
Prahalad, C. K., & Hamel, G. (1991). The core competenceof the corporation, in the state of strategy. Boston:Harvard Business School Press.
Chattopadhyay, A., Dholakia, N., & Dholakia, R. R. (2010).Standing up to goliaths: How small traditional storesinfluence brand choices in India. Working Paper 7.College of Business Administration, Kingston.Retrievedfromwww.cba.uri.edu/research/workingpapers/documents/2011/WP7_2011.pdf.
Cronbach, L.J. (1951). Coefficient alpha and the internalstructure of tests. Psychometrika, 16(3), 297-334.
Kosol, D. (2003). Creating business competitiveness. Bangkok:Expernet.
Day, G. S. (1988). Assessing advantage: A framework fordiagnosing competitive superiority. Journal of Marketing,52(2), 1-20.
Dyer, J.H., & Singh, H., (1998). The relational view:Cooperative strategy and sources of inter-organizationalcompetitive advantage. Academy of ManagementReview, 23 (4), 660-697.
Fernie, J. (1995). The coming of the fourth wave: New formsof retail out-of-town development. International Journalof Retail and Distribution Management, 23 (1), 4-11.
Forbes.(2015). From dabbawallas to kirana stores, five uniqueE-Commerce delivery innovations in India.Retrieved fromhttp://www.forbes.com/sites/saritharai/2015/04/15/from-dabbawallas-to-kirana-stores-five-unique-ecommerce-delivery-innovations-inindia.
Freepress (2015). Lessons from local self sustained retailer.Retrieved from http://www.freepressjournal.in/lessons-from-local-self-sustained-retailers.
Fulmer, R.M., Gibbs, P., & Keys, B.J. (1998). The secondgeneration learning organizations: New tools forsustaining competitive advantage. OrganizationalDynamics, 2(27), 7-20.
Goswami, P., & Mishra, M. (2008). Would Indian consumersmove from kirana stores to organised retailers whenshopping for groceries. Asia Pacific Journal of Marketing,21(1), 127-143.
Greenley, G.E., & Shipley, D. (1995). Problems confrontingUK retailing organisations. In: Akehurst, G., Alexander,N. (Eds.), Retailing Marketing. London: Frank Cass.
Gupta, U., &Tandon, V. K. (2013). Changing consumerpreferences from unorganised retailing towards organisedretailing: A Study in Jammu. Journal of EmergingKnowledge on Emerging Markets, 4 (1),10.
Hansen, G.S., & Wernerfelt, B. (1989). Determinants of firmperformance: The relative importanceof economic andorganizational factors. Strategic Management Journal, 10(5), 399-411.
G. Somasekhar, M. Suresh Babu, Shaik Saleem and R. Madhu

IMJ 13
Volume 7 Issue 2 July - December 2015
Hawes, J.M., & Crittenden, W.F. (1984). A taxonomy ofcompetitive retailing strategies. Strategic ManagementJournal, 5(3), 275-287.
Hooley, G., MoKller, K., & Broderick, A. (1998). Competitivepositioning and the resource-basedview of the firm.Journal of Strategic Marketing, 6, 97-115.
Howe, S. (1992). Retailing Management. London: MacMillan.
Kotler, P.,& Keller, K. L. (2009). Marketing management (13ed). New Jersey: Pearson Education International.
Lawrence, J. R., Derek, A. N., Neil, H. B., & Farris, P .W.(1989). Decision in Marketing (2nd ed). Boston, USA.
Lado, A. A., Boyd, N. G., & Wright, P. (1992). A competency-based model of sustainable competitive advantage:Toward a conceptual integration. Journal ofManagement, 18 (1),77-91.
Lado, A.A., Wilson, M.C., 1994. Human resource systemsand sustained competitive advantage: A competence-based perspective. Academy of Management Review, 19(4), 699-727.
McGahan, A., & Porter, M., (1997). How much does industrymatter really? Strategic Management Journal, 18, 5-14.
Mishra M., & Dash, U. (2008). Importance of retail serviceattributes: A study on Indian consumers, ICFAI Journalof Management Research, 7 (2), 7-20
Wrigely, N., & Lowe, M. (2002). Reading retail: A geographicalperspective on retail and consumption spaces, London:Routledge.
Nunnally, C. (1978). Psycometric Theory, New York: McGraw-Hill.
Oppewal, H., & Timmermans, H. (1997). Retailer self-perceived store image and competitive position. TheInternational Review of Retail Distribution and ConsumerResearch, 7 (1), 41-59.
Othman & Owen. (2001). Adopting and measuring customerService Quality (SQ) in Islamic banks: A case study inKuwait finance house. International Journal of IslamicFinancial Services, 3(1), 1-26.
Porter, M. (1990). Competition and economic development.Retrieved from http://www.isc.hbs.edu/econ-natlcomp.html.
Porter, M. (1992). Competitive Strategy (1st ed.). New York:The Free Press.
Ramakrishna, K. (2010). The competitive response of small,independent retailers to organised retail: Study in anemerging economy. Journal of Retailing and ConsumerServices, 17(4), 251-258.
Rumelt, R. (1991). How much does industry matter? StrategicManagement Journal, 12(3), 167-185.
Shah, A. D. (2009). A study of consumer behaviour in mallsvis-a-vis Mom & Pop stores. Doctoral Dissertation,Saurashtra University, Rajkot, Gujrat.
Shaw., Rawson & Blair. (1992). Imported foods in British supermarket chain: Buyer decision in a safe way. InternationalReview of Retail Distribution and Consumer Research,2(1), 35-37.
Sinha, P K., & Banerjee, A. (2004). Store choice behaviorin an evolving market. InternationalJournal of Retail &Distribution Management, 32(10), 482-494.
South, S. E. (1980). Competitive advantage: The corner ofstrategic thinking. The Journal of Business Strategy, 1(4),15-25.
Swinyard, W.R. (1997). Retailing trends in the USA:Competition, consumers, technology and the economy.International Journal of Retail and DistributionManagement, 25(8), 244-255.
G Somasekhar earned his MBA and Ph.D from SVU,Tirupati and is associated with AITS,Tirupati. Hisprofessional interests include Retail Management andStrategic Management.
M Suresh Babu earned his M.Com, MBA and Ph.D fromSVU, Tirupati and is associated with SVU, Tirupati. Hisprofessional interest includes Investment & PortfolioManagement.
Shaik Saleem earned his M.Com and MBA from SVU,Tirupati and is associated with SVU, Tirupati. Hisprofessional interest includes Portfolio Management.
R Madhu earned his MBA from SVU, Tirupati and isassociated with AITS, Tirupati. His professional interestincludes Logistics Management.
G. Somasekhar, M. Suresh Babu, Shaik Saleem and R. Madhu

IMJ 14
Volume 7 Issue 2 July - December 2015
Abstract
With the increasing emphasis on branding, employeesas well as customers have become brand conscious. Thisstudy seeks to check the influence of employer brandingon employees' attitude. This is an empirical study. Datawere collected from 140 employees of private bankingorganizations. Secondary data that has been taken fromjournals, articles, reports and web sites, is also used forthe study. This study identifies important determinantsof employer brand. It also highlights the perceived levelof importance of various dimensions of branding onemployees' attitude. The finding of the study mighthelp management practitioners to make effectivestrategies and foster a healthy relationship between theemployer and the employees.
Keywords: Employer brand, Employees' attitude,Employer branding strategy.
1. Introduction
Initially, branding was used to differentiate productsbut now a days it is used to differentiate people, aspeople associate themselves with different brands (likei- phone user or apple user). Brand may be any term,name, logo, sign, design or a combination of all thesethat differentiates a product from competitors (Kotler& Keller, 2007). The use of branding principles in humanresources (HR) is known as employer branding(Backhaus &Tikoo, 2004). Just as customers are attractedtowards branded products, today's talent are also wantsto work for a reputed or branded organization. Theconcept of employer branding is new in human resourcemanagement and came in focus in 1990 when Tim Amblerand Simon Barrow introduced the term. Later it waspublicly defined by them in 1996 in their paper 'TheEmployer Brand'. Employer brand is defined as "thepackage of social, psychological and functional benefitsprovided by the employment and identified with in theemploying company"(Ambler & Barrow, 1996).
Impact of Employer Branding onEmployees' AttitudeVijay Rathee and Ritu
There is a war for talent (Michaels et al., 2001) andorganizations are facing the problem of attractingsuitable talent and sustaining the talent. This challengefaced forced organizations to work for transformingtheir organization as an employer brand i.e., an attractiveand desirable place for employees to work (Backhaus& Tikoo, 2004). Employer branding is the communicationof employee value proposition that is, offering by theemployer to employees in tangible and non-tangibleforms. An effective employee value proposition canincrease commitment up to 29 percent and decreasecompensation premium up to 50 percent (CorporateLeadership Council, 2006).
Externally, employer branding helps to attract potentialhires and internally it is used to retain employees,increasing productivity, motivating employees, andincreasing loyalty of employees (Backhaus & Tikoo,2004). Studies have shown that employees want to workfor an organization that provides them good workingconditions, development facilities, cooperative workenvironment and the ambience to use their skills (NigelWright Recruitment Survey, 2011). Now organizationsare striving to establish themselves as employer brands.In India 24 percent organizations have well definedemployer brand strategies and 26 percent are workingon it (TJinsite survey, 2012).
2. Review of Literature and Hypothesis Development
Ambler and Barrow (1996) tested the relevance of theterm branding in human resource management. Theystated that if brand marketing and human resourcemanagement come in a single framework then closerelations would develop between employees and theorganization. This will create loyalty and trust in theorganization. Backhaus and Tikoo (2004) conceptualizedand researched the concept of employer brand andstated that employer brand projects the organization asan attractive employer for potential hires and influencesthe loyalty and productivity of existing employees.
Vijay Rathee and Ritu

IMJ 15
Volume 7 Issue 2 July - December 2015
Edwards (2010) found that when there is a strongperception of employees towards an employer imageand identity, it creates higher levels of employeecommitment and identification. It also results in higherlevel of talent attraction. Sokro, (2012) stated thatemployer branding is positively related to attractionand retention of employees. Good working conditions,career development, core values of the organization areforemost reasons for talent attraction whereasopportunity for growth, job security, company imageare significant reasons for retention of employees.
Berthon et al. (2005) developed a scale to measureemployer attractiveness for potential hires. Theyidentified five main dimensions namely, economic,social, developmental, application and interest value,that makes an employer attractive or otherwise. Jiangand Paul Iles (2011) found that employer brandingdeterminants such as, economic, developmental, social,interest and brand trust, create internal and externalemployee based brand equity and organizationalattractiveness. Schlager et al. (2011) empirically testedthe impact of employer branding on employees' attitude,especially in the service industry. They identifiedeconomic value, developmental value, social value,diversity and reputation value as the main employerbrand dimensions. These dimensions show a positiveimpact on employees' satisfaction and identification.Nigel Wright Recruitment and researchers from DurhamUniversity Business School conducted a survey (2011)among potential employees in Europe on employerbranding and found that social value, economic valueand developmental value have maximum influence onthe decision of employees to join any organization.Sivertzen et al. (2013) used the employer attractivenessscale (empAT) in Norway and found that economic,developmental, social, interest and application valuesproved important for potential employees. Corporatereputation is also considered as an important dimensionfor employer attractiveness. Researchers (Cable &Graham, 2000; Cable & Turban, 2001) concluded thatreputation of the employer influences the job seekers'intention to apply for a job. Celani and Singh (2011),while discussing the central role of signaling theory inrecruitment, identified that employers with more or
higher reputation will attract more and better qualitypotential talent.
2.1. Employer Branding Dimensions
Collins and Stevens (2002) concluded that employees'intention to apply for a job depended upon two maindimensions of the employer - general attitude towardsthe company and perceived job attributes. This studyincluded three main dimensions: Economic value,developmental value, social value of the EmpAT scale(Berthon et al., 2005), and one additional dimensioni.e., corporate reputation value (Schlager et al., 2011)since literature signaled that it is important for studyingemployer brand influence on employees' attitude.
2.1.1. Economic Value: Ambler and Barrow (1996) foundthat employer brand also provides benefits like productband in developmental, economic and psychologicalforms. So, the first dimension taken for the study iseconomic value that is given by Berthon, Ewing andHah (2005) in the EmpAt scale. Economic value meansthe benefits provided by the employer, in monetary andnon-monetary forms, to the employees. It includes goodsalary, retirement benefits, attractive compensationpackage, good promotion opportunities etc. Sanchezand Brock, (1996) identified that salary is related to jobsatisfaction and commitment of employees. Higher thesalary, higher the satisfaction level of employees.Schlager et al. (2011) also proved that economic benefitslike good salary, good retirement benefits, fair amountof vacation, good health benefits and high job securityhave a significant relationship with employees'satisfaction. Weathington, (2008) found that employeesgave importance to both monetary and non monetarybenefits. Non monetary benefits like retirement benefits,medical benefits etc. have significant influence onemployees' perception of a job
Based on the above discussions, the followinghypotheses were framed:
H1: There is a significant relationship between economicvalue and employees' attitude.
2.1.2. Developmental Value: The second dimensiontaken for the study is developmental value. Researchers( Berthon et al., 2005; Schlager et al., 2011) stated that
Vijay Rathee and Ritu

IMJ 16
Volume 7 Issue 2 July - December 2015
developmental value constitutes access to careerenhancing activities, spring board for futureemployment, recognition for good work, trainingopportunities, mentoring culture, empoweringenvironment etc. These variables influence employerimage and have relationship with talent attraction andemployees' satisfaction. Tansky and Cohen (2001)investigated the positive influence of developmentalprograms on employee commitment and satisfaction.Lee (1971) studied employees' perception regardingcurrent and future growth and performance reward,and highlighted their positive relationship withorganizational commitment of employees. Saari andJudge, (2004) identified that the career developmentchances in an organization have significant influenceon employee attitude. According to Douglas McGregor,employees who belong to generation Y are more careerdirected and want to be a part of the organization thatprovides them career growth opportunities,empowerment, creative work culture etc.
Thus, we propose the following hypothesis:
H2: There is a significant relationship betweendevelopment value and employees' attitude.
2.1.3. Social Value: The third dimension taken for thestudy is social value. Berthon et al. (2005) stated thathaving good relationship with superiors and colleagues,supportive and happy work environment, respectfulenvironment etc. have influence on employerattractiveness. Schlager et al. (2011) show a positiverelationship with employees' attitude to increase insatisfaction and identification. Saari and Judge (2004)stated that behavior ofsuperiors and colleagues, workculture in the organization have influence on employees'attitude,leading to satisfaction or dissatisfaction.Bhatnagar and Srivastava, (2008) concluded that thefeel good factors at the organization, friendly workculture, helpful superior etc. should be communicatedto the prospective hires to attract them. Backhaus andTikoo, (2004) pointed out that potential employeesbecame part of any organization on the basis of thesocial value of the company. They want to join theorganization that will provide them social approval ifthey work for it.
Thus, we propose the following hypothesis:
H3: There is a significant relationship betweenemployees' attitude and social value.
2.1.4. Corporate Reputation: The fourth and finaldimension for the study is reputation value. Studies(Cable & Graham, 2000; Cable & Turban, 2001) havedefined it as job seekers' beliefs about how other peopleevaluate an employer. Reputation of the employerinfluences job seekers' intention to apply for a job.Employer with better reputation will be more attractivefor potential talent. Schlager et al. (2011) also researchedthat reputation value like good quality products, wellknown products, innovative products, good reputationof company amongst friends, good brand to have onthe resume, influence employees' attitude and theirsatisfaction level in the organization. Salam et al. (2013)checked the influence of corporate image and reputationon customer satisfaction and loyalty, and found thatthere is a positive relationship between corporatereputation, image and customer satisfaction and loyalty.It can be expected that similar relationship exists betweencorporate reputation and employees' satisfaction in anorganization. Marty Stuebs and Li Sun (2010) stated thatcorporate reputation has a positive influence on laborefficiency and productivity. Higher the reputation ofthe organization, the higher will be labor efficiency andproductivity. Also, Archer and Bussy (2006) stated thatnegative publicity of an organization will adverselyimpact the employer brand of the organization and itsability to attract potential talent.
Following hypothesis was developed from the review:
H4: There is a relationship between reputation valueof an organization and employees' attitude.
3. Research Methodology
3.1. Research Design
This study based on both empirical and theoreticalinvestigation.
A sample of 150 employees was taken for the studydrawn from three leading private sector banks. Banksconsidered for the study are ICICI bank, HDFC Bankand Axis Bank since these banks have maximumemployee strength and branches in NCR. HDFC Bank
Vijay Rathee and Ritu

IMJ 17
Volume 7 Issue 2 July - December 2015
had 76,286 employees in March 2015 whereas ICICI had67,857 employees in 2015. Axis Bank being the thirdlargest privatebank, had 42,230 employees in March2015. Further the decision of considering private banks,and not government-owned banks, emanates from theobservation that private sector banks engage in brandingactivities; also, data collection and availability ofemployees is better compared to public sector banks.Another important reason is the availability of branchesin most areas of the National Capital Region (N.C.R).Outof total 150 distributed questionnaires, 140 responseswere received back. Thus, the average response rate is93.33 percent.
Data was collected from both primary and secondarysources. Questionnaires and personal interviews wereused for data collection. Questionnaire contains 20questions related to employer branding dimensionsnamely, economic, social, developmental and corporatereputation. The questionnaire is based on the 5 pointLikert scale and personal interviews. Along with primarysource data collection, secondary sources like journals,books, websites and articles were also used for thestudy. For analyzing the data, descriptive statistics (meanand standard deviation) and t-test were used. Meanvalue of various factors and variables shows theimportance of each factor and variable for measuringemployees' attitude.
4. Analysis and Interpretation
Table 1 represents the different variables of employerbranding, grouped under four factors namely, economicvalue (F1), social value (F2), developmental value (F3)and reputation value (F4). Mean value and standarddeviation of various variables is shown in Table 1. Meanvalue shows the significance of the variable and standarddeviation shows the consistency or variability ofresponses. Retirement benefits have highest mean score( = 2.21) and standard deviation (=1.021). This depictsretirement benefits as the strongest influencing variablein economic value but with high variability, whereasjob security has the lowest mean value ( =1.72)representing that this aspect has least contributiontowards satisfaction derived by the employees in F1.In the social value factor (F2), social meetings organized
by employer have highest mean value ( =1.89) followedby social status enjoyed by the employee because ofemployer brand ( =1.79). Under developmental value,spring board for future has highest mean value ( =1.88) with standard deviation (= 0.744). This impliesthat it is the strongest influencing variable in F3 to retainemployees within the organization. Training anddevelopmental programs have least mean value ( =1.61) with standard deviation 0.765. On the other hand,good reputation among friends and relatives is thelowest influencing variable of the reputation factorbecause of lowest mean score ( =1.50) with standarddeviation ( =0.617). So, it is proposed that this variableis not a strong decision influencer.
Table 2 represents the t-test results. In Table 2, "t"column represents the observed t statistic for each factor,calculated as the ratio of mean difference divided bythe standard error of the sample mean. The "df" columndisplays degree of freedom. The value listed is theprobability of obtaining an absolute value greater thanor equal to the observed t statistics, if the differencebetween the sample mean and test value is purelyrandom. From Table 2 it is found that all factors aresignificant at 95 percent level of significance. This depictsthat hypotheses H1, H2, H3 and H4 are accepted. Itmeans all the factors of employer branding i.e., economicvalue, social value, development value and reputationvalue, have significant influence on employees' attitudewhile rating the employer as an attractive employer.This result also reflects that the employees will be highlymotivated and will work to their full efficiencies if theabove said factors are reasonably present in theorganization. The final ranking of these factors can bedone by the mean score representations.
Table 3 depicts the mean value and standard deviationsof various factors of employer branding. Economicdimension (F1) mean ( =1.869) is highest, so it is thestrongest influencing factor on employees' attitudetowards the organization. Developmental value (F3) isthe second highest influencing factor with mean value( = 1.8114), followed by social value (F2) ( =1.7014)and reputation value (F4) ( = 1.6814). As Table 3 shows,reputation value have lowest mean value ( = 1.6814)
Vijay Rathee and Ritu

IMJ 18
Volume 7 Issue 2 July - December 2015
which shows that it is the lowest influencing factoramong all the four determinants of employer branding.On the other side, developmental value has highestvariation because it has highest standard deviation ()with value 0.583. Reputation value shows minimumvariability in responses and shows highest consistencybecause of lowest standard deviation () with value0.459.
All the factors of employer branding are significant buthave different levels of significance for employees. So,an employer should frame strategies for employees onthe basis of their importance.
5. Discussion
For increasing the satisfaction level of employees, thereare some strategies suggested to the managements onthe basis of the significance of crucial factors of employerbranding. Economic dimensions have maximumsignificance among all the dimensions of employerbranding. In economic dimension, retirement benefitshave highest mean score with highest standarddeviation. On the other side, compensation packageshave comparable mean score with less standarddeviation. So, it is suggested that managements shouldgive maximum importance to attractive compensationpackage followed by good retirement benefits. Attractivecompensation package may include attractive and timelysalary, proper incentives etc. Retirement benefits canbe given in the form of voluntary retirement scheme,onetime payment of providentfund, after retirementhealth benefits etc. It is the second most significantfactor of employer branding. Organizations should focuson providing novel work practices to employees toincrease their satisfaction level. Novel work practicesmay include openness to change in policy matters,creative tasks etc. An employer should frame strategiesfor the social environment of the organization by givingpriority to social meetings organized by the employer.Social meetings can be organized in the form of familygatherings at festivals or success parties of theorganization and inter-organizational parties. Get-togethers with close competitors or with best playersin the industry can also inculcate faith in employees.
Employees perceive this dimension as the leastsignificant but this dimension also has significance. Anorganization should promote itself as the best in thecategory to retain and motivate employees. The samecould be done by following ethical practices, especiallythrough quality products and services. Organizationscan promote themselves through corporate web sites,social media etc.
Conclusion
In this study, we examined the perceived importanceof various dimensions of employer branding byemployees, and its influence on their attitude towardsthe organizations. It is found that social, economical,development and reputation factors have significantinfluence on employees' attitude towards anorganization and they influence satisfaction, retentionand productivity within the organization. It is concludedthat economic factor is perceived by employees as thestrongest influencer and corporate reputation as theleast influencing factor, which affects their satisfactionlevel within the organization. This study helps employersto frame strategies for the betterment of employees onthe basis of employees' preference for crucial factors ofemployer branding, and simultaneously building itsown brand image and attainment of objectives veryeffectively, efficiently and in time. Employer brand actsas an inspirational tool for motivating and retainingemployees in the organization; retaining an employeeis much cheaper and a better alternate as compared toattracting newer talent, unless needed. This not onlyhelps in the growth of the organization but also inlowering attrition rate.
Employer branding is a very complex concept and therecould be many other dimensions to study the same.This paper has considered only limited dimensions tosee the impact on employee's attitude. Further,employees around the world and country in the bankingsystemare varied and this points to the geographicallimitation of the study. Not only as employees, butcultural background of the respondents also has aninfluence on the perception of employer branding.Paucity of time and funds is obviously a limiting factorof the study.
Vijay Rathee and Ritu

IMJ 19
Volume 7 Issue 2 July - December 2015
Table 1: Employer Brand Dimensions
S.No. Scale items Mean Std.value Deviation
F 1 Economic value
I believe that the compensation package offered by the 1.92 0.857employer attracts me.
I like to work at a place where timely and fair rewards are given. 1.72 0.750
I closely monitor the way periodic performance is 1.77 0.817evaluated by the organization.
Retirement benefits affect my performance and motivation 2.21 1.021at work place.
I prefer a secure job. 1.72 0.841
F 2 Social value
I believe in equality of respect and appreciationin an 1.56 0.526organization.
I enjoy working with an employer withhigh social status. 1.79 0.827
Regular social meetings organized by employer makes me happy. 1.89 0.832
The ease of work and timely help in problems motivates me. 1.69 0.787
The availability of facilities and cordial environment brings 1.58 0.612in satisfaction.
F 3 Developmental value
Regular training and developmental programs give an 1.61 0.765add-on to the career.
Novel HR work practices boost my performance. 1.90 0.807
I enjoy power and responsibilities at workplace. 1.81 0.735
The employer should provide equal opportunities for growth. 1.86 0.801
The employer brand should act as a spring board in my 1.88 0.744future endeavor.
F 4 Reputation value
I believe organizations are what they represent themselves 1.53 0.555as to the potential hires.
When my friends and relatives compliment me because of 1.50 0.617my company, I feel proud.
Brand image of the existing employer gives a cutting edge 1.68 0.649in future jobs.
How the people (employees/ society) feel about the reputation(good/bad) motivates or de-motivates me to be more/less productive. 1.84 0.755
How I feel about the brand image (best/good/average/poor)influences my decision onlongetivity of services to the organization. 1.86 0.923
Source: Primary Data; 1= strongly agree, 2= agree, 3= neutral, 4= disagree, 5= strongly disagree.
Vijay Rathee and Ritu

IMJ 20
Volume 7 Issue 2 July - December 2015
References
Ambler, T. and Barrow S. (1996). The employer brand.The Journal of Brand Management, 4(3), 185-206
Archer, C. and Bussy, N. (2006). The role of corporatereputation versus relationships in building employerbrand equity: The case of a Major Private Hospital,ANZMAC 2006 Advancing theory, MaintainingRelevance. Sage.
Backhaus,K. and Tikoo, S.(2004). Conceptualizing andresearching employer branding. Career DevelopmentInternational, 9(5), 501-517
Berthon, P., Ewing, M. and Hah, L.(2005). Captivatingcompany: Dimensions of attractiveness in employerbranding. International Journal of Advertising, 24(2),151-172
Bhatnagar, J. and Srivastava, P. (2008). Strategy forstaffing: Employer branding & person organizationfit. Indian Journal of Industrial Relation, 44(1), 35-48.
Cable, D.M. and Graham, M.E. (2000). Determinants ofjob seekers reputation perceptions. Journal of Orga-nizational Behavior, 21(8), 929-947
Table 3: Analysis on the Basis of Mean Score of Crucial Factors of Employer Branding
One-Sample Statistics
Factors N Mean Std. Std. ErrorDeviation
F1 Economic value 140 1.8686 .56148 .04745
F2 Social value 140 1.7014 .45927 .03882
F3 Developmental value 140 1.8114 .58261 .04924
F4 Reputation value 140 1.6814 .49626 .04194Source: Primary Data; 1= strongly agree, 2= agree, 3= neutral, 4= disagree, 5= strongly disagree.
Cable, D.M. and Turban, D.B. (2001). Establishing thedimensions, source, and value of job seekers' em-ployer knowledge during recruitment process. Re-search in Personnel and Human Resource Management,20, 115-163
Celani, A., & Singh, P. (2011). Signaling theory andapplicant attraction outcomes. Personnel Review, 40(2),222-238.
Collins, C.J. and Stevens, C.K. (2002). The relationshipbetween early recruitment- related activities and theapplication decision of new labor- market entrants:A brand equity approach to recruitment. Journal ofApplied Psychology, 87(6), 1121-1133
Edwards, M. R. (2010). An integrative review of employerbranding and OB theory. Personnel Review, 39(1), 5-23
Jiang,T.T. and Iles, P. (2011). Employer brand equity,organizational attractiveness and talent managementin the Zhejiang private sector, China. Journal ofTechnology Management in China, 6(1), 97-110
Vijay Rathee and Ritu
Table 2: Analysis of Employer Branding Factors on the Basis of T-Test
One-Sample Test
t df Sig. Mean(2-tailed) Difference
F1 Economic value 39.376 139 .000 1.869
F2 Social value 43.833 139 .000 1.701
F3 Developmental value 36.788 139 .000 1.811
F4 Reputation value 40.090 139 .000 1.681
Source: Primary Data; 1= strongly agree, 2= agree, 3= neutral, 4= disagree, 5= strongly disagree.

IMJ 21
Volume 7 Issue 2 July - December 2015
Lee, S.M.(1971). An empirical analysis of organizationalidentification. The Academy of Management Journal,14(2), 213-226.
Salam, Shawky and Nahas. (2013). The impact of cor-porate image and reputation on service quality,customer satisfaction and customer loyalty: Testingthe mediating role. Case analysis in an internationalcompany, The Business and Management Review, 3(2),177-196
Sanchez, J.I. and Brock, P.(1996). Outcomes of perceiveddiscrimination among Hispanic employees: Is diver-sity management a luxury or a necessity?. Academyof Management Journal, 39(3), 704-719.
Sarri,L.M. and Judge, T.A.(2004). Employee attitude andjob satisfaction. Human Resource Management, 43(4),395-407.
Schlager et.al. (2011). The influence of the employerbrand on employee attitudes relevant for servicebranding: an empirical investigation. Journal of ServiceMarketing, 25(7), 497-508.
Sivertzen, A.M., Ragnhild, E. and Olafsen, H.(2013).Employer branding: Employer attractiveness and theuse of social media. Journal of Product and BrandManagement, 22/7, 473-483
Sokro, Evans (2012). Impact of employer branding onemployees attraction and retention. European Journalof Business and Management, 4(18), 164-173
Stuebs, M. and Sun, Li (2010). Business reputation andlabor efficiency, productivity, and cost. Journal ofBusiness Ethics, 96(2), 265-283
Tansky, J.W. and Cohen, D.J. (2001). The relationshipbetween organizational commitment support, em-ployee development and organizational commitment:An empirical study. Human Resource DevelopmentQuarterly, 12(3), 285-300
Weathington, B.L. (2008). Income level and the value ofnon wage employee benefits. Employee Responsibilitiesand Rights Journals, 20(4), 291-300.
Books
Kothari, C.R. (2008). Research methodology methods andtechniques, New Age International publishers, 184-229
Kotler, P. and Keller, K.L. (2007). Marketing Management12e, Prentice Hall of India Private Ltd, 12th edition.272-341
Michealset. al.(2001). The War for Talent, Harvard Busi-ness Press
Robbins, S. and Sanghi, S. (2005). Organizational Behav-ior", Pearson Edition. 11th. 165
Web sites:
Corporate Leadership Council Survey (2006).https://clc.executiveboard.com/ Public/ PDF/ Attracting_and_Retaining_Critical_Talent_Segments_Exec_Summ.pdf.Accessed on April 23, 2014
Earnings Presentations - Half year results for FY 2013-14 . Axis Bank. 17 October 2013. Accessed on January26, 2014.
HDFC Bank Director's Speech. http://www.sharekhan.com/stock-market/company-de-tails/company-profile/Speeches/HDFC-Bank-Ltd/14030055.00/HDFCBANK/Directors-Speech.htm.Accessed on March 22, 2014.
http://www.thehindubusinessline.com/industry-and-economy/banking/icici-banks-employeebase-fell-4400-last-fiscal/article7211079.ece. Accessed onApril 10, 2016
Nigel Wright recruitment employer brandingsurveyhttp://no.nigelwright.com/Assets/ Docu-ments/Arbeidsgiver Branding Rapport.pdf?1341494343. Accessed on March 28, 2014
TJinsite (2012). Building and maintaining employerbranding survey. http://content.timesjobs.com/tjinsite/?p=5975. Accessed on March 30, 2014
Vijay Rathee, Assistant Professor (MBA), is working atUniversity Institute of Law and Management Studies since2007. He is the main author and is continuouslycontributing to national and international community bypublications in reputed journal like journal of IIM Shilongand by holding workshops on research methodology etc.his mail id is :[email protected] and he could becontacted on 09818686186.
Ritu, is a research scholar and is persuing her Ph.D.
Vijay Rathee and Ritu

IMJ 22
Volume 7 Issue 2 July - December 2015
Abstract
Market-oriented service firms are becoming morecreative and innovative in their pursuit of deliveringsuperior customer value. Though the impact ofinnovative practices on a firm's performance issufficiently acclaimed by previous studies, there stillremains a void with respect to the distinctive impactof the dimensions of market orientation on types ofservice innovation, especially in the context of emergingeconomies such as India. The present study addressesthis gap by examining firms in four select service sectorsfor their role and impact on the type of innovation andorganisation performance. Using survey method,primary data was collected from 353 managers andstatistical techniques such as Confirmatory FactorAnalysis (CFA) and Structural Equation Modeling(SEM)were used for analysing the hypothesizedrelationships of the research model. The results revealedthat only customer orientation exertsa strong andpositive influence on incremental and radical innovation.Service innovation is also found to be strongly associatedwith organisation performance. The findings furthersuggested that service innovation mustperform amediating role in the relationship between marketorientation and organisation performance. The studydraws useful implications for market-oriented servicefirms and outlines the scope for future research in thispertinent domain.
Key Words: Market orientation, Incremental serviceinnovation, Radical service innovation, Organisationperformance
1. Introduction
With the impressive growth of the service sector in ahighly competitive market era, the demands of service
Market Orientation and Service Innovation:Examining the Linkages to OrganisationPerformanceGarima Gupta and Sanjeewani Sehgal
management are increasing significantly (Bates et al.,2003; Camison, 1996; Yavas et al., 1997). Service firmsare becoming market oriented in their pursuit to createand deliver superior customer value. This requirescreative ideas and continuous innovation for long termcustomer retention and sustenance in the market place.For firms and economies which function in anenvironment of intense competition, slow growth anddecreased spending, more apprehensive innovativeapproaches may be needed. It is therefore not surprisingthat service innovation is regarded as a criticalcomponent for the economic viability of firms. It is alsoa key driver for the long term success and competitiveadvantage ofnations (Baker & Sinkula, 2002). In anemerging country like India too, innovation is one ofthe significant parameters for growth and developmentin the service sector.
As such, innovative practices have become a centralmeans for gaining competitive advantage, enablingcompanies to provide distinctive services. The degreeof innovativeness further reflects the firm's knowledgeand its capability to increase organizational performancethrough application of new methods and processes. Theprocess of turning opportunity into new ideas and theirimplementation not only provides customers withdifferent options to satisfy their needs on a sustainablebasis, but also becomes an effective way ofincreasingthe firm's financial and non-financial performance.
Though the concept of innovation in services has gainedimportance, empirical research with a market orientedperspective still remains an under-researchedarea(Grawe et al., 2009). The contribution of marketorientation to new services and its impact on firm'sperformance empirically is equivocal (Manzano et al.,2005; Zhou et al., 2005). But a component-wise analysis
Garima Gupta and Sanjeewani Sehgal

IMJ 23
Volume 7 Issue 2 July - December 2015
of market orientation in relation to its impact on typesof service innovation and organisation performance ismajorly lacking (Cheng & Krumwiede, 2012). Further,majority of the innovation studies have been conductedfor products and that too in the context of developednations (Alam, 2007; Alam, 2006; Storey & Easingwood,1999). The present study addresses this gap in existingliterature by examining market oriented service firmsof four select service sectors i.e., Hospitality, Healthcare,IT and Banking services, for their role and impact ontypes of innovation and organisation performance inthe context of an emerging economy like India.
2. Objectives of the Study
As suggested by previous studies, the present studyconducts a dimension-wise analysis related to threeprimary constructs namely, market orientation, serviceinnovation and organisation performance. Thehypotheses formulated are subsequently tested todetermine a deeper understanding of the linkagesbetween each of these constructs. More specifically, theobjectives of the study can be outlined as follows:
• To examine the independent effect of two dimensionsof market orientation (i.e. customer orientation andcompetitor orientation) on two dimensions of serviceinnovation i.e. incremental innovation and radicalinnovation, for firms in four select service sectors.
• To assess the independent effect of two dimensionsof market orientation on two components oforganisation performance i.e., financial and non-financial performance.
• To investigate the mediating role of service innova-tion in impacting the relationship between the dimen-sions of market orientation and the dimensions oforganisation performance.
3. Conceptual Framework and Formulation ofHypotheses
3.1 Market Orientation and Service innovation:Components and Linkages
Market orientation, defined as an organisation'sresponsiveness towards consumer needs and tastes,necessitates intelligence about the market, customers
and competitors and thus is considered as an importantcomponent of organisational culture (Baker & Sinkula1999; Lonial et al., 2008; Narver & Slater, 1990). Existingliterature has dominantly conceptualized marketorientation as being composed of three interactivedimensions: Customer orientation, competitororientation and inter-functional orientation. However,due to lack of presence of inter-functional orientationin actual practice, the present work has confined itselfto the examination of the remaining two dimensions fortheir distinct relationship with innovation practices.According to Narver & Slater (1990), the dimension ofcustomer orientation can be understood as a collectionof knowledge and intelligence about customers in orderto satisfy their needs and desires. The continuous changein needs and preferences of the customers requiresfirms to pay special attention to creation or developmentof new ideas which bring new opportunities and superiorvalue for target customers (Joshi & Sharma, 2004;Nasution et al., 2011). Competitor orientation, on theother hand, is understood as a firm's ability to identify,analyse and respond to competitors' actions (Kohli &Jaworski, 1990). This allows firms to deliver serviceswhich are distinct from those of its competitors, therebyconfirming the role of competitor's strategy as anothersource of innovation in the form of differentiation (Hanet al., 1998).
Services marketing literature conceives serviceinnovation as the development of new service offeringsand concepts, including how to generate new ideas forservice offerings and develop customer-oriented options(Nijssen et al., 2005; Olsen & Sallis, 2006). Later, it wasregarded as the set of innovations in service processesi.e., service-logic innovation for the existing serviceproducts of an organization (Gadrey et al., 1995). Thevaried classifications of service innovation suggestedby past studies are breakthrough innovation, continuousand discontinuous innovation, exploratory andexploitative innovation, and incremental and radicalinnovations (Chan et al., 1998; Jansen et al., 2006).Thetypology of incremental and radical innovation isconsidered important (Cheng & Krumwiede, 2012).While incremental innovations connotes minor
Garima Gupta and Sanjeewani Sehgal

IMJ 24
Volume 7 Issue 2 July - December 2015
adaptations or improvements of an incremental naturethat are regularly made in modern business houses tocontinually improve their products or services (Garcia& Calantone, 2002; Griffin, 1997 ), radical innovationsare technologically new to the market as well as to theinnovating firm (Oerlemans et al., 2013) and brings inabrupt changes in technology usage and are based onunique knowledge sources.
Despite sufficient studies being conducted in the areaof marketing orientation and service innovation, effectiveresearch has not been conducted by marketingpractitioners so far for examining the relationshipbetween dimensions of market orientation and types ofinnovative service practices (Jaworski & Kohli, 1993).Some of the related studies examining the linkagesbetween these constructs too fail to provide a consensus.For instance, though studies show a positive effect ofmarket orientation on innovation (Athuahene-Gima,1995), there exists a parallel view which suggests thatcustomer orientation in the form of placing a greaterreliance by firms on customer feedback may have anegative impact on the degree of innovation (Christensenet al., 2005). Propagating this view, Christensen (1997)argues that many large organizations fail becauselistening to customers places stringent limits on thestrategies firms can and cannot pursue, resulting infailure of radical innovation. Similarly, though animitation of competitor's strategy is regarded as a logicalsource for bringing new services in so far as minimisationof cost and risk are involved, many scholars (Bennett& Cooper, 1981; Hayes & Abernathy, 1980) have arguedthat businesses following their competitors too closelycan make only small improvements in the existingservices and ignore radical changes. Further, Day&Wensley (1998) also stressed that focussing too muchon competitor's strategy may distract marketer'sattention towards changes in existing market segments,and reduces their capability to innovate radically.Against this background, the present study envisagesthe following hypotheses to test the dimension-wiserelationship between market orientation and serviceinnovation:
H1a: Customer orientation significantly relates to
incremental service innovation.
H1b: Customer orientation insignificantly relates toradical service innovation.
H2a: Competitor orientation significantly relates toincremental service innovation.
H2b: Competitor orientation insignificantly relates toradical service innovation.
3.2 Relationship of Market Orientation and ServiceInnovation with Organisation Performance
Previous studies have addressed the performance ofbusiness or service firms from varied perspectives suchas, financial performance, business unit performance,or organizational performance, (Venkatraman &Ramanujam, 1986), subsequently providing consensusto the view that a firm's innovation performance shouldbe considered broadly in terms of its financial and non-financial performance (Avlonitis et al. , 2001;Gounarisetal., 2003).Following this line, the presentstudy considers organisation performance to becomposed of two broad components: Financial and non-financial. Financial performance reflects the ability ofa firm to use its current assets for generating revenue.It includes parameters such as,increase in profitabilityof the company, more revenue generation, sales, costreduction, and expansion in market share (Avlontis etal., 2001; Menor et al., 2002). The non-financialcomponent, on the other hand, may be understood interms of enhanced customer loyalty, increase in newcustomer base, improved image and reputation of thefirm (Blazevic & Lievens, 2004; Lievens & Moenaert,2000).
A number of previous studies have regarded marketorientation as an essential factor for generatinginnovative service and improved organisationperformance (Dawes, 2000; Manzano et al., 2005; Songet al., 2009; Tsiotsou, 2010). A pioneering study byKohli&Jaworski (1990) argued that clarity of focus andfirm's vision are facilitated through market orientation.However, assessment across dimensions of marketorientation has provided mixed findings where studies(Chao et al., 2007; Deshpande & Farley, 1998) suggest
Garima Gupta and Sanjeewani Sehgal
IMJ 25
Volume 7 Issue 2 July - December 2015
customer orientation as an important aspect of marketorientation to business performance, but have foundcompetitor orientation to be detrimental to profitability(Sin et al., 2005).
In addition to market orientation, literature emphasisesthat service innovation, whether incremental or radical,also significantly contributes towards firm's financialand non-financial performance (Venkatraman &Vasudevan, 1986). Studies examining the relativeinfluence of innovation on a firm's financial success(Lievens & Moenaert, 2000; Thompson et al., 1985)showed that the process of new service developmentimproves quality of service, in-turn providing benefitsto the company in the form of increased profit, costsavings, increase in sales performance and expandingmarket. In relation to non-financial outcomes too,researchers have opined that adoption of serviceinnovation practices such as providing ease of buyingprocess and prioritising customer's needs result incustomer retention, value generation, and firm's superiorimage and reputation (Avlonitis et al., 2001).
Furthermore, some of the studies propound the directcontribution of market orientation on organisationperformance (Kumar et al., 1998; Langerak, 2003) whileothers suggest the mediating role of service innovationin impacting the relationship of a market oriented firmwith its overall performance. More specifically, a studyby Tsiotsou (2010) provides the strong view that marketorientation can not make a direct impact on firmperformance without service innovation. However,research on the direct or indirect relationship betweenmarket orientation and organisation performanceremains largely inconclusive. The hypothesesformulated on the basis of the aforesaid discussion canbe stated as follows:
H3: Market orientation (customer and competitor) signifi-cantly influences organisation performance.
H4: Service innovation (incremental and radical) signifi-cantly influences financial as well as non-financialorganisation performance.
H5: Service innovation mediates the relationship betweenmarket orientation and organisation performance.
4. Research Methodology
4.1 Selection of Sample
Adopting the questionnaire design, primary data forthe study were collected from key personnel of firms/companies in four service industries namely, hospitality;healthcare, information technology and bankingservices. These industries are generally engaged ininnovative activities and hence were found to be suitablefor the purpose of the present research. For instance,hospitals like Medanta have introduced new dedicatedtelemedicine centres across the country and all over theworld to deliver the best health-care facilities even inremote areas. The world class budgeting and planningsystem offered by one of the IT companies (TCS) enabledgovernment offices to process data fast. Lemon Treehotels provide new human resource practices such asemploying and training deaf and mute people in theorganisation. Banking sector is also moving ahead withits cost-effective financial and technological innovationssuch as online utility billing and online filing of Income-Tax returns.As majority of representative firms fromthese four sectors are situated in the National CapitalRegion, covering major industrial areas of Gurgaon,Faridabad and Noida, the sampling frame for the studyconsisted of the medium and large service firms situatedin three areas of Delhi-NCR.The details of these servicefirms were obtained from websites and the databasemaintained by Confederation of Indian Industries (CII),with prior approval of its human resource department.While a total of 667 companies were found in IT enabled/Telecom services, 257 hospitals including clinics, nursinghomes, and other health care organisations comprisedof the health care sector. The hospitality industryaccounts for 563 hotels, which includes rating from onestar to five star. The total number of banks was 70,including private and public, national and multinationalbanks operating in India. All the sources, includingofficial websites and database of CII, provided the poolof 1557 firms from four service sectors. Assuming thatonly firms having more than 100 employees and anannual turnover of more than 2 crores usually haveformal organisation of functional departments, firmsnot meeting the reference criterion were excluded from
Garima Gupta and Sanjeewani Sehgal
IMJ 26
Volume 7 Issue 2 July - December 2015
the sample. Information pertaining to annual turnoverof organisations was obtained from their respectiveofficial websites. Following a similar approach forhospitality services, hotels with less than 3 star ratingwere removed from the sample list. The reduced sampleof 1059 service firms (comprising of 372 firms fromhospitality services, 447 firms in IT and telecomsector,170 hospitals and 70 banks) formed the finalsample of firms that were approached for the purposeof data collection.
In the second phase, pretesting was conducted on 50respondents including 10 respondents from each of thefour service industries and remaining 10 comprising ofmarketing professors, marketing practitioners and headof the concerned sectorial divisions from CII. Interviewmethod was adopted during pretesting. The contactdetails of top level management were obtained from thedatabase provided by Confederation of Indian Industries(CII) and also from the respective official websites ofthe responding firms. Key officials having access toinformation about innovation service activities andperformance, and possessing familiarity with customerswere approached for the survey. The respondents werefurther screened on three parameters: First, for theirexperience as practicing managers in the servicedevelopment or a related position; second, for theirinvolvement in new service development process; andthird, the firm having introduced a new service and/or a new method of service delivery to the customersin the last three years. In addition to the online survey,personal visits were made to collect the responses. Thefollow-up mails, phone calls and regular personal visitsprovided the final response set from 353 service firms,yielding a response rate of 33 percent.
4.2 Measurement of Constructs
The primary constructs examined in the study includemarket orientation, service innovation and organisationperformance. The scale items for these constructs andtheir sub-dimensions have been largely adapted fromprevious studies. However, since these studies pertainedto varied service settings of more developed westerncountries, some of the statements were modified to
make them more suitable for the chosen service sectorsin the context of emerging economies such as India. Thescales developed by Narver and Slater (1990) andPaladino (2007) were used to measure the construct ofmarket orientation. The adapted scale comprising of 15items captured the two dimensions of market orientation,namely competitor orientation and customer orientation.While radical service innovation was measured usinga five-item scale adapted from Avlonitis et al. (2001),a merged scale of six items suggested by Abernathy andClark (1985), Benner and Tushman (2003) and Lewinet al. (1999) was used to operationalise incrementalservice innovation. Organization performance, bothfinancial as well as non-financial, was measured througha scale consisting of 10 items derived from O'Sullivanand Abela (2007), Zou and Cavusgil (2002), Avlonitiset al. (2001) and Voss and Voss (2000). The responsesfor all underlying constructs under study were obtainedusing a seven-point Likert scale with response categoriesranging from 'strongly disagree' (1) to 'strongly agree'(7).
The final questionnaire was pre-tested with 50respondents from the mix of four service sectors(hospitality, healthcare, information technology andbanking) chosen forthe study. Informal discussions withresearchers, academicians and top-level managementexperts of service sector organisations located in Delhi-NCR helped in further pruning the instrument, whichwas finally tested for reliability, validity andmulticollinearity. Table 1 provides the details of itemstatistics and estimated loadings of the measures. Theresponses generated from the final questionnaire werecoded in SPSS 16.0 and the study hypotheses weretested through structural equation modeling (SEM) usingAMOS 16.0.
5. Analysis and Discussion
The two-stage analysis of the present study assessedthe measurement model using confirmatory factoranalysis (CFA) and examined the hypothesizedrelationships of the proposed research model usingpath analysis.
Garima Gupta and Sanjeewani Sehgal

IMJ 27
Volume 7 Issue 2 July - December 2015
5.1 Measurement of Reliability and Validity
The study examines reliability through computation ofCronbach alpha values. The values above the acceptedvalue of 0.70 for all the items (see Table 1) indicate goodinternal consistency of scale items (Gerrard &Cunningham, 2003). In addition, composite reliabilityabove 0.90 for all the constructs in the present workfurther confirms the reliability of data (Fornell & Larcker,1981). The majority of loadings above 0.70 and AVEvalues above 0.50 for all the constructs indicateconvergent validity of the scale. Following the approachof Fornell and Larcker (1981), discriminant validity hasbeenassessed on six factors by comparing square rootof AVE with the correlations between constructs. Resultsprovided in Table 2 indicate the presence of discriminantvalidity as the square-root of average variance extractedis greater than the correlation between the pair ofconstructs in almost all the cases.
5.2 Confirmatory Factor Analysis
After testing the data for reliability and validity, CFAwas performed for the three primary constructs namely,'market orientation', 'service innovation', and'organisation performance'. The approach suggested byFang et al. (2005) and Joshi (2009) was followed in thisregard. The first CFA model was estimated for 'marketorientation' with its two first-order dimensions: customerorientation and competitor orientation. Of the fifteen-itemscale that was used for measuring the construct andits underlying dimensions, four items were subsequentlydeleted due to their regression weights (or factor loading)less than 0.50. The final model with eleven items hasbeen found to have a good fit (Chi-square/df=2.171,RMSEA=.05, GFI= .96, AGFI= .92, CFI=.98, NFI=.966and TLI=.966) and so was accepted in the present work.Separate CFA models were similarly examined for'service innovation' with its two first-order dimensions:incremental innovation and radical innovation(Chi-square/df=2.27, RMSEA=.06, GFI=.97, AGFI=.93,CFI=.99, NFI=.98 and TLI=.98) and for 'organisationperformance' with its two dimensions i.e., financialperformance and non-financial performance (Chi-square/df=3.448, RMSEA=.08, GFI=.98, AGFI=.90,CFI=.99, NFI=.99 and TLI=.97).The results, summarized
in Table 3, demonstrate an acceptable fit with theseindices for all three models.
5.3 Hypotheses Testing
Taking market orientation as an independent variable,service innovation as a mediating variable, andorganisation performance as the final outcome variable,the hypothesized relationships of the study wereexamined through structural path analysis. The overallfit measures suggest that the data provides a good fitfor the hypothesized model (Bagozzi et al., 1991;Baumgartner & Homburg, 1996). The goodness-of-fitindex (GFI=0.983), adjusted goodness-of-fit index(AGFI=0.917), root mean square error of approximation(RMSEA=0.07) and standardised root mean squareresidual (SRMR=0.011) are within acceptable range.The values for other indices like normed-fit index (NFI),comparative- fit index (CFI) and Tucker- Lewis index(TLI) are also found to be above 0.90, thereby reflectinga reasonable fit to the data as well as for the overallstructural model (X2/df =2.993; GFI=.983; AGFI=.917;CFI=.995; NFI=.992; TLI=.995; RMSEA=.07).The SEMresults (see Figure 1) reveal strong association, withcustomer orientation significantly influencing bothincremental service innovation (=.78, p<0.00) as wellas radical service innovation (=.73, p<0.00), therebylending support to the acceptance of H1a and rejectionof H1b in the present study. The findings contradictprevious studies (Cheng & Krumwiede, 2012) that havesuggested customer orientation to be significantlyrelated with incremental service innovation only. Withrespect to competitor orientation, the results in Table4 show an insignificant relationship with bothincremental innovation (=.04, p=.20) and radicalinnovation (=.01, p=.45). The study thus rejects H2aand accepts H2b.
An assessment of the impact of market orientation onorganisation performance provides interesting resultswhen component-wise analysis is performed. Whilecustomer orientation is found to be exerting a positiveand significant influence on financial (=.23) as well asnon-financial performance (=.21),the study found theeffect of competitor orientation to be negative andinsignificant for both the dimensions of organisationperformance. In all, the findings provide partial support
Garima Gupta and Sanjeewani Sehgal

IMJ 28
Volume 7 Issue 2 July - December 2015
to H3. The next stage of analysis was conducted toexamine the impactofthe two dimensions of serviceinnovation on two components of organisationperformance. The findings reveal a positive andsignificant impact of incremental service innovation onboth financial (=.23) and non-financial performance(=.54). The direct impact of radical service innovationon financial performance (=.32) and non-financialperformance (=.23) too is found to be positive andsignificant. The present study thus accepts H4(see Table 3).
The four-step approach of Baron and Kenny (1986) wasused to examine the mediating role of service innovationin influencing the relationship between marketorientation and organisation performance. Themediation was checked separately for all therelationships between market orientation andorganisation performance (i.e., customer orientation-financial performance, customer orientation-nonfinancial performance, competitor orientation-financial performance, competitor orientation-nonfinancial performance). In Step 1 of the mediationmodel, the regression of market orientation total scoreson organisation performance, ignoring the mediator,was significant, (=0.65, p<.001). Step 2 showed that theregression of market orientation on service innovationwas also significant (=0.70, p<.001). Step 3 of themediation process revealed that the regression of serviceinnovation on the organisation performance, controllingfor the market orientation, was significant (=0.81,p<.001). Step 4 of the analyses showed that afterun-constraining all the paths, market orientation scoresremain significant but with decreased regression weightsi.e., the significance of the relationship between marketorientation and organisation performance decreasedafter mediator service innovation (=0.16, p<.001). Theresults presented in Table 5 indicate partial mediationof service innovation, thereby providing only partialacceptance to H5.
6. Discussion and Conclusion
The study makes an attempt to contribute to the existingliterature by providing useful insights with respect tothe component-wise linkages between marketorientation, service innovation, and organisationperformance, in the context of four major service sectors
namely, hospitality, healthcare, information technologyand banking services. The results of the study can beused by market oriented innovative service firms tounderstand better the differential impact of twodimensions of market orientation (i.e., customerorientation and competitor orientation) in bringing abouteither incremental or radical innovation of the servicefirms and subsequently affecting its financial and non-financial outcomes. The results at the outset revealcustomer orientation to be significantly associated withboth incremental as well as radical innovation. Thisimplies that due to continuous change in needs andpreferences of the customers, firms should give specialattention towards innovation efforts. A proactivecustomer-oriented approach with a clear understandingof customers' latent needs may enable the firms todeliver value through service innovations that can eitherbe incremental or radical in nature. On the other hand,the findings did not show any impact of competitororientation on either type of service innovation. Thismay be due the fact that competitor orientation is asource for imitation. Easy imitation of new services bycompetitors may thus fail to influence anyinnovationpositively. Keeping this in mind, it may beinferred that too much focus on competitors may reducethe innovative capabilities of a service firm and henceshould be avoided. In all, the findings lend support tothe superior diagnosis ability of the component-wisemeasurement model tested in the present research.
Results of the study indicate the significant and positiveinfluence of each type of service innovation (i.e.,incremental and radical) on the two components oforganisation performance. However, while thecontribution of incremental service innovation towardsnon-financial performance is relatively greater, radicalinnovation is found to be influencing financialperformance more than non-financial performance. Thefirms should therefore focus on continuous innovationto derive advantage of superior image and customerloyalty, but at the same time should also strive to developnew services so as to outperform competing firms interms of profitability and market share.
In addition to establishing the direct impact of marketorientation on organisation performance, the presentresearch also found service innovation to be partially
Garima Gupta and Sanjeewani Sehgal

IMJ 29
Volume 7 Issue 2 July - December 2015
mediating the relationship between market orientationand organisation performance. It may thus be inferredthat market-oriented innovative service firms wouldprovide greater impetus to their organisationperformance in comparison to firms that choose to beeither market-oriented or innovative in their approach.To sum up, it can be suggested that a balanced focustowards introduction of totally new innovations as wellas continuous improvements in the existing ones is thekey ingredient for an improved overall performance ofmarket-oriented service firms.
As is true with majority of studies, the present worktoo has certain limitations which may be addressed byfuture researchers. First, the study has been undertakenin the context of only four select service sectors in Delhi-
NCR. Inclusion of other service sectors and geographicallocations may provide better understanding of theconstructs under investigation. Second, the researchcan be extended to incorporate the views of customersas well as managers to examine the differences in theperception towards innovation for both groups ofstakeholders. Third, non-availability of empirical studiesin the context of emerging economies may have resultedin the exclusion of some of the other sub-dimensionsof the primary constructs. Future studies can attemptto make the model more exhaustive by identifyingadditional dimensions. Lastly, there always exists apossibility to improve the reliability and validity ofscale items for future use.
Table 1: Item Statistics and Estimated Loadings
Constructs/Items Mean Std. Cronbach AVE Composite ItemDev Alpha Reliability Loadings
Market Orientation(a) Customer Orientation 0.88 0.66 0.96• Taking corrective actions 6.32 .942 .922• Taking efforts to modify a service 6.04 1.145 .778• Spending time in discussing
customers' future needs 6.08 1.125 .750• Periodically circulating documents
(such as reports) related tocustomer information 6.07 1.068 .720
• Meeting customersatleast oncea year 5.73 1.285 .517
• Disseminating informationabout customer satisfaction 5.88 1.279 .549
• Knowledge about majorcustomer/ market 5.73 1.315 .565
(b) Competitor Orientation 0.79 0.54 0.98• Information about competitors
generated independently by alldepartments
• Sharing information about 5.88competitors by top management 5.87
• Quick response to competitors' 6.01actions
• Rapid response to competitors'campaignfor target customers
Garima Gupta and Sanjeewani Sehgal

IMJ 30
Volume 7 Issue 2 July - December 2015
Service Innovation(a) Incremental Innovation 0.80 0.60 0.98• Regular adaptation of existing
services 5.87 .828 .623• Improved efficiency of providing
services 6.29 .774 .916• Expanding services for existing
clients 5.36 1.675 .886• Using improvised ways of
providing services 5.99 1.025 0.928• Introducing continuous
improvements in services forlocal markets 6.29 .837 .859
(b) Radical Innovation 0.83 0.52 0.97• Using advanced technology to
produce service 6.24 .914 .738• Creating totally new services 5.44 1.53 .807• Changing customers' buying
behaviour through their usageof new services 5.51 1.229 .609
• Using new ways of evaluatingquality of services 5.79 1.040 .709
• Prompt addition of new servicefeatures in comparison to thatof competitors 5.68 1.078 .741
Organisation Performance 0.94 0.77 0.98
(a) Financial Performance
• Enhanced sales and profitability 6.12 .862 .842• Organisation meeting its sales
objectives 6.22 .738 .833• Successful attainment of market
share objective 6.19 .878 .876• Good return on investment 6.25 .821 .916• Attainment of profit targets 6.15 .828 .937
(b) Non-Financial Performance .93 0.75 0.97
• Significant number of newcustomers 6.00 .759 .891
• Increased loyalty of existingcustomers 6.14 .905 .913
• Strong market reputation 6.30 .846 .932• Gainingcompetitive advantage
over other service providers 6.19 .820 .889• Improved organisation image 6.28 .875 .706
Constructs/Items Mean Std. Cronbach AVE Composite ItemDev Alpha Reliability Loadings
Garima Gupta and Sanjeewani Sehgal

IMJ 31
Volume 7 Issue 2 July - December 2015
Table 2: Correlation Matrix and Discriminant Validity
Variables 1 2 3 4 5 6
1. Customer Orientation (0.81)
2. Competitor Orientation .27 (0.73)
3. Incremental Innovation .63 -.01 (0.77)
4. Radical Innovation .73 .01 .91 (0.72)
5. Financial Performance .73 -.03 .76 .77 (0.87)
6. Non- Financial Performance .63 .04 .75 .78 .87 (0.86)
Note: Values on the diagonal are the square-root of the average variance extracted for each construct (AVE).
Table 3: Summarized Results of CFA and SEM
Model 1 Model 2 Model 3
Construct Market orientation Service Innovation Organizational(second-order (second order Performance
construct) mediator variables) (second-orderconstruct)
Sub-Dimensions Customer Orientation Incremental Innovation Financial Performance(first-order constructs) and Competitor and Radical and Non-Financial
Orientation Innovation Performance
Number of items 11 10 10X2 67.9 38.7 31.0df 33 17 9X2/df 2.058 2.276 3.448GFI .966 .979 .983CFI .983 .993 .995TLI .971 .982 .975RMSEA .055 .060 .083
Garima Gupta and Sanjeewani Sehgal

IMJ 32
Volume 7 Issue 2 July - December 2015
Table 4: Results of Hypotheses Testing
Direct effect Path Coefficients Hypotheses Testing
Market Orientation Service Innovation Partially accepted
Customer orientation-Incremental SI .781* Accepted
Customer orientation-Radical SI .732* Rejected
Competitor orientation-Incremental SI NS Rejected
Competitor orientation-Radical SI NS Accepted
Service Innovation Org Performance Accepted
Incremental SI -Financial Performance .474* Accepted
Incremental SI -Non-Financial Performance .611* Accepted
Radical SI - Financial Performance .375* Accepted
Radical SI - Non-Financial Performance .233* Accepted
Market Orientation Org Performance Partially accepted
Customer orientation- Financial Performance .413* Accepted
Customer orientation- Non-Financial Performance .386* Accepted
Competitor orientation- Financial Performance NS Rejected
Competitor orientation- Non-Financial Performance NS Rejected
Notes: *p<.001, NS: Not Supported
Table 5 Mediation Results-Four Step Procedure
Steps Model Linkages Effects
Step 1- Step 3 Constrained Model MO-----------OP .65*(IV) (DV)MO-----------SI .70*(IV) (M)SI-------------OP .81*(M) (DV)
Step 4 Unconstrained Model After mediator SI .16*(Significant but lower SRW, SI partiallyMO--------------OP mediates the relationship between(IV) (DV) MO and OP)
MO-SI-OP Partially accepted
Notes: *p<.001, IV: Independent Variable, DV: Dependent Variable, M: Mediating Variable, MO: Market Orientation, SI: Service
Innovation, OP: Organisation Performance
Garima Gupta and Sanjeewani Sehgal

IMJ 33
Volume 7 Issue 2 July - December 2015
References
Abernathy, W. J., & Clark, K. (1985). Mapping the windsof creative destruction. Research Policy 14, 3-22.
Alam, I (2007). New service development process: Emergingversus developed markets. Journal of Global Marketing,20, 43-55.
Alam, I. (2006). Service innovation strategy and process: Across-national comparative analysis. InternationalMarketing Review, 23 (3), 234-254.
Athuahene-Gima, K. (1995). An exploratory analysis of theimpact of market orientation on new productperformance: A contingency approach. Journal ofProduct Innovation Management, 12 (4), 275?293.
Avlonitis, G., Papastathopoulou, P., &Gounaris, S. (2001). Anempirically-based typology of product innovativeness fornew financial services: Success and failure scenarios.Journal of Product Innovation Management, 21, 324-342.
Bagozzi, R. P., Yi, Y., & Phillips, L. W. (1991). Assessingconstruct validity in organisational research.Administrative Science Quarterly. 36(3), 412-458.
Baker, W. E., & J. M. Sinkula (1999). The synergistic effectof market orientation and learning orientation onorganisational performance. Journal of the Academy ofMarketing Science, 27, 411-427.
Baron, R.M., Kenny, D.A. (1986). The moderator-mediatorvariable distinction in social psychological research:Conceptual, strategic and statistical considerations.Journal of Personality and Social Psychology, 51, 1173-1182.
Baumgartner, H., & Homburg, C. (1996). Applications ofstructural equation modeling in marketing and ConsumerResearch. International Journal of Marketing Research,13(2), 139-161.
Bates, K., Bates, H. & Johnston, R. (2003). Linking serviceto profit: The business case for service excellence.International Journal of Service Industry Management,14, 173-83.
Benner, M. J., & Tushman, M. L. (2002). Process managementand technological innovation: A longitudinal study ofthe photography and paint industries. AdministrativeScience Quarterly, 47, 676-706.
Bennett, R. C., & Robert, G. C. (1981). The misuse ofmarketing: An American tragedy. Business Horizons, 24,51-61.
Garima Gupta and Sanjeewani Sehgal
Model Fit Indices
X2/df GFI CFI IFI RMSEA
2.857 .992 .997 .986 .078
Figure 1: Path Model Results

IMJ 34
Volume 7 Issue 2 July - December 2015
Blazevic, V., &Annouk, L. (2004). Learning during the newfinancial service innovation process: Antecedents andperformance effects. Journal of Business Research, 57(4), 374-391.
Camison, C. (1996). Total quality management in hospitality:An application of the EFQM model. TourismManagement, 17, 191-201.
Chan, A., Go, F.M. & Pine, R. (1998). Service innovationsin Hong Kong: attitude and practice. Service IndustriesJournal, 18 (2), 112-124.
Chao, P., Fu, J.P., & Lu, I.Y. (2007). Strengthening the quality-loyalty linkage: The role of customer orientation andinterpersonal relationship. The Service Industries Journal,27 (4), 471-494.
Cheng, C.C., &Krumwiede, D. (2012). The role of serviceinnovation in the market orientation-new serviceperformance linkage. Technovation, 32, 487-497.
Christensen, C., Cook, S., & Hall, T. (2005). Marketingmalpractice. Harvard Business Review, 12, 74-83.
Christensen, C.M. (1997). The Innovator's Dilemma. HarvardBusiness School Press, Boston, MA.
Dawes, J. (2000). Market orientation and companyprofitability: Further evidence incorporating longitudinaldata. Australian Journal of Management, 25 (2), 173-200.
Day, G., & Wensley, R. (1998). Assessing advantage: aframework for diagnosing competitive superiority.Journal of Marketing, 52 (2), 31-44.
Deshpande, R., & Farley, J.U. (1998). Measuring marketorientation: Generalisation synthesis. Journal of MarketFocused Management, 10(8), 213-232.
Fang, E., Evans, K. R., & Landry, T. D. (2005). Control systems'effect on attributional processes and sales outcomes: Acybernetic information-processing perspective. Journalof the Academy of Marketing Science, 33 (4), 553-574.
Fornell, C., & Larcker, D.F. (1981). Evaluating structuralequation models with unobservable variables andmeasurement error. Journal of Marketing Research, 18(1), 39-50.
Garcia, R., & Calantone, R. (2002). A critical look attechnological innovation typology and innovativenessterminology: A literature review. Journal of ProductInnovation Management, 19, 110-132.
Gadrey, J., Gallouz, F., & Weinstein, O. (1995). New modesof innovation: How services benefit industry.International Journal of Service Industry Management,6 (3), 4-16.
Gerrard, P., & Cunningham, J. B. (2003). The diffusion ofinternet banking among Singapore consumers.International Journal of Bank Marketing, 21(1), 16-28
Grawe, S., Chen, H., & Daugherty, P. (2009). The relationshipbetween strategic orientation, service innovation, andperformance. International Journal of PhysicalDistribution and Logistics Management, 39 (4), 282-300.
Griffin, A. (1997). The effect of project and processcharacteristics on product development cycle time.Journal of Marketing Research, 34 (1), 24-35.
Han, J., Kim, N., &Srivastava, R., (1998). Market orientationand organizational performance: Is innovation a missinglink? Journal of Marketing, 62 (4), 30-45.
Hayes, R. H., & William, J. A. (1980). Managing Our Wayto Economic Decline. Harvard Business Review, 58, 67-77.
Jansen, J. J. P., Van Den Bosch, F. A. J., &Volberda, H. W.(2006). Exploratory innovation, exploitative innovation,and performance: Effects of organisational antecedentsand environmental moderators. Management Science, 52(11), 1661-1674.
Jaworski, B. J., &Kohli, A. K. (1993). Market orientation:Antecedents and Consequences. Journal of Marketing,57, 53-70.
Joshi, A. W. (2009). Continuous supplier performance: Effectsof collaborative communication and control. Journal ofMarketing, 73 (1), 133-150.
Joshi, A. W., & Sharma, S. (2004). Customer knowledgedevelopment: Antecedents and impact on new productperformance. Journal of Marketing, 68 (4), 47-59.
Kumar, K., Subramanian, R., & Yauger, C. (1998). Examiningthe market orientation- performance relationship: Acontext-specific study. Journal of Management, 24 (2),201-234.
Langerak, F. (2003). An appraisal of research on the predictivepower of market orientation. European ManagementJournal, 21 (4), 447-464.
Lewin, A. Y., C. P. Long, T. N. Caroll. 1999. The coevolutionof new organizational forms. Organization Science, 10,535-550.
O'Sullivan, D., & Abela, A. (2007, April). Marketingperformance measurement ability and firm performance.Journal of Marketing, 71, 79-93.
Lievens, A., & Rudy, K. M. (2000). New service team asinformation processing systems. Journal of ServiceResearch, 3 (1), 46-65.
Lonial, S. C., Tarim, M., Tatoglu, E., Zaim, S., & Zaim, H.(2008). The impact of market orientation on NSD andfinancial performance of hospital industry. IndustrialManagement & Data Systems, 108 (6), 794-811.
Manzano, A. J., Kuster, I., & Vila, N. (2005). Market orientationand innovation: An interrelationship analysis. EuropeanJournal of Innovation Management, 8(4), 437-452.
Narver, J.& Slater, S. (1990). The effect of a market orientationon business profitability. Journal of Marketing, 54 (4),20-35
Nasution, H. N., Mavondo, F. T., Matanda, M. J., & Ndubisi,N. O. (2011). Entrepreneurship: Its relationship withmarket orientation and learning orientation and asantecedents to innovation and customer value, IndustrialMarketing Management, 40, 336-345.
Garima Gupta and Sanjeewani Sehgal

IMJ 35
Volume 7 Issue 2 July - December 2015
Nijssen, E., Hillebrand, B., &Vermeulen, P. (2005). Unravelingwillingness to cannibalize: A closer look at the barrierto radical innovation. Technovation, 25 (12), 1400-1409.
Oerlemans, L.A.G. Knoben, J., & Pretorius, M.W. (2013).Alliance portfolio diversity, radical and incrementalinnovation: The moderating role of technologymanagement. Technovation, 33, 234-246.
Paladino, A. (2007). Investigating the drivers of innovationand new product success: A comparison of strategicorientations. Journal of Product Innovation Management,24(6), 534-553.
Song, M., & Thieme, J. (2009). The role of suppliers in marketintelligence gathering for radical and incrementalinnovation. Journal of Product Innovation Management,26(1), 43-57.
Storey, C., &Easingwood, C. (1999). Types of new productperformance: Evidence from consumer financial servicessector. Journal of Business Research, 46, 193-206.
Thompson, P., Glenn, D., & Bradley T. G. (1985). The strategicmanagement of service quality. Cambridge, MA: StrategicPlanning Institute.
Tsiotsou, R. (2010). Delineating the effect of market orientationon services performance: a component-wise approach.The Service Industries Journal, 30 (3), 375-403.
Venkatraman, N., &Vasudevan, R. (1986). Measurement ofbusiness performance in strategy research: A comparisonof approaches. Academy of Management Review, 11 (4),801-814.
Voss, G., & Voss, Z. (2000). Strategic orientation and firmperformance in an artistic environment. Journal ofMarketing, 64, 67-83.
Yavas, U., Bilgin, B. &Shemwell, D.J. (1997). Service qualityin the banking sector in an emerging economy: A
consumer survey. International Journal of BankMarketing. 15, 217-23.
Zhou, K., Brown, J., Dev, C., &Agarwal, S. (2007). The effectsof customer and competitor orientations on performancein global markets: A contingency analysis. Journal ofInternational Business Studies, 38, 303-319.
Zhou, K., Yim, B., &Tse, D. (2005). The effects of strategicorientations on technology- and market-basedbreakthrough innovations. Journal of Marketing, 69 (2),42-60.
Zou, S., &Cavusgil, S. T. (2002). The GMS: A broadconceptualization of global marketing strategy and itseffect on firm performance. Journal of Marketing, 66,40-56.
Garima Gupta is presently working as an AssociateProfessor in the Faculty of Management Studies, Universityof Delhi. She has contributed articles to journals of reputeincluding Vikalpa, Vision, MAIMS, Business Analyst,Envision, Effulgence, Journal of Commerce and BusinessStudies, Synergy etc. and has presented papers in national/international conferences. She has authored a book titledMarketing of Services: Quality Dimensions published byNew Century Publications, New Delhi.e-mail:[email protected]
Sanjeewani Sehgal is currently pursuing her doctoralresearch in the area of marketing from Faculty ofManagement Studies, University of Delhi. She hascontributed papers to journals of repute includingMetamorphosis and Journal of Business Studies. She hasalso presented papers in national/ internationalconferences.email: [email protected]
Garima Gupta and Sanjeewani Sehgal
IMJ 36
Volume 7 Issue 2 July - December 2015
Abstract
The present paper focuses on the consideration of ethicsin marketing communication. Recently, Lenskart,American Swan and Trioka made promotional brandcommunication on the day of the Nepal earthquake toexploit business leverage. This faced criticism on variousmedia platforms for insensitivity of the communicationpiece. Author identified various factors which may leadto such insensitive communication which includes,organizational policies, role of educational institutes inmoral development, cognitive moral upbringing ofindividual, individual personality traits, intentions ofthe message and competitive environment. In additionit explains, how brands handle image management onceit has been damage. A few components of Image RepairTheory such as, mortification, evasion of responsibilityand reduction in the offensiveness of the act have beenused to restore the image.
Keywords: Marketing communication, ethics inmarketing, ethical marketing communication,competitive environment, image management.
1. Introduction
"Ethical considerations - questions of right and wrong - arean inseparable part of real-life marketing communications.Any part of an organisation's marketing communicationscan send messages about its ethical stance, either intentionallyor otherwise. Organisations need to cultivate an activeawareness of the ethical consequences of their marketingcommunications."
- Richard Christy (2009, p. 99)
Over the decades, marketing has been a process to sellgoods and services produced by the business world.Marketing includes the processes to communicateofferings to the prospective customers in a way which
Ethical Marketing Communication in theEra of DigitizationKuldeep Brahmbhatt
attracts attention and stimulates the intention topurchase. The modes of communication have undergonechanges over a period of decades in line withtechnological reforms, economic changes, changes inthe operating environment of the business and mostimportantly, customer expectations. In the last decade,digitization has revolutionized marketingcommunication. Aaker (2015) noticed that digitalmarketing communication is a powerful device forbuilding brands and strengthening the relationship withindividuals and community by engaging them activelyin the marketing process. He also adds that such activeparticipation has led the marketer to communicate themessage at individual level with rich and deep content.In a way, the digital platform has given the marketeran option for greater reach with more customizedofferings.
According to Aaker (2015), digital marketingcommunication strategies need not be seen as a siloentity, it could take many more forms depending oncultural differences, events, crisis, company profiles,logistics of the countries and variety within the country.It would be very naïve to generate branding strategiesand its communication for India as a country, withoutconsidering its cultural diversity or the logistics of theregions across India. Thus, a context is of primeimportance for any marketing communication.Likewise,at the time of natural calamity, a marketer needs tounderstand the criticality of that crisis and needs toformulate the communication campaign taking intoaccount societal and humane needs.
For example, on the day of the Nepal earthquake on25 April, 2015, Bharti Airtel offered all calls from Indiato Nepal free of charge on its network for 48 hours frommidnight the same day. ("Nepal earthquake: Call trafficfrom India sees massive jump", 2015). Similarly,
An Earlier version of the manuscript was accepted for presentation at World Management Conference (WMC) 2015.
Kuldeep Brahmbhatt

IMJ 37
Volume 7 Issue 2 July - December 2015
Facebook ran a campaign called “Safety Check for thepeople affected by the earthquake”. Through SafetyCheck, one could update one's family and friends thatone is safe.People could also check about their friends'safety (Sen, 2015).In contrast to Airtel and Facebook,a few brands like Lenskart, American Swan and TroikaConsulting tried to get business leverage through thecalamity of the earthquake.
Lenskart, a seller of eyewear and contact lenses throughonline and retail stores, sent an SMS advertisement toits customers saying,"Shake it off like this earthquake"(Khosla, 2015). The message sought to offer specialdiscounts for sunglasses on the disastrous day for Nepal.The discount offered by sending the message to fiftyknown people was on the brand Vincent Chasesunglasses. Such viral activity had been planned togenerate buzz in the market relating to a particularoffer. Sprague and Wells (2010) argued that personalrecommendation through referencing is one of thestrongest triggers for customers because it comes froma reliable source instead of a corporate third party. But,the thrust of Lenskart to gain more consumers by themeans of buzz marketing during a calamity wasquestioned and they faced criticism for their SMSadvertisement (Khosla, 2015). Another similar piece ofcommunication was by American Swan, an onlinefashion retailer, which came up with, "Earth shatteringoffer", providing discounts to its followers (Khosla,2015). In the SMS advertisement,followers wereprovided promotional codes to avail high discount andadded discount for using the platform of Mobikwik.Thus, American Swan planned to get business fromexisting customer through sales promotion. But, theirchoice of event for sales promotion faced criticism(Khosla, 2015). Another blunder was from the talentsourcing agency, Troika, which communicated hiringof people who were busy updating their status on socialmedia while their building was being evacuated inearthquake (Khosla, 2015). Troika posted a picture ofthe same on their Facebook media job group page andurged social media savvy candidates to apply for theposts of social media team. As rightly noted by Va (2015,p. 75) for communication message, brand "cannot touchthe tangent Millions unless the Method of dialect
between the brand and the prospective customer isunique, innovative and special", which is also a premiseof guerilla marketing. In the same manner, Troika triedto be unique by Guerilla marketing on social media, butit faced criticism too (Khosla, 2015). Images of thesecommunications areshown below.
Consequently, these brands attracted immense criticismon social media; so they ended up with an apology fortheir advertisements. American Swan and Lenskart sentposted apologies to their followers and customers fortheir message and said that the whole event wasunintentional and they did not intend to be mean aboutany crisis or the people involved in it (Shrivastava,2015). Troika Consulting removed its Facebook postwithin a few hours and sent an apology post to theirfollowers. With acommunication to Social Samosa,Troika communicated that the message not intendedforearthquake victims ("Troika Consulting's responseto Earthquake Post", 2015).Thus, all the three brandsplanned image management immediately after theincident. Even though the brands tried to build positiveimages afterwards, customers do have their own wayof interpreting the phenomenon. Wan and Schell (2007)argued that the image of the brand isanalyzed at twolevels: firstly at the level of personality and character,which refers to motivations of the brand with skillfullydesigned communication. At the second level, customer'sperception about the communication, based on theirunderstanding and interpretation. Here, two processesare playing a role, firstly at the cognitive level throughcustomer's understanding about the organization andsecondly, at the affective level through customers'owninterpretations in relation to marketing communicationby the brand(Avraham & Ketter, 2008; Dowling, 2001).
Kuldeep Brahmbhatt
IMJ 38
Volume 7 Issue 2 July - December 2015
Ethics in marketing communication refers to themarketing morality related to one of the 4P's that is,promotion. Communication pieces like the onesmentioned above raise concerns over the ethics involvedin marketing communication. In India, AdvertisingStandards Council of India (ASCI) regulates the ethicalissues involved in marketing communication. Thegeneral guidelines from ASCI and other regulatorybodies put emphasis on the normal requirements ofdecency, legality and honesty regarding the advertisingmessages or claims, and the means by which thesemessages are being presented (Pickton &Broderick,2005). But, these requirements are not explained in greatdetail (Pickton & Broderick, 2005). So, for a marketingmanager, what might be communicated is nebulous.Most organizations are not intentional in their unethicaldoing (Carrigan & Attala, 2001); but these are pitfallswhich organizations should be wary of. Such pitfallsmay lie with organizational policies, workforce or otherenvironmental forces. In the following section,throughdetailed literature review, author explains ethics inmarketing communication and identifies the factorswhich may lead to insensitive marketing communication.Plus, once the damage has been done, how a brandreacts to the situation and undertakes imagemanagement is also studied.
2. Ethics in the Marketing Communication
Ethics is about the study of morality in which practicesor activities which are right and wrong have been focused(De George, 1999).Question of right and wrong havebeen discussed by thinkers and writers over manydecades and to discuss it superficially here in this spacewould not do justice to its magnitude. Varey (2002, p.325) produced a more pluralistic view for ethics inmarketing communication stating, "ethical standardsshould ensure that representation and expression arenot misleading, deceitful, exploitative, demeaning,irritating, wasteful, arrogant or servile". For this researchwe consider people's response on a particular instanceas a right or wrong act.Laczniak and Murphy (2006)noted that ethical marketing puts customers first.In thepresent case, criticism on various media for marketingcommunication by Lenskart, American Swan and Troika
would reveal the insensitivity in their communicationor wrong action, while studying morality.
As a part of the larger domain of ethics, ethics in businessfocuses on ethical principles in relation to the conductof the business. Within the study of business ethics,ethics in marketing communication is an importantcomponent. In the literature of marketingcommunication, ethics concerns appear at two levels(Christy, 2009). Firstly, critiques of the marketingcommunication who believe that the activity as a wholeis undesirable or only some aspects of the marketingcommunication activity are not justifiable on the basisof ethical principles. This study focuses on the ethicalconsideration within various activities of the marketingcommunication which may include advertising, salespromotion, PR and so on.
As Robin and Reidenbach (1993) pointed out, marketingcommunication is seen to be ethical or unethical basedon the context in which they are applied.Theconsideration of ethics in marketing communicationhas been studied in various contexts such as truthtelling through advertisements, treatment for vulnerablegroups, representation of groups, infringement ofpersonal privacy through direct marketing, images ofwomen and men in advertising and stereotyping people,culture and region (Attas, 1999; Borgerson & Schroeder,2002; Carrigan & Szmigin, 2003; Christy & Mitchell,1999; Packard, 1960; Strachan & Pavie-Latour, 2008).However, no study has focused on sensible and ethicalmarketing communication in the scenario of naturalcalamity. This study offers an opportunity to exploreand understand the phenomena of ethics for sensiblecommunication by the brands in the scenario ofdevastative natural calamity.
3. Factors Influencing Ethical MarketingCommunication
3.1 Personal, Organizational and Institutional Factors
It is quite interesting to know why brands adopt differingcommunication strategies in similar situations ofdevastation. In the Nepal earthquake, Airtel andLenskart chose to do different marketingcommunications. It is critical to understand the factors
Kuldeep Brahmbhatt
IMJ 39
Volume 7 Issue 2 July - December 2015
that actually differentiate both. Sparks and Hunt (1998,p. 92) pointed out various organizational factors whichaffect organizational ethical decision making, whichincludes,"the process of judging organizational practices,the impact of supervisory actions, the effect ofMachiavellianism, the influence of cognitive moraldevelopment, the role of deontological norms and therole of the importance and moral intensity of ethicalissues".Hunt &Vitell (1992) described a model of ethicaldecision making wherein sensing the ethical situationand feeling ethical sensitivity in the decision makingprocess is a personality trait.As a result, some peopleneverrecognize the existence of the issue at all. Thestudy identified variables like religion, individual valuesystem, beliefs, strength of moral character and ethicalsensitivity. Here, they consider ethical sensitivity as apersonal characteristic which enables an individual tofeel the presence of an ethical issue.Some authors havealso pointed out the role of educational institutes likeschools and colleges in instilling the sense of ethics.There is an influential relationship between theenvironment of an educational institution and thedevelopment of standards of ethics in students (Hawkins&Cocanougher, 1972).Thus, factors at personal,organizational and institutional levels have an influentialrole to play in ethical communication.
3.2 Contextual Factors
In addition to the factors mentioned above, context andmotives are also vital while evaluating ethics inmarketing communication. Clampitt (1991) hasdiscussed three fundamental assumptions in relation tothe communicator and the motives for ethicalinterventions in marketing communication. Firstly, eachand every communication has one or the other ethicaldimension. While choosing any communication, acommunicator focuses onthe feelings attached,information to be sent and motives. It is the receiverwho takes a moral stance for any piece of communication.Secondly, he adds that marketing communicationinvolves motives and their impact. There is the chancethat a good motive was directed in a deceitful way.Lastly, while making decisions relating to ethicalcommunication, one needs to understand who iscommunicating with whom, in what sense, where andwhen.Thus, motives and context of the communication
are important.
3.3 Competitive Environment
Eliashberg and Chatterjee (1985) have noted that abrand'smarketing department keeps an eye oncompetitors' activities or conduct. A competitor'sactivities or industry practices are important drivingfactors for a brand's marketing strategies to gaincompetitive advantage. Johnson & Busbin (2000, p. 153)observed that competitive advantage has taken a"multidimensional character";to be at the cutting edge,brands need to be effective at product strategies as wellas marketing strategies. They added that to attaincompetitive advantage, a brand needs to be up to datewith the flow of market information, distributionintensity and diversity, sophistication of customers andcompetitors etc. At the same time, competitive advantagecan be hindered by "structural nature of the industry,networking, alliances and government interventions"(Johnson & Busbin, 2000, p. 153).
In the present scenario, digital marketing communicationand its innovative tactics have added one moredimension to competitive advantage. Johnson & Busbin(2000, p. 153) noted that digital marketing has changedthe form of "time based competition" introduced byStalk and Hout in early 1990s, which focused on beingfaster than the competitor. Being faster would includebeing faster in response to market changes, faster indistribution channels and service to the customers, fasterin new product development with the advent oftechnological changes. In the above mentioned form ofcompetition, digitization has revolutionized informationdissemination in an innovative way. The advancesininformation dissemination has generated conceptslike buzz marketing, viral marketing, stealth marketing,word of mouth and Guerilla marketing.
Notarantonio and Quigley (2009) explained buzz andviral marketing as tempting customers or consumersto take the product, service, brand or any businessfunction so that they involve themselves in the advocacyprocess by spreading the message to others. They addedthat in the process, the source of the message has primeimportance due to its assumed objectivity. Commercialsources of the message are also important in spreading
Kuldeep Brahmbhatt

IMJ 40
Volume 7 Issue 2 July - December 2015
awareness.But, word of mouth has a strong influenceon innovation information adoption which is a morereliable source in consumer decision making (Katz &Lazarsfeld, 1955; Mahr & Chiagouris, 2005).Notarantonio and Quigley (2009) added that Word ofMouth (WOM) is a source of consumer dominatedchannel of marketing because it is assumed to beindependent of marketer intervention. So, WOM is amore reliable, credible and trustworthy source ofcommunication. Schweitzer (2005) defined Guerillamarketing as an unconventional way of promoting thebrand wherein traditional media is no longer able toreach the targeted mass demographic. He added thatGuerilla marketing comes with more engaginginstruments with element of surprise andunconventional methods of connecting with theconsumer through offensive modes of promotion. Thus,the above marketing communication tactics giveleverage to brands on the digital platform due to theircapability of faster and more innovative informationdissemination.
In order to gain competitive advantage, suchcommunication tactics have generated a blind race ofsales promotion and in turn, brands follow insensitivecommunication as observed in examples of earthquakementioned above. Within the area of ethical marketingin general, and ethical marketing communication inparticular, no studies have put emphasis on the factorof competitive environment as a vital influencing factorfor ethical marketing communication. This study wouldinstigate this factor for future research.
4. Image Management
Nandan (2005) explained the concept of brand. He saidthat brands are intangible assets which help inshareholder value maximization by reflecting the truevalue of the firm, keeping in mind the benefits of bothorganization and consumer. He also added that brandidentity is the company's reflection of their own self tothe world and brand image refers to the image receivedor perceived by the consumer. Brands try to eliminatethe gap between brand identity and brand image throughtheir communicative messages over a period of time.But if the gap widens, companies need to do image
management by handling crisises encountered by theorganization. Hermann (1963) notes three fundamentalcharacteristics of crisis which are surprise, threat anda short response time. In the same line of thought, "Anorganizational crisis is a specific, unexpected, and non-routine event or series of events that create high levelsof uncertainty and simultaneously present anorganization with both opportunities and threats inrelation to its high-priority goals" (Ulmer, Sellnow andSeeger, 2015, p. 7). In this paper, we mention threat asa threat to the image of the brand. Organizational crisisthrough any activity widens the gap between brandidentity and brand image, which needs to be managed.Objectives of the crisis management are maintaining theorganization's image, lessening the negative outcomes,and protecting stakeholders' rights (Pang, 2012). Pang(2012) also added that, the impact of the crisis on theimage of the brand depends on three things:firstly, howstrong the current image is, secondly, the magnitudeand type of the crisis and lastly, how much mediaattention the event got. Crisis and/or ImageManagement should thus opt for organizationalnormalcy and seek to influence the perception of theaudience.
In the process of regaining the image and to restore thebrand image, Holtzhausen and Roberts (2009) suggestedImage repair theory proposed by Benoit and Pang.Image repair theory in public relations has got its rootsin two forms of rhetoric: political rhetoric and socialscience. This theory suggests five strategies to repairthe image of abrand. First, denial: It is explained as thecommunicative agency's stance on denying theperformance of the act or to transfer the responsibilityto someone else's shoulder. Second, evasion of theresponsibility: It caters to the argument that the eventwas merely an accident and unintentional on the partof the organization. Third, reduce the offensiveness ofthe act: It emerges from showcasing one's good traitsor by reducing the importance of the act or by blamingthe accuser or by providing compensation to the victim.Fourth, corrective action: It refers to the communicativeagency's plans to resolve the issue. And lastly,mortification: It suggests apology for the event by thebrand. According to the situation, the organization
Kuldeep Brahmbhatt

IMJ 41
Volume 7 Issue 2 July - December 2015
would use either one strategy or a combination of a fewto resolve the crisis. Thus, a brand can restore its imagein a crisis situation through any of the ways.
5. Discussion and Future Direction
5.1 Empirical Investigation of Ethical MarketingCommunication
Lenskart, American Swan and Troika faced criticismwith plenty of comments on various social mediaplatforms for their proclaimed (by the people) insensitivepiece of communication. The same incident raisedquestions relating to ethicality in marketingcommunication. To evaluate the same, one need to lookat it from multiple perspectives, which include companypolicies relating to ethical behavior, individual'scognitive moral development, individual personalitytraits, intentions behind representation and expressionof the message, role of education institutions, contextof the communication, and competitive environment.For instance, criticism on a piece of communication hasproved brands to be guilty of a deed, which proved tobe insensitive in a single time communication.
At this juncture, it is quite difficult to evaluate whetheron a larger scale people have actually perceived brandsto be unethical and if yes, then which are the contributingfactors to it. And even among the contributing factorsmentioned, it is difficult to know which factors contributemore and with what intensity.To ascertain the same infuture research, executing the method of laddering isrecommended. Laddering refers having in-depthinterviews with customers and developing an analysisof how customers actually translate the attributes of theproducts/communication with meaningful attachmentby considering their own self, following means-endtheory(Gutman,1982). Here, the very purpose of havingin-depth interviews is to know the attributes(A),consequences (C) and values (V) associated with theinsensitive piece of communication. Attributes andvalues would be the influencing factors for ethicalmarketing communicationin the current study. Thus,execution of the laddering method would distinguishethics of the brands and the perceived value associatedwith it,which in turn decides the basis for the brand or
piece of communication being ethical or unethical.Another measure for finding ethicality of the brand is"ethical brand index" introduced by Karen Fraser, whichis one of the most accurate measurements of perceivedimage in relation to ethics (Arnold, 2009, p.16).Suchmeasures would help us to gaugelong term perceivedimage of brands relating to ethicality. The combinationof laddering and ethical brand index would give us aproper indicationfor customer's point of view.Varey(2002) argued that the objective of marketingcommunication is to differentiate, remind, persuadeand inform, not by an authoritarian way, but throughcollaboration and participation with the stakeholdersin a specific context. Here, brands tossedinsensitivecommunication without understanding the sentimentsof the customers at atime of natural calamity.
5.2 Competitive Environment: A New Factor ofInfluence
Renowned semiotician, Barthes (1953) said that,denotations are not the first meaning of signs andmessages but it pretends to be so, whereas connotationsare more established and close to the reading of signsand messages. So, denotations and connotations togetherlead to meaning making of the phenomenon. With theconnotative underpinnings, the communicationmessages of Lenskart and American Swan generatedguilt-by-association for brands likeVincent Chase andMobikwik. Guilt-by-association refers to the consumerjudgments of higher perceived risk and lack of trustregarding a particular brand by associating with anotherbrand whose brand image has been contaminated (Gaoet al., 2013) Both the associates, Vincent ChaseandMobikwik, might have got negative word of mouth forgetting involved in such a piece of communication.Secondly, Lenskart had floated its offer for people whowere required to make it viral by communicating thesame message to fifty more people in order to get thediscount. In a way, it planned for buzz marketing orword of mouth from a devastating calamity. Sprague& Wells (2010) opined that customers are highly receptiveof word of mouth communication and adaptive tomessages from reliable sources. Such buzz marketingcampaign could have been created on a festive seasonor by announcing season's sale insummer, but the brand
Kuldeep Brahmbhatt

IMJ 42
Volume 7 Issue 2 July - December 2015
messed up with the unusual communication on the dayof a disaster.Troika Consulting used the concept ofGuerilla Marketing through its unconventional messagefor recruiting people for the social media team.Apparently, all the three brands had tried to getcompetitive advantage through these communicationpieces but it did notwork for them.
In the last few years, the e-commerce segment in Indiahas become highly competitive with the presence ofinternational and national brands. PWC Report (2014)noted that, this segment has grown three times in thelast four years: by 12.6 billion USD in 2013, whichwouldgrow manifold in two more years.To grab themarket in this competitive environment and to getcompetitive advantage each brand is keeping an eye onother brands' actions and industry practices. Parallel toit, frequent sales promotions have been a trend in theindustry. As a result, every player in the market iscatchingup with faster market changes, fasterdistribution and services, and faster new productdevelopment. Such a race is motivating them to grabthe opportunity to earn even through disastrous naturalcalamities. This leads them to insensitive communicationfor profit maximization, which generatesa pitifulsituation. Thus, competitive environment as aninfluential factor for ethical marketing communicationwould bea new avenue for future research.
5.3 Image Management
Brand identity is an organization's unique anddifferentiated offering to the target audience whichideally reflectsin every single communication by thebrand. In the present case, Lenskart communicated to"Shake it off like earthquake" (Khosla, 2015).In thispiece of communication, what is to be shaken off is anambiguity. In the same context, earthquake that is adisastrous event with plenty of attached sad emotionswas clubbedwith the ambiguous message. It pointstothe clear blunder in the communication. AmericanSwan communicated,"Earth shattering offer" (Khosla,2015), which had connotations of being surprised withthe present offer. But, how could a person be surprisedin the shock of the disaster? Such instances haveplacedthe brands in animage crisis. Once the crisis
occurred, the brands tried to maintain the image andto lessen the negative word of mouth. After a few hours,they sent apologies for the communication to normalizethe situation and to change the perceptive image alreadygenerated.But, till then social media and traditionalmedia had captured the issue and ruptured their brandimage significantly. According to Image Repair Theory,brands performed the strategies of mortification, evasionof responsibility, and reduction in the offensiveness ofthe act. They intended to prove the messagesunintentional and conveyed that they were merely anaccident. Through their act, they curtailedthe importanceof the event in an effort to influence the perceived imagein the minds of consumers. But, actually how effectivethey were poses a question of exploration with empiricalstudies in future.
6. Conclusion
Out of the 4P's of marketing, promotion is one of thesignificant parameters which drive the firm's success.Marketing of promotional communication has asignificant impact on consumer psychology and theirbehavior in the consumer market. Ethicality in everycommunication campaign plays a very vital role ingenerating a good brand image for the organization. Ata micro level, an organization's corporate policies,individual's cognitive moral development, individualpersonality traits, intentions behind representation orexpression, context of the communication, are the mostinfluencing factors for any irresponsible or deceptivecommunication. At the macro level, a rush for gettingcompetitive advantage in the digital age motivates themarketer to use marketing tactics such as, viralmarketing, buzz marketing, stealth marketing andguerilla marketing, in unethical ways. Plus, environmentof educational institutions also plays a vital role. Suchmacro and micro factors leading to unethical practiceswidens the gap between brand identity and brand image,which in turn generates crisis situations for the brand.According to the Image Repair Theory, communicatingagency's crisis situation can be handled by five strategiesout of which evasion of responsibility, reducing theoffensiveness of the act, and mortification were usedby Lenskart, American Swan and Troika.
Kuldeep Brahmbhatt

IMJ 43
Volume 7 Issue 2 July - December 2015
Though quite often utilitarianism decides the moralworth of ethicality of the communication from thecustomer point of view, there is the need to dig deepand explore the underpinning factors which matter forethical marketing communication with the interventionof both customers and marketers.
References
Aaker, D. (2015). Four ways digital works to build brandsand relationships. Journal of Brand Strategy, 4(1), 37-48.
Arnold, C. (2009). Ethical marketing and the new consumer.West Sussex: John Wiley and Sons.
Attas, D. (1999). What's wrong with deceptive advertising?Journal of Business Ethics, 21, 49-59.
Avraham, E. and Ketter, E. (2008). Media strategies formarketing places in crisis. Butterworth-Heinemann:Oxford.
Barthes, R. [1953] (1967). Writing Degree Zero (trans. AnnetteLavers & Colin Smith). London: Cape.
Borgerson, J.L. and Schroeder, J. (2002). Ethical issues ofglobal marketing: avoiding bad faith in visualrepresentation. European Journal of Marketing, 36(5),570-94.
Carrigan, M. and Szmigin, I. (2003).Regulating ageism in UKadvertising: an industry perspective. MarketingIntelligence and Planning, 21(4), 198-204.
Carrigan, M and Attalla, A. (2001). The myth of the ethicalconsumer - do ethics matter in purchase behavior?Journal of Consumer Marketing, 18(7), 560-575.
Christy, R. and Mitchell, S.M. (1999). Direct marketing andprivacy. Journal of Targeting, Measurement and Analysisfor Marketing, 8(1), 8-20.
Christy, R. (2009). Ethics in marketing communications. InFill, C (5th Ed.), Marketing communications: Interactivity,communities and content (pp. 99 - 127). Harlow:Prentice Hall.
Clampitt, P. G. (1991). Communicating for ManagerialEffectiveness. London: Sage Publications.
Dowling, G. (2001). Creating Corporate Reputations. Oxford:Oxford University Press.
Gao, H., Knight, J., Zhang, H. and Mather, D. (2013). Guiltby association: Heuristic risks for foreign brands duringa product-harm crisis. Journal of Business Research,66(8), 1044-1051. in China
Khosla, V. (2015, April 27). Companies such as LensKart,American Swan & Troika Consultants draw social mediaflak for using quake ads. The Economic Times. RetrievedMay 20, 2015, from http://economictimes.i n d i a t i m e s . c o m / a r t i c l e s h o w / 4 7 0 6 4 4 8 5 .cms?utm_source=contentofinterest&utm_medium=text&utm_campaign=cppst
Eliashberg, J. and Chatterjee, R. (1985). Analytical modelsof competition with implications for marketing: Issues,findings, and outlook. Journal of Marketing Research,22,237-245.
Gutman, J.(1982). A Means- End Chain Model Based onConsumer Categorization Processes. Journal ofMarketing, 46(2), 60-72.
Hermann, C. F. (1963). Some consequences of crisis whichlimit the viability of organizations. AdministrativeScience Quarterly, 8, 61-82.
Holtzhausen, D. R. and Roberts, G. F. (2009). An investigationinto the role of image repair theory in strategic conflictmanagement. Journal of Public Relations Research, 21(2),165-186.
Hunt, S. and Vitell, S. J. (1992). The General Theory ofMarketing Ethics: A Retrospective and Revision, in Ethicsin Marketing. Homewood, IL: Richard D. Irwin.
Johnson, J. T. and Busbin, J. W.(2000). The evolution ofcompetitive advantage: Has virtual marketing replacedtime-based competition? Competitiveness Review, 10(2),153-162.
Katz, E., andLazarsfeld, P. (1955).Personal influence: The partplayed by people in the flow of mass communications.Glencoe, IL: Free Press.
Mahr, I. andChiagouris, L. (2005). Get the word out. MarketingManagement, 14(4), 51-54.
Nandan, S. (2005). An exploration of the brand identity-brandimage linkage: A communications perspective. Brandmanagement, 2(4), 264-278.
Notarantonio, E. M and Quigley C. J. (2009). The effectivenessof a buzz marketing approach compared to traditionaladvertising: An exploration. Journal of PromotionManagement, 15, 455-464.
Packard, V. (1960).The Hidden Persuaders.Harmondsworth:Penguin.
Pang, A. (2012). Towards a crisis pre-emptive imagemanagement model. Corporate Communications: AnInternational Journal, 17(3), 358-378.
Pickton, D. and Broderick, A. (2005). Integrated MarketingCommunication. United Kingdom: Pearson Education.
PWC Report (2014). Evolution of e-commerce in India:Creating the bricks behind the clicks. RetrievedMay 21,2015, fromhttp://www.pwc.in/assets/pdfs/publications/2014/evolution-of-e-commerce-in-india.pdf
Robin, D.P. and Reidenbach, R.E. (1993). Searching for aplace to stand: Toward a workable ethical philosophyfor marketing. Journal of Public Policy and Marketing,12(1), 97-105.
Schweitzer, S. (2005). Building a buzz on campus: Companiesenlist students to pitch products to their peers. London:Boston Global.
Sen, A. (2015, April 26). Facebook starts safety check featurefor Nepal's earthquake victims. The Economic Times.RetrievedMay 20, 2015, from http://articles.
Kuldeep Brahmbhatt
IMJ 44
Volume 7 Issue 2 July - December 2015
economictimes.indiatimes.com/2015-04-26/news/61542739_1_mark-zuckerberg-earthquake-victims-safety-check
Shrivastava, A. (2015, April 26). LensKart, American Swanapologize for earthquake-related promotions. TheEconomic Times. RetrievedMay 20, 2015, from http://articles.economictimes.indiatimes.com/2015-04-26/news/61542656_1_lenskart-peyush-bansal-idg-ventures
Sparks, J and Hunt, S. (1998).Marketing researcher ethicalsensitivity: Conceptualization, measurement, andexploratory investigation. Journal of Marketing, 62, 92-109.
Sprague, R. and Wells, M. E. (2010). Regulating online buzzmarketing: Untangling a web of Deceit. AmericanBusiness Law Journal, 47(3), 415-454.
Strachan, J. and Pavie-Latour, V. (2008). Food for thought.International Journal of Market Research, 50(1), 13-27.
Nepal earthquake: Call traffic from India sees massive jump(2015, April 27).The Economic Times. RetrievedMay 20,2015, from http://articles.economictimes.indiatimes.com/2015-04-27/news/61578273_1_traffic-facebook-post-cent-rise
Troika Consulting's response to Earthquake Post.(2015). SocialSamosa. Retrieved May 21, 2015, from http://www.socialsamosa.com/2015/04/troika-consulting-response-earthquake/
Ulmer, R.,Sellnow, T. and Seeger, M. (2015). Effective CrisisCommunication.California: Sage publication.
Varey, R. (2002). Marketing Communication: Principles andPractice. New York: Routledge.
Va, K. P. (2015). Reinventing the art of marketing in the lightof digitalization and neuroimaging. Amity GlobalBusiness Review, 10,75-80.
Wan, H. and Schell, R. (2007). Reassessing corporate image- an examination of how image bridges symbolicrelationships with behavioral relationships.Journal ofPublic Relations Research, 19(1),25-45.
Kuldeep Brahmbhatt is an FPM Scholar at MICA,Ahmedabad. He has earned his BE & MBA and possessfive years of industry experience. His research interestsinclude Consumer-Brand relationships, Brand Personality,Regional Brands, Marketing issues in emerging markets.
Kuldeep Brahmbhatt

IMJ 45
Volume 7 Issue 2 July - December 2015
Abstract
Market penetration has always been a vital challengefor companies targeting customers in different sectors.Samsung outsmarted Nokia by introducing dual-simtechnology and Android operating system in mobile-phones. Haldiram has been a dominant player in fast-food category in the Indian market in spite of the presenceof McDonald's, KFC and Domino's. Sensodyne andColgate Sensitive are the two brands struggling to makea mark in the low-priced oral-care segment. Bajaj Scootersin India experienced marketing myopia in spite of beinga first-mover in the two-wheeler segment. Keeping inview the problems faced by different sectors in theindustry, a multiple qualitative case analysis has beendone taking into account their innovative practices. Asite-ordered effects matrix model has been derived outof the sales promotion cases about established market-players in the industry to find solutions to problemsrelated to market penetration faced by the companiesin Oral-care, FMCG, Automotive, Banking, ConsumerElectronics, Real Estate segments.
Keywords: Customer Engagement, BrandRevitalization, Affiliate Marketing, Sales Promotion
Introduction
Market penetration has always been perceived bycompanies as an uphill task for product launches andservice delivery, especially in a market wherecompetitors already exist (Masterson and Pickton, 2014).Samsung outsmarted Nokia by introducing dual-simcard technology and Android operating system in mobilephones. Samsung has a wide range of handsets withdifferent price points and screen sizes, and is therebyahead in competition with Nokia. The oral care industryhas not been able to retain its customers in the sensitivetoothpaste category. Experts feel sensitive toothpastebrands like Sensodyne, Colgate Sensitive hit the markinitially but consumers switched to regular ones after
Market Penetration through Sales Promotion- A ReviewSubhasis Sen and Kannan Rajagopal
early trials (Malviya, 2015). It has also been observedthat in Quick Service Restaurant (QSR) category, despitethe profusion of multinational corporation brands withhigh cool quotient like McDonald's, KFC and Domino's,good old-fashioned Indian offerings from Haldiram'sstill dominate the Indian market. Haldiram's presencehas been felt both in ubiquitous casual dining eateriesand packaged snacks. Every product of Haldiram ismade in-house (Malviya, 2015). In yet another segment,slow-moving winter has affected FMCG playersviz.,Emami, Dabur. Sales of winter care products,primarily cold creams, body lotions, specialized face-care creams, lip balm, and food items like chyawanprash,dry fruits and sweets such as chikki have dropped byfive to seven percent, while 20 percent fall has beenobserved in woolen garments like jackets and footwearacross general trade(Bhusan and Mukherjee, 2014). Two-wheeler industry has been going through a changingphase. Most of the market-players like TVS, Piaggio,Honda, Hero Motors, and Yamaha have re-inventedtheir scooters with innovative features and introducedcustomer loyalty programmes. Two decades ago, Bajajwas the key player in the two-wheeler scooter segment.There was a sudden decision to fade out scooters, whichhad been on a successful journey on the Indian roadsfrom 1950-2000, as a result of technology obsolescenceand redirecting their focus on manufacturing andmarketing of motorcycles (Pandya and Jani, 2011).Industry trends show changes in tastes and preferencesof customer with progress in time, technology andthought process. Therefore companies have to look forcontinuous improvement of product promotion andservice delivery. The need of the hour is to find waysto penetrate the markets by replicating successfulinnovative practices from different sectors. The studywas conducted during the year 2014-2015 to identifyinnovative sales promotion practices implemented bycompanies while penetrating different global markets.
Subhasis Sen and Kannan Rajagopal

IMJ 46
Volume 7 Issue 2 July - December 2015
Literature Review
A study by Yeniyurt, Townsend and Talay (2007)identified factors impacting the launch of brands inemerging global markets. The multiple indicators ofactivities can contribute to experiential learning whilelaunching brands globally. Market attractivenesspositively impacts the possibility of a brand beinglaunched in an emerging market. This indicates thatpotential demand conditions should be consideredduring the product introduction stage. The results haveshown significant outcomes with respect to the role ofpsychic distance and experiential learning. There arelesser probabilities of brands launching into nationsthat are culturally and economically less similar to thedomestic market. From a managerial perspective, thisresearch suggests that enterprises should look foracquiring both local and global expertise to materializethe launch of products and brands in the internationalmarkets.
Industry analytics can be treated as a customizedinformatics solution for creating an entry strategy intoan emerging market, launching a new product ordeveloping the operating strategy of a firm. The firmshave to proactively design and modify their strategyto maintain market position.
The telecom industry of United States might beexperiencing spin-offs, mergers and acquisitions. Thecountry has faced falling stock prices, decreasingmargins and declining market share. The double-digitgrowth of a stable economy is now a place of businessescompeting for each other's customers in a saturatedmarket. The situation of declining costs and marketshares have resulted to a wave of consolidations. Themarket is significantly moving to a phase whencompanies would concentrate on their core competenciesand offer low cost products with high level ofdifferentiation. This research, (Krishna and Ghatak,2008), based on secondary data, ascertains the fact thatconvergence of technology and consolidation along withtechnology leadership is the need of the hour. Thesaturated markets in America are driving companiesoffshore into emerging markets like India in search ofnewer acquisitions in terms of customers and
competencies.
A study (Beverland, 2002) analyzed the strategy adoptedby large New Zealand based companies and revealsthat the relationship with East European traders iscontext driven. It has been debated that relationship-marketing models accurately capture the trading realitiesof market entry in Eastern Europe. A series ofpropositions have been developed with respect to theresearch which has reflected uncertainties in marketentry, formation of alliances and building relationships.
Cordis Australia is an American company that is adivision of Johnson & Johnson. Cordis manufacturesand markets medical devices designed to treatcardiovascular conditions. The study describes andevaluates Cordis introduction of a new and innovativecoronary artery stent named as CYPHER. Coronaryartery stents are tiny stainless steel 'mesh like' tubes(similar to a spring from a pen) that are used to openup arteries of the heart when they become blocked. Thisprocedure is called angioplasty. Such blockages ofcoronary arteries can lead to chest pain and heart attacks.Cordis has been the first-mover to develop a stent witha drug coating that offered superior features whencompared to plain stainless steel stents (Rankin,2004).
Marlboro advertisements have benefitted by the traditionthat precedes them. They have captured a complexmessage which attempts to differentiate a product fromcompetitors, that are largely the same, through simpleimage and few words. The success of Marlboro brandcan be attributed to the branding strategy used by itsparent company - the Altria Group. Altria has optedfor an endorsement strategy. In this strategy, individualbrands and divisions are marketed under the canopyof the parent company. The combination of brand equityof the parent company with the value of individualbrands and divisions has created greater impact. Itleverages the endorsement equity of the parent acrossdivisional and product categories. The brands anddivisions retain their identity and can be included inthe total equity of the company. Thus, it bringsrecognition among the shareholders, increased cross-selling opportunities, and endorsement credibility fornew products or services (Hemdev,2005).
Subhasis Sen and Kannan Rajagopal

IMJ 47
Volume 7 Issue 2 July - December 2015
Research on the car wars identifies the issues leadingto success or failure of an automotive, analyzing productsuccesses and failures in United States during the last50 years. The development and analysis of twenty casestudies have found several factors driving the fate ofthe products launched. The results indicate that theproduct development system of new vehicles with highsuccess has emerged from financial and corporateresponses to market crisis. The target segment of a newentrant in the automotive sector and its progress dependson the economic conditions of buyers and the leadershipposition of the firm (Hanawaltand Rouse, 2010).
A study discusses the challenges faced by sales peopleto understand consumer behavior that boost up salesgrowth. Data has been collected from across industriesthrough a survey of sales managers, sales representativesand customers. With reference to product promotionthrough personal selling, the findings highlight that anoptimum level of customer orientation is essential withregard to individualized products having premium priceand high degree of competitive intensity(Homburg,Muller and Klarmann, 2011).
Co-creating experiences demands interactions betweenthe customer and the company (Klaus and Maklan,2011). Co-creation considers every interaction to bevital for customers' evaluation of their experience(Ballantyne and Varey, 2006).
The findings of a qualitative study highlights thatcustomers perceive quality on three dimensions: brandexperience, service experience and post-purchase/consumption experience. The research has also pointedout that customers experienced quality, while evaluatingsignificant marketing outcomes like satisfaction, levelof loyalty and word of mouth publicity (Klaus, 2015).
Objectives of the Study
The current study aims to derive solution to challengesfaced in selected sectors with respect to marketpenetration. The objectives of this qualitative researchstudy include:
Understanding the sales promotion approaches to enterdifferent markets through review of cases pertaining toleading business enterprises;
Aligning the problems faced by sectors like Oral-care,FMCG, Automotive, Banking, Consumer Electronics,Real Estate, with the innovative sales promotionpractices in the industry.
The Methodology and Model
The study represents a qualitative multiple case analysis(Gay, Mills and Airasian, 2008). A case study can beabout an event, activity, firm or individual. It givesdetailed information, acquired from multiple sources,leading to a detailed understanding of a particularsituation (Masterson and Pickton, 2014). The data hasbeen derived from reliable secondary sources likerenowned journals and books on marketing and salesmanagement. The researchers have designed a site-ordered effects matrix model for aligning the innovativesales promotion practices in the business with theproblems faced by the companies with respect to marketpenetration (Gay, Mills and Airasian, 2008). Multiplecase studies related to sales promotion are consideredas previous knowledge. The innovative sales promotionpractices derived out of the cases can be implementedas solutions to problems faced by different sectors likeFMCG, Automotive, Consumer Electronics, Banking,QSR, and Oral-care.
Market Penetration for Haul-Away Truck Segment
A reputed manufacturer of large trucks, MAN, wantedto improve its sales performance and identify ways topenetrate a new market segment. The company wantedto launch more trucks on the road. MAN followed afranchising model of business. The product wastechnically sound with its engine offering the best-in-class fuel economy. The brand reputation was immenseand financially competitive. The success of thefranchises, however, varied significantly. The largestdemand for the trucks had been in the 'haul-away'market segment. This involves waste or constructionspoil being transported from wherever it has been createdor stored to where it would be disposed of or used. Thetrucks were heavy, durable and reliable. The companyfailed, however, to successfully penetrate the containerhaulage market segment. The container haulage marketsegment required trucks to haul containers to and from
Subhasis Sen and Kannan Rajagopal

IMJ 48
Volume 7 Issue 2 July - December 2015
ports, and to make deliveries throughout Europe. It wasfound that truck buyers (the product) not only lookedfor technical functionality but also for trust in thefranchisee's 'in franchise territory' service and the servicecoverage provided through the manufacturer for 'outof franchise' and European use of the truck. The buyerswere looking for flexible and quick turnaround timesfor vehicle servicing, preferably overnight, and fast andreliable breakdown services throughout UK and the restof Europe.
The solution to this franchisee problem can be throughshared understanding of the market, its segmentationand how the truck manufacturer sees its futurecompetitive positioning within it. The need of the houris to develop the product and service portfolio to enablethem to exploit the market opportunities moreeffectively. The truck manufacturer relied upon thefranchisees' commitment to the product and theirwillingness and ability to invest in the customerrelationship and services to support it. It is a symbioticrelationship based upon mutual understanding andintent to invest for boosting the product sales and serviceportfolio (Morlay, 2014).
Brand Revitalization at KFC
KFC, having its base in Louisville, Kentucky, isconsidered the world's most preferred chicken restaurantchain. It operates over 5,000 restaurants in United Statesand more than 15,000 globally. It is a division of YumBrands, with a revenue of around $11 billion in the year2009. In 1965, KFC started its operations in Britain. Thenumber of KFC stores has exceeded 700 in the year 2015.KFC lost its dominance during the year 2005 as a resultof declining reputation and sales. This led to exhaustiveresearch leading to revitalization the brand's image. Astrategy has been developed to change the taste of itsofferings to differentiate them from the competitors.The initiative to design products with differentingredients has been carried out over the year, to increaseboth frequency of visits and spending. The brand hasregained its lost glory by April 2006 and hence forthhas been maintaining a high rate of year-on-year growth.Sales promotion helped to a great extent in regainingthe brand's reputation and average spends. In India,
KFC has created awareness among people by adaptingaffiliate marketing in tie-ups with banks like Bank ofIndia for attractive offers via SMS and emails to thebank customers on registered mobiles and email ids.The factors customers consider before visiting KFC arefound to be store ambience, friendliness of the staff, andinclination towards the brand and store location (Davis,2009).
Sustainable Brand Promise by Audi
The famous German car manufacturer, Audi, has beenlaunching vehicles since early twentieth century and isconsidered a valuable brand within the VolkswagenGroup. In UK, Audi has proved to be a major competitorwithin the prestige car category, known for its excellencein engineering and commercial success. Marketing hasenhanced the success of Audi from a niche brand to aleading position in the prestige car sector. Audi's uniqueapproach has always been challenging the conventionaldesign in the car industry. The company is positioningitself as Vorsprung durch Technik which means,advancement through technology.
Technological advancement is both Audi's brandmessage and philosophy. Audi has always emphasizedon innovation while reaching out to its buyers, goingbeyond the conventional way, meeting the expectationsthrough emerging technologies, and justifying theprogressive ideology of brand. Innovative design isprojected while communicating with the audience in amore appropriate manner. Launch of a new TV Channelnamed Audi Channel for prospective customers toengage with the brand, imaginative content creation inthe form of a magazine named GQ, generating brandbuzz by partnering with the New Scientist for acompetition and going interactive through onlinemarketing are examples. The website of Audi worksas a virtual dealer which helps customers to explore andidentify the perfect car (Davis, 2009).
Shell Joint Promotion through Long-Term Scheme
Petrol retailers faced steep competition and difficultyto sustain in the market in1997. The popularity ofsupermarkets generated higher revenue than dealingwith petroleum products. There were various heavily
Subhasis Sen and Kannan Rajagopal

IMJ 49
Volume 7 Issue 2 July - December 2015
promoted card based schemes from Shell as well asother forecourt businesses. But these offers failed tobring about benefit to continue with the petroleumbusiness. In 1994, Shell launched a 5-year 'Smart Card'programme. Shell had been the market leader for quitesome time but was steadily losing its leading positiondue to its failure in offering a life-long loyaltyprogramme. The focus of Shell's sales campaign hadbeen to attract customers through premium pricing andhigh mileage for their vehicles. The Smart Card campaignwas launched in a tie-up with prominent serviceproviders like Air Miles, HMV, UCI and Ticketmaster.The offer against the card was the choice of redeemingpoints with the option of saving, third-party deals andcatalogue shopping, opportunity for donations andindividual gains. The promotional activities caused aviral effect through television advertisements, directselling, and point of purchase in forecourts, radiopromotions, direct mailers and magazine insertions.Shell achieved 3 million cardholders within a year andalso won ISP Gold Award for its card scheme. Further,Shell developed partnership with Dixons, Currys andVictoria Wine. Shell re-launched its brand with a newcard scheme in the year 2007. Thus, joining hands inthe forecourt business with different brands helped thepetrol retailers to sustain and build a long termrelationship with petrol users(Mullin, 2010).
Electrolux Premium Promotions
Product launch in case of a vacuum cleaner is alwaysa tough task. Electrolux launched a new micro-cleaner,the X8, in the year 1994. The company initially sent aseries of mailers to potential buyers. The salesrepresentative had been visiting the prospects with asecurity box made of stainless steel having top-secretmessages. Once the lid was opened, a personalizedmessage was played by a cassette player about the topsecret mission that the buyers were about to experience.The box showed the X8 in all its 'micro' glory after themessage was played. This created valuable impact interms of interest and amusement to the traders. TheElectrolux outlets started showcasing X8 and thismotivated the rise of X8 sales in different outlets. Themarket share of Electrolux in the cylinder cleaner sector
rose to 50 percent, capturing the brand leadershipposition (Mullin, 2010).
Sainsbury's 'Schoolbags' Campaign
Sainsbury's is the second largest supermarket chain inthe United Kingdom with a market share of around 17percent. Sainsbury's 'Schoolbags' promotion is aninnovative measure to fulfill business objectives andaddress social and environmental issues. Sainsbury'shad been planning strategies to increase its family appealto deal with market competition and on the other hand,to reduce the huge waste of carrier bags for shoppingissued to millions of customers every year. ThePromotional Campaigns Group emerged with an ideato involve families with children shopping at Sainsbury'sand reiterate the reusability of the carrier bags. Theshoppers were offered schoolbag vouchers at the exitpoint forthe bag they reused. The vouchers could becollected by educational institutions to acquireequipments like crayons and clipboards. Schools wereinvited to participate in the scheme through direct mail,in-store and TV advertisements.
The campaign was a huge success for Sainsbury's andengaged families to shop for a noble cause and fulfillthe requirements of their kids going to school. About12,000 schools across United Kingdom participated andbenefitted in acquiring equipments for school children.The above initiative saved the society fromenvironmental pollution by restricting the use of newcarrier bags and attracting the shoppers for repeatpurchases (Mullin, 2010).
Upselling - A Common Practice for Real Estate Market-Players
This case study illustrates helping or attractingcustomers to invest more than they originally intended.It is essential to identify the buyers' needs and therebyoffer them the best possible solutions. Sometimes theprospective buyers are ready to scale up their budgetfor a better future. In this case, a judicious real estatecustomer would buy an economy apartment at areasonable price and sell it off at a much higher pricein a short duration of about five years to purchase apremium spacious apartment of the same construction
Subhasis Sen and Kannan Rajagopal

IMJ 50
Volume 7 Issue 2 July - December 2015
company or some other builder. The sales assistant inthe real estate business creates a value proposition(features, benefits and values) of its offerings for theprospective buyers. The value appreciation enables theinvestors in real estate to gain within a short period oftime (Leadbetter, 2011 and Gould, 2012).
Results and Discussions
The cases discussed can be considered innovativepractices by companies facing difficult situations forpenetrating into new market segments. Based on thestudy, the following Site-Ordered Effects MatrixModel(Gay, Mills and Airasian, 2008) has been derived:(Table 1)
The study has future scope for research in sectors notmentioned earlier.
The case study based research highlights the majorissues in penetrating new market segments of different
sectors and suggests ways to overcome problems relatedto market penetration. Customer EngagementCampaigns, Branding, Service Delivery, Upselling andAffiliate Marketing play a major role in influencingprospective customers. An attempt has been made tomap the innovative industry practices with the problemsfaced by existing market-players. The sustainability ofproducts and services in any market depend largely oncustomer involvement and innovation in marketing.
Scope for Further Development
This research can help marketers to define salespromotion strategies for market penetration. Theproposed model can be further tested by collectingprimary data with respect to customer engagement,branding, service delivery, upselling and affiliatemarketing.
Table 1: Alignment of Innovative Practices with Problems faced by Industry
Sector Problems faced Recommended InnovativePractices in the CasesDiscussed
Oral-Care, FMCG, Lack of Usage, Seasonal Customer Engagement byReal Estate Fluctuation in Sales Sainbury's 'Schoolbags' Promotion
Automotive Technology Obsolescence, Innovative BrandLack of Service Facilities Communication by Audi,
Affiliate Marketing by KFC; OvernightService Facility by Haul-Away TruckSegment
QSR Unable to create Purchase Intent for Premium Promotions of a newthe Foodies Micro-Cleaner by Electrolux to its
dealers; Joining hands in the forecourtwith Petrol Retailers like Shell offeringloyalty schemes
Banking, Consumer Selling Products at a Premium Price Creating Value Proposition in RealElectronics Estate Business
Subhasis Sen and Kannan Rajagopal

IMJ 51
Volume 7 Issue 2 July - December 2015
References
Ballantyne, D., and Richard, J.V. (2006). Creating value-in-use through marketing interaction: The exchange logicof relating, communicating and knowing. MarketingTheory, 6 (3), 335-348.
Beverland, M.(2002). Relationship strategies for market entry:The experience of New Zealand companies in EasternEurope. Journal of East-West Business, 7(4), 55-77.
Bhusan, R.,and Mukherjee, W.(2014, December 8). A slow-moving winter gives the chills to FMCG players. TheEconomic Times, Mumbai, India, p. 5.
Gay, L.R., Mills, E. Mills and Airasian, P. (2008). EducationalResearch: Competencies for Analysis and Applications.NJ: Pearson Education USA.
Gould, R. (2012). Creating the Strategy: Winning and KeepingCustomers in B2B Markets. Kogan Page Ltd. UK.
Hanawalt, E.S.,and Rouse, W.B.(2010). Car wars: Factorsunderlying the success or failure of new car programs.Systems Engineering, 13 (4), 389-404, Wiley PeriodicalsInc.
Hemdev, P.A. (2005). Marlboro - A mini case study. TheMarketing Review, 5 (1), 73-96.
Homburg C., Muller M., and Klarmann M.(2011). Whenshould customer really be king? On the optimum levelof salesperson customer orientation in sales encounters.Journal of Marketing. American Marketing Association,75 (2), 55-74.
Klaus, P. (2015). Measuring Customer Experience. PalgraveMacmillan UK.
Klaus, P., and Maklan, S. (2011). Bridging the gap fordestination extreme sports - A model of sports tourismcustomer experience. Journal of Marketing Management,27(13-14), 1341-1365.
Leadbetter J.(2011). Sales & service excellence - How to Standout from the Crowd. Management Books 2000 Ltd. UK.
Malviya S.(2015, February 3). McD's no match for haldiram'shere. The Economic Times, Mumbai, India, p. 7.
Malviya S.(2015, January 2). Sensitive toothpaste Cos just haveto grin & bear It. The Economic Times, Mumbai, India,p. 7.
Masterson, R.,andPickton, D. (2014). Marketing: AnIntroduction. London: Sage Publications.
Morlay, M. (2014). Understanding Markets and Strategy,Kogan Page Ltd. UK.
Mullin, R.(2010). Sales Promotion. Kogan Page Ltd. UK. 5thEdition.
Murali Krishna, P.V., and Roy Ghatak, A. (2008).Deconstruction of the telecommunications value chainof North American markets. The ICFAI University Journalof Business Strategy, 5 (4), p. 40.
Pandya, K.,andJani, H.J.(2011). Customer satisfaction amongtwo-wheeler users- An Indian experience-with specialreference to motorcycle users. SIES Journal ofManagement, 7 (2), 74-87.
Rankin, S. (2004). Mini case study of product strategy: Thecypher Stent from cordis (A Johnson& JohnsonCompany). The Marketing Review, Westburn PublishersLtd., 4 (2), 211-224.
Samsung Pips Nokia to Become No. 1 in India's HandsetMarket: Voice & Data (2013, August 21).The EconomicTimes, Pune, India, p. 4.
Yeniyurt, S., Townsend, J.D., and Talay, M.B.(2007). Factorsinfluencing brand launch in a global marketplace. TheJournal of Product Innovation Management, ProductDevelopment & Management Association, 24 (5), 471-485.
Subhasis Sen earned his B.Com.(Hons.), MBA, M.Phil, andPhD from University of Calcutta and is associated withSCMHRD, Symbiosis International University Pune (India).His professional interests include Sales and DistributionManagement, Services Marketing, Sports Marketing andStrategic Marketing Decisions. He has published researchpapers in prestigious journals of national and globalrepute.
Kannan Rajagopal earned his B.Sc., MSW, M.Phil,PGDHRM, MBA, and PhD from Bharathiar University(Coimbatore) and is associated with SCMHRD, SymbiosisInternational University Pune (India). His professionalinterests include Brand Management and BusinessMarketing. He has presented research papers in reputedInternational Conferences in India and abroad.
Subhasis Sen and Kannan Rajagopal
IMJ 52
Volume 7 Issue 2 July - December 2015
Abstract
Social media marketing is the latest effective tool fordisseminating marketing related information, increasingconsumer awareness and providing a perception of thesize, reputation and ease of transaction associated withonline stores. Consumers' trust in online stores isinfluenced by messages delivered by the companiesthemselves as well as own social media contacts. Thisresearch paper explores four store characteristics whichmay lead to trust and, in turn, facilitate formation ofwillingness to purchase, electronic word of mouth andsocial capital in consumer's social networks,. Aconceptual model is proposed and tested empiricallywith partial least square. It finds that awareness andabsence of risk significantly influence development oftrust. Social capital and electronic word of mouth (e-WOM) are most influenced by trust, while there is leasteffect of trust on willingness to purchase..
Keywords: Social Media Marketing, Trust, s-Commerce,Social Network Sites
1. Introduction
Online Social Media (OSM) has become a part of ourdaily lives by facilitating flow of information withoutany spatial and temporal barrier. Availability of freeinformation at the right time adds to the charm of socialmedia. Thus, people all over the world are joining socialmedia sites to keep themselves abreast of latestdevelopments and to connect with friends.
Marketers have grabbed this opportunity to connectwith this huge customer base. Companies of varyingsizes have set up their presence on different socialmedia sites to promote their products through online
Role of Trust in Perceived Store Characteristicsand Consumer Behavioural Outcome in theContext of Online Social Media MarketingNirankush Dutta and Anil Bhat
campaigns and drive virtual communities of customers.Thus, Online Social Media Marketing (OSMM) hasevolved as an effective marketing tool over the last fewyears.
OSMM has become more attractive because of thefreedom that emanates through participation of neutralcustomers who voice their support or concern for variousbrands. Although this freedom of speech may backfireon the brands, undoubtedly it gives rise to trustedsources of information. Online stores often attempt toenhance perceived trustworthiness by incorporatingdifferent strategies, which may range from providingtimely and accurate information to assuring theconsumers about the vast variety of available productsat a fair price. There exists a need to understand thevarious factors that help to increase perceivedtrustworthiness of online stores.
Although some of the earlier researchers have identifiedand studied the role of trust in the context ofOSMM(Chow & Shi, 2014; Esmaeili, Mardani, Mutallebi,& Golpayegani, 2015; Gorner, Zhang, & Cohen, 2013;Pentina, Zhang, & Basmanova, 2013), there ishardlyany study that focuses specifically on store specificcharacteristics as antecedents of trust. This researchexplores four store characteristics in the context of onlinesocial networks, aiming to find out their relativeimportance, so that online stores / brands can takeproper measures to effectively utilize them for achievingtheir marketing objectives.
A conceptual model is proposed and empirically testedwith a sample of 150 users of online social network sites(OSN) to investigate the effect of awareness, perceivedreputation, perceived risk and perceived size of an
An Earlier version of the manuscript was accepted for presentation at World Management Conference (WMC) 2015.
Nirankush Dutta and Anil Bhat

IMJ 53
Volume 7 Issue 2 July - December 2015
online store on developing a consumer's willingness topurchase, intention to disseminate electronic word ofmouth (e-WOM) and formation of social capitalmoderated by interpersonal organizational trust. Theresults indicate that awareness and perceived riskinfluence formation of trust. On the other hand, trustacts as a moderator and influences willingness topurchase, e-WOM and social capital. Perceived size andreputation of an online store does not have significantimpact on formation of trust.
2. Theoretical Background, Hypothesis and ResearchModel
2.1 Trust and its Effects
From personal life to business transactions, trust playsa significant role while entering into a transaction.Marketing scholars view trust as a variable whichfacilitates relationships to evolve and change over time(Czepiel, 1990). Because of greater uncertaintiesassociated with e-Commerce transactions compared tothe traditional offline ones, trust becomes even morecritical when consumers enter into such atransaction.This is due to consumers' sense of insecuritycaused by the inability to interact face to face with theonline firm personnel (Bart, Shankar, Sultan, & Urban,2005) or physically check the products they wish topurchase (Grabner-Kräuter & Kaluscha, 2003).
"Trust is a psychological state comprising the intentionto accept vulnerability based on positive expectationsof the intentions or behaviors of another" (Rousseau,Sitkin, Burt, & Camerer, 1998). This type of interpersonaltrust can act as a lubricant to facilitate online purchasedecision. Trust can be affective (wherein customersexhibit willingness to rely on a trustee's competenceand reliability) or cognitive (based on trustee'sbenevolence) (Chang & Chen, 2008). Therefore, trustdevelops when a consumer feels that an online store/brand has the ability, integrity and benevolence toreliably deliver goods and services as expected.
In the impersonal world of e-Commerce, consumersdepend on the faceless store front to act on their behalf(Culnan & Armstrong, 1999). Thus, consumers pick upcues from the online store to validate his belief of trust.
These cues may be in the form of range and variety ofproducts, reputation as is evident from other buyers.Online social networks facilitate dissemination ofinformation about various stores and brands throughthe online stores themselves as well as othercustomers,and thus can help in formation of trust.
In this study, interpersonal trust between an individualand an organization is considered to measure its effectson purchase decision and transmission of e-WOM aswell as formation of social capital.
Willingness to Purchase
Although majority of organizations use social media toinform consumers about their brands, promote onlinecampaigns and create a virtual community (Ernst &Young, 2013), the ultimate objective is definitely toentice the customers to purchase products and services.Consumers, on the other hand, may feel morecomfortable once they have established trust on anorganization through previous interaction, or theperceived characteristics of the firm as evident fromsocial network sites.Earlier researchers have identifiedpurchase intention as one of the most commonconsequences of trust (Ganguly, Dash, Cyr, & Head,2010) in the context of e-Commerce. This study examinesthe effect of trust on willingness to purchase by testingthe following hypothesis.
H1: Interpersonal organizational trust in an online storepositively influences willingness to purchase.
e-WOM
The rules of relationship marketing have been redefinedin the age of social media. Social network sites allowconsumers to build communities around a product ,brand or online store (O'Brien, 2011). They have madecommunication process faster among the participantsof online communities by removing barriers of location,time and access that existed in the earlier traditionalmedia. As consumers post their opinion orrecommendations about an online store or brand throughtheir social network profiles, they may greatly influencetheir contacts in various stages of decision making.Trust plays a vital positive role in spreading e-
Nirankush Dutta and Anil Bhat

IMJ 54
Volume 7 Issue 2 July - December 2015
WOM(Bergeron, Ricard, & Perrien, 2009; Chu & Kim,2011), as consumers spend their valuable time and energyto voluntarily disseminate information.Sichtmann foundthat the likelihood of recommending products or servicesof a company increases proportionately with consumers'trust on it (Cater & Zabkar, 2009; Sichtmann, 2007). Thisleads to formation of the second hypothesis.
H2: Interpersonal organizational trust in an online storepositively influences dissemination of e-WOM.
Social Capital
Social capital refers to the set of resources embeddedin a social network accessed and used by actors withinthat network (Coleman, 1988). Social capital is intangibleand is comprised of shared norms, expectations andobligations that may affect individual behavior. Fromthe consumer behavior perspective, social capital canbe in the form of expectation of valid and relevantinformation from their contacts in social network sites.
Since consumers primarily use OSMs for purposes otherthan marketing, existence of social capital can act as anadded bonus to them. Once consumers feel that thevirtual communities formed around the online storesoffer them more than simple marketing information,they may become loyal to the stores and deliberatelyparticipate in dissemination of more information,resulting in a close knit community. Therefore, onlinestores / brands may consider social capital as one oftheir desired outcomes of participation in OSMM.
Trust plays a critical role among online communitymembers in promoting information and knowledgesharing among members (Chiu, Hsu, & Wang, 2006).Trust facilitates the use of information with increase inperceived credibility and the subsequent higher usageof that information (Nahapiet & Ghoshal, 1998). Hightrust in an organization will speed up the formation ofsocial capital, while absence or low level of trust willact as an impediment. Thus we form the followinghypothesis.
H3: Interpersonal organizational trust in an online storepositively influences the formation of social capital.
2.2 Awareness
Awareness is defined as the ability of a potential buyerto recognize or recall a specific online store. Familiarityor awareness of an online store originates from thenumber of store related experiences that the consumerhas had (Alba & Hutchinson, 1987). This is a functionof the time spent processing information about thestore. Awareness may reduce the effort for informationsearch and give rise to trust. Previous researchers havefound that a company's awareness significantlyinfluences website trust (Cheskin Research & StudioArchetype/ Sapient, 1999; Yoon, 2002). Awareness ofa brand is also expected to influence the level of trust(Banerjee & Banerjee, 2012).Although some researcherssuggest that trust may not be so dependent on awarenessor familiarity (McKnight, Cummings, & Chervany, 1998),we find it more logical to assume that high level ofawareness of an online store will give rise to enhancedinterpersonal trust in it, unless one has anegativeattitude. This leads to the fourth hypothesis.
H4: Awareness of an online store positively affects formationof interpersonal organizational trust on it.
2.3 Perceived Store Reputation
Reputation is a valuable asset that is built with longterm investment of resources, effort and attention tocustomer relationship. Good reputationof storesindicates past forbearance from opportunism (Smith &Barclay, 1997). Stores having good reputation areperceived to have higher cost of untrustworthy behavior,especially in cases where the consumer group can easilyinteract (Axelrod & Hamilton, 1981). The generalperception of reputation of a store influences individualsto form an opinion of trust on it, as reputation istransferable among individuals (Koufaris & Hampton-Sosa, 2004). Earlier studies have found that perceivedreputation of an online store influences trust in it(Yoon,2002).This research attempts to test the same in thesocial media marketing context.
H5: Reputation of an online store in social network sitespositively influences / positively affects formation ofinterpersonal organizational trust on it.
Nirankush Dutta and Anil Bhat

IMJ 55
Volume 7 Issue 2 July - December 2015
2.4 Perceived Store Size
Literature suggests that the perceived size of a store,rather than the actual size, assists consumers in formingtheir impression regarding trustworthiness of a store(Jarvenpaa, Tractinsky, & Vitale, 2000). A buyer usesstore size as an indicator that other consumers believein a particular store to deliver on its promises (Doney& Cannon, 1997). Larger store size also hints that thebusiness has invested considerable assets in establishingitself and has more to lose by going back on its promise.Moreover, a large store should be able to control itsassociates better to ensure customer delight.
Online stores give indicationof their size by showinga variety of product categories available at differentproduct ranges. Many stores resort to paid advertisingin their effort to impress customers with their offerings.Claims of being exclusive dealers of certain brands mayalso act as indirect indicators of the size of an onlinestore. Thus the next hypothesis is formed as below.
H6: An online store's perceived size positively affectsformation of interpersonal organizational trust on it.
2.5 Perceived Risk from Store
Perceived risk can be regarded as a consumer's subjectivefunction of the magnitude of adverse consequences andthe probabilities ofthese consequences occuring if theproduct is acquired (Dowling & Staelin, 1994). Riskperception refers to the "trustor's belief about likelihoodsof gains and losses outside of considerations that involvethe relationships with the particular trustee" (Mayer,Davis, & Schoorman, 1995). In the context of this study,perceived risk embodies certain types of financial risks,product performance, social, psychological, physicaland time risks when consumers make transactions online(Corbitt, Thanasankit, & Yi, 2003).
Some earlier researchers have considered perceivedrisk as an outcome of trust (van der Heijden, Verhagen,& Creemers, 2003), while others have treated risk as theantecedent of trust (Corritore, Kracher, & Wiedenbeck,2003). But researchers have also specified that trust isinterwoven with risks (McAllister, 1995). Trust canreduce perception of risk, whereas the absence ofperceived risk may also affect trust positively (Alam&
Yasin, 2010; Resnick, Zeckhauser, Friedman, &Kuwabara, 2000). Users of OSNs get a perception of riskinvolved with an online store as other users openlyshare their experiences online. The recommendationsand feedback of past users play a significant role in thedevelopment of risk perception towards online stores.
H7: Absence of perceived risk from an online storepositively affects formation of interpersonalorganizational trust on it.
2.6 Conceptual Model
The conceptual model thus developed is illustrated inFigure 1.
The conceptual model illustrates that consumers'willingness to purchase from an online store, spread e-WOM about it or feeling of having obtained socialcapital, are contingent to the store's ability to evoketrust from the consumer. Trust is affected by consumer'sawareness of the store, perceived reputation and sizeof the store as well as perceived absence of risk inentering into a commercial transaction with the store.All these may positively affect the formation of trust.
3. Methodology
3.1 Sample
By using random sampling technique, 150 properresponses were collected to an online survey,over aperiod of two weeks, from students pursuingundergraduate and post graduate courses in a reputeddeemed university in India. This method of datacollection is justified as many students feel a sense ofconfidence and privacy expressing their opinion online.Moreover, online data collection has become popularthroughout the world, as this method is fast, convenientand cost-effective.
The demographic details of the respondents are listedin Table 1. The mean age of the respondents was 23.23years, 33 (22%) being female and the rest male (78%).102 (68%) respondents were pursuing undergraduatestudies, while the rest 48 (32%) were enrolled intopostgraduate courses. This age group of respondentsrepresentthe most active users of various social media
Nirankush Dutta and Anil Bhat
IMJ 56
Volume 7 Issue 2 July - December 2015
and constitutes a major target for e-Commercecompanies. 140 respondents expressed that Facebookwas their preferred social media platform for marketingpurposes.
3.2 Measurement Development
The questionnaire was primarily divided into two parts:demographic variables and construct items. Therespondents were requested to choose their preferredsocial media for marketing purposes (e.g., informationsearch, interaction with brand, dissemination of productrelated information among contacts etc.) from amongFacebook, LinkedIn, Twitter and Google+ as well asanyof the online stores from amongJabong, Myntra, Yebhiand Zovi. They responded to the rest of the surveyagainst this backdrop.
All constructs were adapted from earlier studies. StoreReputation (Jarvenpaa et al., 2000) and Perceived StoreSize (Jarvenpaa et al., 2000) were measured by twovariables. Store Risk Perception (Jarvenpaa et al., 2000)was measured by three variables, Willingness toPurchase (Jarvenpaa et al., 2000) by four variables, StoreAwareness (Bart et al., 2005) by six variables,Interpersonal Organizational Trust (Eastlick & Lotz,2011) by eight variables, Electronic Word of Mouth(Chu, 2009) by 11 variables and Social Capital (Choi,Eldomiaty, & Kim, 2007) by 19 variables. All items weremeasured on a 5-point Likert scale in the range of 1 to5, with 1 denoting "strong disagreement" and 5 conveying"strong agreement".
4. Results
4.1 Descriptive Statistics
Table 2 lists the mean, standard deviation and ChronbachAlpha values of the constructs. Acceptable reliabilityis achieved as is evident from Chronbach Alpha valueof more than 0.7 for all the constructs (Nunnally &Bernstein, 1994).
Table 2 gives the mean, standard deviation, skewness,kurtosis, and Shapiro-Wilk test results for individualindicator items of the constructs. It is evident that thedata is not normal but slightly skewed and kurtotic.
4.2 Analytical Strategy for Assessment of Model
Partial Least Square (PLS) Path Modeling was used foranalysis of data. PLS has become popular because ofits predictive abilities using different explanatoryconstructs (Joe F. Hair, Sarstedt, Ringle, & Mena, 2012).Moreover, it produces fairly accurate results using arelatively small sample size (Haenlein & Kaplan, 2004),without any restriction on multivariate normality (Lowry& Gaskin, 2014). The sample size considered in thisstudy is more than that recommended for the conceptualmodel of this type (Hair, Hult, Ringle, & Sarstedt, 2014).
SmartPLS 2.0 (Ringle, Wende, & Will, 2005) was usedto verify the proposed conceptual model empirically.The model is based on various earlier researches. Theconstructs were measured with the help of reflectiveindicators, except in the case of InterpersonalOrganizational Trust which was measured by formativeconstructs. The collected data contained no missingvalues. Path Weighing Scheme with an initial value of1 for each of the outer weights was applied. Stop Criteriawas set to 0.00001 and maximum iteration was limitedto 300. Bootstrapping was done with 1500 samples withno sign change option.
4.3 Measurement Model
During analysis of thethe measurement models,reflective indicators with outer loadings below 0.4 wereremoved straight away. Reflective indicators with outerloading above 0.4 but below 0.7 were removed in caseswhere the removal resulted in increased compositereliability or average variance extracted (AVE) abovethe threshold value of 0.7 or 0.5 respectively. Indicatorsof Formative Construct- "Interpersonal OrganizationalTrust" with t-Statistics less than 1.96 (5% level ofsignificance) and outer loading below 0.5 were deletedfrom further analysis (Hair et al., 2014). This resultedin the removal of one indicator from Store Awareness,one from Electronic Word of Mouth, one fromInterpersonal Organizational Trust, and eight fromSocial Capital. Thus, only reflective indicators withsufficient individual reliability were considered for theanalysis.
The composite reliability for each construct is more than
Nirankush Dutta and Anil Bhat

IMJ 57
Volume 7 Issue 2 July - December 2015
the acceptable value of 0.7 (Nunnally & Bernstein, 1994),indicating sufficient internal consistency. The AVEwas also more than 0.5 for each construct (Fornell &Larcker, 1981). Thus, adequate convergent validity wasalso ensured.
Moreover, square root of the AVE of each construct washigher than its highest correlation with any otherconstruct (Fornell & Larcker, 1981) (Table 2). Both theseevaluations indicated acceptable discriminant validity.
Evaluation of formative indicators found no existenceof multicollinearity, as tolerance was more than 0.2 andVIF was less than 5 for each of them (Hair et al., 2014).
4.4 Structural model
The structural model is analyzed with the help ofSmartPLS software to test the hypothesized relationshipamong various constructs. The structural model is foundto be free of multicollinearity (Table 2), as Tolerancevalue is more than 0.2 and VIF is less than 5 (Hair etal., 2014).
Trust was found to have a significant impact onWillingness to Purchase (=0.285, p<0.01), ElectronicWorld of Mouth (=0.450, p<0.01), and Social Capital(=0.492, p<0.01). Therefore, H1, H2 and H3 wereaccepted.
Path coefficient of Reputation to Trust and Size to Trustwerenot statistically significant. Thus H5 and H6 couldnot be accepted. On the other hand, the path coefficientsfor Awareness to Trust (=0.249, p<0.05) and Risk toTrust (=0.154, p<0.05) were found to be significant.Thus, H4 and H7 were accepted. Figure 1 depicts thestructural model with its path loading.
The four antecedents of trust account for 15.9% of itsvariance. Trust alone accounts for 24.1% variance ofSocial Capital and 20.1% variance of Electronic Wordof Mouth. But only 8.3% variance of Willingness toPurchase can be accounted for by InterpersonalOrganizational Trust. It should be noted that in consumerbehavior research R2 values of 20% can be consideredas high (Hair et al., 2014). Hence, the analysis foundthe effect of Trust on e-WOM and Social Capital quitesignificant.
5. Discussion and Conclusion
5.1 Discussion
This study attempts to explore the effects of fourperceived store characteristics on interpersonalorganizational trust, which in turn acts as a mediatorin the formation of willingness to purchase, e-WOM andsocial capital in the context of online social networks.Although trust is one of several reasons that may affectthese outcomes, undeniably it is a vital component.
This study finds that trust developed through OSMMactivities of a store influences e-WOM and social capitalmore than the formation of willingness to purchase. Tillnow, companies too have been focusing more on usageof social media marketing for spreading positive wordof mouth through online campaigns and building virtualcommunity of consumers. Thus, the findings of thisstudy provide empirical evidence in support of mostof the marketers.
Although awareness of online store and perceivedabsence of risk are significant in building trust towardsthe store, it is found that awareness is more importantof the two, as indicated by higher Total Effect exhibitedby it (Awareness to EWOM: 0.112; Awareness to SocialCapital: 0.129).
5.2 Practical Implications
This research has direct practical bearing on brands andstores using social media marketing. Online socialnetworks facilitate formation of trusts by disseminatinginformation from various sources and providing variouscues to the prospective consumers. Online stores alsoutilize these networks to grab customer's positiveattention. In doing so, they try to enhance customer'sawareness about the store, and provide a feeling ofbeing large and reputed.
But in the emerging world of OSMM, it seems that brandreputation or size is no more important to build trust.This is quite evident with the emergence of online storeswhich compete with the established brands. Sincecustomers can browse online catalogues of stores fromthe comfort of their desk at home or at work, they areless concerned about the size of the store. Visiting
Nirankush Dutta and Anil Bhat

IMJ 58
Volume 7 Issue 2 July - December 2015
different stores online takes the same time as visitinga single store. What matters more is the availability ofproducts and the assurance that quality of the productwould meet the expectations at the given cost.
Moreover, customers may also perceive reputedestablished brands and upcoming stores withindifference. Since the e-Commerce space is witnessinga lot of competition to grab new customers, online storesoften provide heavy discounts, especially during theinitial days. Customers areprobably aware of thisphenomenon. Thus they may trust and willingly go toa less reputed smaller store than spend more for thesame product in a big online store. This finding pointsto the fact that OSM may have emerged as a strongplatform to build online reputation. It is also quitepossible that consumers are not able to distinguishbetween reputed stores and not-so-reputed ones whichpromote themselves through OSMM. Thus, unlike earlieroffline businesses or even e-Commerce, in OSMMreputation does not play a significant role in evokingconsumer trust.
In these circumstances increasing customer awarenessis the main challenge facing the social media marketers.Since social media marketing provides a very cost-effective platform for communication, even smallercompanies can take advantage of it to win the big battleof customer acquisition. Devising a proper social mediamarketing strategy and implementation of the same canonly help online stores to increase customer awarenessand be perceived as more trustworthy. The PLS analysisreveals that availability of products of good quality inan online store is the most important influencer in theformation of positive attitude towards a store. A properlymaintained online social network page of a store is thesecond most important criteria for formation of positiveattitude towards the store.
Online stores should emphasize on being perceived asless risky through their messages. The analysis indicatesthat customers estimate likelihood of making a goodbargain by buying from an online store as the mostimportant indicator of perceived risk. Stores whichprovide good value for money are probably perceivedas more trustworthy because of the lower monetary riskassociated. This also shows that customers are valueconscious and may ignore reputed brands in favour of
emerging ones if they provide good value for money.
The analysis also finds that trust plays the mostimportant role in forming social capital in the contextof social media marketing. Customers expect to getvaried information from their trusted sources. Thus,companies should focus on providing a holisticexperience to customers and encourage their evangeliststo form a dense virtual community, rather than restrictingcommunication to offerings of the store only. Customerslike to know what different people think about somethingof their interest and they want to feel part of a largercommunity. Online stores should therefore focus onthese attributes to become successful in social mediamarketing.
Online stores can measure the success of their socialmedia campaigns by the extent of dissemination of theircontent through e-WOM. Consumers who trust onlinestores willingly spread positive e-WOM andrecommendation of their network contacts to theirfriends online. Customers also ask for opinion aboutnew products in OSMs. Online stores should thereforestrive to disseminate relevant information in a timelymanner.
The analysis reveals that willingness to purchase is leastinfluenced by trust. Nevertheless, interpersonalorganizational trust in an online store is significant inthe formation of this attitude. This research finds thatafter development of trust in an online store, customersare more likely to make a purchase from it within thenext three months, if they have money to buy a productthey need and it is available from the trusted store. Still,it may be difficult to measure customer's trust on a storethrough purchase behavior alone. Moreover, OSMM isstill at a nascent stage as a platform for direct buying.Although platforms such as, Facebook, Google Plus,Twitter and Pinterest, have been trying to integratepurchase options, they have not been successful inimplementing the same ona larger scale till now.Companies should thus focus on other metrics thanincrease in sales volume while calculating the successof their social media marketing campaigns.
5.3 Limitation and Scope for Further Research
The present study explores the effect of online storecharacteristics on formation of three outcomes where
v

IMJ 59
Volume 7 Issue 2 July - December 2015
interpersonal organizational trust acts as a mediator.This has been done with the help of four Indian onlineretailers of fashion and accessories. This category waschosen as it is one of the fastest growing segments inthe Indian e-Commerce space. Also, the respondents ofthe survey conducted were expected to be more familiarwith online stores in this domain.
But the e-Commerce space is sprucing up with differentproducts from grocery to real estate. Attitude formationprocess for stores operating in this vast product rangemay also be different. Future research should thereforefocus on products of different categories which areexpected to give rise to varying levels of involvement.
The five store characteristics together account for 17.2percent variance explained for interpersonalorganizational trust. This indicates that there are otherfactors which may influence formation of trust in OSMMcontext. This may be related to social networking
characteristics, personal characteristics or a user'sinteraction characteristics etc. Future research shouldfocus on finding the effect of these differentcharacteristicsto explore other dimensions which affecttrust and its outcomes.
Although the sample size collected for this study issufficient for PLS path modeling, a larger sampleconsisting of information from user group with varieddemographic profiles may be considered for futureresearch.
The present study attempts at development of theoryand prediction of constructs. Once other antecedents ofinterpersonal organizational trust in the context ofOSMM are developed, the evolved theory can be testedand confirmed after comparison with existing alternativetheories through the use of covariance based structuralequation modeling?
Nirankush Dutta and Anil Bhat
6. Appendix
Table 1: Demographic Details
Age No. of Respondents
Below 20 years 30
20 - Below 25 years 75
25 - Below 30 years 29
30 years and above 16
Gender
Male 117
Female 33
Education
Undergraduate 102
Postgraduate 48
Daily Internet Usage Duration
Less than 1 hour 5
Less than 2 hours 27
Less than 3 hours 24
Above 3 hours 94

IMJ 60
Volume 7 Issue 2 July - December 2015
Tabl
e 2:
Des
crip
tive
Sta
tist
ics
Sr.
MS
DC
AC
R1
23
45
67
8N
o.
1In
terp
erso
nal
Org
aniz
atio
nal
Tru
st3.
230
0.83
50.
730
---
0.94
1
2St
ore
Aw
aren
ess
3.82
20.
861
0.78
60.
839
0.40
30.
718
3St
ore
Rep
uta
tion
4.21
50.
747
0.73
60.
841
0.63
40.
563*
*0.
854
4St
ore
Ris
k P
erce
pti
on3.
350
1.05
80.
926
0.95
20.
227
0.18
4*0.
295*
*0.
932
5P
erce
ived
Sto
re S
ize
3.72
50.
858
0.79
80.
907
0.41
80.
376*
*0.
547*
*0.
226*
*0.
910
6E
lect
ron
ic W
ord
of
Mou
th3.
391
0.94
30.
884
0.92
70.
279
0.22
0**
0.31
8**
0.17
9*0.
161*
0.74
8
7W
illi
ngne
ss t
o P
urc
hase
3.69
01.
081
0.87
60.
918
0.49
60.
254*
*0.
453*
*0;
.284
**0.
294*
*0.
258*
*0.
858
8So
cial
Cap
ital
3.61
30.
924
0.88
20.
919
0.29
00.
233*
*0.
289*
*0.
122
0.14
10.
488*
*0.
279*
*0.
714
Not
e:N
o. o
f re
spon
den
ts =
150
Dia
gona
ls r
epre
sent
squ
are
root
of
AV
EIn
terp
erso
nal
Org
aniz
atio
nal
Tru
st i
s a
form
ativ
e co
nstr
uct
Sign
ific
ance
at
** 0
.01,
* 0
.05
M i
s M
ean,
SD
is
Stan
dar
d D
evia
tion
, C
A i
s C
ronb
ach
Alp
ha a
nd S
R i
s C
omp
osit
e R
elia
bili
ty
Nirankush Dutta and Anil Bhat
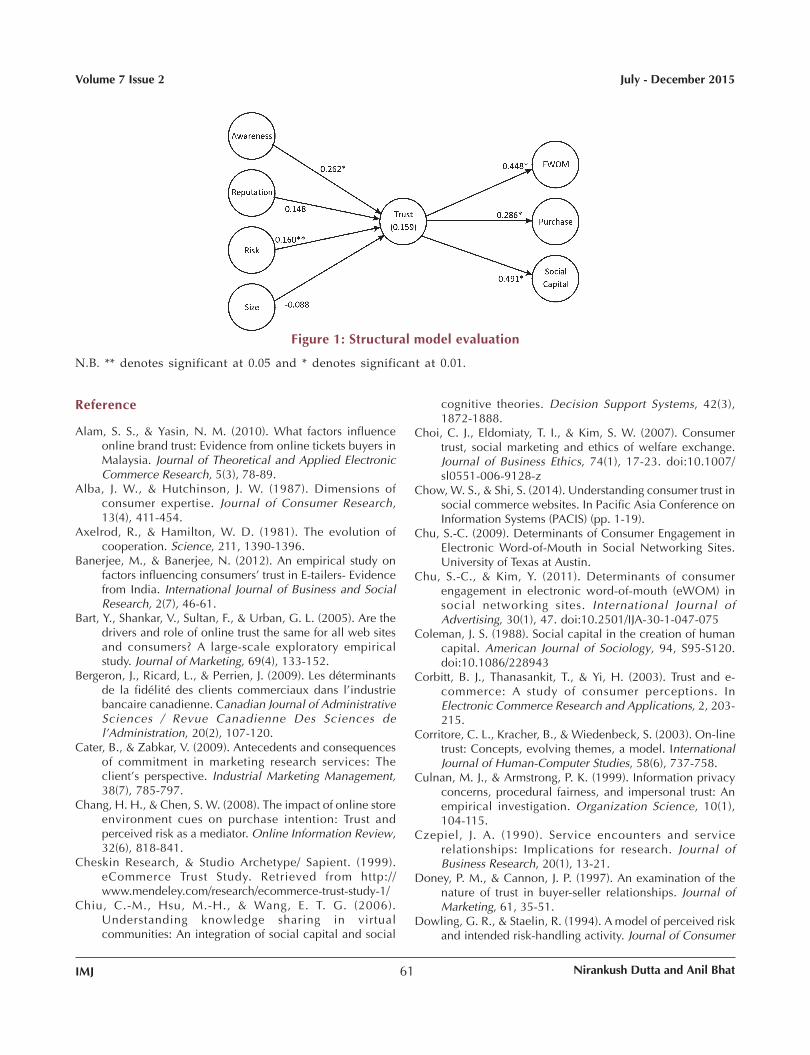
IMJ 61
Volume 7 Issue 2 July - December 2015
Reference
Alam, S. S., & Yasin, N. M. (2010). What factors influenceonline brand trust: Evidence from online tickets buyers inMalaysia. Journal of Theoretical and Applied ElectronicCommerce Research, 5(3), 78-89.
Alba, J. W., & Hutchinson, J. W. (1987). Dimensions ofconsumer expertise. Journal of Consumer Research,13(4), 411-454.
Axelrod, R., & Hamilton, W. D. (1981). The evolution ofcooperation. Science, 211, 1390-1396.
Banerjee, M., & Banerjee, N. (2012). An empirical study onfactors influencing consumers' trust in E-tailers- Evidencefrom India. International Journal of Business and SocialResearch, 2(7), 46-61.
Bart, Y., Shankar, V., Sultan, F., & Urban, G. L. (2005). Are thedrivers and role of online trust the same for all web sitesand consumers? A large-scale exploratory empiricalstudy. Journal of Marketing, 69(4), 133-152.
Bergeron, J., Ricard, L., & Perrien, J. (2009). Les déterminantsde la fidélité des clients commerciaux dans l'industriebancaire canadienne. Canadian Journal of AdministrativeSciences / Revue Canadienne Des Sciences del'Administration, 20(2), 107-120.
Cater, B., & Zabkar, V. (2009). Antecedents and consequencesof commitment in marketing research services: Theclient's perspective. Industrial Marketing Management,38(7), 785-797.
Chang, H. H., & Chen, S. W. (2008). The impact of online storeenvironment cues on purchase intention: Trust andperceived risk as a mediator. Online Information Review,32(6), 818-841.
Cheskin Research, & Studio Archetype/ Sapient. (1999).eCommerce Trust Study. Retrieved from http://www.mendeley.com/research/ecommerce-trust-study-1/
Chiu, C.-M., Hsu, M.-H., & Wang, E. T. G. (2006).Understanding knowledge sharing in virtualcommunities: An integration of social capital and social
cognitive theories. Decision Support Systems, 42(3),1872-1888.
Choi, C. J., Eldomiaty, T. I., & Kim, S. W. (2007). Consumertrust, social marketing and ethics of welfare exchange.Journal of Business Ethics, 74(1), 17-23. doi:10.1007/sl0551-006-9128-z
Chow, W. S., & Shi, S. (2014). Understanding consumer trust insocial commerce websites. In Pacific Asia Conference onInformation Systems (PACIS) (pp. 1-19).
Chu, S.-C. (2009). Determinants of Consumer Engagement inElectronic Word-of-Mouth in Social Networking Sites.University of Texas at Austin.
Chu, S.-C., & Kim, Y. (2011). Determinants of consumerengagement in electronic word-of-mouth (eWOM) insocial networking sites. International Journal ofAdvertising, 30(1), 47. doi:10.2501/IJA-30-1-047-075
Coleman, J. S. (1988). Social capital in the creation of humancapital. American Journal of Sociology, 94, S95-S120.doi:10.1086/228943
Corbitt, B. J., Thanasankit, T., & Yi, H. (2003). Trust and e-commerce: A study of consumer perceptions. InElectronic Commerce Research and Applications, 2, 203-215.
Corritore, C. L., Kracher, B., & Wiedenbeck, S. (2003). On-linetrust: Concepts, evolving themes, a model. InternationalJournal of Human-Computer Studies, 58(6), 737-758.
Culnan, M. J., & Armstrong, P. K. (1999). Information privacyconcerns, procedural fairness, and impersonal trust: Anempirical investigation. Organization Science, 10(1),104-115.
Czepiel, J. A. (1990). Service encounters and servicerelationships: Implications for research. Journal ofBusiness Research, 20(1), 13-21.
Doney, P. M., & Cannon, J. P. (1997). An examination of thenature of trust in buyer-seller relationships. Journal ofMarketing, 61, 35-51.
Dowling, G. R., & Staelin, R. (1994). A model of perceived riskand intended risk-handling activity. Journal of Consumer
Figure 1: Structural model evaluation
N.B. ** denotes significant at 0.05 and * denotes significant at 0.01.
Nirankush Dutta and Anil Bhat

IMJ 62
Volume 7 Issue 2 July - December 2015
Research, 21(1), 119.Eastlick, M. A., & Lotz, S. (2011). Cognitive and institutional
predictors of initial trust toward an online retailer.International Journal of Retail & DistributionManagement, 39(4), 234-255.
Ernst & Young. (2013). Social Media Marketing: India TrendsStudy 2013.
Esmaeili, L., Mardani, S., Mutallebi, M., & Golpayegani, S. A.H. (2015). Studying the affecting factors on trust in socialcommerce. International Journal of Advanced Studies inComputer Science and Engineering, 4(6), 41-46.
Fornell, C., & Larcker, D. F. (1981). Structural equation modelswith unobservable variables and measurement error:Algebra and statistics. Journal of Marketing Research, 18,382-388.
Ganguly, B., Dash, S. B., Cyr, D., & Head, M. (2010). Theeffects of website design on purchase intention in onlineshopping?: The mediating role of trust and the moderatingrole of culture. International Journal of ElectronicBusiness, 8(4/5), 302-330.
Gorner, J., Zhang, J., & Cohen, R. (2013). Improving trustmodeling through the limit of advisor network size anduse of referrals. Electronic Commerce Research andApplications, 12(2), 112-123.
Grabner-Kräuter, S., & Kaluscha, E. a. (2003). Empiricalresearch in on-line trust: a review and critical assessment.International Journal of Human-Computer Studies, 58(6),783-812.
Haenlein, M., & Kaplan, A. M. (2004). A beginner's guide topartial least squares qnalysis. Understanding Statistics,3(4), 283-297.
Hair, J. F., Hult, J. G. T. M., Ringle, C. M., & Sarstedt, M. (2014).A Primer on Partial Least Squares Structural EquationModeling (PLS-SEM).
Hair, J. F., Sarstedt, M., Ringle, C. M., & Mena, J. a. (2012). Anassessment of the use of partial least squares structuralequation modeling in marketing research. Journal of theAcademy of Marketing Science, 40(3), 414-433.
Jarvenpaa, S. L., Tractinsky, N., & Vitale, M. (2000). Consumertrust in an Internet store. Information Technology andManagement, 1, 45-71.
Koufaris, M., & Hampton-Sosa, W. (2004). The development ofinitial trust in an online company by new customers.Information & Management, 41(3), 377-397.
Lowry, P. B., & Gaskin, J. (2014). Partial Least Squares ( PLS )Structural Equation Modeling ( SEM ) for building andtesting behavioral causal theory?: When to choose It andhow to Use It. IEEE Transactions on ProfessionalCommunication, 57(2), 123-146.
Mayer, R., Davis, J., & Schoorman, F. (1995). An integrativemodel of organizational trust. Academy of ManagementReview, 20, 709-734.
McAllister, D. J. (1995). Affect- and cognition-based trust asfoundations for interpersonal cooperation inorganizations. Academy of Management Journal, 38(1),24-59.
McKnight, D. H., Cummings, L. L., & Chervany, N. L. (1998).Iinitial trust formation in new organizational
relationships. Academy of Management Review, 23, 473-490.
Nahapiet, J., & Ghoshal, S. (1998). Social capital, intellectualcapital, and the organizational advantage. Academy ofManagement Review, 23, 242-266.
Nunnally, J. C., & Bernstein, I. (1994). Psychometric Theory.rdsepiucsforg (Vol. 3).
O'Brien, C. (2011). The emergence of the social mediaempowered consumer. Irish Marketing Review, 21(1),32-40.
Pentina, I., Zhang, L., & Basmanova, O. (2013). Antecedentsand consequences of trust in a social media brand: Across-cultural study of Twitter. Computers in HumanBehavior, 29(4), 1546-1555.
Resnick, P., Zeckhauser, R., Friedman, E., & Kuwabara, K.(2000). Reputation Systems. Communications of theACM, 43(12), 45-48.
Ringle, C. M., Wende, S., & Will, A. (2005). SmartPLS 2.0.M3.Hamburg: SmartPLS. Retrieved from http://www.smartpls.de
Rousseau, D. M., Sitkin, S. B., Burt, R. S., & Camerer, C. (1998).Not so different after all: A cross-discipline view of trust.Academy of Management Review, 23(3), 393-404.
Sichtmann, C. (2007). An analysis of antecedents andconsequences of trust in a corporate brand. EuropeanJournal of Marketing, 41(9/10), 999-1015.
Smith, J. B., & Barclay, D. W. (1997). The effects oforganizational differences and trust on the effectivenessof selling partner relationships. Journal of Marketing,61(1), 3.
van der Heijden, H., Verhagen, T., & Creemers, M. (2003).Understanding online purchase intentions: contributionsfrom technology and trust perspectives. European Journalof Information Systems, 12(1), 41-48.
Yoon, S.-J. (2002). The antecedents and consequences of trustin online-purchase decisions. Journal of InteractiveMarketing, 16(2), 47-63.
Nirankush Dutta, a Doctoral Research Fellow from BITSPilani, holds a Bachelor of Engineering degree inInformation Technology and a Post Graduate Diploma inBusiness Management. His research papers have beenaccepted in several international conferences andinternational journals. His case studies have beenpublished by Ivey, Emerald and HEC Montreal. His interestlies in social media marketing.
Anil Bhat, a Mechanical Engineering graduate from RECSrinagar, Fellow of IIM Bangalore and member of Academyof Management, specializes in Marketing Research andis presently Professor and Head of ManagementDepartment at BITS Pilani (Pilani Campus). He has morethan fifty publications to his credit and has served as amanagement expert in Union Public Service Commission.He has co-authored a book on management publishedby Oxford University Press.
Nirankush Dutta and Anil Bhat

IMJ 63
Volume 7 Issue 2 July - December 2015
Abstract
Customer Delight refers to a phenomenon when theneeds and desires of customers are not only met butexceed their expectations. There is a paradigm shift inconcept from satisfied customers to delightedcustomers.The main aim of Customer Relationship Managementis understanding customer needs and effectivelyresponding to them is a great way to build a strongrelationship. Now a days when initiatives are beingtaken to reach the masses, the concept of CustomerService is a concern among service providers, especiallyBanks and Insurance companies. This study aims atfinding whether the banks and insurance companieshave incorporated the similar components to attaincustomer delight. Furthermore, the study measures andcompares the perception of customers in the customerservice practices of the two sectors.
In order to access the service levels of Banking andInsurance sector, primary data was collected by usingself-designed questionnaire. Three factors of CustomerService, Empathy, Responsiveness and Tangibles, wereselected for the purpose of the study and respondents'score was measured for these factors. For the Insurancesector, empathy and tangibles emerged as the mostsignificant constructs to create a significant differencewith the Banking sector.
Keywords: Customer delight, CRM, Customer service,Empathy, Responsiveness, Tangibles.
1. Introduction
Customer relationship management (CRM) is anintegrated business approach that tries to collaborateemployees with the process and technology so as toimprove an organization's relationship with its existingand prospective customers. The aim of any business is
Way to Customer Delight- Interpreting the Role ofDimensions of Service Quality for Effective CRMin Banking and Insurance SectorsCharu Upadhyaya and V.K Jain
to attain the market demands and cater the needs ofits customers, CRM helps business to achieve this aimin a highly competitive environment. CRM is an ongoingcycle consisting of segmentation and lead analysis,customer service and customer retention.
Service quality, a major component of CRM strategy,is a reflection of organizational performance and is theultimate measure of customer's satisfaction, especiallyin the services sector which tries to retain customersfor life. Quality service ideates strong personalassociation with the customers. A strong associationleads an enterprise to attain greater heights. As anemotional association is developed, it becomes easierfor any organization to determine the real demands ofits customers and to maintain a strong relation withthem. Over the years the product life cycle concept hashelped in developing the theory of customer life cyclewhere the focus is on the designing the services in sucha manner that not only the present needs are determinedbut also companies can cater to the future needs ofexisting customers. (Panda, 2003).
It is found from customers across the globe that theyhave become more demanding when it comes to qualityof services; hence there is an increase in the requirementsfor higher quality service (Sin et al., 2005). Thus, inorder to sustain competitive advantage service sectorssuch as banks and insurance are obliged to provideexcellent services to their customers. Now a days, withthe advent of technology and global competition, theenvironment in which the companies operate has becomevery dynamic. Thus, in order cope up with the dynamicenvironment with a focus on maintaining long termrelations with customers, banks and insurancecompanies also design several market strategies tobenefit the customers with high end delivery of services(Eisingerich et al., 2006).
Charu Upadhyaya and V.K Jain

IMJ 64
Volume 7 Issue 2 July - December 2015
Now a days banks and insurance companies have tobe at par, they should be committed to provide excellentcustomer service which will help them to have satisfiedcustomers, and play a major role in the financial sectorthat is growing and diversifying (Balachandran, 2005).It is observed in the last few years that there has beena considerable change in the way the service sectoroperates. Today's customers demand services of highquality from banks and insurance organizations. Withmultiple choices available, customers will look for thebest. Banks as well as insurance companies have realizedthat they need to meet that increasing expectations ofcustomers. Hence, by delivering effective quality ofservices, banks and insurance companies can cope upthe dynamism where, the role of technology would bethe most important aspect.
In order to fully tap customer potential, the challengeis to keep pace with the changing needs of the customersand to provide them with the best service at the righttime and at the best price. To meet these challenges,there is a need to access the highest level of servicequality in both the sectors. With the advent ofmultinationals, the competition is also increasingbetween the banking and insurance sectors. This studyis undertaken to highlight the prominent factors inenhancing service quality levels for both sectors and todraw a comparison between them.
This study will help to depict a clear picture of howfactors considered for the study, includingresponsiveness, empathy and tangibles, play animportant role in maintaining relationships for thesectors. Also, a clear comparison based on these factorswould help in determining the level of adoption ofcomponents of CRM in both sectors and thus, wouldhelp the sectors in analyzing their performance todevelop a better CRM strategy.
2. Literature Review
2.1 Status of CRM in Banking and Insurance Sectors
Browne and Hoyt (1995) conducted a study in the areaof insurance sector where he found that though thebanks and insurance are separate entity but soon thebanks are going to be involved into non-bankingactivities, it would be beneficial to both as banks have
huge customer data and contacting these customer soas to expand their business, it will allow the entry ofinsurers into the banks base. Although, the responseof bank customers towards insurance products has notbeen appreciated, this might be because of the riskelement involvement in insurance business. It is alsosuggested by the author for banks to continue theirinvolvement in the insurance products as it will involveonly an incremental cost to their business.
Nath et al. (2009) conducted a study for comparing CRMadoption amongst Banking and Insurance sector. It wassuggested in the research that in order to improvecustomer satisfaction, organization must provide theiremployees with greater job satisfaction and motivationto help them in serving the customers better. Thisenhances the overall customer relationship management.Second, they pointed out that organizations shouldmake the customers aware of the importance ofmaintaining good relationship which will in turn helpthem in gaining more benefits from the organization.It was also highlighted in the research that there aremany organizations which have partially inculcated, orare at the designing stage of integrating thecommunication channels with the customers so as tomaintain and deepen customer relationship in thiscompetitive era. This will help in developing trust andassurance between the customer and the organizationwhich will definitely be beneficial to both the parties.
Fagbemi and colleagues (2011) conducted a study tocompare CRM implementation between banks andinsurance companies in Nigeria. It was found in thestudy that although both banks and insurance haveimplemented CRM practices but their method to achieveCRM differs in many ways. In order to effectively managethe relationship with customers many variables of CRMwere studied in the research. It was suggested thatattitude of employees towards customers should befriendly, high end technological tools should be usedto track the customer information, high service qualityshould be delivered to the customers. It is also foundthat all these factors together lead to high customercommitment which ultimately results into effectiverelationship management.
A Report by Delloitte (2011) mentioned that theawareness levels of insurance offerings are low as
Charu Upadhyaya and V.K Jain

IMJ 65
Volume 7 Issue 2 July - December 2015
compared to banking products, except for products likemotor insurance where insurance is mandatory. Evenwhen awareness of insurance products exists, theperceived value of buying insurance remains low forreasons like high expectations on returns (which otherfinancial products may offer) and the belief that riskcoverage is not needed. Hence, insurance remains a"push" rather than a "pull" product in India. Even amongthose who buy insurance, the lapse ratios are high(average ~25% lapse ratio for top 13 players as per IRDA2010 annual report) and many buyers lose interest dueto mismatch between expected returns and actualbenefits. It is suggested that players would primarilyneed to innovatively improve two aspects of business- value proposition to customers (to improve customeracquisition) and operational performance (to improveprofitability).
Thus from literature it is clear that banking and insurancesectors are now collaborating and over the years therehas been a significant difference in the way customerservice is managed by corporates. With the changingtimes and latest technological advancement, the conceptof customer relationship management has also changed.Now the customers are more demanding and they wantservice that is more than their expectations i.e., theywant to be delighted. Thus, in order have delightedcustomers it is necessary to measure the current servicelevels and to find new avenues to maintain customers'interest with the organization.
Further review reflects the important factors of CRMstudied by various researchers over the years. Althoughthere are several factors that were studied earlier, inthe context of service quality, the prominent factorsconsidered for the study are Reliability, Empathy andTangibles. (Table 1)
2.2 Factors Considered for the Study
2.2.1 Responsiveness
Responsiveness here is referred with respect toemployee's attitudes and behiour towards customers.If the employees are willingly providing quick servicesto the customers, then they are said to be responsivetowards them. it is generally observed in service sector
that customers are very sensitive to employees' behavior,especially in the Banking and Insurance industries(Brown and Mitchell, 1993). A study conducted byGollway and Ho in 1996 revels that in order to achievebetter service quality for customers there should be acorrect match between staff skills and customers'expectations. Another study states that the importantcomponents of service quality are service recovery andproblem solving (Hart et al., 1990; Swanson and Kelley,2001). Another study to compare the Islamic bankingmeasured the level of quality of service and customersatisfaction in Malaysia. It was found in the study thatresponsiveness emerged as the most important factorof service quality (Nelson, 2006).
2.2.2 Empathy
This dimension shows the magnitude of caring andindividual attention given to customers. In the Bankingand Insurance industry the two important aspects forenhancing performance are customer care and individualattention. Empathy has emerged out as an importantdimension of service quality preferred by bankcustomers (Jabnoun & Al-Tamimi, 2003). Many studiesresults show that if the employee is commitment todeliver quality services and is skilfully handles conflictsif any and is together efficiently delivers services thenit will lead to long term benefits for the organizationas it would resulted in satisfied customers (Nelson &Chan, 2005).
2.2.3 Tangibles
Tangibles encompasses of the physical amenitiesavailable at the premises which are designed to facilitatethe customers in the best possible way.This may includefeatures like presence of service desk, sitting space andother physical aspects to facilitate the customers.Tangibles has found to be preferred by customers andis an important dimension of service quality in UAEBanking industry (Jabnoun & Al-Tamimi, 2003).
As all the above factors are important determinants ofservice quality level, these factors are measured for boththe sectors for the purpose of comparison.
Charu Upadhyaya and V.K Jain

IMJ 66
Volume 7 Issue 2 July - December 2015
3. Hypothesis
In order to analyze the factors affecting Customer Servicein Banking Sector, the following hypotheses wereproposed.
H1: There is a significant difference in the level ofresponsiveness between Banking and Insurance Sectors.
H2: There is a significant difference in the level of empathybetween Banking and Insurance sectors.
H3: There is a significant difference in the level of tangiblesbetween Banking and Insurance sectors.
4. Research Methodology
In order to measure the level of service quality and itscomponents in banking and insurance sectors, primarydata was collected by using self-designed and standardstructured questionnaire. As the purpose of the studyis to measure customer satisfaction about the servicesprovided by the two sectors, primary data collectingtool is used for this study. The sample size selected forthe study was 500; hence, questionnaire is selected asa tool for collecting data. The questions in thequestionnaire tried to identifythe factors of ServiceQuality prevalent in Banking and Insurance Sectors.
Also, discussions with some experts in the Insuranceindustry were conducted to show them the factors whichto be used in the study. After the discussions all theconsidered factors were accepted. After finalizing thefactors, the questionnaire of these researches wascombined and further amendments done in thequestionnaire.
5. Data Analysis
5.1 Descriptive Statistics
In order to measure the level of Service Qualitycomponents in Banking and Insurance Sectors, meanvalue was computed for individual factors constitutingService Quality including, Tangibles, Empathy andResponsiveness. The mean values of individual factorswere computed on a scale of 1 to 5. The values arepresented in Table 2.
It can be seen from the Table 2 that there exists a
significant level of Responsiveness, Empathy andTangibles for Banking and Insurance Sectors as themean value for all the parameters is more than 3.Moreover standard deviation is also minimal in all thecases. Here, N represents number of responses whichare 459 in case of Insurance sector and 469 in case ofBanking Sector. Further, to measure the relationship ofthese factors with each other, correlation was appliedon the data collected.
5.2 Correlation Statistics (Table 2)
Service Quality and Empathy (.857); the major factorcontributing to it is the effectiveness of employees inhandling in grievances, willingness to help the customersby providing then with necessary guidance anddelivering prompt service.Further, there also exists astrong association between Service Quality andTangibles ( .716); customers find the overallinfrastructural facilities of their insurance companiesappealing and the presence of help-desk is also ratedhigh in terms of satisfaction quotient. Lastly, theassociation of Responsiveness with Service Quality isfound to be moderately positive (.084) which is notsignificant. This is mainly because of the fact that teamvisits are less, the real time- response to customer queriesis also not satisfactory.Level of response to customercomplaints is also found to be a prominent factor fora non-significant correlation. Hence, it can be said thatService Quality increases as the level of Tangibles andEmpathy increases for the Insurance Sector. (Table 2)
It can be clearly seen from the Table 2 that there existsa significant level of positive correlation between ServiceQuality and Reliability ( .883);the major factorcontributing to it is the respect for customers from theemployees which leads to satisfactory behavior, timelyexecution of services and the presence of well trainedand motivated staff. Further, there also exists a strongassociation between Service Quality and Empathy (.874).Customers find the services to be prompt; also,employees are willing to help the customers and providethem necessary guidance. Lastly, the association ofTangibles with Service Quality is found to be positive(.819) which is significant. This is mainly because theoverall infrastructural facilities are appealing, premisesare well maintained and the presence of help-desk is
Charu Upadhyaya and V.K Jain
IMJ 67
Volume 7 Issue 2 July - December 2015
rated high in terms of satisfaction quotient. Hence, itcan be said that Service Quality increases as the levelof Tangibles, Empathy and Responsiveness increasesfor the Banking Sector.
5.3 Regression Statistics (Table 3)
a. Dependent Variable: Service Quality in InsuranceSector (SQI)
Hence, the regression equation:
SQI= -.482 + .045 REI+ .621 EMI + .433TGI.
Since the value of slope for Responsiveness (RE),Empathy (EM) and Tangibles (TG) is positive, we cansay that there is a positive impact of these factors onService Quality. The constant value is small and negative(-.482) which shows that the three factors are importantdeterminants of Service Quality for the Insurance Sectoras they carry high weightage. It can also be depictedthat Empathy has a higher impact on Service Qualityas its coefficient value is more than Tangible andResponsiveness coefficients. (Table 4)
a. Dependent Variable: Service Quality in BankingSector (SQB)
Hence, the regression equation:
SQB= -.107 + .015 REB + .626 EMB + .369TGB
Since the value of the slope for Responsiveness, Empathyand Tangibles is positive, we can say that there is apositive impact of these factors on Service Quality. Theconstant value is small and negative (-.107) which showsthat the three factors are important determinant ofService Quality for the Banking Sector as they carry highweightage. Similar to the case of Insurance Sector, thevalue of Empathy has a higher impact on Service Qualityas its coefficient value is more than Tangible andResponsiveness coefficients.
Further, in order to compare the level of Service Qualitybetween Banking and Insurance Sectors Z Test wasapplied on the data collected which resulted in thefollowing,
5.4 Z Statistics5.4.1 Z score for Tangibles
It can be inferred from the results for Tangibles
(Table 4) that the value of two tail z test is -2.10116 whichis under the rejection area, and is more than |z| = 1.96,hence the null hypothesis, for Tangibles stands rejected.Also, P value is .03 which is less than the significancevalue .05, hence, the null hypothesis gets rejected andthe alternate hypothesis is accepted.
Since the mean value of Tangibles for Insurance Sector(3.969) is higher than Banking sector (3.878), it can besaid that Insurance Sector is operating with differentlevels of infrastructural amenities, because of whichthere is a difference in the level of service quality betweenthe two sectors. The major areas where Insurance sectorscores more than Banking sector in terms of mean valueare found to be -maintenance of premises, spaciousoffices and presence of help desk; thus, the overall scorefor infrastructural facilities inInsurance companiesisfound to be more than Banks.
5.4.2 Z score for Empathy
It can be inferred from the Empathy results(Table 4) that the value of two tail z test is -5.043052which is under the rejection area, and is greater than|z| = 1.96, hence the null hypothesis, for Empathy isrejected and the alternate hypothesis gets accepted.This indicates that there is significant difference in thelevel of Empathy between the two sectors.
The major areas where Insurance sector scores morethan Banking Sector in terms of mean value are foundto be effectiveness of employees in handling customergrievances, their willingness to help the customers andproviding them with necessary guidance.
5.4.3 Z score for Responsiveness
It can be inferred from the Responsiveness test results(Table 4) that the value of two tail z test is -1.52905 whichis under the acceptance area, and is less than |z| = 1.96,hence the null hypothesis for Responsiveness is accepted.Also, the value of P is .126251, which is more than thelevel of significance value .05. Thus the alternatehypothesis "There is a significant difference in the levelof Responsiveness between Banking and Insurancesectors" gets rejected whereas, the null hypotheses,"There is no significant difference in the level ofResponsiveness between
Banking and Insurance sectors" is accepted. Here, wecan conclude that there is thesame level of
Charu Upadhyaya and V.K Jain

IMJ 68
Volume 7 Issue 2 July - December 2015
Responsiveness between the two sectors inhandlingrelationship management.
5.4.4 Z score for Service Quality
It can be inferred from the Service Quality test results(Table 4) that the value of two tail z test is -3.4014 whichis under the rejection area, and is greater than |z| =1.96, hence the null hypothesis for Service Quality isrejected. Also, the value of P is .0006, which is less thanthe level of significance value .05. Here, we can concludethat there is a significant difference in the level of'Service Quality' between the two sectors inhandlingrelationship management.
6. Findings
1. There exists a difference in the level of Empathy inBanking and Insurance Sectors. It is found that bankemployees are not available whenever needed toguide the customers whereas, in insurance companiesgrievances are handled well by the employees, ascompared to banks.
2. It is also found that insurance employees handlecustomer grievances more effectively as they have anunderstanding of customer needs and are alwayswilling to help the customers by providing them withnecessary guidance and instant response to theirrequests.
3. Insurance companies are also found to be moreequipped with tools such as presence of detailedbrochures of products and its features because ofwhich it becomes easier for the customers to performtheir transactions. This also saves the time of employ-ees in providing guidance to customers.
4. There is a difference in the level of Tangibles inbanking and insurance sectors. The point of differencelies in the infrastructural facilities available at Insur-ance companies which is more visually appealing tothe customers than in the Banks.
5. This infrastructure also includes less seating spacein Banks compared tothat of insurancecompanies,creatinginconvenience to them. Moreover,the presence of customer service help-desk at insur-ance companies is found to be more effective thanat banks,which helps the Insurance customers to
resolve their queries faster and more conveniently.
6. Also, customers found employees in insurance to bemore neat in appearance than inbanks.
7. Conclusion
Banking and Insurance Sectors must aspire for customerdelight which is a form of customer satisfaction. Withcustomers placing greater demands, and competitiveconditions forcing organizations to accede to them,customer expectation is a moving target, and one thatorganizations must strive to constantly exceed bytakingadequate measures to empower their employees.
From the study it can be concluded that there are certainfactors of Service Quality that have a great impact inthe Insurance sector, hence managers should considerthese factors as their strength and enhance theseattributes in their CRM strategy. For the Banking sectorthere is need to concentrate more on services which arefocusing customers, effective grievance handling,friendliness of employees, information andcommunication technology, high quality service, andother variables of the study.
8. Implications for Practice
1. Customers who are satisfied with the services tendto be loyal.The only way to cater loyal customers isby delivering qualityservice. Organizations shoulddesign loyalty programs for its customers which willmake the loyal customers feel delighted. The selectionof loyal customers may depend not only on their bankbalance but also, their length of relationship andreference provided by them and so on.
2. One of the most essential aspect of service qualityhas emerged as Reliability. Reliability is an integralpart of service quality. From the study, reliabilityscore is found to be less, thus, both banks andInsurance companies can provide sufficient trainingto its employees which will help them in properlyaddressing the customers issues with ease. Thiswould help in gaining reliability from customers.
3. Organizations should provide better amenities tohave a delightful customer experience. Thus, ad-equate space for parking, also proper seating arrange-
Charu Upadhyaya and V.K Jain

IMJ 69
Volume 7 Issue 2 July - December 2015
ment and the availability of other amenities such asdrinking water, can be small important aspects of adelighted customer experience.
9. Implications for Further Research
1. Banks and Insurance sector are a part of financial ser-vice sector of a country. As the economic and corpo-rate sector slowdown has led to an increase innumber
Table 1 : CRM Factor Scale
Sr. Model Author/s Variables of the StudyNo.
1 Kano's Model Kano (1984) Must-be requirements, One-dimensional requirements,Attractive requirements, Reverse Quality
2 Perceived SQ Gronroos (1984) Technical service quality, Functional service quality,Model Corporate image
3 SERVQUAL Zeithaml Reliability, Responsiveness, Assurance, Empathy andBarry and TangiblesParasuraman, (1996)
4 SERVFERF Cronin and Reliability, Responsiveness, Assurance, Empathy andTaylor (1994) Tangibles
5 E-commerce Reichheld and Customer support, on-time delivery, compelling productSchefter (2000) presentations, convenient and reasonably priced shipping
and handling, clear and trustworthy privacy
6 e-SQ and e- Zeithaml, Efficiency, Reliability, Fulfilment, Privacy, Responsiveness,SERVQUAL Parasuraman, and Compensation, And Contact
Malhotra (2000)
7 e-Satisfaction Szymanski and Convenience, Merchandising, Easiness, Information, Deign,Hise (2000) Financial Security
8 Service Quality Kumar andManjunath (2012) Tangibles, Reliability, Empathy, Assurance, Convenience.
Charu Upadhyaya and V.K Jain
of banks focusing on the retail segment. Many of themare also entering the new vistas of Insurance. Hence,further research can be conducted to measure the effi-ciency of bancassurance channels in India.
2. Also, future researchers could cover more service cat-egories and with large database across countries tocompare the level of CRM and thus can also build anindex for measuring CRM for more service categories.
3. Further study can be conducted in order to comparethe performance of Indian Banks and Insurancecompanies with their foreign counterparts.
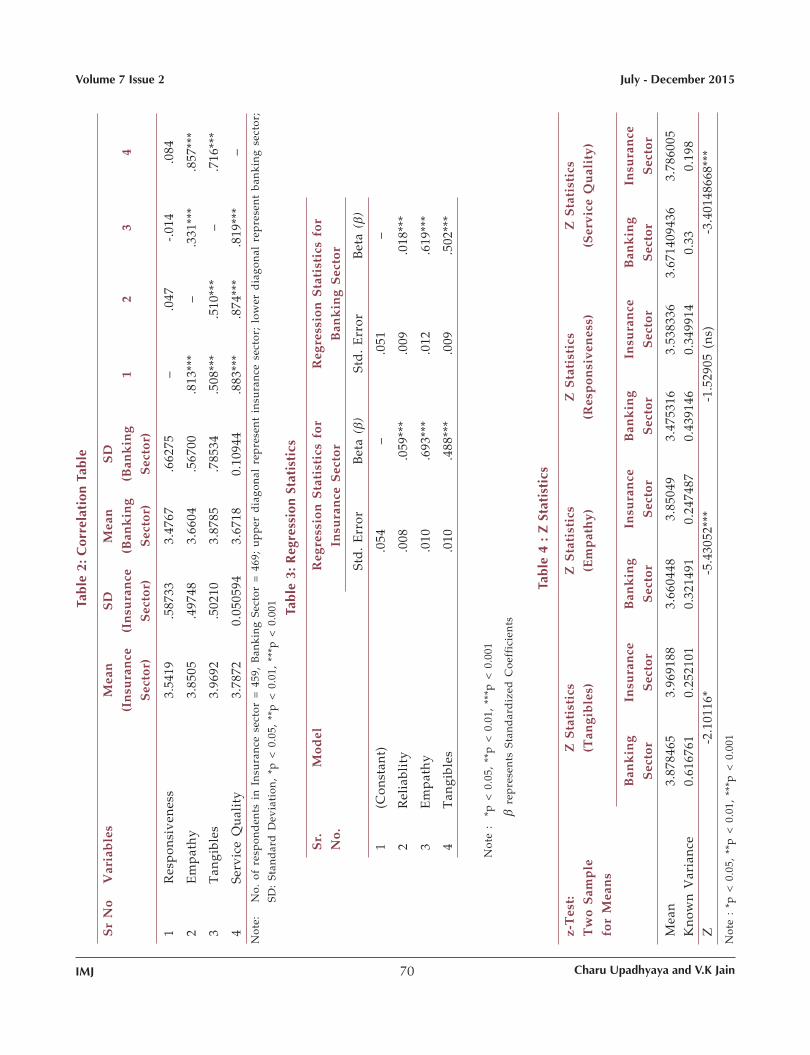
IMJ 70
Volume 7 Issue 2 July - December 2015
Charu Upadhyaya and V.K Jain
Tabl
e 2:
Cor
rela
tion
Tab
le
Sr
No
Var
iab
les
Mea
nS
DM
ean
SD
(In
sura
nce
(In
sura
nce
(Ban
kin
g(B
ank
ing
12
34
Sec
tor)
Sec
tor)
Sec
tor)
Sec
tor)
1R
esp
onsi
ven
ess
3.54
19.5
8733
3.47
67.6
6275
–.0
47-.
014
.084
2E
mp
ath
y3.
8505
.497
483.
6604
.567
00.8
13**
*–
.331
***
.857
***
3T
angi
bles
3.96
92.5
0210
3.87
85.7
8534
.508
***
.510
***
–.7
16**
*
4Se
rvic
e Q
ual
ity
3.78
720.
0505
943.
6718
0.10
944
.883
***
.874
***
.819
***
–N
ote:
No.
of
resp
ond
ents
in
In
sura
nce
sec
tor
= 4
59,
Ban
kin
g Se
ctor
= 4
69;
up
per
dia
gon
al r
epre
sen
t in
sura
nce
sec
tor;
low
er d
iago
nal
rep
rese
nt
ban
kin
g se
ctor
;
SD:
Stan
dar
d D
evia
tion
, *p
< 0
.05,
**p
< 0
.01,
***
p <
0.0
01 Tabl
e 3:
Reg
ress
ion
Stat
isti
cs
Sr.
Mod
elR
egre
ssio
n S
tati
stic
s fo
rR
egre
ssio
n S
tati
stic
s fo
rN
o.In
sura
nce
Sec
tor
Ban
kin
g S
ecto
r
Std
. E
rror
Bet
a (
)St
d.
Err
orB
eta
()
1(C
onst
ant)
.054
–.0
51–
2R
elia
blit
y.0
08.0
59**
*.0
09.0
18**
*
3E
mp
ath
y.0
10.6
93**
*.0
12.6
19**
*
4T
angi
bles
.010
.488
***
.009
.502
***
Not
e :
*p <
0.0
5, *
*p <
0.0
1, *
**p
< 0
.001
re
pre
sen
ts S
tan
dar
diz
ed C
oeff
icie
nts
Tabl
e 4
: Z S
tati
stic
s
z-T
est:
Z S
tati
stic
sZ
Sta
tist
ics
Z S
tati
stic
sZ
Sta
tist
ics
Tw
o S
amp
le(T
angi
ble
s)(E
mp
ath
y)(R
esp
onsi
ven
ess)
(Ser
vice
Qu
alit
y)fo
r M
ean
s
Ban
kin
gIn
sura
nce
Ban
kin
gIn
sura
nce
Ban
kin
gIn
sura
nce
Ban
kin
gIn
sura
nce
Sec
tor
Sec
tor
Sec
tor
Sec
tor
Sec
tor
Sec
tor
Sec
tor
Sec
tor
Mea
n3.
8784
653.
9691
883.
6604
483.
8504
93.
4753
163.
5383
363.
6714
0943
63.
7860
05K
now
n V
aria
nce
0.61
6761
0.25
2101
0.32
1491
0.24
7487
0.43
9146
0.34
9914
0.33
0.19
8Z
-2.
1011
6*
-5
.430
52**
*
-1.
5290
5 (n
s)
-3.4
0148
668*
**
Not
e :
*p <
0.0
5, *
*p <
0.0
1, *
**p
< 0
.001

IMJ 71
Volume 7 Issue 2 July - December 2015
References
Kumar, A.G., and Manjunath, S.J. (2012).Service qualityimpact on customer satisfaction-A study of ICICI bankin Mysore city. International Journal of Engineering andManagement Research,2(4),1-4.
Balachandran, S. (2005).How to Build a Culture of CostManagement. Financial Times, August 18th, 16.
Brown, K. A., & Mitchell, T. R. (1993). Organizationalobstacles: Links with financial performance, customersatisfaction, and job satisfaction in a serviceenvironment. Human Relations, 46(6), 725-757.
Browne, M., and Hoyt, R. (1995).Economic and marketpredictors of insolvencies in the property-liabilityinsurance industry.The Journal of Risk andInsurance,62(2), 309-327.
Cronin, J. and Taylor, S. (1994). SERVPERF versus SERVQUAL:Reconciling performance-based and perceptions-minus-expectations measurement of service quality. Journal ofMarketing, 58(1), 125-131
Eisingerich, A. and Bell, S. (2006). Relationship marketingin the financial services industry: The importance ofcustomer education, participation and problemmanagement for customer loyalty. Journal of FinancialServices Marketing, 10 (4), 86 - 97.
Fagbemi, A. and Olowokudejo, F. (2011). A Comparison ofthe Customer Relationship Management Strategies ofNigerian Banks and Insurance Companies. InternationalJournal of Management Business Research, 1(3),161-170.
Galloway, L. & Ho. S. (1996). The model of service qualityfor training. Training for Quality, 4(1), 20-26.
Gronroos C, (1984). Service Quality And Its MarketImplications. European Journal Of Marketing,18(4), 36-44.
Hart, C., Heskett, J., & Sasser, W., (1990). The profitable artof service recovery. Harvard Business Review, 68(4), 148-156.
Jabnoun, N. and Hassan Al-Tamimi, H.(2003), Measuringperceived service quality at UAE commercial banks.International Journal of Quality & ReliabilityManagement, 20 (4), 458-472.
Kano, N., Seraku, N., Takahashi, F., & Tsuji, S. (1984),Attractive quality and must-be quality. Hinshitsu: TheJournal of the Japanese Society for Quality Control, 14(2),39-48.
Nath, V., Gugnani, R., Goswami, S., & Gupta, N. (2009).An Insight into Customer Relationship ManagementPractices in Selected Indian Service Industries. Journalof Marketing & Communication, 4(3), 18-40.
Nelson, N.O. (2006). A Structural Equation Modeling of theAntecedents of Relationship Quality in the MalaysiaBanking Sector. Journal of Financial Services Marketing,11(1), 131-141.
Nelson, N.O. & Chan, K.W. (2005). Factorial and discriminantanalysis of the underpinnings of relationship marketingand customer satisfaction. International Journal of BankMarketing, 23(7), 542-557
Panda, T.K. (2003). Creating Customer Lifetime Value througheffective CRM in Financial Services Industry. Journal ofServices Research, 2 (2), 157-171.
Reichheld, F. & Schefter, P. (2000). E-loyalty-your secretweapon on the web. Harvard Business Review, 78(4),105-113.
Report by Deloitte (2011), "Indian Insurance Sector InnovateNow or Stagnate", Pp.1-18
Sin, L., Tse, A., Yau, O., Chow, R., and Lee, L. (2005).Relationship Marketing Orientation: Scale Developmentand Cross-Cultural Validation. Journal of BusinessResearch, 58(2), 185-94.
Swanson, S., & Kelley, S. (2001). Attributions and outcomesof the service recovery process. Journal of MarketingTheory and Practice, 9(4), 50-65.
Szymanski, D., and Hise, R. (2000). E-Satisfaction: an initialexamination. Journal of Retailing, 76(3), 309-322.
Zeithaml, V., Berry, L., & Parasuraman, A. (1996). TheBehavioral Consequences of Service Quality. Journal ofMarketing, 60(2), 31-46
Zeithaml, V., Parasuraman, A., & Malhotra, A. (2000). Aconceptual framework for understanding e-servicequality: Implications for future research and managerialpractice. Working Paper, No. 00-115. Cambridge, MA:Marketing Science Institute.
Charu Upadhyaya is an Assistant Professor at Lala LajpatraiInstitute of Management, Mumbai University. She has 7years of experience in teaching and 1 year of corporateexperience.
V K Jain is presently working as Director at COER Schoolof Management, Roorkee. He has a total of 20 years ofexperience which include 10 years of experience asDirector at various institutes of repute. There are 165publications to his credit. He is actively associated withCSI, AIMA, AIMS, ISTD etc.
Charu Upadhyaya and V.K Jain
IMJ 72
Volume 7 Issue 2 July - December 2015