Vol. 4 Economic Development Assessment Tools …. 4 Economic Development Assessment Tools and Study...
39
Sources of Regional Growth in Non-Metro Appalachia Vol. 4 Economic Development Assessment Tools and Study Conclusions for Identifying Sources of Growth Prepared for the Appalachian Regional Commission Prepared by: Economic Development Research Group, Inc. Revised 2007
Transcript of Vol. 4 Economic Development Assessment Tools …. 4 Economic Development Assessment Tools and Study...

Sources of Regional Growth in Non-Metro Appalachia
Vol. 4 Economic Development Assessment Tools and Study Conclusions for Identifying Sources of Growth
Prepared for the Appalachian Regional Commission
Prepared by: Economic Development Research Group, Inc.
Revised 2007

Vol.4 Economic Development Assessment Tools
Sources of Growth in Non-Metro Appalachia
SOURCES OF GROWTH PROJECT The Sources of Growth project is part of a series of research efforts funded by the Appalachian Regional Commission to improve our understanding of factors affecting economic growth in rural and distressed areas. As stated in the Volume 1 Introduction, “the starting premise of this project is that there can multiple paths that an area can pursue in successfully enhancing job and income creation. They may build on natural resources, cultural resources, human resources, local amenities, institutional facilities or location advantages. The resulting direction of economic growth may involve manufacturing or supply chain development, resource extraction or tourism development, educational development or trade center development.” This research is intended to provide a basis of information that can ultimately be useful for enhancing the effectiveness of policies and tools aimed at improving the region’s economic development. This is Volume 4 in a series of reports prepared as part of this project:
• Executive Summary –synthesis of findings from all work products related to the study’s four main research components.
• Volume 1, Project Background and Prior Research on Economic Growth Paths –
study objectives, characteristics of non-metro Appalachian counties, classification of economic development growth paths, and synopsis of white paper findings on theory relating to economic development growth paths.
• Volume 2, Case Studies of Local Economic Development Growth Processes –
findings related to growth paths as observed for selected case studies covering manufacturing industry specialization clusters, supply chain-based development, tourism-based development, advanced technology development, and diversification from resource-based economies.
• Volume 3, Statistical Studies of Spatial Economic Relationships – findings from a
series of econometric modeling and GIS-based analyses, focusing on roles of spatial adjacency, market access and transportation in determining economic growth and development of trade centers.
• Volume 4, Economic Development Assessment Tools & Study Conclusions –
description of new and updated tools available to ARC and its Local Development Districts to assess economic development opportunities and potential directions for economic growth.
• Appendices – (A) Spatial Analysis of Economic Health, (B) Economic Analysis of
Hub-Spoke Relationships, (C) White Papers on Economic Growth Theories, (D) Literature Review of Empirical Studies on Spatial Influences in Economic Development.

Vol.4 Economic Development Assessment Tools
Sources of Growth in Non-Metro Appalachia
TABLE OF CONTENTS ACKNOWLEDGEMENTS i 1 INTRODUCTION..........................................................................................................................1
1.1 OVERVIEW: FROM RESEARCH TO ACTION...............................................................................1 1.2 ARC ROLE IN DEVELOPING ECONOMIC TOOLS.......................................................................2 1.3 NEED FOR ECONOMIC ASSESSMENT TOOLS.............................................................................3 1.4 PITFALLS IN USING ECONOMIC TOOLS ....................................................................................4
2 OVERVIEW OF LEAP.................................................................................................................7 2.1 LEAP STRUCTURE ..................................................................................................................7 2.2 ELEMENTS OF INTEGRATED EVALUATION...............................................................................9 2.3 LEAP USES FOR APPALACHIAN GROWTH.............................................................................13
3 USE OF FINDINGS FROM SOURCES OF GROWTH PROJECT ......................................16 3.1 ENHANCING ANALYTIC CAPABILITIES ..................................................................................16 3.2 TRADE CENTER DEVELOPMENT PATHS .................................................................................18 3.3 INDUSTRY AGGLOMERATION CLUSTER PATHS......................................................................19 3.4 SUPPLY-CHAIN (DISPERSAL) PATHS .....................................................................................21 3.5 AMENITY & CULTURAL ASSET GROWTH PATHS...................................................................22 3.6 LEARNING AND TECHNOLOGY GROWTH PATHS ....................................................................24 3.7 NATURAL RESOURCE & OTHER GROWTH PATHS..................................................................26 3.8 SUPPORTING LOCAL ECONOMIC DEVELOPMENT ...................................................................27
4 CONCLUSIONS FROM THE STUDY OF SOURCES OF GROWTH.................................28 4.1 LESSONS LEARNED FROM THE COMPREHENSIVE EXAMINATION ...........................................28 4.2 LESSONS FROM THE CASE STUDIES .......................................................................................28 4.3 KEY FINDINGS FROM EMPIRICAL STUDIES ............................................................................29 4.4 IMPLEMENTING FINDINGS FOR STRATEGY PLANNING ...........................................................33 4.5 FUTURE STUDY DIRECTIONS ON NON-METRO GROWTH PROCESSES .....................................34

Vol.4 Economic Development Assessment Tools
Sources of Growth in Non-Metro Appalachia page i
ACKNOWLEDGEMENTS This volume was authored by Economic Development Research Group, Inc. Other volumes in this series were also co-authored by staff of Regional Technology Strategies, Inc. and by faculty and graduate students in the Dept. of Urban Studies & Planning at the Massachusetts Institute of Technology. The Sources of Growth project involved a team of researchers including:
• Economic Development Research Group, Inc. (EDRG) – Lisa Petraglia (Project Director), Glen Weisbrod (Principal-in-Charge) and Teresa Lynch, with research support from Tyler Comings, Brett Piercy and Susan Moses;
• Regional Technology Strategies, Inc. (RTS) –Stuart Rosenfeld, Phil Psilos and Dan Broun;
• Massachusetts Institute of Technology, Department of Urban Studies & Planning (MIT-DUSP) – Prof. Karen R. Polenske, Prof. Joseph Ferreira, Jr. and Ayman Ismail, with research support from Tan Zhijun, Isabelle Xin Li, Yi Xu and Leigh Graham.
The project also benefited from the expertise of outside policy and research experts who reviewed documents, participated in project meetings and provided technical guidance: Deb Markley (Co-Director of the Center for Rural Entrepreneurship, a Rural Policy Research Institute), Joseph Cortwright (Vice-President of Impresa Consulting), Ken Poole (Executive Director of ACCRA: The Council for Community and Economic Research), David Freshwater (Professor of Agricultural Economics and Public Policy at the University of Kentucky), David McGranahan and Luc Anselin (Professor. Dept. of Agriculture & Consumer Affairs and Regional Economics Applications Laboratory at the University of Illinois, Urbana- Champaign). Overall project direction and oversight was provided by Dr. Greg Bischak of the Appalachian Regional Commission, whose wide range of research experience served to focus the project team on the development of policy applications. Important insight and suggestions were also provided by officials of the Appalachian Regional Commission who participated in a day-long symposium with the project team, including Thomas Hunter (executive director of ARC, Ann Pope (federal co-chair of ARC) and Rick Peltz (alternate federal co-chair). In addition, Ken Wester and Jason Wang of ARC assisted the project team in collecting and assembling transportation and geographic data.

Vol.4 Economic Development Assessment Tools Ch.1 Introduction
Sources of Growth in Non-Metro Appalachia page 1
1 INTRODUCTION
1.1 Overview: From Research to Action The Appalachian Regional Commission (ARC) is recognized in the field of economic development, not only for its program investments that have been shown to create jobs, but also for its research aimed at improving the effectiveness of its economic development efforts. The Sources of Growth project is part of that research effort aimed at improving our understanding of factors affecting economic distress and identifying strategies that can enhance economic growth in the region. One of the most important elements of the Sources of Growth project is that it aims to illuminate the range of potential economic growth paths that can be relevant for rural areas (Exhibit 1-1). It avoids the “urban bias” that exists when people focus just on in-vogue concepts such as technology-driven clusters. Instead, it lays out multiple paths that areas can potentially pursue to create jobs and income. For any specific area, though, some growth paths are more likely to succeed than others. Hence, successful economic development requires analysis to identify the relevant growth paths. Exhibit 1-1 Alternative Growth Paths
Asset-based
Strategy
Performance Evaluation – gauging progress on a growth path
Given Local Conditions – Resources, Constraints and Opportunities
Decision Criteria on Most Appropriate Growth Path(s) to Pursue
Goal – Improved Economic Development
Supply Chain
Strategy
Learning-based
StrategyAgglomeration
StrategyTrade Center
Strategy
The prior three volumes describe theory, prior research, case studies and empirical analysis of economic growth factors -- all generating insight and implications for local policy initiatives in Appalachia’s non-metro counties, where economic distress is greatest. This volume discusses our ability to use those findings to improve tools that can be used by ARC’s Local Development Districts (LDDs) for assessing their economic development opportunities and developing growth path strategies.

Vol.4 Economic Development Assessment Tools Ch.1 Introduction
Sources of Growth in Non-Metro Appalachia page 2
1.2 ARC Role in Developing Economic Tools ARC-Opps Spreadsheet Tools. The ARC started providing tools for enhancing economic development targeting and strategy when it released the highway opportunities model: ARC-OPPS in March 2001.1 That system of analysis tools was designed to help ARC’s Local Development Districts identify the type of business growth opportunities that come along when areas gain new or improved highway access. It was motivated by concern that local economic development agencies were often not fully prepared to identify or pursue new opportunities created when segments of the Appalachian Development Highway System (ADHS) were completed. ARC-OPPS was successfully used for various ADHS links such as Appalachian Corridor “V” in Mississippi and Appalachian Corridor “T” in New York State. However, this system also created interest in expansion of developing broader tools to assess economic development targeting opportunities for regions that did not have new highway openings. ARC-LEAP Spreadsheet Tools. In January 2004 the Appalachian Regional Commission (ARC) issued the report and software tool known as ARC-LEAP, the Local Economic Assessment Package.2 Building on the demands of the ARC’s Local Development Districts (LDDs), this product provided the LDDs with a robust package of economic development assessment tools that could assist development practitioners in their local economic planning efforts. This package superseded ARC-OPPS by covering the economic and employment impacts of other types of development projects, including water and sewer projects, industrial site development, workforce development, and transportation improvements. ARC-LEAP was widely distributed among Appalachian state and local government economic development programs. The Southern Tier West Regional Planning Council in New York was an early adopter of the LEAP package to evaluate how transportation accessibility affected economic development opportunities in his region, and to assess development options for distribution centers and the lodging sector. Another example was the First Development District of Tennessee, which engaged in a strategic planning process utilizing the capabilities of LEAP to identify key development opportunities for the region. The Middle Georgia Regional Development Center used LEAP as the foundation for a larger effort to develop a regional economic diversification strategy plan. It was also used for Tennessee DOT’s evaluation of the potential economic development benefits of completing Appalachian Corridor “J”.
1 Handbook for Assessing Economic Opportunities from the Completion of Appalachian Development Highways,
by Economic Development Research Group with the assistance of Cambridge Systematics, March 2001. Available at http://www.arc.gov/index.do?nodeId=709
2 Handbook: Assessing Local Economic Development Opportunities with ARC-LEAP, Appalachian Regional Commission Local Economic Assessment Package, by Economic Development Research Group, January 2004. Available at http://www.arc.gov/index.do?nodeId=2203

Vol.4 Economic Development Assessment Tools Ch.1 Introduction
Sources of Growth in Non-Metro Appalachia page 3
Recognition Awards. During the 2005-2006 period, LEAP began earning national recognition and awards from the IEDC - International Economic Development Council and ACCRA – the Council for Community and Economic Research. Both of these recognition awards noted the unique capabilities of LEAP in enabling local economic development agencies to effectively assess their targeting strategy options, and both were given jointly to ARC and Economic Development Research Group (EDRG) in recognition of their partnership in its development. Web-Tools: EDR-LEAP®. While the LEAP spreadsheet-based toolbox was gaining critical success, its use was limited to agencies that had the staff time and resources to collect all of the information required to use it. In response to this need, EDRG developed a new system that overcame this problem by having: (a) essentially all of the data already collected and immediately available via a dynamic database and geographic information system, and (b) the entire system available on-line and directly usable through any web browser, with help screens for new users. ARC made the system available to Appalachian Local Development Districts and Appalachian State Economic Development Departments. (It is available to other users through EDRG.3 ) The initial version of EDR-LEAP® assessed local economic performance gaps, barriers holding back further development, business attraction target opportunities and effects of program or policy initiatives. It also included some evaluation of business cluster opportunities. However, it did not fully distinguish the alternative growth paths that can be important for any region, but particularly for rural districts where there is not necessarily a critical mass of population and employment to support business clusters. Findings from the Sources of Growth project -- including literature review, case studies and empirical studies – now provide a base for further enhancing the breadth of analysis and use of this tool.
1.3 Need for Economic Assessment Tools The concept of local economic assessment is not new. It goes back at least forty years, with “economic base analysis” and its set of ratio calculations to identify their economic performance strengths and weaknesses.4 These methods started appearing in guides for economic development agencies in the 1970s. In the later 1980s and most of the 1990s, there was also a flurry of research ranking business site location factors. Today, there is now a strong consensus on the nature of the key business location factors, which represent local competitiveness factors for economic developers. Those factors are shown in Exhibit 1-2. Together, the evaluation of economic performance (via economic base analysis) and the evaluation of economic competitiveness factors (via analysis of site location 3 See www.edrgroup.com/leap for further information and links to contact information. 4 This includes LQ (Location Quotient), S (Shift-Share) and VAMP (value added minus payroll per employee).
Vol.4 Economic Development Assessment Tools Ch.1 Introduction
Sources of Growth in Non-Metro Appalachia page 4
factors) provided a foundation for guides such as Economic Development Planning, International Economic Development Council (2002).
Exhibit 1-2. Business Site Location Factors 5
Suitability of Business Parks, Land and Buildings Scale and Skills of the Labor Market --Workforce Scale and Socioeconomic Characteristics of the Consumer Base Availability and Quality of Infrastructure -- roads, power, water/sewer, broadband
telecom, intermodal transportation terminals and connections Access to Markets, as well as to airports, marine ports and intermodal rail terminals Business Support services & business climate – job training, regulations, business
organizations Quality of life -- including climate, arts and culture, recreation, and school quality Cost of doing business – including labor, utilities, infrastructure and taxes
1.4 Pitfalls in Using Economic Tools Note: Most of this part 1.4 text is drawn from a separate article, “New Tools for Economic Development Targeting and Strategy: Applying a Local Economic Assessment Package” by Glen Weisbrod and Brett Piercy, 2006. publication pending. The full value of an integrated evaluation and targeting system such as LEAP comes from its ability to offer a coordinated toolkit that effectively support economic development targeting and strategy development. As a coordinated toolkit, it avoids the common limitations and pitfalls that come from reliance on simpler methods or bundles of separate tools. Examples of these problems include the following:
• While area-wide industry mix patterns and trends are easy to assess, most economic developers understand that such information is of limited value unless it can be compared to relevant neighbor and competitor areas to identify performance gaps, and then linked to business competitiveness factors to help explain those results.
The problem of over-reliance on industry patterns and trends is that they can lead to a naïve conclusion that already strong industries represent clusters that
5 Industrial site location factors are widely recognized in the field of economic development today, though most of
the research to identify them took place over the prior decade. Sources include: (1) Portland 2002: Strategy for Economic Vitality, Appendix 2-3: “Location Factors,” 2002, (2) Sloagett, Gordon and Mike Woods. “Critical Factors in Attracting New Business and Industry in Oklahoma. Oklahoma Cooperative Extension Service; (3) Kotler, Philip et al. Marketing Places. The Free Press, 1993; (4) Lyne, Jack, “Quality of Life Factors Dominate Many Facility Location Decisions,” Site Selection Handbook, August 1988, and (5) Finkle, Jeffrey. “Developing Strategies for Economic Stability and Growth,” Council for Urban Economic Development, 1997. For quality of life, also see (6) Segedy, James. “How Important is Quality of Life in Location Decisions and Local Economic Development” in Bingham and Mier (Eds.) Dilemmas of Urban Economic Development, Sage, 1997.
Vol.4 Economic Development Assessment Tools Ch.1 Introduction
Sources of Growth in Non-Metro Appalachia page 5
should be the top priorities for further recruitment. More appropriately, economic development strategies should focus on identifying existing gaps and missed opportunities, desired growth paths and the steps needed to overcome barriers now holding back achievement of those opportunities.
• Measuring cost differences among regions is a straightforward process, and the
nature of those differences forms a core of economic simulation and forecasting models. Those models focus on estimating dollar flows and cost differences to explain how industry growth and investment moves among areas. However, most economic developers understand that business location requirements also depend on various non-cost (size, quality and access) factors that are at least as important as cost in determining competitiveness and resulting industry growth and investment shifts.
The problem of over-reliance on cost comparisons is that they can lead to a naïve conclusion that local economic development strategy should focus just on cost incentives to attract economic growth. Often, economic development strategies need to focus more on identifying opportunities to overcome gaps in transportation facilities, job training, industrial park facilities and/or business support services as ways to enhance quality.
• Economic forecasting and impact models can show how a given type of new
business will generate additional flows of dollars to suppliers. However, most economic developers understand that part of their job is to make economic forecasting and impact models be wrong. That is because economic forecasting models usually assume no change in competitiveness factors aside from costs, while economic developers may be working hard to make quality improvements in local facilities, job training or support services. In addition, economic impact calculations assume that dollars will “leak” out of the area if there are currently no local suppliers to serve a major new industry, while economic developers may be working hard to develop local supply chains that can keep those dollars in the local economy.6
The problem of reliance on economic forecasts and impact models is that they
6 An economic impact model applied before the opening of the BMW assembly plant in South Carolina
would normally have calculated that the flow of dollars to auto parts suppliers would go mostly out of state, since there was no major auto parts industry in the state at that time. It would not have known that the cooperative efforts of BMW and the state would subsequently lead to the attraction of 49 new auto parts suppliers, creating thousands of additional jobs.

Vol.4 Economic Development Assessment Tools Ch.1 Introduction
Sources of Growth in Non-Metro Appalachia page 6
can lead to a pessimistic view of future prospects for local economic development, and wrong priorities for industry growth and attraction targets. More appropriately, economic developers need to take advantage of opportunities to enhance local supplier networks as a way of enlarging the indirect benefits of business expansion and attraction efforts.
Vol.4 Economic Development Assessment Tools Ch.2 Overview of LEAP
Sources of Growth in Non-Metro Appalachia page 7
2 OVERVIEW OF LEAP
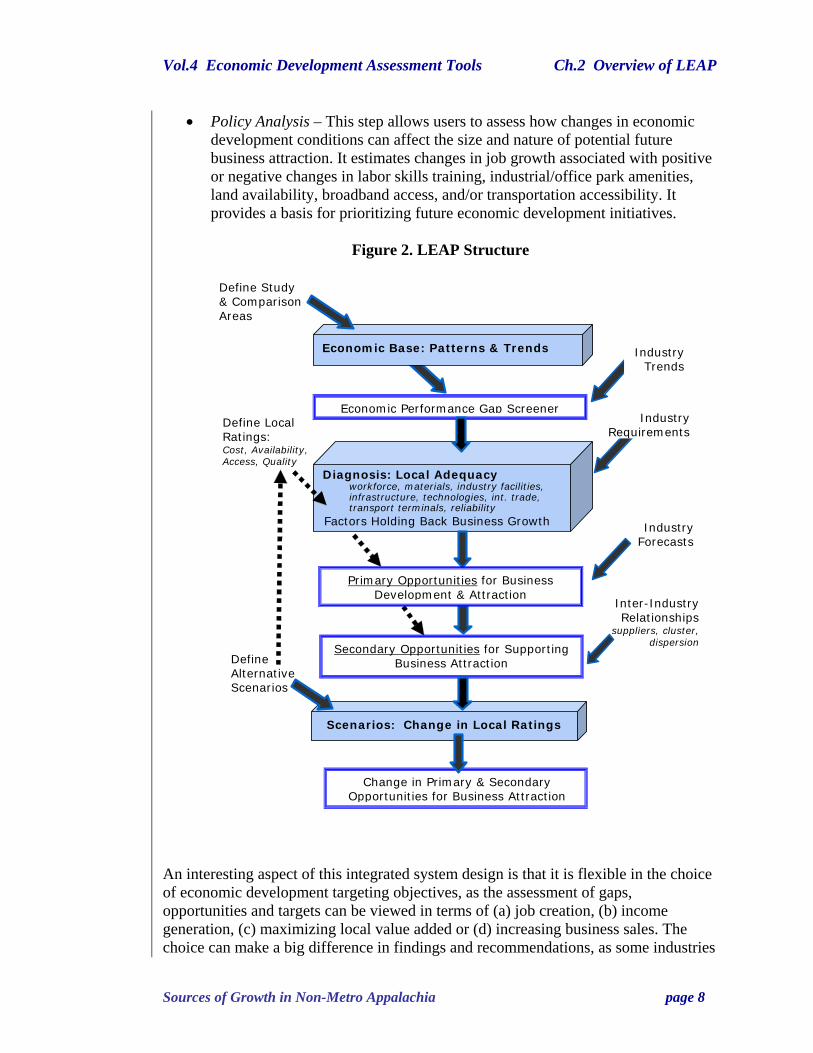
2.1 LEAP Structure In recognition of these shortcomings, the Appalachian Regional Commission supported development of the “Local Economic Assessment Package” as a bundle of tools to give economic developers the ability to diagnose local competitive position, select appropriate targets and design economic development targeting strategies that build on strengths and minimize weaknesses. The resulting package of tools follows the evaluation process supporting IEDC’s Economic Development Planning guide and recommended targets and policy priorities. It is designed specifically to avoid the pitfalls just discussed. The structure of this approach is shown in Figure 2. It revolves around three steps or modules, shown by the shaded three-dimensional boxes: (1) Economic Assessment, (2) Targeting Diagnostics and (3) Policy Analysis. They implement the three-phase evaluation process that was previously discussed to provide information for the IEDC economic development planning process. Most importantly, it avoids or minimizes the pitfalls of incomplete and inappropriate conclusions by making the critical connection between (a) local economic performance results to date and (b) local competitiveness factors (costs, quality, access and market scale differences). That provides a basis for determining (c) potentially feasible business growth/attraction targets and actions needed to make them possible. The steps are as follows:
• Economic Base Assessment – This step develops profiles of business mix and performance trends by industry, and benchmarks them against adjacent or competing areas to identify leading & lagging industries, performance gaps and business types with the greatest local growth or attraction potential.
• Targeting Diagnostics – This step rates competitive strengths and weaknesses
of the area in terms of various costs (e.g., utilities, housing g, land, labor, taxes), qualities (worker skills, industrial/office park amenities), access (to airports, highways, railroads) and supporting infrastructure (broadband, business resources). It uses a knowledge base of industry requirements, thresholds for business location, and inter-industry relationships to identify the key factors that are constraining local attractiveness for each industry, and potentially achievable business attraction targets.
Vol.4 Economic Development Assessment Tools Ch.2 Overview of LEAP
Sources of Growth in Non-Metro Appalachia page 8
• Policy Analysis – This step allows users to assess how changes in economic development conditions can affect the size and nature of potential future business attraction. It estimates changes in job growth associated with positive or negative changes in labor skills training, industrial/office park amenities, land availability, broadband access, and/or transportation accessibility. It provides a basis for prioritizing future economic development initiatives.
Figure 2. LEAP Structure
An interesting aspect of this integrated system design is that it is flexible in the choice of economic development targeting objectives, as the assessment of gaps, opportunities and targets can be viewed in terms of (a) job creation, (b) income generation, (c) maximizing local value added or (d) increasing business sales. The choice can make a big difference in findings and recommendations, as some industries
Define Study & Comparison Areas
EDR-LEAP Local Economic Assessment Package
Change in Primary & Secondary Opportunities for Business Attraction
Define Alternative Scenarios
Industry Trends
Economic Performance Gap Screener
Primary Opportunities for Business Development & Attraction
Industry Requirements
Define Local Ratings: Cost, Availability, Access, Quality
Industry Forecasts
Inter-Industry Relationships
suppliers, cluster, dispersion
Secondary Opportunities for Supporting Business Attraction
Economic Base: Patterns & Trends
Diagnosis: Local Adequacy workforce, materials, industry facilities, infrastructure, technologies, int. trade, transport terminals, reliability
Factors Holding Back Business Growth
Scenarios: Change in Local Ratings

Vol.4 Economic Development Assessment Tools Ch.2 Overview of LEAP
Sources of Growth in Non-Metro Appalachia page 9
are growing in business sales while jobs or effective salaries are being cut. It is also flexible in the choice of comparison areas for benchmarking, which can be adjacent areas, national or regional competitors, or other areas that will be linked by new transportation corridor connections. That decision also depends on the purpose and use of the analysis. Recognizing its flexibility, this system has now been adopted by the Appalachian Regional Commission and distributed to its Local Development Districts in 13 states to support and enhance their economic development targeting efforts. Applications of it have won national recognition awards from IEDC - the International Economic Development Council and ACCRA – the Council for Community and Economic Research.7
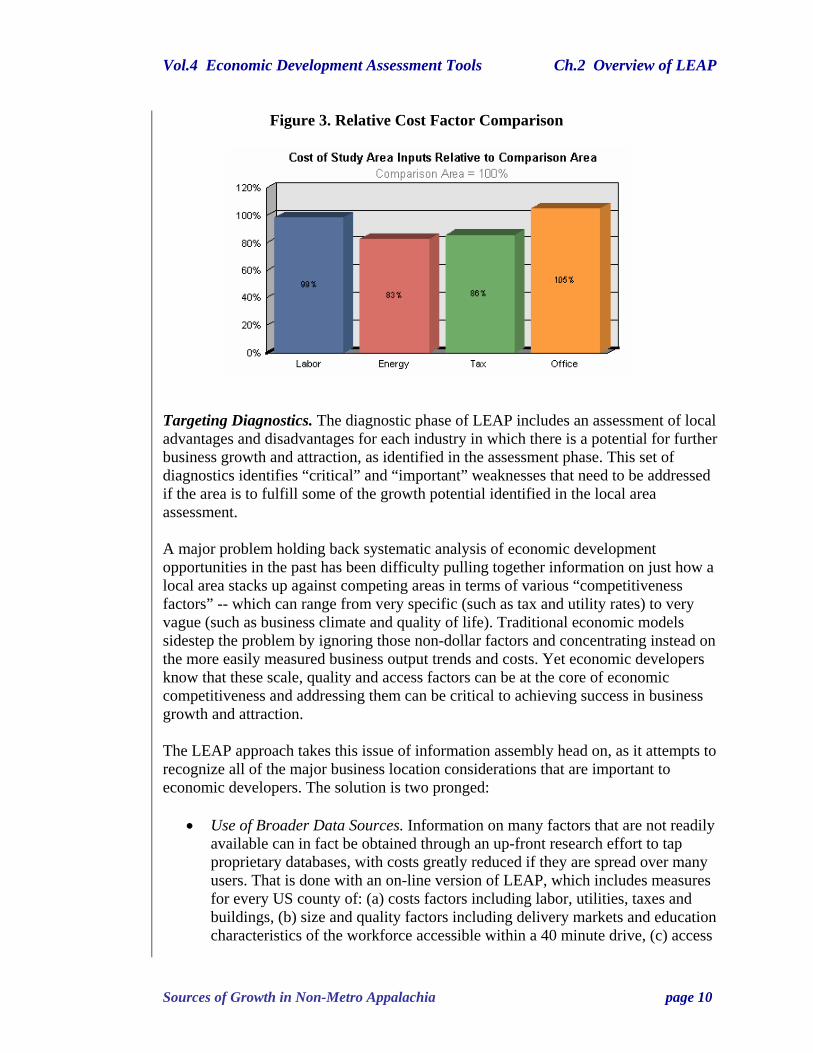
2.2 Elements of Integrated Evaluation Assessment of the Economy. As noted by economic development textbooks, the three principal tools that form the starting basis for economic base analysis are Location Quotient (business mix analysis), Shift Share (business trend analysis), and SWOT (Strengths, Weaknesses, Opportunities and Threats) analysis.8 These techniques are not new and they often form part of Comprehensive Economic Development Strategy (CEDS) documents funded by the US Economic Development Administration. Nor are these techniques inherently complicated. In fact, they can be done quickly with spreadsheets following instructions in regional economic textbooks. The difficulties lie in (a) collecting data on dozens of industries at the appropriate level of detail, and then (b) making the right comparisons to extract findings on local strengths and weaknesses. This is one area where LEAP diverges from traditional analysis approaches. The traditional approach for economic base analysis has been to compare a local area against national patterns and trends. Economic models similarly also compare local costs against national costs. The problem, of course, is that a rural region does not necessarily expect to compete against big metro regions for the same industries, nor does a lake recreation area expect to compete against mining or industrial centers. That is why a benchmarking approach, which compares local industry mix patterns and growth trends against relevant competing areas, will lead to totally different types of findings on local gaps than a comparison to state or national averages. Figure 3 is a graph generated by LEAP that illustrates a comparison of business cost factors in a study area relative to a user-defined comparison area. 7 ACCRA 2006 National Award for Applied Research; IEDC Honorable Mention for Research Studies, 2005 8 Bendavid-Val, Avrom. Regional and Local Economic Analysis for Practitioners, fourth edition. 1991.
Vol.4 Economic Development Assessment Tools Ch.2 Overview of LEAP
Sources of Growth in Non-Metro Appalachia page 10
Figure 3. Relative Cost Factor Comparison
Targeting Diagnostics. The diagnostic phase of LEAP includes an assessment of local advantages and disadvantages for each industry in which there is a potential for further business growth and attraction, as identified in the assessment phase. This set of diagnostics identifies “critical” and “important” weaknesses that need to be addressed if the area is to fulfill some of the growth potential identified in the local area assessment. A major problem holding back systematic analysis of economic development opportunities in the past has been difficulty pulling together information on just how a local area stacks up against competing areas in terms of various “competitiveness factors” -- which can range from very specific (such as tax and utility rates) to very vague (such as business climate and quality of life). Traditional economic models sidestep the problem by ignoring those non-dollar factors and concentrating instead on the more easily measured business output trends and costs. Yet economic developers know that these scale, quality and access factors can be at the core of economic competitiveness and addressing them can be critical to achieving success in business growth and attraction. The LEAP approach takes this issue of information assembly head on, as it attempts to recognize all of the major business location considerations that are important to economic developers. The solution is two pronged:
• Use of Broader Data Sources. Information on many factors that are not readily available can in fact be obtained through an up-front research effort to tap proprietary databases, with costs greatly reduced if they are spread over many users. That is done with an on-line version of LEAP, which includes measures for every US county of: (a) costs factors including labor, utilities, taxes and buildings, (b) size and quality factors including delivery markets and education characteristics of the workforce accessible within a 40 minute drive, (c) access
Vol.4 Economic Development Assessment Tools Ch.2 Overview of LEAP
Sources of Growth in Non-Metro Appalachia page 11
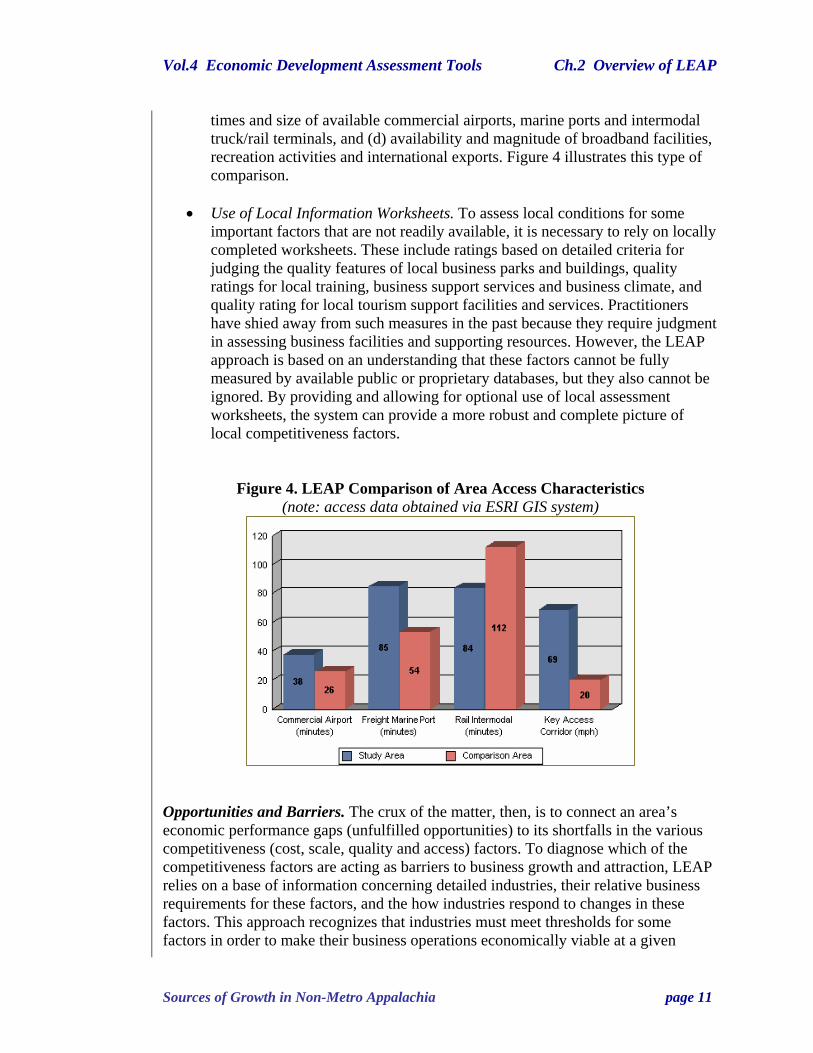
times and size of available commercial airports, marine ports and intermodal truck/rail terminals, and (d) availability and magnitude of broadband facilities, recreation activities and international exports. Figure 4 illustrates this type of comparison.
• Use of Local Information Worksheets. To assess local conditions for some
important factors that are not readily available, it is necessary to rely on locally completed worksheets. These include ratings based on detailed criteria for judging the quality features of local business parks and buildings, quality ratings for local training, business support services and business climate, and quality rating for local tourism support facilities and services. Practitioners have shied away from such measures in the past because they require judgment in assessing business facilities and supporting resources. However, the LEAP approach is based on an understanding that these factors cannot be fully measured by available public or proprietary databases, but they also cannot be ignored. By providing and allowing for optional use of local assessment worksheets, the system can provide a more robust and complete picture of local competitiveness factors.
Figure 4. LEAP Comparison of Area Access Characteristics (note: access data obtained via ESRI GIS system)
Opportunities and Barriers. The crux of the matter, then, is to connect an area’s economic performance gaps (unfulfilled opportunities) to its shortfalls in the various competitiveness (cost, scale, quality and access) factors. To diagnose which of the competitiveness factors are acting as barriers to business growth and attraction, LEAP relies on a base of information concerning detailed industries, their relative business requirements for these factors, and the how industries respond to changes in these factors. This approach recognizes that industries must meet thresholds for some factors in order to make their business operations economically viable at a given

Vol.4 Economic Development Assessment Tools Ch.2 Overview of LEAP
Sources of Growth in Non-Metro Appalachia page 12
location. For instance, the thresholds can be minimum market size requirements (common for financial and business services), maximum access times to airports (common for electronic products), and/or delivery time and reliability requirements along supply chain corridors (common for just-in-time automotive parts). Additional elements of the information base include baseline industry growth forecasts and inter-industry supplier and buyer relationships, which together provide information on how attracting one industry can create spatial cluster opportunities to also attract additional growth through complementary industries. In this way, LEAP identifies sets of industries that are good targets for economic development based on the match of local characteristics and the operating requirements of each industry. For those industries that are currently lagging but could offer future growth opportunities, it identifies the nature of current disadvantages that need to be overcome in order to effectively promote more local business activity. Figure 5 shows an example of a LEAP diagnostic report and the resulting identification of factors responsible for current industry performance gaps.
Figure 5. LEAP Diagnosis of Factors Holding Back Economic Growth in a Sample Study Area
Armed with these diagnostics, LEAP identifies industry targets with the greatest opportunities for direct business attraction, the magnitude of potentially achievable growth, and the factors that must be addressed to realize those results. It also helps practitioners consider opportunities for building upon inter-industry linkages – in other words, sets of industries that build on common needs and buyer-supplier relationships. Complementary industries are types of business which are not primary target industries, but which may nevertheless represent growth opportunities because they are suppliers of goods and services to the primary target industries or otherwise interact with them. In this case, any direct opportunities for business growth may also indirectly create opportunities for growth in complementary industries that do not directly depend on highway access.

Vol.4 Economic Development Assessment Tools Ch.2 Overview of LEAP
Sources of Growth in Non-Metro Appalachia page 13
Policy Analysis considers how some barriers to business growth and attraction can be minimized or overcome by the programs and projects of local planners and economic developers. Local public policies and programs and projects can include improvements in the availability and adequacy of local education, workforce skills training, infrastructure enhancement, business site development, access to airports, sea ports, and rail; and improvements to highways or initiation of improved support services. By applying the base on information on industry growth factors, the system can then identify the potential impact of proposed policies or projects on business attraction, and present estimates of the range of resulting impact on jobs, income, value added or business output. The impacts are expressed in terms of range estimates, based on risk factors including industry volatility and sensitivity to business cycles. Follow On Actions. Economic development targets identified from LEAP will only be achieved if a strategy plan is put in place to address remaining needs and to actively entice such business growth and attraction. Once potential opportunities for targeting future business growth and attraction have been identified, along with needs for addressing existing barriers, the economic developer must devise a process to work with other area agencies and leaders in forging a strategy plan. This includes agreement on targets and goals, and a program of action steps covering organizational, staffing and financing plans to pursue the goals, as well as some form of monitoring and evaluation of results.
2.3 LEAP Uses for Appalachian Growth Performance Indicators. For regional and state economic development agencies, LEAP was designed to be used in several ways. First, it provides economic development performance indicators, reflecting the area’s economic performance, trends and growth opportunities, as well as comparison of those performance indicators to surrounding areas or counterparts elsewhere. LEAP provides a large volume of key information that would take considerable effort for local economic development agencies to assemble and process themselves. This includes the following
• The core data on employment and business output (patterns and shifts over time) is provided through a cooperative agreement with Minnesota IMPLAN Group, Inc. (MIG). It is developed from information compiled by the US Bureau of Economic Analysis, US Bureau of Labor Statistics, Zip and County Business Patterns, and the Economic Census, with additional enhancement to provide full details for small areas without suppression. We update aggregate estimates using information from more recent Dun & Bradstreet.
• Additional information on local concentration of international exports and local purchasing patterns is also provided by MIG under cooperative
Vol.4 Economic Development Assessment Tools Ch.2 Overview of LEAP
Sources of Growth in Non-Metro Appalachia page 14
agreement. The export estimates are based on International Trade Administration data, while further analysis of local source purchasing is derived from calibrated IMPLAN models.
• Local travel times, accessibility measures, delivery markets and labor markets
are derived from highway network drive times along with business and demographic data, using a Geographic Information System (GIS) from ESRI.
• Other local information includes: (a) workforce characteristics, educational
attainment and housing costs derived from the US Census; (b) Utility costs derived from the Energy Information Administration, Edison Electric Institute and Energy User News; (c) Local taxes and government revenues compiled from the Census of Government; (d) Airport, marine port, and freight intermodal facility locations and activity levels are based on inventories maintained by the US Dept of Transportation.
Support for Strategic Review. A second use of LEAP results is use of its evaluation reports to support both internal organization strategy and outside information dissemination. This includes the following:
• Profile of business attraction strengths and weak nesses, such as the size of the labor market and delivery market, availability of transportation and broadband telecommunications facilities, and workforce education.
• Tracking change in the local area economy is changing over time, in terms of
gains and loses in employment and/or business sales in various local industries. Also identify local industries where local business sales are gaining while jobs are dropping as a result of increasing outsourcing and/or mechanization).
• Comparison of local performance relative to adjacent or competing areas (or
the state as a whole), to identify how the local area has been over- or under-performing in terms of its business mix and business growth performance.
• Benchmarking of local competitiveness for various growth paths, by showing
relative differences in workforce skills, educational attainment, transportation access, broadband penetration, and quality of industrial parks.
Strategy Development. Finally, LEAP can provide information that can help guide strategy for pursuing various growth paths. This includes the following elements:
• Identification of barriers holding back local current success in promoting business growth and attraction economic performance: LEAP identifies the specific factors that are constraining local business growth and attraction, and the specific industries that are being constrained.

Vol.4 Economic Development Assessment Tools Ch.2 Overview of LEAP
Sources of Growth in Non-Metro Appalachia page 15
• Target Industries that represent opportunities for business attraction. LEAP identifies the best industries to focus on, the magnitude of the potential opportunity and the extent of uncertainty associated with it. It also identifies mutually supporting and complementary industries that can be an indirect element of a growth strategy.
• Policy Actions that can affect the type and size of industry growth
opportunities and targets. LEAP allows you to estimate how proposed scenarios for enhancing industrial parks, transportation infrastructure, job training and business support services may change target opportunities.

Vol.4 Economic Development Assessment Tools Ch.3 Use of Findings
Sources of Growth in Non-Metro Appalachia page 16
3 USE OF FINDINGS FROM SOURCES OF GROWTH PROJECT
3.1 Enhancing Analytic Capabilities The Sources of Growth project provided a synthesis of theory and prior research on growth paths, a day-long workshop of experts in the field, and empirical studies of factors affecting economic growth in Appalachia. As summarized in the prior three volumes, these efforts highlighted critical considerations in defining alternative growth paths and their determinants. That has enabled us to identify ways in which LEAP tools can be improved to better serve the needs of Appalachian LDDs and State Economic Development Agencies. These improvements fall into three categories:
• Defining Growth Paths. Until now, LEAP has focused on evaluating and identifying appropriate target industries for local areas. However, the research conducted for this study suggests that there can be additional value in explicitly identifying classes of target growth paths (rather than just target industries) that local areas can pursue in their economic development strategies. An example of such a classification is shown in Exhibit 3-1.
• Rating Existing Situation. Until now, LEAP has focused on characterizing existing conditions through ratings of local economic performance and trends. However, the research conducted for this study enables us to also develop ratings of localized growth specialization. Such ratings can reflect the extent to which a local area is already specializing as a resource-based, learning-based, tourism-based, supply-chain based or trade center based economy.
• Rating Potentials for Alternative Growth Paths. Until now, LEAP has focused on recommendations of economic growth opportunities in terms of potential industries. However, the research conducted for this study provides us with a further capability for recommending potential growth path directions based on potential competitive advantages such as labor skills, road networks, climate or technology infrastructure features.

Vol.4 Economic Development Assessment Tools Ch.3 Use of Findings
Sources of Growth in Non-Metro Appalachia page 17
Exhibit 3-1. Definition of Six Major Classes of Economic Growth Paths Basis for Area’s Economy Growth
Description
Trade Center Growth pattern emanating from a small urban cluster that provides goods and services to the exurban communities & rural hinterlands
Agglomeration (e.g. cluster economy)
Growth resulting from geographic concentrations of interconnected businesses and institutions that enhance the productivity of the core industries.
Supply-Chain (e.g. dispersal economy)
Remote location is chosen over the central metropolitan area to host a node of economic activity (distribution or assembly) that is part of a larger (geographic) production chain.
Natural Amenity or Cultural Assets
Growth as a result of either quality-of-place attracting new households –or – efforts to actively develop & promote cultural, recreation, eco-tourism venues and their supporting visitor services.
Knowledge (Learning) Assets
Growth opportunities leveraged from the collective knowledge embodied in the region, including social capital, technical applications / commercialization, institutional assets (educational and financial), entrepreneurial start-ups.
Other Growth Paths: Natural Resources and Government
Growth made possible by the existence of long-standing mineral, lumber or agricultural resources, or by the decision of government agencies to site major regional or national facilities in an area.
The remainder of this chapter describes various measures that can be constructed to assess the current growth path status of an area or the factors affecting local potential for various growth paths. The measures that are listed and discussed in the rest of this chapter are not intended to represent a complete list of desired or possible metrics. Rather, they are intended to represent what is known to be currently possible given (a) publicly available data sources and (b) proven metrics that have been demonstrated in the literature of prior studies (described in Volume 1) or recent empirical studies (described in Volume 3). These various measures represent potential additions to enhance the value and use of LEAP for assessing growth path opportunities. At the time of this report’s publication, some have been implemented, some are planned for implementation in the near future and others are still in the proposal or development process. Updates on the status of these changes will be posted for participating registered users of the LEAP system, including Appalachian Local Development Districts and Appalachian State Economic Development Agencies at www.edr-leap.com ..

Vol.4 Economic Development Assessment Tools Ch.3 Use of Findings
Sources of Growth in Non-Metro Appalachia page 18
3.2 Trade Center Development Paths A micropolitan trade center provides goods and services to a surrounding rural “hinterland.” It depends on having a small but critical base of population and employment, a nature junction of traffic routes serving surrounding areas, and distance or topographical features that encourage residents and employees in those surrounding areas to visit this trade center location rather than other adjacent or nearby areas as their center for buying retail goods and consumer services. The plan is to improve LEAP by providing each county or group of counties (comprising a region or Local Development District) with trade center indicators rating for both existing conditions and future potential opportunities. Rating Existing Situation. A description of trade center-based economies is provided in Volume 1. It indicates that a trade center is characterized by having a larger than normal concentration of retail stores and consumer and professional services (barbers, doctors, loan companies) than would be expected, given its population base. Of course, a given area may be a strong trade center that is well-serving a large surrounding area, or it may be a weak trade center that only partially services outside areas. This leads to the following proposed indicators of existing conditions:
• Economic Base Indicator: Consumer Trade-Based Concentration – This indicator is defined as the ratio of local employment in retail + consumer services + professional services, divided by local population.
• Trade Center Micro/Metro Rating – This indicator is defined as the county or
place that has a high rating for the above-cited consumer-based concentration and is also designated by the US Census as a “metropolitan center” or “micropolitan center” on the basis of net inflows of workers coming in from surrounding counties.
Rating Potentials for Future Trade Center Growth. Discussion of the determinants of trade center-based economies are provided in Volume 1 as well as case studies in Volume 2. In addition, relevant research on economic hubs, spokes, and market area effects are described in Volume 3. These documents focus on transportation, topography and population clustering patterns that create centers of consumer trade activity serving surrounding trade areas that do not have similarly strong centers of activity. This leads to the following diagnostic indicators:
• Economic Base: Trade Linkages– Technically known as a “spatial lag multiplier,” this measure is an indicator of the extent to which economic activity for each industry in a given county is supported by demand generated in neighboring counties. It is calculated by considering the industry mix of each county and that of neighboring counties and information on inter-industry relationships. It effectively captures situations where one county is serving as

Vol.4 Economic Development Assessment Tools Ch.3 Use of Findings
Sources of Growth in Non-Metro Appalachia page 19
the hub of economic activity for other surrounding counties. Details of this measure are provided in the Volume 2, Chapter 2 report where it was successfully used to explain trade center growth. It is based on work by Ismail at MIT, updating original work by Smirnov.
• Labor Market Area (Scale) – This is an indicator of the size of the workforce
or population base that lives within a given (40, 50 or 60 minute) drive time of the population center of a county. It thus reaches into neighboring counties to calculate a “market area”, which can be interpreted as an indicator of the relative size of both the labor market for any industry and the shopper customer market for retail and consumer service industries. This measure is constructed on the basis of geographic information systems and highway network drive times. It is a variant of the population base used for analysis in Volume 2, Chapter 4 of the Sources of Growth Study. This indicator is now implemented in EDR-LEAP.
• Composite Trade Center Indicator – This indicator combines spatial lag
multipliers or trade area indicators with information on distance to the closest larger city or urban county. It is intended to overcome a problem confronting both of the preceding indicators, which is that they assume a strong central city surrounded by a rural hinterland, and can provide misleading results when there are actually multiple cities of significance in a multi-county region. For instance, the spatial lag multiplier seemed to indicate that Scioto County, OH was a strong trade center when it found economic strength in that county and evidence that residents of surrounding counties were going outside their home counties for purchasing of goods and services. However, the case study (in Volume 2, Chapter 2) found that the residents of those surrounding counties were actually shopping in extra-regional metro centers due to new highway access thereby creating an adverse backwash effect on Scioto County. By measuring the distance to next larger cities or urban counties, this error can be minimized.
3.3 Industry Agglomeration Cluster Paths Agglomeration-based economic growth is based on development of geographic concentrations of interconnected businesses and institutions that enhance the productivity of the core industries. It most often depends on achieving some form of: (a) economies of scale in operations of a single industry, or (b) economies of vertical integration associated with clustering industries that buy from and sell to each other, or (c) economies associated with several industries sharing a common skill or resource base in a given region. The plan is to improve LEAP by providing each county or group of counties (comprising a region or Local Development District) with agglomeration cluster indicators rating for both existing conditions and future potential opportunities.

Vol.4 Economic Development Assessment Tools Ch.3 Use of Findings
Sources of Growth in Non-Metro Appalachia page 20
Rating Existing Situation. A description of agglomeration -based economies is provided in Volume 1. It indicates that an industry agglomeration cluster is characterized by having a larger concentration of individual production-based sectors and their directly complementary sectors, relative to the rest of the economic base mix. This leads to the following proposed indicators of existing conditions
• Economic Base: Manufacturing Concentration – This indicator is an index
reflecting the extent to which any one or more manufacturing industries have a higher concentration (location quotient) in the study area that the statewide average.
• Economic Base: Vertical Integration of Suppliers – This indicator is an index
reflecting the extent to which the dominant manufacturing industries also have a strong relative concentration of their suppler industries within the region. That is determined by using the tables of inter-industry purchasing patterns (technology coefficients) within BEA national input-output tables. These input-output relationships are already in use within LEAP for the identification of indirect business attraction opportunities; the proposed new measure would use that information for also assessing existing industries.
Rating Potentials for Future Industry Cluster Growth. Discussion of the determinants of trade center-based economies is provided in Volume 1, along with the manufacturing case study (Alabama’s auto manufacturing cluster) in Volume 2. These documents focus on the scale and density of industries, workforce skills and supporting facilities, as well as their cost and quality. This leads to the following diagnostic indicators:
• “Effective Density” of Opportunities Rating – This is a composite indicator of the productivity gain associated with increasing the effective density of activities reachable from a center of industrial activity. It is calculated on the basis of population based within 40 minutes of the population-weighted center of the core county, divided by the land area of the county. It effectively represents density of the county population, modified to add extra “effective density” if additional outside population is close by. This measure is based on research results of “Productivity and Metropolitan Density,” by Timothy Harris and Yannis Ioannides, Tufts Univ. Dept of Economics, 2000. This measure is now implemented in LEAP.
• Gap Analysis: Vertical Integration of Suppliers – This is the flip side of the
economic base measure cited earlier. It reflects that proportional magnitude of the gap between (a) level of local employment in suppliers to the dominant manufacturing industry, and (b) the theoretical maximum employment if all suppliers were locally present.
• Barrier Analysis: Cost Competitiveness – This is a composite measures of the

Vol.4 Economic Development Assessment Tools Ch.3 Use of Findings
Sources of Growth in Non-Metro Appalachia page 21
local cost of labor, energy and transportation inputs for each industry, relative to competing areas or other comparison areas. It is calculated using relative weights for the degree to which each industry makes use of labor, energy and transportation factors in is production process. This calculation is now implemented in LEAP.
3.4 Supply-Chain (Dispersal) Paths Supply-chain based economic growth is based on development of suppliers and distributors strung along a highway corridor. This arrangement makes use of dispersal economies for keeping labor costs low, and it makes use of transportation connection efficiencies associated with same day delivery. In some cases, it also makes use of multi-modal delivery connections (e.g., intermodal truck-rail or truck-air connections). The plan is to improve LEAP by providing each county or group of counties (comprising a region or Local Development District) with supply chain ratings for both existing conditions and future potential opportunities. Rating Existing Situation. A description of supply chain economic growth is provided in Volume 1. It indicates that a supply chain-based economy is most often characterized by having a larger than normal concentration of distribution facilities and/or parts suppliers to assembly plants (e.g., metal or plastic product fabricators serving auto plants). This leads to the following proposed indicators of existing conditions
• Economic Base: Logistics Concentration – This is an index reflecting the extent to which warehousing/distribution, wholesaling, and trucking industries have a higher concentration in the study area that the statewide average. This is reflected in a composite “Location Quotient” for those logistics-related industries.
• Economic Base: Fabricated Parts Suppliers – This is an index reflecting the
extent to which metal, plastic or glass fabrication industries have a higher concentration in the study area that the statewide average. This is reflected in a composite “Location Quotient” for those fabrication industries.
Rating Potentials for Future Supply Chain Growth. Discussion of the determinants of supply chain -based economies is provided in Volume 1 and the auto alley case study in Volume 2. These documents focus on the roles of labor cost, industry mix and location relative to highways, in addition to highway and connections with intermodal rail and air terminals. This leads to the following diagnostic indicators:
• Major Highway Access – This is constructed as a measure of distance from the county population-weighted center to the nearest four-lane or interstate level highway. Alternatively, the county’s mileage of four lane highways can be
Vol.4 Economic Development Assessment Tools Ch.3 Use of Findings
Sources of Growth in Non-Metro Appalachia page 22
used to reflect the extent of highway access occurring in the county, as done in the “Twin County” study described in Volume 3, Chapter 3. Either way, the highway measure can be used with the measures of logistics and fabricated parts suppliers to improve the indicator of supply chain supporting activity.
• Drive time to Commercial Airport – This is a measure of the highway drive
time from the county population-weighted center to the nearest public airport with regular commercial scheduled airline service. It is combined with information on the magnitude of service provided at that airport (measured in terms of the number of annual commercial airline takeoffs and landings), so that both airport proximity and airport size (service level) are reinforcing positive factors. This interaction reflects the new empirical analysis described in Volume 2, Chapter 4. The measure also requires a database of commercial airport facilities from the FAA, and a highway network with shortest time path travel times. This has now been implemented in LEAP.
• Drive time to Commercial Rail Intermodal Terminal – This is a measure of the
highway drive time from the county population-weighted center to the nearest freight truck-rail intermodal terminal with regularly scheduled commercial scheduled freight train service. It requires a database of commercial truck-rail intermodal interchange facilities (from USDOT) and a highway network with shortest time path travel times. This has now been implemented in LEAP.
• Drive time to Commercial Marine Port – river to sea – This is a measure of the
highway drive time from the county population-weighted center to the nearest marine (river or sea) port with regularly scheduled commercial marine ship or barge service. It requires a database of commercial marine terminals with regular service (from USDOT) and a highway network with shortest time path travel times. This has now been implemented in LEAP.
• Labor Force Scale Rating – This is a measure of the population or workforce
living within 40 minutes drive time from the county population-weighted center. A minimum level of workforce is needed to attract warehousing, wholesaling and related logistics-related industries, as shown in Volume 3, Chapter 4. Thus this measure can be interacted with the preceding four transportation access measures to develop more refined measures of potential area attractiveness for growing supply-chain based activities t an area.
3.5 Amenity & Cultural Asset Growth Paths Amenity and cultural assets are “quality of place” features that can serve to attract new households to an area for a tourist visit or as a retirement destination. The attractions can be climate, interesting mountains or water features, and/or developed cultural activities or recreation venues. The plan is to improve LEAP by providing each

Vol.4 Economic Development Assessment Tools Ch.3 Use of Findings
Sources of Growth in Non-Metro Appalachia page 23
county or group of counties (comprising a region or Local Development District) with amenity and cultural asset activity ratings, for both existing conditions and future potential opportunities. Rating Existing Situation. A description of amenity and cultural asset-based economies is provided in Volume 1. It indicates that this type of growth path is characterized by a concentration of lodging, meal and/or recreation activities, serving either day visitors or overnight visitors. This leads to the following proposed indicators of existing conditions:
• Economic Base: Lodging, Restaurants and Recreation Concentration – This is an index reflecting the extent to which local lodging (hotel, motel and camping), meals (restaurants, bars and takeout establishments) and recreation services have a higher concentration of employment in the study area than the per capita statewide average for those activities. This is reflected in a composite “Location Quotient” for those visitor-serving industries. This has now been implemented in LEAP.
• Housing/Population Base: Retirees – This is an index reflecting the extent to
which the local area has a higher share of population that is retired and living in the region shorter than five years. It draws information from the US Census Bureau and their Current Population Survey.
Rating Potentials for Future Amenity & Cultural Asset-Based Growth. Discussion of the determinants of amenity and cultural asset -based economies are provided in Volume 1, as well as the case study of asset-based growth (e.g Chautauqua County, NY and the Corridor K region) in Volume 2. These documents indicate that this economic growth path depends on having some combination of: (1) desirable climate, (2) interesting water, mountain or other scenery features, (3) interesting cultural, creative or recreational visitation sites and (4) access to a nearby population market for day trips. In the case of some large regional or national draws, it may also depend on (5) highway and airport for long-distance trips. Unfortunately, there is no good database that can identify the locations of man-made sites of interest, and particularly places where there is a potential for future development of cultural, creative or recreational attractions (factor #3 above). However, it is still possible to obtain or derive data relating to factors #1-2 and #4-5 above, and those factors lead to the following diagnostic indicators:
• Climate Rating – Composite ratings of outdoor temperature comfort levels can be used as a factor affecting the potential for outdoor activities including tourism and recreation. This information can be drawn from NOAA data on temperature conditions in weather stations across the country, covering all states and metropolitan areas. For each location, their database provides monthly data on temperature averages and ranges, as well as heating and cooling “degree-days” (indicators of comfort levels for outdoor activities and

Vol.4 Economic Development Assessment Tools Ch.3 Use of Findings
Sources of Growth in Non-Metro Appalachia page 24
need/cost of running heaters and air conditioners if indoors). This database has now been assembled for potential use in LEAP.
• Physical Amenity Rating – Composite ratings of physical amenities can be
used to represent the attraction of an area as a place to live. The ERS-USDA “Natural Amenities Scale” is an index reflecting the extent to which each county offers topographic variation (hills and mountains) and water areas (lakes, rivers and seacoasts), as well as temperate weather and low humidity. It is provided by the Economic Research Service (ERS) of the US Dept. of Agriculture (USDA). This dataset was obtained and used in the Volume 3, Chapter 5 study by MIT, though that use was in the context of predicting economic distress (where it was not a significant explanatory factor) rather than the context of assessing amenity-based tourism and retirement activities (where it would be a much more relevant factor). It is now available for potential use in LEAP.
• Major Highway Access – Good highway access is needed for development of
most tourism and visitor attraction sites. This can be measured in terms of distance from the county population-weighted center to the nearest four-lane or interstate level highway. That is the same measure discussed earlier for evaluation of supply chain growth potentials.
• Urban Rating – Urbanized areas could provide a larger density of population
and higher likelihood of multiple attractions for some types of day-trip tourism. Degrees of urbanization can be measured in terms of the ERS/USDA “Rural-Urban Continuum Codes” -- a classification scheme of nine steps that distinguishes metropolitan counties by population size and non-metropolitan counties by degree of urbanization and adjacency to metropolitan areas. The urbanization measure was used in the Volume 3 study of general spatial influence factors. However, the role of this factor particularly for tourism and amenity based development is not yet proven.
3.6 Learning and Technology Growth Paths Learning and technology growth paths are forms of economic development that leverage the collective knowledge of specialized technologies and/or the entrepreneurial base that is embodied in the residents and workforce of a region. These features are typically the result of two factors: (1) specialized workforce training, including experience with technical applications and/or commercialization processes, and (2) strength of specialized supporting systems such as colleges, research & development facilities, financial institutions and high levels of broadband availability and usage. The plan is to improve LEAP by providing each county or group of counties (comprising a region or Local Development District) with learning and technology-based ratings for both existing conditions and future potential

Vol.4 Economic Development Assessment Tools Ch.3 Use of Findings
Sources of Growth in Non-Metro Appalachia page 25
opportunities. Rating Existing Learning-based Setting. A description of learning and technology-based economic growth is provided in Volume 1. It indicates that areas with this type of economic growth path are often characterized by having a larger than normal concentration of activity in supporting institutions, including graduate level higher education institutions, private research laboratories, and science-based industries (such as pharmaceuticals and computer electronics). This leads to the following proposed indicator of existing conditions:
• Economic Base: Education, Research and Development –This is an index reflecting the extent to which higher education institutions, research and development laboratories and science-based industries account for a higher portion of employment in the study area than the statewide average for those activities. This is reflected in a composite “Location Quotient” for education, research and technology industries.
Rating Potentials for Future Learning-Based Growth. Discussion of the determinants of learning and technology-based economies are provided in Volume 1, as well as the case study of technology development (Morgantown-Fairmont WV) in Volume 2. They indicate that key factors affecting success in learning-based economic development are: workforce training and entrepreneurship, supported by concentrations of educational institutions and research centers, availability of broadband technology, and availability of financing options. Those factors lead to the following diagnostic indicators:
• Four Year Colleges (spatial lag) – This measure is defined as the number of students attending four year colleges and graduate programs in the specified county and surrounding counties. It is constructed parallel to the “spatial lag” variable, defined earlier to measure local concentrations of activity that serve a broader “hinterland” region. A database listing the names and addresses of all colleges is provided by the US Dept. of Education. This measure is being processed and will soon be programmed as an addition to LEAP operations.
• College Graduates – This measure is defined as the portion of the active
workforce in a given county that has completed at least four years of college, relative to the national average. It is derived from US Census Bureau data. The rating can also be scaled by workforce size, if desired. The basic measure has now been implemented in LEAP.
• Broadband Access – This measure is defined through a 0 – 4 scale reflecting
the number of competing service companies offering broadband access in a given area. It is compiled from FCC and telecom/cable industry sources. The premise behind this measure is that greater availability and more competition lead to increased coverage and reduced prices compared to places where such competition is not available. This measure has now been implemented in

Vol.4 Economic Development Assessment Tools Ch.3 Use of Findings
Sources of Growth in Non-Metro Appalachia page 26
LEAP.
• Entrepreneurship – This measure reflects the fact that some areas have attracted a population base that exhibits notably higher than normal rates of entrepreneurship. This may be due to some combination of location isolation, cultural traditions, local institutions or historical factors. The Federal Reserve Bank of Kansas City has developed “Entrepreneurship Indicators” on the basis of BEA and Census data about local employment and income generated by non-farm proprietors.
3.7 Natural Resource & Other Growth Paths There are other economic growth paths that need to be acknowledged, though we do not develop measures of their status or growth factors for reasons that are explained below.
• Natural resource-based economic growth is that made possible by the existence of mineral, lumber or agricultural resource assets. Historically, the American economy through the mid nineteenth century was based primarily on natural resource development, and many rural areas across America still depend on it. A problem that plagues many rural areas, but particularly rural Appalachia, is that the coal mining and lumber/wood resources that were previously the mainstay of local economies is no longer a source of job growth (while industry output has grown by investing in technology-enhancements.) Therefore, most of these areas are making attempts to diversify away from a resource-based economy. Accordingly, we do not focus heavily on natural resources among the various forms of asset-based growth in this study (the exception is the case study in Volume 2 for Pike County, KY) for the Appalachian Regional Commission.
• Government and institution-based economic growth is made possible by the
external decision of government agencies (federal and/or state) and private institutions to site major regional or national facilities in an area. There are some notable examples of military bases, government office facilities, colleges and research labs that have chosen to locate in rural, isolated areas within Appalachia and elsewhere. Some of these decisions were made in part to help “jump-start” a local economy. However, the political, personal and institutional preference factors underlying these decisions are usually outside of local control. Hence, we do not develop measures to reflect the potential for this form of economic growth.

Vol.4 Economic Development Assessment Tools Ch.3 Use of Findings
Sources of Growth in Non-Metro Appalachia page 27
3.8 Supporting Local Economic Development Use of LEAP. The Local Economic Assessment Package (LEAP) is being used by the Appalachian Regional Commission as a means of providing its Local Development Districts (LDDs) and the Appalachian state-level economic development agencies with both relevant information and diagnostic tools for improving economic development. Adding measures of the current growth path status of local areas, as well as ratings of potential opportunities for pursuing various growth paths will impart new capabilities to the LEAP analysis. Instead of just offering diagnostics and targets in terms of industries, it will also be capable of offering diagnostics and targets in terms of growth paths. By having both capabilities, ARC, the LDDs and the state agencies can be empowered to make more informed and better targeted economic development strategies for local development. Further Research and Enhancement of Tools. The improvements laid out in this chapter are an initial attempt to expand the economic development analysis tools and assessment methods beyond the industry-based cluster targeting that has been a mainstay of the economic development field for many decades. The research discussed in Volume 1, the case studies in Volume 2 and the new empirical analysis covered in Volume 3 all point to a common conclusion -- that local economic development success comes from the confluence of many factors, and further work is clearly necessary to further untangle their roles and effects. In particular, the work completed in those three earlier volumes also moves forward our state of knowledge and understanding of economic development growth factors. In particular, it confirms the importance of understanding “spatial linkages” – factors that tie the economic development success of an individual county or a region to the broader economic development patterns and trends of their neighbors – proximal and /or economic. That work also confirms the key role that accessibility and Appalachian transportation improvements can make in affecting all of the various economic development growth paths. As new research is completed, further improvements can be made in our diagnostic measures of growth path opportunities and targets.

Vol.4 Economic Development Assessment Tools Ch.4 Study Conclusions
Sources of Growth in Non-Metro Appalachia page 28
4 CONCLUSIONS FROM THE STUDY OF SOURCES OF GROWTH
4.1 Lessons learned from the Comprehensive Examination
This multi-year study effort on non-metro Appalachian growth prospects combined several research techniques to examine various hypotheses on the growth processes that may be most compatible with local conditions and assets (both physical and human-made). The working hypothesis of this inquiry is that when local economic development efforts are better informed by the use of the new tools and insights about what they have to work with – including the attributes of neighboring communities/economies – such efforts will yield better suited opportunities for growth than when planned in isolation. That being said, it is not always transparent to even local economic developers what the explanation is for one rural county’s success story. Even if that evidence can be articulated retrospectively, it is likely that the perspectives would differ in terms of the identifying the most critical factor(s) to the economic turnaround and in the sequence of socio-economic/policy events – whether local, regional, national or global.
4.2 Lessons from the Case Studies In the few instances where case study results did not entirely agree with the expected model generated patterns of growth, we gained a new understanding of how neighboring economies’ spatial influence exert adverse backwash effects on the case study economies (such as the influence of the Cincinnati metro area on the development path of Scioto County, OH). In essence we learned about the limitations of the spatial economic base modeling diagnostics and reinforced the validity of findings from other research, such as by Feser (2005). This discovery process added another dimension to our understanding of the processes influencing the current and desired economic performance in non-metro Appalachia. In short, while timing and
Vol.4 Economic Development Assessment Tools Ch.4 Study Conclusions
Sources of Growth in Non-Metro Appalachia page 29
patience are key features of every strategy plan, and its associated outcomes, these results underscore the need for a periodic reassessment of how the local economy and labor market are changing in relation to neighboring economies. Market access opportunities are rarely evenly distributed which makes it all the more imperative to (a) improve what you can, and then with the remaining access limitations (b) plan regionally so that the growth opportunities that have emerged for one county (e.g. Pike County, KY) may exert more of a beneficial spillover to distressed, neighboring counties. Engaging the educational system – from K-12 to leveraging certificate programs and community colleges – has to be one of the first steps to re-conditioning the existing workforce and preparing the county’s future working age residents for meeting regional employment demand – especially if job growth is slow to ignite in the home county. This also requires that the workforce has access to the transport infrastructure to connect to the employment center. This evolution of events was most clearly demonstrated in the case of Alabama’s success in building its current auto assembly cluster. Both the educational resources and transportation infrastructure of a county can evolve to take on more dynamic roles to shaping local and regional growth outcomes. As the case of the Morgantown-Fairmont high-tech development demonstrated, the R&D investment and population that are drawn to locations with higher-education institutions and government research facilities are rewarded with broader networks (e.g. social capital), commercialization of research, business start-ups, and opportunities for higher wage job formation. These are the benefits conferred on learning-based economies. In addition to Alabama’s responsive educational system, auto assembly manufacturing took hold throughout the state as a result of plentiful development sites (many as greenfields and flat terrain) and the fact that Alabama’s ample highway network allowed in-state auto manufacturing firms to participate in several national supply chains as well.
4.3 Key Findings from Empirical Studies
These studies shed new light on what causes some non-metro Appalachian counties to make economic strides forward, while others remain distressed. Key objectives of these studies were an examination of the role of economic linkages among counties, and the effects of demographic factors, industry mix, mountain topography, market access and highway improvements, among other factors, in affecting relative economic performance. Of particular note is the exploration of new techniques to examine spatial and economic linkages in a region to help diagnose complementary development prospects for the economic base of neighboring counties. Another contribution is the empirical study of the economic development impact of the ADHS, which provides evidence on the significant impact of new corridors in the system, as

Vol.4 Economic Development Assessment Tools Ch.4 Study Conclusions
Sources of Growth in Non-Metro Appalachia page 30
well as the continued importance of manufacturing in accounting for the growth differences of Appalachian counties as compared to their socioeconomic non-Appalachian twins. The set of empirical studies provide important insights into how spatial measures interact with demographic, industry, geographical and transportation variables to influence economic performance and growth rates. Taken together these findings provide better calibrated economic analytical techniques that can help to identify relevant development paths given the assets, linkages and constraints of the counties within their regional neighborhood. Economic Base Studies: The spatial linkage economic base model provides new tools to diagnose the economic development prospects of counties relative to their neighbors and the larger surrounding region. The principal distinction between the classical export-base model and the modified spatial model is that in the spatial model, the export-base is segmented into two components where the “local” oriented export-base is linked directly to “global” export activities in the neighboring counties. In addition, this approach introduces the concept of regional neighborhood which can be understood as the sphere of immediate economic influence of a county’s economy exerted via common infrastructure, economic linkages, shared labor pools, etc. Because most of these effects diminish with geographical distance, it is reasonable to assume initially that most of these cross-county border interactions affect neighboring counties.
The spatial export base method provides insights into the development potentials of the distressed and transitional counties’ export-base, but the methodology is perhaps best used on a regional and sub-regional basis rather than on a county basis. While this analysis can be used to create profiles for each county, highlighting the multipliers, the top industries for each county, etc., users should not construe these county profiles as policy prescriptions since by definition the profiles reflect the influences of neighboring counties. Instead this approach should be used for a cross-county comparison to understand the relative characteristics of these counties such as the degree of industry diversification or concentration, or the regional linkages. This application may be useful in identifying potential “growth hubs” that possess strong spatial and economic linkages with their neighbors and the potential to generate regional growth, but caution is recommended given important data and modeling limitations as evidenced by the case study of Scioto County, OH in Volume 2. Moreover, this model has analytical limitations in applications to remote, rural counties. In this context it is recommended that this method be applied to groups of counties for case studies that examine the spatial forces at work on each county in a specific neighborhood.
Vol.4 Economic Development Assessment Tools Ch.4 Study Conclusions
Sources of Growth in Non-Metro Appalachia page 31
Transportation Access Studies: Several facets of these studies examine the impact of different types of transportation accessibility in affecting the economic performance and prospects of counties. The Impact of the ADHS: The key empirical finding of twin county study on the impact of ADHS is that by 2000, the performance of ARC counties with open ADHS segments had higher income growth relative to their non-Appalachian twins, with the ADHS counties posting 200% more income growth over the 1969-2000 period. This finding can be compared to the growth rate gap between all ARC counties and their twins. By 2000 income in all ARC counties had grown 131% more since 1969 than in the non-Appalachian counties; earnings growth was 96% higher; population growth was 9% higher; and per capita income growth was 36% higher. Thus, this study showed that using survey-based data overcame shortcomings in earlier analyses to demonstrate a robust statistical link between ADHS investments and differential income and earnings growth between ARC counties and their twins, particularly for new construction. These findings also suggest that there is a considerable lag between highway investments and their full effect on economic growth. The twin county study also provides insight into the uneven performance in the ARC region during this period: performance in the northern part of the ARC region not only lagged its non-Appalachian twins but also the rest of Appalachia, and smaller metropolitan areas fell far behind their non-Appalachian counterparts. By contrast, the study of long-term trends also showed that the states performing best relative to their non-Appalachian “twins” (i.e., Georgia, Kentucky, and South Carolina, and Tennessee) appeared to do so in part on the strength of their performances in manufacturing. This reinforces the finding that manufacturing clusters are still an important source of economic growth.
Airport Accessibility: This study found that there are the types of industries that can be expected to situate near airports because they rely on business air travel for meetings with either clients or other office locations of their business. Businesses that appear to particularly value reductions in travel time to airports include wholesale trade, paper manufacturing, insurance, and professional services. While these findings on airport access make sense, there is need for further analysis of the business attraction relationship to airport access – separating improvements in access time, distance, type of highway access and/or airport service levels. Furthermore, there is a need to further explore the ways in which market scale and airport access may be better measured by industry employment shares, concentration ratios or total size of the industries.

Vol.4 Economic Development Assessment Tools Ch.4 Study Conclusions
Sources of Growth in Non-Metro Appalachia page 32
Demographic and Spatial Influences on County Economic Performance: These econometric studies provide new insights into how spatial influences interact with demographic, industry, geographical and transportation attributes of a county to influence its economic performance and rate of growth. First, the studies demonstrated the importance of explicitly modeling spatial dependencies among counties in order to avoid overstating the influence of other non-geographical factors that account for growth differences within the Region. In addition, using adjacency to measure spatial dependency may not be the best way to account for spatial spillover effects among counties, particularly knowledge-based spillovers such as the diffusion of information, innovations, and technical collaboration which are not as simply contained by adjacency. Second, the analyses confirm the importance of other measures of connectivity and interdependence, particularly major highway and rail infrastructure connecting the localities to population centers or resource users. Work force accessibility as measured by commuting times vary in their impact on economic performance according to county types, with commuter accessibility mattering most for micropolitan counties, registering as somewhat important for Metro counties, and as not significant for non-core, non-metro counties. With respect to geographical factors, the most salient finding is that metro areas’ economic performance are least influenced by geography (the result of infrastructure and population-economic density having diluted the constraints of topography). In contrast non-metro areas, particularly non-core counties with neighboring counties that have relatively more rugged terrain, may benefit economically from accessibility improvements as shown in the case study in Volume 2 of Pike County, KY as a trade center, and Cherokee County (Murphy, NC) as a trade center in the Corridor K region. Third, rather than trying to identify a single, complex model for explaining economic performance and growth differences across all county types, a potentially more useful inquiry was to identify the most relevant type of model for a county depending upon the characteristics of that county and its neighbors. Indeed, while the results from the general models developed in this report underscored the relevance of spatial modeling, the findings also indicate the need to disaggregate counties into metro, micropolitan and non-core, non-metro types. Once the cross sectional analysis was disaggregated by county type, the separate analyses demonstrated that metro, micropolitan and non-core counties exhibit considerable variation in economic performance and growth, with varying responses to demographic, industrial, geographic and transportation accessibility factors. Yet, analyses based on county types pose new challenges in modeling spatial relationships, as the researchers indicated, and leave open to question certain findings since spillover effects are not being explicitly modeled, particularly for demographic variables such as educational attainment (which are probably considerable for micropolitan counties). The finding of the positive employment growth effect of industry concentration within the micropolitan county makes intuitive sense in that it may reflect the influence of cluster-type development, while the negative employment effects of industry

Vol.4 Economic Development Assessment Tools Ch.4 Study Conclusions
Sources of Growth in Non-Metro Appalachia page 33
concentration in non-core, non-metro counties undoubtedly reflects the effect of a narrow economic base due to the high dependence on one industry. The lack of influence of industry concentration in metro counties follows from the higher diversification of the economies of such counties. Nevertheless, the findings on industry mix (based on factor analysis) raise more questions than they answer, and clearly require more exploration, as do the specifications of these models which lack explanatory power, particularly for explaining employment growth in micropolitan and non-core, non-metro counties. Fourth, a few conundrums were uncovered by these analyses, particularly the lack of explanatory power of natural amenities to account for economic performance differences based on the natural assets of the counties. The lack of explanatory power for natural amenities suggest the need for other types of spatial modeling, perhaps based on transportation networks and improvements between metro and non-metro counties. Since the presence of natural amenities is largely invariant over time, it makes sense to model relevant changes in infrastructure that may affect the accessibility or value of these assets to the non-resident population. The influence of knowledge-based spillovers may require an understanding of networks that link, for example, higher education institutions with research and industry centers. Fifth, entrepreneurial measures performed reasonably well in the economic health models indicating that increases in income per non-farm proprietor were positively correlated with lower distress levels, while an increase in dependence on proprietors’ income relative to wage and salary income were correlated with increased distress. These results seem to reflect the differences stemming from greater entrepreneurial opportunities in counties where proprietors income in growing, while increases in proprietors income relative to wage and salary incomes suggests entrepreneurship of necessity due to a lack of wage and salary employment growth.
Finally, a separate analysis of the relationship of the size of the population base on the business mix of a county shows that population thresholds matter, particularly for transportation, financial services, publishing, professional and technical services, and real estate. These findings are useful in framing and targeting local strategies for both business recruitment and entrepreneurial strategies that non-metro counties might pursue.
4.4 Implementing Findings for Strategy Planning
Many of these modeling findings provide an analytical foundation for applying better calibrated economic techniques to identify relevant development paths given the assets, linkages and constraints of the counties within their regional neighborhood. Counties in micropolitan areas, and perhaps those adjacent to micropolitan areas or

Vol.4 Economic Development Assessment Tools Ch.4 Study Conclusions
Sources of Growth in Non-Metro Appalachia page 34
linked via major transportation corridors and supplier chains, should be viewed as the prime candidates for applying many of these techniques and insights. Many of the growth factors that were identified in the various facets of this study are amenable to further refinements by augmenting the diagnostic capabilities of the EDR-LEAP model which is available to all local development district entities as an on-line research tool. Many of the growth path specific attributes are already now implemented in the EDR_LEAP tool and the current market access logic of EDR-LEAP implicitly begins to address spatial linkage potential, though this could be done with greater detail as the data resources become available. Having evolved from the first ARC-Highway Opportunities model, the EDR –LEAP model is an accessible economic development analysis framework that accounts for the role of overcoming market isolation and points towards different opportunities for an area’s working age residents and businesses. The result of including better understood metrics that depict the spatial influences exerted on a county, or its growth path propensity would seem promising to improve how opportunities are both understood and identified. There may be opportunities to complement such applications with additional case study work that applies spatial econometric analysis and regional input-output analysis to better explicate the nature of these spatial relationships among non-metro counties and the implications on how economic activity is organized.
4.5 Future Study Directions on Non-metro Growth Processes
The following areas have emerged for future study as a result of where this current research effort has concluded. The impact analysis of the ADHS suggests the need for more detailed examination of the time lags between the completion of corridors and the economic impacts, including applying spatial analysis to assess any backwash or relocation effects. The augmented export base model could be revisited to improve the level of resolution regarding the nature of cross-sector interactions under-pinning the spatial linkages currently detected. Further spatial modeling techniques should be developed to explore the spillover effects for different county types, as well as developing new spatial modeling approaches for amenity and knowledge-based spillovers. Finally, nowhere in the current study undertaking was the role of fiscal capacity in growth outcomes explored. To do so will require overcoming the current data constraints and harnessing a good cross-section of fiscal data.