Vol. 30, No.2 December 2015 · Vol. 30, No.2 December 2015 United Nations publication Printed in...
86
Vol. 30, No.2 December 2015 Asia-Pacific Population Journal Vol. 30, No.2 December 2015 Asia-Pacific Population Journal
Transcript of Vol. 30, No.2 December 2015 · Vol. 30, No.2 December 2015 United Nations publication Printed in...
Vol. 30, No.2December 2015
United Nations publicationPrinted in Thailand
December 2015 - 500
ISBN 978-92-1-120703-3
Asia-Pacif ic Population Journal Vol. 30, No.2 December 2015
Asia-Paci�cPopulation
JournalPublished since 1986 by the United Nations Economic and Social Commission for Asia and the Pacific (ESCAP), The Asia-Pacific Population Journal(APPJ) brings out high-quality, evidence-based and forward-looking articles on a wide range of populationand development issues in Asia and the Pacific.
This issue of the Asia-Pacific Population Journal contains the following articles:
The contribution of age-specific mortality towards male and female life expectancy differentials in India and selected States, 1970-2013 By Vladimir Canudas-Romo, Nandita Saikia and Nadia Diamond-Smith
Demography of a Small Island Nation: Findings from the 2011 Census of Population and Housing of the Republic of Marshall Islands By Bhakta Gubhaju, Arthur Jorari and Gerald Haberkorn
Scenarios of population change in the coastal Ganges Brahmaputra Delta (2011-2051) By Sylvia Szabo, Dilruba Begum, Sate Ahmad, Zoe Matthews and Peter Kim Streatfield

Asia-Pacif icPopulation
Journal

ii
Full text of the articles is available atwww.unescap.org/appj.asp
ASIA-PACIFIC POPULATION JOURNAL Vol. 30, No. 2, December 2015
The Asia-Pacific Population Journal is published at least twice a year in English by the United Nations Economic and Social Commission for Asia and the Pacific (ESCAP).
The Journal provides a medium for the international exchange of knowledge, experience, technical information and data on population-related issues as a basis for policymaking and programme development.
References to dollars ($) are to United States dollars, unless otherwise stated.
The designations employed and the presentation of the material in this periodical do not imply the expression of any opinion whatsoever on the part of the Secretariat of the United Nations concerning the legal status of any country, territory, city or area, or of its authorities, or concerning the delimitation of its frontiers or boundaries.
The opinions, figures and estimates set forth in these Journal articles are the responsibility of the authors, and should not necessarily be considered as reflecting the views or carrying the endorsement of the United Nations.
Mention of firm names and commercial products does not imply the endorsement of the United Nations.
ESCAP is not accountable for the accuracy or authenticity of any quotations from sources identified in this publication. Questions concerning quoted materials should be addressed to the sources directly.
This issue of the Asia-Pacific Population Journal has been issued without formal editing.
ST/ESCAP/2732

CONTENTS
page
Abstracts ........................................................................................................ iv
Articles
The contribution of age-specific mortality towardsmale and female life expectancy differentials in India and selected States, 1970-2013By Vladimir Canudas-Romo, Nandita Saikia and Nadia Diamond-Smith ............................................................................. 1
Demography of a Small Island Nation: Findings from the 2011 Census of Population and Housing of the Republic of Marshall IslandsBy Bhakta Gubhaju, Arthur Jorari and Gerald Haberkorn ........................... 21 Scenarios of population change in the coastal Ganges Brahmaputra Delta (2011-2051)By Sylvia Szabo, Dilruba Begum, Sate Ahmad, Zoe Matthews and Peter Kim Streatfield ........................................................ 51
iii

iv
The contribution of age-specific mortality towards male and female life expectancy differentials in India and selected States, 1970-2013
Most research on mortality differentials by sex in India focuses on disparities among children under 5 years of age. This paper assesses the changing age and cause patterns of mortality by sex in India and selected States using survey data and including mortality trends over the life span. Since the 1970s, the gap between female and male mortality in India has increased to females’ advantage. This occurred despite persisting higher female mortality below age 5, a disadvantage masked by the large gap favoring women at adult and older ages. This paper finds that the life expectancy gap between females and males in the second half of the 1990s can be attributed mainly to non-communicable diseases and external causes of death. While more developed States (primarily in the South) showed higher female longevity already in the 1970s, the States that lagged behind displayed similar mortality levels for females and males up until the turn of the century. The paper recommends strengthening policies towards ending the discrimination of girls as well as targeted policies encouraging a healthy lifestyle for adults, particularly men.
Demography of a Small Island Nation: Findings from the 2011 Census of Population and Housing of the Republic of the Marshall Islands
The 2011 Census of Population and Housing of the Republic of the Marshall Islands is the eleventh such census conducted since 1920. The main objective of the present paper is to highlight trends in population growth, fertility, mortality and migration, using the 2011 census. The 2011 census, conducted on 5 April 2011, recorded a total population of 53,158; it collected comprehensive information on the fertility history of women 15 to 54 years of age, which included questions on children ever born and children still living by sex. The fertility history also included the date of birth of the last child born alive. These data have been used to estimate current fertility and to indirectly estimate life expectancy at birth and infant mortality by sex. The current paper provides recommendations on: relevant government policies to improve existing or emerging socioeconomic conditions revealed by the census results; and areas of census planning, field management and data utilization in the Marshall Islands and in the rest of the Pacific countries.
Asia-Pacific Population Journal Vol. 30, No. 2

v
Abs tracts
Scenarios of population change in the coastal Ganges Brahmaputra Delta (2011-2051)
This paper provides an overview of population dynamics and scenarios of population change in the environmentally vulnerable coastal Ganges Brahmaputra Delta region. The main data sources used for the study include the most recent and historical census data, data from the Sample Vital Registration System (SVRS) and Demographic and Health Surveys (DHS). The research adopts the standard cohort component approach for population projections and provides population estimates for the period from 2011 to 2051. Research outcomes include scenarios of future population change in the coastal Ganges Brahmaputra Delta region and district-level population projections by age and sex. The results show that population growth is likely to continue in some, but not all, districts in the study area. The results also suggest that future migration flows are most likely to be the deciding component of population change in the study area. Given the expected shifts in population distribution and population structure, policy initiatives will have to address the challenges related to informal settlements and population ageing.


1
The contribution of age-specific mortality towards male and female life expectancy differentials in India and selected States, 1970-2013
The contribution of age-specific mortality towards
male and female life expectancy differentials in India and selected States,
1970-2013Most research on mortality differentials by sex in India focuses on disparities among children under 5 years of age. In this paper, we assess the changing age and cause patterns of mortality by sex in India and selected States using survey data and including mortality trends over the life span. Since the 1970s, the gap between female and male mortality in India has increased to females’ advantage. This occurred despite persisting higher female mortality below age 5, a disadvantage masked by the large gap favoring women at adult and older ages. This paper finds that the life expectancy gap between females and males in the second half of the 1990s can be attributed mainly to non-communicable diseases and external causes of death. While more developed States (primarily in the South) showed higher female longevity already in the 1970s, the States that lagged behind displayed similar mortality levels for females and males up until the turn of the century.
By Vladimir Canudas-Romo, Nandita Saikia and Nadia Diamond-Smith1,2
Keywords: sex gap, mortality, India, causes of death, log-quadratic model, life expectancy, age-decomposition.
1. Vladimir Canudas-Romo, Max Planck Odense Center on the Biodemography of Aging, University of Southern Denmark, Department of Epidemiology, Biostatistics and Biodemography, Odense C, Denmark, and Johns Hopkins Bloomberg School of Public Health, Department of Population, Family and Reproductive Health, Baltimore MD 21205, United States of America, e-mail: [email protected]; Nandita Saikia, Center for the Study of Regional Development, School of Social Science, Jawaharlal Nehru University, New Delhi, India; Nadia Diamond-Smith, Global Health Science, University of California, San Francisco, United States of America.
2. The authors would like to thank Abhishek Singh, Domantas Jasilionis, as well as colleagues at the Institute of Economic Growth, India, and Johns Hopkins Bloomberg School of Public Health (JHBSPH), USA, for their useful and constructive comments. The first authors’ work was supported by the European Research Council - ERC Starting Grant number 240795. The first and third authors are thankful to the Institute of Economic Growth, India, and the Global Health Established Field Placement Research/Practice Experience Agreement, JHBSPH, USA, respectively for their travel grants.

2
Asia-Pacific Population Journal Vol. 30, No. 2
Introduction
Today, in most countries in the world, women have a longer life expectan-cy at birth than men (Barford and others, 2006). India has experienced a continuous rise in life expectancy since the 1970s for both sexes, and the transition to a female advantage in life expectancy occurred around the turn of the century (India, Registrar General, 2004 and 2007). Nevertheless, the pace of mortality improvements stagnated in the 1990s and 2000s, especially for female child mortality and infant mortality for both sexes (Claeson and others, 2000; Saikia and others, 2011). This calls for a close examination of age patterns of mortality to answer questions related to slower mortality declines, with a specific focus on differences in mortality between females and males.
In developed countries, female mortality rates are lower than male mortality rates at most ages, and female life expectancy is greater than male life expectancy (Glei and Horiuchi, 2007; Oksuzyan and others, 2008). Past research in developed countries has found that men have higher mortality risks than women at practically all ages, and that since the 1950s disparity increased, especially for men in their middle ages, and then decreased in the last few decades (Oksuzyan and others, 2008). Other work looking at sex-based mortality differentials by age group found that disparities in children and adolescents decreased over time (Conti and others, 2003). The mortality gap in the working-age population also decreased over time, and mortality patterns at age 60 and older were the primary contributor to maintaining sex-based differentials in life expectancy (Conti and others, 2003). The increasing contribution of mortality at older ages is partially a consequence of the shifting of mortality towards older ages (Canudas- Romo, 2010; Oeppen and Vaupel, 2002).
There is a substantial body of literature that shows that, for most populations, male infants have higher rates of mortality than female infants, especially in the neonatal period (Wells, 2000). Work by Hill and Upchurch (1995) used Demographic and Health Survey data from developing countries to look at sex differences in child mortality. They found that female mortality disadvantage was greatest in childhood (ages 1 to 4) due to care-giving behavior, which is the main risk factor for mortality in childhood (Hill and Upchurch, 1995).

3
The contribution of age-specific mortality towards male and female life expectancy differentials in India and selected States, 1970-2013
Mortality differentials in India: age, sex and cause
A large body of literature describes child mortality disparity by sex in India, a topic which has received much attention since the description made by Nobel Prize winner Amartya Sen of “100 million missing women” in Asia (Sen, 1990). Sen brought attention to the fact that there are a lot fewer women in India and China than there should naturally be, due to a strong cultural preference for sons and discrimination against daughters. Despite increased public attention, the situation worsened in the following decades. According to various rounds of Census, the sex ratio of children under the age of 5 in India has fallen from 945 girls to 1,000 boys in 1991 to 914 girls to 1,000 boys in 2011. Discrimination against girls in India does not only occur before birth through sex-selective abortion — there are also noted sex differences in infant and child mortality. The under-5 mortality rate for the country as a whole was 60/1,000 for males and 69/1,000 for females in 2009, and the infant mortality rate was 49/1,000 for males and 52/1,000 for females (India, Office of Registrar General, 2011). Oster (2009) looked at the impact of specific types of biases on mortality, and found that uneven vaccination rates explain about 20 to 30 per cent of the sex imbalance, malnutrition explains 20 per cent, respiratory infections and diarrhoea combined explain 5 per cent, and the remaining roughly 50 per cent is unexplained by these factors (Oster, 2009). Cause-of-death data in India is scarce and problematic (The Million Death Study Collaborators, 2010). Given the paucity of data on causes of death among children in India, a detailed study of mortality in children under age 5 was undertaken in India from 2001 to 2003 (The Million Death Study Collaborators, 2010). This study found that prematurity/low birth weight, neonatal infections and birth asphyxia/trauma accounted for 78 per cent of neonatal deaths. Diarrhoea and pneumonia accounted for 50 per cent of deaths in children from 1 month to 5 years of age. Contrary to what is observed in developed countries but in line with what has been observed in India in previous studies, female disadvantage in mortality starts in India as early as 1 month after birth. As suggested in The Million Death Study, girls under 5 years of age have a higher mortality risk than boys in every region of India, and in some regions, girls have four to five times higher death rates for the same causes compared to boys.
4
Asia-Pacific Population Journal Vol. 30, No. 2
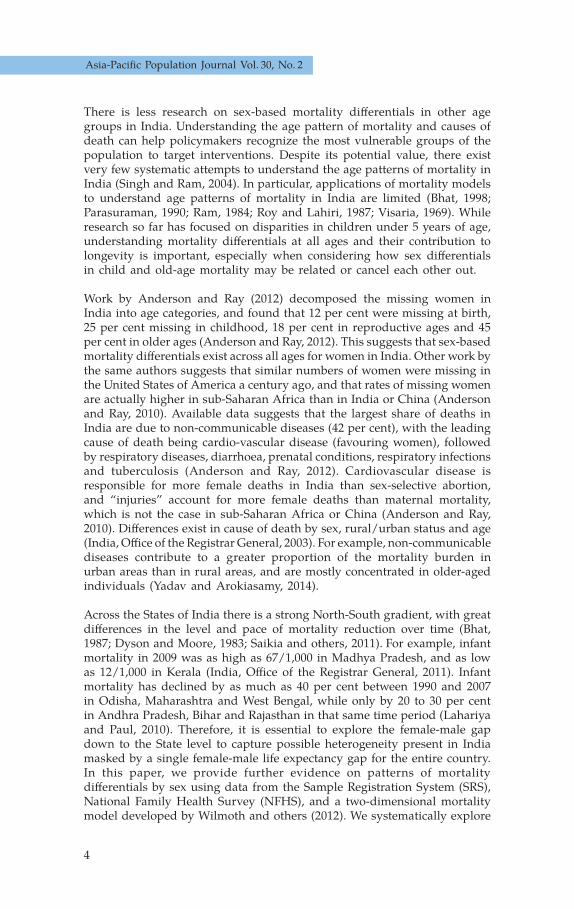
There is less research on sex-based mortality differentials in other age groups in India. Understanding the age pattern of mortality and causes of death can help policymakers recognize the most vulnerable groups of the population to target interventions. Despite its potential value, there exist very few systematic attempts to understand the age patterns of mortality in India (Singh and Ram, 2004). In particular, applications of mortality models to understand age patterns of mortality in India are limited (Bhat, 1998; Parasuraman, 1990; Ram, 1984; Roy and Lahiri, 1987; Visaria, 1969). While research so far has focused on disparities in children under 5 years of age, understanding mortality differentials at all ages and their contribution to longevity is important, especially when considering how sex differentials in child and old-age mortality may be related or cancel each other out.
Work by Anderson and Ray (2012) decomposed the missing women in India into age categories, and found that 12 per cent were missing at birth, 25 per cent missing in childhood, 18 per cent in reproductive ages and 45 per cent in older ages (Anderson and Ray, 2012). This suggests that sex-based mortality differentials exist across all ages for women in India. Other work by the same authors suggests that similar numbers of women were missing in the United States of America a century ago, and that rates of missing women are actually higher in sub-Saharan Africa than in India or China (Anderson and Ray, 2010). Available data suggests that the largest share of deaths in India are due to non-communicable diseases (42 per cent), with the leading cause of death being cardio-vascular disease (favouring women), followed by respiratory diseases, diarrhoea, prenatal conditions, respiratory infections and tuberculosis (Anderson and Ray, 2012). Cardiovascular disease is responsible for more female deaths in India than sex-selective abortion, and “injuries” account for more female deaths than maternal mortality, which is not the case in sub-Saharan Africa or China (Anderson and Ray, 2010). Differences exist in cause of death by sex, rural/urban status and age (India, Office of the Registrar General, 2003). For example, non-communicable diseases contribute to a greater proportion of the mortality burden in urban areas than in rural areas, and are mostly concentrated in older-aged individuals (Yadav and Arokiasamy, 2014).
Across the States of India there is a strong North-South gradient, with great differences in the level and pace of mortality reduction over time (Bhat, 1987; Dyson and Moore, 1983; Saikia and others, 2011). For example, infant mortality in 2009 was as high as 67/1,000 in Madhya Pradesh, and as low as 12/1,000 in Kerala (India, Office of the Registrar General, 2011). Infant mortality has declined by as much as 40 per cent between 1990 and 2007 in Odisha, Maharashtra and West Bengal, while only by 20 to 30 per cent in Andhra Pradesh, Bihar and Rajasthan in that same time period (Lahariya and Paul, 2010). Therefore, it is essential to explore the female-male gap down to the State level to capture possible heterogeneity present in India masked by a single female-male life expectancy gap for the entire country.In this paper, we provide further evidence on patterns of mortality differentials by sex using data from the Sample Registration System (SRS), National Family Health Survey (NFHS), and a two-dimensional mortality model developed by Wilmoth and others (2012). We systematically explore

5
The contribution of age-specific mortality towards male and female life expectancy differentials in India and selected States, 1970-2013
long-term trends in male and female life expectancy and cause-specific contributions to the life expectancy gap by sex from the late 1990s to the 2000s. Our aim is to understand the contribution of sex differentials in mortality through the entire life span in India, with the ultimate goal of providing an evidence base to better tailor policies.
Data and methods
Data
Mortality data and limitations
The present study uses data from the Sample Registration System (SRS) from 1970 to 2013, and the second round of National Family Health Survey (NFHS), 1998/99 (International Institute for Population Sciences (IIPS) and ORC Macro International, 2000). Indicators for mortality under 5 years of age and for adults are taken from the published SRS life tables for the period from 1970 to 2013 (India, Office of the Registrar General, 1984, 1985, 1989, 1994, 1998, 2004, 2007, 2013, 2015). For the years 2000 to 2004 and 2002 to 2006, the original SRS abridged life table estimates show increasing child mortality rates for India and its States, which is inconsistent with the SRS annual reports and NFHS information on child mortality (Saikia, Singh and Ram, 2010). The Office of the Registrar General and Census Commis-sioner therefore published revised life tables for this time period which had corrected child mortality estimates (India, Registrar General, 2013). These revised figures were used in our analysis for that time period. A more detailed description of the SRS procedure and the quality of its mortality information is available in the study by Saikia and others (2011). For the most recent period of 2009 to 2013, while a detailed analysis remains to be conducted, we applied the same methodology as for the other time periods.
Cause-of-death data and limitations
India’s Civil Registration System statistics on causes of death is far from complete or accurate (Mahapatra and others, 2007). For this analysis, we used the data on cause of death in India from the second round of National Family Health Survey (NFHS). Detailed descriptions of the NFHS survey design and findings are available in various reports at the national and State levels (IIPS and ORC Macro International, 2000; IIPS and ORC Macro International, 2007). The second round of NFHS (1998/99) provided details on 52 causes of death. The cause of death was reported by the head of household and recorded when a household member had died as a result of disease. Since information on the causes of death is only reported by the head of household (and may not be medically certified), we categorized it into five broad groups of causes of death to avoid misclassification as much as possible: communicable diseases, non-communicable diseases, external

6
Asia-Pacific Population Journal Vol. 30, No. 2
causes, other causes, and misclassified. The specific causes of death in each of these groups are listed below and their International Classification of Diseases, ICD10, can be found in the publications of NFHS (IIPS and ORC Macro International, 2000; IIPS and ORC Macro International, 2007):
a) Communicable, maternal, perinatal and nutritional diseases: unclassified fevers, malaria, influenza, typhoid, not classifiable digestive disorders, gastroenteritis, cholera, tuberculosis of lungs, bronchitis, pneumonia, measles, leprosy, tetanus, poliomyelitis, prematurity, malposition, congenital malformation, birth injury, respiratory infection, diarrhoea, malnutrition, amoebic dysentery, other respiratory diseases;
b) Non-communicable diseases: anemia, peptic ulcer, acute abdominal pain, asthma, central nervous system diseases, paralysis or cerebral apoplexy, meningitis, congestive heart diseases, heart attack, cirrhosis of liver, jaundice, malignant neoplasm, mental diseases, diabetes;
c) External Causes: accidents and injuries, snake bite, scorpion and other insect bite, dog bite, drowning, fall, vehicular accidents, burns, suicide, homicide, food poisoning;
d) Others: other causes not accounted for by the above (i) to (iii);
e) Misclassified: misclassified and coded as “I don’t know”.
Methods
Taking into account potential weaknesses of the age-specific data from the SRS, especially at older ages (Saikia and others, 2011), a two-dimensionalsystem of the model life table (log-quadratic model) approach was applied to estimate age-specific mortality rates (Saikia and others, 2011; Wilmoth others, 2012). Several further reasons for applying the log-quadratic model to the Indian population are that it helps to obtain consistency across States, time, and sex, since the model only requires information on child and adult mortality to construct the life tables. Additionally, the SRS publishes life tables up to age 70+, while the log-quadratic model returns estimates up to advanced ages, facilitating the study of mortality at older ages in this population. Nevertheless, for consistency with some of the results on causes of death only available for ages 75 and above, we present all our results with this open-ended age group.
The two inputs in the model are the probability of death from birth to age 5, denoted and the probability of death between ages 15 and 60, . The model uses existing information on child and adult mortality to predict mortality levels for all ages. The model outperforms the Coale-Demeny (Coale and Demeny, 1966; Coale and Demeny, 1983) and UN model life tables (United Nations, 1982) and returns similar results as those produced by the modified Brass logit model (Murray and others, 2003).

7
The contribution of age-specific mortality towards male and female life expectancy differentials in India and selected States, 1970-2013
The death rate at age x, denoted as mx , is estimated from the input parameters probability of dying between birth and age 5, , and between ages 15 and 60, , as:
, (1)
where and is a function of the adult mortality input. The estimated relationship between and is quadratic with the four age-specific coefficients (ax, bx, cx, and vx) calculated from the Human Mortality Database and presented in Wilmoth and others (2012). Finally, given a value of , the model chooses a value of in order to reproduce the observed value of exactly.
The calculated coefficients for the log-quadratic model are based on all countries in the Human Mortality Database, populations mainly of Euro pean origin, except for Japan and Taiwan, Province of China. Although it is not the optimal data for India’s population, this is the most accurate existing information on the age pattern of mortality to date. We conducted a validation of the modeling approach.
In order to estimate the contributions of age and causes of death to the fe-male-male life expectancy gap, standard decomposition methods were used. (Preston, Heuveline and Guillot, 2001; Canudas-Romo, García-Guerrero and Echarri-Cánovas, 2014). The overall age-contribution between ages x and x+n, nΔx, to the difference in life expectancies between populations 1 and 2, is obtained as:
, (2)
where , and are the survival function at exact age x, person-years lived between ages x to x+n, and after age x respectively for a life table in population i. Population i=1 corresponds to males and i=2 to females. This age decomposition can be further decomposed into causes of death
as, , where is calculated from the proportion of deaths from cause c at that age (for more details see Preston, Heuveline and Guillot, 2001). We explore the female-male life expectancy gap from 1970 to 2013 in India using the log-quadratic model with Indian SRS data. For causes of death we explore the period from 1996 to 2000 with data from NFHS (a further analysis of causes of death for the period from 2001 to 2003 was carried out).
8
Asia-Pacific Population Journal Vol. 30, No. 2
Results
Trends in female and male life expectancy at birth
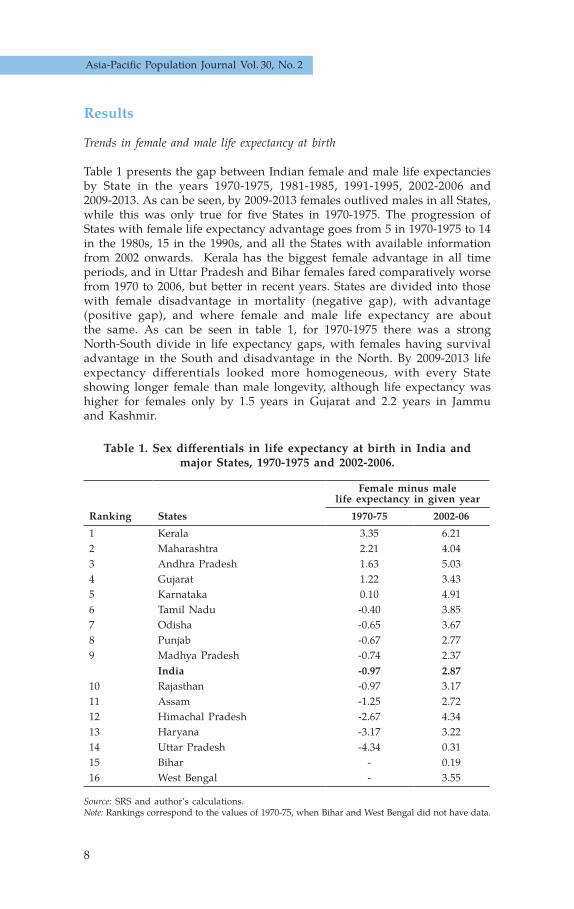
Table 1 presents the gap between Indian female and male life expectancies by State in the years 1970-1975, 1981-1985, 1991-1995, 2002-2006 and 2009-2013. As can be seen, by 2009-2013 females outlived males in all States, while this was only true for five States in 1970-1975. The progression of States with female life expectancy advantage goes from 5 in 1970-1975 to 14 in the 1980s, 15 in the 1990s, and all the States with available information from 2002 onwards. Kerala has the biggest female advantage in all time periods, and in Uttar Pradesh and Bihar females fared comparatively worse from 1970 to 2006, but better in recent years. States are divided into those with female disadvantage in mortality (negative gap), with advantage (positive gap), and where female and male life expectancy are about the same. As can be seen in table 1, for 1970-1975 there was a strong North-South divide in life expectancy gaps, with females having survival advantage in the South and disadvantage in the North. By 2009-2013 life expectancy differentials looked more homogeneous, with every State showing longer female than male longevity, although life expectancy was higher for females only by 1.5 years in Gujarat and 2.2 years in Jammu and Kashmir.
Table 1. Sex differentials in life expectancy at birth in India and major States, 1970-1975 and 2002-2006.
Female minus male life expectancy in given year
Ranking States 1970-75 2002-061 Kerala 3.35 6.212 Maharashtra 2.21 4.043 Andhra Pradesh 1.63 5.034 Gujarat 1.22 3.435 Karnataka 0.10 4.916 Tamil Nadu -0.40 3.857 Odisha -0.65 3.678 Punjab -0.67 2.779 Madhya Pradesh -0.74 2.37
India -0.97 2.8710 Rajasthan -0.97 3.1711 Assam -1.25 2.7212 Himachal Pradesh -2.67 4.3413 Haryana -3.17 3.2214 Uttar Pradesh -4.34 0.3115 Bihar - 0.1916 West Bengal - 3.55
Source: SRS and author’s calculations. Note: Rankings correspond to the values of 1970-75, when Bihar and West Bengal did not have data.

9
The contribution of age-specific mortality towards male and female life expectancy differentials in India and selected States, 1970-2013
The role of different ages and causes of death
The contribution to the sex gap in life expectancy by age group has shifted over time, as can be seen in figure 1. In this figure, age groups contributing to female advantage in life expectancy are above zero, and below zero show female disadvantage. We observe a few notable changes in female-male life expectancy dynamics during the studied period. First, males had one year of advantage in life expectancy over their female counterparts, with particular disadvantage at ages below 30 in 1970-1975. The following four decades were of transition to female advantage: around 1 year in the 1980s, 2 years in 1990s, and almost 3 years in the early 2000s. By 2009-2013, there were 4.08 years of difference between female and male life expectancy, with females living longer. The female-male life expectancy gap in Indian States is therefore similar to what is found in East and South-East Asia today, where countries range from 1.29 years (Lao People’s Democratic Republic) to 4.98 years (Democratic People’s Republic of Korea) (Gu and others, 2013). Second, there is a clear change in the contribution of various age groups to sex differentials in life expectancy. For example, age group 0-4 always showed male advantage in life expectancy, but it decreased from two years in 1970-1976 to half a year in the 2000s. Although all age groups from 15 to 74 played a positive role in favoring female life expectancy, the role of age groups 45-74 substantially increased in this period. A reduction in excess female deaths in age groups 5-14 and 30-44 became visible in the mid-1980s. Finally, there is minimum change in the contribution of age group 75 and older during the studied period.
Figure 1. Contribution of mortality patterns by age group to sex differentials in life expectancy, India, 1970-2013
-3.75
-2.50
-1.25
0
1.25
2.50
3.75
5.00 75+
Age
-con
trib
utio
n to
the
life
expe
ctan
cy g
ap
Year (gap in life expectancy)
(-1) (-0.6) (0.6) (1.1) (1.7) (1.9) (2.6) (2.6) (4.1)1970-1975 1976-1980 1981-1985 1986-1990 1991-1995 1996-2000 2000-2004 2002-2006 2009-2013
60-7445-5930-4415-295-140-4
10
Asia-Pacific Population Journal Vol. 30, No. 2
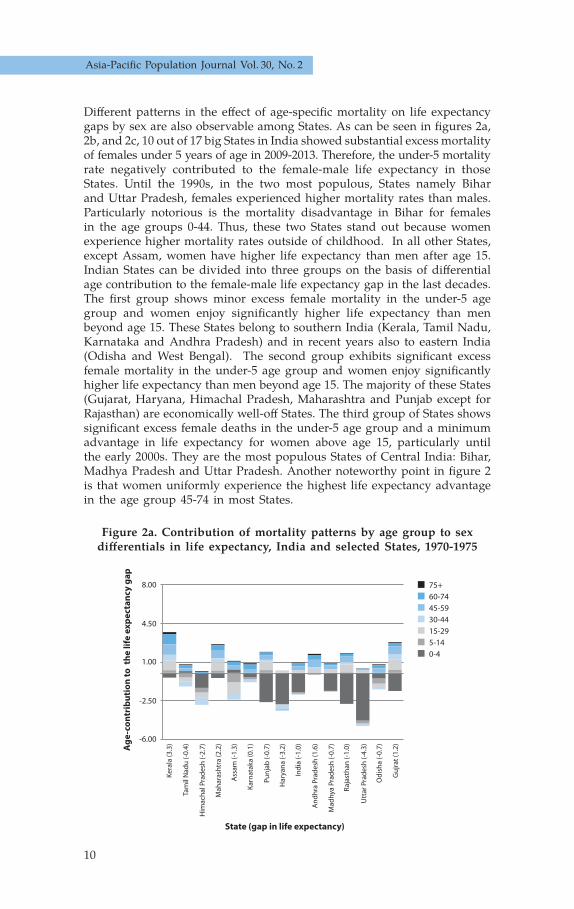
Different patterns in the effect of age-specific mortality on life expectancy gaps by sex are also observable among States. As can be seen in figures 2a, 2b, and 2c, 10 out of 17 big States in India showed substantial excess mortality of females under 5 years of age in 2009-2013. Therefore, the under-5 mortality rate negatively contributed to the female-male life expectancy in those States. Until the 1990s, in the two most populous, States namely Bihar and Uttar Pradesh, females experienced higher mortality rates than males. Particularly notorious is the mortality disadvantage in Bihar for females in the age groups 0-44. Thus, these two States stand out because women experience higher mortality rates outside of childhood. In all other States, except Assam, women have higher life expectancy than men after age 15. Indian States can be divided into three groups on the basis of differential age contribution to the female-male life expectancy gap in the last decades. The first group shows minor excess female mortality in the under-5 age group and women enjoy significantly higher life expectancy than men beyond age 15. These States belong to southern India (Kerala, Tamil Nadu, Karnataka and Andhra Pradesh) and in recent years also to eastern India (Odisha and West Bengal). The second group exhibits significant excess female mortality in the under-5 age group and women enjoy significantly higher life expectancy than men beyond age 15. The majority of these States (Gujarat, Haryana, Himachal Pradesh, Maharashtra and Punjab except for Rajasthan) are economically well-off States. The third group of States shows significant excess female deaths in the under-5 age group and a minimum advantage in life expectancy for women above age 15, particularly until the early 2000s. They are the most populous States of Central India: Bihar, Madhya Pradesh and Uttar Pradesh. Another noteworthy point in figure 2 is that women uniformly experience the highest life expectancy advantage in the age group 45-74 in most States.
Figure 2a. Contribution of mortality patterns by age group to sex differentials in life expectancy, India and selected States, 1970-1975
-6.00
-2.50
1.00
4.50
8.00
Age
-con
trib
utio
n to
the
life
exp
ecta
ncy
gap
State (gap in life expectancy)
Ker
ala
(3.3
)
Tam
il N
adu
(-0.
4)
Him
ach
al P
rad
esh
(-2.
7)
Mah
aras
htr
a (2
.2)
Ass
am (-
1.3)
Kar
nat
aka
(0.1
)
Pun
jab
(-0.
7)
Har
yan
a (-
3.2)
Ind
ia (-
1.0)
An
dh
ra P
rad
esh
(1.6
)
Mad
hya
Pra
des
h (-
0.7)
Raj
asth
an (-
1.0)
Utt
ar P
rad
esh
(-4.
3)
Od
ish
a (-
0.7)
Gu
jrat
(1.2
)
75+60-7445-5930-4415-295-140-4

11
The contribution of age-specific mortality towards male and female life expectancy differentials in India and selected States, 1970-2013
Figure 2b. Contribution of mortality patterns by age group to sex differentials in life expectancy, India and selected States, 1991-1996
Figure 2c. Contribution of mortality patterns by age group to sex differentials in life expectancy, India and selected States, 2009-2013
Age
-con
trib
utio
n to
the
life
exp
ecta
ncy
gap
State (gap in life expectancy)
75+60-7445-5930-4415-295-140-4
Ker
ala
(7.2
1)
Tam
il N
adu
(3.3
7)
Him
ach
al P
rad
esh
(3.6
8)
Mah
aras
htr
a (2
.88)
Ass
am (0
.73)
Kar
nat
aka
(4.0
3)
Pun
jab
(3.5
5)
Har
yan
a (1
.75)
Ind
ia (1
.72)
An
dh
ra P
rad
esh
(3.6
4)
Wes
t B
eng
al (1
.73)
Mad
hya
Pra
des
h (1
.27)
Raj
asth
an (2
.68)
Utt
ar P
rad
esh
(-0.
36)
Bih
ar (-
1.19
)
Od
ish
a (1
.72)
Gu
jrat
(3.1
4)
-6.00
-2.50
4.50
1.00
8.00
Age
-con
trib
utio
n to
the
life
exp
ecta
ncy
gap
State (gap in life expectancy)
75+60-7445-5930-4415-295-140-4
Ker
ala
(6.0
3)
Ass
am (5
.19)
Kar
nat
aka
(4.9
2)
Pun
jab
(4.7
1)
Har
yan
a (4
.45)
Ind
ia (4
.08)
An
dh
ra P
rad
esh
(3.8
4)
Wes
t B
eng
al (3
.78)
Mad
hya
Pra
des
h (3
.63)
Raj
asth
an (3
.43)
Utt
ar P
rad
esh
(3.3
2)
Bih
ar (3
.19)
Od
ish
a (3
.05)
Jam
mu
& K
ash
mir
(2.2
)
Gu
jrat
(1.5
7)
Tam
il N
adu
(5.3
9)
Him
ach
al P
rad
esh
(5.2
7)
Mah
aras
tra
(5.2
2)
-6.00
-8.00
-4.50
-1.00
-2.50

12
Asia-Pacific Population Journal Vol. 30, No. 2
Figure 2c. Contribution of mortality patterns by age group to sex differentials in life expectancy, India and selected States, 2009-2013
Figure 3 illustrates the role of age and causes of death in the female-male life expectancy gap from 1996 to 2000. A distinct shift in the pattern of causes of death across the age spectrum is visible in this figure. While communicable diseases are the most prominent killer of females under 5 years of age, external causes of death are a major player for excess male deaths in the age group 15-50. Non-communicable causes, on the other hand, are responsible for excess male deaths beyond age 50. Thus, in the 1990s, disparities in mortality can be explained by higher female mortality due to communicable diseases at the youngest ages and excess male mortality due to external and non-communicable diseases at adult and older ages. The main causes of the female-male life expectancy gap in the second half of the 1990s were already non-communicable diseases and external causes of death, affecting mostly men. Communicable diseases made a minor overall contribution. However, this minor role results from the fact that disadvantages for females below age 5 and female advantages after this age cancel each other out when added together. Nevertheless, it can be noted that communicable diseases continue to be the main cause of excess mortality in females below age 5, but less information is available for the rest of the age groups and for causes of death from this supplementary figure.
Cont
ribu
tion
to th
e li
fe e
xpec
tanc
y ga
p
Age-groups
Missclassi�ed 0.007 (-0.09%)Others -0.251 (-8.15%)External-causes 0.995 (3.08%)Non-communicable 1.107 (32.27%)Communicable 0.066 (3.43%)
1.0000
0.5000
-0.5000
0
-1.00000 5-9 15-19 25-29 35-39 45-49 55-59 65-69 75+

13
The contribution of age-specific mortality towards male and female life expectancy differentials in India and selected States, 1970-2013
Figure 3. Contribution of causes of death to sex differentials in life expectancy, India, 1996-2000
Conclusions
The results confirm that, in the past few decades, overall female life expectancy surpassed male life expectancy in India. This occurred despite persistent female disadvantage below age 5. A large positive gap favoring women at adult and older ages masks the disadvantage experienced by female children even in States at the later stages of the epidemiological transition. While States that were more advanced in this transition showed female longevity advantages already in the 1970s, States in earlier stages displayed similar mortality levels for males and females even during recent years. In comparison, every country in East and South-East Asia showed female advantage in life expectancy by 1980 (Gu and others, 2013).
The biggest contribution to the life expectancy gap by sex in the second half of the 1990s was made by non-communicable diseases and external causes of death, affecting men more starkly. However, for children under 5 years of age, most of the disparity was attributed to communicable diseases, with female infants and children more likely to die of communicable diseases than their male counterparts.
Although great progress has been made in reducing both male and female infant and child mortality in India, the female disadvantage in mortality below 5 years of age remains (India, Office of the Registrar General, 2009). Female children still face a serious disadvantage compared to male children. Much literature has documented discrimination against girl-children in India in the past; here we have added to the complexity of the current Indian mortality situation by showing that these behaviors co-exist today at the same time that women at older ages are experiencing advantage in mortality. Past literature has suggested that parents discriminate against their female children through sex-selective abortion before birth (Jha and other, 2011), and in care-taking, such as providing fewer vaccines, less nutritional diets, and taking them to health care facilities less often when they are ill (Barcellos, Carvalho and Lleras-Muney, 2012; Das Gupta, 1987; Mishra, Roy and Retherford, 2004). All of these types of behaviors could contribute to excess mortality from communicable diseases for female children.
Our results suggest that greater efforts are needed to reduce population mortality, specifically that of girls below 5, by eliminating discrimination at the individual, household and community levels. Policymakers need to strengthen their efforts to reduce discrimination against girls and subsequent sex-selective abortion and excess of mortality in the early years of childhood. This could include promoting gender equality and the value of girls broadly, specifically incentivizing families to bring their young daughters to health facilities for vaccinations or check-ups, or other programmes to ensure equal opportunities for girls and boys. Both programmes that encourage school attendance by girls and health-seeking behavior for

14
Asia-Pacific Population Journal Vol. 30, No. 2
daughters by parents seem to play a role in reducing mortality disparities (Das Gupta and others, 2005; Pebley and Amin, 1991). Further research on effective policies to reduce discrimination and improve the health of girls is much needed (Sekher, 2012; Sekher, 2010). At the other end of life, women are experiencing advantages in mortality at older ages. External causes of death and cardiovascular deaths, which affect predominantly men, are the explanatory factors in western countries, as well as in India as shown by past research (Anderson and Ray, 2010; Meslé, 2013). Behavioral factors, such as smoking and alcohol consumption, greatly increase males’ risk of mortality and partially explain the female to male gap in mortality in western societies (Glei, Meslé and Vallin, 2011; McCartney and others, 2010). India remains a very sex-divided society, and these behavioral patterns may also have contributed to creating a female advantage in survival at adult ages. For example, about 42 per cent of men in India smoke, compared to just over 4 per cent of women, and men in India are twelve times more likely to be current alcohol drinkers than women (John, Sung and Max, 2009; Wilsnack and others, 2009). There has been growing attention to the need for policies focused on reducing drinking and smoking behaviors in men in India, which could help men catch up to women in terms of life expectancy (Prasad, 2009). Obesity in India, which is growing despite the concurrent existence of extreme malnutrition, has also gained additional policy attention (Khandelwal and Reddy, 2013).
Substantial geographic variations in sex-specific mortality patterns persist in India. In order to better understand the path and timing of the health transition and its determinants in India and its States, it is important to consider changing sex-specific mortality patterns and their geographical diversity. It is also essential to think critically about using the life table estimates that come from the SRS. It appears that the log-quadratic model to estimate life expectancy is appropriate for the Indian population, and might provide a way of working around weaknesses in the data (Saikia and others, 2010). However, no model can replace the optimal situation of having accurate data, and India should strive to improve the accuracy of its data on mortality and causes of death. Having reliable data on causes of death is vital for understanding the changing nature of mortality in a population. We were limited by the lack of cause-of-death data after the 1990s because the National Family Health Survey stopped collecting data in its latest survey (2005-2006). In addition, the NFHS-2 data had more missing values and poorer quality data, such as more age heaping, than
15
The contribution of age-specific mortality towards male and female life expectancy differentials in India and selected States, 1970-2013
NFSH-1 (Rajan and James, 2008). Hence, our results on overall mortality, and particularly on the cause-of-death data, should be taken with caution and further analysis should be carried out once appropriate data is available.
References
Anderson, Siwan, and Debraj Ray (2012). The age distribution of missing women in India. Economic and Political Weekly, vol. XLVII, No. 47.
__________ (2010). Missing women: age and disease. Review of Economic Studies, vol. 77, pp. 1262-1300.
Barcellos, Silvia, Leandro Carvalho, and Adriana Lleras-Muney (2012). Child gender and parental investments in India: are boys and girls treated differently? Working Paper No. 17781. Cambridge, MA. National Bureau of Economic Research.
Barford, Anna, and others (2006). Life Expectancy: women now on top everywhere. British Medical Journal, vol. 332, p. 808.
Bhat, P. and N. Mari (1987). Mortality in India: levels, trends, and patterns. A dissertation in demography. University of Michigan at Ann Arbor. Available from http://repository.upenn.edu/dissertations AAI8725140.
__________ (1998). Demographic estimates of post independence India: a new integration. Demography India, vol. 27, No. 1, pp. 23-37.
Canudas-Romo, Vladimir (2010). Three measures of longevity: time trends and record values. Demography, vol. 47, No. 2, pp. 299-312.
__________, Victor M. García-Guerrero, and Carlos J Echarri-Cánovas (2014). The stagnation of the Mexican male life expectancy in the first decade of the 21st century: the impact of homicides and diabetes mellitus”. Journal of Epidemiology and Community Health, vol. 68, No. 10, pp. 1-7.
Claeson, Mariam, and others (2000). Reducing child mortality in India in the new millennium. Bulletin of the World Health Organization, vol. 78, No.10, pp. 1192–1199.
Coale, Ansley, and Paul Demeny (1966). Regional Model Life Tables and Stable Populations. New York: Academic Press.
__________ (1983). Regional Model Life Tables and Stable Populations. New York: Academic Press.

16
Asia-Pacific Population Journal Vol. 30, No. 2
Conti, S., and others (2003). Gender differentials in life expectancy in Italy. European Journal of Epidemiology, vol. 18, No. 22, pp.107-112.
Das Gupta, Monica (1987). Selective discrimination against female children in rural Punjab, India. Population and Development Review, vol. 13, No. 1, pp. 77–100.
__________, and others (2005). Improving child nutrition outcomes in India: can the integrated child development services program be more effective?. Policy Research Working Paper, No. 3647. Washington, D.C.: World Bank.
Dyson, Tim, and Mick Moore (1983). On kinship structure, female autonomy,
and demographic behavior in India. Population and Development Review, vol. 9, No. 1, pp. 35-60.
Glei, Dana, and Shiro Horiuchi (2007). The narrowing sex differential in life expectancy in high-income populations: effects of differences in the age pattern of mortality. Population Studies, vol. 61, No. 2, pp. 141-159.
__________, France Meslé, and Jaques Vallin (2010). Diverging trends in life expectancy at age 50: A look at causes of death. In International Differences in Mortality at Older Ages: Dimensions and Sources. Washington, D.C.: National Academies Press.
Gu, Danan, and others (2013). Old age mortality in Eastern and South- Eastern Asia. Demographic Research, vol. 29, Article 38, pp. 999-1038.
Hill, Kenneth, and Dawn M. Upchurch (1995). Gender differenes in child health: evidence from demographic and health surveys. Population and Development Review, vol. 21, No.1, pp.127-151.
International Institute for Population Sciences (IIPS), and ORC Macro Inter-national (2000). National Family Health Survey 1998–99, India. Mumbai.
__________(2007). National Family Health Survey (NFHS-3), 2005–06: India, Volume I. Mumbai.
Jha, Prabhat, and others (2011). Trends in selective abortions of girls in India: analysis of nationally representative birth histories from 1990 to 2005 and census data from 1991 to 2011. The Lancet, vol. 377, Issue 9781, pp. 1921–1928.

17
The contribution of age-specific mortality towards male and female life expectancy differentials in India and selected States, 1970-2013
John, R. M.., H-Y Sung, and W. Max (2009). Economic cost of tobacco use in India, 2004. Tobacco Control, vol. 18, No. 22, pp. 138–143.
Khandelwal, S., and K. S. Reddy (2013). Eliciting a policy response for the rising epidemic ofoverweight-obesity in India. Obesity Reviews, vol. 14, No. 2, pp. 114–125.
Lahariya, Chandrakant, and Vinod K. Paul (2010). Burden, differentials, and causes of child deaths in India. Indian Journal of Pediatrics, vol. 77, Issue 11, pp. 1312–1321.
Mahapatra, and others (2007). Civil registration systems and vital statistics: successes and missed opportunities. The Lancet, vol. 370, Issue 9599, pp. 1653-1663.
McCartney, Gerry, and others (2011). Contribution of smoking-related and alcohol-related deaths to the gender gap in mortality: evidence from 30 European countries. Tobacco Control, vol. 20, No. 2, pp. 166–168.
Meslé, France (2013). Will the gender gap in mortality continue to narrow?. Paper presented at the Population Association of America 2013 Annual Meeting. Available from: http://paa2013.princeton.edu/papers/130710.
Mishra, Vinod, T.K. Roy, and Robert D. Retherford (2004). Sex differentials in childhood feeding, health care, and nutritional status in India. Population and Development Review, vol. 30, No. 2, pp. 269–295.
Murray, Christopher J.L., and others (2003). Modified logit life table system: principles, empirical validation, and application. Population Studies, vol. 57, No. 2, pp. 165-182.
Oeppen, J., and James W. Vaupel (2002). Broken limits to life expectancy. Science, vol. 296, Issue 5570, pp. 1029-1031.
Office of Registrar General, India (1984). SRS based abridged life tables 1970-75. Census of India 1981. Occasional Papers No. 1 of 1984. New Delhi.
__________(1985). SRS based abridged life tables 1976-80. Census of India 1981. Occasional Papers No. 1 of 1985. New Delhi.

18
Asia-Pacific Population Journal Vol. 30, No. 2
__________(1989). SRS based abridged life tables 1981-85. Census of India 1981.
Occasional Papers No. 1 of 1989. New Delhi.
__________(1994). SRS based abridged life tables 1986-90. SRS Analytical Studies Report Series, Occasional Papers No. 1 of 1994. New Delhi.
__________(1998). SRS based abridged life tables 1990-94 and 1991-95. SRS Analytical Studies Report No. 1 of 1998. New Delhi.
__________(2003). "Report on Causes of Death: 2001-03.New Delhi.
__________(2004). SRS based abridged life tables 1996-2000 and 1997- 2001. SRS Analytical Studies Report No. 2 of 2004. New Delhi.
__________(2007). SRS based abridged life tables 2000-2004. SRS Analytical Studies Report No. 1 of 2007, edited by Controller of Publications. New Delhi.
__________(2009). Report on Causes of Death in India 2001-2003. SRS, New Delhi. http://www.cghr.org/wordpress/wp-content/uploads/Causes_of_death_2001-03.pdf
__________(2011). Maternal & Child Mortality and Total Fertility Rates: Sample Registration System (SRS). New Delhi.
__________(2013). Abridged Life Tables: 2003-07 to 2006-10. SRS, New Delhi. http://censusindia.gov.in/vital_statistics/SRS_Based/SRS_Based.html
__________(2015). Appendix_SRS Based Life Table 2009-13. New Delhi. http://www.censusindia.gov.in/vital_statistics/Appendix_SRS_Based_Life_Table.html
Oksuzyan, Anna, and others (2008). Men: good health and high mortality. Sex differences in health and aging. Aging Clinical and Experimental Research, vol. 20, No. 2, pp. 91-102.
19
The contribution of age-specific mortality towards male and female life expectancy differentials in India and selected States, 1970-2013
Oster, Emily (2009). Proximate sources of population sex imbalance in India. Demography, vol. 46, No. 2, pp. 325-339.
Parasuraman, S. (1990). Age patterns of Mortality in India. In Dynamics of population and family welfare 1989, K.A.a.P.K.B. Srinivasan, ed. Mumbai: Himalaya Publishing House.
Pebley, Anne R., and Sajeda Amin (1991). The impact of a public-health intervention on sex differentials in childhood mortality in rural Punjab, India. Health Transition Review, vol. 1, No. 2, pp. 143-167.
Prasad, Raekha (2009). Alcohol use on the rise in India. The Lancet, vol. 373, Issue no. 9657, pp. 17-18.
Preston, Samuel, Patrick Heuveline, and Michel Guillot (2001). Demography: measuring and modeling population processes. Population and Development Review, vol. 27, No. 2, pp. 365-379.
Rajan, S. Irudaya, and K.S. James (2008). Third national family health survey in India: issues, problems and prospects. Economic & Political Weekly, vol. 43, No. 48, pp. 33-38.
Ram, Faujdar (1984). Contribution towards the estimation of vital rates from incomplete data. Unpuslihed manuscript. Bombay University.
Roy, T.K., and Subrata Lahiri (1987). Dynamics of population and family welfare. Bombay, India: Himalaya Publishing House.
Saikia, Nandita, and others (2011). Trends and geographic differentials in mortality under age 60 in India. Population Studies, vol. 65, No. 1, pp. 73-89.
Saikia, Nandita, Abhishek Singh, and Faujdar Ram (2010). Has child mortality in India really increased in the last two decades? Economic and Political Weekly, vol.45, No. 51, pp. 62-70.
Sekher, T.V. (2012). Skewed sex ratios, conditional cash transfers and promotion of girl children: the Indian experience. Paper presented at the Population Association of America 2012 Annual Meeting. Available from: http://paa2012.princeton.edu/papers/121442.

Demography of a Small Island Nation: Findings from the 2011 Census of Population and Housing of the Republic of the Marshall Islands
20
Asia-Pacific Population Journal Vol. 30, No. 2
__________(2010). Special financial incentive schemes for the girl child in India: a review of select schemes. International Institute for Population Sciences, Mumbai.
Sen, Amartya (1990). More than 100 million women are missing. In The New York Review of Books, 1990 Issue.
Singh, Abhishek, and Faujdar Ram (2004). Forecasting mortality in India. T.K. Roy, M. Guruswamy, and Arokiaswamy eds. Rawat Publication: Mumbai.
The Million Death Study Collaborators (2010). Causes of neonatal and child mortality in India: a nationally representative mortality survey. The Lancet, vol. 376, No. 9755, pp. 1853–1860.
United Nations (1982). Model Life Tables for Developing Countries. Sales No E.81.XIII.7
Visaria, Pravin, M. (1969). Mortality and fertility in India, 1951-1961.
Milbank Memorial Fund Quarterly, vol. 47, No. 1, pp. 91-116.
Wells, Jonathan C.K. (2000). Natural selection and sex differences in morbidity and mortality in early life. Journal of Theoretical Biology, vol. 202, Issue 1, pp. 65-76.
Wilmoth, John, and others (2012). A flexible two-dimensional mortality model for use in indirect estimation. Population Studies, vol. 66, No. 2, pp. 219-221.
Wilsnack, Richard W., and others (2009). Gender and alcohol consumption: patterns from the multinational GENACIS project. Addiction, vol. 104, No. 9, pp. 1487-1500.
Yadav, Suryakant, and Perianayagam Arokiasamy (2014). Understanding epidemiological transition in India. Global Health Action, vol. 7:23248. Available from http://www.globalhealthaction.net/index.php/gha/article/view/23248.

21
Demography of a Small Island Nation: Findings from the 2011 Census of Population and Housing of the Republic of the Marshall Islands
1. Bhakta Gubhaju is a former United Nations staff member in the Social Development Division, Economic and Social Commission for Asia and the Pacific, Bangkok, e-mail: gubhajubb @gmail.com; Arthur Jorari, Team Leader (Collections), Statistics for Development Division, Secretariat of the Pacific Community, Noumea, e-mail: [email protected]; Gerald Haberkorn, Director, Statistics for Development Division, Secretariat of the Pacific Community, Noumea; e-mail: [email protected].
Demography of a Small Island Nation: Findings from
the 2011 Census of Population and Housing of the Republic
of the Marshall IslandsThe 2011 Census of Population and Housing of the Republic of the Marshall Islands is the eleventh such census conducted since 1920. The main objective of the present paper is to highlight trends in population growth, fertility, mortality and migration, using the 2011 census. The 2011 census, conducted on 5 April 2011, recorded a total population of 53,158; it collected comprehensive information on the fertility history of women 15 to 54 years of age, which included questions on children ever born and children still living by sex. The fertility history also included the date of birth of the last child born alive. These data have been used to estimate current fertility and to indirectly estimate life expectancy at birth and infant mortality by sex. The current paper provides recommendations on: relevant government policies to improve existing or emerging socioeconomic conditions revealed by the census results; and areas of census planning, field management and data utilization in the Marshall Islands and in the rest of the Pacific countries.
By Bhakta Gubhaju, Arthur Jorari and Gerald Haberkorn1
Key words: Marshall Islands, Small island developing states, census, fertility, migration, population ageing.
22
Demography of a Small Island Nation: Findings from the 2011 Census of Population and Housing of the Republic of the Marshall IslandsAsia-Pacific Population Journal Vol. 30, No. 2
Introduction
The history of census taking in the Marshall Islands dates back to 1920, after which censuses were conducted every five years up to 1935 when the Second World War disrupted this pattern. The first census after the Second World War was in 1958, followed by censuses in 1967, 1973, 1980, 1988 and 1999. The 2011 Census of Population and Housing of the Republic of the Marshall Islands is the eleventh census conducted since 1920 and the third since the Marshall Islands gained independence in 1979.
As the demographic information of small island nations is rarely published in international journals, presenting the demographic situation of the Marshall Islands will provide an opportunity to share the results from the census data. The main objective of this paper is, therefore, to highlight trends in population growth, nuptiality, fertility, mortality and migration. For the sake of comparison, results are also presented from the 1999 census report.
National population size and growth
The 2011 census, conducted on 5 April 2011, recorded a total population of 53,158, of whom 27,243 were males and 25,915, females. The census showed an increase of 2,318 persons or 4.6 per cent over the previous census conducted on 1 June 1999. These figures are comparable as both censuses adopted the de jure method of enumeration, which means that people were enumerated according to their place of “usual residence”, that is the place where a person lives and sleeps most of the time.
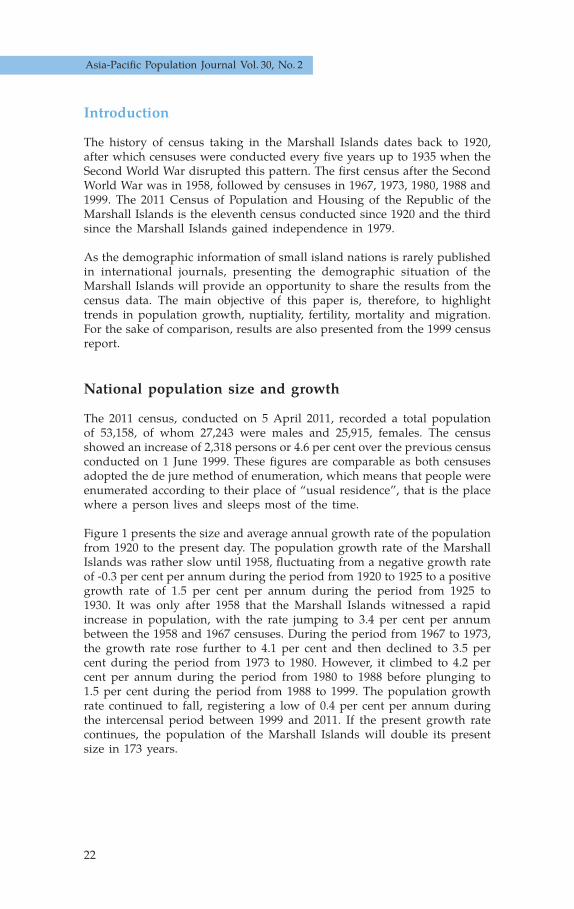
Figure 1 presents the size and average annual growth rate of the population from 1920 to the present day. The population growth rate of the Marshall Islands was rather slow until 1958, fluctuating from a negative growth rate of -0.3 per cent per annum during the period from 1920 to 1925 to a positive growth rate of 1.5 per cent per annum during the period from 1925 to 1930. It was only after 1958 that the Marshall Islands witnessed a rapid increase in population, with the rate jumping to 3.4 per cent per annum between the 1958 and 1967 censuses. During the period from 1967 to 1973, the growth rate rose further to 4.1 per cent and then declined to 3.5 per cent during the period from 1973 to 1980. However, it climbed to 4.2 per cent per annum during the period from 1980 to 1988 before plunging to 1.5 per cent during the period from 1988 to 1999. The population growth rate continued to fall, registering a low of 0.4 per cent per annum during the intercensal period between 1999 and 2011. If the present growth rate continues, the population of the Marshall Islands will double its present size in 173 years.
23
Demography of a Small Island Nation: Findings from the 2011 Census of Population and Housing of the Republic of the Marshall Islands
Figure 1. Population and average annual growth rate, 1920-2011
The main reason for the significant decline in the population growth rate since 1988 is emigration. While the rate of natural increase (RNI) of population based on the 1999 census was estimated at 3.7 per cent per annum, it is now 2.8 per cent per annum based on the 2011 census. RNI is the difference between the crude birth rate and crude death rate. Based on the 2011 census, the estimated crude birth rate and crude death rate are 32.1 per 1,000 and 3.7 per 1,000, respectively. Estimation of both rates using an indirect technique is discussed later. The decline in the population growth rate is also attributed to a decline in the fertility rate. The total fertility rate dropped from 5.7 children per woman in 1999 to 4.1 in 2011.
Population distribution by atoll/island
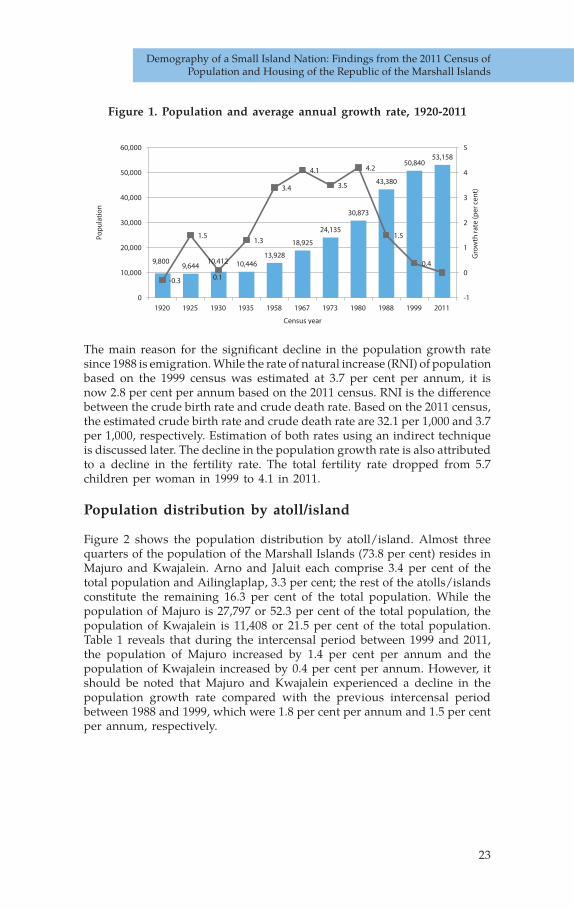
Figure 2 shows the population distribution by atoll/island. Almost three quarters of the population of the Marshall Islands (73.8 per cent) resides in Majuro and Kwajalein. Arno and Jaluit each comprise 3.4 per cent of the total population and Ailinglaplap, 3.3 per cent; the rest of the atolls/islands constitute the remaining 16.3 per cent of the total population. While the population of Majuro is 27,797 or 52.3 per cent of the total population, the population of Kwajalein is 11,408 or 21.5 per cent of the total population. Table 1 reveals that during the intercensal period between 1999 and 2011, the population of Majuro increased by 1.4 per cent per annum and the population of Kwajalein increased by 0.4 per cent per annum. However, it should be noted that Majuro and Kwajalein experienced a decline in the population growth rate compared with the previous intercensal period between 1988 and 1999, which were 1.8 per cent per annum and 1.5 per cent per annum, respectively.
-
-1
0
1
2
3
4
5
0
10,000
20,000
30,000
40,000
50,000
60,000
1920 1925 1930 1935 1958 1967 1973 1980 1988 1999 2011
Gro
wth
rate
(per
cen
t)
Pop
ula
tion
Figure 1. Population and Average Annual Growth Rate, RMI: 1920 - 2011
Census year
9,8009,644
10,412 10,44613,928
18,925
24,135
30,873
43,380
50,84053,158
0.3
1.5
0.1
1.3
3.4
4.1
3.5
4.2
1.5
0.4
24
Demography of a Small Island Nation: Findings from the 2011 Census of Population and Housing of the Republic of the Marshall IslandsAsia-Pacific Population Journal Vol. 30, No. 2
It can also be seen from table 1 that the population growth rates of 18 other atolls/islands in the country declined during the intercensal period between 1999 and 2011, while those of four others, namely Jaluit, Lae, Lib and Rongelap, increased. It should be noted that owing to the small population size of some atolls/islands, rate variations may tend to be large and hence should be interpreted with caution. There is a marked variation in the average annual growth rate of population by atoll/island, ranging from the negative growth rate of -3.5 per cent per annum in Ailuk and -3.6 per cent per annum in Namdrik to the positive growth rate of 12.1 per cent per annum in Rongelap. However, in terms of size, the population of Rongelap increased from 19 in 1999 to 79 in 2011. During the intercensal period between 1999 and 2011, aside from Majuro and Kwajalein, Jaluit, Lae, Lib, Rongelap and Utirik experienced positive population growth rates, while all other atolls/islands experienced negative growth rates. Bikini, Jabat, Lib, Rongelap and Wotho represent the five least populated (less than 200 people) atolls/islands in the 2011 census. It should, however, be noted that the enumerated population in Bikini (9 males) and Rongelap (78 males and 1 female) were all living in construction or public work camps. On the other hand, three atolls, aside from Majuro and Kwajalein, have more than 1,000 people, namely Ailinglaplap (1,729), Arno (1,794) and Jaluit (1,788).
Figure 2. Population distribution by atoll/island, 2011
Figure 2. Percentage Distribution of Population by Atoll/Island, RMI: 2011
Wotje 1.6%
Namu 1.5%
Mili 1.4%
Ebon 1.3%
Maloelap 1.3%
Enewetak 1.2%
Kili 1.0%
Namdrik 1.0%
Aur 0.9%
Utirik 0.8%
Likiep 0.8%
Ujae 0.7%
Mejit 0.7%
Lae 0.7%
Rest of RMI 1.4%
Note: Rest of RMI Includes Ailuk (0.6%), Lib (0.3%), Wotho and Jabat (0.2%), Rongelap (0.1%) and Bikini (0.02%).
Majuro52.3%
Kwajalein21.5%
Arno3.4%
Jaluit3.4% Ailinglaplap
3.3%
Other16.3%

25
Demography of a Small Island Nation: Findings from the 2011 Census of Population and Housing of the Republic of the Marshall Islands
Table 1. Population enumerated in the 1988, 1999 and 2011 censuses and the intercensal population growth rates
(1988-1999 and 1999-2011) by atoll/island
Atoll/Island Population Average annual growth rate (per cent)
1988 Census 1999 Census 2011 Census 1988-1999 1999-2011
Marshall Islands 43 380 50 840 53 158 1.5 0.4Ailinglaplap 1 715 1 959 1 729 1.3 -1.1Ailuk 488 513 339 0.5 -3.5Arno 1 656 2 069 1 794 2.1 -1.2Aur 438 537 499 1.9 -0.6Bikini 10 13 9 2.5 -3.1Ebon 741 902 706 1.9 -2.1Enewetak 715 853 664 1.7 -2.1Jabat 112 95 84 1.6 -1.0Jaluit 1 709 1 669 1 788 -0.2 0.6Kili 602 774 548 2.4 -2.9Kwajalein 9 311 10 902 11 408 1.5 0.4Lae 319 322 347 0.1 0.6Lib 115 147 155 2.3 0.5Likiep 482 527 401 0.8 -2.3Majuro 19 664 23 676 27 797 1.8 1.4Maloelap 796 856 682 0.7 -1.9Mejit 445 416 348 -0.6 -1.5Mili 854 1,032 738 1.8 -2.9Namdrik 814 772 508 -0.5 -3.6Namu 801 903 780 1.1 -1.2Rongelap - 19 79 - 12.1Ujae 448 440 364 -0.2 -1.6Ujelang - - - - -Utirik 409 433 435 0.5 0.0Wotho 90 145 97 4.5 -3.4Wotje 646 866 859 2.8 -0.1

26
Demography of a Small Island Nation: Findings from the 2011 Census of Population and Housing of the Republic of the Marshall IslandsAsia-Pacific Population Journal Vol. 30, No. 2
Population density
Table 2 presents the population density of all inhabited atolls/islands in the country based on the 2011 census. The population density of the Marshall Islands increased slightly from 726 persons per square mile in the 1999 census to 759 persons per square mile in the 2011 census. The population density varies markedly by atoll/island. The most densely populated atoll in the country is Majuro, with a population density of 7,413 persons per square mile, followed by Kwajalein, with 1,802 persons per square mile, and Kili with 1,522 persons per square mile. By contrast, besides Bikini and Rongelap, five other atolls/islands, namely Ailuk, Likiep, Maloelap, Mili and Wotho, have a population density of less than 200 persons per square mile.
Table 2. Land area, population density (1999 and 2011) and density rankings (2011) by atoll/island
Atoll/island Land area (sq. miles)
Population Population density
(population per sq. mile)
Rank according
to 2011 population
density1999 census
2011 census
1999 census
2011 census
Marshall Islands 70.07 50 840 53 158 726 759 -Ailinglaplap 5.67 1 959 1 729 346 305 15Ailuk 2.07 513 339 248 164 20Arno 5.00 2 069 1 794 414 359 12Aur 2.17 537 499 247 230 18Bikini 2.32 13 9 6 4 25Ebon 2.22 902 706 406 318 14Enewetak 2.26 853 664 377 294 16Jabat 0.22 95 84 432 382 11Jaluit 4.38 1 669 1 788 381 408 10Kili 0.36 774 548 2 150 1 522 3Kwajalein 6.33 10 902 11 408 1 722 1 802 2Lae 0.56 322 347 575 620 4Lib 0.36 147 155 408 431 9Likiep 3.97 527 401 133 101 22Majuro 3.75 23 676 27 797 6 314 7 413 1Maloelap 3.79 856 682 226 180 19Mejit 0.72 416 348 578 483 6Mili 6.15 1 032 q 168 120 21a 1.07 772 508 721 475 7Namu 2.42 903 780 373 322 13Rongelap 3.07 19 79 6 26 24Ujae 0.72 440 364 611 506 5Ujelang 0.67 0 0 - - -Utirik 0.94 433 435 461 463 8Wotho 1.67 145 97 87 58 23Wotje 3.16 866 859 274 272 17

27
Demography of a Small Island Nation: Findings from the 2011 Census of Population and Housing of the Republic of the Marshall Islands
Urban-rural distribution
Almost three quarters (73.8 per cent) of the population of the Marshall Islands in 2011 lived in urban areas, compared with 65.2 per cent in 1999. Of those living in urban areas, 70.9 per cent were located in Majuro atoll and the remaining 29.1 per cent in Kwajalein atoll (figure 4).
Figure 4. Percentage distribution of the total population and urban population, 2011
01000
20003000
40005000
60007000
8000
Kwajalein
Majuro
Rural
Urban
18027413
233
3889
Persons per sq. mile
Figure 3. Density of Urban and Rural Population, RMI: 2011
73.8
26.2
70.9
29.1
0
10
20
30
40
50
60
70
80
90
100
Urban Rural Majuro Kwajalein
Per c
ent
Figure 4. Percentage Distribution of Total Population and Urban Population, RMI: 2011
Per cent of total population Per cent of urban population
Figure 3 shows that the population density of urban areas is 3,889 persons per square mile compared with 233 persons per square mile in rural areas. Majuro and Kwajalein atolls are designated as urban areas while the remainder of the islands are rural areas.
Figure 3. Density of urban and rural populations, 2011

28
Demography of a Small Island Nation: Findings from the 2011 Census of Population and Housing of the Republic of the Marshall IslandsAsia-Pacific Population Journal Vol. 30, No. 2
Age-sex structure
Figures 5 and 6 show the age-sex structure of the population enumerated in the 1999 and 2011 censuses. Marked differences in age structure between the 1999 and 2011 censuses are evident. The base of the age pyramid (under 20 years) of the 2011 census is somewhat narrower than that of the 1999 census. In contrast, male and female bars in the age groups 20 years and over are relatively longer in the 2011 census than in the 1999 census. As stated in the 1999 census report, shorter male and female bars in the age group 5-9 compared with the adjacent age groups are the result of the rapid decline in fertility during the past 10 years and the massive emigration of families with young children. The 2011 age pyramid also reflects the impact of the decline in fertility causing a deficit of population in the age group 15-19, as a majority of the population aged 5-9 enumerated in the 1999 census are reported in the age group 15-19 in the 2011 census, while some would be in the next age group, 20-24. The consistency of the 1999 and 2011 age pyramids validates the accuracy of age reporting in the Marshall Islands censuses.
Figure 5. Age-sex pyramid, 1999
Figure 6. Age-sex pyramid, 2011
10 8 6 4 2 0 2 4 6 8 10
80 and over
Per cent of total population
Ag
e g
rou
p
Figure 5. Age-Sex Pyramid of the RMI: 1999
Male Female
75-7970-7465-6960-6455-5950-5445-4940-4435-3930-3425-2920-2415-1910-14
5-90-4
Percentage of total population
10 8 6 4 2 0 2 4 6 8 10
75-7970-7465-6960-6455-5950-5445-4940-4435-3930-3425-2920-2415-1910-14
5-90-4
80 and over
Per cent of total population
Ag
e g
rou
p
Figure 6. Age-Sex Pyramid of the RMI: 2011
Male Female
Percentage of total population

29
Demography of a Small Island Nation: Findings from the 2011 Census of Population and Housing of the Republic of the Marshall Islands
Population distribution by broad age groups
Figure 7 presents the distribution of population of the Marshall Islands by broad age groups in 1999 and 2011. While the share of the population under age 15 was close to 40 per cent of the total population in 2011, it had declined from 43 per cent in 1999. As expected, the population of the Marshall Islands had aged somewhat by 2011 in comparison with the population in 1999. However, the size of the population aged 60 or more was only 4 per cent of the total population in the 2011 census, which is still far below an ageing population, which is defined as having 7 per cent of the total population aged 60 or more. The percentage of population in the age group 15-59 has also gone up, from 53.7 per cent in 1999 to 56.1 per cent in 2011.
Figure 7. Population distribution by broad age group, 1999 and 2011
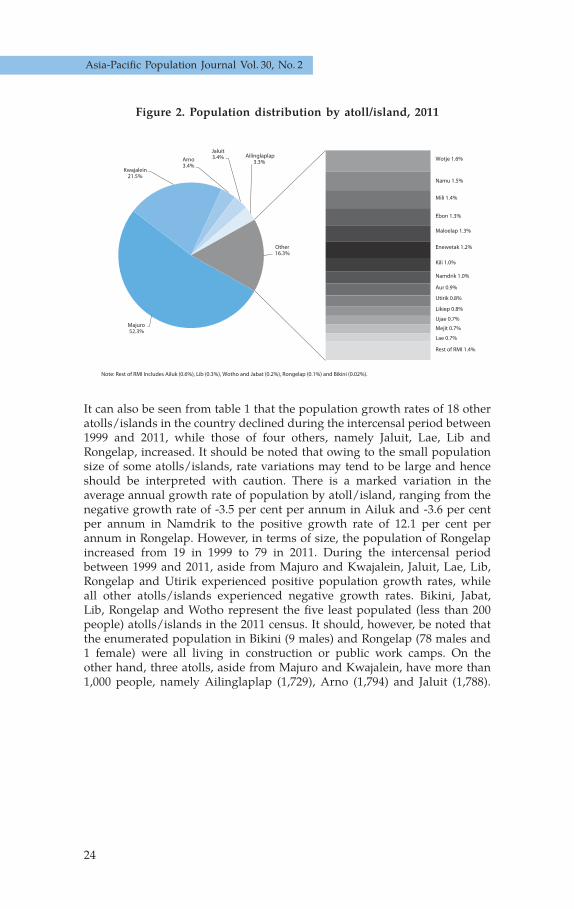
Figure 8 shows that in the 2011 census, the population distribution by broad age group in urban areas is markedly different from that of rural areas. As a result of higher fertility in rural areas than in urban areas, the rural population continues to be very young, with those less than 15 representing 46.1 per cent of the total population, compared with 37.7 per cent in urban areas. The percentage of those 60 or more differs very little between urban areas (4 per cent) and rural areas (3.8 per cent). In contrast, the percentage of the population in the age group 15-59 is significantly higher in urban areas (58.2 per cent) than in rural areas (50.1 per cent). This may be primarily due to the migration of the working-age population from rural to urban areas; in addition, the decline in fertility in urban areas contributes to a rise in the working-age population as the high-fertility cohort begins to move to this age group.
1999
20110
102030405060
Under 1515-59
60 and over
Per c
ent
Figure 7. Percentage Distribution of Population by Broad Age Groups, RMI: 1999 and 2011
43.053.7
3.3
39.956.1
4.0
30
Demography of a Small Island Nation: Findings from the 2011 Census of Population and Housing of the Republic of the Marshall IslandsAsia-Pacific Population Journal Vol. 30, No. 2
Figure 8. Population distribution by urban-rural residence, 2011
As a result of the substantial decline in fertility and increase in longevity during the past two decades, the median age of the national population, for both males and females, increased from 14 years in 1988 to 18 years in 1999, with a further increase to 20.6 years in 2011. As expected, the median ages of urban and rural populations are 21.3 years and 17.9 years, respectively.
Dependency ratios
The Marshall Islands has undergone a substantial change in the age structure of the population during the past two decades. On the one hand, the percentage of the young population (15 or less) has declined; on the other hand, the percentage of the working-age population (15-64) has gone up. The share of the older population (65 or more) has increased very modestly. This has resulted in a decline in both the child and elderly dependency ratios of the Marshall Islands. It is evident from figure 9 that the child dependency ratio, which is the number of children below the age of 15 per 100 persons in the working-age population (15-64 years), declined substantially from 110.6 in 1888 to 78.3 in 1999, with a further decline to 68.8 in 2011. Likewise, the elderly dependency ratio, which is the number of persons aged 65 or more per 100 persons in the working-age population, declined markedly from 6.3 in 1988 to 3.9 in 1999, with a further drop to 3.5 in 2011. The total dependency ratio has sharply declined to 72.3 in 2011 from 82.2 in 1999, a drop in total dependency by 10 persons below age 15 and 65 years and over. If children below age 15 and persons 65 years and over are considered economically dependent on the working-age population, the number of dependents that every 100 persons in the working-age population had to support in 2011 will be fewer by 10 persons than in 1999.
Urban
Rural0
102030405060
Under 1515-59
60 and over
Perc
ent
37.7
58.2
4.0
50.1
3.8
46.1
Figure 8. Percentage Distribution of Population by Urban-RuralResidence, RMI: 2011

31
Demography of a Small Island Nation: Findings from the 2011 Census of Population and Housing of the Republic of the Marshall Islands
Figure 9. Total, child and elderly dependency ratios, 1988, 1999 and 2011
Nuptiality
The 2011 census collected information on marital status of those aged 15 or more. Figure 10 shows that of the 35,600 persons aged 12 or more, 55.3 per cent were married: that is, 29.5 per cent were legally married and 25.8 per cent were in a common-law union or live-in status. Almost two fifths had never been married, some 3 per cent were widowed and 1.8 per cent were either divorced or separated. Over three quarters of widowed persons were women: this is attributed to the differences in the age of the spouses at the time of marriage (women tend to be younger than their spouse) and a higher life expectancy at birth for women than men. The percentage of widowed women increases with age as they tend to remarry less frequently than men upon divorce or the death of a spouse.
Figure 10. Population aged 12 or more by marital status, 2011
Figure 9. Total, Child and Elderly Dependency Ratios (Per 100 Working-age Population), RMI: 1988, 1999 and 2011
2011
1999
1988
0
20
40
60
80
100
120
TotalChild
Elderly
72.368.8
3.5
82.278.3
3.9
116.9110.6
6.3
Figure 10. Population 12 Years old and Over by Marital Status, RMI: 2011
Never Married39.9%
Legally Married29.5%
Common-law/
Live-in
25.8%
Divorced/
separated
1.8%
Widowed2.9% Never married
39.9%
Legally married29.5%
Common-law/Live-in25.8%
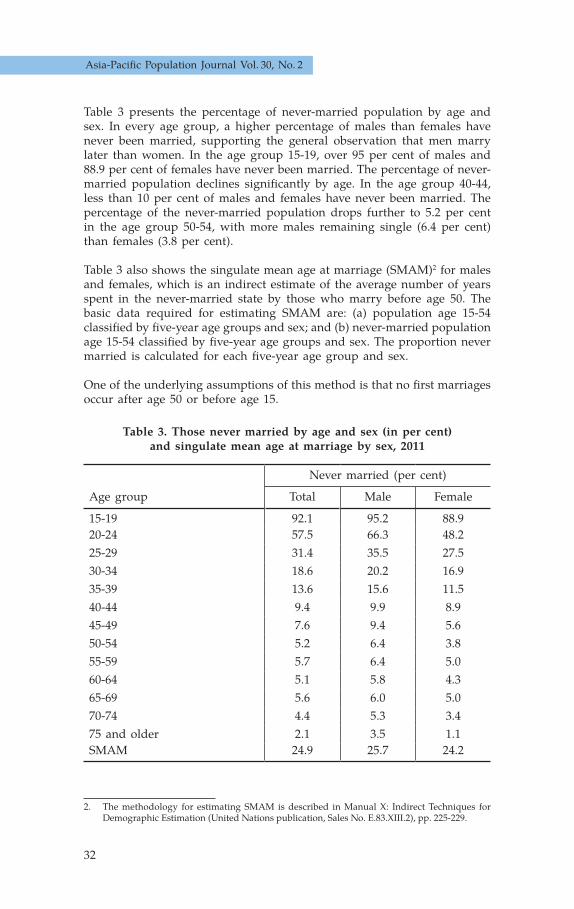
32
Demography of a Small Island Nation: Findings from the 2011 Census of Population and Housing of the Republic of the Marshall IslandsAsia-Pacific Population Journal Vol. 30, No. 2
Table 3 presents the percentage of never-married population by age and sex. In every age group, a higher percentage of males than females have never been married, supporting the general observation that men marry later than women. In the age group 15-19, over 95 per cent of males and 88.9 per cent of females have never been married. The percentage of never- married population declines significantly by age. In the age group 40-44, less than 10 per cent of males and females have never been married. The percentage of the never-married population drops further to 5.2 per cent in the age group 50-54, with more males remaining single (6.4 per cent) than females (3.8 per cent).
Table 3 also shows the singulate mean age at marriage (SMAM)2 for males and females, which is an indirect estimate of the average number of years spent in the never-married state by those who marry before age 50. The basic data required for estimating SMAM are: (a) population age 15-54 classified by five-year age groups and sex; and (b) never-married population age 15-54 classified by five-year age groups and sex. The proportion never married is calculated for each five-year age group and sex.
One of the underlying assumptions of this method is that no first marriages occur after age 50 or before age 15.
Table 3. Those never married by age and sex (in per cent) and singulate mean age at marriage by sex, 2011
Age group
Never married (per cent)
Total Male Female
15-19 92.1 95.2 88.920-24 57.5 66.3 48.225-29 31.4 35.5 27.530-34 18.6 20.2 16.935-39 13.6 15.6 11.540-44 9.4 9.9 8.945-49 7.6 9.4 5.650-54 5.2 6.4 3.855-59 5.7 6.4 5.060-64 5.1 5.8 4.365-69 5.6 6.0 5.070-74 4.4 5.3 3.475 and older 2.1 3.5 1.1SMAM 24.9 25.7 24.2
2. The methodology for estimating SMAM is described in Manual X: Indirect Techniques for Demographic Estimation (United Nations publication, Sales No. E.83.XIII.2), pp. 225-229.

33
Demography of a Small Island Nation: Findings from the 2011 Census of Population and Housing of the Republic of the Marshall Islands
Figure 11 reveals that SMAM increased from 24.1 years in 1999 to 24.9 years in 2011 — an increase of 0.8 years. During the intercensal period, SMAM for males increased by half a year, from 25.2 to 25.7 years, while for females it increased by 1.2 years, from 23 to 24.2 years.
Figure 11. Singulate mean age at marriage by sex, 1999 and 2011
As expected, SMAM is slightly higher in urban areas (25 years) than in rural areas (24.5 years). The urban/rural difference in age at marriage is somewhat wider among females (24.3 years in urban and 23.6 years in rural) than among males (25.8 years in urban and 25.5 years in rural). Irrespective of whether they live in urban or rural areas, males tend to marry at an older age than females (figure 12).
Figure 12. Singulate mean age at marriage by urban-rural residence and sex, 2011
Figure 11. Singulate Mean Age at Marriage (SMAM) by Sex, RMI: 1999 and 2011
1999
201120
21
22
23
24
25
26
TotalMale
Female
24.125.2
23.0
24.925.7
24.2
SMA
M (y
ears
)
Figure 12. Singulate Mean Age at Marriage (SMAM) byUrban-Rural Residence and Sex, RMI: 2011
Rural
Urban20
21
22
23
24
25
26
TotalMale
Female
24.5 25.5
23.6
25.025.8
24.3
SMA
M (y
ears
)

34
Demography of a Small Island Nation: Findings from the 2011 Census of Population and Housing of the Republic of the Marshall IslandsAsia-Pacific Population Journal Vol. 30, No. 2
Fertility
The 2011 census collected comprehensive information on the fertility history of women between the ages of 12 and 54 years, which included questions on children ever born alive by sex. Fertility history also included the date of birth of last child born alive (including a child that may have died later). This information is very useful for estimating current or period fertility as well as the fertility history of women between the ages of 15 and 49. Current fertility estimates are directly obtained from information on the date of birth of the last child to women between the ages of 15 and 49. The information on total children ever born gathered from all women aged 15 or more in the 2011 census also enables estimates of cumulative or past fertility, which is computed as the mean children ever born, or mean parity classified by five-year age groups of women. Note, however, that the completed family size — the mean number of children ever born to women between the ages of 45 and 49 — would correspond to the total fertility rate under conditions of constant fertility of a given population over recent decades. However, these two measures would be different as the Marshall Islands has undergone a decline in fertility during the recent past. It is, therefore, most likely that the mean children ever born to women between the ages of 45 and 49, representing cumulative fertility history, would be higher than the total fertility rate estimated from the current fertility data.
Age-specific and total fertility rates
The age-specific and total fertility rates,3 which represent current fertility, are estimated using the information on births that occurred during the year preceding the census. The rates therefore refer to the year immediately preceding the census. Table 4 presents the age-specific and total fertility rates and mean parity by age of women from the 2011 census. It is evident from this table that the total fertility rate declined from 5.7 children per women in 1999 to 4.1 in 2011. The total fertility rate of 4.1 means that a woman in the Marshall Islands will, on an average, give birth to a little over four children in her lifetime, assuming that she survives up to age 49 and bears children at each age according to the age-specific fertility rates prevailing in 2011.
3. The age-specific fertility rate is defined as the ratio of the number of live births occurring during a specified period to women of a specific age or age group to the total number of women of the same age in the same period. Summation of age-specific fertility rates multiplied by the age interval gives an age standardized index of fertility, referred to as the total fertility rate. The total fertility rate is, in turn, defined as the number of children that would be born per woman if all women lived to the end of their childbearing years and bore children at a given set of age-specific fertility rates.

35
Demography of a Small Island Nation: Findings from the 2011 Census of Population and Housing of the Republic of the Marshall Islands
Table 4. Number of women, mean parity and age-specific fertility rates by age of women, 2011
Age group Number of women
Children ever born
Births in past year
Mean parity
Age-Specific Fertility
Rate (ASFR) (1) (2) (3) (4) (5)* (6)**
15-19 2 202 371 188 0.168 0.085420-24 2 463 2 526 542 1.026 0.220125-29 2 236 4 730 486 2.115 0.217430-34 1 900 5 842 292 3.075 0.153735-39 1 541 5 839 146 3.789 0.094740-44 1 356 5 925 40 4.369 0.029545-49 1 150 5 732 11 4.984 0.0096
* (5) = (3)/(2)** (6) = (4)/(2)
The total fertility rate from the 2011 census has also been estimated indirectly by the P/F ratio method, using data on live births in the past year and children ever born by age of women (table 4). P/F ratios are obtained by dividing, for each age group of women, mean parity by the parity equivalent. The latter is derived from cumulative fertility. Cumulative fertility rates are converted to parity equivalents since, for a particular age group, they provide an estimate of the average number of children ever born who have reached the end of the age group. In comparison, mean parity provides an estimate of the average number of children ever born by women whose ages vary over the range of the age group. Parity equivalents are, therefore, made consistent with mean parity over the age range. These are derived by interpolation using the period fertility rates or age-specific fertility rates and the cumulated fertility rates.4
Similarly, age-specific fertility rates given in table 4 are converted into age-specific fertility rates for conventional age groups. This is because the age-specific fertility rates are based on birth in the 12 months prior to the census, classified by the age of the mother at the time of the census. However, at the time of the birth the mother would be, on an average, six months younger. Hence, these fertility rates are specific for unorthodox age groups that are shifted six months. Age-specific fertility rates for conventional five-year age groups are calculated by applying weighting factors to fertility rates for unorthodox age groups.5 The rates for the conventional age groups are then multiplied by a correction factor. In the present analysis, the correction factor is based on the weighted average of the P/F ratios for age groups 20-24 and 25-29.
4. Manual X, pp. 33-34.5. 5 Ibid.
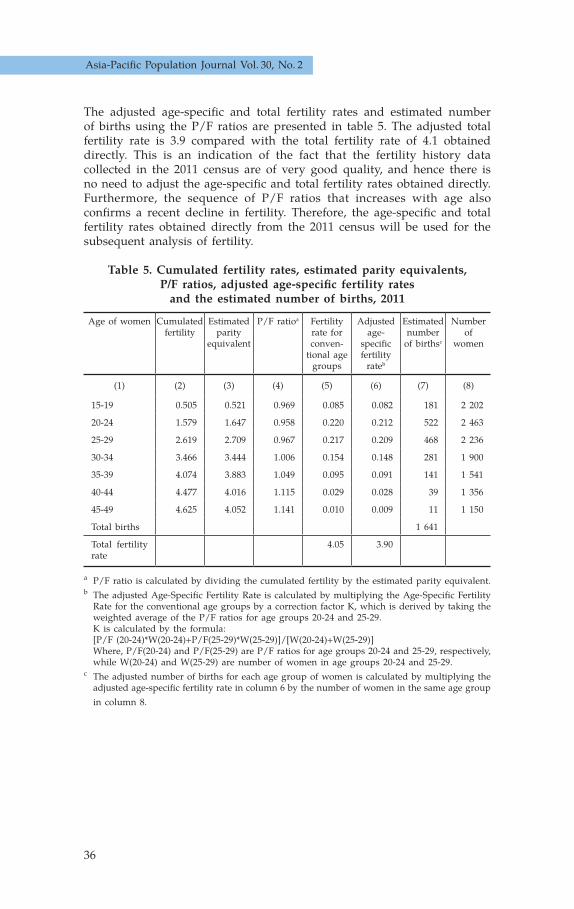
36
Demography of a Small Island Nation: Findings from the 2011 Census of Population and Housing of the Republic of the Marshall IslandsAsia-Pacific Population Journal Vol. 30, No. 2
The adjusted age-specific and total fertility rates and estimated number of births using the P/F ratios are presented in table 5. The adjusted total fertility rate is 3.9 compared with the total fertility rate of 4.1 obtained directly. This is an indication of the fact that the fertility history data collected in the 2011 census are of very good quality, and hence there is no need to adjust the age-specific and total fertility rates obtained directly. Furthermore, the sequence of P/F ratios that increases with age also confirms a recent decline in fertility. Therefore, the age-specific and total fertility rates obtained directly from the 2011 census will be used for the subsequent analysis of fertility.
Table 5. Cumulated fertility rates, estimated parity equivalents, P/F ratios, adjusted age-specific fertility rates
and the estimated number of births, 2011
Age of women Cumulated fertility
Estimated parity
equivalent
P/F ratioa Fertility rate for conven-
tional age groups
Adjusted age-
specific fertility
rateb
Estimated number
of birthsc
Number of
women
(1) (2) (3) (4) (5) (6) (7) (8)
15-19 0.505 0.521 0.969 0.085 0.082 181 2 202
20-24 1.579 1.647 0.958 0.220 0.212 522 2 463
25-29 2.619 2.709 0.967 0.217 0.209 468 2 236
30-34 3.466 3.444 1.006 0.154 0.148 281 1 900
35-39 4.074 3.883 1.049 0.095 0.091 141 1 541
40-44 4.477 4.016 1.115 0.029 0.028 39 1 356
45-49 4.625 4.052 1.141 0.010 0.009 11 1 150
Total births 1 641
Total fertility rate
4.05 3.90
a P/F ratio is calculated by dividing the cumulated fertility by the estimated parity equivalent.b The adjusted Age-Specific Fertility Rate is calculated by multiplying the Age-Specific Fertility Rate for the conventional age groups by a correction factor K, which is derived by taking the weighted average of the P/F ratios for age groups 20-24 and 25-29. K is calculated by the formula: [P/F (20-24)*W(20-24)+P/F(25-29)*W(25-29)]/[W(20-24)+W(25-29)] Where, P/F(20-24) and P/F(25-29) are P/F ratios for age groups 20-24 and 25-29, respectively, while W(20-24) and W(25-29) are number of women in age groups 20-24 and 25-29.c The adjusted number of births for each age group of women is calculated by multiplying the adjusted age-specific fertility rate in column 6 by the number of women in the same age group in column 8.

37
Demography of a Small Island Nation: Findings from the 2011 Census of Population and Housing of the Republic of the Marshall Islands
Figure 13 shows the age pattern of fertility in 1999 and 2011. It is consistent in both censuses, with peak fertility occurring in women in the age group 20-24, followed by a second peak in the age group 25-29. It is also evident from this figure that with the exception of the age group 15-19, women in all age groups exhibited a considerable drop in fertility between 1999 and 2011. The decline in fertility was most pronounced among women in the age group 30-34, with fertility falling by 35 per cent — from 238 to 154 per 1,000. Women in the age groups 20-24 and 25-29 also witnessed a decline in fertility, by over 20 per cent.
Figure 13. Age-specific fertility rates, 1999 and 2011
Table 6 presents the summary indicators of fertility for the urban and rural areas and for the whole country. As stated earlier, these indicators are based on direct estimates of fertility. It is evident from this table that rural fertility is higher than urban fertility, with the exception of the crude birth rate. Note, however, that the crude birth rate is normally affected by the age-sex structure of the population and other characteristics. Hence, the crude birth rate is less meaningful for making comparisons. The total fertility rate of rural women is 4.5 children per woman, compared with 3.9 among urban women. The gross reproduction rate, which takes into account female births in the calculation of age-specific rates, is 2.1 among rural women and 1.8 among urban women. This is a very useful indicator of fertility as it provides an indication of replacement-level fertility of a given population. For example, the gross reproduction rate of around 1.0 would mean that the country has reached replacement-level fertility.
15-19 20-24 25-29 30-34 35-39 40-44 45-49
Figure 13. Age-Specific Fertility Rates, RMI: 1999 and 2011
20111999
0
50
100
150
200
250
300
Birt
hs
per
1,0
00 w
om
en
Age of women

38
Demography of a Small Island Nation: Findings from the 2011 Census of Population and Housing of the Republic of the Marshall IslandsAsia-Pacific Population Journal Vol. 30, No. 2
As the 2011 census collected information on births by sex, the gross reproduction rate is calculated by using only female births. If the data on births are not available by sex, the gross reproduction rate can be obtained by multiplying the total fertility rate by the ratio of female births to total births, assuming the sex ratio at births of 1.06. The gross reproduction rate of 1.8 in 2011 means that a woman in the Marshall Islands will have, on an average, 1.8 daughters in her lifetime, assuming that she produces children according to the prevailing age-specific fertility rates in 2011 and she survives up to age 49. Table 6 also shows that the general fertility rate in the country as a whole is 133 live births per 1,000 women between the ages of 15 and 49, with a higher rate in rural areas (147 live births per 1,000 women) than in urban areas (129 live births per 1,000 women).
Table 6. Total fertility rate, gross reproduction rate, general fertility rate and crude birth rate by urban/rural residence, 2011
Fertility indicators Total Urban RuralTotal fertility rate (live births per woman) 4.05 3.93 4.45Gross reproduction rate (female births per woman) 1.83 1.75 2.11General fertility rate (live births per 1,000 women 15-49 years)
132.9 128.8 147.1
Crude birth rate (live births per 1,000 population) 32.1 32.9 30.0
Mean parity
This section examines the past fertility or cumulative fertility history of women, which is measured by computing the mean children ever born to women classified by five-year age groups. The mean children ever born — also known as mean parity pertaining to women approaching the end of reproductive age (say 45-49) — provides an indication of completed fertility, as it represents the cumulative experience of a cohort of women who passed through the series of fertility schedules in the past (or passed through the prevailing age-specific fertility). However, this measure does not provide any indication of the reference period or year.
Figure 14 presents the mean parity by age of women in 1999 and 2011. It has been commonly observed in censuses conducted in developing countries that older women are likely to underreport the children they have given birth to. Children who were born a long time back and are no longer living with their mothers, and children who died during infancy, are most likely to be missed out during enumeration. However, the 1999 and 2011 censuses reveal that the mean parity consistently increases with the advancement in age from 15-19 to 45-49. This is an indication of the reliability of the number of children ever born reported by women in the 1999 and 2011 censuses. It is evident from this figure that the mean parity by age of women was consistently lower in 2011 than in 1999. The completed family size reported by women aged between 45 and 49 is 5.0 in 2011, compared with 6.1 in 1999.

39
Demography of a Small Island Nation: Findings from the 2011 Census of Population and Housing of the Republic of the Marshall Islands
Figure 14. Mean children ever born by age of women, 1999 and 2011
It can be seen from figure 15 that the mean parity of rural women is consistently higher than the mean parity of urban women in all the age groups. In 2011, the completed family size of women between the ages of 45 and 49 is 5.3 in rural areas compared with 4.9 in urban areas.
Figure 15. Mean children ever born by age of women and urban/rural residence, 2011
0
1
2
3
4
5
6
Mea
n c
hild
ren
eve
r bo
rn
Age of women
Rural Urban
Figure 15. Mean Children Ever Born by Age of Women and Urban/Rural Residence, RMI: 2011
0.2
1.1
2.4
3.3
4.4
4.95.3
0.2
1.0
2.0
3.0
3.6
4.2
4.9
15 -19 20 -24 25 -29 30 -34 35 -39 40 -44 45 -49
Age of women
Mea
n c
hild
ren
eve
r bo
rn
Age of women
2011 1999
Figure 14. Mean Children Ever Born by Age of Women, RMI: 1999 and 2011
0
1
2
3
4
5
6
7
15 -19 20 -24 25 -29 30 -34 35 -39 40 -44 45 -49
0.2
1.0
2.1
3.1
3.84.4
5.0
0.2
1.2
2.5
3.7
4.8
5.66.1
Age of women

40
Demography of a Small Island Nation: Findings from the 2011 Census of Population and Housing of the Republic of the Marshall IslandsAsia-Pacific Population Journal Vol. 30, No. 2
Mortality
The 2011 census collected information on children ever born and children still living from women between the ages of 15 and 54 years of age. These data were collected separately for male and female children. Although the census did not collect information on death of the household population, data on children ever born and children still living are used to indirectly estimate life expectancy at birth, the infant mortality rate and the crude death rate for males and females separately. The “West family” of the regional model life tables has been used for indirect estimation as the mortality analysis based on census data carried out earlier also assumed that the Marshall Islands' mortality was closest to that represented by the West family of the model life tables. Note that in the absence of the complete death registration statistics, it is not possible to ascertain the exact age pattern of mortality. Hence, in the mortality analysis, the West family pattern is considered as the most appropriate model because it is the most general of the four regional patterns. The North, East and South patterns are far more specific mortality patterns than the West pattern. There is no evidence that the conditions underlying these patterns were found in the Marshall Islands.
Tables 7 presents the data required for the indirect estimation of infant mortality, while the results are summarized in table 8. Note that these estimates have been obtained by using the United Nations Software Package for Demographic Measurement: MORTPAK for Windows, version 4.1, United Nations Population Division.
Table 7. Proportion of children still living and proportion of live born children who are now dead by age of women, 2011
Age group Number of women
Children ever born
Mean children
ever born
Children still living
Proportion of children still living
Proportion of live born
children now dead
(1) (2) (3) (4)a (5) (6)b (7)c
15-19 2 202 371 0.168 359 0.9677 0.0323
20-24 2 463 2 526 1.026 2 468 0.9770 0.0230
25-29 2 236 4 730 2.115 4 605 0.9736 0.0264
30-34 1 900 5 842 3.075 5 665 0.9697 0.0303
35-39 1 541 5 839 3.789 5 677 0.9723 0.0277
40-44 1 356 5 925 4.369 5 754 0.9711 0.0289
45-49 1 150 5 732 4.984 5 495 0.9587 0.0413a (4) = (3)/(2)b (6) = (5)/(3)c (7) = 1-(6)

41
Demography of a Small Island Nation: Findings from the 2011 Census of Population and Housing of the Republic of the Marshall Islands
Table 8 shows life expectancy at birth and infant mortality rate by sex, and crude death rate in 1999 and 2011. It is evident from this table that life expectancy at birth has increased from 67.5 years in 1999 to 71.8 years in 2011. Both males and females have witnessed a rise in life expectancy at birth, from 65.7 to 71.3 years for males, and from 69.4 to 72.5 years for females, during the intercensal period. There has also been a remarkable decline in the infant mortality rate, from 41.4 to 24 per 1,000 live births for males and from 32.4 to 20 per 1,000 live births for females, during the intercensal period. Crude death rates are also obtained by using the life table death rates (corresponding to the level of mortality shown in this table) applied to the age distribution of the population enumerated in the 2011 census. The crude death rate declined from 4.9 per 1,000 population in 1999 to 3.7 per 1,000 population in 2011, with a higher crude death rate for males than for females.
Table 8. Estimates of life expectancy at birth, infant mortality rate, crude death rate and associated mortality level in the
West model life tables by sex, 1999 and 2011
Mortality indicators 2011a 1999
Life expectancy at birth (years)Both sexes 71.8 67.5Males 71.3 65.7Females 72.5 69.4
Infant mortality rate (per 1,000 live births)Both sexes 22.0 37.0Males 24.0 41.4Females 20.0 32.4
Crude death rate (per 1,000 population)b
Both sexes 3.7 4.9Males 4.0Females 3.3
West mortality level Both sexes 22.54 20.81Males 22.69 20.88Females 22.32 20.74
Source: 1999 estimates are taken from the 1999 census report, table 10.8, p. 55.a Figures were derived using an indirect technique based on data on children ever born and children still living.b The crude death rate is usually calculated by using the mid-year population as denominator. However, to be consistent with the 1999 census, the 2011 crude death rates were derived by dividing the total deaths, based on life table age-specific death rates, by the total population enumerated in 2011.

42
Demography of a Small Island Nation: Findings from the 2011 Census of Population and Housing of the Republic of the Marshall IslandsAsia-Pacific Population Journal Vol. 30, No. 2
Migration
Internal migration
The 2011 census collected information from the household population aged at least 5 on their previous place of residence five years ago. Based on this information, a matrix table was generated by place of current residence (atoll/island) and previous place of residence five years ago (atoll/island). Using these data, numbers of in-migration and out-migration to and from atoll/island were estimated during the period five years prior to the census: namely, between April 2006 and March 2011.
It is evident from table 9 that during this period, a total number of 3,546 persons were found to have lived in another atoll/island; these persons are referred to as inter-atoll/island migrants. Of this number, there were slightly more males (1,807) than females (1,739). Majuro received the highest volume of in-migrants (50 per cent) during the migration period examined, followed by Kwajalein, which received 10.9 per cent of in-migrants. During the migration period examined, of the total out-migrants, one-third were from Majuro (33.1 per cent), with the next largest percentage from Kwajalein (13.6 per cent).

43
Demography of a Small Island Nation: Findings from the 2011 Census of Population and Housing of the Republic of the Marshall Islands
Table 9. In-migrants and out-migrants aged at least 5 by atoll/island during the period between April 2006 and March 2011
Atoll/island of destination/origin
April 2006 to March 2011In-migrants Out-migrants
Number Per cent of all migrants
Number Per cent of all migrants
Total 3 546 100.0 3 546 100.0Ailinglaplap 136 3.8 263 7.4Ailuk 44 1.2 132 3.7Arno 118 3.3 268 7.6Aur 31 0.9 50 1.4Bikini 0 0.0 18 0.5Ebon 105 3.0 96 2.7Enewetak 42 1.2 74 2.1Jabat 27 0.8 20 0.6Jaluit 204 5.8 208 5.9Kili 51 1.4 63 1.8Kwajalein 386 10.9 484 13.6Lae 20 0.6 40 1.1Lib 23 0.6 20 0.6Likiep 42 1.2 39 1.1Majuro 1 772 50.0 1 174 33.1Maloelap 128 3.6 99 2.8Mejit 49 1.4 36 1.0Mili 120 3.4 105 3.0Namdrik 36 1.0 62 1.7Namu 78 2.2 84 2.4Rongelap 0 0.0 17 0.5Ujae 19 0.5 52 1.5Ujelang 0 0.0 2 0.1Utirik 17 0.5 31 0.9Wotho 9 0.3 11 0.3Wotje 89 2.5 98 2.8
During the past five years, from April 2006 to March 2011, Majuro recorded a total of 1,772 in-migrants. Of the total number of in-migrants in Majuro, 17.6 per cent came from Kwajalein, followed by 14 per cent from Arno (figure 16). Migrants who came from Jaluit and Ailinglaplap each comprise about 9 per cent, while those coming from Ailuk constitute 5.5 per cent. About 5 per cent of migrants were from each of Mili and Maloelap. Overall, there were slightly more female in-migrants (923) than male in-migrants (849) in Majuro. There were more males than females who came from Ailinglaplap, Jaluit and Mili, while those coming from Kwajalein, Arno, Ailuk and Maloelap comprised more females than males.

44
Demography of a Small Island Nation: Findings from the 2011 Census of Population and Housing of the Republic of the Marshall IslandsAsia-Pacific Population Journal Vol. 30, No. 2
Figure 16. In-migration to Majuro by atoll/island of origin, April 2006 to March 2011
Table 10 reveals that during the migration period from April 2006 to March 2011, Majuro experienced a substantial growth in its population from internal migration. The number of in-migrants in Majuro (1,772) exceeded out-migrants (1,174), with a net gain of 598 persons. In contrast, Kwajalein experienced a net loss of 98 persons (386 in-migrants and 484 out-migrants) during the same migration period. In terms of the net migration rate, however, Jabat leads the atolls and islands with a net migration rate of 9.4 per cent, which means a net gain of 9.4 per 100 persons aged 5 or more. Jabat is followed by Maloelap (4.8 per cent), Mejit (4.1 per cent), Majuro (2.6 per cent) and Lib (2.6 per cent). Other atolls/islands with a positive net migration rate were Ebon, Likiep and Mili. All other inhabited atolls/islands had negative net migration rates. Three atolls/islands, aside from Bikini and Rongelap, witnessed negative net migration rates that exceed 9 per cent — Ailuk (-27.6 per cent), Ujae (-10.6 per cent) and Arno (-9.6 per cent); Kwajalein had a negative net migration rate of -1 per cent.
Figure 16. In migrants of Majuro by Atoll/Island of Origin During the Period April 2006 to March 2011
Note: Other atolls include Bikini, Jabat, Lae, Lib, Rongelab, Ujelang and Wotho
Wotje 3.8%
Enewetak 3.8%
Kili 3.0%
Namdrik 2.8%
Aur 2.5%
Mejit 1.7%
Utirik 1.5%
Ujae 1.4%
Likiep 1.4%
Other atolls 4.2%
Kwajalein17.6%
Arno14.0%
Jaluit9.1%
Ailinglaplap9.0%
Ailuk5.5%
Mili5.0%
Maloelap4.9% Ebon
4.4%Namu4.3%
Other26.2%

45
Demography of a Small Island Nation: Findings from the 2011 Census of Population and Housing of the Republic of the Marshall Islands
Table 10. Net-migration rate of those aged 5 or more by atoll/island, April 2006 to March 2011
Atoll/island
Number Rate (per cent)In-
migrantsOut-
migrantsNet
migrantsIn-
migration rate
Out-migration
rate
Net migration
rate
Total 3 546 3 546 0 7.9 7.9 0Ailinglaplap 136 263 -127 9.2 17.8 -8.6Ailuk 44 132 -88 13.8 41.5 -27.6Arno 118 268 -150 7.6 17.2 -9.6Aur 31 50 -19 7.1 11.5 -4.4Bikini 0 18 -18 0.0 184.9 -184.9Ebon 105 96 9 16.9 15.5 1.5Enewetak 42 74 -32 7.4 13.0 -5.6Jabat 27 20 7 36.1 26.7 9.4Jaluit 204 208 -4 13.4 13.6 -0.3Kili 51 63 -12 10.3 12.7 -2.4Kwajalein 386 484 -98 4.0 5.1 -1.0Lae 20 40 -20 6.9 13.7 -6.9Lib 23 20 3 19.8 17.2 2.6Likiep 42 39 3 11.3 10.4 0.8Majuro 1 772 1 174 598 7.7 5.1 2.6Maloelap 128 99 29 21.0 16.3 4.8Mejit 49 36 13 15.6 11.5 4.1Mili 120 105 15 17.9 15.7 2.2Namdrik 36 62 -26 7.6 13.2 -5.5Namu 78 84 -6 11.2 12.0 -0.9Rongelap 0 17 -17 0.0 29.1 -29.1Ujae 19 52 -33 6.1 16.7 -10.6Ujelang 0 2 -2 0.0 0.0 0.0Utirik 17 31 -14 4.7 8.6 -3.9Wotho 9 11 -2 9.8 11.9 -2.2Wotje 89 98 -9 12.0 13.2 -1.2
Note: For each atoll/island, migration rates were calculated by dividing the number of migrants by the population aged 5 or more during the period 2.5 years prior to the 2011 census. This was obtained by calculating the intercensal population growth rate and applying this rate to estimate the population 2.5 years prior to the 2011 census.

46
Demography of a Small Island Nation: Findings from the 2011 Census of Population and Housing of the Republic of the Marshall IslandsAsia-Pacific Population Journal Vol. 30, No. 2
International migration
The Marshall Islands has witnessed a significant increase in the volume of international migration, with the number of immigrants during the past five years, April 2006 to March 2011, rising to 1,434, up from 544 during the period between January and May 1999, according to the 1999 census. As with internal migration, Majuro is the preferred destination of international migration. It can be seen from figure 17 that four fifths of the immigrants during the past five years resided in Majuro. Kwajalein received 12 per cent of immigrants, and the remaining 8 per cent lived in other atolls. Immigrants constituted slightly more females than males (97.8 males per 100 females). In comparison, immigrants comprised more males than females during the past five years of the 1999 census.
Figure 17. Migrants from foreign countries by destination during the period April 2006 to March 2011
The 2011 census gathered information on the place of birth of the household population enumerated in the Marshall Islands. Lifetime migration is estimated based on the data on place of current residence and place of birth: a lifetime migrant is defined as a person whose current place of residence is different from his or her mother’s residence at the time of his or her birth. The 2011 census revealed that there were a total number of 3,250 foreign-born persons residing in the country (figure 18). Of this number, the majority (1,417 or 43.6 per cent) were from the United States of America (22.1 per cent from the mainland and 21.5 per cent from Hawaii). Another 16.5 per cent came from the Philippines, while about 10 per cent came from China. Lifetime migrants also consisted of 8.4 per cent from Kiribati and 7.4 per cent from the Federated States of Micronesia.
Figure 17. Migrants from Foreign Countries by Destination During thePeriod April 2006 to March 2011
Majuro, 1142(80%)
Kwajalein, 174(12%)
Other Atolls, 118(8%)
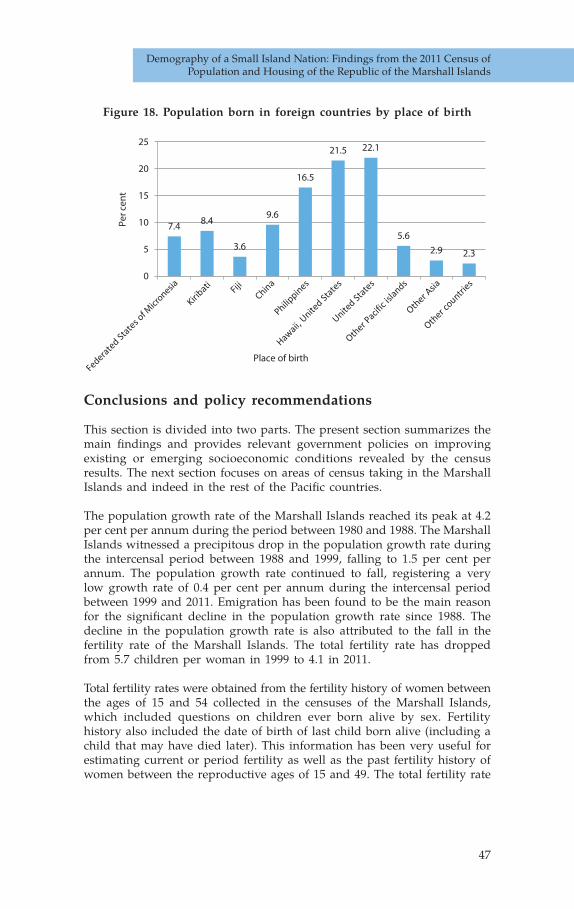
47
Demography of a Small Island Nation: Findings from the 2011 Census of Population and Housing of the Republic of the Marshall Islands
Figure 18. Population born in foreign countries by place of birth
Conclusions and policy recommendations
This section is divided into two parts. The present section summarizes the main findings and provides relevant government policies on improving existing or emerging socioeconomic conditions revealed by the census results. The next section focuses on areas of census taking in the Marshall Islands and indeed in the rest of the Pacific countries.
The population growth rate of the Marshall Islands reached its peak at 4.2 per cent per annum during the period between 1980 and 1988. The Marshall Islands witnessed a precipitous drop in the population growth rate during the intercensal period between 1988 and 1999, falling to 1.5 per cent per annum. The population growth rate continued to fall, registering a very low growth rate of 0.4 per cent per annum during the intercensal period between 1999 and 2011. Emigration has been found to be the main reason for the significant decline in the population growth rate since 1988. The decline in the population growth rate is also attributed to the fall in the fertility rate of the Marshall Islands. The total fertility rate has dropped from 5.7 children per woman in 1999 to 4.1 in 2011.
Total fertility rates were obtained from the fertility history of women between the ages of 15 and 54 collected in the censuses of the Marshall Islands, which included questions on children ever born alive by sex. Fertility history also included the date of birth of last child born alive (including a child that may have died later). This information has been very useful for estimating current or period fertility as well as the past fertility history of women between the reproductive ages of 15 and 49. The total fertility rate
7.48.4
3.6
9.6
16.5
21.5 22.1
5.6
2.9 2.3
0
5
10
15
20
25
Per c
ent
Place of birth

48
Demography of a Small Island Nation: Findings from the 2011 Census of Population and Housing of the Republic of the Marshall IslandsAsia-Pacific Population Journal Vol. 30, No. 2
from the 2011 census has also been estimated indirectly by the P/F ratio method, using data on live births in the past year and children ever born by age of women. Using this technique, the total fertility rate has been adjusted for possible underreporting of births. However, the adjusted total fertility rate of 3.9 estimated indirectly was very close to the total fertility rate of 4.1 obtained directly. This is an indication of the fact that the fertility history data collected in the 2011 census were of very good quality. It is, therefore, recommended to continue the collection of fertility history data in the subsequent censuses. The 2011 census of the Marshall Islands also collected information on children ever born and children still living by sex of the child from women between the ages of 15 and 54. These data were used to indirectly estimate life expectancy at birth, the infant mortality rate and crude death rate for males and females separately. It has been shown that life expectancy at birth has reached 71.8 years in 2011, up from 67.5 years in 1999. As usual, life expectancy at birth was higher for females (72.5) than for males (71.3). Consistent with the life expectancy at birth, the infant mortality rate has declined from 37 per 1,000 live births in 1999 to 22 in 2011. In the absence of direct information on death of the household population, an indirect technique has been employed to estimate these indicators of mortality. It is, however, strongly recommended to collect additional information on death of the household population by age at death in the next census. This information would allow not only the direct estimation of the age-specific death rate, crude death rate, infant mortality rate and the calculation of life expectancy at birth but would also provide an indication of the age pattern of mortality.
The present paper has revealed that as a result of the decline in fertility and improvement in longevity, the Marshall Islands has undergone a substantial change in the age structure of the population during the past two decades. On the one hand, the percentage of the young population below the age of 15 has declined; on the other hand, the percentage of the working-age population between the ages of 15 and 59 has gone up. The share of the older population aged 60 or more has increased very modestly. This has resulted in a decline in both the child and elderly dependency ratios of the Marshall Islands.
This is a unique opportunity for social and economic development, as the Marshall Islands has experienced a significant increase in the proportion of the working-age population, rising from 53.7 per cent in 1999 to 56.1 per cent in 2011, which will last for several decades. Hence, the nation is currently well placed to reap the “demographic dividend” before its population starts ageing rapidly. However, the Government would need to urgently put in place appropriate social and economic policies to reap the benefit from the demographic dividend to spur economic growth. Therefore, to fully capitalize on the benefits from the demographic dividend, it is important to create awareness among planners and policymakers of age-structural changes brought by the decline in fertility and increase in longevity and the relevance of the demographic dividend for investment planning and human resources development policy formulation. The

49
Demography of a Small Island Nation: Findings from the 2011 Census of Population and Housing of the Republic of the Marshall Islands
demographic dividend is a one-time window of opportunity that the nation should not fail to fully benefit from. Some of the policy recommendations for stimulating economic growth as a result of the demographic dividend include, for example, massive investment in education and human resource development. Such investments are possible because of savings from the low dependency ratios resulting from the demographic transition. These savings should be properly utilized to increase the capacity of the current and future labour force to participate fully in a skill-based economy.
While implementing policies and preparing programmes to reap the benefits of the demographic dividend, the Marshall Islands should also learn from the experience of low fertility countries in Eastern and South-Eastern Asia and foresee the consequences of declining fertility and increasing longevity in the near future, that is ageing of the population. Although, older persons in the Marshall Islands represent only 4 per cent of the total population, a crucial agenda for the Government would be to plan for an ageing society before fertility drops well below the replacement level. It is, therefore, timely to address the needs of older persons and start implementing policies to improve the living conditions, health, welfare and general quality of life of older persons in the Marshall Islands.
Recommendations on census planning
Pacific censuses and surveys suffer from weak planning and resource support, weak field operational management, and lack of national demand and incorporation of census results in policy decision support. In what follows, the study recommendations focus on three areas of census taking in the Marshall Islands and indeed in the rest of the Pacific countries.
Census planning
Proper census planning and resource mobilization with longer lead times would result in well-organised, documented and tested census processes, instruments and systems. Many countries in the Pacific fail to plan and undertake pilot census or post-census enumeration surveys to assess content and coverage errors. To give confidence and to validate census results, it is recommended that longer lead times are allowed in census planning and resource mobilization, and that census operations and procedures are properly tested and validated before the main census operations. This would then improve census data quality.

50
Asia-Pacific Population Journal Vol. 30, No. 2
Census field management
Poor census field management is a common issue in many censuses across the Pacific and the Marshall Islands is no exception. This leads to data errors, including missing answer categories observed in the final census tables. It is, therefore, recommended that at census planning, emphasis be placed on field management, including field supervision and quality control procedures, and that the plans are adequately resourced and implemented.
Census data utilization
One of the main challenges to census taking in the Pacific, including the Marshall Islands, is the lack of national demand for census results. This leads to poor resource allocation for census or survey taking, which obviously results in poorly planned census results. When results are available, there is no internal demand by national users, especially in pub-lic institutions of Government to understand what the census results are showing and to incorporate results into relevant policies and plans. To create demand for national evidence-based decision support, it is recommended that census organizations in the Pacific and their development and technical partners increase efforts to promote the use of census and other statistics for policy planning and research.
References
Republic of the Marshall Islands, Economic Policy, Planning and Statistics Office (2007). Republic of the Marshall Islands 1999 Census Report. Noumea.
Republic of the Marshall Islands, Economic Policy, Planning and Statistics Office and the South Pacific Commission Statistics for Development Programme (2012). Republic of the Marshall Islands 2011 Census Report. Noumea: Secretariat of the Pacific Community.
United Nations (1983). Manual X: Indirect Techniques for Demographic Estimation. Sales No. E.83.XIII.2.
United Nations (2012). United Nations Software Package for Demographic Measurement: MORTPAK for Windows, version 4.1.

51
Scenarios of population change in the coastal Ganges Brahmaputra Delta (2011-2051)
Scenarios of population change in the coastal Ganges
Brahmaputra Delta (2011-2051)
Abstract
This paper provides an overview of population dynamics and scenarios of population change in the environmentally vulnerable coastal Ganges Brah-maputra Delta region. The main data sources used for the study include the most recent and historical census data, data from the Sample Vital Registration System (SVRS) and Demographic and Health Surveys (DHS). The research adopts the standard cohort component approach for population projections and provides population estimates for the period from 2011 to 2051. Research outcomes include scenarios of future population change in the coastal Ganges Brahmaputra Delta region and district-level population projections by age and sex. The results show that population growth is likely to continue in some, but not all, districts in the study area. The results also suggest that future migration flows are most likely to be the deciding component of population change in the study area. Given the expected shifts in population distribution and population structure, policy initiatives will have to address the challenges related to informal settlements and population ageing.
By Sylvia Szabo, Dilruba Begum, Sate Ahmad, Zoe Matthews and Peter Kim Streatfield,1,2
Key words: population projections, Ganges Brahmaputra Delta, Bangladesh
1. Sylvia Szabo is a Research Fellow, Division of Social Statistics and Demography, University of Southampton, Southampton, United Kingdom of Great Britain and Northern Ireland, email: [email protected]; Dilruba Begum is a Senior Research Officer, International Centre for Diarrhoeal Disease Research, Dhaka, Bangladesh; Sate Ahmad is a Research Officer, Interna-tional Centre for Diarrhoeal Disease Research, Dhaka, Bangladesh; Zoe Matthews is Professor of Global Health and Social Statistics, Division of Social Statistics and Demography, University of Southampton, Southampton, United Kingdom; Peter Kim Streatfield is Emeritus Scientist, International Centre for Diarrhoeal Disease Research, Dhaka, Bangladesh.
2. This work was supported by the Ecosystem Services for Poverty Alleviation (ESPA) Deltas project (Grant No. NE/J002755/1) and the Belmont Forum DELTAS project (Grant No. NE/L008726/1). The ESPA programme is funded by the Department for International Development (DFID), the Economic and Social Research Council (ESRC) and the Natural Environment Research Council (NERC). The Belmont Forum DELTAS project is co-funded by the Natural Environment Research Council (NERC).

52
Asia-Pacific Population Journal Vol. 30, No. 2
1. Introduction
Since the publication of the Essay on the Principle of Population by Thomas R. Malthus (1798, 1826), population dynamics and the interlink-ages between population and environment have been a subject of intense scholarly inquiry (de Sherbinin and others, 2007; Hummel and others, 2012; Neumann and others, 2015). Today, the fears that population growth may threaten adequate food supplies have regained ground, in particular in the context of studies on food security (Brown, 2012; Dyson and Grada, 2002; Ehrlich, Ehrlich, and Daily, 1993; FAO, IFAD, and WFP, 2013; Funk and Brown, 2009; Pimentel and others, 1997). Populations of most developing regions continue to grow despite declining fertility rates. In many countries, including Bangladesh, population momentum will be a major factor contributing to the future population size (Streatfield and Karar, 2008).
Between 1950 and 2010, the population of Bangladesh has increased approximately four times and it is projected to exceed 200 million by 2050 (United Nations, 2013). This large population size coupled with high population density and unplanned urbanization puts considerable pressure on agriculture, which has limited capacity for expanding food production (Streatfield and Karar, 2008). The major part of the country lies in the Ganges Brahmaputra Delta region, which constitutes a complex socioecological system (Foufoula-Georgiou and others, 2013). This vulnerable socioecological system has been changing rapidly due to demographic and environmental factors, including sea level rise (Hossain and others, 2014). According to the recent research 5.5 per cent of the delta region is likely to be lost by 2050 and 1.8 per cent of the delta population will be at risk (Ericson and others, 2006).
Evidence suggests that sustaining livelihoods for households in the coastal areas of the Ganges Brahmaputra Delta region has been particularly challenging (Ahmed, 2009; Brammer, 2014) and that coastal areas are more vulnerable to the impact of climate change compared to other regions of Bangladesh. This vulnerability translates in turn into an increased risk of yield reduction in the agricultural sector (Bangladesh, Ministry of Environment and Forest, 2005). Soil salinization, linked to shrimp farming, and riverbank erosion constitute additional factors which affect population dynamics in the study area, particularly through out-migration (Swapan and Gavin, 2011). Additionally, soil salinization and arsenic can affect health outcomes in a number of ways. Soil salinization has a negative effect on water quality and can lead to water borne diseases. Consuming arsenic contaminated water and food can lead to kidney failure and skin cancers (Abedin, Habiba, and Shaw, 2012).

53
Scenarios of population change in the coastal Ganges Brahmaputra Delta (2011-2051)
Although environmental research focusing on the Ganges Brahmaputra Delta and other tropical delta regions is relatively rich, current literature lacks robust, up-to-date demographic analysis and projections for the region. Yet, in order for policymakers to meet increasingly complex challenges in the coastal Ganges Brahmaputra Delta region, it is crucial to estimate the plausible scenarios of future population change. The present study, part of the Ecosystem Services for Poverty Alleviation (ESPA) Deltas project, aims to fill this research gap by providing a set of evidence based demographic scenarios for nine districts of the coastal delta region, all located in the Khulna and Barisal divisions. The analysis responds directly to a call for population projections raised by public health scholars (Streat-field and Karar, 2008).
The next section provides a brief overview of population dynamics in the Ganges Brahmaputra Delta region. We then discuss the methods and data sources, including assumptions made for the development of the three scenarios. The main data sources include most recent and historical census data, Demographic and Health Surveys (DHS) and data from the Sample Vital Registration System (SVRS). The data are analysed by applying the standard cohort component approach to population projections. In section five, we present and discuss the selected projections scenarios. In the final section, we provide a summary of the analysis, discuss limitations of the study and highlight key policy implications.
2. Population dynamics in the delta study area
2.1 Population size and growth
The total population of the study area (nine districts) is about 14 million people comprising approximately 10 per cent of the whole country’s population. Khulna and Barisal districts are the most populous districts while Jhalokathi and Barguna districts have the smallest populations. In terms of population density, Jhalokhathi district has the highest population density (966 people per square kilometre) and Bagerhat district in Barisal division has the lowest population density (373 people per square kilometre). Figure 1 and table 1 illustrate population change in the study area and in a wider national context. Both Barisal and Khulna divisions experienced considerable decline in their share of national population (see figure 1). On the other hand, divisions such as Dhaka and Chittagong saw a net gain in the share of the overall national population. This increase was most pronounced in Dhaka division where the proportion of national population increased from 28.8 per cent at the beginning of the 20th century to 32.9 per cent in the most recent census data. Changes such as these can be explained by increasing urbanization due to large rural to urban migrations (Hossain, 2013). Large population flows in the study area are caused by push factors, such as reoccurring natural disasters (especially in the coastal Ganges Brahmaputra Delta) and pull factors such as expanding non- agricultural sectors in cities - a source of better employment and hence income (Mallick and Vogt, 2012).

54
Asia-Pacific Population Journal Vol. 30, No. 2
At the district level, a large variation can be observed regarding the change in population size during the last intercensal period from 2001 to 2011 (see table 1). While in 2001 all districts in the study area experienced a positive annual population growth rate, by 2011 this pattern had changed. Notably, Barisal, Jhalakathi, Bagerhat and Khulna districts had negative rates of annual population growth in 2011. The largest changes can be observed in Khulna division, within which Bagerhat and Khulna districts jointly lost more than 133,000 people.
Figure 1. Historical trends in population distribution in Bangladesh
Source: Bangladesh Population and Housing Census (2001 and 2011).Note: Following the recent administrative changes, the Rajshahi division data for 2011 refers to the population in both Rajshahi and Rangpur divisions.
Table 1. Population change in the study area (2001-2011)
Administrative area Population size Annual population growth rate(per cent)
Division District 2001 2011 2001 2011Barisal Barguna 848 554 892 781 0.90 0.50
Barisal 2 355 967 2 324 310 0.65 -0.13Bhola 1 703 117 1 776 795 1.44 0.42Jhalakathi 694 231 682 669 0.41 -0.17Patuakhali 1 460 781 1 535 854 1.38 0.49Pirojpur 1 111 068 1 113 257 0.44 0.02
Khulna Bagerhat 1 549 031 1 476 090 0.79 -0.47Khulna 2 378 971 2 318 527 1.70 -0.25Shatkhira 1 864 704 1 985 959 1.56 0.62
Total study area 13 966 424 14 106 242 1.03 0.15
0
5
10
15
20
25
30
35
1901 1911 1921 1931 1941 1951 1961 1971 1981 1991 2001 2011
(per
cen
t)
Historical trends in population distribution in Bangladesh
Barisal Chittagong Dhaka Khulna Rajshahi* Sylhet

55
Scenarios of population change in the coastal Ganges Brahmaputra Delta (2011-2051)
2.2 Components of population change
Fertility
Analysing trends in the total fertility rate (TFR) in Bangladesh reveals a decline from 6.7 children per woman in 1960 to around 2.2 in 2012 (World Bank, 2012). This decline is substantial in urban and rural areas and across all administrative units, education categories, and wealth quintiles. The average total fertility rates in both Khulna and Barisal divisions are below the national average except for Barisal district. The lowest fertility rates are observed in Satkhira and Barguna districts with TFR 1.56 and 1.59 respectively (Bangladesh, Ministry of Planning, 2012). In line with the national trends, TFRs in the study area have seen a considerable decline (see figure 2). In 1993/94 in
Barisal division, the TFR was as high as 3.47, whereas in Khulna divison the TFR was 3.05 (Mitra and others, 1994). This compares with the national TFR of 3.44 in 1993/94 (urban TFR was 2.69, while rural TFR was 3.54) (Mitra and others, 1994). While in Barisal division the TFR dropped to 2.3 in 2011, in Khulna division the 2011 TFR is well below the replacement level (overall TFR=1.9). Moreover, the most recent census data suggest that in some districts, such as Satkhira, the TFR is as low as 1.56. In this context, it is interesting to mention the changes in the ideal family size in the coastal Ganges Brahmaputra Delta region.
Figure 2. Changes in Fertility patterns in Khulna and Barisal divisions
0
0.5
1
1.5
2
2.5
3
3.5
4
1993/94 1999 2004 2011
Tota
l fer
tilit
y ra
te
Changes in fertility patterns in Khulna and Barisal divisions
Barisal Khulna

56
Asia-Pacific Population Journal Vol. 30, No. 2
During the time of the first DHS (1993/94) the mean ideal number of children was 2.5, a decline from 4.1 in 1975 (Mitra and others, 1994). Following the reported TFR data, Khulna division showed the lowest desired mean family size with 2.3 children as compared to 2.4-2.8 in other divisions. According to the most recent DHS report in 2011 the mean ideal number of children dropped to 2.2. Regarding regional differentials, Khulna division continues to have the lowest fertility rates, while the mean ideal number of children is lowest in Khulna, Rajshani and Rangpur divisions (2.1) (NIPORT, Mitra and Associates, and ICF International, 2013). The highest mean ideal number of children (2.5) was reported for Sylhet division (NIPORT, Mitra and Associates, and ICF International, 2013).
Mortality
Mortality is the second component of population change. Over the last several decades, Bangladesh has experienced important declines in mortality rates resulting in higher life expectancy across all regions. According to the United Nations data, overall life expectancy in Bangladesh increased from 43.6 years in 1950-55 to 68.4 years in 2005-10 (United Nations, 2013). While subnational mortality time series data are difficult to obtain, a paper by Sen and Ali (2005) provides statistics on division level life expectancy in 1995. According to these data, in 1995 life expectancy in Barisal division was 57.2 years and life expectancy in Khulna division was 58.4 years, which implies considerable improvements in health outcomes of the populations in south-western Bangladesh. This is supported by recent evidence, which reported exceptional achievements in health in Bangladesh despite relatively poor economic performance of the country (Asadullaha, Savoiae, and Mahmud, 2014; Chowdhury and others, 2013).
Migration
Migration is a key factor affecting population size and structure in the study area, which is also due to the environmental vulnerability of the coastal region. According to the 2011 census, 9.7 per cent of the total population of Bangladesh are lifetime internal migrants. Amongst all the districts of Barisal division the proportion of urban to urban, urban to rural and rural to rural lifetime migrants in Jhalokathi district is the highest in terms of percentage of district population (1.1 per cent, 1 per cent and 3.8 per cent respectively). However, the proportion of rural to urban lifetime migrants is the highest in Barisal district (1.7 per cent of the district population) amongst all the districts of Barisal division. Amongst the three districts of the Khulna division, the highest proportions of urban to urban and rural to urban lifetime migrants are found in Khulna district (1.3 per cent and 7.7 per cent respectively). The proportion of urban to rural lifetime migrants is the highest in Bagerhat district (0.6 per cent of the district population). Figure 3 shows the proportions of lifetime internal migrants by district.

57
Scenarios of population change in the coastal Ganges Brahmaputra Delta (2011-2051)
Figure 3. Internal migration over the 5 years (preceding 2011) by place of residence for Barisal and Khulna divisions
Source: BBS (2012b, pp. 324-325). Migration within each district is not considered.
In terms of more recent internal migration (individuals who moved to a different district during the five years preceding the 2011 census), amongst all the districts in the study area, Khulna district has the highest number of recent migrants (over 58,000 people). For most of the districts in the study area the greatest migration flow appears to be from rural areas (of the respective districts) to other rural areas of other districts (except Bhola and Khulna districts). For Bhola district, the highest percentage of migrants is in the direction of urban to rural areas, while for Khulna district it is from rural to urban areas. Migration within each district is not considered in the census.
3. Materials and methods
3.1 Data
For the purpose of this research, several data sources were used. The primary source of data was the most recent 2011 Bangladesh Population and Housing census. The census results included the detailed district-level reports, the Socio-Economic and Demographic Report published by the Bangladesh Bureau of Statistics, and raw data available as Excel file. Complementary sources of data included the most recent and previous versions of the Demographic Health Surveys (DHS), the 2010 report on
0Barguna
10
20
30
40
50
60
70
Barisal Bhola Jhalokati Patuakhali Pirojpur Bagerhat Khulna Satkhira
Khulna divisionBarisal division
Total number of migrants (’000) Urban tourban (percentage of migrants)
Urban torural (percentage of migrants)
Rural torural (percentage of migrants)
Rural tourban (percentage of migrants)

58
Asia-Pacific Population Journal Vol. 30, No. 2
the Sample Vital Registration System (SVRS) and statistics provided by the United Nations Population Division. Additional data were drawn from relevant literature, government reports as well as reports by international organizations. The 2011 census data were used as the baseline population data (table 2).
Table 2. Age-decomposition to the sex gaps in life expectancy at birth (LE) in India and major states in 2002-06
Age
groups
Khulna division Barisal division
Bagerhat Khulna Satkhira Barguna Barisal Bhola Jhalokathi Patuakhali Pirojpur
0-4 132 715 197 075 170 622 88 297 228 010 214 777 63 488 159 889 106 980
5-9 169 581 241 127 216 253 110 594 300 136 269 803 85 334 206 010 135 953
10-14 174 005 252 719 218 237 102 567 302 463 237 853 89 430 189 099 134 839
15-19 119 444 206 349 178 558 63 324 209 397 150 877 60 075 119 917 94 722
20-24 117 969 224 897 182 526 68 675 186 131 142 002 49 835 118 379 88 035
25-29 126 817 222 579 184 510 81 162 186 131 150 877 51 200 132 216 90 264
30-34 115 095 185 797 156 624 68 685 162 378 112 133 49 287 110 533 81 796
35-39 104 619 168 886 142 368 62 766 148 384 102 469 45 039 101 007 74 746
40-44 94 143 151 975 128 112 54 403 128 614 88 817 39 039 87 550 64 788
45-49 72 493 117 025 98 650 42 470 100 403 69 335 30 476 68 346 50 577
50-54 63 347 95 507 81 726 37 589 91 432 57 623 28 772 60 416 46 331
55-59 44 300 66 790 57 152 28 411 69 106 43 553 21 746 45 664 35 018
60-64 48 662 64 919 57 535 30 324 76 779 51 476 23 893 50 734 36 774
65-69 34 888 46 147 42 468 19 693 49 660 31 354 16 581 31 683 26 656
70-74 26 315 34 808 32 033 14 128 35 625 22 493 11 895 22 729 19 123
75-79 15 749 20 832 19 171 8 669 21 861 13 803 7 299 13 947 11 734
80+ 15 949 21 096 19 414 11 024 27 799 17 551 9 282 17 735 14 921
Total 1 476 090 2 318 527 1 985 959 892 781 2 324 310 1 776 795 682 669 1 535 854 1 113 257
Note: Analysis based on the 2011 Bangladesh population census. 39-50 and 65+ age group distribution has been derived based on equivalent proportions in 2010 SVRS report.
3.2 Assumptions
Extensive expert consultations took place in Dhaka, Bangladesh throughout 2014. These consultations involved analysis of plausible future scenarios of the factors affecting population dynamics in the Ganges Brahmaputra Delta region and possible evolution of the three components of population change. Consultations were held at International Centre for Diarrhoeal Disease Research, Bangladesh (icddr,b) and preliminary research findings were presented during the ESPA Deltas project consortium meeting in Dhaka in June 2014. Data analysis was undertaken jointly by the University of Southampton and icddr,b. Three specific scenarios of population change

59
Scenarios of population change in the coastal Ganges Brahmaputra Delta (2011-2051)
were developed in line with broader ESPA Deltas project socio-economic development scenarios, which included a “business as usual”, or constant scenario, a more sustainable scenario and a less sustainable scenario. These broader scenarios were conceived through a series of consultations with Bangladeshi policymakers and academics.
The population projections scenarios were adapted to match the socio- economic development scenarios for the study area. We followed the United Nations interpretation of sustainable development which highlights the three pillars of sustainability, i.e. social, economic and environmental development (Kates, Parris, and Leiserowitz, 2005). Within the three scenarios, we applied this concept, and therefore included potential consequences of environmental and climate change on the current and expected population size and age structure in the study area. The effect of environmentally induced migration on age structure can be particularly noticeable through the migration component of population change, as out-migration tends to have a significant impact on population pyramids in both sending and receiving areas.
Fertility
Fertility assumptions were made based on the historical fertility data, policy developments and evolution of fertility preferences in the study area, and Bangladesh, more broadly. Accounting for these factors, the expert group suggested two specific sets of fertility assumptions. First, the constant trend in fertility based on the most recent fertility levels; and second, fertility decline based on the past trends in total fertility rates and fertility preferences. The constant fertility assumptions are used in combination with assumptions of constant trends in migration and mortality rates. This analysis is undertaken in order to enable comparison with the outcomes of projections based on alternative assumptions. Regarding the declining trends in TFR, assumed future fertility levels were interpolated using Spectrum software with the lowest threshold set at 1.5 children per woman. Overall, demographic research distinguishes between three low fertility levels. Firstly, the replacement level with TFR of 2.1 children per woman, secondly very low fertility where TFR is 1.5, and finally, lowest-low, or ultra-low fertility with TFR of 1.3 or below (Billari and Kohler, 2004; Jones, 2009; Suzuki, 2009). While the aforementioned fertility levels have primarily been analysed in the context of Europe and the Asia-Pacific region, the trends and current fertility levels in the Ganges Brahmaputra Delta region show similar patterns.

60
Asia-Pacific Population Journal Vol. 30, No. 2
With regard to age specific fertility rates (ASFRs), the expert assumptions suggested that they would remain unchanged in the constant and less sustainable scenario. In the more sustainable scenario, the projections assume that ASFRs will gradually change following the Pirojpur district pattern. Pirojpur district has been selected because of its current patterns in ASFRs, which matches most closely the expected future ASFRs in the Ganges Brahmaputra Delta region. Arguably, Pirojpur shows an ASFR pattern which is most reflective of the patterns observed in more economically and socially advanced countries and regions.
Mortality
Mortality assumptions were made accounting for past trends in life expectancy and considering trends in other human development indicators. Data were extrapolated using Spectrum software based on the division level changes in mortality. Based on expert judgement, the upper life expectancy values at the end of the projection period were set at 78 years for males and 80 years for females and kept unchanged in the less sustainable and constant scenarios.
Migration
Migration is arguably the most complex and challenging component of population change because it is influenced by a number of unpredictable factors. As the Ganges Brahmaputra Delta region constitutes a particularly vulnerable socioecological system (Renaud and others, 2013), the potential for out-migration is relatively higher. Regional push factors involve poor quality of life or loss of livelihoods due to environmental shocks. Accounting for the fact that migration is relatively difficult to model, the present study makes three distinct assumptions about future migration. In the constant trends scenario, net migration rate and associated number of migrants are based on the past migration trends. In the more sustainable scenario, a decreasing rate of out-migration is assumed using interpolation methods. Conversely, in the less sustainable scenario relatively high out-migration trends are assumed, based on the most recent 2011 census data. After two decades, out-migration is assumed to gradually decrease. This scenario presupposes a negative impact of climate change, including sea level rise and salinity ingression, which are likely to exacerbate the existing push factors. In this sense, it is assumed that high out-migration is associated with poorer economic development. Assumptions for migration, mortality and fertility are summarised in table 3.
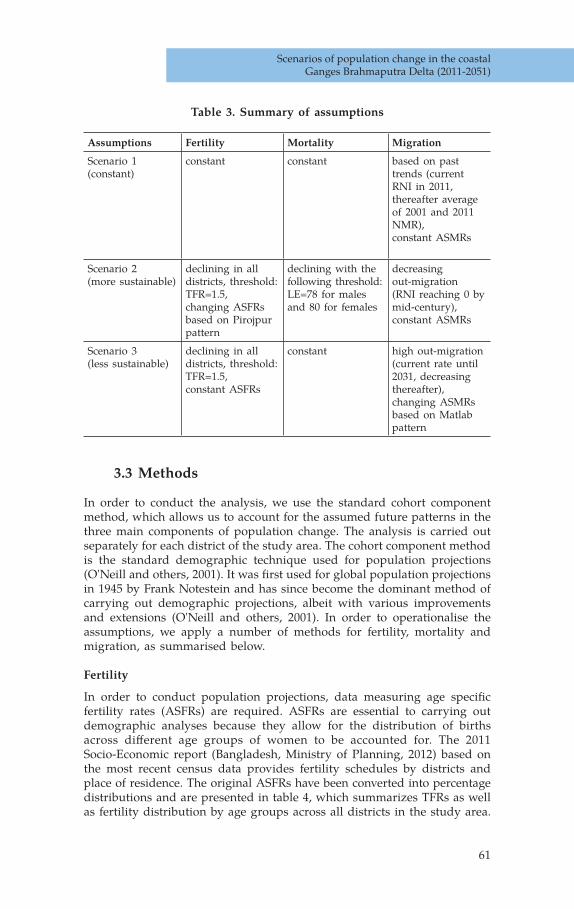
61
Scenarios of population change in the coastal Ganges Brahmaputra Delta (2011-2051)
Table 3. Summary of assumptions
Assumptions Fertility Mortality Migration
Scenario 1 (constant)
constant constant based on past trends (current RNI in 2011, thereafter average of 2001 and 2011 NMR),constant ASMRs
Scenario 2 (more sustainable)
declining in all districts, threshold: TFR=1.5,changing ASFRs based on Pirojpur pattern
declining with the following threshold: LE=78 for males and 80 for females
decreasing out-migration (RNI reaching 0 by mid-century),constant ASMRs
Scenario 3 (less sustainable)
declining in all districts, threshold: TFR=1.5,constant ASFRs
constant high out-migration (current rate until 2031, decreasing thereafter),changing ASMRs based on Matlab pattern
3.3 Methods
In order to conduct the analysis, we use the standard cohort component method, which allows us to account for the assumed future patterns in the three main components of population change. The analysis is carried out separately for each district of the study area. The cohort component method is the standard demographic technique used for population projections (O'Neill and others, 2001). It was first used for global population projections in 1945 by Frank Notestein and has since become the dominant method of carrying out demographic projections, albeit with various improvements and extensions (O'Neill and others, 2001). In order to operationalise the assumptions, we apply a number of methods for fertility, mortality and migration, as summarised below.
Fertility
In order to conduct population projections, data measuring age specific fertility rates (ASFRs) are required. ASFRs are essential to carrying out demographic analyses because they allow for the distribution of births across different age groups of women to be accounted for. The 2011 Socio-Economic report (Bangladesh, Ministry of Planning, 2012) based on the most recent census data provides fertility schedules by districts and place of residence. The original ASFRs have been converted into percentage distributions and are presented in table 4, which summarizes TFRs as well as fertility distribution by age groups across all districts in the study area.

62
Asia-Pacific Population Journal Vol. 30, No. 2
This method is the standard method of applying fertility distribution across age groups and has been incorporated into the widely used population projections software Spectrum (United States Agency for International Development, 2008). It can be observed that amongst all districts in the study area, the proportional contribution of fertility to the overall TFR by the youngest women (aged 15-19) is greatest in Satkhira and Khulna districts. ASFRs for women aged 40 and older are highest in Jhalokati and Pirojpur districts.
Table 4. Distribution of fertility by age groups in the study area districts
Age groups
Barguna Barisal Bhola Jhalokati Patuakhali Pirojpur Bagerhat Khulna Satkhira
15-19 6.94 6.94 7.04 4.67 7.64 9.83 11.05 12.31 15.06
20-24 42.27 33.01 31.41 38.01 30.79 24.72 37.96 38.15 40.06
25-29 25.55 27.27 34.17 25.86 25.46 27.53 25.50 24.62 24.36
30-34 16.40 19.14 18.34 14.64 22.69 16.29 17.28 17.23 12.50
35-39 5.68 10.29 5.03 11.21 9.26 14.89 4.25 5.85 3.85
40-44 0.00 2.63 2.01 5.61 3.24 4.78 2.83 1.85 4.17
45-49 3.15 0.72 2.01 0.00 0.93 1.97 1.13 0.00 0.00
total 100.00 100.00 100.00 100.00 100.00 100.00 100.00 100.00 100.00
TFR 1.59 2.09 1.99 1.61 2.16 1.77 1.76 1.63 1.56
Note: Analysis based on the 2011 Bangladesh Population and Housing census.
Mortality
Division level life tables have been constructed using the 2011 Population and Housing Census data. Based on these data, the estimated current life expectancy of males in the study area varies from 70.9 years for Khulna division to 68.2 years in Barisal division. For females, life expectancy at birth is 73.1 years in Khulna division and 69.8 years in Barisal division. Future life expectancy values were generated using United Nations model life tables. Using these tables relevant Lx values were matched with the estimated life expectancy in the study area in order to project the number of survivors.
Migration
The residual method was used to calculate crude net migration rate. This method cannot directly provide separate information on in-migration and out-migration or on the origin and destination of a migrant. However, it can measure the balance of the movements of all migrating groups, which is of special importance in reconstructing historical trends in net migration. The equation used for the residual method is: net migration is equal to population change during the intercensal period minus natural increase during that period (Morrison, Bryan, and Swanson, 2004). The method used here uses the same equation.

63
Scenarios of population change in the coastal Ganges Brahmaputra Delta (2011-2051)
To elaborate, crude net migration rate (per 1,000 population) is equal to the average annual growth rate (AAGR) (per 1,000 population) minus the annual rate of natural increase (RNI) (per 1,000 population). The RNI is the difference between the Crude Birth Rate (CBR) (per 1,000 population) minus the Crude Death Rate (CDR) (per 1,000 population). While the method does not allow one to estimate in-migration or out-migration, it helps to approximate the size of net migration. Therefore, a negative crude net migration rate would imply that more people out-migrated (O) than in-migrated (I). The equation can be written as follows:
I-O=AAGR – RNI or, I-O=AAGR - (CBR-CDR) Therefore, CNMR=AAGR-(CBD-CDR)
Where,
I-O is the crude net migration rate (CNMR) (The difference between in- migration and out-migration)AAGR is the average annual growth rate (per 1,000 population) RNI is the annual rate of natural increase (per 1,000 population)CBR is the crude birth rates (per 1,000 population) and CDR is the crude death rates (per 1,000 population) (for the same time period).
4. Scenarios of future population change
4.1 Overview of the three scenarios
This section presents three selected scenarios of future population change based on the previously discussed set of assumptions. The difference in expected population sizes between the constant and more sustainable scenarios is almost 1.3 million people in 2051 (table 5 and figure 4). This gap is primarily due to the assumption of continuing out-migration from the study area under the constant scenario. Under the more sustainable scenario the effects of decreasing out-migration combined with higher life expectancy and changing ASFRs lead to practically no change in the projected population size compared to 2011. The starkest difference occurs when the less sustainable scenario is considered. Current rate of net migration combined with no improvements in mortality leads to a considerable decrease in the delta population. More specifically, the population size decreases to 13.1 million in 2031 reaching around 11.4 million in 2051. Relatively high out-migration implies that there would be potentially less women of reproductive age, which in turn has considerable impact on the number of births.

64
Asia-Pacific Population Journal Vol. 30, No. 2
Table 5. Estimated population change in the study area
Scenario 2011 2016 2021 2026 2031 2036 2041 2046 2051 Percentage change
(2011-2051)
More sustainable
14 106 242 14 108 562 14 030 651 14 021 038 14 102 600 14 236 335 14 294 783 14 268 882 14 161 440 0.4
Less sustainable
14 106 242 14 040 870 13 788 501 13 484 356 13 148 726 12 732 769 12 305 516 11 838 135 11 357 150 -19.5
Constant 14 106 242 14 064 703 14 107 618 14 141 168 14 183 383 14 183 127 13 991 248 13 558 890 12 910 194 -8.5
Figure 4. Crude net migration in different divisions of Bangladesh, 2001 and 2010/11
Note: Rangpur division was created in 2010. It includes districts, which were previously part of the Rajshahi division.
4.2 Population structure, dependency ratio and median age
The results of the analysis indicate that while population size is likely to vary depending on assumptions made, there is little difference in terms of projected population structure in the study area. It is expected that in the next decades the population structure in the coastal Ganges Brahmaputra Delta region will undergo considerable change regardless of the projection scenario. The two key aspects of this shift will entail an ageing population and a declining proportion of younger people. More specifically, the proportion of 65 and over is likely to increase from 5.7 per cent in 2011 to 15 or 16 per cent in 2051 depending on the projection scenario. At the same time, the proportion of children and youth (aged 0-14) will decline from 34 per cent to 15 per cent under the less sustainable scenario and to 16 per cent under the constant and more sustainable scenarios. A similar shift is likely to occur in all nine districts although at varying pace.
-15
-10
-5
0
5
10
Crude Net Migration (per 1000)
Barisal Chittagong Dhaka Khulna Raishahi(+Rangpur)
Sylhet
2001
2010/11
(per 1,000 population)

65
Scenarios of population change in the coastal Ganges Brahmaputra Delta (2011-2051)
Figure 5 illustrates the changing population structure by means of population pyramids based on the constant scenario. It can be observed that during the projection period the structure of the population in the study area is likely to undergo considerable change. In particular, the youngest age groups will shrink and be offset by increases in the elderly population. Projected dependency ratios and median population age (figures 6 and 7) confirm this pattern. An interesting finding is that initially dependency ratios show a steady decline which is related to the shrinking population at the bottom of the population pyramid. However, before the mid-point of the projection period (between 2026 and 2031), in all three scenarios the dependency ratios start to pick up which is a consequence of the ageing population. This is confirmed by trends in the median age. While currently the median age in the study area is around 25 years, it is projected to exceed 32 years in 2031 and reach 43 years in 2051. For comparison, according to the CIA World Factbook, the current median age in Thailand is around 36 years, and in China it is almost 37 years. It should be stressed that these expected changes have important policy and management implications. In general, an ageing population requires a greater support network and care which is already a challenge in Bangladesh. In this context, national developmental plans should specifically address the anticipated impacts of population changes at the regional level so as to mitigate future societal risks.
Figure 5. Scenarios of population change in the study area
11,000
11,500
12,000
12,500
13,000
13,500
14,000
14,500
2001 2006 2011 2016 2021 2026 2031 2036 2041 2046 2051
po
pu
lati
on
(00
0)
Scenarios of population change in the study area
Constant Less sustainable More sustainable
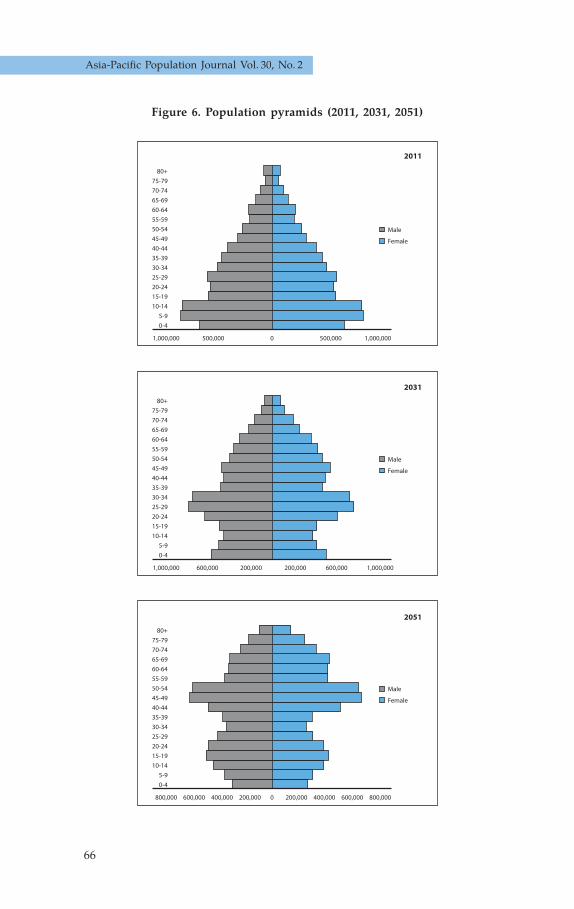
66
Asia-Pacific Population Journal Vol. 30, No. 2
Figure 6. Population pyramids (2011, 2031, 2051)
0-45-9
10-1415-1920-2425-2930-3435-3940-4445-4950-5455-5960-6465-6970-7475-79
80+
Male
Female
Population Distribution-All Study area (2011)
500,000 1,000,000500,0001,000,000 0
0-45-9
10-1415-1920-2425-2930-3435-3940-4445-4950-5455-5960-6465-6970-7475-79
80+
Male
Female
Population Distribution-All Study area (2031)
600,0001,000,000 200,000 600,000200,000 1,000,000
0-45-9
10-1415-1920-2425-2930-3435-3940-4445-4950-5455-5960-6465-6970-7475-79
80+
Male
Female
Population Distribution-All Study area (2051)
800,000 600,000 400,000 200,000 200,000 400,000 600,000 800,0000
2011
2031
2051

67
Scenarios of population change in the coastal Ganges Brahmaputra Delta (2011-2051)
Figure 7. Projected dependency ratios in the study area
Figure 8. Estimated median age in the study area
0.35
0.4
0.45
0.5
0.55
0.6
0.65
0.7
2011 2016 2021 2026 2031 2036 2041 2046 2051
Projected dependency ratios in the study area
Constant Less sustainable More sustainable
0
5
10
15
20
25
30
35
40
45
50
2011 2016 2021 2026 2031 2036 2041 2046 2051

68
Asia-Pacific Population Journal Vol. 30, No. 2
5. Conclusions and policy implications
This study aimed at providing a set of plausible demographic futures for the coastal Ganges Brahmaputra Delta region. Several conclusions can be drawn based on our analysis. First, the contribution of population in the study area to the overall population size in Bangladesh decreased substan-tially over the last century. Second, the population of the study area shows considerable variability in terms of different components of population change. Fertility is still above replacement level in Patuakhali district, but the TFR is as low as 1.6 in Barguna and Satkhira districts. Due to high out-migration combined with declining fertility rates, districts such as Bagerhat have already shown a considerable decline in their populations. Given high environmental vulnerability of the geographical area under investigation, it is sensible to assume that these patterns are likely to continue thus leading to a general population decline in the region. The less sustainable scenario reflected this expected population decline associated with possible high out-migration driven by both economic and environ-mental push factors.
The findings of the present study have important policy implications. Firstly, given the unique demographic patterns in the study area, the policy planning process should prioritize designing specific measures linked to population distribution at the regional and country level. Secondly, important policy implications will result from shifting population structures, in particular a greater proportion of elderly population. Policies regarding healthcare for the elderly should be put in place along with strengthening local infrastructures. In this respect, Bangladeshi policymakers should engage in a dialogue with other countries experiencing similar challenges, such as China. The recent out-migration from the coastal Ganges Brahmaputra Delta region has a significant impact on other geographic locations, including growth of slums and informal settlements in major cities such as Dhaka. Slums in Dhaka and other urban locations already pose a major developmental obstacle in the country (Afsana and Wahid, 2013; Khatun and others, 2011). In this context, regulations around land tenure and property rights will become critical and might require a more decentralised approach. Finally, given the interconnectedness of environmental and social factors and the present and future impacts of climate change on human well-being, it is critical that policy approaches develop integrated strategies targeting the most vulnerable groups.
Future research should aim at understanding the different interrelated drivers of migration, such as political, economic, environmental and social pull and push factors, both at the source and at the destination. Moreover, there is a need for the Government and non-governmental organizations to put in place better systems to improve the vital statistics database, which would enable studies like this to be more robust with improved access to updated data.

69
Scenarios of population change in the coastal Ganges Brahmaputra Delta (2011-2051)
References
Abedin, M. A.,U. Habiba, and R. Shaw (2012). Impacts of salinity, arsenic and drought in South-western Bangladesh. R. Shaw, P. Tran and T. Phong, Environment Disaster Linkages, pp. 165-193. Emerald Group Publishing.
Afsana, K., and S.S. Wahid (2013). Health care for poor people in the urban slums of Bangladesh. The Lancet, vol. 382, No. 9910, pp. 2049-2051.
Ahmed, I. (2009). Environmental refugees and environmental distress migration as a security challenge for India and Bangladesh. Facing Global Environmental Change: Environmental, Human, Energy, Food, Health and Water Security Concepts, vol. 4, pp. 295-308.
Asadullah, M. N., A. Savoia and W. Mahmud (2014). Paths to development: is there a Bangladesh surprise. World Development, vol. 62, pp. 138-154.
Bangladesh, Ministry of Planning (2012). Population and Housing Census 2011. Socio-Economic and Demographic Report. Dhaka
Bangladesh, Ministry of Environment and Forest (2005). National Adaptation Programme of Action (NAPA). Dhaka.
Bangladesh, National Institute of Population Research and Training (NIPORT), Mitra and Associates, and ICF International. (2013). Bangladesh Demographic and Health Survey 2011. Dhaka, Bangladesh and Calverton, Maryland, Unitted States of America.
Billari, F. C., and H.P. Kohler (2004). Patterns of low and lowest-low fertility in Europe. Population Studies: A Journal of Demography, vol. 58, No. 2, pp. 161-176.
Brammer, H. (2014). Bangladesh’s Dynamic Coastal regions and Sea-level Rise. Climate Risk Management, vol. 1, pp. 51-62.
Brown, L. R. (2012). Full Planet, Empty Plates: the New Geopolitics of Food Scarcity. Earth Policy Institute. New Jersey: Rutgers University.
Chowdhury, A.M., and others (2013). The Bangladesh Paradox: Exceptional Health Achievement Despite Economic Poverty. The Lancet, vol. 382, No. 9906, pp. 1734-1745.
de Sherbinin, A., and others (2007). Population and Environment. Annual Review of Environment and Resources, vol. 32, pp. 345-373.
Dyson, T., and C.O. Grada (2002). Demography, food production and famine risks in the twenty-first century. IDS Bulletin, vol. 33, No. 4, p. 108. Available from: http://onlinelibrary.wiley.com/doi/10.1111/idsb.2002.33.issue-4/issuetoc.

70
Asia-Pacific Population Journal Vol. 30, No. 2
Ehrlich, P. R., A.H. Ehrlich, and G.C. Daily (1993). Food security, population, and environment. Population and Development Review, vol. 19, No. 1, p. 32.
Ericson, J.P., and others (2006). Effective sea-level rise and deltas: causes of change and human dimension implications. Global and Planetary Change, vol. 50, Nos. 1 and 2, pp. 63-82
Food and Agriculture Organization of the United Nations (FAO), International Fund for Agricultural Development (IFAD) and World Food Programme (WFP). (2013). The State of Food Insecurity in the World 2013. The Multiple Dimensions of Food Security. Rome: Food and Agriculture Organization of the United Nations. Available from: http://www.fao.org/docrep/018/i3434e/i3434e.pdf.
Foufoula-Georgiou, E., and others (2013). A Vision for a Coordinated International Effort on Delta Sustainability. Deltas: Landforms, Ecosystems and Human Activities, vol. 358, pp. 3-11.
Funk, C. C., and M.E. Brown (2009). Declining Global per Capita Agricul-tural Production and Warming Oceans Threaten Food Security. Food Security, vol. 1, No. 3, pp. 271-289.
Hossain, S. (2013). Migration, Urbanization and Poverty in Dhaka. Journal of the Asiatic Society of Bangladesh, vol. 58, No. 2, pp. 369-382.
_____________, and others (2014). The Coevolution of Ecosystem Services and Human Well-being in the Bangladesh delta. Regional Environmen-tal Change. Springer.
Hummel, D., and others (2012). Inter-and Transdisciplinary Approaches to Population-Environment Research for Sustainability Aims: A Review and Appraisal. Population and Environment, vol. 34, No. 4, pp. 481-509.
Jones, G. W. (2009). Recent Fertility Trends, Policy Responses and Fertility Prospects in Low Fertility Countries of East and Southeast Asia. Available from http://www.un.org/esa/population/meetings/EGM-Fertility2009/P05_Jones.pdf.
Kates, R. W., T.M. Parris, and A.A. Leiserowitz (2005). What is sustainable development? Goals, Indicators, values, and practice. Environment, vol. 47, No. 3, pp. 8-21.
Khatun, F., and others (2011). Causes of neonatal and maternal deaths in Dhaka Slums: implications for service delivery. Tropical Medicine and International Health, vol. 16, pp. 85-86.

71
Scenarios of population change in the coastal Ganges Brahmaputra Delta (2011-2051)
Mallick, B. and J. Vogt (2012). Cyclone, coastal society and migration: empirical evidence from Bangladesh. International Development Planning Review, vol. 34, No. 3, pp. 217-240.
Malthus, T.R. (1798). An essay on the principle of population: The first edition (1798) with introduction and bibliography. The Works of Thomas Robert Malthus. E. A. Wrigely and D. Souden, W. Pickering.
______________(1826). An essay on the principle of population: The sixth edition (1826) with variant readings from the second edition (1803). The Works of Thomas Robert Malthus. E. A. Wrigely and D. Souden, W. Pickering.
Mitra, S.N., and others. (1994). Bangladesh Demographic and Health Survey, 1993-1994. Calverton, Maryland, U.S.A.
Morrison, P.A., T.M. Bryan and D.A. Swanson (2004). Internal Migration and Short-distance Mobility. In The Methods and Materials of Demography. J. S. Siegel, D. A. Swanson and H. Shryock, eds. San Diego, California: Elsevier Academic Press.
Neumann, B., and others (2015). Future Coastal Population Growth and Exposure to Sea-Level Rise and Coastal Flooding-A Global Assessment, PLoS ONE, vol. 10, No. 3.
O'Neill, B. C., and others (2001). A Guide to Global Population Projections. Demographic Research, vol. 4, pp. 203-288.
Pimentel, D., and others (1997). Impact of Population Growth on Food Supplies and Environment. Population and Environment, vol. 19, No. 1, pp. 9-14.
Renaud, F. G., and others. (2013). Tipping from the holocene to the anthro-pocene: How threatened are major world deltas? Current Opinion in Environmental Sustainability, vol. 5, No. 6, pp. 644-654.
Sen, B., and Z. Ali (2005). Spatial Inequality in Social Progress in Bangladesh. PRCBP Working Paper, No. 7. Available from http://www.chronicpoverty.org/uploads/publication_files/PRCPB_WP_7.pdf
Streatfield, P. K., and Z.A. Karar (2008). Population challenges for Bangladesh in the coming decades. Journal of Health Population and Nutrition, vol. 26, No. 3, pp. 261-272.
Suzuki, T. (2009). Fertility Decline and Governmental Interventions in
Eastern Asian Advanced Countries. The Japanese Journal of Population, vol. 7, No. 1, pp. 47-56.

72
Asia-Pacific Population Journal Vol. 30, No. 2
Swapan, M.S.H., and M. Gavin (2011). A desert in the delta: Participatory assessment of changing livelihoods induced by commercial shrimp farming in Southwest Bangladesh. Ocean and Coastal Management, vol. 54, No. 1, pp. 45-54.
United Nations (2013). World Population Prospects, the 2012 Revision. New York.
United States Agency for International Development (USAID) (2008). DemProj. A Computer Program for Making Population Projections. Available from http://www.healthpolicyinitiative.com/Publications/Documents/1255_1_DemmanE.pdf.
van Huis, A., and others (2013): Edible Insects Future Prospects for Food and Feed Security, FAO Forestry Paper, No. 171. Rome: Food and Agricultural Organization of the United Nations. Available from: http://www.fao.org/docrep/018/i3253e/i3253e.pdf.
World Bank. (2012). The World Development Indicators. Accessed 20/10/2012, Available from http://data.worldbank.org/indicator/all.

Editorial management
Editor-in-Chief: Srinivas TataEditor: Vanessa SteinmayerAdvisors: Bhakta Gubhaju and Ghazy Mujahid
EDITORIAL ADVISORY BOARD
• ANTHONY ABEYKOON, Former Secretary-General of the Asian Population Association (APA) and Senior Fellow, Institute for Health Policy, Sri Lanka
• LUBNA BAQI, Deputy Director, UNFPA Asia and the Pacific Regional Office
• JERROLD HUGUET, Former Chief of the Population Section at ESCAP and Independent Population Consultant, Bangkok
• SHIREEN JEJEEBHOY, Senior Programme Associate, Population Council, New Delhi.
• JOHN KNODEL, Professor, Population Studies Center, University of Michigan, United States of America
• SUREEPORN PUNPUING, Director, Institute for Population and Social Research, Mahidol University, Nakhon Pathom, Thailand.

Guidelines for contributors
Orig ina l cont r ibut ions are invited, especially papers by authors from or familiar with the Asian and Pacific region. Ideally, such papers would discuss the p o l i c y a n d / o r p r o g ra m m e impl icat ions of populat ion issues and solutions to problems, reporting on experiences from which others could benefit.
All material submitted for the consideration of the Editorial Board should be in the English language. Manuscripts should not exceed 6,000 words, including tables, figures, references and other material. Consideration will also be given to shorter technical and policy papers and notes on areas of specific po l i cy in terest and va lue . Manuscripts should include a short abstract (100-200 words) of the issues addressed and the most important policy-related findings. The manuscript should be prepared in one of the major word-processing programs and be double- spaced. The margins should be at least 3 cm (roughly 1 inch) wide, preferably more for the left-hand margin. If possible, please submit the manuscript as an e-mail attachment to the address given below. If e-mail attachment is not possible, send a hard copy (a single-sided print copy on A4-sized paper), together with an e-file of the text on CD-ROM.
A complete list of references arranged a lphabet ica l ly by author should also be included at the end of the manuscript together with a few keywords. Please refer to examples in any issue of the Journal or contact the Editor for a copy of the editorial guidelines. Figures and tables should be supplied separately either as e-mail attachments or in the e-file, preferably in Microsoft® Excel® or any major spreadsheet program.
Manuscripts are accepted on the understanding that they may be edited. Contributors should submit only material that has not previously been published or submitted for publication elsewhere; and they should so state in their covering letter.
A brief introduction about the author(s), including title and affiliat ions , should a lso be submitted.
All manuscripts will be submitted to double-blind peer review. The name(s) of the author(s) or other identifying information should therefore be placed only on the title page in order to preserve anonymity.
Manuscripts may be sent by e-mail to the Editor, APPJ, at [email protected]; or by airmail post to: Editor, APPJ, Social Development Division, ESCAP, United Nations Building, Rajadamner n Nok Avenue , Bangkok 10200, Thailand.
Asia-Pacific Population Journal

ESCAP is the regional development arm of the United Nations andserves as the main economic and social development centre forthe United Nations in Asia and the Pacific. Its mandate is to fortercooperation between its 53 members and 9 associate members.ESCAP provides the strategic link between global and country-levelprogrammes and issues. It supports Governments of countries in theregion in consolidating regional positions and advocates regionalapproaches to meeting the region's unique socioeconomic challengesin a globalizing world. The ESCAP office is located in Bangkok. Pleasevisit the ESCAP website at www.unescap.org for further information.
The shaded areas of the map indicate ESCAP members and associate member.
UNITED NATIONS PUBLICATIONSales No. E.15.II.F.98
Copyright@United Nations 2012All rights reserved
Manufactured in ThailandISBN: 978-92-1-120703-3
e-ISBN: 978-92-1-057672-7ST/ESCAP/2732
Copies of this publication may be obtained from:
Economic and Social Commissionfor Asia and the Pacific (ESCAP)
United Nations BuildingRajadamnern Nok AvenueBangkok 10200, Thailand
E-mail: [email protected]

United Nations publications may be obtained from bookstores and distributors throughout the world. Please consult your bookstore or
write to any of the following: Customers in: America, Asia and the Pacific
Email: [email protected] Web: un.org/publications Tel: +1 703 661 1571 Fax: +1 703 996 1010
Mail Orders to:United Nations PublicationsPO Box 960Herndon, Virginia 20172United States of America
Customers in: Europe, Africa and the Middle East
United Nations Publicationc/o Eurospan Group Email: [email protected] Web: un.org/publications Tel: +44 (0) 1767 604972 Fax: +44 (0) 1767 601640
Mail Orders to:United Nations PublicationsPegasus Drive, Stratton Business ParkBigglewade, Bedfordshire SG18 8TQUnited Kingdom
For further information on this publication,
please address your enquiries to:
ChiefConference and Documentation Service SectionOffice of the Executive SecretaryEconomic and Social Commission for Asia and the Pacific (ESCAP)United Nations Building, Rajadamnern Nok AvenueBangkok 10200, Thailand Tel: 66 2 288-1110 Fax: 66 2 288-3018E-mail: [email protected]


![Untitled-2 [apps.azdot.gov] · 22 23 FAA APPROVAL Subject to comments contained in our letter dated: FEDERAL AVIATION ADMINISTRATION Western-Pacif Region Manager 7 Manager — AIRPORT](https://static.fdocuments.us/doc/165x107/5e9e697b14f5525afb4aed53/untitled-2-appsazdotgov-22-23-faa-approval-subject-to-comments-contained-in.jpg)