Vol. 15, No.-2, July - December 2017 - RDIAS
117
CHIEF PATRON Sh. K. C. Garg Chairman, RDIAS Founder President, SPMES PATRON Prof. (Dr.) Raman Garg Director (Officiating), RDIAS EDITORIAL TEAM Editor-in-Chief Prof. Anil Kumar Goyal Associate Editor Dr. Anshu Lochab Dr. Smita Mishra Dr. Irameet Kaur Editorial Advisory Board Prof. R. K. Mittal GGS Indraprastha University, Delhi Prof. Debi S. Saini Former Professor Management Development Institute Gurgaon, Haryana Prof. A. T. K. Raman New Delhi Institute of Management, New Delhi Prof. Satinder Bhatia Indian Institute of Foreign Trade, New Delhi Prof. Manipadma Datta Teri University, Delhi Vasant Kunj, New Delhi Prof. Sudhir K. Jain Indian Institute of Technology, Delhi Dr. Ravi Gupta Sriram College of Commerce University of Delhi, Delhi Prof. C. P. Gupta University of Delhi Prof. A. K. Singh FORE School of Management, Delhi Dr. D. K. Sharma Gautam Buddha University, Greater Noida
Transcript of Vol. 15, No.-2, July - December 2017 - RDIAS

CHIEF PATRONSh. K. C. GargChairman, RDIASFounder President, SPMES
PATRONProf. (Dr.) Raman Garg Director (Officiating), RDIAS
EDITORIAL TEAM
Editor-in-Chief Prof. Anil Kumar Goyal
Associate EditorDr. Anshu LochabDr. Smita MishraDr. Irameet Kaur
Editorial Advisory Board
Prof. R. K. MittalGGS Indraprastha University, Delhi
Prof. Debi S. Saini Former Professor Management Development Institute Gurgaon, Haryana
Prof. A. T. K. RamanNew Delhi Institute of Management, New Delhi
Prof. Satinder BhatiaIndian Institute of Foreign Trade, New Delhi
Prof. Manipadma DattaTeri University, DelhiVasant Kunj, New Delhi
Prof. Sudhir K. JainIndian Institute of Technology, Delhi
Dr. Ravi GuptaSriram College of Commerce University of Delhi, Delhi
Prof. C. P. GuptaUniversity of Delhi
Prof. A. K. SinghFORE School of Management, Delhi
Dr. D. K. SharmaGautam Buddha University, Greater Noida

Vol. 15, No.-2, July - December 2017
ContentsRESEARCH PAPERS Page No.Impact of Implementation of Corporate Governance Guidelines
Performance of Indian Listed firms
Dr. Prashant Gupta, Dr. Dinesh Kumar Sharma 01
Role of Stakehoders in Implementing Green Supply Chain Practices in Indian Automobile Industry
Renu Paisal, Dr. Manisha Sharma 17
Mismatched Perception and Expectation of Retail Stakeholders: An Assessment of Indian Retail
Store Jobs
Dr. Anju Verma, Dr. Ubba Savita 33
Role of Imparting Value Driven Soft Skills in Young Managers: An Empirical Study in The Indian
Context
Prof. Shalini Garg, Shipra Sharma 44
CSR Activities and Responsibilities by FMCG Companies of India: A Customer Perspective
Shivani Raheja 52
Factors influencing Women Employees in Hospitality industry: A Study with reference to Lucknow
Dr. Tripti Barthwal, Dr. Akanksha Srivastava 64
Evaluation of Post-Merger Performance on a Value Based Framework: A Case of Hindalco Industries
Ltd. and Novelis Inc.
Dr. Anjala Kalsie, Dr. Ashima Arora 77
Financial Risk and Job Stress in Banks: An Empirical Analysis
Dr. Nidhi Dhawan 90
CASE STUDYCompetency based Human Resource Management System- A case study of a leading Public Sector
undertaking
Dr. Namita Gupta, Dr. Deepa Kumari, Dr. Bharat Gupta 97
BOOK SCANUnderstanding the Black Economy and Black Money in India
Dr. Tripti Toor Bajpai 107
(Clause 49) on Financial
ISSN (O) : 2456-6675, ISSN (P) : 0972-8058


Editorial
Dear Readers,
In a world that’s perpetually transforming and continuing to spring up new challenges, its imperative that we speak the language of holistic approach. The changing trends in all the sectors, economies, trades and geographies, are leading to new developments and new perspectives of doing things. Such new and upcoming dimensions have inspired this new issue of “Effulgence” which we are pleased to bring onboard.
The issue touches upon the various aspects revolving around the changing management trends across diverse fields such as marketing, finance, human resources and supply chain. Ranging from modern concepts of green supply chain practices to the traditional competency based framework, this edition attempts to present a bouquet of studies from different sectors. Short studies on financial risks and job stress in banks and impact of corporate governance guidelines on financial performance have been included to cover the financial aspects. The social side of business has been discussed by short review of CSR activities by FMCG companies and by discussing the factors effecting women in the hospitality segment. The HR part discusses about the assessment of retail jobs and the role of soft skills in young managers. The key highlight of this issue is the comprehensive Book scan of the book by Prof. Arun Kumar that uncovers the reality behind the black economy and black money in India.
The issue thus attempts to integrate different studies across sectors to present an overview of the latest happenings “Effulging” in the area of business management. To conclude, hope the compilation in this issue makes an interesting and informative read.
With best wishes
Prof. Anil Kumar GoyalEditor-in-Chief
Effulgence
Vol. 15 No. 2
July-December, 2017
Rukmini Devi Institute of Advanced Studies
E-mail : [email protected], Website : www.rdias.ac.in
http://effulgence.rdias.ac.in/user/default.aspx

Impact of Implementation of Corporate Governance Guidelines (Clause 49) on Financial Performance of Indian Listed firms
1Dr. Prashant Gupta
2Dr. Dinesh Kumar Sharma
1. IMI, New Delhi, [email protected]. Gautam Budh University, Greater Noida, [email protected] Author
Dr. Dinesh Kumar Sharma, Gautam Budh University, Greater Noida, [email protected]
Abstract
Generally the good corporate governance reduces the agency problem and improves the firm/enterprise's performance. It not
only cubs the corporate frauds, scandals etc, but also improves the corporate image in the minds of all stakeholders and public at
large. During liberalization in early nineties, evolution of corporate governance also started in India from Cadbury Committee
Report to Kumar Manglam Birla report on Corporate Governance. Then, came the formal code of conduct or guidelines issued
by the regulator of capital markets, Securities Exchange Board of India (SEBI) by inserting a new 'Clause 49' in the listing
guidelines to make these mandatory for all the listed companies in India from January, 2006. The question is to determine how
governance and firm performance interact with each other and study their relationship to find some meaningful results. This
study examined the impact of the implementation of the Clause 49 (corporate governance) on the firm's performance in India.
Since it is made compulsory for the listed companies, hence this study is done on the companies listed in the NSE. Both market
and accounting based performance measures are used for the purpose. Unique data from 50 listed firms drawn from the index
“Nifty 50” to represent the Indian listed firms for 16 years, covering eight years period each for prior and after 2006 to find out
the impact by comparing the results.
The result of the study suggests that there is no positive impact of implementation of Clause 49 on the performance of the Indian
listed companies.
Corporate Governance, Clause 49 and Firm PerformanceKeywords:
large. Hence, the corporate governance is the INTRODUCTIONprocess, rule and/or the laws to supervise, manage
and govern the firms without under the undue orporate governance empowers the board so
influence of any one and to serve the all Cthat it can perform its duties being unbiased to stakeholders. So, corporate governance mitigates the
promoter shareholders and/or to the top agency problems arising due to the complex
management of the firm, i.e. to resolve the agency relationship between agents and principals.
problem and protect the shareholder's benefits at
Effulgence
Vol. 15 No. 2
July-December, 2017
Rukmini Devi Institute of Advanced Studies
E-mail : [email protected], Website : www.rdias.ac.in
http://effulgence.rdias.ac.in/user/default.aspx
ISSN (O) : 2456-6675, ISSN (P) : 0972-8058

ISSN (O) : 2456-6675, ISSN (P) : 0972-8058
Then what the Corporate Governance is all about? It world over. The existing literature on corporate
is a relevant set of mechanisms to economic governance is generally on and about large and
efficiency that has influence over investor's decision listed firms in the US and UK, and these studies
to provide finance to firm; debt or equity (Shleifer primarily focused on the relationship between
and Vishny, 1997). Mayer (1997) defined corporate corporate performance, structures of ownership and
governance as ways of bringing investor's and composition of boards.
manager's interest in line to ensure firm's
functioning for the investor's benefit. Corporate In many Asian countries like India, Japan, Korea,
governance includes the structures, processes, and also in some South-East Asian countries large
cultures and systems that create organizations' number of businesses are managed and owned by
successful operation (Keasey et al., 1997). Significant business families. By using cross investment and
flow of capital to the financing of firms can be stock pyramids, these families retain their control on
ensured with governance structure. Information the businesses even without a controlling stake. A
asymmetry between suppliers' of capital and divergence between cash flow rights and voting (or
managers can cause into expropriation of investor's control) rights is created due to this.
wealth due to separation between control and
ownership (Berle and Means, 1932). This could be In Indian context, generally the agency problem is at
dealt properly with an appropriate governance the core of corporate governance, which is a conflict
structure in place that should take care of reducing between shareholders and management. Earlier,
rent seeking behavior of an agent while providing companies who were going global started following
required necessary investment. As described by stringent policies, disclosures and international
Deakin and Hughes (1997), corporate governance is accounting standards, but now after clause 49 for all
the relationship between conception of society about listed companies and with new company law in
the scope of firm's accountability and the mechanism place, most others are now considering it necessary
adopted by the firm for internal governance. Due to to do so since they have to follow the current norms.
presence of agency problem, for future decisions and In India, the Anglo-American model is generally
any unforeseen situation that is not described in the followed that lays more importance to shareholders
current agreement between principal and agent, it is as compared to stakeholders.
necessary to have a mechanism for this. Hart (1996)
described that structure of governance provide a The major areas of compliance in Clause 49 are :
way to decide those actions which may be taken in • Enhanced role of Audit committee
future but were not initially specified in the contract. • CEO/CFO Certification of Accounts by
From the above discussion we can deduce that the CEO/CFO
structure and process set up by a company or • Appointment of Independent Directors as per
enterprise to reduce the agency problem as the requirements
ownership and controls are separated. Various • Code of Conduct for Board / Senior
different systems of corporate governance will draw Management
a clear structure and legitimate accountability by • Legal Compliance Report and Risk Mitigation
explaining relationship between company and its Report to the Board
key functionaries. • Compliance, related to Subsidiary Companies
• Information items to Board
Due to East Asian crisis, increasing integration of
Review of Literature:business across the globe and some corporate
scandals/frauds around the world, prominence and
Diverse, rather many times contrast objectives impetus to corporate governance has increased
Effulgence, Vol. 15, No. 2, July-December, 2017
02

emerge between owners and managers of business. over managers can be minimized by incorporating
This requires a system to control the cost associated effective corporate governance. Jensen and Meckling
with this divergence. Corporate governance serves (1976) have discussed about relationship between
that purpose and agency theory dominates the shareholders and managers and suggested that since
corporate governance literature. managers mange the company on behalf of
shareholders so managers are agents of shareholders
It is generally accepted that there is a positive effect and thus they must judiciously utilize the financial
of good corporate governance on performance of resources supplied by shareholders to the business.
firms that is enhanced due to good governance. Now days, a lot is debated and discussed about the
Several studies supported this view (Weisbach, 1988; board's functioning and structures so this has
Brickley and James, 1987; Rosenstein and Wyatt, become an important issue to be monitored by
1990; Lee et al, 1992; Byrd and Hickman, 1992; legal/regulatory authorities and also subject to
Brickley et al, 1994; Hossain et al, 2000; Chung et al, continuous scrutiny by media. Quality of manager's
2003). On the contrary to this generally accepted decision making can be enhanced and improved by
notion about positive impact of good governance on better board supervision (Monks and Minow, 1995).
firm performance, many studies have found that The association between board size and financial
there is no or negative relationship between performance was analyzed on the data of 504 firms
performance of firm and good corporate governance drawn from 18 industries by Kathuria and Dash
(Prevost et al. 2002; Park and Shin, 2003; Young, (1999) in India. They found that if firm size grows,
2003; Singh and Davidson, 2003; Bathala and Rao, contribution of additional board member decrease if
1995; Hutchinson, 2002) or have not found any board size is increased but with increase in board
relationship. size, performance of firm increases.
Some studies tried to find out the reasons of these Another study, done by Dhawan (2006) in India on
diverse results and inconsistencies. Some found it is the large listed firms to identify the role of the
due to the limited scope of sources being it a survey directors (Board) in the corporate governance
data or publicly available data. Krivogorsky (2006) practices, found that the size of the board increases
argued that the literature in corporate governance with the increase in turnover initially but after a
generally use only two variables at a time. For certain level, increase in turnover has no influence
example, studies by McAvoy et al. (1983) and on board size. He also found that what matter more
Hermalin and Weisbach (1991) studied relationship than the size of board is, the appropriate
between firm performance and composition of board combination of knowledge and skills. Relationship
and Demsetz and Villalonga (2001) analysed the between Board parameters and financial
correlation between firm performance and performance of firms is empirically examined by
managerial ownership. Furthermore, Gani and Ghosh (2006) on 127 listed manufacturing firms and
Jermias, (2006) pointed out that the restrictive use of it was found that irrespective of market based or
accounting based measures like return on equity accounting based performance measures, there is
(ROE), return on assets (ROA) and return on capital negative influence of board size on the performance
employed (ROCE) or market based measures like of firm. Also it is found that there is a significant
market value of equities may be the reason of these impact of Chief Executive Officer's compensation on
inconsistencies. performance of firm. Generally it is believed that
independence of board leads to better firm
According to Shleifer and Vishny (1997) in their performance. A study based on factor analysis is
extensive literature survey on corporate governance, done by Prasanna (2006) that empirically proved this
suggested that shareholder's and creditor's control belief. The study suggested that the independent
ISSN (O) : 2456-6675, ISSN (P) : 0972-8058
03

directors effectively lead various committees formed relationship between firm value and independence
for better governance, make board more credible for of audit committee by Chan and Li (2008) on fortune
improved governance and they also help board in 200 companies, it is found that if top executives of
functioning more efficiently and effectively. In an other publically listed companies are considered as
another study done by Mayur and Saravanan (2006), 'expert independent directors' then their presence in
who studied the relationship between performance board or in audit committee as 'expert independent
of Indian banks and three chosen board parameters, directors', increases the value of firm. The audit
it is deducted that board size does not affect the committee size has significant effect on the value of
value of Bank. Later SEBI also came out with Clause firm, however independence of audit committee and
49 for all the listed companies that emphasized the no. of meetings of audit committee were found
importance and role of independent directors for the insignificant with firm performance in a study
enhanced transparency and improved governance as conducted by Al-Matari et.al.(2012) on listed
compared to only executive/functional directors in companies of Saudi on Saudi stock exchange
the board. Recommendations by other committees (TADWAL) in year 2010. An increasing trend
like Kumar Manglam Birla Committee along with towards the compliance of clause 49 of SEBI was
other recommendations also argued and advocated observed in the listed companies in a content
for independency of board for effective governance analysis, done by Bhasin (2012) on top 500 listed
structure. Hence composition of board can be companies in India.
considered one of the important parameter in
Rationale of the studyrelation to performance of firm. Kumar and Singh
(2012) conducted a study in 2008 on 157 non-
Literature review suggests that lots of studies have financial Indian companies to find out the
been done on to find out the impact of corporate effectiveness of outside directors in boards of
governance on firm performance. Many researchers companies. The results of this study do not strongly
have studied different aspects of corporate confirm that more independent directors in board
governance and linked these to firm performance have positive impact on firm's value. On the other
like Board Size, Number of Independent Directors in hand a study, done by Jackling and Johl (2009) on
board, Audit committees meetings etc. But we found Indian companies supported agency theory and
very fewer studies find out the performance of found that firm performance improves if more
Indian listed companies after the implementation of independent directors are inducted in boards of
Clause 49 by the SEBI in 2006. So the researchers companies. Results of this study also opposed the
thought to study this impact on the Indian listed idea of disassociation of ownership and control i.e. a
companies.strong owner cum (duality role, CEO is the
promoter, and also the only board manager) have a Objectives of the studynegative impact on firm performance was not
supported by this study. So the various studies The objective of the study is:which examined between firm performance and • To find out the impact of implementation of internal ownership can be categorized in to two sets;
Corporate Governance Guidelines (Clause 49) on one with positive relationship and another with performance of listed companies in India. To negative relationship between the two aspects. find out the impact on firm performance, Impact of insider ownership on firm performance is various profitability parameters are tested (like industry specific and not general (Phani et al., 2005). EPS, leverage, gross profit and net profit etc.) of This study examined the difference in cash flow listed companies.rights and insiders control and also its impact on the
individual firm performance. In a study on the
ISSN (O) : 2456-6675, ISSN (P) : 0972-8058
04
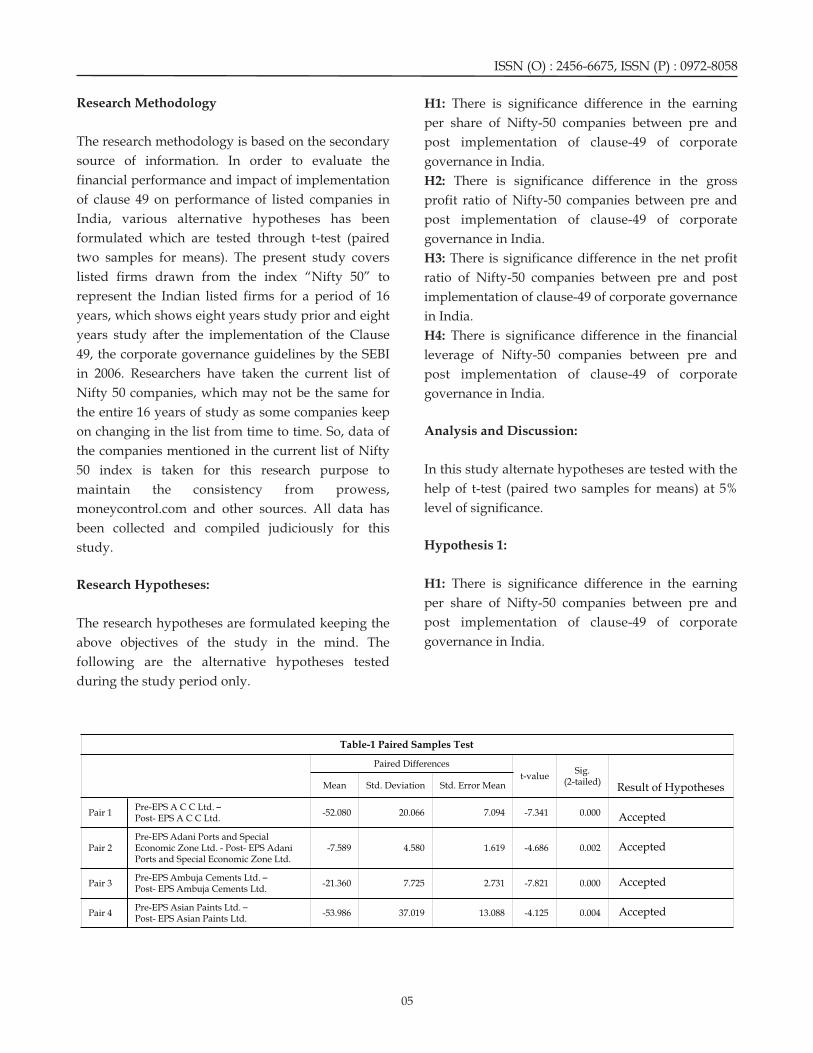
Table-1 Paired Samples Test
Paired Differences
t-valueSig.
(2-tailed)Result of Hypotheses Mean Std. Deviation Std. Error Mean
Pair 1Pre-EPS A C C Ltd. –Post- EPS A C C Ltd.
-52.080 20.066 7.094 -7.341 0.000 Accepted
Pair 2Pre-EPS Adani Ports and Special Economic Zone Ltd. - Post- EPS AdaniPorts and Special Economic Zone Ltd.
-7.589 4.580 1.619 -4.686 0.002 Accepted
Pair 3Pre-EPS Ambuja Cements Ltd. –Post- EPS Ambuja Cements Ltd.
-21.360 7.725 2.731 -7.821 0.000 Accepted
Pair 4Pre-EPS Asian Paints Ltd. –Post- EPS Asian Paints Ltd.
-53.986 37.019 13.088 -4.125 0.004 Accepted
Research Methodology H1: There is significance difference in the earning
per share of Nifty-50 companies between pre and
The research methodology is based on the secondary post implementation of clause-49 of corporate
source of information. In order to evaluate the governance in India.
financial performance and impact of implementation H2: There is significance difference in the gross
of clause 49 on performance of listed companies in profit ratio of Nifty-50 companies between pre and
India, various alternative hypotheses has been post implementation of clause-49 of corporate
formulated which are tested through t-test (paired governance in India.
two samples for means). The present study covers H3: There is significance difference in the net profit
listed firms drawn from the index “Nifty 50” to ratio of Nifty-50 companies between pre and post
represent the Indian listed firms for a period of 16 implementation of clause-49 of corporate governance
years, which shows eight years study prior and eight in India.
years study after the implementation of the Clause H4: There is significance difference in the financial
49, the corporate governance guidelines by the SEBI leverage of Nifty-50 companies between pre and
in 2006. Researchers have taken the current list of post implementation of clause-49 of corporate
Nifty 50 companies, which may not be the same for governance in India.
the entire 16 years of study as some companies keep
Analysis and Discussion:on changing in the list from time to time. So, data of
the companies mentioned in the current list of Nifty
In this study alternate hypotheses are tested with the 50 index is taken for this research purpose to
help of t-test (paired two samples for means) at 5% maintain the consistency from prowess,
level of significance.moneycontrol.com and other sources. All data has
been collected and compiled judiciously for this
Hypothesis 1:study.
H1: There is significance difference in the earning Research Hypotheses:
per share of Nifty-50 companies between pre and
post implementation of clause-49 of corporate The research hypotheses are formulated keeping the
governance in India.above objectives of the study in the mind. The
following are the alternative hypotheses tested
during the study period only.
ISSN (O) : 2456-6675, ISSN (P) : 0972-8058
05

Pair 5Pre-EPS Axis Bank Ltd. –Post- EPS Axis Bank Ltd.
-59.356 31.223 11.039 -5.377 0.001 Accepted
Pair 6Pre-EPS Bajaj Auto Ltd. –Post-EPS Bajaj Auto Ltd.
-9.551 29.998 10.606 -0.901 0.398 Rejected
Pair 7Pre-EPS Bank Of Baroda –Post- EPS Bank Of Baroda
-59.218 31.532 11.148 -5.312 0.001 Accepted
Pair 8Pre-EPS Bharat Heavy Electricals Ltd. –Post- EPS Bharat Heavy Electricals Ltd.
-60.383 39.241 13.874 -4.352 0.003 Accepted
Pair 9Pre-EPS Bharat Petroleum Corpn. Ltd. –Post- EPS Bharat Petroleum Corpn. Ltd.
5.081 49.320 17.437 0.291 0.779 Rejected
Pair 10Pre-EPS BhartiAirtel Ltd. - Post- EPS BhartiAirtel Ltd.
-32.201 10.944 3.869 -8.322 0.000 Accepted
Pair 11Pre-EPS Bosch Ltd. - Post- EPS Bosch Ltd.
-163.488 57.670 20.390 -8.018 0.000 Accepted
Pair 12Pre-EPS Cairn India Ltd. - Post-EPS Cairn India Ltd.
-14.339 28.894 10.216 -1.404 0.203 Rejected
Pair 13 Pre-EPS Cipla Ltd. - Post- EPS Cipla Ltd. -9.773 16.615 5.874 -1.664 0.140 Rejected
Pair 14Pre-EPS Coal India Ltd. - Post- EPS Coal India Ltd.
-18.745 11.005 3.891 -4.818 0.002 Accepted
Pair 15Pre-EPS Dr. Reddy'S Laboratories Ltd. -Post- EPS Dr. Reddy'S Laboratories Ltd.
-54.596 68.555 24.238 -2.253 0.059 Rejected
Pair 16Pre-EPS G A I L (India) Ltd. - Post- EPS G A I L (India) Ltd.
-10.514 4.909 1.736 -6.058 0.001 Accepted
Pair 17Pre-EPS Grasim Industries Ltd. - Post-EPS Grasim Industries Ltd.
-99.778 69.736 24.655 -4.047 0.005 Accepted
Pair 18Pre-EPS H C L Technologies Ltd. - Post-EPS H C L Technologies Ltd.
-74.284 97.551 34.489 -2.154 0.068 Rejected
Pair 19Pre-EPS H D F C Bank Ltd. - Post- EPS H D F C Bank Ltd.
-68.711 33.709 11.918 -5.765 0.001 Accepted
Pair 20Pre-EPS Hero Motocorp Ltd. - Post- EPS Hero Motocorp Ltd.
-312.403 94.733 33.493 -9.327 0.000 Accepted
Pair 21Pre-EPS Hindalco Industries Ltd. - Post-EPS Hindalco Industries Ltd.
-29.425 64.427 22.778 -1.292 0.237 Rejected
Pair 22Pre-EPS Hindustan Unilever Ltd. - Post-EPS Hindustan Unilever Ltd.
56.888 203.813 72.059 0.789 0.456 Rejected
Pair 23Pre-EPS Housing Development Finance Corpn. Ltd. - Post- EPS Housing Development Finance Corpn. Ltd.
-43.821 112.816 39.886 -1.099 0.308Rejected
Pair 24Pre-EPS I C I C I Bank Ltd. - Post- EPS I C I C I Bank Ltd.
-33.918 11.437 4.044 -8.388 0.000 Accepted
Pair 25 Pre-EPS I T C Ltd. - Post- EPS I T C Ltd. -37.465 19.062 6.739 -5.559 0.001 Accepted
Pair 26Pre-EPS Idea Cellular Ltd. - Post- EPS Idea Cellular Ltd.
-2.751 1.207 0.427 -6.446 0.000 Accepted
Pair 27Pre-EPS Indusind Bank Ltd. - Post- EPS Indusind Bank Ltd.
-5.860 10.197 3.605 -1.625 0.148 Rejected
Pair 28Pre-EPS Infosys Ltd. - Post- EPS Infosys Ltd.
-35.450 109.255 38.627 -0.918 0.389 Rejected
Pair 29Pre-EPS Kotak Mahindra Bank Ltd. -Post- EPS Kotak Mahindra Bank Ltd.
-10.704 14.118 4.991 -2.144 0.069 Rejected
Pair 30Pre-EPS Larsen & Toubro Ltd. - Post-EPS Larsen & Toubro Ltd.
-212.603 141.166 49.910 -4.260 0.004 Accepted
Pair 31Pre-EPS Lupin Ltd. - Post- EPS Lupin Ltd.
-79.399 63.546 22.467 -3.534 0.010 Accepted
Pair 32Pre-EPS Mahindra & Mahindra Ltd. -Post- EPS Mahindra & Mahindra Ltd.
-48.790 30.819 10.896 -4.478 0.003 Accepted
Pair 33Pre-EPS Maruti Suzuki India Ltd. - Post-EPS Maruti Suzuki India Ltd.
-107.123 38.197 13.505 -7.932 0.000 Accepted
ISSN (O) : 2456-6675, ISSN (P) : 0972-8058
06

Pair 34Pre-EPS N T P C Ltd. - Post- EPS N T P C Ltd.
-4.681 2.097 0.742 -6.313 0.000 Accepted
Pair 35Pre-EPS Oil & Natural Gas Corpn. Ltd. -Post- EPS Oil & Natural Gas Corpn. Ltd.
-4.900 43.739 15.464 -0.317 0.761 Rejected
Pair 36Pre-EPS Power Grid Corpn. Of India Ltd. - Post- EPS Power Grid Corpn. Of India Ltd.
-3.671 1.682 0.595 -6.175 0.000Accepted
Pair 37Pre-EPS Punjab National Bank - Post-EPS Punjab National Bank
-73.353 32.446 11.472 -6.394 0.000 Accepted
Pair 38Pre-EPS Reliance Industries Ltd. - Post-EPS Reliance Industries Ltd.
-43.013 36.950 13.064 -3.292 0.013 Accepted
Pair 39Pre-EPS State Bank Of India - Post- EPS State Bank Of India
-75.629 38.759 13.704 -5.519 0.001 Accepted
Pair 40Pre-EPS Sun Pharmaceutical Inds. Ltd. -Post- EPS Sun Pharmaceutical Inds. Ltd.
-65.450 55.162 19.503 -3.356 0.012 Accepted
Pair 41Pre-EPS Tata Consultancy Services Ltd. -Post- EPS Tata Consultancy Services Ltd.
-401.091 95.904 33.907 -11.829 0.000 Accepted
Pair 42Pre-EPS Tata Motors Ltd. - Post- EPS Tata Motors Ltd.
-21.045 34.709 12.271 -1.715 0.130 Rejected
Pair 43Pre-EPS Tata Power Co. Ltd. - Post- EPS Tata Power Co. Ltd.
-14.293 9.237 3.266 -4.376 0.003 Accepted
Pair 44Pre-EPS Tata Steel Ltd. - Post- EPS Tata Steel Ltd.
-36.511 25.100 8.874 -4.114 0.004 Accepted
Pair 45Pre-EPS Tech Mahindra Ltd. - Post- EPS Tech Mahindra Ltd.
-4.691 20.848 7.371 -0.636 0.545 Rejected
Pair 46Pre-EPS Ultratech Cement Ltd. - Post-EPS Ultratech Cement Ltd.
-70.855 18.919 6.689 -10.593 0.000 Accepted
Pair 47Pre-EPS Vedanta Ltd. - Post- EPS Vedanta Ltd.
-178.984 184.929 65.382 -2.737 0.029 Accepted
Pair 48Pre-EPS Wipro Ltd. - Post- EPS Wipro Ltd.
24.444 62.900 22.239 1.099 0.308 Rejected
Pair 49Pre-EPS Yes Bank Ltd. - Post- EPS Yes Bank Ltd.
-19.645 13.904 4.916 -3.996 0.005 Accepted
Pair 50Pre-EPS Zee Entertainment Enterprises Ltd. - Post- EPS Zee Entertainment Enterprises Ltd.
-35.001 29.010 10.257 -3.413 0.011Accepted
The results of Paired Samples t-Test in Table-1 depict observed that most of the bank's EPS have been
that the alternative hypotheses of 16 companies have impacted significantly.
been rejected while it has been accepted for 34
Hypothesis 2:companies. Hence statistically there is significance
impact of implementation of clause-49 of corporate
H2: There is significance difference in the gross governance on the shareholder's wealth of majority
profit ratio of Nifty-50 companies between pre and of nifty-50 companies in India. The industries were
post implementation of clause-49 of corporate further clustered on the basis of acceptance and
governance in India.rejection of the relevant hypotheses. It has been
ISSN (O) : 2456-6675, ISSN (P) : 0972-8058
07

Table-2 Paired Samples Test
Paired Differences
t-valueSig.
(2-tailed)
Result of Hypothese
s MeanStd.
DeviationStd. Error
Mean
Pair 1 Pre-GP Ratio A C C Ltd. - Post- GP Ratio A C C Ltd. -8.767 11.705 4.424 -1.982 0.095 Rejected
Pair 2Pre-GP Ratio Adani Ports and Special Economic Zone Ltd. -Post- GP Ratio Adani Ports and Special Economic Zone Ltd.
-29.003 14.796 5.592 -5.186 0.002 Accepted
Pair 3Pre-GP Ratio Ambuja Cements Ltd. - Post- GP Ratio AmbujaCements Ltd.
-1.870 15.043 5.686 -0.329 0.753 Rejected
Pair 4Pre-GP Ratio Asian Paints Ltd. - Post- GP Ratio Asian Paints Ltd.
-2.467 3.809 1.440 -1.714 0.137 Rejected
Pair 5 Pre-GP Ratio Axis Bank Ltd. - Post- GP Ratio Axis Bank Ltd. -1.873 1.720 0.650 -2.881 0.028 Accepted
Pair 6 Pre-GP Ratio Bajaj Auto Ltd. - Post-GP Ratio Bajaj Auto Ltd. -5.504 1.559 0.589 -9.342 0.000 Accepted
Pair 7Pre-GP Ratio Bank Of Baroda - Post- GP Ratio Bank Of Baroda
-1.229 0.978 0.370 -3.323 0.016 Accepted
Pair 8Pre-GP Ratio Bharat Heavy Electricals Ltd. - Post- GP Ratio Bharat Heavy Electricals Ltd.
-5.237 8.061 3.047 -1.719 0.136 Rejected
Pair 9Pre-GP Ratio Bharat Petroleum Corpn. Ltd. - Post- GP Ratio Bharat Petroleum Corpn. Ltd.
1.830 2.792 1.055 1.734 0.134 Rejected
Pair 10Pre-GP Ratio BhartiAirtel Ltd. - Post- GP Ratio BhartiAirtelLtd.
2.761 16.543 6.252 0.442 0.674 Rejected
Pair 11 Pre-GP Ratio Bosch Ltd. - Post- GP Ratio Bosch Ltd. 4.954 6.656 2.516 1.969 0.096 Rejected
Pair 12 Pre-GP Ratio Cairn India Ltd. - Post-GP Ratio Cairn India Ltd. 2435.906 2884.542 1090.254 2.234 0.067 Rejected
Pair 13 Pre-GP Ratio Cipla Ltd. - Post- GP Ratio Cipla Ltd. -0.159 7.131 2.695 -0.059 0.955 Rejected
Pair 14 Pre-GP Ratio Coal India Ltd. - Post- GP Ratio Coal India Ltd. -107.839 50.518 19.094 -5.648 0.001 Accepted
Pair 15Pre-GP Ratio Dr. Reddy'S Laboratories Ltd. - Post- GP Ratio Dr. Reddy'S Laboratories Ltd.
-0.860 14.939 5.646 -0.152 0.884 Rejected
Pair 16Pre-GP Ratio G A I L (India) Ltd. - Post- GP Ratio G A I L (India) Ltd.
6.883 10.697 4.043 1.702 0.140 Rejected
Pair 17Pre-GP Ratio Grasim Industries Ltd. - Post- GP Ratio Grasim Industries Ltd.
-6.870 9.294 3.513 -1.956 0.098 Rejected
Pair 18Pre-GP Ratio H C L Technologies Ltd. - Post- GP Ratio H C L Technologies Ltd.
0.304 18.204 6.881 0.044 0.966 Rejected
Pair 19Pre-GP Ratio H D F C Bank Ltd. - Post- GP Ratio H D F C Bank Ltd.
-2.224 2.823 1.067 -2.084 0.082 Rejected
Pair 20Pre-GP Ratio Hero Motocorp Ltd. - Post- GP Ratio Hero Motocorp Ltd.
2.701 5.476 2.070 1.305 0.240 Rejected
Pair 21Pre-GP Ratio Hindalco Industries Ltd. - Post- GP Ratio Hindalco Industries Ltd.
12.090 13.255 5.010 2.413 0.052 Rejected
Pair 22Pre-GP Ratio Hindustan Unilever Ltd. - Post- GP Ratio Hindustan Unilever Ltd.
1.180 6.797 2.569 0.459 0.662 Rejected
Pair 23Pre-GP Ratio Housing Development Finance Corpn. Ltd. -Post- GP Ratio Housing Development Finance Corpn. Ltd.
-59.730 20.138 7.611 -7.848 0.000 Accepted
Pair 24Pre-GP Ratio I C I C I Bank Ltd. - Post- GP Ratio I C I C I Bank Ltd.
-3.797 1.280 0.484 -7.851 0.000 Accepted
Pair 25 Pre-GP Ratio I T C Ltd. - Post- GP Ratio I T C Ltd. -0.101 9.705 3.668 -0.028 0.979 Rejected
Pair 26Pre-GP Ratio Idea Cellular Ltd. - Post- GP Ratio Idea Cellular Ltd.
-6.623 14.341 5.420 -1.222 0.268 Rejected
Pair 27Pre-GP Ratio Indusind Bank Ltd. - Post- GP Ratio Indusind Bank Ltd.
-2.447 0.962 0.364 -6.729 0.001 Accepted
Pair 29Pre-GP Ratio Kotak Mahindra Bank Ltd. - Post- GP Ratio Kotak Mahindra Bank Ltd.
-3.196 1.470 0.556 -5.752 0.001 Accepted
Pair 30Pre-GP Ratio Larsen & Toubro Ltd. - Post- GP Ratio Larsen & Toubro Ltd.
-2.427 3.699 1.398 -1.736 0.133 Rejected
ISSN (O) : 2456-6675, ISSN (P) : 0972-8058
08

Pair 31 Pre-GP Ratio Lupin Ltd. - Post- GP Ratio Lupin Ltd. -8.980 5.081 1.920 -4.676 0.003 Accepted
Pair 32Pre-GP Ratio Mahindra & Mahindra Ltd. - Post- GP Ratio Mahindra & Mahindra Ltd.
-2.580 5.069 1.916 -1.347 0.227 Rejected
Pair 33Pre-GP Ratio Maruti Suzuki India Ltd. - Post- GP Ratio Maruti Suzuki India Ltd.
1.647 8.891 3.361 0.490 0.641 Rejected
Pair 34 Pre-GP Ratio N T P C Ltd. - Post- GP Ratio N T P C Ltd. 6.221 15.002 5.670 1.097 0.315 Rejected
Pair 35Pre-GP Ratio Oil & Natural Gas Corpn. Ltd. - Post- GP Ratio Oil & Natural Gas Corpn. Ltd.
-1.089 16.130 6.097 -0.179 0.864 Rejected
Pair 36Pre-GP Ratio Power Grid Corpn. Of India Ltd. - Post- GP Ratio Power Grid Corpn. Of India Ltd.
86.120 270.571 102.266 0.842 0.432 Rejected
Pair 37Pre-GP Ratio Punjab National Bank - Post- GP Ratio Punjab National Bank
-2.053 1.247 0.471 -4.355 0.005 Accepted
Pair 38Pre-GP Ratio Reliance Industries Ltd. - Post- GP Ratio Reliance Industries Ltd.
2.837 6.741 2.548 1.114 0.308 Rejected
Pair 39Pre-GP Ratio State Bank Of India - Post- GP Ratio State Bank Of India
-0.926 1.843 0.697 -1.329 0.232 Rejected
Pair 40Pre-GP Ratio Sun Pharmaceutical Inds. Ltd. - Post- GP Ratio Sun Pharmaceutical Inds. Ltd.
5.164 16.437 6.212 0.831 0.438 Rejected
Pair 41Pre-GP Ratio Tata Consultancy Services Ltd. - Post- GP Ratio Tata Consultancy Services Ltd.
-1.440 7.625 2.882 -0.500 0.635 Rejected
Pair 42Pre-GP Ratio Tata Motors Ltd. - Post- GP Ratio Tata Motors Ltd.
2.467 8.488 3.208 0.769 0.471 Rejected
Pair 43Pre-GP Ratio Tata Power Co. Ltd. - Post- GP Ratio Tata Power Co. Ltd.
2.700 6.054 2.288 1.180 0.283 Rejected
Pair 44 Pre-GP Ratio Tata Steel Ltd. - Post- GP Ratio Tata Steel Ltd. -8.346 17.858 6.750 -1.236 0.262 Rejected
Pair 45Pre-GP Ratio Tech Mahindra Ltd. - Post- GP Ratio Tech Mahindra Ltd.
-5.187 8.356 3.158 -1.642 0.152 Rejected
Pair 46Pre-GP Ratio Ultratech Cement Ltd. - Post- GP Ratio Ultratech Cement Ltd.
-10.483 9.103 3.440 -3.047 0.023 Accepted
Pair 47 Pre-GP Ratio Vedanta Ltd. - Post- GP Ratio Vedanta Ltd. -11.583 45.827 17.321 -0.669 0.529 Rejected
Pair 48 Pre-GP Ratio Wipro Ltd. - Post- GP Ratio Wipro Ltd. 2.387 7.218 2.728 0.875 0.415 Rejected
Pair 49 Pre-GP Ratio Yes Bank Ltd. - Post- GP Ratio Yes Bank Ltd. -4.346 3.036 1.147 -3.787 0.009 Accepted
Pair 50Pre-GP Ratio Zee Entertainment Enterprises Ltd. - Post- GP Ratio Zee Entertainment Enterprises Ltd.
-7.440 12.375 4.677 -1.591 0.163 Rejected
The results of Paired Samples t-Test in Table-2 depict acceptance and rejection of the hypotheses. It has
that the alternative hypotheses of 36 companies have been observed that gross profit ratios of the firms
been rejected while it has been accepted for 14 affected significantly are banks.
companies. Hence statistically there is no
significance impact of implementation of clause-49 of H3 : There is significance difference in the net profit
corporate governance on the gross profit ratio of ratio of Nifty-50 companies between pre and post
majority of nifty-50 companies in India. The implementation of clause-49 of corporate governance
industries were further clustered on the basis of in India.
ISSN (O) : 2456-6675, ISSN (P) : 0972-8058
09

Table-3 Paired Samples Test
Paired Differencest-
value
Sig.(2-
tailed)
Result of Hypothese
s MeanStd.
DeviationStd. Error
Mean
Pair 1 Pre-NP Ratio A C C Ltd. - Post- NP Ratio A C C Ltd. -10.969 10.660 3.769 -2.910 0.023 Accepted
Pair 2Pre-NP Ratio Adani Ports and Special Economic Zone Ltd. - Post-NP Ratio Adani Ports and Special Economic Zone Ltd.
-37.813 11.080 3.917 -9.653 0.000 Accepted
Pair 3Pre-NP Ratio Ambuja Cements Ltd. - Post- NP Ratio Ambuja Cements Ltd.
-0.426 8.465 2.993 -0.142 0.891 Rejected
Pair 4 Pre-NP Ratio Asian Paints Ltd. - Post- NP Ratio Asian Paints Ltd. -3.245 1.734 0.613 -5.293 0.001 Accepted
Pair 5 Pre-NP Ratio Axis Bank Ltd. - Post- NP Ratio Axis Bank Ltd. -6.724 2.371 0.838 -8.022 0.000 Accepted
Pair 6 Pre-NP Ratio Bajaj Auto Ltd. - Post-NP Ratio Bajaj Auto Ltd. -5.906 3.971 1.404 -4.207 0.004 Accepted
Pair 7 Pre-NP Ratio Bank Of Baroda - Post- NP Ratio Bank Of Baroda -6.226 3.030 1.071 -5.813 0.001 Accepted
Pair 8Pre-NP Ratio Bharat Heavy Electricals Ltd. - Post- NP Ratio Bharat Heavy Electricals Ltd.
-6.013 4.317 1.526 -3.939 0.006 Accepted
Pair 9Pre-NP Ratio Bharat Petroleum Corpn. Ltd. - Post- NP Ratio Bharat Petroleum Corpn. Ltd.
0.799 1.354 0.479 1.668 0.139 Rejected
Pair 10 Pre-NP Ratio BhartiAirtel Ltd. - Post- NP Ratio BhartiAirtel Ltd. -14.813 12.250 4.331 -3.420 0.011 Accepted
Pair 11 Pre-NP Ratio Bosch Ltd. - Post- NP Ratio Bosch Ltd. -4.349 5.460 1.930 -2.253 0.059 Rejected
Pair 12 Pre-NP Ratio Cairn India Ltd. - Post-NP Ratio Cairn India Ltd. 1113.215 3152.698 1114.647 0.999 0.351 Rejected
Pair 13 Pre-NP Ratio Cipla Ltd. - Post- NP Ratio Cipla Ltd. 0.043 3.644 1.288 0.033 0.975 Rejected
Pair 14 Pre-NP Ratio Coal India Ltd. - Post- NP Ratio Coal India Ltd. -1187.510 1194.632 422.366 -2.812 0.026 Accepted
Pair 15Pre-NP Ratio Dr. Reddy'S Laboratories Ltd. - Post- NP Ratio Dr. Reddy'S Laboratories Ltd.
-1.346 10.203 3.607 -0.373 0.720 Rejected
Pair 16Pre-NP Ratio G A I L (India) Ltd. - Post- NP Ratio G A I L (India) Ltd.
1.419 4.695 1.660 0.855 0.421 Rejected
Pair 17Pre-NP Ratio Grasim Industries Ltd. - Post- NP Ratio Grasim Industries Ltd.
-10.710 4.654 1.645 -6.509 0.000 Accepted
Pair 18Pre-NP Ratio H C L Technologies Ltd. - Post- NP Ratio H C L Technologies Ltd.
14.225 19.177 6.780 2.098 0.074 Rejected
Pair 19Pre-NP Ratio H D F C Bank Ltd. - Post- NP Ratio H D F C Bank Ltd.
-1.166 2.631 0.930 -1.254 0.250 Rejected
Pair 20Pre-NP Ratio Hero Motocorp Ltd. - Post- NP Ratio Hero Motocorp Ltd.
-0.320 2.662 0.941 -0.340 0.744 Rejected
Pair 21Pre-NP Ratio Hindalco Industries Ltd. - Post- NP Ratio Hindalco Industries Ltd.
10.155 5.863 2.073 4.899 0.002 Accepted
Pair 22Pre-NP Ratio Hindustan Unilever Ltd. - Post- NP Ratio Hindustan Unilever Ltd.
0.321 3.806 1.345 0.239 0.818 Rejected
Pair 23Pre-NP Ratio Housing Development Finance Corpn. Ltd. - Post-NP Ratio Housing Development Finance Corpn. Ltd.
-1.565 7.364 2.603 -0.601 0.567 Rejected
Pair 24Pre-NP Ratio I C I C I Bank Ltd. - Post- NP Ratio I C I C I Bank Ltd.
-3.604 3.908 1.382 -2.608 0.035 Accepted
Pair 25 Pre-NP Ratio I T C Ltd. - Post- NP Ratio I T C Ltd. 0.768 2.308 0.816 0.941 0.378 Rejected
Pair 26 Pre-NP Ratio Idea Cellular Ltd. - Post- NP Ratio Idea Cellular Ltd. -16.805 14.294 5.054 -3.325 0.013 Accepted
Pair 27Pre-NP Ratio Indusind Bank Ltd. - Post- NP Ratio Indusind Bank Ltd.
-2.330 6.226 2.201 -1.058 0.325 Rejected
Pair 28 Pre-NP Ratio Infosys Ltd. - Post- NP Ratio Infosys Ltd. 2.909 2.068 0.731 3.978 0.005 Accepted
Pair 29Pre-NP Ratio Kotak Mahindra Bank Ltd. - Post- NP Ratio Kotak Mahindra Bank Ltd.
9.658 11.434 4.043 2.389 0.048 Accepted
Pair 30Pre-NP Ratio Larsen & Toubro Ltd. - Post- NP Ratio Larsen & Toubro Ltd.
-3.794 2.298 0.812 -4.670 0.002 Accepted
Pair 31 Pre-NP Ratio Lupin Ltd. - Post- NP Ratio Lupin Ltd. -9.194 3.551 1.255 -7.324 0.000 Accepted
ISSN (O) : 2456-6675, ISSN (P) : 0972-8058
10
Pair 32Pre-NP Ratio Mahindra & Mahindra Ltd. - Post- NP Ratio Mahindra & Mahindra Ltd.
-4.041 3.363 1.189 -3.399 0.011 Accepted
Pair 33Pre-NP Ratio Maruti Suzuki India Ltd. - Post- NP Ratio Maruti Suzuki India Ltd.
-4.295 5.675 2.006 -2.141 0.070 Rejected
Pair 34 Pre-NP Ratio N T P C Ltd. - Post- NP Ratio N T P C Ltd. 3.009 4.674 1.653 1.821 0.111 Rejected
Pair 35Pre-NP Ratio Oil & Natural Gas Corpn. Ltd. - Post- NP Ratio Oil & Natural Gas Corpn. Ltd.
-1.089 3.395 1.200 -0.907 0.395 Rejected
Pair 36Pre-NP Ratio Power Grid Corpn. Of India Ltd. - Post- NP Ratio Power Grid Corpn. Of India Ltd.
137.326 389.149 137.585 0.998 0.351 Rejected
Pair 37Pre-NP Ratio Punjab National Bank - Post- NP Ratio Punjab National Bank
-3.401 5.433 1.921 -1.771 0.120 Rejected
Pair 38Pre-NP Ratio Reliance Industries Ltd. - Post- NP Ratio Reliance Industries Ltd.
1.070 3.663 1.295 0.826 0.436 Rejected
Pair 39Pre-NP Ratio State Bank Of India - Post- NP Ratio State Bank Of India
-2.439 3.377 1.194 -2.042 0.080 Rejected
Pair 40Pre-NP Ratio Sun Pharmaceutical Inds. Ltd. - Post- NP Ratio Sun Pharmaceutical Inds. Ltd.
4.305 54.066 19.115 0.225 0.828 Rejected
Pair 41Pre-NP Ratio Tata Consultancy Services Ltd. - Post- NP Ratio Tata Consultancy Services Ltd.
-0.820 4.725 1.670 -0.491 0.639 Rejected
Pair 42 Pre-NP Ratio Tata Motors Ltd. - Post- NP Ratio Tata Motors Ltd. -2.025 7.091 2.507 -0.808 0.446 Rejected
Pair 43Pre-NP Ratio Tata Power Co. Ltd. - Post- NP Ratio Tata Power Co. Ltd.
-0.970 2.581 0.913 -1.063 0.323 Rejected
Pair 44 Pre-NP Ratio Tata Steel Ltd. - Post- NP Ratio Tata Steel Ltd. -7.455 11.038 3.902 -1.910 0.098 Rejected
Pair 45Pre-NP Ratio Tech Mahindra Ltd. - Post- NP Ratio Tech Mahindra Ltd.
7.948 8.105 2.866 2.773 0.028 Accepted
Pair 46Pre-NP Ratio Ultratech Cement Ltd. - Post- NP Ratio Ultratech Cement Ltd.
-12.931 4.459 1.577 -8.202 0.000 Accepted
Pair 47 Pre-NP Ratio Vedanta Ltd. - Post- NP Ratio Vedanta Ltd. -15.618 27.087 9.577 -1.631 0.147 Rejected
Pair 48 Pre-NP Ratio Wipro Ltd. - Post- NP Ratio Wipro Ltd. 3.070 2.618 0.926 3.317 0.013 Accepted
Pair 49 Pre-NP Ratio Yes Bank Ltd. - Post- NP Ratio Yes Bank Ltd. -13.410 7.624 2.695 -4.975 0.002 Accepted
Pair 50Pre-NP Ratio Zee Entertainment Enterprises Ltd. - Post- NP Ratio Zee Entertainment Enterprises Ltd.
-3.311 11.283 3.989 -0.830 0.434 Rejected
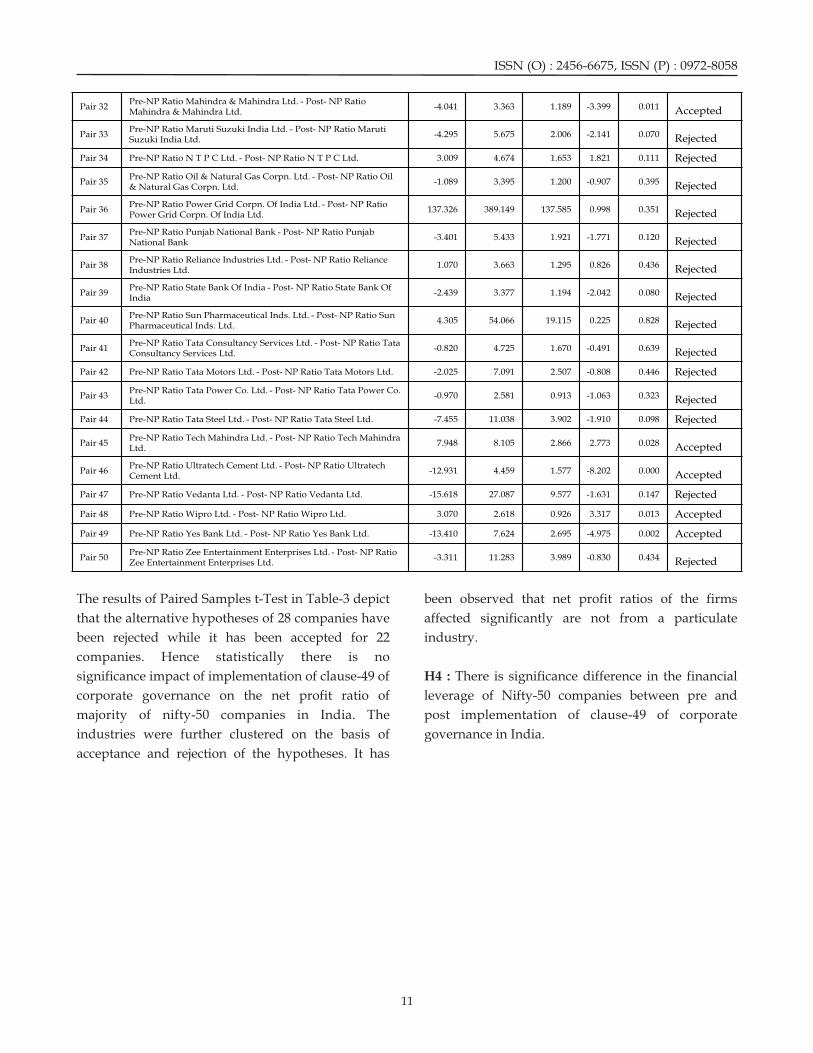
The results of Paired Samples t-Test in Table-3 depict been observed that net profit ratios of the firms
that the alternative hypotheses of 28 companies have affected significantly are not from a particulate
been rejected while it has been accepted for 22 industry.
companies. Hence statistically there is no
significance impact of implementation of clause-49 of H4 : There is significance difference in the financial
corporate governance on the net profit ratio of leverage of Nifty-50 companies between pre and
majority of nifty-50 companies in India. The post implementation of clause-49 of corporate
industries were further clustered on the basis of governance in India.
acceptance and rejection of the hypotheses. It has
ISSN (O) : 2456-6675, ISSN (P) : 0972-8058
11
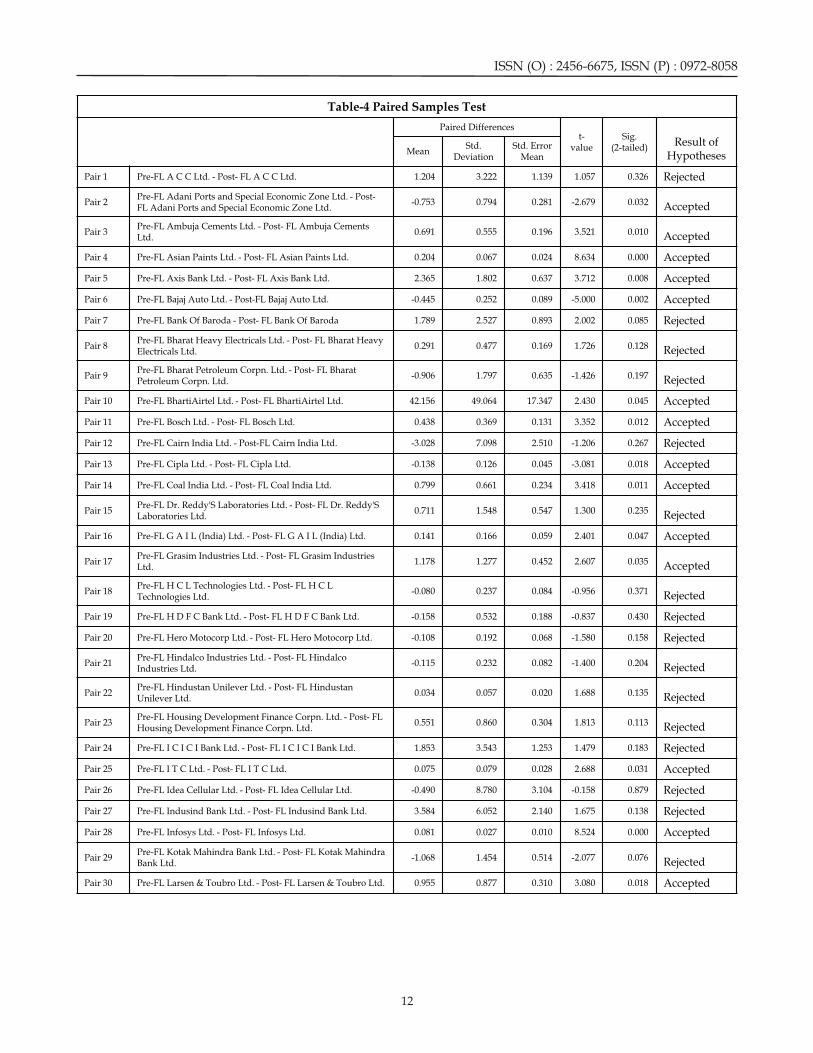
Table-4 Paired Samples Test
Paired Differencest-
valueSig.
(2-tailed)Result of
Hypotheses MeanStd.
DeviationStd. Error
Mean
Pair 1 Pre-FL A C C Ltd. - Post- FL A C C Ltd. 1.204 3.222 1.139 1.057 0.326 Rejected
Pair 2Pre-FL Adani Ports and Special Economic Zone Ltd. - Post-FL Adani Ports and Special Economic Zone Ltd.
-0.753 0.794 0.281 -2.679 0.032 Accepted
Pair 3Pre-FL Ambuja Cements Ltd. - Post- FL Ambuja Cements Ltd.
0.691 0.555 0.196 3.521 0.010 Accepted
Pair 4 Pre-FL Asian Paints Ltd. - Post- FL Asian Paints Ltd. 0.204 0.067 0.024 8.634 0.000 Accepted
Pair 5 Pre-FL Axis Bank Ltd. - Post- FL Axis Bank Ltd. 2.365 1.802 0.637 3.712 0.008 Accepted
Pair 6 Pre-FL Bajaj Auto Ltd. - Post-FL Bajaj Auto Ltd. -0.445 0.252 0.089 -5.000 0.002 Accepted
Pair 7 Pre-FL Bank Of Baroda - Post- FL Bank Of Baroda 1.789 2.527 0.893 2.002 0.085 Rejected
Pair 8Pre-FL Bharat Heavy Electricals Ltd. - Post- FL Bharat Heavy Electricals Ltd.
0.291 0.477 0.169 1.726 0.128 Rejected
Pair 9Pre-FL Bharat Petroleum Corpn. Ltd. - Post- FL Bharat Petroleum Corpn. Ltd.
-0.906 1.797 0.635 -1.426 0.197 Rejected
Pair 10 Pre-FL BhartiAirtel Ltd. - Post- FL BhartiAirtel Ltd. 42.156 49.064 17.347 2.430 0.045 Accepted
Pair 11 Pre-FL Bosch Ltd. - Post- FL Bosch Ltd. 0.438 0.369 0.131 3.352 0.012 Accepted
Pair 12 Pre-FL Cairn India Ltd. - Post-FL Cairn India Ltd. -3.028 7.098 2.510 -1.206 0.267 Rejected
Pair 13 Pre-FL Cipla Ltd. - Post- FL Cipla Ltd. -0.138 0.126 0.045 -3.081 0.018 Accepted
Pair 14 Pre-FL Coal India Ltd. - Post- FL Coal India Ltd. 0.799 0.661 0.234 3.418 0.011 Accepted
Pair 15Pre-FL Dr. Reddy'S Laboratories Ltd. - Post- FL Dr. Reddy'S Laboratories Ltd.
0.711 1.548 0.547 1.300 0.235 Rejected
Pair 16 Pre-FL G A I L (India) Ltd. - Post- FL G A I L (India) Ltd. 0.141 0.166 0.059 2.401 0.047 Accepted
Pair 17Pre-FL Grasim Industries Ltd. - Post- FL Grasim Industries Ltd.
1.178 1.277 0.452 2.607 0.035 Accepted
Pair 18Pre-FL H C L Technologies Ltd. - Post- FL H C L Technologies Ltd.
-0.080 0.237 0.084 -0.956 0.371 Rejected
Pair 19 Pre-FL H D F C Bank Ltd. - Post- FL H D F C Bank Ltd. -0.158 0.532 0.188 -0.837 0.430 Rejected
Pair 20 Pre-FL Hero Motocorp Ltd. - Post- FL Hero Motocorp Ltd. -0.108 0.192 0.068 -1.580 0.158 Rejected
Pair 21Pre-FL Hindalco Industries Ltd. - Post- FL Hindalco Industries Ltd.
-0.115 0.232 0.082 -1.400 0.204 Rejected
Pair 22Pre-FL Hindustan Unilever Ltd. - Post- FL Hindustan Unilever Ltd.
0.034 0.057 0.020 1.688 0.135 Rejected
Pair 23Pre-FL Housing Development Finance Corpn. Ltd. - Post- FL Housing Development Finance Corpn. Ltd.
0.551 0.860 0.304 1.813 0.113 Rejected
Pair 24 Pre-FL I C I C I Bank Ltd. - Post- FL I C I C I Bank Ltd. 1.853 3.543 1.253 1.479 0.183 Rejected
Pair 25 Pre-FL I T C Ltd. - Post- FL I T C Ltd. 0.075 0.079 0.028 2.688 0.031 Accepted
Pair 26 Pre-FL Idea Cellular Ltd. - Post- FL Idea Cellular Ltd. -0.490 8.780 3.104 -0.158 0.879 Rejected
Pair 27 Pre-FL Indusind Bank Ltd. - Post- FL Indusind Bank Ltd. 3.584 6.052 2.140 1.675 0.138 Rejected
Pair 28 Pre-FL Infosys Ltd. - Post- FL Infosys Ltd. 0.081 0.027 0.010 8.524 0.000 Accepted
Pair 29Pre-FL Kotak Mahindra Bank Ltd. - Post- FL Kotak Mahindra Bank Ltd.
-1.068 1.454 0.514 -2.077 0.076 Rejected
Pair 30 Pre-FL Larsen & Toubro Ltd. - Post- FL Larsen & Toubro Ltd. 0.955 0.877 0.310 3.080 0.018 Accepted
ISSN (O) : 2456-6675, ISSN (P) : 0972-8058
12
Pair 31 Pre-FL Lupin Ltd. - Post- FL Lupin Ltd. 0.853 0.406 0.144 5.939 0.001 Accepted
Pair 32Pre-FL Mahindra & Mahindra Ltd. - Post- FL Mahindra & Mahindra Ltd.
1.034 0.962 0.340 3.038 0.019 Accepted
Pair 33Pre-FL Maruti Suzuki India Ltd. - Post- FL Maruti Suzuki India Ltd.
0.471 1.988 0.703 0.671 0.524 Rejected
Pair 34 Pre-FL N T P C Ltd. - Post- FL N T P C Ltd. 0.296 0.302 0.107 2.776 0.027 Accepted
Pair 35Pre-FL Oil & Natural Gas Corpn. Ltd. - Post- FL Oil & Natural Gas Corpn. Ltd.
-0.078 0.515 0.182 -0.426 0.683 Rejected
Pair 36Pre-FL Power Grid Corpn. Of India Ltd. - Post- FL Power Grid Corpn. Of India Ltd.
0.410 0.372 0.132 3.117 0.017 Accepted
Pair 37Pre-FL Punjab National Bank - Post- FL Punjab National Bank
1.270 3.424 1.210 1.049 0.329 Rejected
Pair 38Pre-FL Reliance Industries Ltd. - Post- FL Reliance Industries Ltd.
0.346 0.246 0.087 3.983 0.005 Accepted
Pair 39 Pre-FL State Bank Of India - Post- FL State Bank Of India 1.723 2.871 1.015 1.697 0.134 Rejected
Pair 40Pre-FL Sun Pharmaceutical Inds. Ltd. - Post- FL Sun Pharmaceutical Inds. Ltd.
0.124 0.156 0.055 2.238 0.060 Rejected
Pair 41Pre-FL Tata Consultancy Services Ltd. - Post- FL Tata Consultancy Services Ltd.
-0.058 0.088 0.031 -1.839 0.109 Rejected
Pair 42 Pre-FL Tata Motors Ltd. - Post- FL Tata Motors Ltd. -2.935 12.293 4.346 -0.675 0.521 Rejected
Pair 43 Pre-FL Tata Power Co. Ltd. - Post- FL Tata Power Co. Ltd. 0.189 0.312 0.110 1.712 0.131 Rejected
Pair 44 Pre-FL Tata Steel Ltd. - Post- FL Tata Steel Ltd. 1.031 1.369 0.484 2.131 0.071 Rejected
Pair 45 Pre-FL Tech Mahindra Ltd. - Post- FL Tech Mahindra Ltd. -0.106 0.269 0.095 -1.116 0.301 Rejected
Pair 46Pre-FL Ultratech Cement Ltd. - Post- FL Ultratech Cement Ltd.
-0.798 4.918 1.739 -0.459 0.660 Rejected
Pair 47 Pre-FL Vedanta Ltd. - Post- FL Vedanta Ltd. -1.880 6.206 2.194 -0.857 0.420 Rejected
Pair 48 Pre-FL Wipro Ltd. - Post- FL Wipro Ltd. 0.143 0.404 0.143 0.998 0.352 Rejected
Pair 49 Pre-FL Yes Bank Ltd. - Post- FL Yes Bank Ltd. -1.485 1.900 0.672 -2.211 0.063 Rejected
Pair 50Pre-FL Zee Entertainment Enterprises Ltd. - Post- FL Zee Entertainment Enterprises Ltd.
0.249 0.311 0.110 2.261 0.058 Rejected
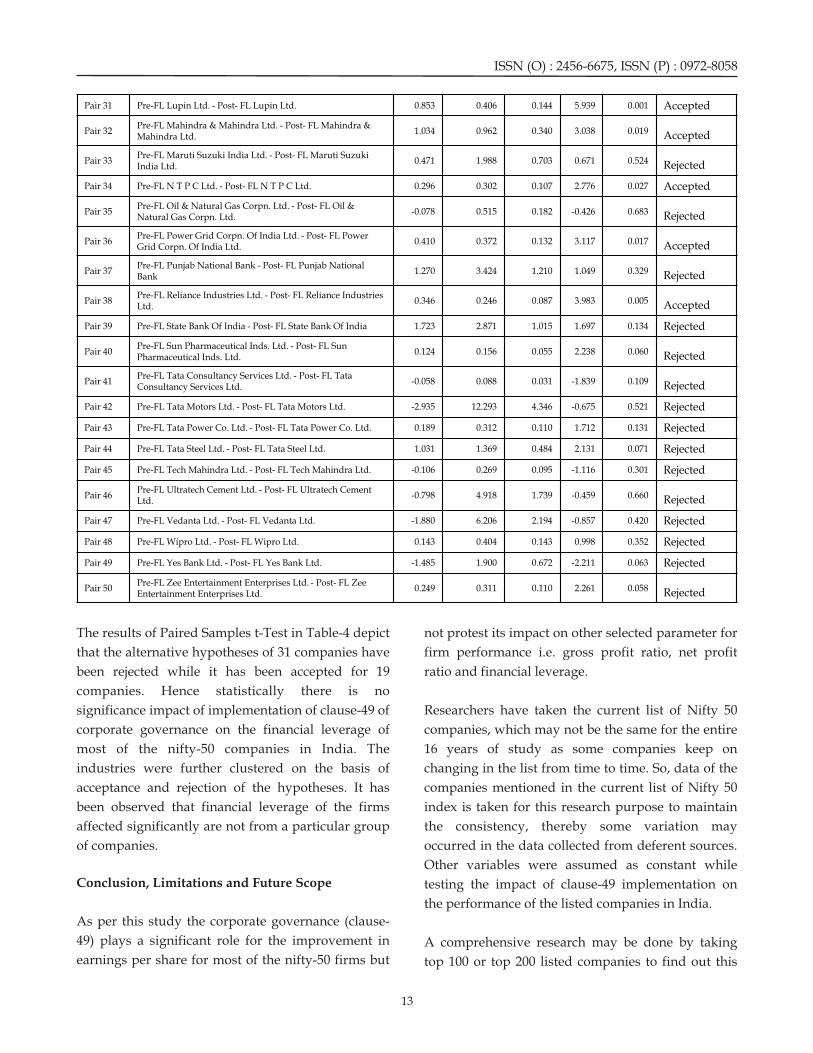
The results of Paired Samples t-Test in Table-4 depict not protest its impact on other selected parameter for
that the alternative hypotheses of 31 companies have firm performance i.e. gross profit ratio, net profit
been rejected while it has been accepted for 19 ratio and financial leverage.
companies. Hence statistically there is no
significance impact of implementation of clause-49 of Researchers have taken the current list of Nifty 50
corporate governance on the financial leverage of companies, which may not be the same for the entire
most of the nifty-50 companies in India. The 16 years of study as some companies keep on
industries were further clustered on the basis of changing in the list from time to time. So, data of the
acceptance and rejection of the hypotheses. It has companies mentioned in the current list of Nifty 50
been observed that financial leverage of the firms index is taken for this research purpose to maintain
affected significantly are not from a particular group the consistency, thereby some variation may
of companies. occurred in the data collected from deferent sources.
Other variables were assumed as constant while
Conclusion, Limitations and Future Scope testing the impact of clause-49 implementation on
the performance of the listed companies in India.
As per this study the corporate governance (clause-
49) plays a significant role for the improvement in A comprehensive research may be done by taking
earnings per share for most of the nifty-50 firms but top 100 or top 200 listed companies to find out this
ISSN (O) : 2456-6675, ISSN (P) : 0972-8058
13

impact with Individual Industry wise study and/or July.
comparative study may also done to find out the 9) Brown, L.D, J.M, Robinson and M.C. Caylor
implementation status and its impact on firm (2004), “Corporate governance and firm
performance. A detailed study may also be performance”,
conducted to list out the important factors in http://www.issproxy.com/pdf/corporate
Corporate Governance and their individual and /or governance.
cumulative impact on firm performance. 10) Core, J. E., R. W. Holthausen, and D. F. Larcker.
(1999), “Corporate governance, chief executive
REFERENCES officer compensation, and firm performance”.
Journal of Financial Economics, 51 (3), pp. 371-406.
1) Anderson, R. C., Mansi, S. A., & Reeb, D. M. 11) Chakrabarti, R., Megginson, W. and Yadav, P. K.
(2004), “Board characteristics, accounting report (2008) , “Corporate Governance in India”. Journal
integrity and the cost of debt”, Journal of of Applied Corporate Finance, 20, pp. 59–72.
Accounting and Economics, 37(3), pp.315-342. 12) Dalton, Dan R., Catherine M. Daily, Alan E.
2) Al-Mudhaki. J. and Joshi, P. L. (2004), “The Role Ellstrand, and Jonathan L. Johnson., (1998).
and Functions of Audit Committees in the 13) “Metal-Analytic Reviews of Board Composition,
Indian Corporate Governance: Empirical Leadership Structure and Financial
Findings”, International Journal of Auditing, 8, Performance”,
pp.33-47 http://asp.thecorporatelibrary.net/patterson/Li
3) Akinsulire, O. (2006): Financial Management, nkDetail.asp?CatalogID=14289>
Lagos, El-Toda Ventures. 14) Dharwardkar, R, George, G and Brandes, P
4) Adenikinju, O and F, Ayorinde (2001): (2000): “Privatization in Emerging Economies:
“Ownership structure, corporate governance An Agency Perspective”, Academy of
and corporate performance: The case of Nigerian Management Review, 25(3), 650-669.
quoted companies”, Unpublished final report 15) Dwivedi, N. and Jain, A.K. (2005), “Corporate
presented at the AERC biannual research Governance and Performance of Indian Firms:
workshop, Nairobi, Kenya, May. The Effect of Board Size and Ownership.
5) Al- Faki, M (2006): “Transparency and corporate Employee Responsibilities and Rights Journal”,
governance for capital market development in Vol.17, No.3, Sept, pp: 161-172.
Africa: The Nigerian case study”, Securities 16) Elankumaran, S., R. Seal and A. Hashmi (2005),
Market Journal, pp.9- 28. “Transcending Transformation: Enlightening
6) Bebchuk, L.A. & Roe, M.J. (1999), “A theory of Endeavours at Tata Steel”, Journal of Business
path dependence in corporate ownership and Ethics, 59, pp. 109-119.
governance”, Stanford Law Review, 52(1), pp.127- 17) Fosberg, R (1989), “Outside directors and
170. managerial monitoring”, Akron Business and
7) Bhagat, S and B, Black (2002), “The non- Economic Review”, Vol. 20, pp.24- 32.
correlation between board independence and 18) Freeman, R.E. (1984), “Stakeholder Management:
long term firm performance”, Journal of A Strategic Approach”, Pitman, Boston, MA.
Corporation Law, Vol. 27, pp 231- 274. 19) Froud, J., Haslam, C., Johal, S. and Williams, K.
8) Bokpin, G.A, A, Kyereboah- Coleman and (2000), “Shareholder value and the political
A.Q.Q, Aboagye (2006), “Corporate governance economy of late capitalism”, Economy & Society,
and shareholder wealth maximization: Evidence Vol. 29 No. 1, pp. 1-12
from listed companies in Ghana”, Unpublished
paper presented at the 3rd African Finance
Journal Conference, Accra, Ghana, 12th – 13th Applied Economics Letters, Volume 13,
20) Ghosh S (2006), “Do board characteristics affect
corporate performance? Firm-level evidence for
India”,
ISSN (O) : 2456-6675, ISSN (P) : 0972-8058
14

Number 7, pp. 435-443(9) Governance”,The IUP Journal of Corporate
21) Hair, J. E., Anderson, R. E., Tatham, R. L., & Governance, July.
Black W. C. (1998), Multivariate data analysis. (5th 33) Parthasarathy, A., Menon, K and Bhattacharjee,
ed.). Upper Saddle River, NJ: Prentice-Hall. D. (2006). “Executive compensation, firm
22) Jensen, M.C., and W.H. Meckling (1976), Performance and corporate governance: An
“Theory of the Firm: Managerial Behavior, empirical analysis. Economic and Political
Agency Costs and Ownership Structure”, Weekly”, 41: pp.4139-47.
Journal of Financial Economics, October, V.3, 4, 34) Patibandla, M. (2006), “Equity Pattern,
pp. 305-360. Corporate Governance and Performance,”
23) Kathuria, V. & Dash S.(1999), “Board Size and Journal of Economic Behavior and Organization, Vol
Corporate Financial Performance; An 59, pp. 29-44.
Investigation”, Vikalpa, Vol 24, No 3, pp.11-17 35) Pearce, J. A., and S. A. Zahra. (1992), "Board
24) Kimber D. & Lipton P. (2005). “Corporate Composition from a Strategic Contingency
governance and business ethics in the Asia- Perspective." Journal of Management Studies,
Pacific region”. Business & Society, 44(2): 178-210. 29,pp. 411-438
25) Khanna, Tarun and Palepu, Krishna (2004), 36) Phani, B. V., Reddy, V. N., Ramachandran, N.
“Globalization and Convergence in Corporate and Bhattacharya, Asish, K. (2005), “Insider
Governance: Evidence from Infosys and the Ownership, Corporate Governance and
Indian Software Industry”, Journal of Corporate Performance”, NSE Research
International Business Studies. Initiative Proposal NO.89 (www.ssrn.com),
26) Klein, A (1998), “Firm performance and board accessed on 16 April, 2013
committee structure”, Journal of Law and 37) Post, J.E., Preston, L.E. and Sachs, S. (2002),
Economics, Vol 41, pp 275- 303. Redefining the Corporation: stakeholder
27) Laczniak, G.R. and P.E. Murphy (1993), Ethical Management and Organizational Wealth,
Marketing Decisions: The Higher Road, Boston, Stanford University Press, Stanford, CA.
Allyn& Bacon. 38) Prasanna, P. Krishna, Corporate Governance
28) Liang, Neng and Joanne Li (1999). “Board (2006), “Independent Directors and Financial
Structure and Firm Performance: New Evidence Performance: An Empirical Analysis”, Indian
from China's Private Firms”, Paper presented at Institute of Capital Markets 9th Capital Markets
the Academy of Management Annual Conference Paper.
Conference, Chicago, USA, August , pp. 7-10
29) Magdi, R and R, Nadareh (2002), “Corporate
governance: A framework for implementation”,
Britain World Group Journal, Vol 20, pp 123- 132
30) Mayur M. and Saravanan P. (2006), “Does board 40) Rappaport, A. (1986), Creating Shareholder
size really matters: an empirical investigation on Value, the New Standard of Business
Indian banking sector”. ICFAI Journal of Corporate Performance, The Free Press, New York, NY.
Governance, Vol. 5, No. 2. 41) Sanda, A.U, A.S, Mikailu and T, Garba, (2005),
31) MohantyPitibas (2003), “Institutional Investors “Corporate governance mechanisms and firm
and Corporate Governance in India” conference financial performance in Nigeria”, AERC
paper at fifteenth AIMS conference held at XIM Research Paper 149, Nairobi
Bhubaneswar. 42) Sanda, A.U, A.S, Mikailu and T, Garba, (2005),
32) Narasimhan M S and JaiswallManju( 2007), “Corporate governance mechanisms and firm
“Role and Functioning of Remuneration financial performance in Nigeria”, AERC
Committee in Improving Corporate Research Paper 149, Nairobi.
39) Ramaswamy, K., Veliyath, R., Gomes, L. (2000),
“A study of the determinants of CEO
compensation in India”, Management
International Review 40(2), pp.167–191.
ISSN (O) : 2456-6675, ISSN (P) : 0972-8058
15

43) Shleifer, A, and R.W, Vishny (1997), “A survey of
corporate governance”, Journal of Financial
Economics, Vo. 52(2), pp 737- 783.
44) SarkarJayati and Sarkar S. (2000),” Large
Shareholder Activism in Developing Countries:
Evidence from India,” International Review of
Finance, September.
45) Steward, G. (1991), The Quest for Value, Harper
Collins, New York, NY
46) Uche, C (2004), “Corporate governance in
Nigerian financial industry”, Chartered Institute
of Bankers of Nigeria Journal, Vol. 2, pp.11- 23.
47) Varma, J. (1997), “Corporate Governance in India:
Disciplining the Dominant Shareholder”, IIMB
Management Review, Oct- Dec., 9 (4), pp. 5-18.
48) Weisbach, M (1988), “Outside directors and CEO
turnover”, Journal of Financial Economics, Vol. 20,
pp 431- 460.
49) Wolfensohn, (1999),“Corporate governance is
about promoting corporate fairness,
transparency and accountability”, Financial
Times, 21st June, 1999.
50) Yermack, David(1996), Higher market valuation
of companies a small board of directors, Journal
of Financial Economics 40, pp.185-202.
ISSN (O) : 2456-6675, ISSN (P) : 0972-8058
16
Role of Stakehoders in Implementing Green Supply Chain Practices in Indian Automobile Industry
1Renu Paisal 2Dr. Manisha Sharma
1. Research Scholar, Gautam Buddha University, Greater Noida (India), [email protected]. Assistant Professor, Gautam Buddha University, Greater Noida (India), [email protected] Author
Dr. Manisha Sharma, Assistant Professor, Gautam Buddha University, Greater Noida (India), [email protected]
Effulgence
Vol. 15 No. 2
July-December, 2017
Rukmini Devi Institute of Advanced Studies
E-mail : [email protected], Website : www.rdias.ac.in
http://effulgence.rdias.ac.in/user/default.aspx
Abstract
Concerned with environmental sustainability, most organizations have started to go green in their functions and are adopting
green supply technology in order to provide more benefit to their business operations as well as their suppliers and customers.
Environmental concerns have become very important issues mainly in manufacturing industry for obvious reasons and more
so in the automobile industry as it is considered to be one of the biggest sources of pollution. It is observed by many researchers
that stakeholders play key roles in a number of ways in the supply chain. Therefore, this study specifically aims at
understanding the role of stakeholders in the implementation of Green Suuply Chain Practices (GSCP) in Indian Automobile
Industry. The present paper is qualitative in nature which will explore various research papers extensively to bring out the
nature of relationship which can be tested further empirically.
Green Supply Chain Practices, Stakeholders, Indian Automobile IndustryKeywords:
consumer goods and services. As a result the INTRODUCTIONintegration of environment and sustainability within
supply chain management agenda has gained upply chain management implies the
immense importance (Kleindorfer et al., 2005). Scoordination and management of the entireSubsequently, companies are being required to
network of activities concerned in delivering a address questions about how eco friendly their
finished product to the end-user or customer. As manufacturing processes and supply chains are. As
described by Womack and Jones, (2005) supply chain Vachon and Klassen (2006) points out that complex
management is the key component of organizational and long supply chains are not energy efficient as
competitiveness and effectiveness. There has been they pose a potential threat to the environment due
increasing pressure on industries to pay more to excessive use of waste material which results in
attention to the environmental concern of the ever-heat emission.
increasing production, supply and consumption of
ISSN (O) : 2456-6675, ISSN (P) : 0972-8058

Supply Chains have been defined as a “network of Indian auto industry aligns supply chain practices to
organizations which are involved, through upstream business strategy to maximize competitive benefit in
and downstream links, in various processes and a rising market. However, prior to economic
activities that produce value in the form of products liberalization (1991), supply chain management had
and services in the hands of the final consumer” by not been seen as a competitive advantage due to
Christopher (1998). In other words, it is the protected tariffs, import quotas, exchange rate
summation of endeavors to integrate a network of controls and regulated licensing for capital goals. All
firms and coordination of their functions as regards these safeguard policies dispirited modernization,
information, material and financial flows. This has cost effectiveness, and achievement of industrial
caused change of focus from reducing operational capabilities thereby causing inefficiencies, sluggish
costs and overall inventory to improved customer export performances, and slow economic growth
service and speedy product delivery. Worldwide rate. However post liberalization era, quantum leap
interest in supply chain management has increased was observed in economic growth, which reflected
steadily since two decades as organizations begin to in the Indian industries', including that of
see benefits of collaborative relationships in business automotive industry, improved capability of
and operations. Stevenson (2007) has noticed that effectively managing their supply chains (Sahay et
Supply chains have involved into effective network al., 2003). This resulted from an understanding that
of organizations performing activities in a particular existing supply chain systems were not developed
product/service value chain”. Organizations in a enough to meet the growing requirements of
supply chain divide up the benefits of the product consumers (Kapoor and Ellinger, 2004).
through market, contracts, and partnership which
increase the efficiency of all partners. In today's Nevertheless, even though the foremost global
complex economy, the competition among large supply chain challenges viz visibility, cost
firms has long been extended to the competition in containment, hazard management, growing
major parts of supply chains. As explained by Soni customer demands and globalization remain the
and Kodali (2011), “Supply chain practices include same, in the Indian context, their impact is distinctly
internal and external issues that must be tailored to different from those in developed countries. Indian
be a 'strategic fit' between competitive strategy and market has some peculiar challenges for supply
supply chain strategy of the company in order to chains which they have to cope with like for Indians
achieve business excellence”. As with all industries, first preference is small cars and two wheelers .There
business environmental factors and Government is absolutely no visibility of customers especially in
regulations affect supply chain to a very large extent rural segment of markets. Lingual as well cultural
followed by costing and buyer-supplier relationship. diversities add to packaging complexities. Resource
In Indian context, as cost of raw materials and labour shortcomings cause quality related issues. Large
are nearly same across the auto component number of fragmented and scattered suppliers are
manufacturing sector, they hardly bear any also big impediment in effective collaborations.
competitive advantage. Fisher (1997) stated that a
supply chain must be designed based on specific Multiplicity of taxes and tariffs, lack of
requirements of the product being manufactured infrastructure, multilevel distribution system, which
This is especially for the complex automotive effects products price, weak intellectual property
industry wherein, an automaker has to accept the and patent laws, poor standard of contract
challenges of managing a network comprising enforcement agencies, variation in cost and
several supply chains specializing in sub-assemblies availability of raw material supplies are to name a
or modules and over thousands of components few in Indian context. Multinational companies
obtained from a variety of sources. It is essential that entering India never faced challenges like cultural
.
ISSN (O) : 2456-6675, ISSN (P) : 0972-8058
18

diversities; price-income disparities and sourcing are organizational economic performance has been
unique to multinational companies that enter India. receiving relatively less attention in the literature.
Much of the literature in this area has utilized a
Besides these factors, stiff competitive environment multiplicity of actions that are normally self-
coupled with volatile demand and changing reported, from a single resource, and has focused on
customer preferences, has led the industry to realize either environmental or social sustainability
that therefore, the automotive supply chain has to be separately (Seuring and Muller, 2008). Expanding on
responsive. As attaining flexible practices are these limitations, a further understanding of the
adversely impacted by a host of other factors such as effects of supply chain green practices, including
global economic instability, identifying and adapting social, and environmental practices is sought. Recent
to promising markets, rising competitive rivalries industry studies substantiate the “prevalence of
and consumer preferences etc, Automakers are managing the greening of supply chains responsibly
focusing on effectiveness of the total supply chain and how it remains one of the most important
rather than on upgrading the specific functional sustainability challenges of organizations” (Lacy and
areas, assimilation of product development process Hayward, 2011; Lacy et al., 2012).
with the production system, the essentials of which
involve close, frequent, interactions both informally Nonetheless, GSCM practices are not easy to
as well as formally between employees and close implement in India owing to their complex nature,
mentoring of subordinates by the supervisors. need of a greater degree of coordination, resource
requirements and lack of willingness on the part of
Green Supply Chain Practices (GSCP): A review organizations. Thereby it is realized that in order to
successfully implement the GSCM practices in India,
The term 'GSCP' refers to a variety of activities a strong will along with the right attitude on the part
performed by an organization that helps minimize of employees and organization as a whole is
the impact on the environment (Vachon and Klassen, required.
2006; Sarkis et al., 2010). In recent years the idea has
been to integrate the green process into the existing Indian Automobile Industry: Present Scenario
supply chain structure metrics and best practices
The Indian automobile industry has come a long that not only advance the environmental
way since its birth in the 1940's to become one of the management but also increase value to the business
largest in the world with an annual production of (Nwe et al., 2010). The process of integration of
over twenty million vehicles. It has seen considerable environmental and sustainability concerns within
growth in the last 20 years mainly due to economic supply chain management has itself evolved into a
liberalization including 100% FDI in the sector The separate and growing field, having a varied set of
automobile industry accounts for 22 % of the names as such : sustainable supply network
country's manufacturing gross domestic product management, supply chain environmental
(GDP) (SIAM, 2015). Ingredients such as availability management, green purchasing and procurement,
of large number of skilled workers, low production environmental purchasing, green logistics,
cost, faster design and development process and environmental logistics and sustainable supply
new emerging market status are stimulants causing chains (Sarkis, 2012).
global auto manufacturing companies to establish
R&D facilities in India . Some of these multinational However, the research and investigation on external
companies outsource most functions regionally policies and practices suggested by Hoejmose and
while retaining control on product development and Adrien-Kirby (2012) such as Sustainable Supply
strategic procurement (Auto SCM India 2006) A Chain Management (SSCM) practices, and
.
ISSN (O) : 2456-6675, ISSN (P) : 0972-8058
19

plethora of groups such as assemblers, multi- and global companies like Bosch, Goetze-Werke and
national assemblers, Indian component suppliers, Johnson Control have set up facilities in India” as
multi-national component suppliers, each with its brought out by Joshi, et al (2013). The multi-tiered
own specific strengths and weaknesses form the auto component industry presently contributes
automotive industry (Ray, S., 2012) India's significantly to the overall growth of the automobile
automotive industry is the world's sixth largest Industry and major part of exports go to the Original
producer of automobiles in terms of volume and Equipment Manufacturers and major suppliers and
value and has grown 14.4% in the last decade The only 30% to global aftermarkets, which indicates
industry contributes 7% to India's GDP, 7-8% of the towards the advancements in this sector
total employed population (about 13 million people), (Automotive 2006). Automakers are increasingly
4% of exports (AT Kearney 2013), & SIAM India 39% looking towards so far untapped rural markets in
of FDI inflows (USD 5.5 billion between 2009 -13) it India due to enhanced buying capacity. Moreover,
contributes 17% to total indirect taxes collected. indigenization of automotive manufacturing and its
Overall domestic sales are led by two-wheelers, associated activities are likely to gather pace with
(77.4% of total sales in 2012-13) followed by intensification of 'Make in India' campaign.
passenger vehicles (15.1%) and commercial vehicles
(4.45%) SIAM India - Society of Indian Automobile The above circumstances indicate that the Indian
Manufacturers (SIAM), 2014. However, despite of automotive industry has prospects for considerable
earnings of 4 billion USD (including 1.8 billion USD growth. This makes it vital for the industry to
of auto component sector) through exports, the achieve competitive advantage through acceptance
automotive sector contributes only 2.37% of world of global supply chain best practices. GSCM thproduction and is ranked very low at 26 in the practices have become the focal point for the
world auto export market with a share of 0.53%. automotive industry as the general public has
Nonetheless, Indian automotive industry is striving become more concerned about how organization
for global competitiveness and is taking noticeable deals with social and environmental issues and give
steps in that direction; India has the best-in-class fuel back to society from which they takes out profit. The
economy rates (KPMG, 2006, & Swaminathan, J.M., increasing criticism of the automobiles as the single
2006). By 2050, the country is expected to top the largest source of pollution has put immense pressure
world in car volumes with approximately 611 on companies to upgrade not only the technology to
million vehicles on the nation's roads (Sarin, 2015). increase the effectiveness and use better emission
Realising the importance of the auto industry, which control devices but also to incorporate green
has grown-up in seven 'clusters' and its involvement measures in their supply chain networks (Shukla et
to financial growth, the Indian government laid out al., 2009). Due to the growing concern of the
the goals of the industry in two documents – 'Auto environment issues, a leading group of companies in
Policy 2002' and 'Auto Mission Plan 2006-16 the automobile industry including Hyundai Motors,
(Automotive 2006). The Government has taken Toyota, and BMW have adopted “green” standards
active steps to realize a target of USD 145 billion in in their SCM. Saad and Patel (2006) argued that
output contributing to 10% of the GDP and Indian automobile sector is not implementing the
providing further employment to 25 million people philosophy of supply chain in its true sense. Some of
by 2016. The setting up of manufacturing facilities in the problems with the Indian automobile sector may
India by large automakers like Hyundai, Ford, be classified as: large number of auto assemblers,
Toyota etc has also ensured rapid establishment and low-technological capability, poor quality, lower
growth of an energetic auto component sector (Auto reliability in terms of delivery, large number of
SCM India 2006). “Design, development and players in automobile sectors, small capacity of auto-
replication capabilities have increased significantly ancillary firms, lack of availability of components
.
.
ISSN (O) : 2456-6675, ISSN (P) : 0972-8058
20

and lack of strong partnership among partners in the their engine technologies to be in compliance with
supply chain (Charan, 2012). environmental legislations. They have worked on
improving the environmental by producing engines
The paper is further structured as follows: Section 4 by lowering emissions, fuel consumption and noise,
defines the Green Supply Chain practices in Indian as well as high dynamic functions and
Automobile Industry where as section 5 identifies dependability.
various drivers of the GSCP as identified in the
literature review which further described the role of In the perspective of the Indian auto industry, Ravi
stakeholders in GSCP. The section 6 classifies the and Shankar (2005) have identified five strong
stakeholders with the help of various studies done in barriers namely: lack of awareness of overturn
this regard. Finally the section 8 concludes the work logistics, lack of commitment by the top
and gives the future research direction. management, problems with product quality, lack of
tactical preparation and financial constraints which
Green Supply Chain Practices (GSCP) in hinder the successful execution of GSCM practices.
Automobile Industry Nevertheless, these aspects are not unique to Indian
industry alone. With recessionary threats to
The Indian Automobile industry has witnessed prevailing market conditions, sluggish auto sales,
many challenges during the past few years in terms unstable petroleum industry, and the blurring future
of supply chain. Singh et al. (2004) observes that after for new technologies adversely impacting the
liberalization, many global automobile operational competence, supply chain management
manufacturers have established manufacturing bases of the auto industry becomes one of the important
or international purchase centers in India. This has elements for the survival or success of the very
intensified the competition among the automobile industry (Webster, 2006).
firms, motivating them to be innovative as to reduce
costs, enhance quality, and improve level of their Therefore, due to the supply chain management's
supply chains. In a study, Yu and Thomas (2011) significant role in the auto industry, there is a need
suggested that as automobile manufacturing to think strategically and critically regarding the
involves hundreds of parts from many suppliers; strengths and weakness of the field, examine closely
supply chain management becomes critical area in the opportunities and pressure in the global
operations management of the industry and a vital environment and offer suggestions to make the most
factor for the success or endurance of the auto of benefits for all stakeholders and maintain the
makers. sustainability of the auto industry (Yu Xia and
Thomas Li-Ping Tang, 2011). Moreover as is evident
Though automobile parts manufacturing companies that relatively the auto industry is fit to be
have initiated multiple dimensions of GSCM considered a mature industry overall because its
practices, as well as internal environmental products, process architectures, and values are
management, green purchasing, green marketing steady; however, due to global warming, the energy
and eco-design, producing environmentally robust for the auto industry in terms of source as well as
engines is one key dimension that is used to storage and supply of green and renewable energy
establish their environmental image, and thus gain takes the center stage and becomes a prevailing
and keep competitiveness. With increased public challenge in the near future (Tang, 2010). As the
consciousness, tightening of environmental norms green energy today is in the undeveloped stage of
and state investments in production and distribution the life cycle, therefore, the auto industry straddles
of cleaner fuels, leading manufacturers in this both grown-up and young industries and requires a
competitive market have been forced to upgrade new, innovative, and imaginative design for the
ISSN (O) : 2456-6675, ISSN (P) : 0972-8058
21
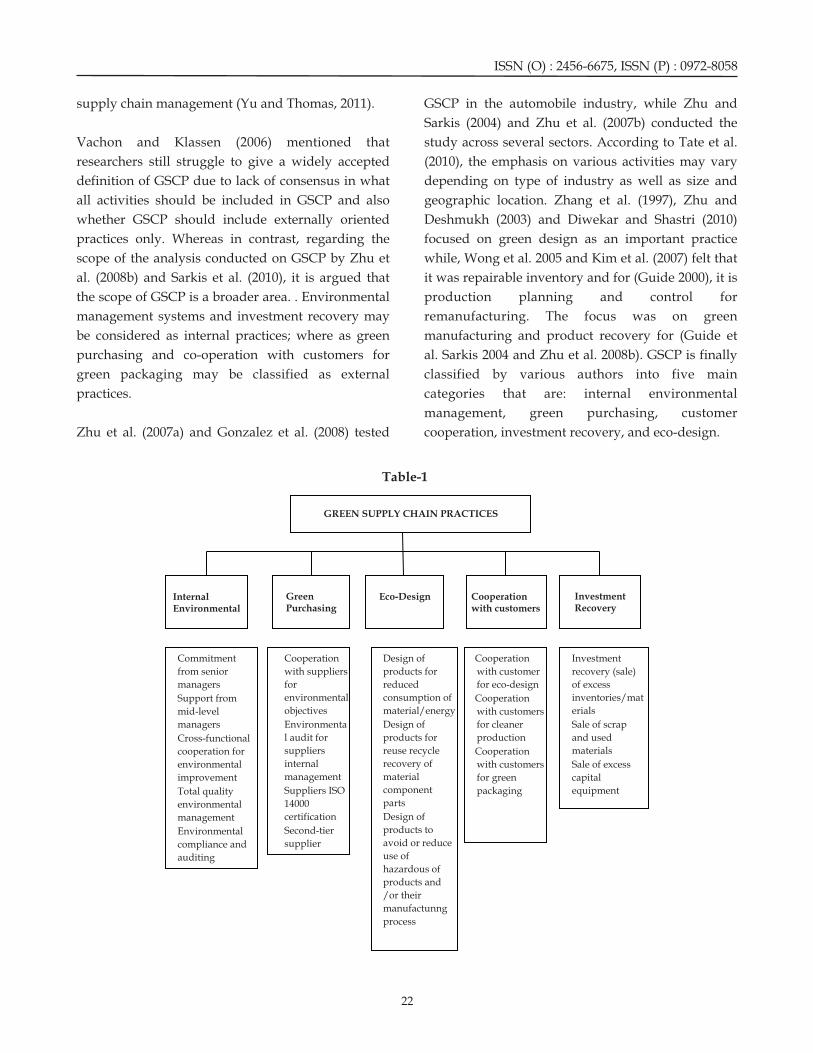
supply chain management (Yu and Thomas, 2011). GSCP in the automobile industry, while Zhu and
Sarkis (2004) and Zhu et al. (2007b) conducted the
Vachon and Klassen (2006) mentioned that study across several sectors. According to Tate et al.
researchers still struggle to give a widely accepted (2010), the emphasis on various activities may vary
definition of GSCP due to lack of consensus in what depending on type of industry as well as size and
all activities should be included in GSCP and also geographic location. Zhang et al. (1997), Zhu and
whether GSCP should include externally oriented Deshmukh (2003) and Diwekar and Shastri (2010)
practices only. Whereas in contrast, regarding the focused on green design as an important practice
scope of the analysis conducted on GSCP by Zhu et while, Wong et al. 2005 and Kim et al. (2007) felt that
al. (2008b) and Sarkis et al. (2010), it is argued that it was repairable inventory and for (Guide 2000), it is
the scope of GSCP is a broader area. . Environmental production planning and control for
management systems and investment recovery may remanufacturing. The focus was on green
be considered as internal practices; where as green manufacturing and product recovery for (Guide et
purchasing and co-operation with customers for al. Sarkis 2004 and Zhu et al. 2008b). GSCP is finally
green packaging may be classified as external classified by various authors into five main
practices. categories that are: internal environmental
management, green purchasing, customer
Zhu et al. (2007a) and Gonzalez et al. (2008) tested cooperation, investment recovery, and eco-design.
GREEN SUPPLY CHAIN PRACTICES
Commitment
from senior
managers
Support from
mid-level
managers
Cross-functional
cooperation for
environmental
improvement
Total quality
environmental
management
Environmental
compliance and
auditing
Cooperation
with suppliers
for
environmental
objectives
Environmenta
l audit for
suppliers
internal
management
Suppliers ISO
14000
certification
Second-tier
supplier
Design of
products for
reduced
consumption of
material/energy
Design of
products for
reuse recycle
recovery of
material
component
parts
Design of
products to
avoid or reduce
use of
hazardous of
products and
/or their
manufactunng
process
Cooperation
with customer
for eco-design
Cooperation
with customers
for cleaner
production
Cooperation
with customers
for green
packaging
Investment
recovery (sale)
of excess
inventories/mat
erials
Sale of scrap
and used
materials
Sale of excess
capital
equipment
Internal Environmental
Green Purchasing
Eco-Design Cooperation with customers
Investment Recovery
Table-1
ISSN (O) : 2456-6675, ISSN (P) : 0972-8058
22
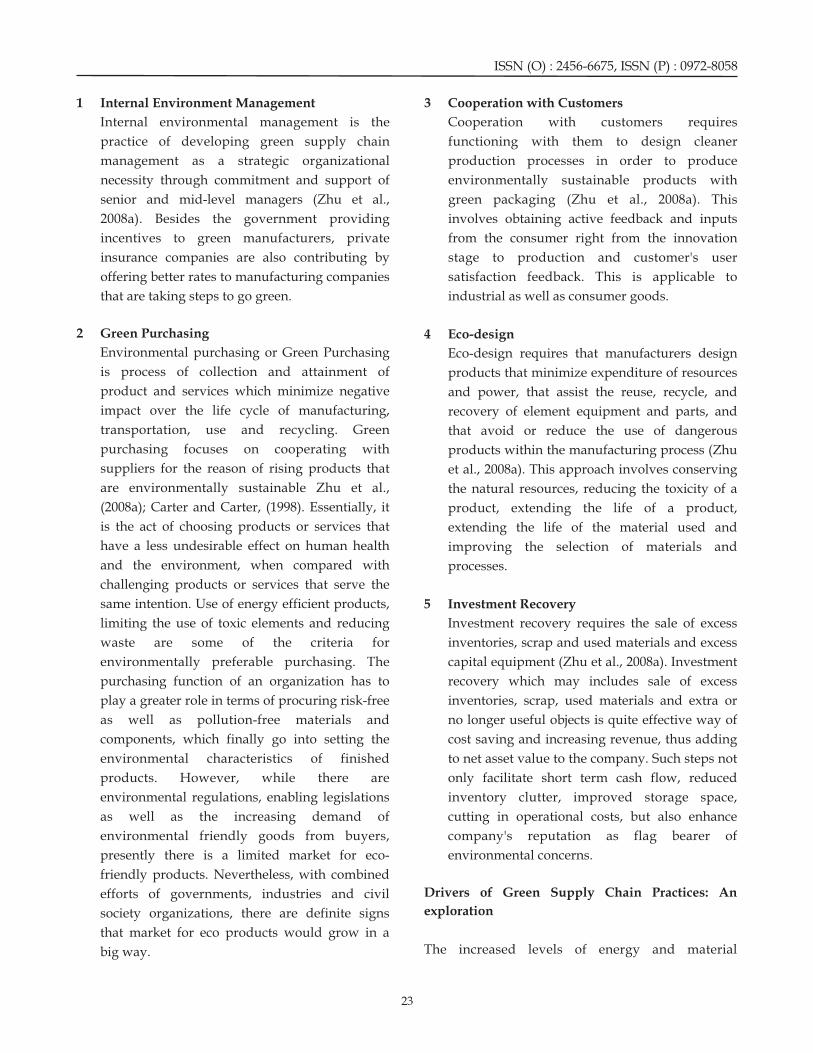
1 Internal Environment Management 3 Cooperation with Customers
Internal environmental management is the Cooperation with customers requires
practice of developing green supply chain functioning with them to design cleaner
management as a strategic organizational production processes in order to produce
necessity through commitment and support of environmentally sustainable products with
senior and mid-level managers (Zhu et al., green packaging (Zhu et al., 2008a). This
2008a). Besides the government providing involves obtaining active feedback and inputs
incentives to green manufacturers, private from the consumer right from the innovation
insurance companies are also contributing by stage to production and customer's user
offering better rates to manufacturing companies satisfaction feedback. This is applicable to
that are taking steps to go green. industrial as well as consumer goods.
2 Green Purchasing 4 Eco-design
Environmental purchasing or Green Purchasing Eco-design requires that manufacturers design
is process of collection and attainment of products that minimize expenditure of resources
product and services which minimize negative and power, that assist the reuse, recycle, and
impact over the life cycle of manufacturing, recovery of element equipment and parts, and
transportation, use and recycling. Green that avoid or reduce the use of dangerous
purchasing focuses on cooperating with products within the manufacturing process (Zhu
suppliers for the reason of rising products that et al., 2008a). This approach involves conserving
are environmentally sustainable Zhu et al., the natural resources, reducing the toxicity of a
(2008a); Carter and Carter, (1998). Essentially, it product, extending the life of a product,
is the act of choosing products or services that extending the life of the material used and
have a less undesirable effect on human health improving the selection of materials and
and the environment, when compared with processes.
challenging products or services that serve the
same intention. Use of energy efficient products, 5 Investment Recovery
limiting the use of toxic elements and reducing Investment recovery requires the sale of excess
waste are some of the criteria for inventories, scrap and used materials and excess
environmentally preferable purchasing. The capital equipment (Zhu et al., 2008a). Investment
purchasing function of an organization has to recovery which may includes sale of excess
play a greater role in terms of procuring risk-free inventories, scrap, used materials and extra or
as well as pollution-free materials and no longer useful objects is quite effective way of
components, which finally go into setting the cost saving and increasing revenue, thus adding
environmental characteristics of finished to net asset value to the company. Such steps not
products. However, while there are only facilitate short term cash flow, reduced
environmental regulations, enabling legislations inventory clutter, improved storage space,
as well as the increasing demand of cutting in operational costs, but also enhance
environmental friendly goods from buyers, company's reputation as flag bearer of
presently there is a limited market for eco- environmental concerns.
friendly products. Nevertheless, with combined
Drivers of Green Supply Chain Practices: An efforts of governments, industries and civil
explorationsociety organizations, there are definite signs
that market for eco products would grow in a
The increased levels of energy and material big way.
ISSN (O) : 2456-6675, ISSN (P) : 0972-8058
23
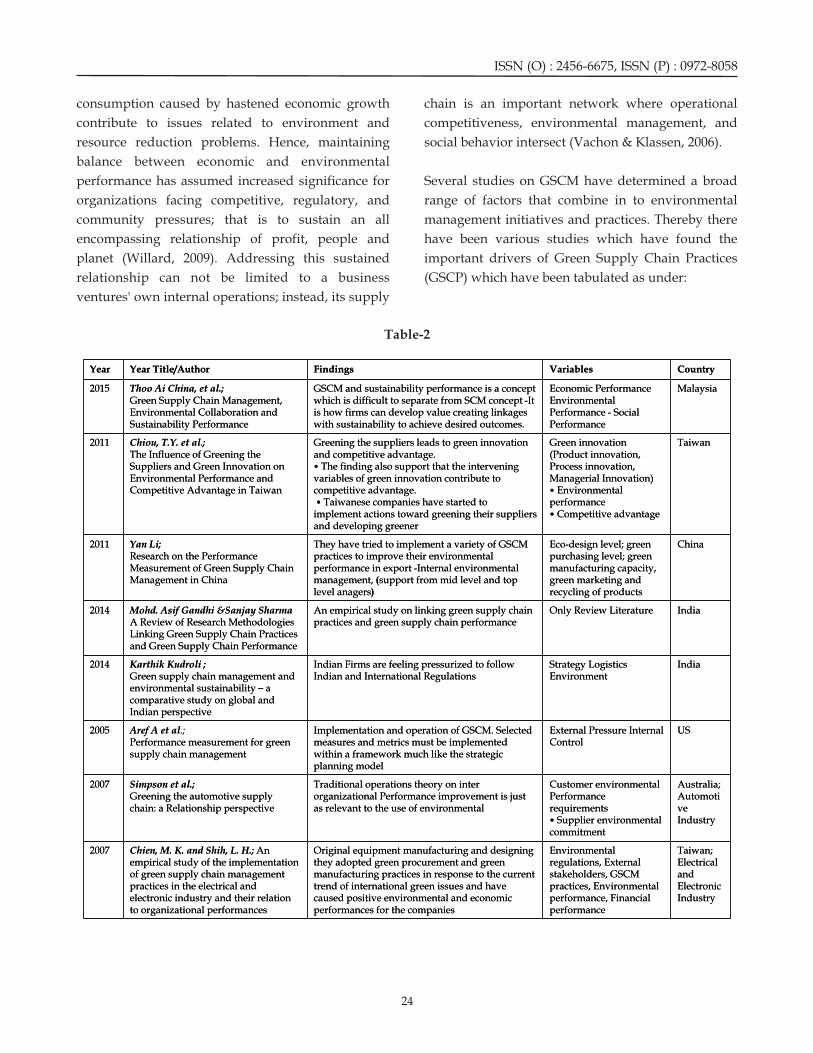
consumption caused by hastened economic growth chain is an important network where operational
contribute to issues related to environment and competitiveness, environmental management, and
resource reduction problems. Hence, maintaining social behavior intersect (Vachon & Klassen, 2006).
balance between economic and environmental
performance has assumed increased significance for Several studies on GSCM have determined a broad
organizations facing competitive, regulatory, and range of factors that combine in to environmental
community pressures; that is to sustain an all management initiatives and practices. Thereby there
encompassing relationship of profit, people and have been various studies which have found the
planet (Willard, 2009) Addressing this sustained important drivers of Green Supply Chain Practices
relationship can not be limited to a business (GSCP) which have been tabulated as under:
ventures' own internal operations; instead, its supply
.
Table-2
Taiwan; Electrical and Electronic Industry
Environmental regulations, External stakeholders, GSCM practices, Environmental performance, Financial performance
Original equipment manufacturing and designing they adopted green procurement and green manufacturing practices in response to the current trend of international green issues and have caused positive environmental and economic performances for the companies
Chien, M. K. and Shih, L. H.; An empirical study of the implementation of green supply chain management practices in the electrical and electronic industry and their relation to organizational performances
2007
Australia; Automotive Industry
Customer environmental Performance requirements • Supplier environmental commitment
Traditional operations theory on inter organizational Performance improvement is just as relevant to the use of environmental
Simpson et al.; Greening the automotive supply chain: a Relationship perspective
2007
USExternal Pressure Internal Control
Implementation and operation of GSCM. Selected measures and metrics must be implemented within a framework much like the strategic planning model
Aref A et al.; Performance measurement for green supply chain management
2005
IndiaStrategy Logistics Environment
Indian Firms are feeling pressurized to follow Indian and International Regulations
Karthik Kudroli ; Green supply chain management and environmental sustainability – a comparative study on global and Indian perspective
2014
IndiaOnly Review LiteratureAn empirical study on linking green supply chain practices and green supply chain performance
Mohd. Asif Gandhi &Sanjay SharmaA Review of Research Methodologies Linking Green Supply Chain Practices and Green Supply Chain Performance
2014
ChinaEco-design level; green purchasing level; green manufacturing capacity, green marketing and recycling of products
They have tried to implement a variety of GSCM practices to improve their environmental performance in export -Internal environmental management, (support from mid level and top level anagers)
Yan Li;Research on the Performance Measurement of Green Supply Chain Management in China
2011
TaiwanGreen innovation (Product innovation, Process innovation, Managerial Innovation) • Environmental performance • Competitive advantage
Greening the suppliers leads to green innovation and competitive advantage. • The finding also support that the intervening variables of green innovation contribute to competitive advantage.• Taiwanese companies have started to
implement actions toward greening their suppliers and developing greener
Chiou, T.Y. et al.;The Influence of Greening the Suppliers and Green Innovation on Environmental Performance and Competitive Advantage in Taiwan
2011
MalaysiaEconomic Performance Environmental Performance - Social Performance
GSCM and sustainability performance is a concept which is difficult to separate from SCM concept -It is how firms can develop value creating linkages with sustainability to achieve desired outcomes.
Thoo Ai China, et al.;Green Supply Chain Management, Environmental Collaboration and Sustainability Performance
2015
CountryVariablesFindingsYear Title/Author Year
ISSN (O) : 2456-6675, ISSN (P) : 0972-8058
24

Kenya, Commercial Banks
Competitiveness Cost, Profitability, Pricing, Market Share, Customer base, Customer loyalty, Share value, Dividend
The potential benefits for integrating green supply chains in the operations of a firm are compelling to any organization in the present day competitive environment is possible with the consumers having sufficient knowledge about it and it is recommended that public awareness of product
Wilson o. omonge; Green supply chain management
practices and competitiveness of
2010
India, Automobile Industry
Environmental attitudeThe results indicate that the pressure environment attitude has some moderating effect in improving GSCM practices. In the discussion of the results, the focus is on the reasons why certain significant characteristics exist. The study suggests that future research can focus on supply chain performance which may be classified as environmental and economic performance measures of GSCM practices
Sharma M. ; The role of employees’ engagement in the adoption of green supply chainpractices as moderated byenvironment attitude:
2014
Stakeholders' Intervention in Green Supply Chain regulations, which may potentially provide
Practices opportunities to gain market advantage.
Role of stakeholders takes prominence in green The classification of Stakeholders: The theoretical
supply chain management with organizational value model
chain of customers supplies and multilevel
The term "stakeholder" identified the wider distributors. It leads to increased Economic Value
hypothesis that others beyond shareholders affected, Added (EVA) achieved through a higher strategic fit
and in turn, were affected by a firm's activities across the entire set of activities in the value chain
(Preble, 2005). The dynamic nature of modern (Subir Sen,2009). Firms at different stages of
business relationships support the idea that development in regards to their approach to GSCM
uncertain and evolving business environments call practices will very likely engage in different
for ways to scan for emerging issues so that practices even though this may not essentially mean
managers can develop appropriate responses; that firms at complex stages would connect in a
observation of stakeholder requests help interpret bigger number of practices, as opposed to perhaps
these external changes (Preble, 2005). Some changes focusing on a less number of chosen practices that
include the emergence of consumer and better serve their objectives. Matten and Moon (2008)
environmental activist groups, an increase in discussed these factors in terms of institutional
government regulation and monitoring activities, theory, and Benn et al. (2006) discussed them in
market globalization and competition, an terms of stakeholder theory, both articles arguing
intensification of media attention and hostility, and that a composite mix of regulations, governance and
the relative loss of confidence in business (Freeman, stakeholder forces influenced the rate of a firm's
1984). Stakeholder theoretical models support a view progression towards more green practices. Some of
of aggregate and complex supply chain the supply chain practices of firms studied have been
relationships. A stakeholder map of an organization subjected to strong examination over the last 10
may include various groups with a investment or years. The stakeholder concept was articulated in a
interest in the success and activities of the firm such study in the 1960s at the Stanford Research Institute
as owners, suppliers, competitors, employees, (Freeman, 2010; Preble, 2005). It is likely that these
customers, community, government, political groups external forces have inclined the industries' current
and others (Freeman, 2010). Freeman (2010) further understandings they have incorporated in Green
emphasized that stakeholder necessities are input supply chain management practices. Such steps can
motivators for tactical actions taken by firm be motivated by the organization's stakeholders'
managers, including ethical and financial activities. requests and swayed by organization's aim to have
Russo and Perrini (2010) pointed out that by complete compliance with environmental
ISSN (O) : 2456-6675, ISSN (P) : 0972-8058
25
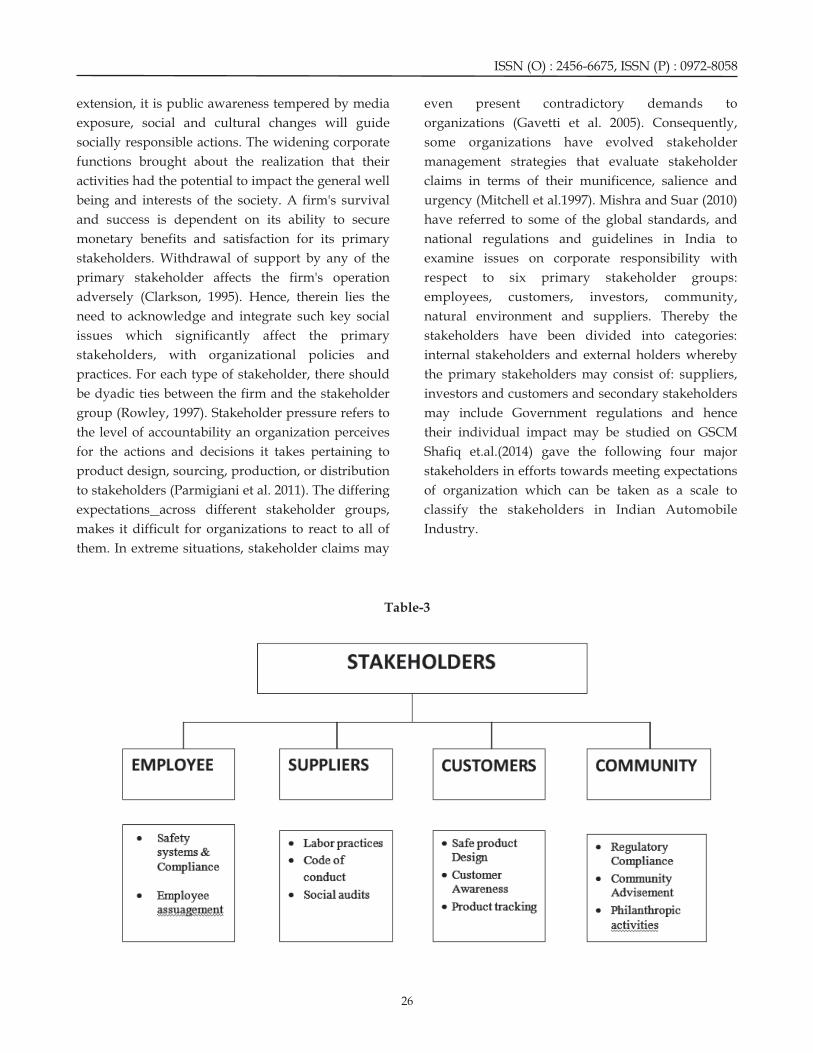
extension, it is public awareness tempered by media even present contradictory demands to
exposure, social and cultural changes will guide organizations (Gavetti et al. 2005). Consequently,
socially responsible actions. The widening corporate some organizations have evolved stakeholder
functions brought about the realization that their management strategies that evaluate stakeholder
activities had the potential to impact the general well claims in terms of their munificence, salience and
being and interests of the society. A firm's survival urgency (Mitchell et al.1997). Mishra and Suar (2010)
and success is dependent on its ability to secure have referred to some of the global standards, and
monetary benefits and satisfaction for its primary national regulations and guidelines in India to
stakeholders. Withdrawal of support by any of the examine issues on corporate responsibility with
primary stakeholder affects the firm's operation respect to six primary stakeholder groups:
adversely (Clarkson, 1995). Hence, therein lies the employees, customers, investors, community,
need to acknowledge and integrate such key social natural environment and suppliers. Thereby the
issues which significantly affect the primary stakeholders have been divided into categories:
stakeholders, with organizational policies and internal stakeholders and external holders whereby
practices. For each type of stakeholder, there should the primary stakeholders may consist of: suppliers,
be dyadic ties between the firm and the stakeholder investors and customers and secondary stakeholders
group (Rowley, 1997). Stakeholder pressure refers to may include Government regulations and hence
the level of accountability an organization perceives their individual impact may be studied on GSCM
for the actions and decisions it takes pertaining to Shafiq et.al.(2014) gave the following four major
product design, sourcing, production, or distribution stakeholders in efforts towards meeting expectations
to stakeholders (Parmigiani et al. 2011). The differing of organization which can be taken as a scale to
expectations across different stakeholder groups, classify the stakeholders in Indian Automobile
makes it difficult for organizations to react to all of Industry.
them. In extreme situations, stakeholder claims may
Table-3
ISSN (O) : 2456-6675, ISSN (P) : 0972-8058
26
1 Employees as Stakeholders focusing on improving employee skills yields long-
lasting benefits for an organization.
Most researchers refer to employees as main internal
2 Suppliers as Stakeholders stakeholders and classify their concerns under the
three main categories of workplace issues, safety and
Integration and cooperation in supply chains health issues and discrimination and affirmative
facilitate more effective management of action issues (Carroll and Buchholtz, 2008). While
environmental issues and therein the suppliers play Clarkson (1995) outlines a list of internal stakeholder
a very important role. Whilst suppliers may not be concerns that include human resource–related
the direct guides, their contribution in GSCM lies concerns, such as compensation and benefits, career
more in the manner of generating and providing planning, leaves of absence, and termination and
valuable ideas in the implementation of layoff issues. The management has significant
environmental projects. Notwithstanding the influence in fostering a safe environment, which is a
indirect role of suppliers in guiding policies of an component of the organizational culture
enterprise, they are considered key stakeholders in encompassing the individuals, jobs, and the
strategy literature (Swanson, 1995), and have an organizational measures affecting employees' health
immense responsibility in ensuring adherence to and safety. Employees' performance is constructively
ethical and environmental standards. Any such influenced by a safe working environment whose
violation on their part will have wide spread maintenance has become an important parameter of
ramifications for a firm's social image and reputation an organisation's social practices. Such internally
and that is why firms need to evolve exhaustive and focused practices are those influences on Green
extensive procurement practices to minimize the risk Supply Chain Management which steer
of any such potential damage coming from supplier. implementation and adoption of GSCM in
Dyadic studies of buyer–supplier relationships have manufacturing industries. A firm with a good social
strengthened the view that long-term commitment, and ethical reputation is a more attractive employer
ethical leadership in both buying and supplying compared to firms with an average or poor social
organizations, and the level of coordination among and ethical record (Turban & Greening, 1997).
the two partners are related to better ethical and Organisational emphasis on promotion and
social performance of both parties (Carter, 2000a, b; maintenance of the physical, mental and social well-
Hill, Eckerd, Wilson, & Greer, 2009). The trend of being of workers facilitates employee motivation
moving production to overseas suppliers has which is described as an employee's basic
resulted in additional responsibility on the supply enthusiasm about work and incentives given to
chain function of firms to not only diligently monitor accomplish work. Incentives may range from
their suppliers for product-related issues but to also satisfying the employee's requirements and prospect
manage their social conduct. Therefore, as firms are from work, good working conditions acknowledging
more likely to engage with multi tiered supply and rewarding their work including monetary
networks in today's globalised world, it is imperative rewards. Apropos social identity theory which states
that they work out a strategy for development and that self-concept of an employee is influenced by
implementation of a code of conduct and enforce its membership in an organization (Ashforth & Mael,
reinforcement through rigorous social audits. 1989). The benefits are visible across the board from
Emmelhainz and Adams (1999) mentioned the three existing employees to attracting new employees who
tasks that a buying organization must perform to exhibit enhanced motivation, greater willingness to
improve the social conduct of their suppliers as the engage in cooperative behavior, and remain
development of a formal code of conduct document, affiliated to a firm that is perceived as a moral and
which serves as a guideline for suppliers to ensure an ethical employer (Dutton,et.al. 1994). Therefore,
ISSN (O) : 2456-6675, ISSN (P) : 0972-8058
27
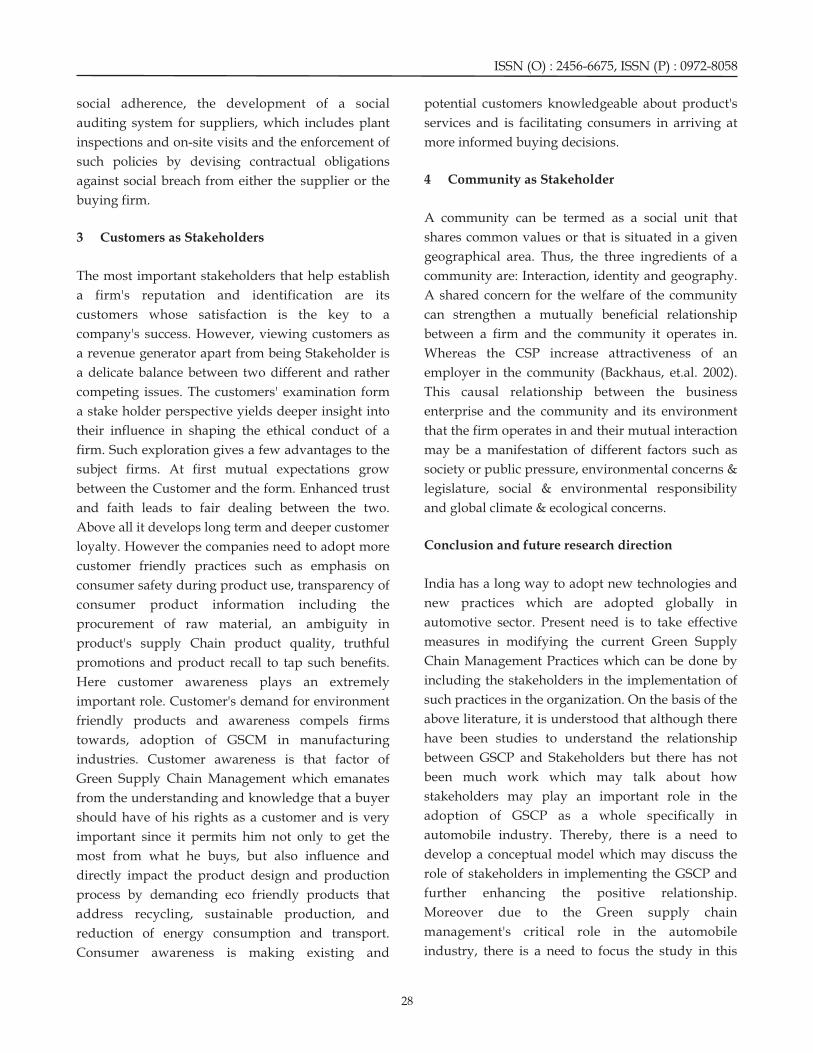
social adherence, the development of a social potential customers knowledgeable about product's
auditing system for suppliers, which includes plant services and is facilitating consumers in arriving at
inspections and on-site visits and the enforcement of more informed buying decisions.
such policies by devising contractual obligations
4 Community as Stakeholderagainst social breach from either the supplier or the
buying firm.
A community can be termed as a social unit that
3 Customers as Stakeholders shares common values or that is situated in a given
geographical area. Thus, the three ingredients of a
The most important stakeholders that help establish community are: Interaction, identity and geography.
a firm's reputation and identification are its A shared concern for the welfare of the community
customers whose satisfaction is the key to a can strengthen a mutually beneficial relationship
company's success. However, viewing customers as between a firm and the community it operates in.
a revenue generator apart from being Stakeholder is Whereas the CSP increase attractiveness of an
a delicate balance between two different and rather employer in the community (Backhaus, et.al. 2002).
competing issues. The customers' examination form This causal relationship between the business
a stake holder perspective yields deeper insight into enterprise and the community and its environment
their influence in shaping the ethical conduct of a that the firm operates in and their mutual interaction
firm. Such exploration gives a few advantages to the may be a manifestation of different factors such as
subject firms. At first mutual expectations grow society or public pressure, environmental concerns &
between the Customer and the form. Enhanced trust legislature, social & environmental responsibility
and faith leads to fair dealing between the two. and global climate & ecological concerns.
Above all it develops long term and deeper customer
Conclusion and future research directionloyalty. However the companies need to adopt more
customer friendly practices such as emphasis on
India has a long way to adopt new technologies and consumer safety during product use, transparency of
new practices which are adopted globally in consumer product information including the
automotive sector. Present need is to take effective procurement of raw material, an ambiguity in
measures in modifying the current Green Supply product's supply Chain product quality, truthful
Chain Management Practices which can be done by promotions and product recall to tap such benefits.
including the stakeholders in the implementation of Here customer awareness plays an extremely
such practices in the organization. On the basis of the important role. Customer's demand for environment
above literature, it is understood that although there friendly products and awareness compels firms
have been studies to understand the relationship towards, adoption of GSCM in manufacturing
between GSCP and Stakeholders but there has not industries. Customer awareness is that factor of
been much work which may talk about how Green Supply Chain Management which emanates
stakeholders may play an important role in the from the understanding and knowledge that a buyer
adoption of GSCP as a whole specifically in should have of his rights as a customer and is very
automobile industry. Thereby, there is a need to important since it permits him not only to get the
develop a conceptual model which may discuss the most from what he buys, but also influence and
role of stakeholders in implementing the GSCP and directly impact the product design and production
further enhancing the positive relationship. process by demanding eco friendly products that
Moreover due to the Green supply chain address recycling, sustainable production, and
management's critical role in the automobile reduction of energy consumption and transport.
industry, there is a need to focus the study in this Consumer awareness is making existing and
ISSN (O) : 2456-6675, ISSN (P) : 0972-8058
28

industry. The literature review done in this context is the consumer products industry. Decision. Sciences,
only suggestive of the link between stakeholders' 29, 28–38.
pressure on green supply chain practices. The role of 10) Carter, C. R., & Rogers, D. S. 2008. A framework
stakeholders may be observed in many positions vis of sustainable supply chain management:
a vis the green supply chain practices as Moving toward new theory. International Journal
independent variable, moderating or mediating of Physical Distribution and Logistics Management,
variable and should be tested empirically with the 38 (5), 360–387.
survey data. 11) Caroll & Buchholtz 2008.
Business &
REFERENCES Economics - 992 pages
12) Charan, P. 2012. Supply chain performance issue
1) Andriof, J., Waddock, S., Husted, B. & Rahman, in an automobile company: A SAP-LAP analysis.
S. 2002. Unfolding Stakeholder Thinking: Measuring Business Excellence, 16(1), 67-86.
Theory, Responsibility, and Engagement. 13) Christopher, M. 1998. Logistics and Supply Sheffield UK: Greenleaf Publishing. Chain Management – Strategies for reducing cost
2) ACMA, 2013. Presentation on “Auto Component and improving service, 2nd ed., London.Industry in India: Growing Capabilities and 14) Clarkson, M.E. 1995. A stakeholder framework Strengths”, retrieved from www.acma.in. for analyzing and evaluating for corporate social
3) AT Kearney 2013, “Building world class supply performance. Academy of Management Review, chain in India”, Conference on Auto Supply Chain 20(1), 92–117. Management, retrieved from www.atkearney.com. 15) Crane, A. & Matten, D. 2004. Business ethics: a
4) Auto SCM India 2006, Chennai, “Background European perspective. Oxford: Oxford University note on Supply Chain management in Press.
Automotive Industry”, retrieved from 16) Dargush & Ward 2010. Understanding corporate ht tps : / /www.sc r i bd . com/ . . . /Supp ly -Cha in - social responsibility with the integration of Management-in-Automobile-Industry supply chain management in outdoor apparel
5) Automotive 2006 “Automotive Mission Plan manufacturers in North America and Australia. 2006-2016 – A Mission for Development of International Journal of Business and Management Indian Automotive Industry”, Ministry of Heavy Science, 3(1), 93-105. Industries & Public Enterprises, Government of 17) De Brito, Carbone and Blanquart. 2008. Towards India, retrieved from http://dhi.nic.in a sustainable fashion retail supply chain in
Europe: organization and performance.
International Journal of Production Economics,114,
(2), 534-53. 7) Backhaus, K. B., Stone, B.A., & Heiner, K. 2002. 18) Diwekar, U.M., & Shastri, Y.M. 2010. Green
Exploring the relationship between corporate process design, green energy, and sustainability: social performance and employer attractiveness. A systems analysis perspective. Computers & Business and Society, 41(3), 292-318. Chemical Engineering, 34(9), 1348-1355.
8) Benn, S., Dunphy, D., & Griffiths, A. 2006.
Enabling change for corporate sustainability: An
integrated perspective. Australasian Journal of
Environmental Management, 13(3), 156–165. 20) ElTayeb, T.K., Zailani, S., & Jayaraman, K. 2010. 9) Carter, R.C. and Carter, J.R. 1998. The examination on the drivers for green
Interorganizational determinants of purchasing adoption among EMS 14001 certified environmental purchasing: initial evidence from companies in Malaysia. Journal of Manufacturing
6) Ashforth, Blake E. and Fred Mael, 1989
. The
Academy of Management Review,14, (1), 20-39.
19) Dutton et al. 1994.
Administrative Science
Quarterly. 39, 239-263.
Business and Society:
Ethics and Stakeholder Management
Social
Identity Theory and the Organization
Organizational Images and
Member Identification .
ISSN (O) : 2456-6675, ISSN (P) : 0972-8058
29

Technology Management, 21(2), 206-225. literature review and future research agenda of a st21) Eltantawy R, Reham A., Giunipero Larry & Fox managerial issue in the 21 century. Journal of
Gavin L. 2009. A Strategic Skill Based Model of Purchasing and Supply Management, 18 (4), 232-
Supplier Integration and its Effect on Supply 242.
Management Performance, Industrial Marketing 33) Joshi, D., Nepal, B., Rathore,A.P.S. & Sharma,D.
Management, (38) 925-236. 2013. On supply chain competitiveness of Indian
22) Emmelhainz, M. A. and R. J. Adams. 1999. The automotive component manufacturing industry,
Apparel Industry Response to 'Sweetshop' International Journal of Production Economics,
Concerns: A Review and Analysis of Codes of 143,151–161.
Conduct”, Journal of Supply Chain Management. 34) Kapoor, V. & Ellinger, A.E. 2004. Transforming
35(3), 51-57. supply chain operations in response to economic
23) Freeman (1984). Strategic Management: A reform: the case of a motorcycle manufactrer in
Stakeholder Approach (Pitman, Boston). India. Supply Chain Management: An International
24) Freeman, 2010. Stakeholder theory: The state of Journal, 9(1), 16-22.
the art. Cambridge: Cambridge University Press. 35) Kim, J.S., Kim, T.Y., & Hur, S. 2007. An
25) Fisher M.L.1997. What is the right supply chain algorithm for repairable item inventory system
for your product?, Harvard Business Review, with depot spares and general repair time
March–April,105–116. distribution. Applied Mathematical Modelling, (31),
26) Gavetti, G., Levinthal, D. A., & Rivkin, J. W. 795-804.
2005. Strategy making in novel and complex 36) Kleindorfer, P.R., Singhal, K., & Wassenhove,
worlds: The power of analogy. Strategic L.N. 2005. Sustainable operations management.
Management Journal, 26(8), 691–712. Production and Operations Management. 14(4), 482-
27) Gonzalez, P., Sarkis, J., and Adenso-Diaz, B. 492.
2008. Environmental management system 37) KPMG. 2006. Indian Automotive Supply Chain–
certification and its influence on corporate A Discussion paper, retrieved from
practices: evidence from the automotive www.in.kpmg.com India. http://dhi.nic.in.
industry. International Journal of Operations and 38) Lacy and Hayward. 2011. A New Era of
Production Management 28 (11), 1021-1041. Sustainability in Emerging Markets? Insights
28) Guide V.D.R., Jr. 2000. Production planning and from a Global CEO Study by the United Nations
Control for remanufacturing: Industry Practice Global Compact and Accenture. Corporate
and research needs, Journal of Operations Governance, 11(4), 348-357.
Management, (18), 467-483. 39) Lacy, P., Haines, A. and Hayward, R. 2012.
29) Guide Jr.VDR .1996. Scheduling using drum- Developing strategies and leaders to succeed in
buffer-rope in a remanufacturing environment. a new era of sustainability: findings and insights
International Journal of Production Research (34), from the United Nations Global Compact-
1081-1091. Accenture CEO Study, Journal of Management
30) Gungor, A., & Gupta, S.M. 1998. Disassembly Development, 31(4), 346-357.
sequence planning for products with defective 40) Lee, K. and Kim, J. 2009. Current status of CSR in
parts in product recovery. Computers & Industrial the realm of supply management: the case of the
Engineering, (35), 161-164. Korean electronics industry. Supply Chain
31) Hanifan, G., Sharma, A., Mehta, P. 2012. Why a Management: An International Journal, 14(2), 138-
sustainable supply chain is good business, 148.
Accenture, Outlook (3), 1-6. 41) Maignan, I., and Ferrell, O.C. 2001. Corporate
32) Hoejmose and Adrien-Kirby. 2012. Socially and citizenship as a marketing instrument –
environmentally responsible procurement:a Concepts, evidence, and research directions.
,
ISSN (O) : 2456-6675, ISSN (P) : 0972-8058
30

European Journal of Marketing. 35 (3/4), 457-484. interactions among the barriers of reverse
42) Matten, D. and Moon, J. 2008. 'Implicit' and logistics. Technological Forecasting & Social
'Explicit' CSR: A conceptual framework for a Change, 72, 1011-1029.
comparative understanding of corporate social 53) Rowley, T.J. 1997. Moving beyond dyadic ties: a
responsibility'. Academy of Management Review, network theory of stakeholder influences,
33 (2), 404-424. Academy of Management Review, 22 (4), 887-910.
43) McWilliams, A. and Siegel, D. 2001. Corporate 54) Russo, A., & Perrini, F. 2010. Investigating
social responsibility: A theory of the firm stakeholder theory and social capital: CSR in
perspective. Academy of Management Review, (26), large firms and SMEs. Journal of Business Ethics,
117-127. (91), 207-221.
44) Mishra, and Suar. 2010. Does Corporate Social 55) Sahay, B.S., Cavale, V., & Mohan, R. 2003. The
Responsibility Influence Firm Performance of Indian supply chain architecture. Supply Chain
Indian Companies?. Jouirnal of Business Ethics Management: An International Journal, 8(2), 93-106.
(95), 571- 601.
45) Mitchell et al. 1997. Toward a Theory of
Stakeholder Identification and Salience: Defining
the Principle of Who and What Really Counts. 57) Sarkis, J., Gonzalez-Torre, P., & Adenso-Diaz, B.
The Academy of Management Review 22(4), 853-886 2010. Stakeholder pressure and the adoption of
46) Moore, S. and Manring, S. 2009. Srategy environmental practices: The mediating effect of
development in small and medium sized training. Journal of Operations Management, 28(2),
enterprises for sustainability and increased value 163-176.
creation. Journal of Cleaner Production, 17(2), 276- 58) Sarkis, J. 2012. A boundaries and flows
282. perspective of green supply chain management,
Supply Chain Management: An International 47) Nwe, E.S., Adhitya, A., Halim I. & Srinivasan, R.
Journal, 17 (2), 202-216. 2010. Green supply chain design and operation
59) Seuring, S. and Muller, M. 2008. From a by integrating LCA and dynamic simulation. In th literature review to a conceptual framework for Pierucci, S. & Ferraris,G.B. (Eds). 20 European
sustainable supply chain management. Journal of Symposiumon Computer Aided Process
Cleaner Production, 16(8), 1699-1710. Engineering-ESCAPE20 (pp. 1-6). Elsevier B.V.
60) Shukla, A.C., Deshmukh, S.G., & Kanda, A. 2009. 48) Parmigiani, A., Klassen, R. D., & Russo, M. V.
Environmentally responsive supply chains: 2011. Efficiency meets accountability:
Learnings from the Indian auto sector. Journal of Performance implications of supply chain
Advances in Management Research, 6(2), 154-171. configuration, control, and capabilities, Journal of
61) Seuring, S. and Muller, M. 2008. From a Operations Management, 29(3), 212–223.
literature review to a conceptual framework for 49) Patel, T. 2006. Making Sense of Diversity of
sustainable supply chain management. Journal of Ethical Strategies in Businesses: A Focus on the
Cleaner Production, 16(8), 1699-1710. Indian Context. CRR Conference, Trinity College,
62) Singh, R.K., Garg, S.K., & Deshmukh, S.G. 2004. Dublin.
Competitiveness of small and medium 50) Preble, J. F. 2005. Toward a comprehensive
enterprises: case of an Indian auto component model of stakeholder management. Business and
manufacturing organization. IIMB Management Society Review, 110(4), 407-431.
Review, 16(4), 94-102. 51) Ray, S. 2012. Economic Performance of Indian
63) SIAM India - Society of Indian Automobile Automobile Industry : An Econometric
Manufacturers (SIAM), retrieved from Appraisal, Business Intelligence Journal, Vol. 5,(1).
www.siamindia.com. Jan 14. Society of Indian 52) Ravi, V., & Shankar, R. 2005. Analysis of
56) Sarin. S .2015. In Business Marketing: Concepts
and Cases, Mcgraw Hill Education publishers, (pp.
73)
ISSN (O) : 2456-6675, ISSN (P) : 0972-8058
31

Automobile Manufacturers (SIAM), Union 75) Wong, H., Cattrysse, D., & Van, O. D. 2005.
Budget 2014-15 Stocking decisions for repairable spare parts
64) Soni,G.and Kodali,R. 2011. The strategic fit pooling in a multi-hub system. International
between Competitive strategy and supply chain Journal of Production Economics, 93/94, 309-317.
strategy in India manufacturing: an empirical 76) Yaziji, M. 2004. Turning gadflies into allies.
approach, Measuring Business Excellence, 15(2), Harvard Business Review, 82(2), 110–115.
70-89. 77) Yu Xia, Thomas Li-Pin Tang. 2011. Sustainability
65) Steiner, G. A., & Steiner, J. F. 1980. Business, in supply chain management: suggestions for
government, and society: A managerial the auto industry, Management Decision, 49 (4),
perspective. New York: Random House Business 495 – 512
Division. 78) Zhang, H.C., Kuo, T.C., Lu, H., & Huang, S.H.
66) Stevenson, M. and Spring, M. 2007. Flexibility 1997. Environmentally conscious design and
form a supply chain perspective: definition and manufacturing: a state-of-the-art survey. Journal
review, International Journal of Production of Manufacturing Systems, 16, 352-71.
Management, 27(7), 685-713. 79) Zhu, Y.J. & Deshmukh, A. 2003. Application of
67) Swaminathan, J.M., 2006. Managing Supply Bayesian decision networks to life cycle
Chain Operations in India – Pitfalls and engineering in green design and manufacturing.
opportunities, Building Supply Chain Excellence Engineering Applications of Artificial Intelligence,
in Emerging Economies, Springer Science + 16, 91-103.
Business Media LLC. 80) Zhu, Q. & Sarkis, J. 2004. Relationships between
68) Swanson R.A. 1995. Performance Is The Key. operational practices and performance among
Human Resource Development ,6(2)207-213. early adopters of green supply chain
69) Tang, T.L.P. 2010. From increasing gas efficiency management practices in Chinese manufacturing
to enhancing creativity: it pays to go green. enterprises. Journal of Operations Management,
Journal of Business Ethics, 94 (2), 149-55. 22(3), 265-289.
70) Vachon, S., & Klassen, R.D. 2006. Extending 81) Zhu, Q., Sarkis, J., & Lai, K. 2007a. Green supply
green practices across the supply chain: the chain management: pressures, practices and
impact of upstream and downstream performance within the Chinese automobile
integration. International Journal of Operations & industry. Journal of Cleaner Production, 15, 1041-
Production Management, 26(7), 795-821. 1052.
71) Webster, S. 2006. Auto industry survey: execs' 82) Zhu, Q., Sarkis, J., & Lai, K. 2007b. Initiatives and
outlook sours as volatility increases, uncertainty outcomes of green supply chain management
creates foothold for pessimism. Knight Ridder implementation by Chinese manufacturers.
Tribune Business News, p. 1. Journal of Environmental Management, (85), 179-89.
72) Willard M, Darcy Hitchcock. 2009. The Business 83) Zhu, Q., Sarkis, J., & Lai, K.H. 2008b. Green
Guide to Sustainability Practical Strategies and supply chain management implications for
Tools for Organizations 'closing the loop'. Transportation Research Part
73) Wolf, J. 2014. The Relationship Between E. Logistics and Transportation Review, 44(1), 1-18.
Sustainable Supply Chain Management,
Stakeholder Pressure and Corporate
Sustainability Performance. J Bus Ethics (119),
317–328
74) Womack, J.P., & Jones, D.T. 2005. Lean solutions:
How companies and customers can create
wealth together. The Free Press, New York, NY.
ISSN (O) : 2456-6675, ISSN (P) : 0972-8058
32

Mismatched Perception and Expectation of Retail Stakeholders: An Assessment of Indian Retail Store Jobs
1Dr. Anju Verma
2Dr. Ubba Savita
1. Assistant Professors, Haryana School of Business, Guru Jambheshwar University of Science & Technology, Hisar, [email protected]
2. Assistant Professors, Haryana School of Business, Guru Jambheshwar University of Science & Technology, Hisar, [email protected]
Corresponding AuthorDr. Anju Verma, Assistant Professors, Haryana School of Business, Guru Jambheshwar University of Science &Technology, Hisar, [email protected]
Effulgence
Vol. 15 No. 2
July-December, 2017
Rukmini Devi Institute of Advanced Studies
E-mail : [email protected], Website : www.rdias.ac.in
http://effulgence.rdias.ac.in/user/default.aspx
Abstract
The organized Indian retail sector is rising exponentially with large number of job openings coming up in the retail sector, it
becomes indispensable to identify the gaps in skills and job profile for the organized retail stores coming up in various parts of
India. The present study is an attempt to have an insight of the skills and job profile in retail stores across India. The sample
included the stakeholders of retail sector; the students (prospective employees) and the present retail employees in order to
identify their mismatched understanding for the kind of skills required and the actual profile of a retail job. The findings
highlight that technical, liasioning, creativity, interactive, leadership skills and prior degree / course make up the skills required
for retail store job. The retail store job profile includes flexible working arrangements, responsiveness, sales analysis,
contributing towards society and company; and other issues.
Job profile, Job skills, Retail, Store.Keywords:
The history of retailing in India goes way back to INTRODUCTIONearly centuries when India was treated as the
epitome of the business activities and retail activities ndia is regarded as one of the top and attractive
were also immense. But looking at the Iretail destination in the world. With huge revolutionized retail actions taking place around the
customer base having large disposable incomes, the world now, India is far behind with the traditional
world retailers are eyeing towards India. As the retail mode still dominating. However the figures
government has opened up the FDI in multi brand are not so looming. The organized retail share in
retailing in India, the opportunities in retail sector India is around 4 per cent but growing at whooping
are rising from all directions. This will also give birth 24 per cent annually whereas the unorganized sector
to large number of job openings in the front and at a slower rate of 10-12 per cent (The Economic
back end operations in retail sector.Times, 13-08-2012).
ISSN (O) : 2456-6675, ISSN (P) : 0972-8058

With positive significant changes in terms of FDI persuaded to work in retail.
coming up in multi and single brand retail, the
Job skills for retail storesopportunities are bound to come. In terms of
employment, retail in India is the second largest
Attracting right kind of talent into the retail sector is employer. After agriculture, majority of the people
a challenge for the retailers. Many researchers have are engaged in retail or related activities providing
attempted to identify the skills required to perform jobs to 9.4 per cent of all work forces available in
retail job. Gush (1996) reported that self- skills and India (Amin 2008). But majority of the people are
communication skills were most important qualities engaged in unorganized sector. With increasing
sought by employers. He also reported that British share of organized sector and huge investments
Retail Consortium (BRC) defined self confidence and flowing in, the job opportunities are on the rise. The
personal strength; leadership and teamwork; job openings are mounting but unfortunately the
planning and organization, analytical and problem labour productivity in Indian retail sector is low. It is
solving; human relations and influencing skills are merely 6 per cent of the labour productivity levels in
key to success in retail jobs. Overall academic US (Amin 2008). Hence more competent and skilled
performance and degree classification were least persons are required in the sector so that the labour
important factors considered by the employers. productivity levels could be higher. In order to grab
Quality in Higher Education (QHE) research found the job opportunities coming up in this sector, the
that retailers focused on in-house training for labour force need to be more skillful and acquaint
knowledge and skills rather than a degree as themselves with the job profile so as to become
informed by Gush (1996). Saunders et al. (2004), in proactive in this regard.
support to the findings of Gush (1996), found that
Review of literature skills related to communication, numeracy,
information technology, problem solving and team
Retail as a career option has been treated for research work, were critical for retail job. McGauran (2004)
by many researchers. Swinyard (1981) and Swinyard said that Parisian managers considered personal
et al. (1991) initiated by reporting the fact that qualities and social skills important along with
college students did not have favourable perception professional sales skills whereas Dublin managers
towards career in retail. But few years later emphasized personal qualities rather than
researchers like Commins and Preston (1997), Hart et professional skills.
al. (1999) found that the negative perception that
people held has changed and retail is being Kumar and Jain (2010) found that communication
considered as an attractive career destination by skill, working with group, adaptability,
United Kingdom (UK) graduates because of responsibility, interaction skill, proactive and
increased number of retail degrees provided by UK initiation skill, customer orientation, appearance,
universities and promotional activities by task perseverance, operational skill, creativity and
Consortium of British Retail Training Organisations problem solving, work performance and technology
(CORTCO). However Commins and Preston (1997) skills are the survival skills for a retail job in Middle
also reported that the retailers (job providers) still East. Nickson et al.(2012) reiterated that soft skills
felt that retail is treated as relatively unattractive need to be emphasized at the entry level retail jobs.
career by the students. Study by Broadbridge et al. Moreover, it is emphasized that there is need for
(2007) reports that almost half of the students who broadening soft skills including aesthetic labour.
worked in retail have positive experiences at work.
Around a quarter of students with retail experience
would take up a retail job and other quarter could be
ISSN (O) : 2456-6675, ISSN (P) : 0972-8058
34

Job profile in retail stores other frequently highlighted duties included staff
management, selling, displays and customer
Job profile is a region which is not been researched services. Johlke and Iyer (2013) indicated that the
extensively by the researchers. Gush (1996) reported characteristics of the retail employee's work
that graduates expect good training and structured environment are associated with enhanced job
development within a reputed company; career attitudes and reduced ambiguity. However they
prospects; interesting and challenging job from a found that greater amounts of job autonomy are
retail job. Commins and Preston (1997) and associated with increased levels of ambiguity.
Broadbridge (2001) found that students have limited
information about the duties of retail job. And this Significance of the Study
awareness of a retail career among students was
restricted to information provided by retailers in The lucrative Indian retail sector has resulted in
form of brochures and meetings/presentations at huge amount of job opportunities coming up. The
career fair (Commins and Preston, 1997). Students' retail employers are also eyeing on the talent inflow
perceptions of retailing as a future career were also in this sector. Awareness about the skills required
based on their experiences as consumers or part-time and the duties to be performed on the job will not
employees (Broadbridge 2003). Broadbridge (2003) only help the prospective but the present employees
attributed that retail career were people/customer to understand and perform their duties in pleasing
oriented, challenging and interesting but had poor and satisfying manner and contribute to increased
salary. She also found that graduates working in labour productivity level. Not only this, the
store based positions sought greater autonomy and understanding of the kind of skills required to
decision making within retailing. Knight and perform the store operations and the duties to be
Crutsinger (2003) had reported that college carried out in front end store operations will provide
graduates currently employed or planning to pursue an idea to the educators to guide and help develop
retail career expected enjoyable work, sense of these skills in the students who will be the
accomplishment, good pay and opportunities to prospective employees. So taking into consideration
develop new skills. Similar results were found by these facts it becomes vital to identify the job skills
Broadbridge et al. (2007) who highlighted that and job profile for store operations as the number of
students look for enjoyment from work, fairness, stores coming up in this part of world.
equality and tolerance. Determined to succeed,
Objectives of the Studypersonal goals and good pay were most important
factors for a retail job however, moving companies
The present study can be viewed as an attempt to and working long hours were least important. Hart
provide an in-depth perceptive of the students et al. (2007) found that there is mismatch between the
(prospective employees) and existing employees of supply and demand of requirements in retail jobs.
retail sector about the gap between students' They identified that the employers consider attitude
perception about the level of skills required and the gap and management skills gap in retail entrants in
actual level of skill required as mentioned by retail UK.
employees, so that students can develop the skills
and make themselves ready for the race. Having an The job experiences studied by various authors were
idea of the duties to be performed they can fulfill the general in nature. More specifically, Commins and
tasks well and contribute to the company's success Preston (1997) reported that job profile include
and their own career development once they are in maximizing sales, providing customer service,
the job. Keeping this in mind, the research is managing systems, controlling costs and enforcing
undertaken to throw light on the two considerations safety standards. As informed by undergraduates
ISSN (O) : 2456-6675, ISSN (P) : 0972-8058
35

of retail store jobs comprising of job skills and job experience in same sector were also included. 108
profile. More specifically the objectives are to – existing employees involved in store operations
were examined. Every sincere effort had been made
(a) to summarize the job skills required for retail by the researchers to avoid biasness in the selection
store operations; of respondents.
(b) to outline the job profile for retail store
Data Analysis, Interpretation and Result operations; and
Discussion(c) to identify the gaps in the perspective of
students (prospective employees) and present
The respondents were asked to give response employees for job skills and job profile.
regarding the skills required for the retail jobs and
the duties to be performed in stores. The collected Methodology
responses were coded and tabulated and then data
reduction technique (Factor Analysis) was applied to In order to achieve the stated objectives, a structured
extract the latent factors. In order to test the questionnaire comprising of the statements related to
significance level of the gaps between the opinions of job skills and job profile of retail store operations
both sets of respondents (students and retail was developed. The statements were drawn from
employees) student t-test was applied thereafter for previous researches which included the works of
skills and job profile.Gush (1996); Broadbridge et. al (2007); and Hurst
and Good (2009). The other statements were drawn
Job skillsfrom the authors' research including the skills
required and job profiles for retail store jobs
Factor Analysis was carried out to measure linear advertised on various Indian job websites. The
combination of some latent factors of job skills. purpose of this act was to include the different skills
Principal Component Analysis with Kaiser required and duties to be performed in a retail store
Normalization has been used as a method for job in Indian setting. This was done to capture the
obtaining the initial factors. Kaiser-Meyer-Olkin actual job skills and job profile as demanded by the
Measure of Sampling Adequacy test was applied Indian retailers. Likert type 5 point scale was used to
initially; the value came out to be 0.665 thereby gather the responses. For carrying out the pilot
hinting that the data is adequate. The value for survey, 28 and 35 statements related to job skills and
Bartlett's Test of Sphericity came out to be 545.166 at job profile respectively were included. The
0.000 significant level, which means that the questionnaire was finally sent to people who teach
correlation matrix is not identical hence fit for factor /practice retail store operations to check the validity.
analysis.The final version of the questionnaire included 13
statements of job skills and 14 statements of job
A total of six components were extracted from profile.
rotation matrix out of fourteen original variables.
Eigen values were 1.712, 1.705, 1.553, 1.371, 1.326 and The sample constituted retail stakeholders i.e.
1.264. These six extracted factors together account for students (prospective employee) and present
63.791 per cent of cumulative variance. Thus the six employees. Students included in the study were the
extracted factors are able to retain approximately 64 final year students with marketing specialization
per cent information. The nomenclatures of factors and pursuing their degrees in various Universities
were done on the bases of nature of the variables and Management Institutions in the state of
constituting factors.Haryana. In total 200 students were included in the
study. Retail employees with at least one year
ISSN (O) : 2456-6675, ISSN (P) : 0972-8058
36

63.79154.76445.29235.50224.40912.227Cumulative Percentage of Variance
9.0279.4729.79011.09412.18212.227Percentage of Variance
1.2641.3261.3711.5531.7051.712Eigenvalues
2.574Employees
2.755Students
.2001.285.658.785Require degree / course before the job(Broadbridge et al., 2007)
4.352Employees
.683.719Require leadership traits (Hurst & Good,2009)
4.233Students
.060-1.885
.671.782Entail to function as part of a team (Hurst & Good)
4.004Employees
.652.693Need interactive attitude
4.035Students
.7080.375
.724.817Require friendly nature
4.088Employees
.619.744Require creativity
4.188Students
.2091.259
.673.785Require motivating a team
.546.509Require good communication skills (Gush,1996)
3.602Employees
.568.635Require coordinating skills
4.332Students
.00012.05
5
.656.788Require good public speaking skills
.523.530Need analytical skills (Gush,1996)
.664.604Require computer handling skills 3.972Employees
.579.612Require good writing skills
3.610Students
.000-5.074
.715.801Require prior work experience
Prior Degree / Course
Leadership Skills
Interactive
Skills
Creativity Skills
Liasioning Skills
Technical Skills
MeanGroupsSig.
(2-tailed)
t-Value
sCommunalities
Factors
Items of Job skills
.000Sig.
545.166Approx. Chi-SquareBartlett's Test of Sphericity
.665Kaiser-Meyer-Olkin Measure of Sampling Adequacy.
.000Sig.
545.166Approx. Chi-SquareBartlett's Test of Sphericity
.665Kaiser-Meyer-Olkin Measure of Sampling Adequacy.
The six factors extracted are named as technical skills factor is explained by four original variables namely:
(factor 1), liasioning skills (factor 2), creativity skills require prior work experience, good writing skills,
(factor 3), interactive skills (factor 4), leadership computer handling skills and analytical skills with
skills (factor 5) and prior degree / course (factor 6). factor loadings of 0.801, 0.612, 0.604 and 0.530 and
Job skills explain the various skills required to each variable shares the variance as: 0.715, 0.579,
perform the jobs at retail stores. The aspirants (MBA 0.664 and 0.523 respectively. From the said table, it is
students) and existing store employees were asked also seen that both the samples (students as well as
about these skills and their differences in opinions employees) have opposite opinion as employees
were calculated afterwards. perceive that technical skills are importantly
required to perform retail job while students do not
Table 1 reveals the statistical matrix constituting think that way (based on the mean values which is
factor analysis and t-test. Technical skills (factor 1) 3.610 and 3.912 for students and employees
are found most contributing factor as it explains respectively). This difference is significant too as the
12.227 per cent variance to cumulative variance. This significance level of t-value (-5.074) is less than 0.05.
Source: Field SurveyNote: The items drawn from the literature, is mentioned in the parenthesis along with the items. Rests of the items are drawn from authors' research.
Table 1: Factors Determination and Comparing the Perception of Students Opted for Retail as Career Option
and Expectations of Retail Employees for Job skills
ISSN (O) : 2456-6675, ISSN (P) : 0972-8058
37

Prior work experience obviously makes a person than 0.05 the mean difference between the
more confident while performing a job than a fresh / employees and students are not found significant
non-experienced person and good writing skill though they seems opposite (mean value for
always makes a person more logical and presentable. students is 4.188 and for employees is 4.088) in
Today computer is an integral part of everything and opinions regarding the importance of creativity
retail is no exception. In retail too, it plays an skills. Retail job includes team spirits. To maintain
important role. Analytical skills enable the persons team spirit, motivational strategies and creativity is
to take right decisions and to tackle the unforeseen required. Hence, both ends should focus on
situations. Therefore, technical skills no doubt are developing this factor.
important and students should focus on these skills.
Interactive skill is found to be fourth factor pivotal
Second factor is liasioning skills constituting three for retail jobs in stores, comprising of two original
variables namely: require good public speaking variables namely: friendly nature and interactive
skills, coordinating skills and good communication attitude with factor loading 0.817 and 0.693 with
skills with factor loading 0.788, 0.635 and 0.509 communalities 0.724 and 0.652 respectively. It
respectively. It explains 12.182 per cent variance to explains 9.790 per cent variance to cumulative. The t-
cumulative. Retail job by nature is a liasioning job as value is 0.375 at level of significance 0.708. As the
the employees are continuously in contact with the significance value is greater than 0.05 the mean
customers. Therefore, this factor plays an important difference between the employees and students is
role. Each variable of this factor shares 0.656, 0.568 found insignificant for opinions regarding the
and 0.546 variance. Here too the employees and importance of interactive skills. Both the groups i.e.
students have opposite opinions as students think students and employees feel that interactive skills
that liasioning skills are more important while are necessary. To survive in intense competition
employees think that this skill is less important (the customer relations is an effective tool which can be
mean value for students is 4.332 and for employees it maintained by friendly nature and with interactive
is 3.602). This difference is also found significant, as attitude. Hence, again both ends should work on it.
the significant level of t-value (12.055) is less than
0.05. Retail employees need to take care of laisioning The next factor that comes out is leadership skills
skills. As they are not found very good in this skill comprising two original variables namely: function
while interacting with customers they are of the as part of team and leadership traits with factor
opinion that the jobs in store operations can do with loading 0.782 and 0.719 with communalities 0.671
less of laisioning with others. However, today's and 0.683 respectively. It explains 9.472 per cent
competitive environment demands such kind of variance to cumulative. The t-value is -1.885 at level
skills. The students who presently are the customers of significance 0.060 so the mean difference between
at retail stores feel that the employees should have the employees and students are not found significant
more of laisioning skills so that they can take care of regarding the importance of leadership skills in retail
the customers in a better way. store jobs. Both the samples feel that in retail jobs
leadership skills has its own significance.
Creativity skills comprising two original variables
namely: require motivating a team and creativity Last factor in relation to job skills is prior training
with factor loading 0.785 and 0.744 with comprising single original variables namely: prior
communalities 0.673 and 0.619 constitute the third training before job with factor loading 0.785 with
factor. It explains 11.094 per cent variance to communality 0.658. It explains 9.027 per cent
cumulative. The t-value is 1.259 at level of variance to cumulative. The t-value is 1.285 at 0.200
significance .209 as the significance value is greater levels of significance, as the significance value is
ISSN (O) : 2456-6675, ISSN (P) : 0972-8058
3
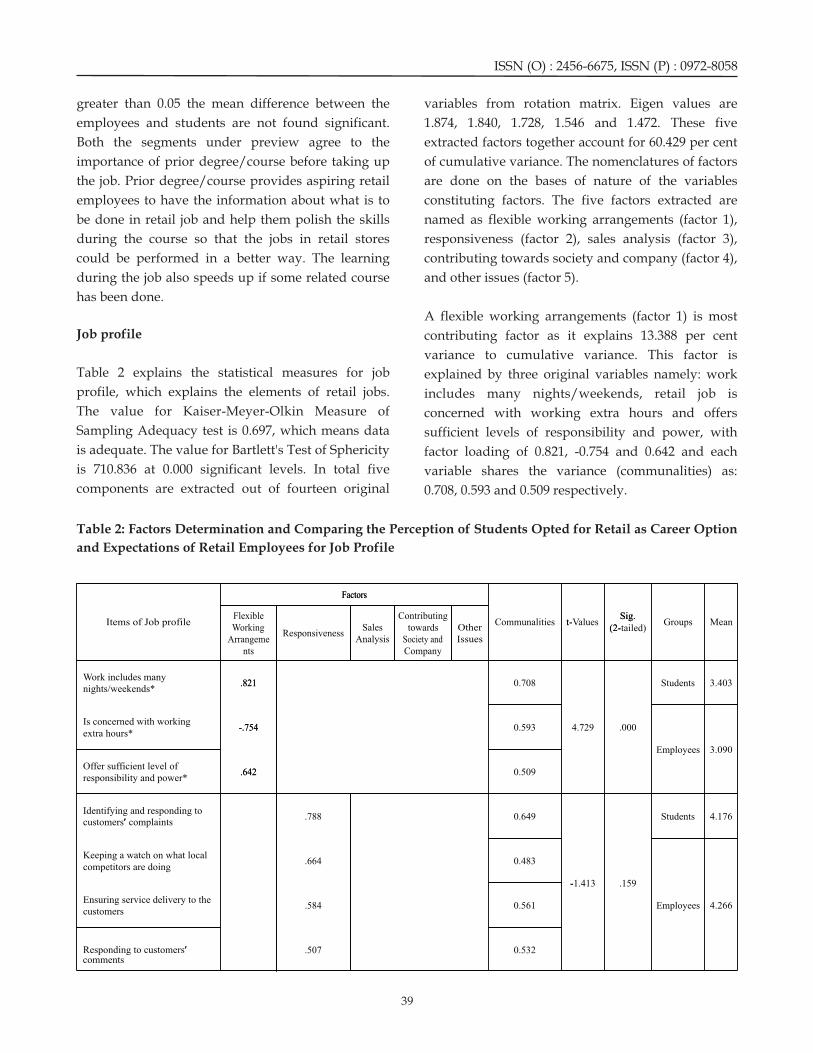
greater than 0.05 the mean difference between the variables from rotation matrix. Eigen values are
employees and students are not found significant. 1.874, 1.840, 1.728, 1.546 and 1.472. These five
Both the segments under preview agree to the extracted factors together account for 60.429 per cent
importance of prior degree/course before taking up of cumulative variance. The nomenclatures of factors
the job. Prior degree/course provides aspiring retail are done on the bases of nature of the variables
employees to have the information about what is to constituting factors. The five factors extracted are
be done in retail job and help them polish the skills named as flexible working arrangements (factor 1),
during the course so that the jobs in retail stores responsiveness (factor 2), sales analysis (factor 3),
could be performed in a better way. The learning contributing towards society and company (factor 4),
during the job also speeds up if some related course and other issues (factor 5).
has been done.
A flexible working arrangements (factor 1) is most
Job profile contributing factor as it explains 13.388 per cent
variance to cumulative variance. This factor is
Table 2 explains the statistical measures for job explained by three original variables namely: work
profile, which explains the elements of retail jobs. includes many nights/weekends, retail job is
The value for Kaiser-Meyer-Olkin Measure of concerned with working extra hours and offers
Sampling Adequacy test is 0.697, which means data sufficient levels of responsibility and power, with
is adequate. The value for Bartlett's Test of Sphericity factor loading of 0.821, -0.754 and 0.642 and each
is 710.836 at 0.000 significant levels. In total five variable shares the variance (communalities) as:
components are extracted out of fourteen original 0.708, 0.593 and 0.509 respectively.
Table 2: Factors Determination and Comparing the Perception of Students Opted for Retail as Career Option
and Expectations of Retail Employees for Job Profile
0.532.507Responding to customers’comments
0.561.584Ensuring service delivery to the customers
4.266Employees
0.483.664Keeping a watch on what local competitors are doing
4.176Students
.159-1.413
0.649.788Identifying and responding to customers’ complaints
0.509.642Offer sufficient level of responsibility and power*
3.090Employees
0.593-.754Is concerned with working extra hours*
3.403Students
.0004.729
0.708.821Work includes many nights/weekends*
Other Issues
Contributingtowards
Society and Company
Sales Analysis
Responsiveness
Flexible Working
Arrangements
MeanGroupsSig.
(2-tailed)t-ValuesCommunalities
Factors
Items of Job profile
’
-
’
.642
-.754
.821
Sig.(2-
t-
Factors
ISSN (O) : 2456-6675, ISSN (P) : 0972-8058
39

0.593.664Involve forecasting future sales volumes
3.975Employees
0.563.732Involve making key decisions about stock control
3.752Students
.003-2.959
0.637.779Is concerned with analyzing sales figures
-
60.42949.91838.87526.53213.388Cumulative Percentage of Variance
60.42949.91838.87526.53213.388Cumulative Percentage of Variance
10.51111.04312.34313.14413.388Percentage of Variance
1.4721.5461.7281.8401.874Eigenvalues
4.292Employees0.661.751Concerned with organizing special promotion display and events
3.903Students
.000-5.217
0.683.812
Involve dealing with staffing issues (interviewing potential staff, conducting appraisal, organizing training etc.)
4.218Employees0.611.750Give opportunities to contribute to company’s success*
4.060Students
.035-2.113
0.677.803Offer opportunity to make a contribution to society*
.751
-
.812
’
-
.000Sig.
710.836Approx. Chi-SquareBartlett's Test of Sphericity
.697Kaiser-Meyer-Olkin Measure of Sampling Adequacy.
.000Sig.
710.836Approx. Chi-SquareBartlett's Test of Sphericity
.697Kaiser-Meyer-Olkin Measure of Sampling Adequacy.
Source: Field Survey
*= Items are drawn from Hurst & Good, 2009 and rest of the items are drawn from authors' research
It is seen that the opinion regarding the flexible students need not worry regarding the odd timings.
working arrangements, both the samples (students
as well as employees) have opposite opinions. This Second factor is responsiveness constituting four
difference is found significant with t-value (4.729) variables namely: identifying and responding to
and significance level less than 0.05. customers' complaints, keeping a watch on what
local competitors are doing, ensuring service
The mean value for students is 3.403 and for delivery to customers and finally, responding to
employees mean value is 3.090. It means students customers' comments with factor loadings of 0.788,
agree that retail jobs include flexible working 0.64. 0.584 and 0.507 respectively. It explains 13.144
arrangements including nights and weekends, while per cent variance to cumulative. Retail job by nature
the employees think differently. Retail jobs by nature is a job where the employees are directly in contact
include timings, which are suitable to the customers. with customers. If the customer faces any problem or
The students feel that a retail store job may have provides any comment, it becomes imperative for
unsuitable work timings however, the employees the employees to respond to it and satisfy the
feel that the timings are flexible enough to be customers. Responding to customers would help
managed. It also offers sufficient levels of power and enhance the image and relationship. In marketing
responsibility to the retail employees. Hence, the one has to keep an eye on what the competitors are
ISSN (O) : 2456-6675, ISSN (P) : 0972-8058
40

doing and in retail it becomes even more important. satisfaction comes when the employee feels that the
The retailers have to frame their strategies in job he/she is doing is contributing to the society and
accordance to the competition. The retail employees company. The people who are involved in retail jobs
are involved in the responsiveness towards the i.e. retail employees has experienced that the retail
customers and local competition. Each variable of jobs offer satisfaction to them. However, the students
this factor shares 0.649, 0.483, 0.561 and 0.532 (prospective employees) feel differently. The
variance. This difference for students and employees students need to understand that the retail jobs will
is found non-significant, as the significant level of t- provide the satisfaction that they desire.
value (-1.413) is greater than 0.05. Retail employees
and the students understand the importance of Last factor is other issues comprising two original
responsiveness similarly. variables namely: dealing with staffing issues and
organizing special promotion displays and events
Sales analysis is third factor comprising of three with factor loadings of 0.812 and 0.751 with
original variables namely: concerned with analyzing communalities 0.683 and 0.661 respectively. It
sales figures, making key decisions about stock explains 10.511 per cent variance to cumulative. The
control and forecasting future sales volume with t-value is -5.213 at level of significance 0.000. As the
factor loading 0.779, 0.732 and 0.664 with significance value is less than 0.05, the mean
communalities 0.637, 0.563 and 0.593. It explains difference between the employees and students are
12.343 per cent variance to cumulative. The t-value is found significant and they are opinioned opposite
-2.959 at level of significance 0.003, which is less than too (mean value for students is 3.903 and for
0.05 indicating that both the respondents (employees employees is 4.292). Though these two variables are
and students) have opposite opinions regarding the opposite in nature but comprising one factor. Both
sales analysis. Every organization is directly the variables are important and form integral part of
concerned with sales figure and retail basically is a retail jobs in stores. Students feel that retail jobs are
sales based operation. Hence, this is a crucial less concerned with HR issues as well as
element. The retail employees more understand the promotional issues while the existing retail
importance of such element than the aspirants employees knows the importance of such issues.
(students) as the mean value for employees (3.975) is They opine that retail jobs are more concerned with
greater than mean value for students (3.752). HR issues and displaying products and events.
Conclusion and Policy ImplicationsContributing towards society and company is found
to be fourth factor comprising two original variables
The present study has identified the skills required namely: offer opportunity to make a contribution to
and duties to be performed in retail store jobs. society and give opportunities to contribute to
Various authors have defined the skills required for company's success with factor loading 0.803 and
retail jobs. However, all the studies are based in 0.750 with communalities 0.677 and 0.611
other nations especially the Western countries. No respectively. It explains 11.043 per cent variance to
study was found with Indian setting.cumulative. The t-value is -2.113 at level of
significance 0.035 (p<0.05). Thus the mean difference
With large number of retail jobs coming up in India between the employees and students is found
it is important to study the skills required in Indian significant and they seem opposite (mean value for
organized retail. The study has identified technical students is 4.060 and for employees is 4.218) in
skills, liasioning skills, creativity skills, interactive opinions regarding the contribution towards society
skills, leadership skills and prior training pivotal to and company. It is important for any job to give
retail job. The educators should help the students satisfaction. Apart from the other things, the
ISSN (O) : 2456-6675, ISSN (P) : 0972-8058
41
develop these skills so that the students do not face The retail store and aspiring employees will have to
any difficulty during retail job. Developing the skills understand the significance of the skills required and
will also help the students crack the right kind of job the kind of duties to be performed in retail store job,
in retail. They will be able to execute their jobs in so that the same can be done in effective and efficient
improved way. So, the students need to grow these manner. With so much of opportunities coming up
skills to become successful in retail sector. The in organized retail, it is up to the students how well
students should take care of developing technical they grab it.
skills during their degree course as they feel that less
REFERENCEStechnical skills are required for retail job.
1) Amin, M. (2008), “Labor regulation and Taking into consideration the Indian scenario, the
employment in India's retail store”, Retrieved on demand is more than supply, the existing employees
May 21, 2012, www.siteresources.worldbank.org feel that liasioning skills are not much relevant in
/SOCIALPROTECTION/Resources/SPDiscussiretail store jobs. The students, who have the
on-papers/labor-Market-DP/0816.pdf.experience of the retail customer, feel that liasioning
2) Broadbridge, A. (2001, 15 June), “Industry urged skills are more important as retail is customer
to improve image of retail as a career”, Retail oriented sector. The retail employees need to
Week, 39.inculcate these skills. Similarly, the students will
3) Broadbrigde, A. (2003), “Student perception of have to develop these skills so that they can have
retailing as a destination career”, International upper hand in their future job. Leadership skills are
Journal of Retail & Distribution Management, 31(6), required more as opined by the employees. Students
298-309.should sharpen the leadership skills and entail to
4) Broadbrigde, A., Maxwell, G.A. and Ogden, S.M. function as a part of team.
(2007), “Students' views of retail employment-
key findings from generation Ys”, International For the job profile, the study has identified flexible
Journal of Retail & Distribution Management, working arrangements, responsiveness, and sales
35(12), 982-992.analysis, contributing towards society and company,
5) Commins, J. and Preston, D. (1997), “The and other issues including HR issues and
attractiveness of retailing as a career for promotional displays and events as necessary part of
graduates: An update”, International Journal of a retail job. The students feel that retail job will
Retail and Distribution Management, 25(4), 120-5.provide them less opportunity to contribute towards
6) FDI in multibrand to boost organized retail in India, society and company. But the employees have
(2012, August 13), The Economic Times, Retrived reported that retail provide them opportunity to
September 11 2012, contribute towards society and company. This could
http://articles.economictimes.indiatimes.com/2be a motivating factor for students as they can pay
012-08-13/news/33182674_1_fdi-global-retail-back to the society and company which might
chains-gdp-growth.enhance their self-satisfaction. As far as other issues
7) Gush, J. (1996), “Graduates into the retail including HR issues and promotional displays and
industry: An assessment of the nature and events are concerned, the employees feel that these
causes of mismatches between the needs and are important part of retail job. However, the
expectations of the retail industry and its students feel the other way. The retail job will
graduate employees”, International Journal of provide the employees to show their creativity in
Retail & Distribution Management, 2(9), 5-12.organizing promotional displays and events. The
8) Hart Cathy, Grazyna B. Stachow, Andrew M. employees will have to indulge in HR activities also.
Farrell & Gary Reed, (2007),"Employer
ISSN (O) : 2456-6675, ISSN (P) : 0972-8058
42
perceptions of skills gaps in retail: Issues and 18) Swinyard, W.R., Langrehr, F.W. and Smith, S. M.
implications for UK retailers", International (1991), “The appeal of retailing as a career: a
Journal of Retail & Distribution Management, 35 (4), decade later”, Journal of Retailing, 67(4), 451-65.
271 – 288.
9) Hurst, J.L. and Good, L.K. (2009), “Generation Y
and career choice the impact of retail career
perceptions, expectations and entitlement
perceptions”, Career Development International,
14(6), 570-593.
10) Johlke, M. C., & Iyer, R. (2013), “A model of
retail job characteristics, employee role
ambiguity, external customer mind-set, and sales
performance”, Journal of Retailing and Consumer
Services, 20(1), 58-67.
11) Knight, D. and Crutsinger, K. (2003), Retain work
expectations and experiences: implications for
retaining college students in the university,
University of North Texas at Denton. Denton,
TX, unpublished manuscript.
12) Kumar Dileep M. and Jain, V. (2010), “Survival
skills of business management graduates: A
study with reference to retail and banking”, Far
East Journal of Psychology and Business, 1(1), 59-77.
13) McGauran, A.M. (2004), “Comparing student
employment in French and Irish retailing”,
International Journal of Retail & Distribution
Management, 32(5), 259-269.
14) Nickson, D., Warhurst, C., Commander, J.,
Hurrell, S. A., & Cullen, A. M. (2012), “Soft skills
and employability: Evidence from UK retail”,
Economic and Industrial Democracy, 33(1), 65-84.
15) Paulins, V.A. (2008), “Characteristics of retailing
internships contributing to students' reported
satisfaction with career development”, Journal of
Fashion Marketing and Management, 12(1), 105-
118.
16) Saunders M.N.K., Skinner D. and Beresford R.
(2005), “Mismatched perceptions and
expectations: an exploration of stakeholders'
views of key and technical skills in vocational
education and training”, Journal of European
Industrial Training, 29(5), 369-382.
17) Swinyard, W.R. (1981), “The appeal of retailing
as a career”, Journal of Retailing, 57(4), 86-97.
ISSN (O) : 2456-6675, ISSN (P) : 0972-8058
43
Role of Imparting Value Driven Soft Skills in Young Managers: An Empirical Study in The Indian Context
1Prof. Shalini Garg
2Shipra Sharma
1. Professor, University of School of Management Studies, GGSIP University, New Delhi, [email protected]. Research Scholar, University of School of Management Studies, GGSIP University, New Delhi,
[email protected] Author
Shipra Sharma, Research Scholar, University of School of Management Studies, GGSIP University, New Delhi, [email protected]
Effulgence
Vol. 15 No. 2
July-December, 2017
Rukmini Devi Institute of Advanced Studies
E-mail : [email protected], Website : www.rdias.ac.in
http://effulgence.rdias.ac.in/user/default.aspx
Abstract
The institutes are in constant pressure from the organizations to train students in a way that they are best fit for organizations.
These educational institutes often rigor themselves by upgrading curricula as well as pedagogy so as to impart best managerial
and technical skills to the students. Looking at today’s scenario although students have technical skills but they generally lacks
in soft skills which are essential for achieving peak performance in organizations and becoming good managers.
Therefore, this paper tries to investigate influence factors (Teachers and Institutes) in imparting value driven soft skills to these
budding managers. It also tries to demonstrate 4C’s (Collaboration, Creativity, Communication and Critical Thinking)
imparting Values to enhance the performance of young managers in organizations.
Schwartz Value Theory, Value based Pedagogy, value drive soft skills.Keywords:
understand the cultural dynamics within the INTRODUCTIONorganizations and make young managers fit for high
quality team work in order to achieve organizational rom many decades the field of management
performance. Thereby organizations insist B-schools Feducation is regularly under strain from to make changes in their pedagogy so as to match up
organizations to prepare the students in a way that with the requirements of companies.
they are employable and contribute their skills to the
organization and society as a whole. Today when However, the business world is constantly suffering
there is immense competition in every field, from unethical issues; this again brings B-Schools
organizations are too striving for finding a potential under deep thrift to impart pedagogy rich in
employee. Progressive companies are committed to delivering value to young minds. Institutions are
build and maintain high quality teams. These trying to make young manager's market ready by
organizations are demanding the institutions to delivering value driven soft skills and thus helping
ISSN (O) : 2456-6675, ISSN (P) : 0972-8058

them to achieve peak performance while at work. Creativity: Self Direction, Stimulation, Hedonism
Communication: Power, Security, Conformity
The paper is based on ten human values proposed Critical Thinking: Tradition, Achievement
by Schwartz's Value theory which acts as essential Collaboration: Benevolence, Universalism
soft skills for today's young leaders. These ten basic
personal values have been recognized by Schwartz's According to figure 1, each “C” comprises of certain
value survey and portrait values questionnaire on set of values which can be essential for today's
the basis of responses collected from 82 countries. budding leaders. Creativity can be referred as
The findings of Schwartz's value theory reveal that generation of ideas which helps in stimulating ones
there exists substantial difference in value priorities brain and making oneself open to adapt the dynamic
by individuals. These values are Self Direction, environment. Teachers, institutes and family
Stimulation, Hedonism, Achievement, Power, environment play a very vital role in building the
Security, Conformity, Tradition, Benevolence, and personality of a student. Teachers and family needs
Universalism which leads young managers to to understand the efficiency of young talents and
develop four C's (Collaboration, Creativity, Critical provide them with open atmosphere to discover new
Thinking and Communication) (Alan D., Greenberg, ventures and guiding them in a right direction
Andrew H. N. 2014) which are mandatory soft skills whenever required. This helps in building their
for a good manager to perform in the organization. analytical skills, problem solving skills; thereby
making them self directed and feel the pleasure in
Schwartz's Value Theory Driving Soft Skills whatever work they do.
Seetha, S. soft skills are essential people's skill; four Another “C” mostly required and looked forward by
C's are stated to be vital soft skills for building good recruiters is Communication. As per NEA (National
managers. When these skills are enriched with Education association) communication is the art to
values it modulates the personality, attitude and inform, construct, motivate and persuade an
behavior of an individual. individual. It reflects ones attitude, behavior and
values. The way one communicates indicates the
authority in speech (power), the clarity in speech
(conformity) and the sense of stability and security
in action. The teachers at various management
institutes have a social responsibility of training
students in a way that imparts such values to make
them good performers and successful leaders.
One cannot learn well without thinking well and
therefore, Critical Thinking is an essential
requirement for budding managers. Critical thinking
is referred as logical arrangement of ideas which is
greatly influenced by our traditions, beliefs.
Traditions and beliefs are learned by an individual
through their parents and surroundings. Over a Figure 1: Soft Skills Driven from Schwartz's Value course of time we normally experience, develops Theoryperceptual possessions and other prejudices which
are considered as barriers to effective These Successive values can have the close
communication. Teachers and parents have a great relationship with four C's:
Communication•Power•Security•Conformity
Creativity•Self Direction•Stimulation•Hedonism
Collaboration•Benevolence•Universalism
Critical Thinking•Tradition•Achievement
ISSN (O) : 2456-6675, ISSN (P) : 0972-8058
45
responsibility of nurturing these young minds in a exploring the ways crime can be prevented; it states
way that they do not develop negative possessions that crime prevention and justice can be brought to
and increase the inefficiency of decision. A clear and the society by eradicating poverty, and increasing
logical thought increase the occurrence of achieving access to health, education, water and energy. As
a set target; thereby giving a sense of achievement to criminal violence is taking a rising toll, [United
young leaders. Nations New Centre] UN report finds the causes of
recent increase in crime including social, economic
Today a great emphasis is laid on fourth “C” which and global issues can be prevented through
is Collaboration. The importance of collaboration is education.
not only seen by organizations but has also been
experienced by these management institutes. It can be depicted by UN report the solution to this
Organizations look for team work and thus crisis can be value education. Over past some many
pressurize the institutes to lay emphasis on years colleges and institutes are slogging their
developing the skills to work effectively and energy and resources to impart education reach in
respectfully with diverse teams. Thus, these values to meet the issues of respective countries.
institutes try to impart team building skills through Countries like India, Australia and Singapore lay a
their curriculum. strong emphasis on imparting value education
through well defined curricula and syllabi (Singh, A.
LITERATURE REVIEW 2011).Various researches have taken place which
attempts to analyze the impact of value education on
People who become great statesmen, successful academic performance. Thereby, attempts to build
business entrepreneurs, have something in common. young and dynamic managers.
They always strive to give their best for the benefit of
the society. But looking at the recent crisis it is Keeping in mind behavioral delinquencies and
believed that the youth is getting deprived of values. imparting value drive soft skills it becomes
Knowledge without values is not only useless but important to train teachers who are acting as an
can be dangerous (Jindal, J. 2013). When knowledge agent for social change ( Cubakcu,
is applied in a right direction as per the society F. 2013 Schools are not value free or Value neutral
norms they are said to be productive to global zones but plays a very vital role in shaping ones
economy. But when the same knowledge is applied character. According to Black, W. we sow an act and
for achieving self motives and unethical reap a habit; we sow a habit and reap a character; we
gratifications it becomes harmful for the society and sow a character and reap a destiny.
increases crime. Crime is basically defined as
something which is forbidden by law and is An individual behavior is influenced by its
punishable. Crime is committed due to a criminal surroundings, they first comes in contact with their
behavior in oneself which depends on individual, parents, teachers, friends (society) and climate at the
societal and ecological factors that are developed schools, colleges, university. Fyffe, L.R. 2006 explores
over a course of our lives (Richerson, P.J. 1991). the characteristics possessed by children who gain
Many young minds are driven by delinquencies and high scores on the Children's Values Profile
thus get involved in crimes like drug abuse, money compared with children who gain low scores on the
laundering, sexual assault, corruption and many instrument. (Sharma, S., Garg, S., Mittal, S. 2015)
more. This normally occurs due to unemployment or develop a conceptual model for imparting values in
low income to these young minds which get swayed young generations that involves parents, teachers,
away with the charms of criminal world and gets society and university. The course curriculum reach th involved in it. 13 United Nations Crime Congress is in moral teachings can modify the behavior of these
Seshadri, C. 2005).
ISSN (O) : 2456-6675, ISSN (P) : 0972-8058
46

young minds. ( et al, 2011).
METHODOLOGY OF STUDY
Objective
This empirical study tries to discover the influence of
teachers and universities or educational institutes
based on ten value of Schwartz Value Theory
helping in developing value based soft skills in alue budding manager. The research tries to demonstrate driven education. Value education does not mean 4C's (Collaboration, Creativity, Communication and value imposition or indoctrination. It helps to Critical Thinking) imparting Values to enhance the develop and demonstrate proper attitude, feelings performance of young managers in organizations.and behavior patterns at different situations (Reddy,
G.L., Thankachan, T.C, Shailaja, M. 2013). If we Sample Designcompare the value system of the modern society to
the prehistoric India we will find the huge difference The sample of 200 is collected both through a (Srivastava, A. 2013). In prehistoric phase an questionnaire and a field survey. The sample was individual was educated through Upanishads, based on random sampling which consisted of Vedas, and other literature sculptures, which kept teachers, students and head of institutes. The sample these individuals physically, emotionally and of students and teachers is collected through ecologically attached to the cultural ethos of the questionnaires from various B-schools in National society.Capital Region in India, trying to extract the impact
of influence factors on youngsters and indicate the Even parents play a vital role in shaping the importance of value based pedagogy for impacting character of a child. The first acquaintance of child value driven soft skills to young managers.since birth happens with his or her parents. Thus,
child grows looking at his or her parents and tries to Tools Usedimitate their behavior. It is importance for the
parents to understand the fact and behave in a The data measurement is based on ordinal level
manner that will help these young minds to grasp where the questionnaires are designed with the help
and inculcate right possessions. Parental of five point Likert Scale. The data is analyzed using
involvement is essential for children right from their multiple regression method to find out the influence
childhood to schooling and thereafter. (Steinberg, L., of independent variables (teachers and institutes) on
Lamborn, S.D. 1992) demonstrate the positive impact dependent variable (young leaders or students) and
of authoritative parenting on adolescent also tries to investigate whether 4C's are able to
achievement, however, is mediated by the positive deliver Schwartz's Values.
effect of authoritativeness on parental involvement The regression models are presented in the form:
in individual's growth. In today's world we have Y=β +β X + β X + Є0 1 1 2 2 houses with dual career couples have their own Where, Y represents students (young managers) as a career aspirations, but as per investigations such dependent variable.parents tend to gather job stress, family stress, role β is the regression constant0 ambiguity and conflicts (Jaitly, R. et al, 2015) which β , β are the partial regression coefficients for the three 1 2even affects child behavior. To avoid these stresses independent variables.the study suggests to have work-life balance (Soi, A.
Choudhuri, I. 2005) Traditional
literature of ancient India fabricates values in a way
that the gap between art and religion is reduced.
Young individuals enjoy reading literature in the
form of short stories and in the process they become
aware of cultural ethos and values.
The environment in the institute also helps these
youngsters to develop positive possessions. These
institutes' plays a very vital role in imparting v
ISSN (O) : 2456-6675, ISSN (P) : 0972-8058
47

RESEARCH HYPOTHESISX , X are the independent variables; teachers, 1 2
institutes respectively.
Hypothesis1a: Teachers and Institutes influence Є represents the error of prediction
student's (young leaders) personality and help them
inculcating value driven soft skills.
ANOVAb
Model Sum of Squares df Mean Square F Sig.
1 2 .040 .371 a.692
47 .108
Regression
Residual
Total 49
.080
5.086
5.166
a. Predictors: (Constant), Var3, Var1
b. Dependent Variable: Var2
Coefficientsa
B Std. Error Beta t Sig
1 (Constant) .000
Var1 .908
Var3
2.893
.021
.132
.611
.185
.155
.017
.123 .398
4.737
.116
.852
a. Dependent Variable: Var2
Table: 1
Regression equation: system prevailing in the institutes. Since, institutes
Y (students) = 2.893 + 0.017*teachers + are made up of its staff members thus we cannot
0.123*Institutes- - - - - - - - - (I) forget the role of teachers in building the personality
of their students. In together, two variables influence
From the above table (table: 1) Var1 signifies the personality of the student in order to impart
influence of Teachers, Var2 indicates influence on accurate value system.
students and Var3 represents influence factor
institutes. Since, Student is a dependent variable and In order to understand whether these values
thereby depends on independent variables teachers (Schwartz's Values) helps in imparting soft skills
and institutes. Regression equation (i) indicates the (Collaboration, Creativity, Communication and
positive impact of independent variables on the Critical Thinking) that can be essential to build good
students. As it is clear from the table (Var1 has β = performers and efficient leaders.c
0.017, t=0.116, p>0.05), (Var3 has β = 0.123, t=0.852, c
Let us consider Hypothesis 1b: 4C's are dependent p>0.05) . This signifies that the personality of the
on Value (Schwartz's Value) based Pedagogystudent is greatly impacted by the culture and value
ISSN (O) : 2456-6675, ISSN (P) : 0972-8058
48

Impart on Students
Table: 2
Variables V1 V2 V3 V4 V5 V6 V7 V8 V9 V10
Communication Creativity Collaboration Critical Thinking
Constant 1.843 1.871 1.804 1.694
V1 -0 .0 4
V2 -0 . 23
V3 0. 1 2*
V4 0 .2 2*
V5 0 .2 2*
V6 0 .2 2*
V7 0 . 09 *
V8 0 .1 0*
V9 -0.4
V10 0.13*
P value 0.08 0.07 0.07 0.04 0.04 0.04 0.05 0.05 0.08 0.08
F value 0.217 0.217 0.217 1.676 1.676 1.676 1.152 1.152 0.811 0.811
R square 0.035 0.035 0.035 0.218 0.218 0.218 0.161 0.161 0.119 0.119
Adjusted
R square
-0.126 -0.126 -0.126 0.088 0.088 0.088 0.021 0.021 -0.028 -0.028
D-W 1.74 1.74 1.74 2.08 2.08 2.08 1.515 1.515 2.30 2.30
* P <0.05 this also indicates that V1, V2 and V3 (Power,
Security and Conformity respectively) are not
This indicates values describing communication (as significant to Communication, V9 and V10 (that is
per figure: 1) are not accurately defining the Tradition and Achievement) are not significant to
personality of the students (V1 has β = -0.040, describe Critical Thinking. Whereas soft skills c
2 2 creativity and collaboration are well associated to Adjusted R = -0.126, V2 has β = -0.233 Adjusted R = c
2 values V4: Self Direction, V5: Stimulation, V6: -0.126 and V3 indicates β = 0.122, Adjusted R = -c
Hedonism and V7: Benevolence, V8: Universal ism 0.126) and the model is not an accurate fit. Although 2 and Institutes help in imparting value based soft V3 has positive Beta coefficient but adjusted R is
skills for achieving high performance and becoming negative which specifies that the model is not an good managers at organization.accurate fit. Similarly, V9 and V10 signifies negative
2 value for Beta coefficient and Adjusted R therefore,
Delivery by Teachers
Table: 3
Variables V1 V2 V3 V4 V5 V6 V7 V8 V9 V10
Communication Creativity Collaboration Critical Thinking
Constant 1.942 1.655 1.53 1.203
V1 - 0 .43
V2 0 . 6 8 *
V3 -0 . 1 3 3
ISSN (O) : 2456-6675, ISSN (P) : 0972-8058
49
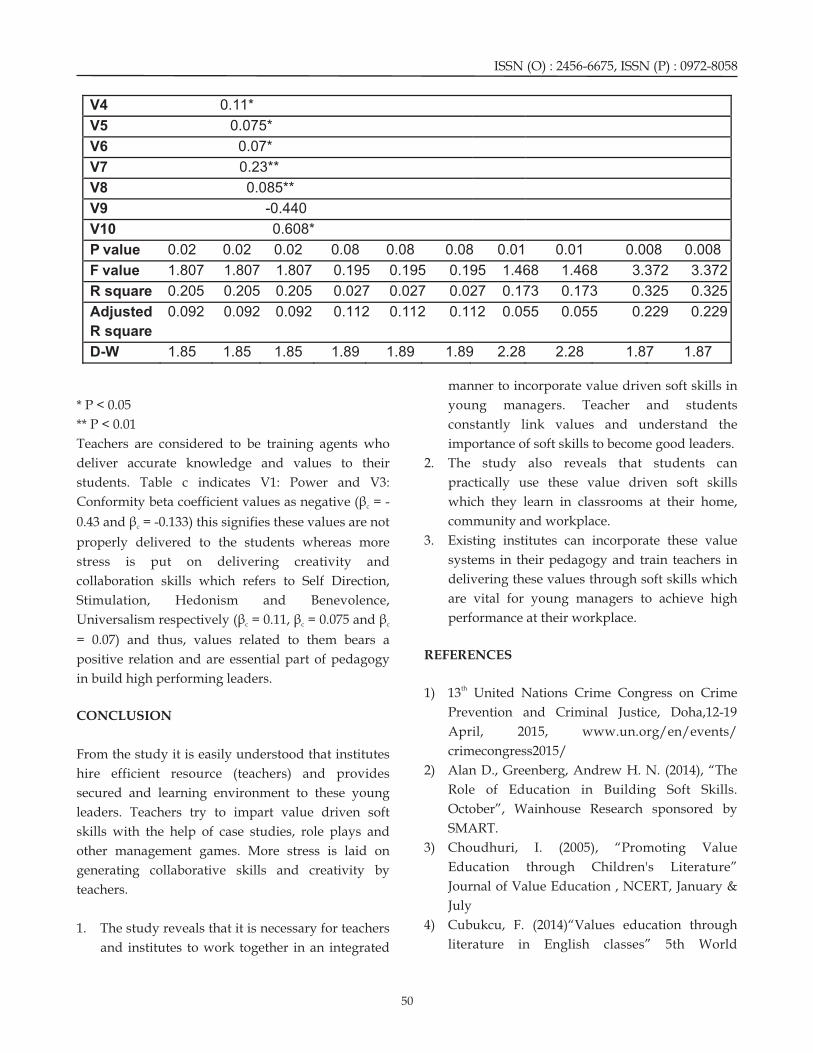
V4 0 . 11 *
V5 0. 0 75*
V6 0 . 07 *
V7 0 .23 * *
V8 0.0 8 5**
V9 -0 .440
V10 0.608*
P value 0.02 0.02 0.02 0.08 0.08 0.08 0.01 0.01 0.008 0.008
F value 1.807 1.807 1.807 0.195 0.195 0.195 1.468 1.468 3.372 3.372
R square 0.205 0.205 0.205 0.027 0.027 0.027 0.173 0.173 0.325 0.325
Adjusted
R square
0.092 0.092 0.092 0.112 0.112 0.112 0.055 0.055 0.229 0.229
D-W 1.85 1.85 1.85 1.89 1.89 1.89 2.28 2.28 1.87 1.87
manner to incorporate value driven soft skills in
* P < 0.05 young managers. Teacher and students
** P < 0.01 constantly link values and understand the
Teachers are considered to be training agents who importance of soft skills to become good leaders.
deliver accurate knowledge and values to their 2. The study also reveals that students can
students. Table c indicates V1: Power and V3: practically use these value driven soft skills
Conformity beta coefficient values as negative (β = - which they learn in classrooms at their home, c
community and workplace.0.43 and β = -0.133) this signifies these values are not c
3. Existing institutes can incorporate these value properly delivered to the students whereas more
systems in their pedagogy and train teachers in stress is put on delivering creativity and
delivering these values through soft skills which collaboration skills which refers to Self Direction,
are vital for young managers to achieve high Stimulation, Hedonism and Benevolence,
performance at their workplace.Universalism respectively (β = 0.11, β = 0.075 and β c c c
= 0.07) and thus, values related to them bears a REFERENCESpositive relation and are essential part of pedagogy
in build high performing leaders.
CONCLUSION
From the study it is easily understood that institutes
hire efficient resource (teachers) and provides
secured and learning environment to these young
leaders. Teachers try to impart value driven soft
skills with the help of case studies, role plays and
other management games. More stress is laid on
generating collaborative skills and creativity by
teachers.
1. The study reveals that it is necessary for teachers
and institutes to work together in an integrated
th1) 13 United Nations Crime Congress on Crime
Prevention and Criminal Justice, Doha,12-19
April, 2015, www.un.org/en/events/
crimecongress2015/
2) Alan D., Greenberg, Andrew H. N. (2014), “The
Role of Education in Building Soft Skills.
October”, Wainhouse Research sponsored by
SMART.
3) Choudhuri, I. (2005), “Promoting Value
Education through Children's Literature”
Journal of Value Education , NCERT, January &
July
4) Cubukcu, F. (2014)“Values education through
literature in English classes” 5th World
ISSN (O) : 2456-6675, ISSN (P) : 0972-8058
50

Conference Educational Sciences – WCES 2013 12) Seetha, S. “Necessity of Soft Skills Training for
Procedia - Social and Behavioral Sciences 116 265 students and professionals” International
– 269 Journal of Engineering, Business and Enterprise
5) Fyffe, L.R. (2006) “An Investigation of Primary Applications (IJEBEA) ISSN (Print)- 2279-0020,
School Children with High and Low Values ISSN (Online)- 2279-0039
Scores and the Development of an Instrument to 13) Seshadri, C. (2005), “An Approach to Value
Measure Children's Values” Dissertation Report, Orientation of Teachers' Education”, Journal Of
Griffith University Value Ducation January & July 6) Jaitly, R., Rana, T., Sharma, R. (2015). Work-Life 14) Sharma, S., Garg, S., Mittal, S.
Loyalties: A New Outlook for Dual Career (2015),“Empowering Youth by Value Based
Couples.” Effulgence, Vol. 13, No. 1, January- Education: A Conceptual Framework”
June ISSN No. 0972-8058 Broombury Publications, University School of
7) Jindal, J. (2013), “Value Based Education -- Need Management Studies, Indraprastha University
of the Day”, September International Journal of (February) ISBN: 978-93-84898-78-6 (Printed
Emerging Research in Management copies for internal circulation).unprme.org/
&Technology ISSN: 2278-9359 (Volume-2, Issue- 15) Singh, A. “Evaluating the Impacts of Value
9) Education: Some Case Studies”, International
8) National education Association, “ An Educators Journal of Educational Planning & stguide to four C's” Preparing 21 Century Administration Volume 1, Number 1, pp. 1-8
Students for Global Society. 16) Soi, A., Agrawal, A., Massey, S. (2011). Work-
wwwnea.org/assets/docs/A-Guide-to-Four- Life Balance. Effulgence, Vol. 9, No. 2, July-
Cs.pdf December. ISSN No. 0972-8058
9) Reddy, G.L., Thankachan, T.C.,, Shailaj, M. 17) Srivastava, A. (2013), “Value Education: Past and
(2013), “Value Processing Skills Of Secondary Present” Voice of Research Vol. 2, Issue 3
School Students With Respect To Their Gender December ISSN No. 2277-7733
And Religion”, Innovative Thoughts 18) Steinberg, L., Lamborn, S.D., Dornbusch, S.M.,
International Research Journal ISSN 2321-5453 Darling, N. “Impart of Parenting Practices on
Volume 1, Issue 1, August. Adolescence Achievement, Authoritative
10) Richerson, P., Mulder, M.B., Vila, B. “Principles Parenting, Schools Involvement and
Of Human Ecology-Principles for Responsible Encouragement to succeed Child Development,
Management Education: PRME, Six Principles, 1992, 63, 12661-1281
www.unprme.org
11) Schwartz,S.H. (2006) “An Overview of the
Schwartz Theory of Basic Values”
ISSN (O) : 2456-6675, ISSN (P) : 0972-8058
51

CSR Activities and Responsibilities by FMCG Companies of India: A Customer Perspective
Shivani Raheja
Assistant Professor, Aryabhatta College, University of Delhi, Email-id: [email protected]
Effulgence
Vol. 15 No. 2
July-December, 2017
Rukmini Devi Institute of Advanced Studies
E-mail : [email protected], Website : www.rdias.ac.in
http://effulgence.rdias.ac.in/user/default.aspx
Abstract
Corporate Social Responsibility is a strategic weapon that is often used by the corporates as per the whims and fantasies of board
and managers to project the image of being a ‘Good Corporate citizen’. It can be used as a marketing tool, wherein the Corporates
use CSR as the basis of Segmenting, Targeting and Positioning (STP) in order to decide their social initiatives. They Segment
the CSR domain broadly in three Segments Planet, People, Profit and specifically in ten areas as per the basis of various areas/
themes listed in schedule VII of the Company’s Act 2013. Managers then carefully identify and target the areas, to show the
concern towards Planet, People and Profit by way of meeting Triple Bottom Line (TBL). But, are the customers supportive of
these CSR initiatives taken up the Corporates, while making purchases? Numerous researches have proved that focussed CSR
initiatives improve the financial health of the companies but a very less number of significant studies have been done in Indian
Context to check the end consumers’ understanding and perception about CSR. The biggest challenge for the managers lies in
the core of identifying a mechanism to explain “where to spend” and “how to communicate”?
This paper is a partial submission of the research work done under Ph.D. requirement in the specified topic. This research paper
is a contributory part of the major study done under the Ph. D submission requirements of the author. In this paper, the author
has tried to explain the CSR from the consumer’s perception, what FMCG companies in India do in the name of such CSR
practises, an attempt has been made to check whether the consumers are supportive of such CSR practises and finally to identify
the gaps between what companies does and what the consumers expect.
Corporate Social Responsibility, Strategic Weapon, Corporate Citizen, Corporate Conscience, Social Performance,
Sustainability Strategy, CSR Practices, Segmenting, Targeting and Positioning, Company’s Act 2013, Triple Bottom Line,
Profitability, Consumer’s Perception, FMCG, India.
Keywords:
ISSN (O) : 2456-6675, ISSN (P) : 0972-8058

(People, Planet, Profit).INTRODUCTION
"The social responsibility of business encompasses SR in India is a relatively new term as
the economic, legal, ethical and discretionary Ccompared with rest of the world. Globally, expectations that a society has of organizations at a
different authors have defined it in different ways. given point in time." -Caroll
On the basis of the works done by different authors,
CSR is effectively known as one of the following by
the stakeholders of the business: corporate
citizenship, corporate conscience, social
performance, or sustainable responsible business,
but what it actually means is a practice of corporate
self-regulation integrated into its business model.
Fig 1 : Customer Perception and CSR
Fig: 2 Carroll's PyramidSource: Adapted from Luo & Bhattacharya, 2006
The literature has identified five major dimensions of Looking at a larger picture of this, Corporate Social CSR: the consumers, the employees, the Responsibility is concerned with treating the shareholders, the society and the environment, stakeholders of a company or institution ethically or among others. However, promoting creativity, green in a responsible manner (acceptable according to production, optimum utilization of resources, international norms) and the Stakeholders exist both finding value generating solution for the within a firm or institution and outside. Corporate environmental and other societal problems is yet citizenship is all about the extent to which the another way of contributing towards society, and businesses meet legal, ethical and economic has emerged as the contemporary CSR dimensions. responsibilities ranging from Elementary initiatives The CSR initiatives taken up by firms are generally to Innovative Techniques and finally to similar types of projects often regarded as the pet Transforming strategies. Corporate Conscience projects. The flaunted CSR initiatives by firms are simply states that the corporates though are artificial generally short lived & ornamental as they usually entities but should be morally responsible persons. offer minimal benefits to the business, society or The term Social performance is all inclusive of the nation at large. Hence, the biggest challenge for the firm's economic, financial and environmental corporates lies in identifying the areas of “where to responsibility. CSR is a process to achieve spend” and methods for “how to communicate”?sustainable development in societies and thus the
notion of Sustainable responsible business directs the Many FMCG companies like Dabur India, Emami. firms to go green and meet the. triple bottom line Marico, Tat Beverages etc. are known for their
ISSN (O) : 2456-6675, ISSN (P) : 0972-8058
53

projects dedicated to women and children sanitation quality, reduced carbon footprints, rain water
and empowerment (mortality, education, health, harvesting, reduced water wastages, etc).
malnutrition, protection, equality, fair wages etc.).
ITC: Focuses on Triple Bottom Line contributing to Despite all this, there is a little impact on their brand
the growth of economy, environment and social image and sales, due to ill fit CSR initiatives chosen
development, raising agricultural productivity, by the firms.
education, social & environmental initiatives,
Various initiatives by FMCG companies can be managing water soil level and forest resources, e-
summarised as follows: choupal etc.
Nestle: Creating shared value (environmental Britannia Industries Ltd: Corporate Citizenship,
protection & community services). 'creating shared social development, improving quality of work life
value' is a very different approach to CSR, because it of its people, health and family welfare programs,
is not focused on meeting a set of standard external clean drinking water, free education to poor etc.
criteria, or on philanthropy (by educating and
imparting work skills to farmers, consuming lesser Let us now have a look at the CSR report card of the
water and energy and producing fewer green hose top Indian corporates (India's top companies are
gases, providing high quality products with good ranked 1-100 based on Net Sales for the Financial
services, adopting best business practises etc). Year 2012) as per the same survey.
Coca Cola: Environment protection, food safety &
Table 1
ISSN (O) : 2456-6675, ISSN (P) : 0972-8058
54

ISSN (O) : 2456-6675, ISSN (P) : 0972-8058
55
source: http://forbesindia.com/article/real-issue/csr-report-card-where-companies-stand/34893/1

According to the CSR India Index 2012, the top 10 developments in Western developed countries, such
private sector companies put together made a total as the United States of America (USA) and the
of INR 734 billion in profit-after-tax for the financial United Kingdom (UK) (Chambers et al. 2003) and it
year 2011-12 and CSR spend was only INR 6.9 billion is unclear whether it translates easily into
instead of INR 14.67 billion (less than half of what is developing and non-Western countries. There exist
mandated in the company law i.e. 2% of net-profit). gaps between developed and developing countries
when CSR is implemented (Chambers et al. 2003;
LITERATURE REVIEW Matten and Moon 2004; Chapple and Moon 2005;
Visser 2007). Writers such as Edmondson and
Business philanthropy in India has developed in Carroll (1999), Burton et al. (2000) and Khan (2005),
four phases. During the early years of have suggested that different cultural models and
industrialization (1850-1914), CSR in India was traditional customs may mean that a great deal of
predominantly related to business philanthropy, as what is currently understood about CSR may not be
rich business families set up trusts and institutions applicable in developing countries such as India or
such as schools, colleges, and hospitals. Gandhi, Sri Lanka.
Nehru, Friedman, and Freeman respectively were
champions of these four models. In the ethical model For this reason, the theory and practice of CSR in
the focus is on ''voluntary commitment by developing countries such as needs to be discussed
companies to public welfare'', in the Statist model, and debated at length and there is a need to examine
''state ownership and legal requirements determine whether prevailing Western notions of CSR can be
corporate responsibilities'', in the liberal model implemented in developing countries (Jamali 2007),
''corporate responsibilities are limited to private and whether CSR has positive business benefits
owners'', and in the stakeholder model ''companies (Dutta and Durgamohan 2008). Although various
respond to the needs of stakeholders – customers, stakeholders have pushed companies to implement
employees, communities, etc.'' (Kumar et al., 2001, p. CSR in developing countries, it seems many firms do
2). By the late 1980s, CSR had attracted worldwide not have sufficient knowledge to actualize it
attention and several scholars had determined that (Fernando 2007). Moreover, there are no accepted
socially responsible companies enjoy a number of rules in developing countries to enforce stakeholder
benefits. These include profitability factors, such as demands (Chambers et al. 2003; Blowfield 2004;
achieving a competitive advantage (Smith 1994; Chapple and Moon 2005; Thorpe and Prakash-Mani
Porter and Kramer 2002); generating a positive 2006; Visser 2008). Others suggest that manager's
corporate image (Smith and Stodghill 1994); lack of understanding about the benefits of CSR
attracting and retaining the best employees (Turban inhibits its implementation (Fernando 2007; Agarwal
and Greening 1997); and enhancing customers' 2008).
loyalty by increasing their general estimation of the
company (Brown and Dacin 1997). Since the There has been a significant increase in interest in
liberalization of the Indian economy in 1991, CSR in recent years. One study found that more than
western-style ethical stances are being promoted 80% of the Fortune 500 companies address CSR
hence even though the ethical, statist, and issues (Bhattacharya and Sen, 2004). According to
stakeholder models may be ''idealized'', the liberal Assocham Eco Pulse (2010–11), the maximum CSR
(Friedman) model may be more influential in India, initiatives have been undertaken by almost 52
according to some authors (Balasubramanian et al., companies in FMCG and consumer durable
2005). contributing a share of 13.11 per cent. Despite all this
the FMCG sector has yet not focused too much into
The practice of CSR has been dominated by the social responsibility domain.
ISSN (O) : 2456-6675, ISSN (P) : 0972-8058
56

ISSN (O) : 2456-6675, ISSN (P) : 0972-8058
57
Table 2: Dimensions of Corporate Social responsibility
Source: Adapted from M Šontaitė- Petkevičienė, 2015
CSR and Customer Orientation in the 21st century and community sectors nationally and
internationally.
The following statement of Horrigan (2007) best
portrays the status of CSR at the end of 21st century's Despite that our research target one specific
first decade: Both the developed and developing stakeholder category (the customers) any CSR
worlds are rapidly reaching the point where they activity that increases some aspect of customer
must decide if today's global CSR movement is a satisfaction also positively affect employees (and
passing social fad, a threat to economically efficient their families), the local community, and the society
corporate capitalism, an intrinsic element of at large. Researches have confirmed the impact of
corporate responsibility, or even a key to humanity's the corporates' CSR activities on the consumer's
long-term survival. CSR literacy is quickly becoming attitude, behaviour and hence the purchase
a primary imperative for a variety of actors in a decisions.
multiplicity of roles across governmental, business,
ISSN (O) : 2456-6675, ISSN (P) : 0972-8058
58
CSR Trends in India Research Methodology
FY 2015-16 witnessed a 28 percent growth in CSR The study design is exploratory and descriptive in
spending in comparison to FY 2014-2015. Prime nature and is based on a field survey of FMCG
Minister's Relief Fund saw an increase of 418 percent consumers.
from Rs 1.68 billion in 2014-15 to Rs 7.01 billion in
Data Collection Method2015-16 The CSR spend of listed companies in India
reached Rs 83.45 billion.
Both primary and secondary data sources have been
Research Objective used to collect data & answer research questions.
Primary data mainly is obtained through the
To study the Customer behaviour and Corporate administering of questionnaires while secondary
Responsibility Activities for Indian Consumers sources like past studies and archives were accessed
(Carroll's Pyramid). For Testing the above objective from various databases.
the following Hypothesis were made.
Selection of Sample
Hypothesis
The data was collected in the financial year 2015 – H01: There is no significant difference between 2016. 800 questionnaires were distributed in the customer behavior and economic Corporate entire survey spread over 11 months from May 2015 Responsibility Activities for Indian Consumers. – March 2016, out of which in all 564 were returned HA1: There is significant difference between representing a response rate of 70.5%. Some customer behavior and economic Corporate questionnaires were incomplete and were not Responsibility Activities for Indian Consumers. included in the final sample. The final sample H02: There is no significant difference between consisted of 468 usable questionnaires.customer behavior and legal Corporate
Responsibility Activities for Indian Consumers. STATISTICAL TOOLS AND TESTS USED
HA2: There is significant difference between
customer behavior and legal Corporate (a) Reliability Coefficient Cronbach's alpha
(b) KMO and Barrlett's Test Responsibility Activities for Indian Consumers.
(c) Weighted meanH03: There is no significant difference between
(d) Coefficient of Correlationcustomer behavior and ethical Corporate (e) Multiple Regression AnalysisResponsibility Activities for Indian Consumers.(f) Beta Coefficient of Regression equationsHA3: There is significant difference between (g) Factor Analysiscustomer behavior and ethical Corporate (h) Kruskal – Wallis test, Chi – Square test and Responsibility Activities for Indian Consumers.
Mann – Whitney U test, Wilcoxon – W and Z - H04: There is no significant difference between test for Hypothesis Testing.
customer behavior and philanthropic Corporate
Responsibility Activities for Indian Consumers.
HA4: There is significant difference between
customer behavior and philanthropic Corporate
Responsibility Activities for Indian Consumers.
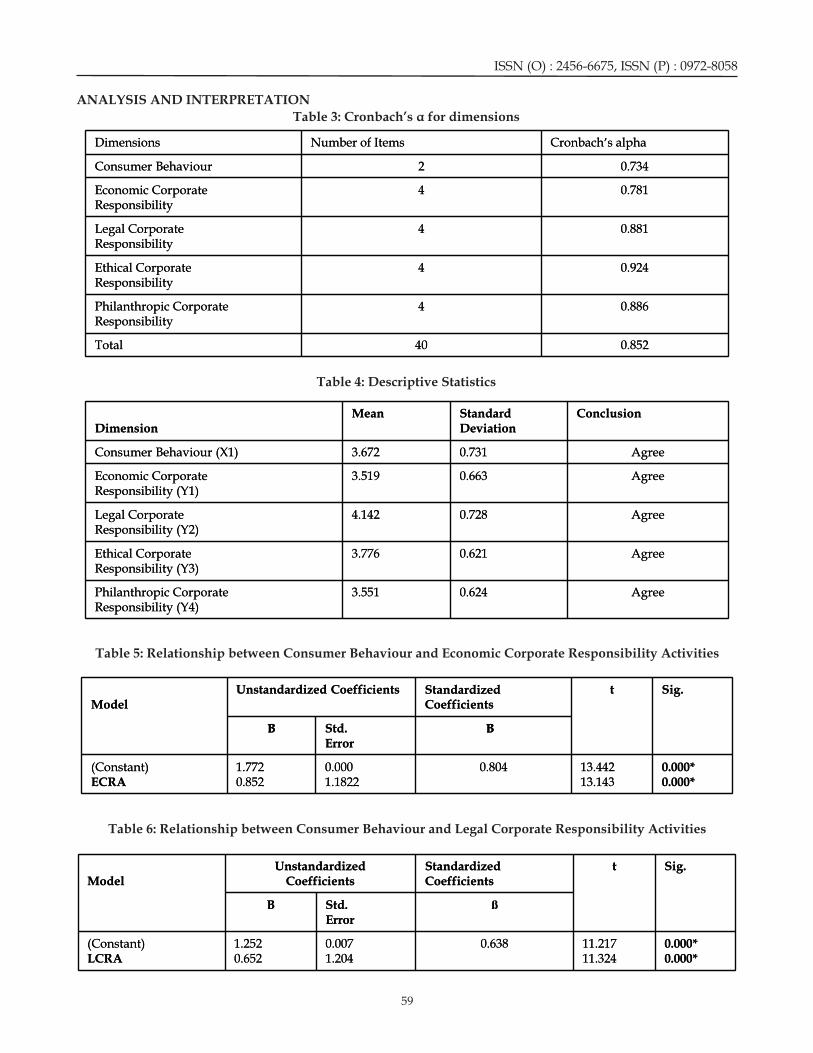
ANALYSIS AND INTERPRETATION
Table 3: Cronbach’s α for dimensions
ISSN (O) : 2456-6675, ISSN (P) : 0972-8058
0.000*0.000*
11.21711.324
0.6380.0071.204
1.2520.652
(Constant)LCRA
ßStd.Error
B
Sig.tStandardizedCoefficients
UnstandardizedCoefficientsModel
0.000*0.000*
11.21711.324
0.6380.0071.204
1.2520.652
(Constant)LCRA
ßStd.Error
B
Sig.tStandardizedCoefficients
UnstandardizedCoefficientsModel
0.000*0.000*
13.44213.143
0.8040.0001.1822
1.7720.852
(Constant)ECRA
Std.Error
Sig.tStandardized Coefficients
Unstandardized CoefficientsModel
0.000*0.000*
13.44213.143
0.8040.0001.1822
1.7720.852
(Constant)ECRA
Std.Error
BBB BBB
Sig.tStandardized Coefficients
Unstandardized CoefficientsModel
Agree0.6243.551Philanthropic CorporateResponsibility (Y4)
Agree0.6213.776Ethical CorporateResponsibility (Y3)
Agree0.7284.142Legal CorporateResponsibility (Y2)
Agree0.6633.519Economic CorporateResponsibility (Y1)
Agree0.7313.672Consumer Behaviour (X1)
ConclusionStandardDeviation
MeanDimension
Agree0.6243.551Philanthropic CorporateResponsibility (Y4)
Agree0.6213.776Ethical CorporateResponsibility (Y3)
Agree0.7284.142Legal CorporateResponsibility (Y2)
Agree0.6633.519Economic CorporateResponsibility (Y1)
Agree0.7313.672Consumer Behaviour (X1)
ConclusionStandardDeviation
MeanDimension
0.85240Total
0.8864Philanthropic CorporateResponsibility
0.9244Ethical CorporateResponsibility
0.8814Legal CorporateResponsibility
0.7814Economic CorporateResponsibility
0.7342Consumer Behaviour
Cronbach’s alphaNumber of ItemsDimensions
0.85240Total
0.8864Philanthropic CorporateResponsibility
0.9244Ethical CorporateResponsibility
0.8814Legal CorporateResponsibility
0.7814Economic CorporateResponsibility
0.7342Consumer Behaviour
Cronbach’s alphaNumber of ItemsDimensions
Table 4: Descriptive Statistics
Table 5: Relationship between Consumer Behaviour and Economic Corporate Responsibility Activities
Table 6: Relationship between Consumer Behaviour and Legal Corporate Responsibility Activities
59

Table 7: Relationship between Consumer Behaviour and Ethical Corporate Responsibility Activities
0.000*0.000*
11.41414.416
0.9420.18411.415
1.4170.984
(Constant)PCRA
Std.Error
B B
Sig.tStandardizedCoefficients
UnstandardizedCoefficientsModel
0.000*0.000*
11.41414.416
0.9420.18411.415
1.4170.984
(Constant)PCRA
Std.Error
B B
Sig.tStandardizedCoefficients
UnstandardizedCoefficientsModel
0.000*0.000*
14.72414.416
0.9420.44711.204
1.2490.952
(Constant)ETCRA
ßStd.Error
B
Sig.tStandardizedCoefficients
UnstandardizedCoefficientsModel
0.000*0.000*
14.72414.416
0.9420.44711.204
1.2490.952
(Constant)ETCRA
ßStd.Error
B
Sig.tStandardizedCoefficients
UnstandardizedCoefficientsModel
Table 8: Relationship between Consumer Behaviour and Philanthropic Corporate Responsibility Activities
1. The null hypothesis was rejected as the study targeting and positioning themselves in the CSR
proved that there is significant relationship domain to project the right social image and needs to
between customer behavior and Economic be selective while going for social initiatives. The
Corporate Responsibility Activities for Indian CSR must be viewed from the eyes of the consumers.
Consumers. Self-satisfying/superlative moves enacted under the
2. Alternative Hypothesis was accepted and a pretext of CSR initiatives may prove detrimental for
significant relationship between customer the growth and the reputation for the company.
behaviour and Legal Corporate Responsibility There is a need to understand what is required and
Activities for Indian Consumers was found. is important from customer's point of view. The
3. Thus, null hypothesis was rejected and initiatives well associated and valued by customers
alternative hypothesis was accepted. So, there is enhances the brand image of the organization in the
significant relationship between customer eyes of its customers and increases manifold the
behavior and Ethical Corporate Responsibility loyalty of the customers towards the firm (Raheja
Activities for Indian Consumers. Shivani, 2017). Also, socially motivated proactive
4. The study found that there is a significant moves need to be rightly supplemented by a
relationship between customer behavior and cautious effort of marketing and communicating the
Philanthropic Corporate Responsibility same to its customers. However, the bottom line is
Activities for Indian Consumers. that the CSR initiatives in India are now seriously
taken by many companies. Especially for the FMCG
CONCLUSION companies, where the major challenge is reduction of
packaging materials, these companies are doing
Customers are involved in rational purchase work in the field of Environment, Health care,
decisions, technology allows the common man to Education, Community welfare, Women's
access information and interpret it wisely. Doing empowerment and Girl Child care. Leading FMCG
anything in the name of CSR is certainly not going to companies fail to leverage their web sites in terms of
work for the organizations (Raheja Shivani, 2014). educating the consumers about their CSR intent and
Corporates need to be carefully segmenting, activities. Another interesting study highlighted that
ISSN (O) : 2456-6675, ISSN (P) : 0972-8058
60
ISSN (O) : 2456-6675, ISSN (P) : 0972-8058
61
the consumers expect firms to be involved in social conceptual model of corporate social
initiatives and may reward them for their efforts performance. Academy of Management Review,
through their positive purchase behaviour. 4, pp. 497–505.
Handpicked CSR projects will not just enhance the 10) Carroll, A.B. (1999). Corporate social
responsibility: evolution of a definitional company's goodwill manifold but will certainly
construct. Business and Society, 38, pp. 268–295.bring a positive shift in the sales and long term
11) Carroll, A.B. (2008). A history of corporate social profitability/sustainability of the firm. The effect of
responsibility: concepts and practices. In Crane, CSR spending can be studied with other financial
A., McWilliams, A., Matten, D., Moon, J. and measures to judge its effect on overall profitability,
Siegel, D. (eds), The Oxford Handbook of share prices (Sapra Ritu, 2016) etc.
Corporate Social Responsibility. Oxford: Oxford
REFERENCES University Press, pp. 19–46.
12) Chambers, E, Chapple, W, Moon, J & Sullivan, M
1) Bhattacharya C. and Sen S. (2004) Doing Better at 2003, 'CSR in Asia: A seven country study of CSR
Doing Good: When, Why and How Consumers website reporting'.
Respond to Corporate Social Initiatives 13) Chapple, W., and Moon, J. 2005. 'Corporate
California Management Review 47(1), 9-25. Social Responsibility in Asia: A Seven-Country
2) Brown, Tom J. and Peter A. Dacin. 1997. “The Study of CSR Web Site Reporting'. Business &
Company and the Product: Corporate Society, 44(4): 415–41.
Associations and Consumer Product Responses.” 14) Du, Bhattacharya, C. B., & Sen, S. (2010).
Journal of Marketing 61 (January): 68-85. Maximizing Business Returns to Corporate
3) Burton B. and Goldsby M. (2009) Corporate Social Responsibility (CSR): The Role of CSR
Social Responsibility Orientation, Goals and Communication. International Journal of
Behaviour: A Study of Small Business Owners Management Reviews, 12(1), 8-19.
Business & Society 48(1), 88-104. 15) Dutta, K., &Durgamohan, M. (2008). Corporate
4) Burton, BK, Farh, JL & Hegarty, WH 2000, 'A Social Strategy: Relevance and pertinence in the
cross-cultural comparison of corporate social Indian context. Institute for international
responsibility orientation: Hong Kong vs. United management and technology.
States students', Teaching Business Ethics, vol. 4, http://www.iitk.ac.in/infocell/announce/conv
no. 2, pp. 151-67. ention/papers/Industrial%20Economics%20%20
5) Carroll A. (1998) The Four Faces of Corporate E n v i r o n m e n t , % 2 0 C S R - 0 8 -
Citizenship Business & Society Review 100(1), 1- Kirti%20Dutta,%20M%20Durgamohan.pdf
7. 16) Edmondson, V. C. & Carroll, A. B. (1999). Giving
6) Carroll, A. B. (1979). A Three-Dimensional Model Back: An Examination of the Philanthropic
of Corporate Performance. Academy of Motivations, Orientations and Activities of Large
Management Review, 4[4], p. 497-505. Black-Owned Businesses. Journal of Business
7) Carroll, A. B. (1991). The Pyramid of Corporate Ethics, 19[2], p. 171-179.
Social Responsibility: Toward the Moral 17) Fernando, M. 2007. 'Corporate Social
Management of Organizational Stakeholders. Responsibility in the Wake of the Asian
Business Horizons, 34, p. 39-48. Tsunami: A Comparative Case Study of Two Sri
8) Carroll, A. B., & Shabana, K. M. (2010). The Lankan Companies'. European Management
Business Case for Corporate Social Journal, 25(1): 1–10.
Responsibility: A Review of Concepts, Research 18) Freeman E. and Reed D. (1983) Stockholders and
and Practice. International Journal of Stakeholders: A New Perspective on Corporate
Management Reviews, 12(1), 85-105. Governance California Management Review
9) Carroll, A.B. (1979). A three-dimensional 25(3), 88-106.
ISSN (O) : 2456-6675, ISSN (P) : 0972-8058
62
19) Friedman, M. (1970). 'The social responsibility of 30) Moon, S.-G., & deLeon, P. (2007). Contexts and
business is to increase its profits. New York Corporate Voluntary Environmental Behaviors:
Times Magazine, September, 13. Examining the EPA's Green Lights Voluntary
20) Horrigan, B 2007, '21st century corporate social Program. Organization Environment, 20(4), 480-
responsibility trends - An emerging comparative 496.
body of law and regulation on corporate 31) Porter, M, E. & Kramer, M, R 2002, 'The
responsibility, governance and sustainability, competitive advantage of corporate
Macquarie Journal of Business Law, vol. 4, no. 1, philanthropy', Harvard Business Review, vol. 80,
pp. 85-122. no. 12, pp. 56-68.
21) Khan, S 2005, 'Exploring the concept of 32) Porter. (2008). Managerial applications of
sustainability in emerging markets: Evidences corporate social responsibility and systems
from the Indian pharmaceutical industry', URL: thinking for achieving sustainability outcomes.
http://www. oikosstiftung. unisg. Systems Research and Behavioral Science, 25(3),
ch/academy2005/paper_khan. pdf> 397-411.
22) Luo, X., & Bhattacharya, C. B. (2009). The Debate 33) Raheja Shivani (2014). CSR: A Social
over Doing Good: Corporate Social Performance, Responsibility or a Social Show off
Strategic Marketing Levers, and Firm- (Sustainability Versus Sham)”. Jigyasa 2014,
Idiosyncratic Risk. Journal of Marketing, 73, 198- Journal of Human Resource and Organizational
213. Development, 33- 36.
23) M. E. Porter and M. R. Kramer, “The 34) Raheja Shivani (2017). A study on Consumer's
Competitive Advantage of Corporate Perception about Corporate Social
Philanthropy,” Harvard Business Review, Vol. Activities/Responsibilities with special reference
80, No. 9, 2002, pp. 56-69. to companies in FMCG sector of India.
24) Matten, D & Moon, J 2004, 'Corporate Social International Conference on Paradigm Shift in
Responsibility Education in Europe', Journal of World Economies: Opportunities and
Business Ethics, vol. 54, no. 4, pp. 323-37. Challenges, (IC- PSWEOC – 2017), ISBN: 978-1-
25) Matten, D & Moon. 2008, '" Implicit" and" 63535-729-5, pg:68-80.
explicit" CSR: a conceptual framework for a 35) Raheja Shivani (2014). Customer perspective: A
comparative understanding of corporate social new way of doing CSR by FMCG companies to
responsibility', The Academy of Management leverage Business, “Paradigm Shift in
Review (AMR), vol. 33, no. 2, pp. 404-24. Contemporary Management” page no 11-19, by
26) Matten, D., & Crane, A. 2005. Corporate Pragati Publications, New Delhi, First Edition,
citizenship: Toward an extended theoretical 2014, ISBN 978-81-7307-145-4.
conceptualization. Academy of Management 36) Raheja Shivani (2017). “CSR Activities and
Review, 30: 166 –179. Responsibilities by FMCG Companies of India: A
27) Miglė Šontaitė-Petkevičienė. 2015. CSR Reasons, Customer Perspective”, Effulgence, the Refereed Practices and Impact to Corporate Reputation. Management Journal of RDIAS, GGSIPU, Procedia - Social and Behavioral Sciences 213, 503- ISSN:0972-8058.508.
37) Raheja Shivani (2017). “Consumers perception 28) Moon, J. (2002), “Corporate social responsibility:
about CSR Activities and Responsibilities of an overview,” in International Directory of
FMCG Companies in India”, South Asian Corporate Philanthropy, Europa, London: UK,
Journal of Socio- Political Studies, SAJOSPS, pp. 385-408.
ISSN: 0972-4613.29) Moon, J. (2007), “The contribution of corporate
38) Sapra Ritu et al. “CSR Spending and its social responsibility to sustainable
Relationship with Share Prices (with Special development,” Sustainable Development, vol.
Reference to Top Indian Auto Ancillary 15, no. 5, pp. 296-306.
Companies in Light of Companies Act 2013)”.

ISSN (O) : 2456-6675, ISSN (P) : 0972-8058
63
pg: 28-36. Effulgence, Vol. 14, No.2, July -
December, 2016. ISSN: 0972-8058.
39) Sen, S., Bhattacharya, C. B., & Korschun, D.
(2006). The role of corporate social responsibility
in strengthening multiple stakeholder
relationships: A field experiment. Journal of the
Academy of Marketing Science, 34(2), 158-159.
40) Smith J. (2003) The Shareholder Versus
Stakeholder Debate Sloan Management Review
44(4) 85-91.
41) Smith, C 1994, 'The new corporate philanthropy',
Harvard Business Review, vol. 72, no. 3, p. 105.
42) Smith, G & Stodghill, R 1994, 'Are good causes
good marketing?', Business Week, vol. 21, pp. 64-
5.
43) Thorpe, J., & Prakash-Mani, K. (2006).
Developing Value. Greener Management
International: The Journal of Corporate
Environmental Strategy and Practice (GMI), 17-
32.
44) Turban, D. B., & Greening, D. W. 1997. Corporate
social performance and organizational
attractiveness to prospective employees.
Academy of Management Journal, 40: 658–72.
45) Visser, W. (2008).‗Corporate Social
Responsibility in Developing Countries' The
Oxford Handbook of Corporate Social
Responsibility. Oxford: Oxford University Press.
46) Visser, W. 2007b. 'Corporate social responsibility
in developing countries', The Oxford Handbook
of Corporate Social Responsibility (Oxford
University Press, Oxford), pp. 473–9.

Factors influencing Women Employees in Hospitality industry: A Study with reference to Lucknow
1Dr. Tripti Barthwal
2Dr. Akanksha Srivastava
1. Director (Lal Bahadur Shastri Institute of Management & Development Studies, Lucknow), [email protected]. Associate Prof. (Lal Bahadur Shastri Institute of Management & Development Studies, Lucknow),
[email protected] Author
Dr. Tripti Barthwal, Director (Lal Bahadur Shastri Institute of Management & Development Studies, Lucknow), [email protected]
Effulgence
Vol. 15 No. 2
July-December, 2017
Rukmini Devi Institute of Advanced Studies
E-mail : [email protected], Website : www.rdias.ac.in
http://effulgence.rdias.ac.in/user/default.aspx
Abstract
The hospitality industry is one of the fastest growing industries in the world. The core of the hospitality industry lies in
promptness in service, patience, courtesy, and adaptability towards customers – all qualities which females are generally
naturally endowed with. Women are different from men in more than one aspect. Hence, the factors which influence working
men may not apply in the same degree to working women. Focusing specifically on women, this study surveyed 50 women
executives in the hospitality industry to find out the factors influencing women in this industry. The study first conducted a
review of literature to bring out the important factors & then used factor analysis to discover the key factors influencing the work
of women in hospitality. Further, differences in the attitudes of working women on the basis of their age & marital status were
also analyzed through cross tabulations.
omen, hospitality industry, gender equality, work life balance, career opportunities.Keywords: W
Korczynski (2002) calls “customer sovereignty” to INTRODUCTIONensure a successful and profitable operation. Their
success depends more on their human capital than ospitality implies having a good time and
machineries. Within the human element, it is Hundertaking activities to satisfy the customer impossible to imagine a hospitality experience
& make him feel comfortable. The hospitality and without the charm, courtesy & grace of women
tourism sector is one of the fastest growing service employees.
sectors in the world and in Asia this growth is
unprecedented. Although the hotel industry has “The hospitality industry has been traditionally male
updated & modernized itself in keeping with the dominated partly because of the culture and nature
changing trends around the globe, the basic format of the industry, where job opportunities are more
services in hotels remains more or unchanged in versatile and require senior executives to be flexible
relation with the last century. They are dependent on with relocation options," said Rainy Chan, general
the critical human elements of service and what
ISSN (O) : 2456-6675, ISSN (P) : 0972-8058
LITERATURE REVIEWmanager of the Peninsula Hong Kong. "For female
hoteliers, they often face the dilemma of having to
According to Professor Tom Baum (March 2015), the make a choice between family and career, and most
tourism and hospitality sector has become an of the time, the former always wins the power
economic and social phenomenon, demonstrating struggle.”
above average growth for the fifth consecutive year
since the 2009 economic crisis and being set to create In his working paper for ILO, titled “International
70 million new jobs over the next 10 years.perspectives on women and work in hotels”,
published in 2013 Prof. Baum writes “Hotels,
Males & females possess different personality catering and tourism (HCT) is a large and fast-
attributes & their working style is also different. growing service sector, with an average female
Maxwell (1997) has found that, compared to that of participation of 55.5 per cent at global level and up
their male counterparts, the approach used by to 70 per cent at regional level. They are employed in
female senior managers in their staff management a wide variety of roles, including as cleaners and
styles such as 'good communication, flexibility and kitchen staff, front-line customer service workers
adaptability, and teamwork' have aided them in and senior management.
attaining this rank and provided good outcomes for
the organisation. Employees perceived that female In terms of women and type of hotels, according to
managers were more innovative, better able to Timo and Davidson (2005), the jobs in 4-and 5-star
prioritize and synchronize activities, more readily international hotel chains are shared almost equally
engaged in mentoring (Vilkinas and Cartn, 1997). between female and male counterparts. However,
Some such as Loscocco (1989) show that women things differ when it comes to managerial positions,
value extrinsic job characteristics more than men do. which are still dominated by men. Schwartz (1989)
However, there are other researches that show the emphasizes on the role of women in management as
opposite (Neil & Snizek, 1987).a competitive advantage by stating that it is
important for businesses to recognize that female
The environment of the hospitality industry, its managers are part of a talent pool that is essential to
demands & customer expectations all are important be retained and developed.
factors in deciding the role played by different
OBJECTIVES OF THE STUDY genders. Contributing to a culture that accentuates
gender differences is the fact that hospitality
The purpose of this study was to identify and employees are often hired, at least in part, because of
examine important factors considered to be their physical attractiveness. It becomes clear that
susceptible to influence the work domain of female women in hospitality experience additional
employees in the hospitality industry in Lucknow. challenges as a result of the nature and
This study has the following objectives: characteristics of the industry in which they work
(Brownell & Walsh, 2008).
• To study the major factors affecting the work of
women in hospitality industry in Lucknow. Besides gender stereotypes, women also have to deal
• To analyse which of these factors exercise the with work life balance issues almost on a daily basis
greatest influence. more often than men. Added to this they work in an
• To ascertain the difference in opinions amongst industry where there is a highly variable demand
women employees on the basis of marital status. cycle which imposes unsocial working hours on
• To find out the difference in opinions amongst employees and can make shift patterns
women employees on the basis of their age. unpredictable, which are difficult to reconcile with
ISSN (O) : 2456-6675, ISSN (P) : 0972-8058
65

family and care responsibilities. In hotels, the long Women 1st (2010) found that there were 5 main
working day is seen as intrinsic to working practices barriers preventing women's advancement into
(Brownell, 1993; Hicks, 1990; Knutson & Schmidgall, management and senior roles. These included:
1999). Seasonal work can demand very high levels of
time commitment during some parts of the year, 1. Difficulty of combing work at senior level with
while offering little or no work during the off-season caring responsibilities
(Baum & Lundtrop, 2010). It becomes a negative 2. Dominant masculine organisational culture
factor for women with young children, as in the 3. Preconceptions and gender bias
majority of cases; women remain the primary 4. Lack of networking and exclusion from informal
caregiver with the added responsibility of household networks of communication
organisation (Lopez - Claros & Zahidi, 2005). 5. Lack of visible women in senior positions
Research gap and contribution of the studyThe implication is clear, points out Brownell &
Walsh (2008) that one primary responsibility is often
On the basis of above Review of Literature following compromised for the sake of the other. This leads to
points can be concluded:stress, disappointment & exhaustion amongst most
• It is found that work has done for improving women. To meet these challenges, some women try
communication between genders in the to find supportive help at home; others opt for a
hospitality workplace.reduced work schedule and take themselves out of
• It is found that “glass-ceiling” prevent women the running for jobs with greater responsibilities and
from reaching top or top executive positions.heavier workloads (McGrath, 1999; Higgins et al.,
• It is found that low female labour participation 2000).
rates and high male immigrant labour rates
contribute to gender imbalance in the hotel Kara, Uysal & Magnini (2012) found that the level of
workforce.job satisfaction is determined by four factors:
• It is found that the Indian corporate woman as “management conditions”, “personal fulfillment”,
an endowment to corporate India.“using ability in the job”, and “job conditions”. The
• It is found that work has done to examine Work-study results show that significant gender
Life Balance issues, its extensive impact and differences exist with regard to the “using ability in
identities factors that could help create a better the job” dimension of job satisfaction. Maxham
Work-Life Balance in India.(2003) found that job satisfaction positively correlates
• It is found that women are competing at par with customer satisfaction. He argues that
with their male counterparts and organizations employees who are satisfied in their job will provide
are also recognizing their talent, irrespective of better service to customers and customer satisfaction
the gender. Women have made their presence will increase. Studies have shown that hospitality
felt in every area. Moreover, they are front-and tourism employees most likely to leave the
runner for change and are emerging as leaders in industry because of low job satisfaction, poor
their respective fields.working conditions and the absence of motivating
• It is found that there has been significant growth factors (Kusluvan & Kusluvan, 2000). Job satisfaction
in the Indian tourism industry during the last in the industry is thought to be influenced by a
few years, particularly after financial year 01-02, number of factors including long hours, night and
there are growing apprehensions regarding the weekend schedules, stress, demanding supervisors
sustainability of tourism as a means of and duties, lack of personal time and quality of life,
development. This is primarily because of the routine, and little opportunity for advancement and
adverse effect on the environment.growth (Pavesic & Brymer, 1990).
ISSN (O) : 2456-6675, ISSN (P) : 0972-8058
66
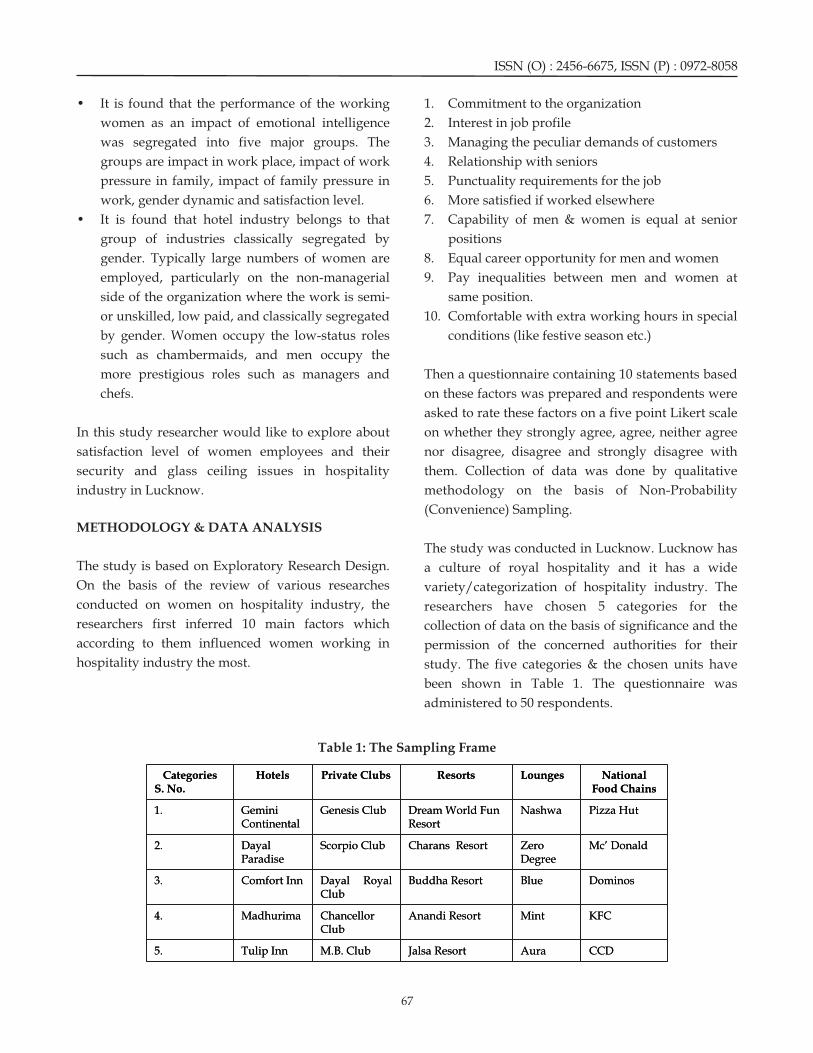
• It is found that the performance of the working 1. Commitment to the organization
women as an impact of emotional intelligence 2. Interest in job profile
was segregated into five major groups. The 3. Managing the peculiar demands of customers
groups are impact in work place, impact of work 4. Relationship with seniors
pressure in family, impact of family pressure in 5. Punctuality requirements for the job
work, gender dynamic and satisfaction level. 6. More satisfied if worked elsewhere
• It is found that hotel industry belongs to that 7. Capability of men & women is equal at senior
group of industries classically segregated by positions
gender. Typically large numbers of women are 8. Equal career opportunity for men and women
employed, particularly on the non-managerial 9. Pay inequalities between men and women at
side of the organization where the work is semi- same position.
or unskilled, low paid, and classically segregated 10. Comfortable with extra working hours in special
by gender. Women occupy the low-status roles conditions (like festive season etc.)
such as chambermaids, and men occupy the
more prestigious roles such as managers and Then a questionnaire containing 10 statements based
chefs. on these factors was prepared and respondents were
asked to rate these factors on a five point Likert scale
In this study researcher would like to explore about on whether they strongly agree, agree, neither agree
satisfaction level of women employees and their nor disagree, disagree and strongly disagree with
security and glass ceiling issues in hospitality them. Collection of data was done by qualitative
industry in Lucknow. methodology on the basis of Non-Probability
(Convenience) Sampling.
METHODOLOGY & DATA ANALYSIS
The study was conducted in Lucknow. Lucknow has
The study is based on Exploratory Research Design. a culture of royal hospitality and it has a wide
On the basis of the review of various researches variety/categorization of hospitality industry. The
conducted on women on hospitality industry, the researchers have chosen 5 categories for the
researchers first inferred 10 main factors which collection of data on the basis of significance and the
according to them influenced women working in permission of the concerned authorities for their
hospitality industry the most. study. The five categories & the chosen units have
been shown in Table 1. The questionnaire was
administered to 50 respondents.
CCDAuraJalsa ResortM.B. ClubTulip Inn5.
KFCMintAnandi ResortChancellor Club
Madhurima4.
DominosBlueBuddha ResortDayal Royal Club
Comfort Inn3.
Mc’ DonaldZero Degree
Charans ResortScorpio ClubDayalParadise
2.
Pizza HutNashwaDream World Fun Resort
Genesis ClubGemini Continental
1.
National Food Chains
LoungesResortsPrivate ClubsHotelsCategoriesS. No.
Table 1: The Sampling Frame
ISSN (O) : 2456-6675, ISSN (P) : 0972-8058
67
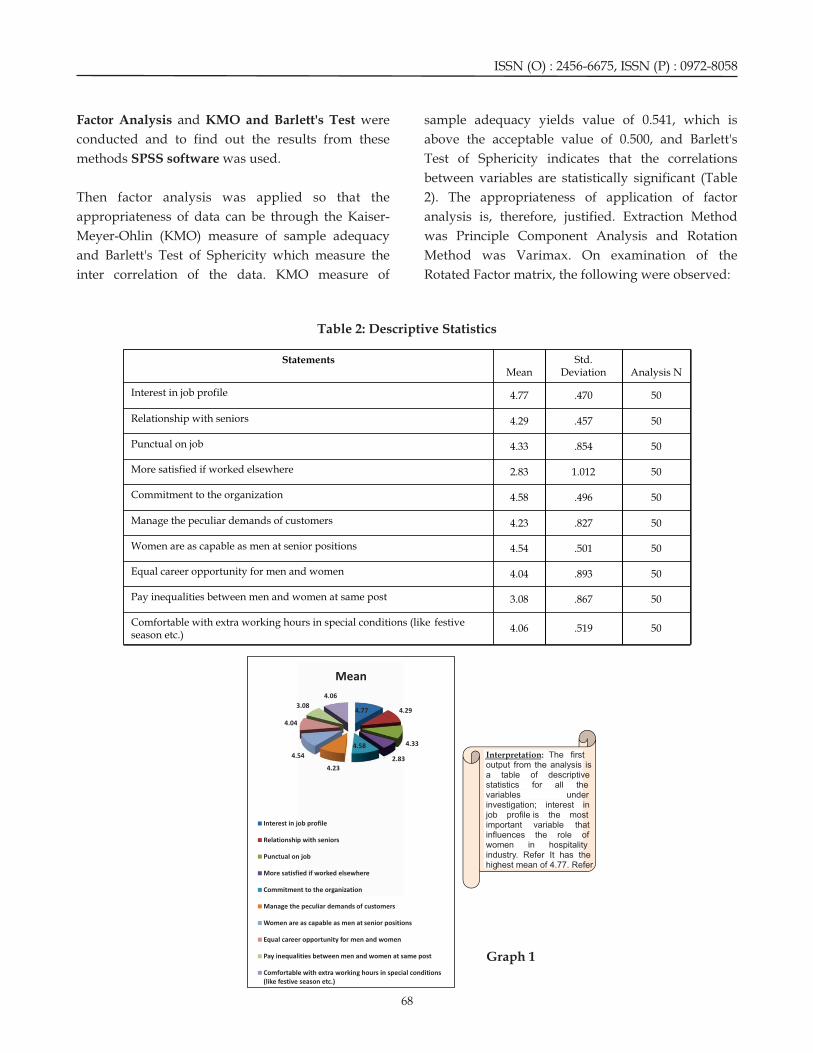
Factor Analysis and KMO and Barlett's Test were sample adequacy yields value of 0.541, which is
conducted and to find out the results from these above the acceptable value of 0.500, and Barlett's
methods SPSS software was used. Test of Sphericity indicates that the correlations
between variables are statistically significant (Table
Then factor analysis was applied so that the 2). The appropriateness of application of factor
appropriateness of data can be through the Kaiser- analysis is, therefore, justified. Extraction Method
Meyer-Ohlin (KMO) measure of sample adequacy was Principle Component Analysis and Rotation
and Barlett's Test of Sphericity which measure the Method was Varimax. On examination of the
inter correlation of the data. KMO measure of Rotated Factor matrix, the following were observed:
Table 2: Descriptive Statistics
50.5194.06Comfortable with extra working hours in special conditions (like festive season etc.)
50.8673.08Pay inequalities between men and women at same post
50.8934.04Equal career opportunity for men and women
50.5014.54Women are as capable as men at senior positions
50.8274.23Manage the peculiar demands of customers
50.4964.58Commitment to the organization
501.0122.83More satisfied if worked elsewhere
50.8544.33Punctual on job
50.4574.29Relationship with seniors
50.4704.77Interest in job profile
Analysis NStd.
DeviationMeanStatements
4.77 4.29
4.33
2.83
4.58
4.23
4.54
4.04
3.08
4.06
Mean
Interest in job profile
Relationship with seniors
Punctual on job
More satisfied if worked elsewhere
Commitment to the organization
Manage the peculiar demands of customers
Women are as capable as men at senior positions
Equal career opportunity for men and women
Pay inequalities between men and women at same post
Comfortable with extra working hours in special conditions(like festive season etc.)
Interpretation: The first output from the analysis is a table of descriptive statistics for all the variables under investigation; interest in job profile is the most important variable that influences the role of women in hospitality industry. Refer It has the highest mean of 4.77. Refer
Graph 1
ISSN (O) : 2456-6675, ISSN (P) : 0972-8058
68

Interpretation: The next item from the output is a analysis over 78% of the variance in punctuality on
table of communalities (Table 4) which shows how job is accounted for while 65.6% of the variance in
much of the variance in the variables has been comfortable with extra working hours in special
accounted for by the extracted factors. From the conditions (like festive season etc.) is accounted for.
It should be greater than. 50 indicating sufficient items for each factor.
It should be significant (less than .05), indicating that the correlation matrix is significantly different from an identity matrix, in which correlations between variables are all zero.
.000Sig.
45Df
307.349Approx. Chi-SquareBartlett's Test ofSphericity
.541Kaiser-Meyer-Olkin Measure of SamplingAdequacy.
Table 3: KMO and Bartlett's Test
.000Sig.
45Df
307.349Approx. Chi-SquareBartlett's Test ofSphericity
Kaiser-Meyer-Olkin Measure of SamplingAdequacy.
Interpretation: The next item from the output is the analysis to proceed. From the analysis, the KMO
Kaiser-Meyer-Olkin (KMO) and Bartlett's test. The measure is 0.541. From the Table 3, the Bartlett's test
KMO measures the sampling adequacy which of sphericity is significant.
should be greater than 0.5 for a satisfactory factor
Table 4: Communalities
Extraction Method: Principal Component Analysis.
.6561.000Comfortable with extra working hours in special conditions (like festive season etc.)
.7431.000Pay inequalities between men and women at same post
.7611.000Equal career opportunity for men and women
.7091.000Women are as capable as men at senior positions
.7151.000Manage the peculiar demands of customers
.7081.000Commitment to the organization
.6781.000More satisfied if worked elsewhere
.7801.000Punctual on job
.7271.000Relationship with seniors
.7131.000Interest in job profile
ExtractionInitialStatements
ISSN (O) : 2456-6675, ISSN (P) : 0972-8058
69
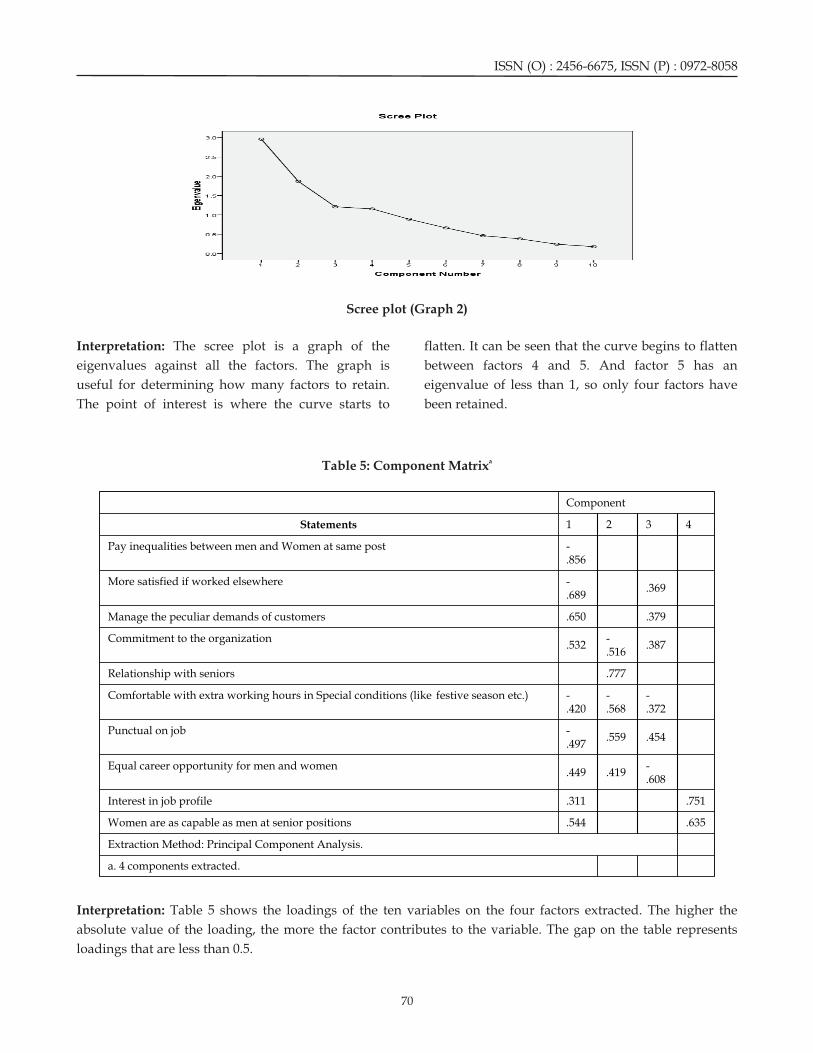
Scree plot (Graph 2)
Interpretation: The scree plot is a graph of the flatten. It can be seen that the curve begins to flatten
eigenvalues against all the factors. The graph is between factors 4 and 5. And factor 5 has an
useful for determining how many factors to retain. eigenvalue of less than 1, so only four factors have
The point of interest is where the curve starts to been retained.
aTable 5: Component Matrix
Interpretation: Table 5 shows the loadings of the ten variables on the four factors extracted. The higher the
absolute value of the loading, the more the factor contributes to the variable. The gap on the table represents
loadings that are less than 0.5.
a. 4 components extracted.
Extraction Method: Principal Component Analysis.
.635.544Women are as capable as men at senior positions
.751.311Interest in job profile
-.608
.419.449Equal career opportunity for men and women
.454.559-.497
Punctual on job
-.372
-.568
-.420
Comfortable with extra working hours in Special conditions (like festive season etc.)
.777Relationship with seniors
.387-.516
.532Commitment to the organization
.379.650Manage the peculiar demands of customers
.369-.689
More satisfied if worked elsewhere
-.856
Pay inequalities between men and Women at same post
4321Statements
Component
ISSN (O) : 2456-6675, ISSN (P) : 0972-8058
70
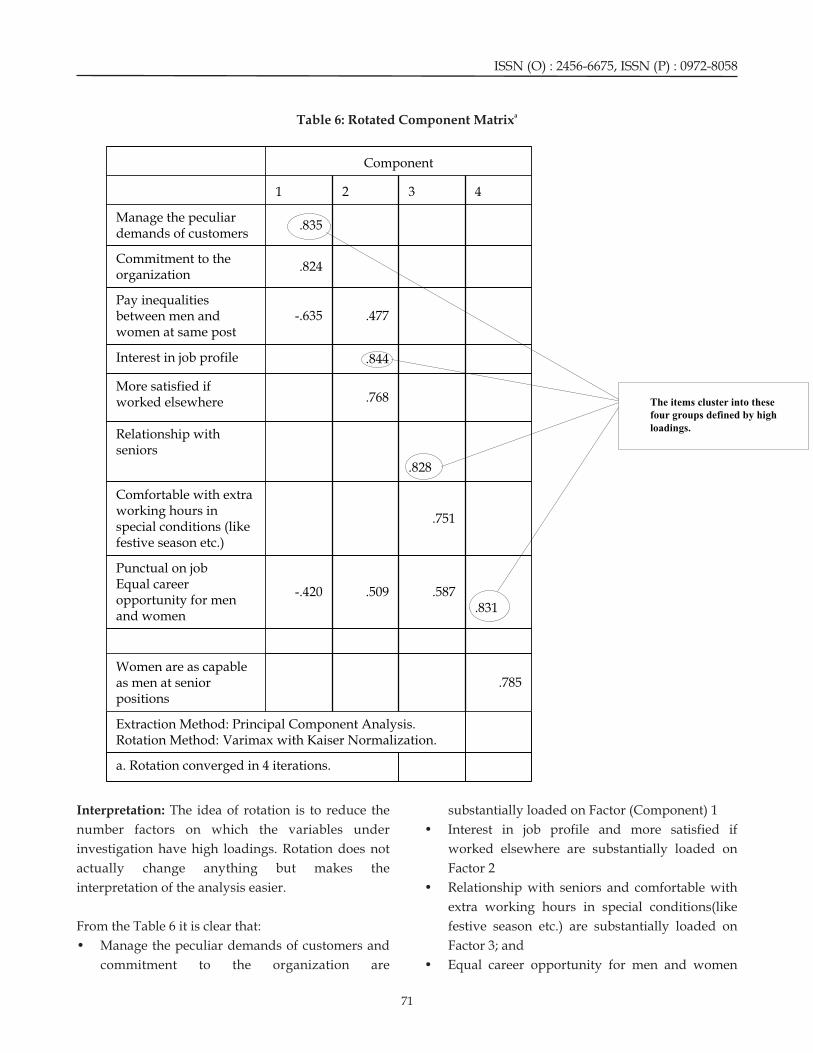
Interpretation: The idea of rotation is to reduce the substantially loaded on Factor (Component) 1
number factors on which the variables under • Interest in job profile and more satisfied if
investigation have high loadings. Rotation does not worked elsewhere are substantially loaded on
actually change anything but makes the Factor 2
interpretation of the analysis easier. • Relationship with seniors and comfortable with
extra working hours in special conditions(like
From the Table 6 it is clear that: festive season etc.) are substantially loaded on
• Manage the peculiar demands of customers and Factor 3; and
commitment to the organization are • Equal career opportunity for men and women
aTable 6: Rotated Component Matrix
a. Rotation converged in 4 iterations.
Extraction Method: Principal Component Analysis. Rotation Method: Varimax with Kaiser Normalization.
.785Women are as capable as men at senior positions
.831.587.509-.420
Punctual on jobEqual career opportunity for men and women
.751
Comfortable with extra working hours in special conditions (like festive season etc.)
.828
Relationship with seniors
.768More satisfied if worked elsewhere
.844Interest in job profile
.477-.635Pay inequalities between men and women at same post
.824Commitment to the organization
.835Manage the peculiar demands of customers
4321
Component
The items cluster into these four groups defined by high loadings.
ISSN (O) : 2456-6675, ISSN (P) : 0972-8058
71
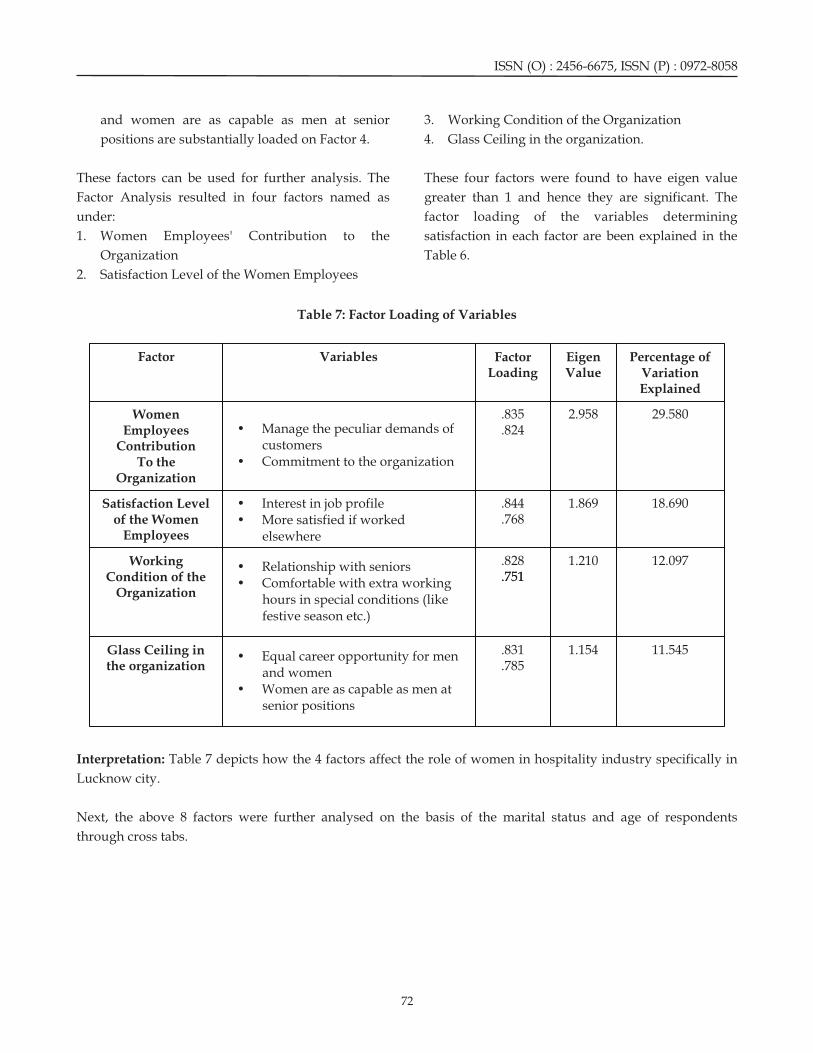
and women are as capable as men at senior 3. Working Condition of the Organization
positions are substantially loaded on Factor 4. 4. Glass Ceiling in the organization.
These factors can be used for further analysis. The These four factors were found to have eigen value
Factor Analysis resulted in four factors named as greater than 1 and hence they are significant. The
under: factor loading of the variables determining
1. Women Employees' Contribution to the satisfaction in each factor are been explained in the
Organization Table 6.
2. Satisfaction Level of the Women Employees
Table 7: Factor Loading of Variables
Interpretation: Table 7 depicts how the 4 factors affect the role of women in hospitality industry specifically in
Lucknow city.
Next, the above 8 factors were further analysed on the basis of the marital status and age of respondents
through cross tabs.
11.5451.154.831.785
Glass Ceiling in the organization
12.0971.210.828.751
Working Condition of the
Organization
18.6901.869.844.768
Satisfaction Level of the Women
Employees
29.5802.958.835.824
Women Employees
ContributionTo the
Organization
Percentage of Variation Explained
EigenValue
Factor Loading
VariablesFactor
.751
• Manage the peculiar demands of customers
• Commitment to the organization
• Interest in job profile• More satisfied if worked
elsewhere
• Relationship with seniors• Comfortable with extra working
hours in special conditions (like festive season etc.)
• Equal career opportunity for men and women
• Women are as capable as men at senior positions
ISSN (O) : 2456-6675, ISSN (P) : 0972-8058
72

Table 8: Respondents' Agreement on the basis of Marital Status
Graph 3
82.4%Unmarried
100%MarriedEqual career opportunity for men and women
100%Unmarried
100%MarriedWomen are as capable as men at senior positions
100%Unmarried
100%MarriedCommitment to the organization
97.3%Unmarried
71.4%MarriedComfortable with extra working hours in special conditions (like festive season etc.)
91.2%Unmarried
78.6%MarriedManage the peculiar demands of customers
44.1%Unmarried
14.3%MarriedMore satisfied if worked elsewhere
100%Unmarried
100%MarriedRelationship with seniors
97.1%Unmarried
100%MarriedInterest in job profile
Respondents Agreement
Marital Status
Statements
ISSN (O) : 2456-6675, ISSN (P) : 0972-8058
73

Interpretation: From the Table 8 & Graph 3 we can women employees are less comfortable with extra
see that married women are more stable employees working hours because they have to maintain a
while unmarried women employees are more balance between work & life.
mobile. One more point is visible that married
Table 9: Respondents' Agreement on the basis of Age
100%Above 40
100%35-40 years
100%30-35 years
100%25-30 years
76%20-25 yearsEqual career opportunity for men and women
100%Above 40
100%35-40 years
100%30-35 years
100%25-30 years
100%20-25 yearsWomen are as capable as men at senior positions
100%Above 40
100%35-40 years
100%30-35 years
100%25-30 years
100%20-25 yearsCommitment to the organization
100%Above 40
0%35-40 years
100%30-35 years
91.7%25-30 years
96%20-25 yearsComfortable with extra working hours in special conditions (like festive season etc.)
0%Above 40
100%35-40 years
83.3%30-35 years
100%25-30 years
88%20-25 yearsManage the peculiar demands of customers
0%Above 40
0%35-40 years
16.7%30-35 years
33.3%25-30 years
48%20-25 yearsMore satisfied if worked elsewhere
100%Above 40
100%35-40 years
100%30-35 years
100%25-30 years
100%20-25 yearsRelationship with seniors
100%Above 40
100%35-40 years
100%30-35 years
100%25-30 years
96%20-25 yearsInterest in job profile
Respondents Agreement
Respondents AgeStatements
100%Above 40
100%35-40 years
100%30-35 years
100%25-30 years
76%20-25 yearsEqual career opportunity for men and women
100%Above 40
100%35-40 years
100%30-35 years
100%25-30 years
100%20-25 yearsWomen are as capable as men at senior positions
100%Above 40
100%35-40 years
100%30-35 years
100%25-30 years
100%20-25 yearsCommitment to the organization
100%Above 40
0%35-40 years
100%30-35 years
91.7%25-30 years
96%20-25 yearsComfortable with extra working hours in special conditions (like festive season etc.)
0%Above 40
100%35-40 years
83.3%30-35 years
100%25-30 years
88%20-25 yearsManage the peculiar demands of customers
0%Above 40
0%35-40 years
16.7%30-35 years
33.3%25-30 years
48%20-25 yearsMore satisfied if worked elsewhere
100%Above 40
100%35-40 years
100%30-35 years
100%25-30 years
100%20-25 yearsRelationship with seniors
100%Above 40
100%35-40 years
100%30-35 years
100%25-30 years
96%20-25 yearsInterest in job profile
Respondents Agreement
Respondents AgeStatements
ISSN (O) : 2456-6675, ISSN (P) : 0972-8058
74

Graph 4
Interpretation: From Table 9 & Graph 4 it is clear • Their contribution to the organisation.
that with the increase in age loyalty towards • Their level of job satisfaction.
organization increases. In initial stage and in later • The working condition of the organization.
stage women employees are comfortable with extra • Existence of glass ceiling in the organization.
working hours while in middle stage (between 25- • Married women are more satisfied with their
30years: it is phase when a female is planning about present organisation in comparison to
her marriage & between 35-40years : it is phase when unmarried ones.
a female is planning about her kids) they are less • Relationships with seniors are cordial across all
comfortable with extra working hours. age groups & marital status.
• Loyalty towards organisation tends to increase
CONCLUSION with age.
• Women employees between 25-40 years are not
On the basis of the data analysis, the following very comfortable with long working hours.
conclusions can be drawn:
• Interest in job profile & relationship with seniors REFERENCES
are most important for the women working in
1) Baum, T. & Lundtorp S. (2000). Seasonality in hospitality industry.
Tourism, London, Elsevier.• Four factors which affect the working women in
2) Baum, T. (2015). White Paper Women in Tourism hospitality industry the most are:
ISSN (O) : 2456-6675, ISSN (P) : 0972-8058
75
& Hospitality: Unlocking the Potential in the Turkey. Tourism Management, 21, 251-269.
Talent Pool 10) Loscocco, K. (1989). The interplay of personal
https://www.diageo.com/Lists/.../Women_in_ and job characteristics in determining work
Hospitality___Tourism_White_Paper.pd... commitment. Social Science Research, 18, 70–79.th(accessed on 27 May, 2017) 11) Lopez - Claros, A., & Zahidi, S. (2005). Women's
3) Brownell, J., & Walsh, K. (2008). Women in Empowerment-Measuring the Global Gender
hospitality [Electronic version]. Retrieved [May Gap: Harvard Business Review.
24, 2017], from Cornell University, SHA School 12) Maxham, J. A. N., R. (2003). Firms reap what
s i t e : th ey sow: The effects of shared values and
http://scholarship.sha.cornell.edu/articles/835 peceived organizational justice on customers'
4) Hicks, L. (1990). Excluded Women: How can this evaluations of complaint handling. Journal of
Happen in the Hotel World. The Service Marketing, 67(1), 46-62.
Industries Journal, 10(2), 348-363. 13) Maxwell, G. A. (1997) "Hotel general
5) Higgins, C. Duxbury, L. Johnson, K. L. 'Part time management: views from above the glass
work for women: does it really help balance ceiling." International Journal of Contemporary
work 126 and family?' Human Resource Hospitality Management 9, (5/6) 230-235.
Management 39 (1) 17–32. (2000). http://dx.doi.org/10.1108/09596119710172624
http://dx.doi.org/10.1002/%28SICI%291099- 14) McGrath, C. 'Do females want to be the future?'
050X%28200021%2939:1%3C17::AIDHRM3%3E3. Hospitality 8. (1999).
0.CO;2-Y 15) Neil, C. C., & Snizek, W. E. (1987). Work values,
6) Kara D., Uysal M., Magnini Vincent P., (2012) job characteristics, and gender. Sociological
"Gender differences on job satisfaction of the Perspectives, 30, 245–265.
16) Pavesic, D., & Brymer, R. (1990). Job satisfaction: five‐star hotel employees: The case of the
what's happening to the young managers? The Turkish hotel industry", International Journal of
Cornell Hotel and Restaurant Administration Contemporary Hospitality Management, Vol. 24
Quarterly, 30(4), 90-96.Issue: 7, pp.1047-1065, doi:
17) Schwartz, F. (1989). Management Women and 10.1108/09596111211258919
the New Facts of Life. Women in Management 7) Knutson, B. J., & Schmidgall, R. S. (1999).
Review. 4(5), 65-76.Dimensions of the Glass Ceiling in the
18) Timo, N., & Davidson, M. (2005) "A survey of Hospitality Industry. Cornell Hotel and
employee relations practices and demographics Restaurant Administration Quarterly, 40(6), 64-
of MNC chain and domestic luxury hotels in 70.
Australia." Employee Relations 27, (2) 175-192.8) Korczynski, M. (2002). Human Resource
19) Vilkinas, T. and Cartan, G. 1997. How different Management in Service Work. London: Palgrave
are the roles displayed by female and male 9) Kusluvan, S., & Kusluvan, Z. (2000). Perceptions
managers?. Women in Management Review, 12(4): and attitudes of undergraduate tourism students
129–135.towards working in the tourism industry in
ISSN (O) : 2456-6675, ISSN (P) : 0972-8058
76
Evaluation of Post-Merger Performance on a Value Based Framework: A Case of Hindalco Industries Ltd. and Novelis Inc.
1Dr. Anjala Kalsie
2Dr. Ashima Arora
1. Assistant Professor, Department of Management Studies, University of Delhi, India2. Assistant Professor, Shaheed Sukhdev College of Business Studies, University of Delhi, IndiaCorresponding Author
Dr. Anjala Kalsie, Assistant Professor, Department of Management Studies, University of Delhi, India
Effulgence
Vol. 15 No. 2
July-December, 2017
Rukmini Devi Institute of Advanced Studies
E-mail : [email protected], Website : www.rdias.ac.in
http://effulgence.rdias.ac.in/user/default.aspx
Abstract
Multiple approaches have been used to evaluate the post-merger performance. The objective of the paper is to demonstrate value
based approach for evaluating post-merger performance. Enterprise Value Added (EVA) as outlined by Stewart in 1980 has
been chosen as the value based measure. EVA methodology was employed as a tool to evaluate the post-merger performance of
the combined entity Hindalco in the paper. The merger deal between Hindalco Industries Ltd. and Novelis Inc. carried out in the
year 2007 has been chosen to demonstrate Enterprise Value Added (EVA) as outlined by Stewart. The value obtained from the
analysis found that the combined entity couldn’t produce expected performance. The five years post-merger analysis of
combined entity’s performance revealed four years of negative economic value (EVA). This underlined that the actual EVA
couldn’t keep up with the expected EVA improvements in the combined entity, thereby validating the fears of the target
company being over-valued during acquisition process by acquiring company, Hindalco.
post-merger performance, Enterprise Value Added, stock market reaction JEL CODE: G34, C52, G11Keywords:
approach to performance measurement can have on INTRODUCTIONthe results.
wentieth century has seen multiple waves of Multiple approaches have been used to evaluate the Tcorporate mergers and acquisitions throughout post-merger performance. Some of the most
the world, changing the face of corporate landscape. common approaches are Share market performance,
Cross border mergers and acquisitions (M&A) have Accounting Measures, Subjective Assessment of
become more frequent in recent times. Cross Border Managers, Expert Assessment, Balance Score Card,
M&A has increased from $97.3 billion in 1987 to Value Based Measures. As per Cording et al (2010),
$2400 billion in 2010 worldwide, as per Thomson 92% of studies have used stock market and
Reuters. All this is complicated by the fact that a accounting measures as the approaches to evaluate
significant fraction (40-80%) of studies of past M&As the performance of mergers.
have found the results failing. This paradox prompts
one to question as to what kind of impact an
ISSN (O) : 2456-6675, ISSN (P) : 0972-8058

Different Performance Measures (ROC), return on invested capital (ROIC) and return
on employed capital (ROEC) among others. These
It would be not only difficult but incorrect to present parameters are compared for multiple periods before
one approach superior to another. It is the purpose and after the acquisition. This approach takes ROC
and context of study that defines the most as the ultimate objective of firm and which is
appropriate approach. Each approach has its reflected in accounting measures. These indicators
advantages and disadvantages. A brief description can be in the domain of growth, profitability,
of some of the approaches is presented here. productivity and innovation. This approach has
several advantages. Few of them are that it considers
Share Market Studies returns that have been realized, easily
implementable, and can capture the impact of
This has been one of the most used approaches in multiple M&A objectives. But this approach has its
Merger & Acquisition evaluation. The approach is limitations. Some of them are results are impacted by
rooted in the Efficient Market Hypothesis. It the effect of outside factors, focuses on past rather
measures the movement in share prices with the than present expectations of future, accounting data
unanticipated M&A event. It assumes that share is subject to manipulations, varying accounting
market incorporates this information to give rational, standards and GAAPs across countries might lead to
accurate and complete measure of expectations of inconsistency, comparison is difficult.
value creation from the new entity. These studies can
be both short and long term. It also assumes that Balance Score Card (BSC) Approach
there are no shocks to share market during the event
window other than the merger and acquisition. This approach uses balance score card methodology
to evaluate post-merger performance. This approach
This approach has several advantages including that captures performance across five broad dimensions
approach is based on wide public opinion and thus as listed below
can be considered rational. The approach 1. Financial Performance
incorporates easy data availability and thus 2. Learning & Growth
significant sample size. Another merit is that the 3. Customer Satisfaction
influence of external factors is easy to eliminate in 4. Internal Business Processes
short term studies and also that measurement of 5. Environment
abnormal returns enable cross industry comparisons.
But there are certain limitations of this approach as This approach captures the comprehensive
well. Some of them are inherent assumptions need performance but relies on accounting measures to
not always be true, though data is easily available judge performance across five broad categories.
yet it is difficult to implement, entities not listed
ECONOMIC VALUE ADDED (EVA)cannot be evaluated, study cannot consider all the
objectives associated with the M&A and
Economic Value Added (EVA) is an operational performance can be evaluated at combined entity
performance measure which deviates from level and not on the level of individual units.
conventional profitability measures on essentially
Accounting Based Measures two accounts. First, in the overall cost, it takes
account of opportunity cost associated with the
This approach takes a long-term view of evaluation capital i.e. it is closely related to the concept of
and monitors the actual performance as depicted in residual income. Second, it incorporates multiple
accounting measures such as return on capital corrections to reported revenues to minimize the
ISSN (O) : 2456-6675, ISSN (P) : 0972-8058
78

impact of accounting errors. The advocates of EVA can only be said to create values for shareholders
preferring it vis-à-vis conventional profitability when the return on capital exceeds the cost of
measures argue that EVA is more strongly related to capital. EVA is also referred as the Return Spread i.e.
wealth maximization. A positive value indicates the the difference between return on capital employed
presence of economic profits and vice versa. EVA is and the cost of capital. EVA can be used as a
the difference of cost of capital deducted from Net comprehensive tool of management because it
Operating Income after Tax (NOPAT), i.e., redirects the focus of company operations and
EVA = N0PAT − c * I managerial direction on creating wealth for the
Where, NOPAT is profit after depreciation and taxes shareholders. EVA can then be used as a tool for
but before interest cost, c is the cost of capital capital budgeting, mergers and acquisition decisions,
generally taken to be WACC and I is the Invested compensation planning, financial reporting and
Capital in the beginning of the year for which the bench marking.
EVA must be calculated. Operations of a company
Figure 1: Economic Value Added
Historical Evolution of EVA based measures of profitability or wealth creation
such as return on equity (ROE), return on investment
The concept as a theoretical construct has been in (ROI), earnings before interest, tax, depreciation and
existence since 1890. It was Alfred Marshall, British amortization (EBITDA) and net operating income
Economist, who defined it as slightly different (NOI). It was the work of Irving Fisher and later
concept of economic profit. Marshal stated that real Nobel Laureates Miller and Modigliani, during 20th
meaning of profit for a business is “What remains of century that further developed the concept of
his profits after deducting interest on his capital at the economic profit in the context of corporate current rate may be called his earnings of undertaking or valuations.management”. It was this definition that set apart the
concept of economic profit from the accounting
ISSN (O) : 2456-6675, ISSN (P) : 0972-8058
79

In the realm of practice, residual income was value of money leading to inaccuracies
adopted by General Electric in the decade of 1950s. It • Managers might ignore beneficial asset
was New York based Stewart & Co. that made replacement to retain high performance rewards
several accounting adjustments in the calculation of • Might lead to individual units performing to the
residual income on the basis of GAAP figures and detriment of overall organization
christened it as EVA. Stewart defined EVA as profit
EVA Compared with other Value Based Measureswhich considers cost of both debt and equity
invested in the operations of a firm. Stewart made
There exist multiple value based tools to measure the more than 160 adjustments to the accounting figures
performance of organizations. Some of them are for the calculation of EVA.
Cash Flow Return on Investment (CFROI), Cash
EVA Compared with Traditional Measures Value Added (CVA), Shareholder Value Added
(SVA), Adjusted Economic Value Added (AEVA)
Solomon and Laya (1967), Fisher (1986) and and Refined Economic Value Added (REVA). CFROI
Livingston and Solomon (1970) have shown that developed jointly by BCG and HOLT Value
there is significant difference among true rate of Associates, compares gross cash flows (GCF) with
return and accounting rate of return. Hence, they gross investments (GI) both adjusted for inflation.
concluded that the later cannot be used as a measure The ratio of GCF and GI is then translated into an
of former. The most common indicator used to IRR by taking account of limited useful life of
measure the performance is return on capital and is depreciating assets and residual value of non-
also considered a good one. Return on Capital is depreciating ones like land.
calculated in different manner by different
companies and has been known by different names CVA is calculated as the difference of Operating
such as ROCE, ROI and ROIC among others. One Cash Flow (OCF) and Operating Cash Flow Demand
major problem with all of them is that it is not (OCFD). OCFD is a measure of average annual cost
necessary that maximizing this rate of return will of capital. AEVA and REVA are modified versions of
also maximize wealth creation for the stockholders. EVA. While AEVA takes current value of assets as
opposed to book value, REVA uses market value of
EVA gives similar results as derived from NPV or the firm in the beginning of period instead of book
DCF which are well established as some of the best value. Some of these measures are dependent upon
analytical methods from investors' point of view. cash flows and thus might be more reliable but at the
Just as IRR might not be a true indicator for project same time their calculation is not very simple and
selection, the ROI also need not give the best results they tend to rely on subjective data.
for investors. Just as IRR shall be used along with
Calculation of EVANPV, ROI can as well be used with EVA.
Performance measures such as EPS and ROI have
AS already stated the EVA is the difference between certain problems as identified below:
NOPAT and cost of capital.
• Possibility of manipulation of income due to
EVA = N0PAT − c * Iinconsistency in the definition of income,
investments and assetsNOPAT• Varying accounting choices create scope for
manipulationIt is the Operating profit before interest but after • GAAP follows accrual system of accounting and payment of taxes. The number of adjustments to be thus to some extent neglects cash flows and time
ISSN (O) : 2456-6675, ISSN (P) : 0972-8058
80
made to accounting figures will vary from country to performance of different mergers and acquisitions.
country depending upon the GAAP prevailing in the Zollo and Singh (2004) asserted that amount of
country. But four generally applied adjustments, heterogeneity, both in defining performance and
equity equivalents, are 1. Amortization of Goodwill; approaches to measuring it has been tremendous.
2.Amortization of R&D cost; 3.LIFO reserve; Zollo& Meier identified close to twelve different
4.Adjustment for deferred tax reserves. approaches used by researchers to assess the
performance of M&As between 1970 and 2006. These N0PAT = PBIT(NNRT) ∗ (1 − T)
approaches vary along different parameters.Where PBIT (NNRT) is profit before interest and
taxes (net of non-recurring transactions)
These studies raise the question whether the M&A PBIT(NNRT) = PAT + taxprovisions +
activity on an average has benefited the shareholders interestexpenses + leaserent− extraordinaryincome
+ extraordinaryexpenses of acquiring companies? Several studies have shown
T is the effective tax rate. that the Target firms' share holder benefit the
maximum from merger gains. Unlike other capital Capital Employed investment decisions acquisitions create immediate
impact on shareholders' value. The objective of the Capital Employed can be calculated using the paper is to develop a methodology to forecast and following equation evaluate operating performance post-acquisition.
CE = CurrentAssets + NetFixedAssets −
NoninterestBearingCurrentLiabilities= One of the fundamental problem in developing a IntersestBearingDebt + method to assess the actual synergies has been the
NetWortℎLessanyNon0peratingAssets absence of basis against which the post-merger Capital Employed for EVA calculations shall be operating performance shall be compared. Only adjusted for four equity equivalents mentioned when the improvement in performance of combined above. The capital employed can also be calculated entity is more than the acquisition premium the using the below formula investment is justified. Till date most of the studies
InvestedCapital = NetWortℎ + TotalBorrowing have used return on stocks or accounting returns as With: the performance indicators. Further studies linking
the short-term market reaction and long term stock
• NetWortℎ = SℎareCapital + ReserveandSurplus − performance indicated that market reaction gives an
RevaluationReserve−AccumulatedLosses− unbiased measure of long rum impact on value of MiscellaneousExpenditure acquiring firm.
• TotalBorrowings = LongTermInterestBearingDebt
+SℎortTermInterestBearingDebt Other studies have focused on return matrices such
as return on sales, return on assets and compared To calculate EVA, we always use beginning of the them before and after the acquisition assuming past year capital employed. Also, it is advisable to use the performance as the benchmark for future book value of capital employed. performance.
LITERATURE REVIEW Shareholders have the options of investing in the
stock of two independent entities themselves and Studying M&A performance has been the focus of therefore any acquisition must be justified by multiple disciplines including, but not limited to, improved performance over and above what in Corporate Finance and Strategy. Multiple already reflected in the market prices of two stocks. approaches have been used to assess the Therefore, any performance benchmark shall be able
ISSN (O) : 2456-6675, ISSN (P) : 0972-8058
81
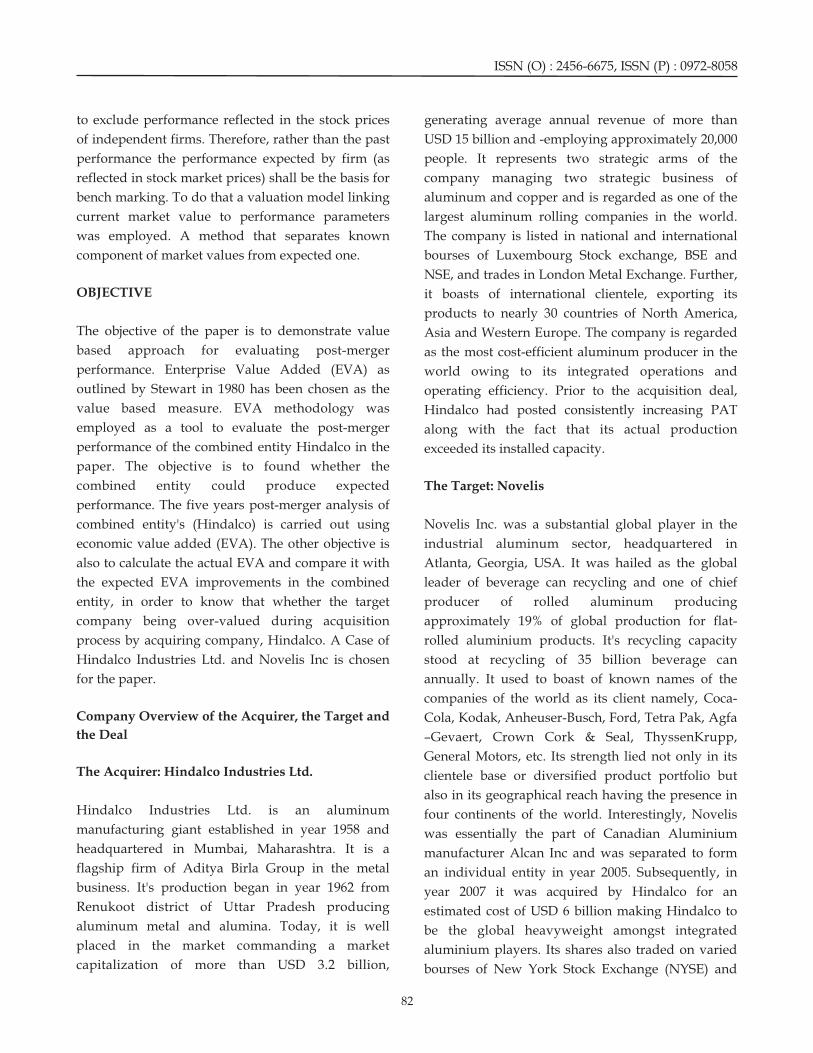
to exclude performance reflected in the stock prices generating average annual revenue of more than
of independent firms. Therefore, rather than the past USD 15 billion and -employing approximately 20,000
performance the performance expected by firm (as people. It represents two strategic arms of the
reflected in stock market prices) shall be the basis for company managing two strategic business of
bench marking. To do that a valuation model linking aluminum and copper and is regarded as one of the
current market value to performance parameters largest aluminum rolling companies in the world.
was employed. A method that separates known The company is listed in national and international
component of market values from expected one. bourses of Luxembourg Stock exchange, BSE and
NSE, and trades in London Metal Exchange. Further,
OBJECTIVE it boasts of international clientele, exporting its
products to nearly 30 countries of North America,
The objective of the paper is to demonstrate value Asia and Western Europe. The company is regarded
based approach for evaluating post-merger as the most cost-efficient aluminum producer in the
performance. Enterprise Value Added (EVA) as world owing to its integrated operations and
outlined by Stewart in 1980 has been chosen as the operating efficiency. Prior to the acquisition deal,
value based measure. EVA methodology was Hindalco had posted consistently increasing PAT
employed as a tool to evaluate the post-merger along with the fact that its actual production
performance of the combined entity Hindalco in the exceeded its installed capacity.
paper. The objective is to found whether the
combined entity could produce expected The Target: Novelis
performance. The five years post-merger analysis of
combined entity's (Hindalco) is carried out using Novelis Inc. was a substantial global player in the
economic value added (EVA). The other objective is industrial aluminum sector, headquartered in
also to calculate the actual EVA and compare it with Atlanta, Georgia, USA. It was hailed as the global
the expected EVA improvements in the combined leader of beverage can recycling and one of chief
entity, in order to know that whether the target producer of rolled aluminum producing
company being over-valued during acquisition approximately 19% of global production for flat-
process by acquiring company, Hindalco. A Case of rolled aluminium products. It's recycling capacity
Hindalco Industries Ltd. and Novelis Inc is chosen stood at recycling of 35 billion beverage can
for the paper. annually. It used to boast of known names of the
companies of the world as its client namely, Coca-
Company Overview of the Acquirer, the Target and Cola, Kodak, Anheuser-Busch, Ford, Tetra Pak, Agfa
the Deal –Gevaert, Crown Cork & Seal, ThyssenKrupp,
General Motors, etc. Its strength lied not only in its The Acquirer: Hindalco Industries Ltd. clientele base or diversified product portfolio but
also in its geographical reach having the presence in Hindalco Industries Ltd. is an aluminum four continents of the world. Interestingly, Novelis manufacturing giant established in year 1958 and was essentially the part of Canadian Aluminium headquartered in Mumbai, Maharashtra. It is a manufacturer Alcan Inc and was separated to form flagship firm of Aditya Birla Group in the metal an individual entity in year 2005. Subsequently, in business. It's production began in year 1962 from year 2007 it was acquired by Hindalco for an Renukoot district of Uttar Pradesh producing estimated cost of USD 6 billion making Hindalco to aluminum metal and alumina. Today, it is well be the global heavyweight amongst integrated placed in the market commanding a market aluminium players. Its shares also traded on varied capitalization of more than USD 3.2 billion, bourses of New York Stock Exchange (NYSE) and
ISSN (O) : 2456-6675, ISSN (P) : 0972-8058
82

Toronto Stock Exchange (TSE). outstanding common shares of Novelis at a price of
USD 44.93 per share. The deal terminated all
The Deal outstanding stock options and other equity
incentives in exchange for the cash payments. Also,
The root cause of the acquisition of a global heavy- Novelis'debt of USD 2.8 billion was acquired by
weight, NovelisInc in year 2005 the substantial loss Hindalco at a net cost of USD 6.2 billion. The
incurred by it year 2006. With global presence, shock acquisition of Novelis was actually made by the
of the sudden increase in world's Aluminum prices acquisition subsidiary of Hindalco, namely AV
was also of large scale. Between September 30 2005 Metals according to the agreement entered on
and 2006, the world's Aluminum prices witnessed an February 10, 2007. Subsequent to the acquisition,
appreciation of 39% in its prices which it was not immediately, the common shares of Novelsi were
able to pass on to its customers globally owing to transferred from AV Metals (Hindalco's subsidiary)
their earlier contract and commitments. to its wholly-owned subsidiary AV Aluminum Inc.
Consequently, a net loss of USD 275 million in year
2006 against the net income of USD 90 million in At the domestic forefront of Hindalco Industries
year 2005 was incurred by it. Ltd., the deal did not appeared to go well down with
the investors at the bourses. The stock prices of
Correspondingly, on another front Hindalco Hindalco Industries Ltd. exhibited a sharp plunge.
Industies Ltd was reflecting a fortified and For instance, the share price of Hindalce a day before
impressive position posting year-on-year profits. Its the announcement of deal was quoted at Rs.160 per
PAT increased from Rs. 686 crore in year 2002 to Rs. share. But the same share price was found at Rs.125
2564 crore in year 2007. per share when noted 10 days after the
announcement of the deal. Probably the premium of
Hence, the two contrasting positions of two Rs. 2300 crores paid by Hindalco to Novelis over and
competitors offered an attractive option to Hindalco above its estimated market value of Rs. 22100 crore
Industries Ltd to make a global imprint by acquiring was perceived by the market to be exorbitantly high.
Novelis Inc. in year 2007. The acquisition on Novelis The reaction was in accordance with the perception
by Hindalco was announced on February11, 2007, of the market as noted from Table 1.
while actual acquisition was made on May 15, 2007
post approval from Ontario Supreme Court of The details of the deal are presented in the Table 1.
Justice, Canada. Hindalco acquired all 75,415,536
METHODOLOGY that is used to evaluate performance draws heavily
from the work of Miller and Modigilani, Mark L.
Present study uses EVA as a measure of Sirower and Stephen F. O'Byrne (1998). Furthermore,
performance assessment post-merger. The model data required to carry out the successful EVA
INR 24400 CroreTotal Value of the Deal
INR 2300 CrorePremium Paid over Market Value
INR 22100 CroreMarket Value of Novelis Inc.
INR 125 per shareStock Price of Hindalco after 10 days
INR 160 per shareStock Price of Hindalco the day before
February 11, 2007Date of Announcement
Source: Bloomberg data base
ISSN (O) : 2456-6675, ISSN (P) : 0972-8058
83
Table 1

analysis of deal, has been collected from multiple
sources including NSE, companies annual report, US
Security Commission and Bloomberg.
EVA Based Performance Evaluation Model The present study seeks to study the post-merger
performance of a corporate entity. Since the
Miller and Modigilani in their paper “Dividend established objective of a firm is to create wealth for
Policy, Growth and Valuations of Shares” the stockholders, Value based parameter i.e. EVA
demonstrate that the market value is the PV of future has been chosen to measure the performance. To
Free Cash Flows (FCF) discounted at WACC. incorporate the complexities associated with a cross
However, FCF does not provide a reliable means of border M&A deal, have the adequate post-merger
operating performance because it subtracts the data to carry out the analysis and ensure that no
investment from operating profit after tax in the year further acquisition was undertaken by acquiring
of investment itself rather than spreading the firm in the period of evaluation merger deal between
investment over its entire useful life. This Hindalco Industries Ltd. and Novelis Inc. carried out thshortcoming can be eliminated by using the concept in the year 2007, 11 of February has been chosen.
of EVA (Economic Value Added) which is calculated
by subtracting c*I from NOPAT. The following steps were followed to estimate the
EVA = N0PAT − c * I post-merger performance:O -1
Where, NOPAT is the Net Operating Profit after Tax,
I is the total invested capital at the beginning of the Step 1. For both the acquirer and target entities, -1
year and c is the weighted average cost of capital. future growth value and the expectational
component of market value needs to be computed
The following relation between market value and which would also include the acquisition premium.
EVA than can be established
MV = Invested Capital + PV of Future EVA Step 2.Preparation of Performance Benchmark: Two
The above equation is important because of its parameters namely, EVA improvement where cost-
division of Market value into known and expected of-capital return represents the perpetuity value, and
component. cost of capital return on FGV are computed in this
step.
Step 3.EVA improvements is computed in this step.
Where, MV is the market value at the end of year 0, Step 4. Excess EVA improvement is subsequently 0
Cap is the book capital at the end of year 0. estimated0
Step 5. Present value of excess of EVA improvement
The first two terms of the equation give the Current needs to be computed in this step.
Operations Value (COV) while the last term gives
ANALYSES AND INTERPRETATIONthe Future Growth Value (FGV). The EVA
improvement (∆) required to ensure a rate of return
Table 2 below provides the analyses of Novelies equal to cost of capital on FGV will be given by the
(target) Inc. Table 3 provides the analyses of following formula
Hindalco Inc (The acquirer ). Table 4 gives the details
of analyses of Hindalco Industries Ltd., as a
combined entity.
Assuming zero changes in FGV the above equation
can be rewritten as follows
ISSN (O) : 2456-6675, ISSN (P) : 0972-8058
84
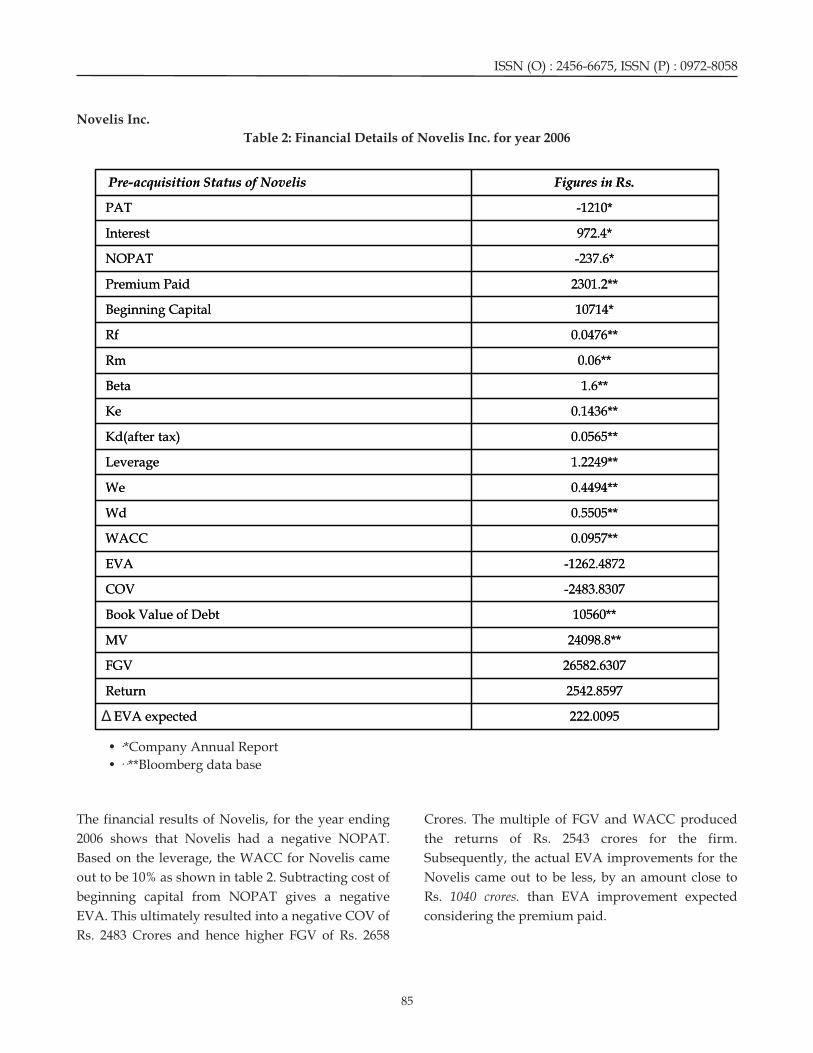
Novelis Inc.
Table 2: Financial Details of Novelis Inc. for year 2006
Δ
The financial results of Novelis, for the year ending Crores. The multiple of FGV and WACC produced
2006 shows that Novelis had a negative NOPAT. the returns of Rs. 2543 crores for the firm.
Based on the leverage, the WACC for Novelis came Subsequently, the actual EVA improvements for the
out to be 10% as shown in table 2. Subtracting cost of Novelis came out to be less, by an amount close to
beginning capital from NOPAT gives a negative Rs. 1040 crores. than EVA improvement expected
EVA. This ultimately resulted into a negative COV of considering the premium paid.
Rs. 2483 Crores and hence higher FGV of Rs. 2658
• ·*Company Annual Report
• ··**Bloomberg data base
222.0095EVA expected
2542.8597Return
26582.6307FGV
24098.8**MV
10560**Book Value of Debt
-2483.8307COV
-1262.4872EVA
0.0957**WACC
0.5505**Wd
0.4494**We
1.2249**Leverage
0.0565**Kd(after tax)
0.1436**Ke
1.6**Beta
0.06**Rm
0.0476**Rf
10714*Beginning Capital
2301.2**Premium Paid
-237.6*NOPAT
972.4*Interest
-1210*PAT
Figures in Rs.Pre-acquisition Status of Novelis
ISSN (O) : 2456-6675, ISSN (P) : 0972-8058
85

Hindalco Industries Ltd.
Table 3: Financial Details of Hindalco Inc. for year 2006
17.44389784EVA expected
162.2066524Return
1346.114384FGV
27831.61293**MV
8442**Book Value of Debt
19389.61293**Market Cap
158Share Price
1227190692Number of shares
26485.49855COV
385.2982644EVA
0.120499903**WACC
0.397102404**Wd
0.602897596**We
0.658656472**Leverage
0.047775957**Kd(after tax)
0.1684**Ke
23288*Beginning Capital
4411*Non-Interest Bearing Liabilities
8668*Current Assets
19031*Net Assets
3191.5*NOPAT
488.5*Interest
2703*PAT
Figures in Rs.Pre-acquisition Status of Hindalco Industries Ltd.
Δ
• ·*Company Annual Report
• ··**Bloomberg data base
The financial results of Hindalco, for the year ending positive COV of Rs. 26485Crores and hence lower
2006 shows that Hindalco had a positive NOPAT of FGV of Rs. 1346Crores. The multiple of FGV and
Rs.3191 crores. Based on the leverage, the WACC for WACC produced the returns of Rs. 162crores for
Hinddalco came out to be 12% as shown in table 3. Hindalco. Ltd. The change in expected EVA for
Subtracting cost of beginning capital from NOPAT Hindalco came out to be amount close to Rs.17 crore.
gives a positive EVA. This ultimately resulted into a
ISSN (O) : 2456-6675, ISSN (P) : 0972-8058
86

Hindalco Industries Ltd.: Consolidated
Table 4: Financial Details of Consolidated Hindalco Industries Ltd. after the Acquisitionfor year 2007 and
forecasted years (five in all)
-3067.97673Market Reaction
-3214.503621Capitalized Cumulative PV
-311.4966682Cumulative PV
-66.998856.89596079-184.0074369-54.24034501-63.146
PV of Excess Improvements
-112.986.4-251.7-66.8-70.1
Excess Improvement
164.8364.026.0210.8207.6? EVA Actual
277.7277.7277.7277.7277.7277.6505593? EVA expected
1662.53673.3262.32127.42094.42865.227206Return
15113.7233393.760562384.73180419339.7291519040.4326702.61146FGV
63450.0876284.6696555021.0954436730.6382462967.7154231.61293MV
4085829365239992830932353Book Value of Debt
22592.0846919.6696531022.095448421.6382430614.71Market Cap
11824516244180Share Price
1.91E+091915088557191494416319140086911.7E+09Number of shares
48336.3642890.9090952636.3636417390.9090943927.2727529.00148COV
-1109.31321.081634.75-2748.25-633.68-2377.691243EVA
0.110.110.110.110.110.107301386WACC
584213997237775423754968849688Beginning Capital
15660180171626017203
Non Interest Bearing Liabilities
32424231881927021474Current Assets
41657348013476538104Net Assets
531747185790191348322953.9NOPAT
17581839143915652209Interest
3559287943513482623PAT
Forecasted Year 5
Forecasted Year 4
Forecasted Year 3
Forecasted Year 2
Forecasted Year 1Proforma Year
Combined Entity
Observing the data of the consolidated firm, Value (COV) was found to be sufficiently high
Hindalco Industries Ltd. in the post-acquisition ranging from approximately 44000 crore estimated
space, it was observed that NOPAT was positive for in year 1 to 48000 crore estimated in year 5.
the all the years. However, EVA turned out to be Additionally, owing to higher market value than
negative for three out of five years reflecting higher COV, the future growth value turned out to be
beginning capital than the NOPAT earned by the fluctuating generally around Rs.19000 crores. The
consolidated entity. However, Current Operations return estimated by the product of FGV and WACC
ISSN (O) : 2456-6675, ISSN (P) : 0972-8058
87

REFERENCESemerged at Rs. 1900 crores approximately.
Subsequently, the improvement in EVA emerged to
1) Betas by Sector (US). (2017, January). Retrieved be Rs.70 crores for the forecasted year 1 and Rs.113
2017, from Stern, New York University: crore for the forecasted year 5.
http://pages.stern.nyu.edu/~adamodar/New_
Home_Page/datafile/Betas.htmlIn essence, results show negative EVA up to two
2) Allen, F., Bhattacharya, S., Rajan, R., & Schoar, years after acquisition despite earning positive
A. (2008, Fall). The contributions of Stewart NOPAT. This indicates that the company failed to
Myers to the theory and practice of corporate recover its cost of Capital in those years. The EVA
finance. Journal of Applied Corporate Finance, approach clearly shows that in the aftermath of
20(4).acquisition, four out of five years the actual EVA
3) Amendment to Form S-4, Registratiion statement improvements fell short of the expected EVA
under The Securities Act of 1993. (n.d.). improvements. This in present value terms
Retrieved 2017, from United States Securities culminated into the deal being overvalued to the
and Exchange Commission: tune of more than Rs.3200 Crore. The market in the
https://www.sec.gov/Archives/edgar/data/13aftermath of the merger reacted negatively and
04280/000095012309051624/g20430a1sv4za.htmconsidered the deal overvalued to the tune of
#105Rs.3068 Crore. The comparison of two results shows
4) Cording, M., Christmann, P., & Weigelt, C. (2010, that market reaction is an adequate measure of the
March). Measuring theoretically complex post-merger performance expectation for the firm.
constructs: The case of acquisition performance,
CONCLUSION strategic organization. Strategic Organization,
8(1), 11-41.
It has been illustrated that numerous approaches are 5) Dickerson, A., Gibson, H., & Tsakalotos, E. (1997,
available to assess the post-merger performance of July 3). The impact of acquisitions on company
the combined entities. However, EVA, a value based performance: Evidence from a large panel of UK
measure due to its superior methodology was firms. Oxford Economic Papers, 49(3), 344-361.
employed as a tool to evaluate the post-merger 6) Miscellaneous Links. (n.d.). Retrieved 2017, from
performance of the new entity. The value obtained Money Control: http://www.moneycontrol.com
from the analysis found that the combined entity 7) Oghuvwu&Omoye. (2016). Mergers, acquisitions
couldn't produce expected performance. The five and corporate performance: The balanced
years post-merger analysis of combined entity's scorecard approach. Accounting and Finance
performance revealed four years of negative Research, 5(4), 63-75.
economic value (EVA). This underlined that the 8) Sarkar, B. (2013, April 9). Estimating the cost of
actual EVA couldn't keep up with the expected EVA capital of CNX Nifty. Retrieved January 2017,
improvements in the combined entity, thereby from NSE India:
validating the fears of the target company being https://www.nseindia.com/research/content/
over-valued during acquisition process by acquiring RP_9_Apr2013.pdf
company, Hindalco. Most importantly, results also 9) Sirower, M., & O’Byrne, S. (1998, Summer). The
revealed negative capitalized cumulative value in measurement of post-acquisition performance:
the post-merger analysis. This indicated that the deal Toward a value-based benchmarking
was an over-priced one where the acquirer ended up methodology. Journal of Applied Corporate
paying excess premium to the target company, Finance, 11(2), 107-121.
significantly over and above the market value which 10) Wang, D., & Moini, H. (2012). Performance
did not paid them off. Assessment of Mergers and Acquisitions:
ISSN (O) : 2456-6675, ISSN (P) : 0972-8058
88

Evidence from Denmark. Retrieved 2017, from 11) Zenner, M., Hill, S., & Clark, J. M. (2008). The
E-Leader Berlin: https://www.g- most important number in Finance; The quest
casa.com/conferences/berlin/papers/Wang.pdf for the market risk premium. J P Morgan.
ISSN (O) : 2456-6675, ISSN (P) : 0972-8058
89

Financial Risk and Job Stress in Banks: An Empirical Analysis
Dr. Nidhi Dhawan
Assistant Professor, Department of Commerce, Zakir Husain Delhi College, University of Delhi, Delhi – 110007
Effulgence
Vol. 15 No. 2
July-December, 2017
Rukmini Devi Institute of Advanced Studies
E-mail : [email protected], Website : www.rdias.ac.in
http://effulgence.rdias.ac.in/user/default.aspx
Abstract
Stress in today’s life is affecting everybody at workplace. The employees of the banks are not left behind. People believe stress is
natural and some stress is required but actually stress is not at all good. Stress is causing health problems and breakdowns
whether it is less or more. The research paper examines the different stressors related to financial risk encountered by private
sector bank employees. The bank employees have to deal with the cash handling and transfer of cash, or cash management;
though computers have come but still stress of overwork and managing funds may be there. A survey instrument questionnaire
cum-scales comprising financial risk stressors was used for identifying financial risk conditions that leads to increase stress
level among employees. A Stratified sampling method was used for the selection of banks in the private sector for the present
study. The sample included 130 middle level respondent employees from private sector banks in Delhi. The survey instrument
was shown to be both reliable and valid. Statistical analytical tools such as Mann Whitney U test, Kolmogorov-Smirnov Z -
Goodness of fit test and other Descriptive statistics scores have been used. An overall analysis of total 130 respondents clearly
depicts in above table that the stress experienced by respondents is due to the Checking of genuineness of notes (2.19) followed by
its custody which is a risk taking responsibility (2.17).
Financial risk stressors, stress, banks.Keywords:
pace with this changing pattern, the life is becoming INTRODUCTIONmore and more stressful. It is not only at individual
level but also at organizational level, life is becoming tress in today's life is affecting everybody at
more stressful. Manager's role is very important in Sworkplace. The employees of the banks are not dealing with stressful situations in the organizations
left behind. People believe stress is natural and some for building a positive, motivating work culture
stress is required but actually stress is not at all which should ensure optimum utilization of the
good. Stress is causing health problems and capabilities of the team members leading to self and
breakdowns whether it is less or more. Modern life is organizational effectiveness. If the work climate is
changing very fast and since everyone wants to keep
ISSN (O) : 2456-6675, ISSN (P) : 0972-8058

not appropriate or a person is not able to adjust with organization may not have developed such a
the working environment, then tension creates a climate.
stress and then further psychological problems.
Basha and Ushashree (1997) studied on job stress
Definition of Stress and coping as related to perceptions of
organizational climate. Significant negative
Beatty (2001) Stress allows us to be at our best and relationship was found between perception of
the body needs to react appropriately when organizational climate and the amount of stress
experiencing a physical threat in order to survive. experienced by the employees.
An acute experience of stressful situation is not
harmful. It is the chronic or long term stress response Buck, (1972) has observed that both manager and
that can be dangerous to one's health. workers who felt that they were under pressure
reported that their superior always ruled with an
Selye (1974) “Stress", the word stress refers to a state iron hand and rarely tried out or allowed
of deviation or variation from normal state due to participation in decision making.
unplanned or improperly designed system or work
process resulting into failures and non- Friedlander and Margulies (1968), using perception
accomplishment of goals. A complete freedom from data from an electronics firm, studied the multiple
stress is death. impacts of organizational climate components and
individual job values on workers satisfaction. They
Selye, (1956) defined stress as the non-specific found that climate had the greatest impact on
response of the body to any demand made upon it. satisfaction with interpersonal relationships on a job,
The body's reaction to a stressor became known as a moderate impact upon satisfaction with
“General Adaptation Syndrome” (G.A.S) or the recognizable advancement in the organization, and
biological stress syndrome which includes alarm relatively less impact upon self-realization from task
reaction, resistance and exhaustion stage. involvement.
REVIEW OF LITERATURE Caplan (1974) describes how people seek out formal
helpers to intermittently augment natural supports Freedy and Hobfall (1994), pointed out that the when out-of-the-ordinary challenges or problems persistence of stress and burnout across the time arise. For example, people who are ill or exposed to a suggests the need for effective intervention personal or family crisis may seek guidance from programs. someone who has had similar experiences and can
tell them what to expect and the options they have in Cooper & Marshall (1976) Investigators have dealing with burdens and challenges. Thus, both the suggested management of stress rather its informal and formal systems can be part of a family's eradication social support network. Sources of support can allow
families to successfully navigate the difficulties they Madhu et al. (1990) conducted a study on role stress: encounter.differential influences of some antecedental factors.
173 managerial personnel from steel organization The kahn research (1964) found that persons who and 76 from petroleum organization participated in were high in neurotic anxiety also had a sensitivity the study. It was found that the petroleum to organizational stress i.e. they had lower tolerance organization has a climate which would assist the than their more stable counterparts to stressful employees in stress reduction where as the steel situations.
ISSN (O) : 2456-6675, ISSN (P) : 0972-8058
91

OBJECTIVE OF THE STUDY Data Collection
The objective of the study is to examine the The study is based on primary data. The data were
organizational stress experienced by the private collected from employees on questionnaire-cum-
sector banks employees due to financial risk scales from private sector banks in Delhi. The
stressors. The aim is to study the relationship permission was taken from the manager of a
between the financial risk stressors and stress randomly selected bank to fill the questionnaire from
perception of the employees working in private his bank employees. The information was collected
sector banks. by bank employees at middle level. The secondary
data was collected through research publications,
Hypothesis of the study standard journals, periodicals and web.
• HO1: There is no relationship between the Research Instrument – Questionnaire Method
financial risk factors and stress perception of the
employees working in private sector banks. Keeping in mind the objectives of the study, a
• HA1: There is a relationship between the questionnaire was used for identifying job situations
financial risk factors and stress perception of the and organizational conditions that leads to increase
employees working in private sector banks. stress level among employees. The questionnaire is
divided into two sections.
RESEARCH METHODOLOGY
Scope of the study (I) Section I - Demographic factors of the
respondents (gathers personal information about An attempt has been made to study and understand the respondents)the sources of organizational stress experienced by (ii) Section II-Financial Risk stressors that includes private sector banks middle level employees arising the following parameters in the questionnaire to due to financial risk stressors. The type of factors identify organizational stressorthat lead to stress and the level of stress they are
bearing. Responses on the scale were given via the use of
five-point likert type scale for financial risk stressors Sample and a standard questionnaire was used to know the
response.A stratified sampling method was used for the
selection of private sector and for selecting bank Reliability Statisticsbranches, a random selection method was used.
With an aim to assess the causes and impact of Reliability statistics by using Cronbach's alpha test financial risk stressors on employees, two and Guttman Split-Half coefficientorganizations from private sector banks (ICICI bank
and HDFC bank) were taken as sample
organizations for the present study. The sampling
population of this research is 130 employees from
private sector banks- HDFC (100), ICICI (30) form
Delhi. This research followed a stratified random
sampling method representative population. In all,
130 employees responded.
Table 1
0.8190.747(No. of items(5))
Financial risk stressors
Guttman Split-Half Coefficient
Cronbach’sAlpha
Coefficient Scale
0.8190.747(No. of items(5))
Financial risk stressors
Guttman Split-Half Coefficient
Cronbach’sAlpha
Coefficient Scale
ISSN (O) : 2456-6675, ISSN (P) : 0972-8058
92
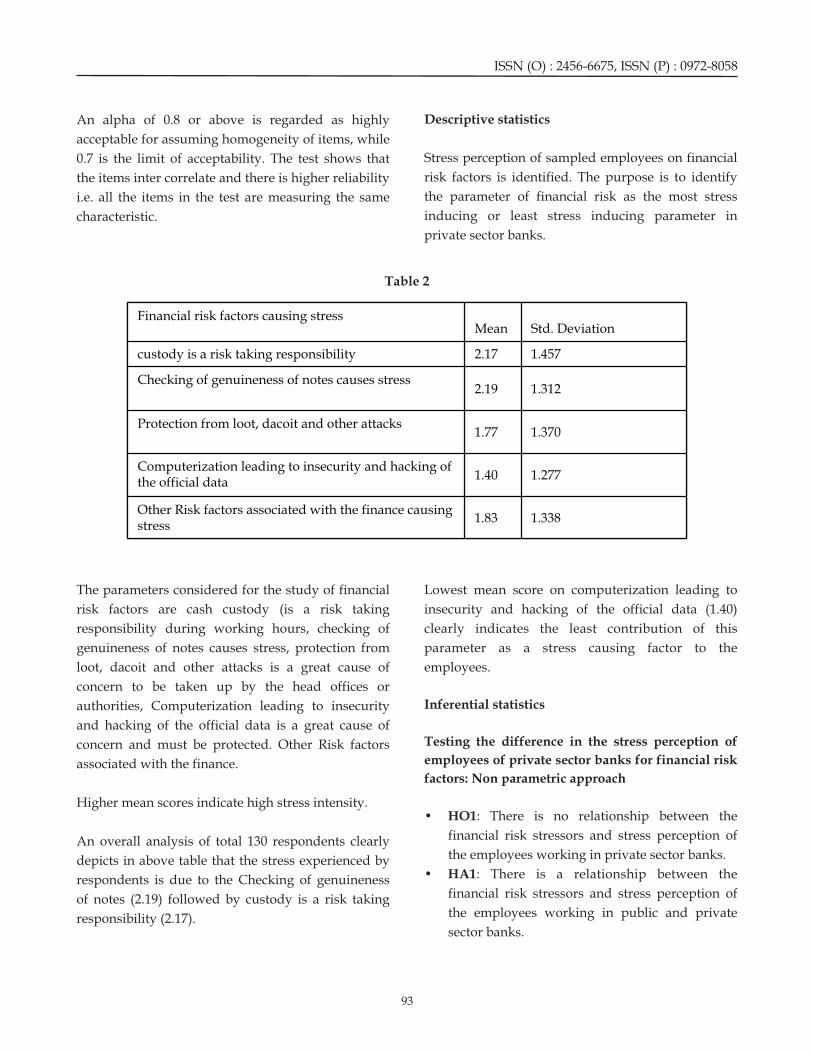
Descriptive statistics An alpha of 0.8 or above is regarded as highly
acceptable for assuming homogeneity of items, while
Stress perception of sampled employees on financial 0.7 is the limit of acceptability. The test shows that
risk factors is identified. The purpose is to identify the items inter correlate and there is higher reliability
the parameter of financial risk as the most stress i.e. all the items in the test are measuring the same
inducing or least stress inducing parameter in characteristic.
private sector banks.
Table 2
1.3381.83Other Risk factors associated with the finance causing stress
1.2771.40Computerization leading to insecurity and hacking of the official data
1.3701.77Protection from loot, dacoit and other attacks
1.3122.19Checking of genuineness of notes causes stress
1.4572.17custody is a risk taking responsibility
Std. DeviationMeanFinancial risk factors causing stress
The parameters considered for the study of financial Lowest mean score on computerization leading to
risk factors are cash custody (is a risk taking insecurity and hacking of the official data (1.40)
responsibility during working hours, checking of clearly indicates the least contribution of this
genuineness of notes causes stress, protection from parameter as a stress causing factor to the
loot, dacoit and other attacks is a great cause of employees.
concern to be taken up by the head offices or
Inferential statisticsauthorities, Computerization leading to insecurity
and hacking of the official data is a great cause of Testing the difference in the stress perception of concern and must be protected. Other Risk factors employees of private sector banks for financial risk associated with the finance.factors: Non parametric approach
Higher mean scores indicate high stress intensity.• HO1: There is no relationship between the
financial risk stressors and stress perception of An overall analysis of total 130 respondents clearly the employees working in private sector banks.depicts in above table that the stress experienced by
• HA1: There is a relationship between the respondents is due to the Checking of genuineness financial risk stressors and stress perception of of notes (2.19) followed by custody is a risk taking the employees working in public and private responsibility (2.17).sector banks.
ISSN (O) : 2456-6675, ISSN (P) : 0972-8058
93

Table 3
Table 4: Test statistics
At 5% level of significance, Mann Whitney U test by accepting the alternate hypothesis.
shows that p values significantly differ with respect
to the parameters Protection from loot, dacoit and The other two parameters custody is a risk taking
other attacks (p value=0.004) and Computerization responsibility (p=0.197) and Checking of
leading to insecurity and hacking of the official data genuineness of notes causes stress (0.258) accepts the
(0.005) Thus these two parameters of financial risk null hypothesis that there is no relationship between
factors reject the null hypothesis and establish a these parameters of financial risk stressors and stress
significant relationship between the stress perception perception of the employees of private sector banks.
of the employees working in the private sector banks
15867.50122.06Other Risk factors associated with the finance
15315.50117.81Computerization leading to insecurity and hacking of the official data
18689.00143.76Protection from loot, dacoit and other attacks
16296.50125.36Checking of genuineness of notes causes stress
17729.50136.38custody is a risk taking responsibility
Sum of RanksMean RankFinancial risk factors causing stress (N=130)
.064-1.85315867.5007352.500Other Risk factors associated with the finance causing stress
.005-2.81115315.5006800.500
Computerization leading to insecurity and hacking of the official data
.004-2.90915241.0006726.000Protection from loot, dacoit and other attacks
.258-1.13116296.5007781.500Checking of genuineness of notes causes stress
.197-1.29116200.5007685.500custody is a risk taking responsibility
Asymp. Sig. (2-tailed)Z
WilcoxonW
Mann-Whitney U
Financial risk factors causing stress
ISSN (O) : 2456-6675, ISSN (P) : 0972-8058
94

Kolmogorov-Smirnov Z - Goodness of Fit
Table 5
.0481.364-.169.000.169Other Risk factors associated with the finance causing stress
.2161.054-.131.000.131
Computerization leading to insecurity and hacking of the official data
.0671.302.000.162.162Protection from loot, dacoit and other attacks
.278.992-.123.000.123Checking of genuineness of notes causes stress
.741.682.000.085.085custody is a risk taking responsibility
NegativePositiveAbsoluteFinancial risk factors causing stress
Asymp. Sig. (2-tailed)
Kolmogorov-Smirnov Z
Most Extreme Differences
At 5% level of significance the KS Z Statistic for all this parameter as a stress causing factor to the
the parameters of financial risk stressors employees.
approximates to normal distribution. • Protection from loot, dacoit and other attacks (p
value=0.004) and Computerization leading to
Major Findings insecurity and hacking of the official data (0.005)
reject the null hypothesis.
• Among the various financial risk stressors, the
Checking of genuineness of notes causes stress CONCLUSION
(2.19) and contributes more to the stress level
followed by custody of cash is a risk taking No matter all facilities are available today and hi
responsibility (2.17). tech infrastructure has made life of the employees in
• The parameters custody is a risk taking the banks easier but still certain things are difficult
responsibility (p=0.197) and Checking of and so becomes the cause of stress. No doubt, for
genuineness of notes causes stress (0.258) accepts maximum stress relief, there must be change in one's
the null hypothesis that there is no relationship internal mental processing and perception towards
between these parameters of organizational the world. A majority of employees face severe stress
climate and stress perception of the employees related ailments and a lot of psychological problems.
of private sector banks. Protection to employees must be given when
• Lowest mean score on computerization leading financial risk stressors arises. Handling of funds in
to insecurity and hacking of the official data the banks is a major responsibility of the employees,
(1.40) clearly indicates the least contribution of so enough security must be given to the employees
ISSN (O) : 2456-6675, ISSN (P) : 0972-8058
95

in term of alarm bells, guards etc and it must be 2) Beatty, j. (2001) The Human Brain. Thousand
given by the management. This particular research Oaks”, CA: Sage.
was intended to study the financial stressors in bank 3) Buck,V. (1972) Working under pressure”,
on job stress of employee's private sector banks. If London, staples press.
organisational climate related variables such as 4) Caplan, G. (1974) Support Systems and
supportive culture, good and friendly climate, community mental health: Lectures on concept
participative working climate, clearly defined development. New York: Behavioral
authority and responsibility, proper working Publications.
conditions, worker autonomy which exert a 5) Caplan, R.D., & Jones, K.W. (1975) Effects of
significant influence on the satisfaction of work load, role ambiguity, and type A
organisational members, then definitely, it would personality on anxiety, Depression, and heart
create a stress free environment and a balanced rate”, Journal of Applied Psychology, Vol. 60,
organisation climate that would yield more satisfied pp. 713-719.
organizational members. 6) Cooper, C.L., & Marshall, J. (1976) Occupational
sources of stress. A review of Literature relating
RECOMMENDATIONS to Coronary Heart disease and Mental III-
Health. Journal of Occupational Psychology, 49,
Efforts must be made by the organisation to give full 11-28.
protection to bank employees in terms of managing 7) Freedy, J.R., & Hobfall, S.E. (1994) Anxiety Stress
funds and handling cash custody in banks, and Coping. An International Journal, 6, 4.
protection in case of any attack from outside in the 8) Friedlander, F and Margulies, N. (1999) Multiple
form of various protective measures such as alarm Impacts of Organizational Climate and
bells, guards etc. Proper training must be provided Industrial Value Systems upon Job Satisfaction”.
to enhance the knowledge of employees related to Personnel Psychology. 22, 171-183.
banking software and security of computer systems 9) Kahn, Robert L. (1964), “Psychology, Industrial;
so that all the data must be protected. Stress (Psychology); Interpersonal relations;
Organization” Wiley (New York,: p. 455-461.REFERENCES 10) Madhu, K., Ananda, T. V. and Rao, A.N., (199s0),
“Role stress: differential influences of some 1) Basha, A. and Ushashree, S., (1997) Job stress antecedent factors”, Psy. Stu., 35(1):28-35.
and coping as related to perceptions
oforganizational climate, Paper presented in 3rd
International and 34th IAAPConference, TTTI,
Chennai.
ISSN (O) : 2456-6675, ISSN (P) : 0972-8058
96
Competency based Human Resource Management System- A case study of a leading Public Sector undertaking
1Dr. Namita Gupta
2Dr. Deepa Kumari
3Dr. Bharat Gupta
1. Namita Gupta, HR facilitator & Soft, and Assistant Professor (HR) in Sharda University Greater Noida, [email protected]
2. Dr Deepa Kumari, Assistant Professor (Marketing), Sharda University Greater Noida3. Dr Bharat Gupta, JIIT, Noida, [email protected] Author
Dr. Namita Gupta, HR facilitator & Soft, and Assistant Professor (HR) in Sharda University Greater Noida, [email protected]
Effulgence
Vol. 15 No. 2
July-December, 2017
Rukmini Devi Institute of Advanced Studies
E-mail : [email protected], Website : www.rdias.ac.in
http://effulgence.rdias.ac.in/user/default.aspx
Abstract
The expectations of the dynamic world is continuously exerting pressure on the organizational systems to go beyond the job
description based employee performance which turns stagnant under a period of time. This leads to the development of
competency based management system that matches well with the pace of change in the external & internal requirements.
The proposed study aims at identifying & implementing the competency framework for an organization in manufacturing
Industry. It throws light on the methodology to be adopted while designing & implementing a competency based management
approach. It brings forth various managerial & functional competencies that support in the process of horizontal integration of
HR practices thus leading to the creation of an effective system based approach. This results in the creation of individual &
organizational road maps that provides them the requisite reference towards their goal attainment in a professional manner. It
supports in creation of link between the various HR practices like training & Development, Performance Appraisal, Career
Planning & Succession planning, Rewards & incentive Management etc as a result becomes a formulae to a more systematic &
productive organizational management.
Competency Management, Manufacturing, cluster, behavioral event interview.Keywords:
century the paucity of capital dissipated & world INTRODUCTIONeconomies started shifting from the era of capital to
the era of knowledge. This gave way to the rise of n the wake of twentieth century when capitalism
another decisive factor of production “Competence Istarted birth was the time when wealth was Management” as a new factor in the area of Human
transferred from land owners to capitalist group. Resource management. (De Geus, 1999).
The power came in the hand of those who had
capital. Over the course of the passing of twentieth
ISSN (O) : 2456-6675, ISSN (P) : 0972-8058
CASE STUDY
st With the unfolding of 21 century the value of The answer to all the above was found in the
managing the skills of employees strengthens its Competency Management approach used by the
position as a key commodity on the world market. organization.
The existing market trends toward the downsizing
LITERATURE REVIEWand streamlining of organizations place
encompassing demand upon organizations to
It would not be wrong to say that the first optimize the competencies of their human resources.
competency mapping models was developed by
Chankaya in his book Arthashastra which was Competence Mapping Practices, as subject matter for
written 3000 years ago when he mentored this research study, was selected with the aspiration
Chandragupta towards being an efficient & effective of providing complementary research information
king. Benjamin Bloom proclaimed Educationists towards the application process of competency
from USA in mid fifties attempted to bring forth the framework along with an attempt to develop
fundamentals of developing the educational insights on the realistic practices in the competency
objectives by specifying knowledge, attitudes and approach employed by Steel Authority of India Ltd.
skills as outcomes. The actual credit towards the
origin of competency management in the modern According to a recent study of 77 companies and
world goes to David McClelland who coined the almost 6000 managers and executives, the most
term “Competency” & described its difference from important corporate resource over the next 20 years
skills in ensuring effective performance.will be talent: smart, sophisticated business people
who are technologically literate, globally astute,
In 1982, Richard E.Boyatzis, David McClelland's operationally agile & highly competent. A big
partner at Hay-McBer company published “The question that arises is -How do organizations shift
Competent Manager: A Model for Effective from traditional HR practices to the new workplace
Performance” making the competency profiling a where all their practices are well aligned &
popular HRD tool in American, Briton, Canada and contributing to each other thus leading to an
Japan, etc. The authors see 'competency' as an engaged human capital.
'underlying characteristic' causally related to
superior job performance (McClelland, 1971 and In order to compete with the MNCs, Indian
Boyatzis, 1982).organizations need to have leadership that can create
strategies which provides a competitive edge to the
John Kotter and James Heskett (1992) conducted an company in the global scenario, managers who can
11-year longitudinal study at Harvard Business execute the planed strategies with utmost efficiency
School that summarizes the impact of a & workers who have the right knowledge, skills &
performance-enhancing culture (PEC) on the attitude to perform & persist in the tough
performance of the organization. The performance of competitive era. They need leaders who may not just
companies with a PEC and those without a PEC are direct but rather lead from the front. Rather than
compared according to their revenue growth, stock hiring an employee who has to be guided towards
price, and net income growth. Companies that performing a specific task, employers increasingly
fostered a performance-enhancing culture need employees who can work in a self managed
outperformed those who did in all three areas. This team & who are continually focused on the
research preposes to not just develop the right innovation of products and processes. Hence, the
processes for the system but also work onto the need for modern employees with advanced
creation of facilitating internal environment & leadership, managerial, workplace and technical
culture in-order to enhance the organizational skills to enable their employers to stay competitive.
ISSN (O) : 2456-6675, ISSN (P) : 0972-8058
98

productivity. methodology. The book included 286 studies of
entrepreneurial, technical and professional, sales,
In 1993, another acclaimed work “Competence at human service, and managerial jobs from industry,
Work: Models for Superior Performance” by government, military, health care, education and
Lyle.M.Spencer & Signe M.Spencer summarized 20 religious organizations.
years of research using the McClelland
Figure 1: Iceberg Model of Competencies
Spencer and Spencer (1993) identified five types of Knowledge and skill competencies tended to be
competency characteristics consisting of motives, visible and relatively surface characteristics of
traits, self-concept, knowledge, and skill. Motives are people whereas self-concept, trait, and motive
the things a person consistently thinks about or competencies were more hidden, deeper, and central
wants that stimulate action. Motives drive, direct, to personality. Figure 1 illustrates central and surface
and select behavior toward certain actions or goals competencies stated by Spencer & Spencer (1993).
and away from others. Traits are physical
characteristics and consistent responses to situations Competency is a common concept. It's a mode to test
or information. Self-concept is a person's attitudes, knowledge, skills, abilities, behaviors and other
values, or self-image. Knowledge is information a characteristics. There are three main categories of
person has in specific content areas and skill is the behavioral abilities that can be regarded as threshold
ability to perform a certain physical or mental task. competencies, which can be used to identify
excellent performance. These three threshold
ISSN (O) : 2456-6675, ISSN (P) : 0972-8058
99

competencies are as follows: (1) expertise and Another study conducted to check the perception
experience is a threshold level of competency; (2) regarding the six competencies defined by SHL
knowledge is a threshold competency; and (3) an framework concluded interesting facts. It was found
assortment of basic cognitive competencies, such as that their was significant difference in perceptions of
memory and deductive reasoning are threshold relative importance of an competency as per the
competencies. Therefore, competency is the levels of managers. The Senior managers valued the
integration and coordination of trans-functional Interpersonal competency much higher than the
abilities, and consists of knowledge, skills, abilities, middle managers. In the eye of Middle managers the
attitudes and behaviors. Competencies are also a value of Dynamism competency was greatly higher
behavioral approach to emotional, social, and than the perception attributed by first-line managers,
cognitive intelligence. and the Operational competency was very highly
rated by the first-line managers in comparison to the
A competency is the capability of applying or using middle managers. On the contrast it was also
knowledge, skills, abilities, behaviors, and personal observed that regarding the Leadership, Analytical,
characteristics to successfully perform critical work and Business Awareness competencies, all the three
tasks, specific functions, or operate in a given role or levels of Senior manager, middle manager & first
position. Personal characteristics may be line manager had no significant differences in
m e n t a l / i n t e l l e c t u a l / c o g n i t i v e , perceptions. (Mbozaki 2004, Wallace & Hunt 1996).
social/emotional/attitudinal, and
physical/psychomotor attributes necessary to An attempt to classify the competencies in terms of
perform the job (Dubois, 1993). distinctive & threshold competencies led to the
interesting result. The Research work defined
Heffernan and Flood (2000) outline two approaches “distinctive” as the competencies present with
to competencies, firstly the US approach and “significantly different intensity” in the best
secondly the UK approach. The predominant US performers' sub-sample (compared with the average
approach portrayed by Boyatzis, Ulrich and others performers' subsample), and “threshold” the
define competency as the underlying attributes of a competencies present with “significantly different
person. It is largely an input based approach, intensity” in the best and average performers' sub-
defining the inputs needed to demonstrate sample (compared with the poor performers'
competent performance. subsample). The research resulted in listing the
following four threshold competencies for
In contrast, the UK approach sees competency as a Production supervisors: a) efficiency orientation and
set of performances and standards. Boam and initiative (goal and action cluster); b) empathy and
Sparrow, Burgoyne and Silver among others are part group management (people management cluster).
of a group of mostly English authors who proposed
that competency was best used as a measure of The distinctive competencies (or differentators),
output learning. Training and assessment of instead, are nine: a) planning and attention to detail
performance was the thrust of this approach. (goal and action cluster), persuasiveness, self-
confidence and development of others (people
In the research conducted on global leadership management cluster); c) use of concepts, networking,
competencies the conclusive list of competencies use of technologies and social objectivity (analytic
identified by T V Rao are as: Interpersonal skills, Job reasoning cluster). ( , F.)
Domain Functional knowledge, Delegating Skills,
Approachable, Calm & Composed & Analytical The terms used in this study are defined as below: A
skills (Rao, 2007). competency is a sum of the Knowledge, Skill,
Gerli
ISSN (O) : 2456-6675, ISSN (P) : 0972-8058
100

Attitude and Aptitude required to execute a job. Moreover, convincing ROI models exist clearly
demonstrating the positive impact of competency-
Functional Competencies- These include technical based HR practices. They also found that depending
competencies that are essential to perform a specific on the complexity of job, a performance of one
job in the organization within a defined technical or standard deviation above the mean is worth between
functional area of work, such as engineering 19% and 48% economic value-added in non-sales
calculations, mechanical drawing, and tool jobs, and 48-120% increased productivity in sales
designing. jobs.
Managerial Competencies- These include 'soft' skills Significance of the study- This study aims at
that enable a person to perform well in any function, providing a glimpse at the process of developing &
such as communicating effectively, achieving implementing a competency framework for an
tangible results and creative problem solving. These organization. It brings out the identification &
are generic because they can be applied to a variety elaboration of significant competency cluster that
of different functions and technical specialties. will act as the base while integrating the various HR
activities. It will fill the knowledge gap as enough
Associated Competencies – These include technical researches has not been done towards describing the
competencies in which incumbents need to possess competency framework in the PSU's of India. This
basic awareness to be able to perform the assigned information has been often been in the hands of
responsibilities effectively. The incumbent may not either the practicing corporate person or the
be proficient or technically expert in these consultants of competency only. The study attempts
competencies but will exhibit basic understanding of to provide a step by step guide by describing &
terms and processes. explaining the information leading to the creation of
a common thread that ties the various practices of
P N khandwala 2004 in his research based on Senior organisation.
Managers Role focused on the competencies related
to manage the power structure, Initiative Profile of the Organisaton- It is the largest steel-
management, fostering innovation, higher resilience making company in India and one of the seven
& effective coping along with strong execution skills Maharatna's of the country's Central Public Sector
Enterprises.
When Competency Model is implemented
holistically in the long run it further minimises the It produces iron and steel at five integrated plants
cost of training (due to suitable recruitment), and three special steel plants, located principally in
grievance management (due to regular feedbacks). the eastern and central regions of India and situated
close to domestic sources of raw materials. It
The competency model creates a complete manufactures and sells a broad range of steel
perspective by aligning all of the HR Value Chain products. They produce iron and steel at five
practices like recruitment & selection, training & integrated plants and three special steel plants,
development, performance management, career & located principally in the eastern and central regions
succession planning etc.(Sahu,2009). of India and situated close to domestic sources of
raw materials.
Research study conducted by Hunter, Schmidt and
Judiesch (1990) found that competency based Since its inception, it has been instrumental in laying
Selection, training, Performance Management shift a sound infrastructure for the industrial
productivity curve toward Superior Performance. development of the country. Besides, it has
ISSN (O) : 2456-6675, ISSN (P) : 0972-8058
101

immensely contributed to the development of b. Observation : - verifying the statements made
technical and managerial expertise. It has triggered during the interviews.
the secondary and tertiary waves of economic c. Web Search : - contemporary researches will be
growth by continuously providing the inputs for the studied from internet.
consuming industry. d. Research of journals, periodicals, technical
materials, seminars and discussions reference
Scope of the study book, journals, published data were referred.
Indian manufacturing industry has gone through a Planning & Developing the Competency
Frameworkdramatic transformation in terms of technology
being used, market dynamics, workforce
The decision of using a competency based demographics and the skills necessary to work hence
management system was incorporated in the wake this study is important because it provides a
of a scenario in it when the organisation had to get practical manual that can act as a guiding light for
ready for expansion & fill a large number of those who aim towards creating the human capital
leadership position through a systematic succession compatibility in managing the dynamic
planning approach. In-order to ensure effective environment. The present study uncovers the gamut
management in the dynamic world a committee was of skills & competencies arranged in the form of a
formed. It aimed at taking action to devise a cluster that will have an impact on the production
systematic approach for development of leadership process in manufacturing industry. Though this
pool to occupy key positions. The committee study limits itself to the framework of one PSU but it
recommended the use of competency based is a representative to any organization which would
approach which is explained in detail in the like to create a fundamental set of critical
subsequent sections. The committee had competencies to bring unison & consistency amongst
deliberations and took inputs from various sources, the organizational skill & competency set.
within the company (through multiple workshops of
THE METHODOLOGY critical role holders) and outside the company
(industry benchmarks, competitor's practices) &
The methodology used for carrying out the research concluded in defining the key positions & the
study is as follows:- required managerial (8 competency clusters) &
technical competencies for the same, thus leading to
Primary Data: - The information is collected directly a competency framework. This was further used for
from the various stakeholders like the strategic team recruitment, appraisal, identify managerial
members, Unit head, Division head, Production developmental needs & design career path.
Managers, HR Managers & the various job
incumbent, of the target organisation with the help The base framework is referred as Leadership
of Interviews which includes both open-ended and Competency Proficiency level comprising of the
close ended questions. Eight competency clusters:
Secondary Data: - Sources used for collection of 1. Strategic Orientation
secondary data are as: 2. Customer Focus
a. Document Review: - Obtaining the actual forms 3. Commercial Acumen
and operating documents currently being used. 4. Managing Self
Reviews blank copies of forms and samples of 5. Execution Excellence
actual completed forms. 6. People Management
ISSN (O) : 2456-6675, ISSN (P) : 0972-8058
102

7. Managing External Agencies them. The Subsumed Competencies considered in
8. Change & innovation the above cluster were identified as: Organisational
sensitivity, analytical thinking, organizational &
All the competency clusters were defined. The environmental awareness, visioning & strategic
Sample Definition of the first competency cluster direction.
Strategic focus & growth orientation (SFGO) is as
“The ability to visualize the gamut of managerial Sample bars for the Managerial Competency-
responsibility required to meet the expansion plans Strategic focus & growth orientation is being
of the organization & long term opportunities for divided into 5 proficiency levels & is displayed in
sustainable growth & develop strategies for meeting the forthcoming table 1.1
Table 1: Behavior description & proficiency level requirement
These competencies are further used as base for a competencies of the candidate. They used a modified
number of HR practices. For recruitment & career version of Quan type Framework adapted to their
planning purposes the minimum technical competencies for capturing the scores of the
competency threshold for key positions was defined prospective candidate.
in terms of experience of the desired technical
competency. For example: The HR Head should be a The assessment of these competencies was done by
MBA in HR/MSW/PGDBM-HR & should have using the following identified tests: Critical
minimum 2 years experience of working on HR Incidents, Online-in-basket, Self evaluation & Case
initiatives as leadership intervention facilitator, based exercises. The mapping for each competency is
resource person for HRD etc. It use Competency demonstrated in the table 1.2.
based Application Blank to capture & record the
ISSN (O) : 2456-6675, ISSN (P) : 0972-8058
103

Table 2: Tools for assessing competency
During Performance Management in-order to special 6 module program titled “Journey towards
evaluate the senior management the organization Expertise” providing experiential understanding for
uses specific Assessment centers for General each competency cluster. External subject matter
Managers for the purpose of attaining individual experts were invited to add on the expertise on more
developmental feedbacks. These are conducted both intricate aspects which lacked internal resource
internally & Externally as per the position. persons.
Performance Management was done through online Trainings were conducted at two levels:
software in which blank forms with specified
competencies were created in which one had to fill 1. To develop in-house expertise: Train the trainer
up his activities that justified the level of proficiency programs for creating subject matter expert to
for that particular competency & finally self score. guide & counsel regarding the various
There was a counter score by the assessor who competency clusters. Programs related to
would look at the submitted data & on the basis of Customer Relationship Management,
his own assessment would enter his score. The Negotiation skills, Cost control, Stress
employee can get his scores reassessed by the level management, etc are conducted.
up reviewer in case not satisfied with the assessor's 2. In-house assessors: They were developed
appraisal. through workshop based training with special
focus on the competency of conducting
Various management development programs were Behavioural Event Interviews which was an
conducted with reference to each competency essential process tool for recruitment & also part
cluster. Senior level management was put through a of the management development Module
ISSN (O) : 2456-6675, ISSN (P) : 0972-8058
104
“Journey towards Success”. Development advantages in terms of reduced biasness, increased
Centers are used to Top Level Managers above transparency, enhanced skills, etc. The top
DGM position. management team recommended that the
organization should start talking about requisite
Training Evaluation is conducted in the form of behaviour both on a 'one-to-one' basis and in groups,
Behavioural Evaluation by making the participants as it is a prerequisite to compete in the dynamic
submit a self development action plan report within scenario. High tea with HR team type of open
90 days that provides complete description of the forums were organised to provide communication
leanings gathered & changes made subsequently in opportunities were employees could put forward
the working style. The format of the report should their doubts & attain immediate solutions. Help
have coverage of the Initiative taken, Impact of desks facility was arranged to provide one point
Initiative & a description of how the individual solution to the competency related aspects.
assessment on the development of his/her Subsequently, it took approximately two years to
competency. create an acceptability level in the employees.
CONCLUSIONThis evaluation is followed by a review workshop
within the time frame of 6 to 12 months after
The creation of competency framework acts as the compiling the reports of all the participants. The
foundation to the various short & long term activities final training effectiveness analysis of the review
in the organization related to aligning the processes workshop is being reported to the top management.
starting from procurement to the Exit of human
capital. The study highlighted the step by step Key finding that underpins all of the preceding
manual of developing a competency based findings are required to be shared by the HR head.
framework by shedding light at all the nitty-gritty After that the framework was created & shared with
required in the process. It manifested the value all the employees. It was expected that all of them
addition provided by the competency based understand it but interestingly it was later found out
approach towards bringing horizontal integration that there had been insufficient discussion of the
which can be further extended to vertical integration. required behaviours and this stemmed from a
This can finally result in a efficient & effective resistance to broach the subject. Critical role holders
system with completely integrated policies, practices were part of the discussion but rest employees were
& procedures.apprehensive of the approach & hence in their words
"Behaviour was never discussed. We didn't talk
The clarity of expected performance & about it, it's a taboo subject and it's all very
documentation of the various competency uncomfortable". One top team member said that his
framework will lead to significant increase in issue was that “No one in my unit wants to talk
productivity & employee morale. Competency about behaviour, even the performance assessors &
management would act as an integrative tool for reviewers were not clear on how to assess the
enhancing the organizational effectiveness & behaviour & counsel their subordinates. The
efficiency in the dynamic environment.subordinate did not want to listen, they didn't like it.
We hate discussing behaviour”.
The created frameworks & the implication of this
study should be valuable for the future researches Having realised the concern HR Team took
exploring towards other type of industries & comprehensive steps in terms of organising multiple
different set of competencies.training programs on the benefits of competency
based approach & highlighted its long term
ISSN (O) : 2456-6675, ISSN (P) : 0972-8058
105

BIBLIOGRAPHY & REFERENCES Competencies of Indian managers, IIMA W.P.
No.2007-06-05.
1) Boyatzis, Richard E. (1982). The competent 13) Sanghi, S.,(2007),The handbook of competency
manager, a model for effective performance. mapping: understanding, designing &
McBer and Company, John Wiley and Sons. implementing competency models, Response
2) Dubois, D. (1993). Competency-based books –sage publications, New Delhi.
performance: A strategy for organizational 14) Spencer, Lyle M. Jr., Spencer M. Signe.(1993)
change. Boston, MA: HRD Press. Competence at work: Models for superior
3) Gerli, F., Competent Production Supervisor: A performance, John Wiley & Sons, Inc
model for effective performance. Publisher: 15) U. S. Department of Labor(2010),Competency
mit.edu. Models: A Review of the Literature and The Role
4) Gupta, N., Dharwal, M., Parimoo, D., “A of the Employment and Training Administration
competence model for Supply Chain (ETA) Employment and Training
Management Professionals in the new era”, Administration
Effulgence, July ~Dec 2015, Vol-13, No.2 ,pg-40- 16) Wallace, J & Hunt,J.,(1996); An analysis of An
50 of RDIAS , New Delhi. analysis of managerial competencies across
5) Gupta, N., Gupta, B., “Analysis & Prediction of hierarchial levels & industry sectors: A
pschychological & learning trends of students by contemporary Australian perspective, Journal of
using the data mining techniques”, Effulgence- Management & Organisation, Volume: 2, Issue:
Jan~June 2014, Vol-12,No.1 of RDIAS College, 1,36-47.
New Delhi.
6) Heffernan, Margaret M. & Flood, P (2000), “ An
Exploration of the Relationships between the
Adoption of Managerial Competencies,
Organisational Characteristics, Human Resource
Sophistication and Performance in Irish
Organisations”, Journal of European Industrial
Training, Vol. 24, No. 2,3,4, pp128-136.
7) Kotter, J. & Heskett, J. (1992); Corporate culture
and performance, Free Press; Reprint edition.
8) Khandwalla, P.N.(2004); Competencies for senior
manager roles,vikalpa, Volume 29, No. 4,
October-December 2004.11.
9) McClelland, D. C.(1973); Testing for competence
rather than for intelligence. American
Psychologist, 28, 1973:1–4.
10) Mollo, SM. (etal) (2005); Leadership
competencies in a Manufacturing environment,
SA Journal of Human Resource Management, 3
(1), 34-42.
11) Mbokazi, B. etal ,(2004); Management
perceptions of competencies essential for middle
managers; SA journal of industrial
psychology,30(1),1-9.
12) Rao, TV.,(2007),Global Leadership & managerial
ISSN (O) : 2456-6675, ISSN (P) : 0972-8058
106

ISSN (O) : 2456-6675, ISSN (P) : 0972-8058
Title: Understanding the Black Economy and Black Money in IndiaAuthor: Prof. Arun KumarPublisher: ALEPH Book Company.Date: 6 Feb., 2017
Dr. Tripti Toor Bajpai
Associate Professor, Rukmini Devi Institute of Advanced Studies, [email protected]
Effulgence
Vol. 15 No. 2
July-December, 2017
Rukmini Devi Institute of Advanced Studies
E-mail : [email protected], Website : www.rdias.ac.in
http://effulgence.rdias.ac.in/user/default.aspx
BOOK-SCAN
country and only 3.5 per cent of the black income INTRODUCTIONgenerated in 2016. Even if the government managed
to suck out all the black cash in circulation, it would t is a short, kindle-size book of 112 pages, where
not have much effect on the black economy which Ihe has brought to fore many diverse facets of involves various activities in which black incomes
black money in our country and make some very are generated. It does not stop these activities from
fascinating observations. The book is an insightful continuing. Moreover, 80 per cent of the Rs 500 and
read for the simple reason that it narrated in a very Rs1, 000 notes (which constituted 86 per cent of the
comprehendible and common man language cash in circulation) was not black money, but rather
keeping the in-depth economic analysis of the white money used by businesses and common
complex phenomenon of demonetization to be citizens. Not only do a vast majority of Indians, rich
understood by all effected.and poor, use cash and not credit cards for daily
financial transactions but businesses need it for thOn 8 November, 2016 the government announced working capital to buy raw materials, pay wages and
the demonetization of all Rs 500 and Rs 1,000 notes other requirements for production and sales. What
citing two reasons — it wanted to eliminate made the situation worse was the inept execution of
counterfeit currency used by terrorists and the demonetization scheme. If over 85 per cent of a
smugglers, and it wanted to destroy the black country's currency is demonetized at one go,
economy by forcing the 'de-hoarding' of cash held by replacing it will take months if not years. The
those generating black income.capacity to print notes is limited, especially if smaller
denomination notes are required. ATMs had to be Prof. Kumar has completely appreciated the
reconfigured to take in the new notes (as they were objectives of the government, but according to him
of different dimensions than the ones they were the scheme was imposed on the country with little or
replacing) and this apparently was not thought of no forethought. First, it must be understood that the
and took much longer than anticipated. To top it was black money the government was targeting is only
the sloppiness of execution .The book points out is about 1 per cent of the black wealth held in the
the fallacious thinking behind the scheme, including
ISSN (O) : 2456-6675, ISSN (P) : 0972-8058
108
following factors - account is that each counterfeit note can only be
used by a terrorist once to finance terrorist
• Only a small amount of the black economy activity; counterfeit currency is therefore
would be affected by the demonetization… constantly being generated and the onetime
• Much of the money that was demonetized was extinguishing of counterfeit currency does not
not black cash. solve the problem. Moreover, if the old notes
• According to the Pew Research Centre, in 2015, could be counterfeited it is likely that the same
only 22 per cent of adults in India had access to will happen to the new notes. It must also be
the internet. This means the vast majority who understood that terrorist activity is not just
do not have access to the internet will be unable financed with Indian currency; it can be and is
to use online banking. fuelled by dollars, gold, diamonds, drugs and so
• Only 17 per cent of Indians have access to smart on. Terrorism is a continuing problem, not a one-
phones and consequently to mobile phone off thing.
banking.
• In a population of 1.3 billion and counting, there The book concludes that the demonetization scheme
are 24.5 million credit cards and 661.8 million will not solve the problem of the black economy.
debit cards. A fairly large number of Indians do Rather, we see that the economy has been impacted
not have access to credit or debit cards. Most in a different manner. The livelihoods of the poor
small businesses do not have card readers so the and small traders who depend overwhelmingly on
cashless economy the prime minister and his cash have been especially hit hard. They have had to
cheerleaders have been talking of cannot become cut down expenditures, leading to decline in
a reality overnight. demand across the economy. The well-off sections
• It is unlikely that black marketeers and other facing uncertainty have also become judicious and
generators of black money will suffer because discretionary in their spending expenditure on
the biggest fish were able to quickly convert things like white goods. All this has impacted
whatever black cash they had into white. Some agriculture, services and industry. As the profits of
of the avenues used, according to media reports, industries decline, they may not be able to pay their
were the purchase of jewelry, cash donations to loans soon so that the NPAs (nonperforming assets)
temples, conversion of old notes to new notes in banks will rise. As a result of this, the capacity of
with the connivance of corrupt bank officials and the banks to lend will decline further. Businesses
circulation through the Jan Dhan accounts of the facing excess capacity and uncertainty have also cut
poor. In other words, despite the massive back investment. Ever since demonetization was
exercise of demonetization, the total amount of announced, unemployment has risen, investment
black cash that has been demobilized is very has fallen, banks are facing difficulties and the crisis
small. in agriculture has been aggravated in spite of a good
• It was not explained why, when high currency monsoon. All this leads to the emergence of almost
notes were being demonetized for being the recessionary conditions in the economy.
choice of currency for black income generators to
hoard — currency of even higher denomination Deposits by people in banks is a temporary deposit
(the Rs2,000 note) was being introduced. Surely, and can only be seen as short-term lending although
this would be even easier to hoard? it was believed that when banks become flush with
• Anticipations were that the scheme would funds they could give these out as loans. It was
nullify the counterfeit currency which is thought argued that interest rates could be lowered so as to
to be used to finance terrorist activity. However, boost investment. But as soon as enough cash is
what doesn't seem to have been taken into available people will withdraw their money. Further,
ISSN (O) : 2456-6675, ISSN (P) : 0972-8058
109
the bankers were too busy dealing with cash and sections of the unorganized sector may move
handling serpentine queues, to focus on lending. towards using less cash. The government is pushing
Regarding lower interest rates leading to an increase hard for it and so are the companies involved in
in investment, this is unlikely to take place since electronic banking and related financial companies.
when capacity utilization is low, investments do not Even though all this will take time, it could help
take place. In the US, Eurozone, etc., in spite of make the economy more efficient in the medium run.
interest rates being close to zero, investment did not The proponents of this move expect that people
revive for a long time after the 2007 economic using electronic transfers of money will leave a trail
meltdown. which will make it more difficult to generate black
incomes. If this comes about, the demonetization
Further, it has been argued that the budget could would have been of some use, but all this lies in the
stand to benefit through increased tax collection as future and there is no guarantee that it will happen.
the black economy declines. However, as explained, Moreover, this move could have been initiated
the black economy is unlikely to be impacted by independently of demonetization and with adequate
demonetization. Even if there is an effect, it will be preparation.
not very significant. The bigger impact is likely to be
the advent of recessionary conditions and a decline The book concludes that the demonetization scheme
in production and incomes which will adversely has had deleterious short, mid-term and long-term
affect tax collection, leading to an increase in deficit effects. Meanwhile, illegal activities, black markets
and additional problems for the government. and real estate scams, the production of spurious
drugs, capitation fees and various other components
Nevertheless, there could be some benefit over the of the black economy will carry on albeit, after a brief
medium term. The organized sector and some hiatus.
INTERNATIONAL CONFERENCE
Rukmini Devi Institute of Advanced Studies
Organized
Paradigm Shift in World Economies:
Opportunities and Challenges
ON
April 07-08, 2017 (Friday & Saturday)
The Conference was organized with the objective of bringing together experts, academicians and researchers from
varied fields to deliberate upon the various facets of changing and changed world economy. The 2 day International
Conference on the contemporary subject of world economy undergoing a monumental shift owing to the
revolutionizing implantation of new technological seeds which now need to be nurtured effectively for further
growth and progress had experts deliberating upon sub themes -The effects of demonetization , tax reforms and the
future ,Make in India, Startup India, and Standup India., scope of human resources in digital era and strategic
options available to business organizations in today's changing scenario.
The expert Resource Persons who graced the International Conference, 2017 were-
The International Conference, 2017 included five Technical sessions and two Poster Presentations sessions
incorporating a broad range of topics and opened up new avenues for research besides enhancing the knowledge
base.
The proceedings of the conference were incorporated in two volumes covering a total of 92 valuable research papers
contributed by Researchers spanning across industry and academia.
To acknowledge the efforts of good researchers, best paper awards for each session were given away in the
valedictory session and also the best 3 papers for technical sessions and 2 from poster presentations were awarded
with cash prizes.
The International Conference, 2017 was a humble effort by Rukmini Devi Institute of Advanced Studies and the
feedback received from guest speakers and paper presenters/ participants is what keeps us motivated and
encourages us to improve upon and keep going. The International Conference, 2017 was streamed live and is
available on you tube session wise. The link to access International Conference, 2017 proceedings is
http://www.rdias.ac.in/proceedings.php
Eminent Resource Persons
Dr. Sambit Patra Prof. Arun Kumar Prof. Abhishek Nirjar Dr. J. K. Goyal
Dr. Hamendra Kumar Dangi
Mr. R. K. DubeyDr. C. P. Gupta
Prof. Anil Singh Prof. Sanjiv Mittal Prof. R. K. Mittal Prof. Debi S. Saini Prof. V. K. Seth
ISSN (O) : 2456-6675, ISSN (P) : 0972-8058
110

Effulgence: Bi-Annual Management Journal of Management
Indexed and Listed at: University Grant Commission (UGC)
J-GateImpact Factor 10.511, evaluated by ISRA
Guidelines for Authors
Perspective normally exceed 6000 words. The articles should be in clear
Effulgence is devoted to the publication of research and concise English and should be typed on A4 paper in
papers/Book Reviews/Case Studies which advance double-line spacing with wide margins. Papers submitted
knowledge through research and cases in functional areas of for consideration in Effulgence should be accompanied by a
marketing, finance, human resource development, declaration by the authors that they have not been published
operations management, general management and also or submitted for publication elsewhere. Editorial decision
macro issues of globalization, regional trade and investment. regarding articles accepted for processing in Effulgence will
The selection of papers for publication will be based on their be communicated as per schedule in call for papers. We
relevance, clarity, and originality, the extent to which they follow blind-refereed review.
advance knowledge, understanding, application and their
Copyrightlikely contribution towards inspiring further development
The manuscript should not appear in another publication.and research.
This will ensure copyright protection for both the authors
Types of Contribution and Rukmini Devi Institute of Advanced Studies. Note that
Research Paper/Case Study it is the author's responsibility to obtain permission to
The Journal attempts to maintain a balance between purely reprint long quotations or use tables, figures or graphs
research-oriented papers and those derived mainly from the previously published with copyright restrictions.
experiences of practitioners involved in the different areas of
management. In case of research-based articles, papers that General Outlines of Papers
present the results of original research analysis are accepted Your paper should contain the following items in the order
for publication in the Journal. The managerial/policy shown below:
implications of the study should be highlighted towards the 1. Title, author's affiliation and full address.
end of the paper. 2. Abstract (not more than 150 words) outlining the
purpose, scope and conclusions of the paper. The
Book Review/Scan abstract should explain why the readers should
This section covers abstract of books on management consider these results important.
especially in the areas of skill building, managerial 3. The text, suitably divided under headings and sub-
effectiveness, and macro-economic issues in development. headings to elucidate the text and to emphasize points.
The summary should not normally exceed 2000 words. 4. Acknowledgements, if any.
5. References.
Abstract 6. Tables: Tables (each on a separate sheet) should be
The manuscript should be accompanied by an abstract (not numbered consecutively in Roman numerals and
more than 150 words) of the article and introduction of should be referred to in the text as Table I, Table II etc.
authors (name's, designation/s, affiliation/s) on separate Tables should not duplicate results in graphs.
sheets. 7. Graphs: The minimum amount of descriptive text
should be used on graphs and drawings (label curves, Text points etc. with single-letter symbols). Graph axes The Research Paper/Case Study/Book Review should not should be labeled with variable written out in full, along
111

the length of the axes, with the unit in parenthesis.
8. Figures and illustrations (each on a separate sheet).
Reference Citation
Books:References (APA Style)
Cooke, Helin S. and Tate, Karen (2005), "Project Only those references; which are actually utilized in the text,
Management", Tata Mc Graw Hill.should be included in the reference list. In the text,
Rothwell, William J. and Kazanas, H. C (2007), ''Planning references should be cited with the surname of the author(s)
and Managing Human Resources", JAICO Publishing House.along with the year of publication, all in brackets. References
should be complete in all respects and alphabetically
Edited Book:arranged.
Rao, P. Mohana (2004), ''Mergers and Acquisitions of
Companies", Deep & Deep Publication Pvt. Ltd.Checklist
While submitting the article please ensure that you have
Articles in Edited Books:included the following:
Gupta, S. (2001), "Financial Institutions and Economic 1. The purpose and prospective readers for whom the
Growth", in Problems and Prospects of Development article has been targeted, the significance of your
Banking, ed. Atmanand, Delhi, International Books, pp. 412-contribution.
425.2. Appropriate context and background to your article by
referring to earlier work in the area.Journal Article:3. Practicality and usefulness of your work.Venkatrarnan, N. (1997), ''Beyond Outsourcing: Managing IT 4. Implications of the study and Identification of future Resources as a Value Center", Sloan Management Review, areas of work.38(3): 51-64 Kephart, J.Q. et al. (1997).5. Proper structuring of the paper so that it reads in a clear
and logical manner.Reports, etc:
Centre for Monitoring Indian Economy (CMlE) (2000), Submission Guideline: Monthly Review of the Indian Economy, Mumbai, May, 1. Register as Author with user id and password on p.124.Reserve Bank of India (1989), Harmonizing the Role of effulgence.rdias.ac.inOperations of Development Financial Institutions and Banks: 2. Wait for 3 working days for the activation of registrationA Discussion Paper, January.3. If account is not activated email the issue on
[email protected] and wait till approval.Newspapers:
4. If account is activated submit your research paper/book Tarapore,S.S. (1998). FIs' Days are numbered. Business
review/case study under the dropdown menu “Submit Standard, 28 August.
Article”
5. You can see further progress like review status, Managing Editor, Effulgence
comment, etc. in your log inRukmini Devi Institute of Advanced Studies
6. Once the research paper/book review/case study is 2A & 2B, Phase-I, Madhuban Chowk, Rohini, Delhi 110085.
accepted for publication, submit the declaration form in E-mail: [email protected]
your log in Dec. Form against your accepted research
paper/book review/case study.Note: The opinions expressed in the papers published in
Effulgence do not necessarily represent the views of Please don't send the manuscripts through email as attachment,
Rukmini Devi Institute of Advanced Studies, Rohini, Delhi. kindly submit online. We request authors to register first through Articles published in Effulgence should not be reproduced/ our website and use the link “Submit reprinted in any form without prior written permission.Articles” to submit your paper.
effulgence.rdias.ac.in
112