Vol. 13, No. 2 EARTH YSTEM ONITORajit/Papers/davis2002esm.pdfwell as the aesthetic value and...
12
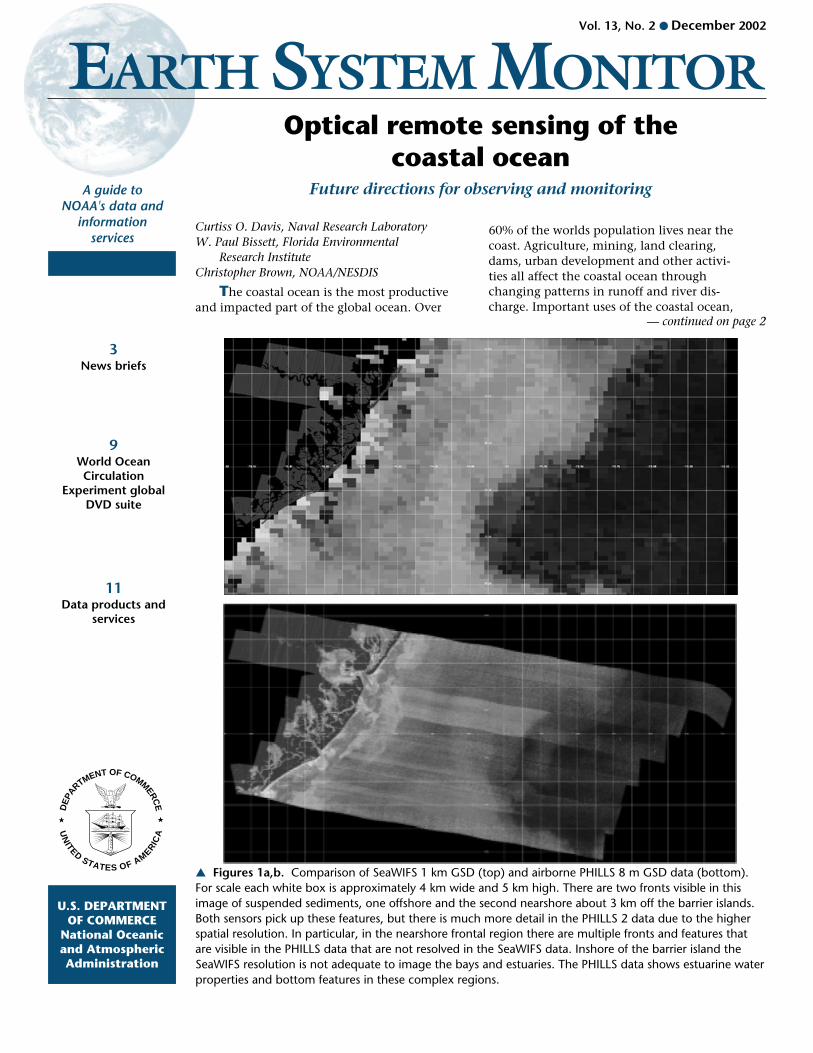
U.S. DEPARTMENT OF COMMERCE National Oceanic and Atmospheric Administration Vol. 13, No. 2 ● December 2002 E ARTH S YSTEM M ONITOR A guide to NOAA's data and information services 3 News briefs 9 World Ocean Circulation Experiment global DVD suite 11 Data products and services Optical remote sensing of the coastal ocean D E P A R T M E N T O F C O M M E R C E ★ ★ U N I T E D S T A T E S O F A M E R I C A Curtiss O. Davis, Naval Research Laboratory W. Paul Bissett, Florida Environmental Research Institute Christopher Brown, NOAA/NESDIS Future directions for observing and monitoring — continued on page 2 ▲ Figures 1a,b. Comparison of SeaWIFS 1 km GSD (top) and airborne PHILLS 8 m GSD data (bottom). For scale each white box is approximately 4 km wide and 5 km high. There are two fronts visible in this image of suspended sediments, one offshore and the second nearshore about 3 km off the barrier islands. Both sensors pick up these features, but there is much more detail in the PHILLS 2 data due to the higher spatial resolution. In particular, in the nearshore frontal region there are multiple fronts and features that are visible in the PHILLS data that are not resolved in the SeaWIFS data. Inshore of the barrier island the SeaWIFS resolution is not adequate to image the bays and estuaries. The PHILLS data shows estuarine water properties and bottom features in these complex regions. The coastal ocean is the most productive and impacted part of the global ocean. Over 60% of the worlds population lives near the coast. Agriculture, mining, land clearing, dams, urban development and other activi- ties all affect the coastal ocean through changing patterns in runoff and river dis- charge. Important uses of the coastal ocean,
Transcript of Vol. 13, No. 2 EARTH YSTEM ONITORajit/Papers/davis2002esm.pdfwell as the aesthetic value and...
U.S. DEPARTMENTOF COMMERCE
National Oceanicand AtmosphericAdministration
Vol. 13, No. 2 ● December 2002
EARTH SYSTEM MONITOR
A guide toNOAA's data and
informationservices
3News briefs
9World OceanCirculation
Experiment globalDVD suite
11Data products and
services
Optical remote sensing of thecoastal ocean
DEP
ARTMENT OF COMMERC
E
★ ★
UN
ITEDSTATES OF AMER
ICA
Curtiss O. Davis, Naval Research LaboratoryW. Paul Bissett, Florida Environmental
Research InstituteChristopher Brown, NOAA/NESDIS
Future directions for observing and monitoring
— continued on page 2
▲ Figures 1a,b. Comparison of SeaWIFS 1 km GSD (top) and airborne PHILLS 8 m GSD data (bottom).For scale each white box is approximately 4 km wide and 5 km high. There are two fronts visible in thisimage of suspended sediments, one offshore and the second nearshore about 3 km off the barrier islands.Both sensors pick up these features, but there is much more detail in the PHILLS 2 data due to the higherspatial resolution. In particular, in the nearshore frontal region there are multiple fronts and features thatare visible in the PHILLS data that are not resolved in the SeaWIFS data. Inshore of the barrier island theSeaWIFS resolution is not adequate to image the bays and estuaries. The PHILLS data shows estuarine waterproperties and bottom features in these complex regions.
The coastal ocean is the most productiveand impacted part of the global ocean. Over
60% of the worlds population lives near thecoast. Agriculture, mining, land clearing,dams, urban development and other activi-ties all affect the coastal ocean throughchanging patterns in runoff and river dis-charge. Important uses of the coastal ocean,
2 December 2002EARTH SYSTEM MONITOR
EARTH SYSTEM MONITOR
The Earth System Monitor (ISSN 1068-2678) is published quarterly by the NOAAEnvironmental Information Services office.Past issues are available online at http://www.nodc.noaa.gov/General/NODCPubs/
Questions, comments, or suggestionsfor articles, as well as requests forsubscriptions and changes of address,should be directed to the Editor,Roger Torstenson.
The mailing address for the Earth SystemMonitor is:
National Oceanographic Data CenterNOAA/NESDIS E/OC1SSMC3, 4th Floor1315 East-West HighwaySilver Spring, MD 20910-3282
EDITORR. Torstenson
Telephone: 301-713-3281 ext.107Fax: 301-713-3302
E-mail: [email protected]
DISCLAIMERMention in the Earth System Monitor ofcommercial companies or commercialproducts does not constitute an endorse-ment or recommendation by the NationalOceanic and Atmospheric Administrationor the U.S. Department of Commerce.Use for publicity or advertising purposes ofinformation published in the Earth SystemMonitor concerning proprietary productsor the tests of such products is notauthorized.
U.S. DEPARTMENT OF COMMERCEDonald Evans, Secretary
National Oceanic andAtmospheric Administration
Conrad C. Lautenbacher, Jr.,Under Secretary and Administrator
NA
TIO
NA
LO
CEA
NICAND ATMOSPHERIC
ADMIN
IST
RA
TIO
N
U.S. DEPARTMENT OF COMMER
CE
Optical remote sensing, from page 1
Curtiss O. DavisCode 7203 (Building 2, Rm 211)Naval Research Laboratory4555 Overlook Avenue, SWWashington, D.C. 20375E-mail: [email protected]
— continued on page 4
such as oil and gas production, ship-ping, and waste water disposal can havesignificant effects on ecosystem health.At the same time, the coastal ocean isthe source for 90% of the worlds fisher-ies and a growing mariculture industry.Additionally, there is extensive recre-ational use of the coastal ocean for fish-ing, water sports, sightseeing andboating. These uses depend on ahealthy coastal ecosystem to supportproductive fisheries and mariculture aswell as the aesthetic value and ecologi-cal function of salt marshes, coral reefs,kelp forests, and other ecosystems.These uses highlight the importance ofthe coastal ocean and the need formonitoring the health of the ecosys-tems within it.
Satellite remote sensing systemsshould be an excellent tool for moni-toring the coastal ocean. Optical satel-lite remote sensing systems haveproven extremely valuable for monitor-ing the health and productivity of theopen ocean and land areas. However, todate these systems have had limitedutility for the coastal ocean. To betterunderstand this, we consider severalreasons why the current systems arenot particularly useful for coastal oceanwaters. We review the types of remotesensing applications that would be use-ful in the coastal ocean and examinethe capabilities of the current systemsand their ability to meet these needs.Finally, we suggest remote sensing sys-tems that are specifically designed toobserve the coastal ocean that wouldgreatly improve our ability to monitorthis important region.
Coastal ocean remote sensingapplications
Current ocean color remote sensinginstruments are designed for the openocean where microscopic plants, calledphytoplankton, are the primary opti-cally active material in the water andother constituents vary proportionately
with their concentration. These sensorshave eight or so narrow spectral bandsfor performing atmospheric correctionand measuring and deriving the oceanproperties, and yield imagery with 1 – 4kilometer spatial resolution (IOCCG ,1998). These systems work well for im-aging the open ocean and continentalshelf, however,yet are inadequate tofully image the much more complexcoastal ocean. There are several reasonsfor this. First, the coastal ocean con-tains a wider range of water columnproperties, such as suspended sedi-ments and shallow bottom reflectance,and requires additional spectral chan-nels for accurate retrieval. Second, theprocess of atmospherically correctingocean color imagery, which removes 90– 95% of the signal received at the sen-sor, is much more difficult in thecoastal regime. The spectral bands andassumptions employed over the openocean are frequently insufficient andinvalid for performing atmosphericcorrection over coastal waters. For ex-ample, the near infrared channels nor-mally used for atmospheric correctionover the open ocean have negligiblewater-leaving radiance such that anysignal may be assumed to be solelyfrom the atmosphere or sea surface.Over coastal waters, these wavelengthsreceive significant water-leaving signalsresulting from shallow or sedimentladen reflectance that can escape thesurface waters. Therefore, additionalchannels at longer wavelengths wherelight is more strongly absorbed by thewater must be added for accurate atmo-spheric correction. Third, increaseddynamic range is required so that thesensor does not saturate when imagingthe beach or other bright objects thatare typical of a coastal scene. Fourth,coastal features are more complex spa-tially than the open ocean resultingfrom the interactions of tides, currents,and fresh waters flows, and higher spa-tial resolution is required. Finally, thecoastal ocean can be extremely dy-namic and some applications may re-quire daily to hourly sampling.
Because of the diversity of applica-tions in the coastal ocean no singlesensor system will meet all of the re-quirements. Each application hasunique requirements for spatial resolu-

3December 2002 EARTH SYSTEM MONITOR
News briefsSeventh International Conferenceon Coelenterate Biology (ICCB)
Information, registration, and ab-stract submission are now available forthe Seventh International Conference onCoelenterate Biology (ICCB) atwww.nhm.ukans.edu/inverts/iccb/.
ICCB7 will occur 6-11 July 2003 atthe University of Kansas, Lawrence. Thiswill be the first ICCB to be held in the US,and one session (or more) will be the2003 North American meeting of theInternational Society for Reef Studies.
Themes of the meeting are "biogeog-raphy and environmental biology ofcoelenterates" (anticipated sessionsinclude those on freshwater biology,bioinformatics, coral reefs, and deep-seaecology), "evolutionary and developmen-tal biology of coelenterates" (anticipatedsessions include those on taxonomy andsystematics, reproduction and develop-ment, and life cycles), and "coelenterateanatomy, physiology, and behavior"(anticipated sessions include those onneurobiology, cnidae, and gametogen-esis). Integration of presentations is anoverarching goal of the meeting.
Workshops will follow the ICCB for 1-2 days, depending on topic and numberof participants. Those being planned in-clude "electronic sources of informationabout anthozoans," and "octocoralliansystematics."
Graduate student members of ISRSwho are citizens of a developingcountry and are enrolled in graduatestudy in a developing country are eligibleto apply for a travel grant from ISRS andthe ICCB7.
We hope to see you in Kansas in July!
Contact:Daphne G. FautinProfessor,Ecology and Evolutionary BiologyCurator, Natural History Museum andBiodiversity Research CenterHaworth HallUniversity of Kansas1200 Sunnyside AvenueLawrence, Kansas 66045-7534 USA
telephone 1-785-864-3062fax 1-785-864-5321for e-mail, please use [email protected] www.nhm.ku.edu/~inverts
International Earth ObservationSatellite Group
On November 21, 2002, GregWithee, NOAA Assistant Administratorfor Satellite and Information Services,assumed chairmanship of the Commit-tee on Earth Observation Satellites(CEOS) at the conclusion of the 16thCEOS Plenary in Frascati, Italy. CEOS, thekey coordination mechanism for space-based Earth observation, now comprises23 space agencies and 21 associates (withUNESCO becoming an associate at the16th Plenary). In assuming the CEOSChairmanship, Greg Withee outllined anambitious CEOS work plan for the up-coming year that in particular will capital-ize on the need to utilize data from up to100 new satellites in the next decade,transferring the benefits to society. Build-ing upon past CEOS efforts, NOAA asCEOS Chair intends to strengthen theIntegrated Global Observing StrategyPartnership (in which CEOS interacts within situ observation providers); to empha-size satellite data utilization in connectionwith several international symposia; tolead CEOS efforts in follow-on activities tothe Johannesburg World Summit on Sus-tainable Development; and to study thepossibility of harmonization amoungCEOS and other space-related interna-tional coordination mechanisms.
New long-time series of ENSOappears in Nature
An article describing how ENSO (ElNino-Southern Oscillation) has variedover the past 12,000 years, co-authoredby NOAA’s Paleoclimatologist DavidAnderson, appeared in the November 15,2002, issue of Nature. The lead authorwas Christopher Moy, formerly of theNOAA Paleoclimatology Program and teCooperative Institute for Research in theEnvironmental Sciences and now atStanford University. The article revealshow El Nino-related floods in theEcuadrian mountains reached theirpresent level 7000 years ago, and how ElNino has varied from one millenium tothe next. The significance of the newlong-time series lies in showing that ElNino is a non-stationary aspect of climate.The data will be distributed by the NOAAPaleoclimatology Program at: http://www.ngdc.noaa.gov/paleo/pubs/moy2002/moy2002.html.
Kilimanjaro ice cores provide newEast African paleoclimate record
The National Oceanic and Atmo-spheric Administration’ (NOAA) Paleo-climatology Program has archived newice core data from Mount Kilimanjaro,whic which provides a paleoclimaticrecord for eastern equatorial Africa overthe last 11,000 years. Published by Th-ompson et al. in Science, October 18,2002, the record indicates three peri-ods of abrupt climate change: ~8.3,~5.2, and ~4 thousand years ago. Thelatter is coincident with the ”First DarkAge,” the period of the greatest histori-cally recorded drought in tropical Africa.The data and research summary can beobtained on thee NOAA Paleoclimatol-ogy Program website at: http://www.ngdc.noaa.gov/paleo/pubs/thompson2002/thompson2002.html.
Coastal GTOS meetingDavid Clark and John Kineman of
NGDC recently attended the first meetingof the Coastal Panel of the GlobalTerrestrial Observing System (GTOS), atEast Carolina University in Greenville,North Carolina. The goal of the meeting,attended by experts from academia, bothforeign and domestic, was to develop aninitial set of variables for monitoring andassessing change in the coastal zone re-lated to climate change and direct humaninfluences.
Clark and Kineman presented anoverview of coastal programs in NOAAand a discussion of issues in coastal eco-system monitoring and assessment. Apreliminary framework and initial recom-mendation of needed coastal terrestrialobservations was developed by the paneland was related to the concept of an”integrated coastal ecosystem.” Sub-groups were formed that will continue tocollaborate between meetings to finalizerecommendations. The next meeting isplanned for Spring 2003.

4 December 2002EARTH SYSTEM MONITOR
Optical remote sensing, from page 2tion, field of view, spectral bands, andsampling frequency (Table 1). In par-ticular, spatial resolution requirementsvary widely depending upon the appli-cation. For large shelf features 1 kmresolution imaging is suitable.
Applications / Issues Spatial Resolutionx Extent
TemporalResolution
Examples of suitableplatforms / sensors
River plumes, outfalls (20 m – 1 km)x (1 km – 100 km)
hours – weeks COIS, SeaWiFS,MERIS, MODIS,Geostationary
Tidal plumes, jets,frontal dynamics
(20 m – 1 km)x (1 km – 10 km)
Hours Airborne,Geostationary
Harmful algal blooms,aquaculture, coastalwater quality
(100 m – 1 km)x (1 km – 100 km)
days – weeks COIS, SeaWiFS,MODIS,Geostationary
Bathymetry andshallow benthichabitat: distribution,status
(1 m – 30 m)x (1 km – 100 km)
weeks to months Airborne platforms,COIS, Landsat TM,Ikonos, SPOT
Maritime operations:navigation, visibility.
(20 m – 1 km)x (20 km – 100 km)
Hours to days COIS, SeaWiFS,Geostationary
Oil spills. (100 m – 1 km)x (1 km – 100 km)
Hours – days Airborne, MODIS,COIS, Geostationary
Operational fisheriesoceanography
(1 km) x (1000 km) Days SeaWiFS, MODIS,Geostationary
Tidal marshes (1-30 m) x (1-20km)
Weeks to months Airborne, COISLandsat TM, SPOT
Coastalgeomorphology
(1-30 m) x (1-20km)
Weeks to months Airborne, COISLandsat TM, SPOT
Table 1: Representative applications or issues that have been addressed using remotesensing data. Spatial resolution, area coverage and temporal resolution are keyparameters to consider when selecting a sensor for each application. See Table 2 for adescription of the sensors.

5December 2002 EARTH SYSTEM MONITOR
— continued on page 6
Satellite Sensor Swath Pixel Size type Web AddressAircraft AVIRIS 2.6-11 km 5-20 m HS http:://aviris.jpl.nasa.govAircraft PHILLS 1-8 km 1-8 m HS http://rsd-www.nrl.navy.mil/7212NOAA AVHRR ~2000 km 1000 m MS http://perigee.ncdc.noaa.gov/docs/intro.htmLandsat 7 ETM+ 185 km 30 m MS http://landsat7.usgs.gov/Landsat 7 Pan 185 km 15 m Pan http://landsat7.usgs.gov/Ikonos MS 5 km 4 m MS http://www.spaceimaging.com/Ikonos Pan 5 km 1 m Pan http://www.spaceimaging.com/OrbView 2 SeaWiFS ~2000 km 1000 m MS http://seawifs.gsfc.nasa.gov/SEAWIFS.htmlTerra MODIS ~2000 km 1000 m MS http://modis.gsfc.nasa.gov/MODIS/Aqua MODIS ~2000 km 1000 m MS http://modis.gsfc.nasa.gov/MODIS/ENVISAT-1 MERIS 1150 km 300 m MS http://envisat.esa.int/COIS COIS 20 km 20 m HS http://rsd-www.nrl.navy.mil/7212SPOT 1-2-4 MS 60 km 20 m MS http://www.spot.comSPOT 1-2-4 Pan 60 km 10 m Pan http://www.spot.comSPOT 5 MS 60 km 10 m MS http://www.spot.comSPOT 5 Pan 60 km 5, 2.5 m Pan http://www.spot.com
Table 2: Characteristics of representative airborne and spaceborne instruments used inimaging the coastal zone. HS is hyperspectral, MS is multispectral and Pan ispanchromatic. The listed systems are currently on orbit except COIS which is proposedto be launched in the next three years. See the listed web pages for additionalinformation.
Existing sensors (Table 2), for example,MERIS and MODIS have the appropri-ate signal-to-noise ratio and a suite ofspectral bands for open ocean watersplus additional bands suitable for mea-suring chlorophyll fluorescence, sus-pended sediments and for atmosphericcorrection over coastal waters. Imagingat 1 km resolution allows for imagingan entire continental shelf and is par-ticularly useful for addressing large-scale ocean forcing, such as El Niñoeffects, on coastal ocean dynamics.
Closer to shore and in bays andestuaries, features are smaller andchange more quickly (Figure 1). Higherspatial resolution sensors with aGround Sample Distance (GSD) on theorder of 100 to 300 m area required.These intermediate resolution systemsare sufficient for many coastal oceanapplications that require the imaging ofdynamic water features such as frontsand red tides. The high resolutionmodes of MERIS (300 m) may be par-ticularly useful for studies of coastalfeatures that require better than 1 kmresolution, but also large area coverage.These features vary in time and space inresponse to weather and tides and ageostationary satellite instrument with
300 m or better resolution and the abil-ity to revisit a site as frequently as every30 minutes would be ideal for studies offronts, river plumes, red tides or otherdynamic features. This would be par-ticularly useful for ecological forecast-ing of the coastal ocean for a couple ofreasons. First, the physical models tendto require high (time and space) resolu-tion data to minimize forecasting er-rors, much like weather simulations.Second, the biological response to thephysical and chemical properties of thewater column is on order of minutes tohours. A daily satellite pass at a 1 kmresolution frequently misses importantecosystem structure and dynamic biom-ass change (e.g., vertical migration ofdinoflagellates) that is necessary to ini-tialize and validate predictions in thecoastal zone.
Imaging areas that include coastalor bottom features or manmade objects,such as fish farms, require 30 m or bet-ter resolution. In addition, the systemmust have many narrow spectral chan-nels and a high Signal-to-Noise Ratio(SNR) suitable to distinguish and sepa-rate the various constituents in coastalwater applications. Airborne imagingspectrometers (also called hyperspectral
imagers) have been used to demon-strate the utility of this approach. Twosystems have been used extensivelyover the past decade. The Airborne Vis-ible InfraRed Imaging Spectrometer(AVIRIS, Vane, et al, 1993) a NASA facil-ity instrument which provides veryhigh SNR data over the 400 to 2500 nmspectral range in 220, 10 nm wide spec-tral channels. Typically AVIRIS is flownon a ER-2 providing 20 m GSD datawhich is excellent for imaging the shal-low coastal ocean (Figure 2). The Por-table Hyperspectral Imager forLow-Light Spectroscopy (PHILLS, Davis,et al., 2002) is a compact portable sys-tem covering the 400 to 1000 nm spec-tral range with 128, 4.15 nm spectralchannels. PHILLS is a very high SNRsystem designed specifically designedfor imaging the coastal ocean. There areseveral PHILLS instruments which areflown on a variety of platforms to give1 to 8 m GSD data (Figure 1b).
As mentioned above, the coastalocean is very dynamic and resolvingsome processes, e.g. tides and diurnalwind forcing require several samplesper day. However, achieving this tem-poral resolution is often a function of
6 December 2002EARTH SYSTEM MONITOR
Optical remote sensing, from page 5
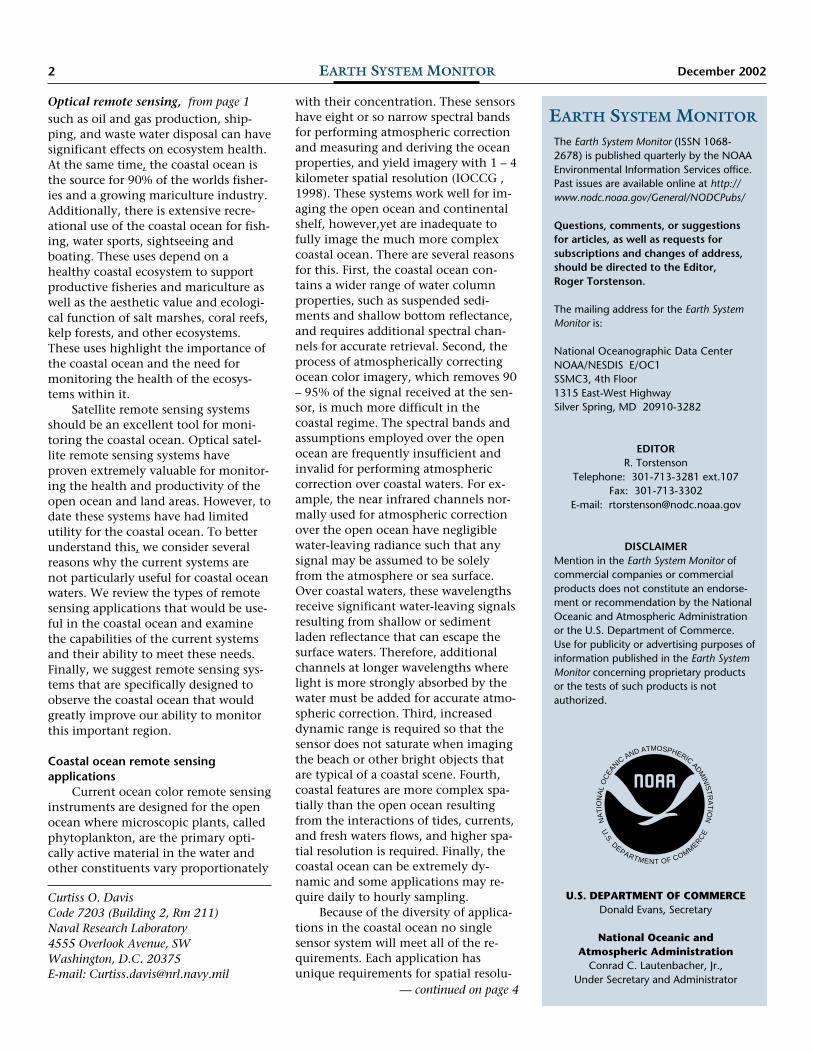
▲ Figure 2. AVIRIS 20 m GSD image of the Florida Keys. The image is 11 km wide and 36 km long, showing sand bottom (A,B,C)and a shallow reef (D). The water is very clear except for a cloud of suspended material around C that is coming out of the pass at thebottom of the image to the left of D. The Keys Highway connects several islands in the lower right corner of the image. Using Currentalgorithms (e.g. Lee et al., 2001) this type of data can be converted to detailed maps of bathymetry, bottom type, and water columnproperties.
the remote sensing platforms altitude.This relationship can be summarized as: •A single polar orbiting satellite willgive at best one image every 2-3 days. •Two polar orbiters can give dailycoverage •An imager on a geo-stationary satel-lite could give 30 minute or less repeatcoverage for areas in its field of regard •Aircraft are suitable for special studieswhich require frequent resampling of aparticular site or feature
Thus, a mix of sensor systems willbe required to properly image the fullrange of processes and features foundin the coastal ocean. Nested sampling,using one sensor to obtain large areacoverage at 300 to 1000 m resolutionfor context and another sensor to pro-vide 100 m or higher resolution imag-ing for detailed studies of the feature ofinterest, may be particularly useful toprovide a balance the needs of temporaland spatial resolution.
Sampling schemes should alwaysbe planned assuming that considerabledata will be lost due to cloudiness. Theglobal average cloud cover is 50%,therefore a good first estimate is to planto sample at least twice as often asminimally required for the plannedexperiment or application. Geostation-ary imagers, which can sample every 30minutes, provide an additional advan-tage in cloudy regions making it pos-
sible to sample during short breaks inthe clouds.
Currently available systems and theiruses
The approximately 1 km images ofthe Sea-viewing Wide Field of ViewSensor (SeaWiFS) and the ModerateResolution Imaging Spectrometer(MODIS) adequately image the largerfeatures on the continental shelf and inthe open ocean. Excellent use is beingmade of these products. Phytoplanktonchlorophyll and productivity, waterclarity and other products are routinelyproduced from this data for a variety ofapplications including Naval opera-tions, fisheries and global carbon mod-eling. Information on these and othersensors used for characterization of thecoastal ocean can be found in the websites listed in Table 2.
As noted previously, the spatialresolution, field of view, and samplingfrequency requirements of sensors forcoastal waters are closely related to theplanned application (Table 1). In thenear coastal regions, airborne instru-ments, such as AVIRIS and PHILLS,and satellite instruments, such asLandsat Thematic Mapper (TM) andSatellite Pour l’Observation de la Terre(SPOT), with their high spatial resolu-tion, have been used for mapping shal-low bottom features and, manmadeobjects and adjacent land areas.
Currently available satellite sys-tems, such as SPOT and Landsat havemoderate SNR and broad spectral bandsdesigned for the brighter land signals.Because of the spectral properties ofwater and phytoplankton absorption,and the fact that water is a very darkobject, these land sensors are not wellsuited for coastal ocean applications.For example phytoplankton absorbstrongly in the blue and backscatter inthe green. Changes in the blue/greenratio are used to estimate phytoplank-ton abundance with narrow band sen-sors, such as MODIS or hyperspectralimagers. However, both the blue andgreen are combined as the first band inLandsat and SPOT data, and there is noway to detect changes in this key pa-rameter.
Spectrally, approximately eightspectral bands are adequate to imagelarge oceanographic features (IOCCG,1998). However, additional bands maybe required for more complex scenesthat include sediments or bottom re-flectance. To assess this issue of spec-tral resolution and scene complexity,Lee and Carder (2002) used remote-sensing reflectance data collected for awide range of optically shallow andoptically deep ocean environments.The data were collected at 2 nm resolu-tion, binned to 5 nm, 10nm, 20 nmand MERIS, MODIS and SeaWiFS chan-nels, and analyzed according to the
7December 2002 EARTH SYSTEM MONITOR
procedures outlined in Lee et. al.(2001). They match the measured spec-tral radiance to a semi-analytic modelof the water column and bottom opti-cal properties and then minimize theleast squared error between the mea-sured radiances and model values toestimate the bathymetry, bottom andwater column optical properties. Forthis study the results with the 5 nmdata was considered truth. When re-sults derived from the 10 nm data werecompared against those obtained fromthe 5 nm data, they were virtually iden-tical. Results estimated with the 20 nmdata and the MERIS data channels werecomparable to the 5 nm data results fordeep water, but not as accurate for shal-low water when the bottom was visible.The MODIS and SeaWiFS data channelsdid not provide accurate retrievals ofbathymetry, however both performedwell for deep water samples. These re-sults suggest that multispectral systemswith the standard ocean color bands(IOCCG, 1998) are fine for large scaleimaging of the open ocean and conti-nental shelf. However, when the bot-tom contributes to the water-leavingsignal, an imaging spectrometer with10 nm or better spectral resolution ispreferred.
Future coastal imaging systemsGiven the continued availability of
1 km resolution imagers, such as MO-DIS, two additional observing systemswould be required to adequately ob-serve all the temporal and spatial scalesof processes and events characteristic ofthe coastal ocean. For nearshore envi-ronments, particularly when imagingthe bottom and adjacent land areas, ahigh resolution system with a groundresolution of 20 to 30 m is required.The system should be a hyperspectralimager to resolve the spectral complex-ity encountered when viewing the bot-tom. The second imager would bemoderate resolution (100 to 300 m)with a 200 km swath to cover the entirecontinental shelf.
The U.S. Navy has a strong interestin near coastal measurements and hasinvested in the development of theCoastal Ocean Imaging Spectrometer(COIS), Wilson and Davis, 1999). COISis a hyperspectral satellite instrument — continued on page 8
that is designed to meet the require-ments for measuring shallow wateroptical properties, bottom type andbathymetry. It has high sensitivity anda very high SNR to image the coastalocean at a 20 m GSD from a 400 kmorbit. The swath width is 1000 pixelsand a standard scene would 20 km x100 km. It uses an Offner spectrometerdesign and a 1024 x 1024 pixel thinnedbackside-illuminated CCD camera toachieve the required sensitivity in theblue.
The primary goals for COIS are tomap shallow water bathymetry andbottom characteristics at 20 m spatialresolution and to measure CDOM, phy-toplankton and suspended sedimentsin a wide range of coastal environ-ments. It was originally planned to flyCOIS on the Naval Earth Map Observer(NEMO), Wilson and Davis, 1999) aspart of a joint program between theU.S. Navy and a commercial partner.That program was not completed dueto lack of commercial funding. Thecurrent status is that a COIS engineer-ing model has been completed andtested to demonstrate that the designmeets all of the science requirements.The flight instrument is approximately70% complete. However, the Navy re-mains interested in completing andflying COIS and they are looking foranother opportunity to fly the COISsensor through the Department of De-fense Space Test Program.
There are additional requirementsfor water column properties at a some-what coarser resolution. Navy, NOAA,and university researchers are develop-ing dynamical models to forecast physi-cal properties (temperature, salinity,and currents) and optical properties atresolutions of 100 to 300 m for thecoastal ocean. Visible radiation is theonly electromagnetic tool that directlyprobes the water column, and so mod-els of visibility are key to naval systemsfor bathymetry, mine hunting, subma-rine detection, and submerged hazarddetection. Physical models also needSea Surface Temperature (SST) at thesame resolution for model initializationand to track the physical mixing pro-cesses that affect the optical properties.A Visible-Near Infrared Red hyper-spectral sensor with a co-registered SST
sensor with 100 m spatial resolutionwould provide essential data for thedevelopment, initialization and updat-ing of these models.
NOAA is developing the CoastalGlobal Ocean Observing System(C-GOOS) to monitor the health of thecoastal ocean, including providingwarnings of harmful algal blooms, as-sessing changes in water clarity,biodiversity and the growth of non-indigenous species (Malone and Cole,2000). A 100 m resolution hyper-spectral sensor with a co-registered SSTsensor will provide the synoptic view tocomplement the planned mooring andship based measurements and give acoherent picture of the coastal ocean.The 100 m resolution is 10 times thatof the global ocean color imagers andsufficient to image red tides, fronts,bays, estuaries and other features ofconcern for coastal management whilestill providing a broad 150 km wideswath along the coast.
To meet those Naval and NOAArequirements the Integrated ProgramOffice (IPO) is considering flying theCoastal Ocean Imager (COI) as part ofthe Ocean Observer satellite. The ideabehind the Ocean Observer is tosupplement the regular National PolarOrbiting Environmental Satellite Sys-tem (NPOESS) satellites with additionalsensors that focus on the coastal ocean.COI is a moderate resolutionhyperspectral imager which is pro-posed as part of Ocean Observer. COIwould have 64, 10 nm wide spectralchannels covering the 380 – 1000 nmspectral range, and two IR channels inthe 10 - 12 mm range for SST. Recentimprovements in array detectors makeit possible to extend down to 380 nmto detect signatures of oil spills and red-tide dinoflagellates. It would have1500 pixels across track and a scanningtelescope that would allow it to followthe coast line and sweep a 150 km wideswath that tracks the coast. It wouldhave a +/ 45 deg field of regard whichallows 2 day revisit to any coastal re-gion. It would be a small compact in-strument using proven designs andalready space qualified components tominimize cost. This high resolutionsystem would make the Ocean Observer
8 December 2002EARTH SYSTEM MONITOR
Optical remote sensing, from page 7a valuable system for dynamical modelsof the coastal ocean and for optical andbiological applications essential forNavy and NOAA missions.
In addition to establishing an ob-serving system that matches the finespatial scale of coastal environments, asecond system is required to providehigher rates of coverage in order tofully address the hourly to daily scaleevents of this region. Daily coverage ata fixed local time (near noon) providedby polar orbiting satellites is inadequateto resolve key underlying processessuch as tides and local wind forcingwhich operate at shorter time (hours todays) scales. More frequent observa-tions are required to remove the effectsof tides and to validate tidal mixingterms in coastal ecosystem models. Tostudy short-term events, data from po-lar orbiting sensors need to be aug-mented by comparable data with ahigher rate of coverage.
One feasible approach would be toplace a Visible Near Infrared (380-1000nm) imager on a geostationary plat-form. Due to the great distance of ageostationary platform from earth, thisapproach would limit the spatial resolu-tion to approximately 250 m or greater.It would, however, provide the capabil-ity to rapidly revisit to regions of inter-est greatly improving the input tomodels and the tracking of red tidesand other features of interest.
Several systems designed to rem-edy coverage constraints imposed bypolar orbiting platforms have been pro-posed. Studies have been conducted toshow the feasibility of a high spatialresolution (250 m), 18 - 20 channelmulti-spectral, instrument covering theUV-visible- near infrared (313 - 905nm) spectral range. This instrumentcould provide observations on a re-gional level as frequently as every 15minutes from Geostationary Opera-tional Environmental Satellite (GOES).High spectral resolution hyperspectralimagers have also been proposed forgeostationary orbits. These instrumentsare designed as atmospheric sounders,and tend to have courser spatial resolu-tion, but they may be adapted for dualuse for imaging the coastal environ-ment.
The high temporal and spatial reso-lution data from a geostationary sensorwould uniquely fill an existing gap inthe time-space domain of observationsof the coastal ocean facilitating studiesof short-term events and processes ofthe coastal ocean, land, and atmo-sphere. These data will permit the in-vestigation of processes of the dynamiccoastal ocean, such as tidal mixing, aswell as the study and tracking ofephemeral events in the terrestrial andatmospheric environments, includingstorm development, volcanic ashplumes, and motions of atmosphericpollutants (smoke, dust, and sulfateaerosols).
A problem with once-a-day sensorsis that clouds often degrade the numberof usable pixels from a scene of interest.However, the motion of clouds can beused with more frequent measurementsfrom a geostationary satellite, to effec-tively increase the number of cloud-freeobservations in a region of brokenclouds through cloud filtering andcompositing of multiple images. Theseattributes will strengthen our ability toappraise local conditions and predictshort-term events. Augmenting nearlycontinuous observations from geosta-tionary platforms, with higher spectralresolution data from polar orbiters, willallow the investigation of oceanic pro-cesses not possible with either platformseparately. Geostationary imagers canalso be used to extend the temporalwindow seen in intermittent observa-tions from very high spatial resolutionocean color sensors like COIS.
Conclusions and future directionsThe current remote sensing sys-
tems, such as Landsat and MODIS, havea long heritage that began in the 1970s.Forward looking engineers and scien-tists designed suitable instruments andanalyzed their data, pushing relent-lessly for more and improved sensors.That process has continued for 25 yearsand has led to the systems we havetoday.
The same long-term and dedicatedeffort is required to develop, launchand demonstrate the utility of imagersnecessary to observe and monitor thecoastal ocean. Over 60 % of the world’spopulation lives along the coast andhuman activity greatly impact the
coastal ocean. A coordinated programto monitor and protect these preciouscoastal waters is needed. Achieving thatprogram will require a coordinated ef-fort to fund, build and demonstrate theutility of the required infrastructureincluding, dedicated satellite systems,in situ monitoring systems and model-ing of the coastal ocean.
AcknowledgementsWe thank Brandon Casey (Neptune sci-
ences, Stennis, MS) for producing Figure 1 andMarcos Montes (NRL, D.C.) for Figure 2. Thiswork was supported by the Office of NavalResearch (COD and WPB) and by NOAA (CB).The opinions expressed are those of the au-thors, and should not be construed as officialpolicy of the Office of Naval Research orNOAA.
ReferencesDavis, C. O., J. Bowles, R. A. leathers, D.
Korwan, T. V. Downes, W. A. Snyder, W.J. Rhea, W. Chen, J. Fisher, W. P. Bissettand R. A. Reisse, Ocean PHILLShyperspectral imager: design, characterization, and calibration, Optics Express,10(4), 210-221, 2002.
IOCCG, Minimum Requirements for an Operational Ocean-Colour Sensor for the OpenOcean, Reports of the InternationalOcean-Colour Coordinating Group,IOCCG, Dartmouth, NS, Canada, 1, 46p., 1998.
Lee, Z. P., K. L. Carder, R. F. Chen, and T. G.Peacock, Properties of the water columnand bottom derived from Airborne VisibleInfrared Imaging Spectrometer (AVIRIS)data, J. Geophys. Research, 106(C6),11,639-11,651, 2001.
Lee, Z. P., and K. L. Carder, Effects of spectral-band number on retrievals of watercolumn and bottom properties fromocean-color data, Appl. Opt., 41(12),2191-2201.
Malone, T. C. and M. Cole, Toward a globalscale coastal ocean observing system,Oceanography 13(1), 7-11, 2000.
Vane, G., R. O. Green, T. G. Chrien, H. T.Enmark, E. G. Hansen and W. M. Porter,The Airborne Visible/Infrared ImagingSpectrometer (AVIRIS), Remote Sens.Environ., 44, 127-143, 1993.
Wilson, T., and C. O. Davis, The NavalEarthMap Observer (NEMO) Satellite,Proceedings of the SPIE, 3753, 2-11,1999. ■

9December 2002 EARTH SYSTEM MONITOR
World Ocean Circulation Experiment global dataDVD suite
Dr. L. Charles SunNational Oceanographic Data CenterNOAA/NESDIS
The World Ocean CirculationExperiment (WOCE) is the part ofthe World Climate Research Pro-gram that has used resources from30 or so countries to make unprec-edented in situ and satellite obser-vations of the global ocean. It is thefirst comprehensive global oceandata collection program that hasbeen conducted during the pastdecade. The US National Oceano-graphic Data Center (NODC), incooperation with the WOCE DataProducts Committee (DPC), hasproduced a series of suites of CD-ROMs/DVDs for each type of theWOCE data. The first version was pro-duced on CD-ROM in 1998 and Ver-sion 2.0 on CD-ROM in 2000. Sincethe issue of the WOCE Version 2 dataon CD-ROM, the WOCE DPC has beenconsidering the possibility of distribut-ing the WOCE Version 3 data on asmall number of DVDs rather than alarger number of CDs. In practicalterms it would clearly be an advantageto have all the WOCE data on 2 DVDsrather than 26 CDs. The DPC-15 meet-ing at Australia Commonwealth Scien-tific and Industrial ResearchOrganization (CSIRO) in Hobart, Aus-tralia, decided that DVD media wouldbe most advantageous for distributionof Version 3.0. The final set, WOCEGlobal Data, Version 3.0, was subse-quently produced in August 2002 anddistributed to approximately 400 par-ticipants of the WOCE and BeyondConference in San Antonio, Texas,November, 18 - 22, 2002 (WOCE DataProducts Committee, 2002).
This is one of the first times a ma-jor science program has adopted DVDmedia for publically distributing itsdata. The primary purpose of this ar-ticle is to describe the contents of theWOCE Global Data DVD. Experienceslearned from the production of theDVDs are also presented here.
WOCE structureThe structure of WOCE is a distrib-
uted system which consists of severalelements with the flow being fromPrincipal Investigators to Data Assem-bly Centers (DACs), to SpecializedAnalysis Centers (SACs), to users andthen to Archive. In addition, the DataInformation Unit (DIU) maintains in-formation on the status and location ofWOCE data sets and the InternationalProject Office (IPO) publishes a newslet-ter, about 4 times per year, reportingrecent results concerned with observa-tions, theory, and models of the ocean.IPO also publishes reports from confer-ences and Workshops. Each type ofWOCE data, a “data stream’, was accu-mulated at a DAC that had specialistknowledge of the particular kind ofdata. The WOCE data streams were:Bathymetry, Current Meters, Drifters,
Hydrography, In Situ Sea Level-FastDelivery, In Situ Seal Level-DelayedMode, Profiling Floats, Satellite SeaSurface Height, Satellite Sea SurfaceTemperature, Satellite SurfaceWinds, Sea Surface Salinity, Ship-board Acoustic Doppler CurrentProfilers, Subsurface Floats, SurfaceMeteorology, and Upper OceanThermal. In addition, two SACs,Hydrographic SAC and SurfaceFluxes SAC, were formed to generategridded fields from hydrographydata and air-sea flux products frommeteorological data, respectively.The US NODC is the long-term re-pository of the WOCE data. Al-though WOCE’s observational phaseends in 1998, many data sets willstill be processed after that time.
Some sources will be producing WOCEdata through 2002. For example, floatand drifter data from deployments inthe 1990s will continue to be acquiredto contribute to the required five-yearaverage; some current meter arrays willbe awaiting recovery, while some datastreams will be continuing and in theprocess of transition to other climateprograms. The repeat hydrography andXBT programs, which are integral partsof WOCE’s assessment of variability,will be continued under funding out-side WOCE. Some DACs, for examples,current meters and subsurface floats,ended their operations. The DIU andIPO will be closed after the final confer-ence of the WOCE program. DIU’s website will be moved to and installed atthe NODC. The new web address ofDIU ishttp://www.nodc.noaa.gov/wocediu.
DVD contents and data formatThe WOCE Global Data DVD suite
consists of two single-sided and double-layered DVDs. Each of contains a seriesof directories (also known as folders). AWeb browser is required for exploringand accessing their contents. At the top
National Oceanographic Data CenterNOAA/NESDIS, E/OC11315 East-West HighwaySilver Spring, Maryland 20910E-mail: [email protected] — continued on page 10
10 December 2002EARTH SYSTEM MONITOR
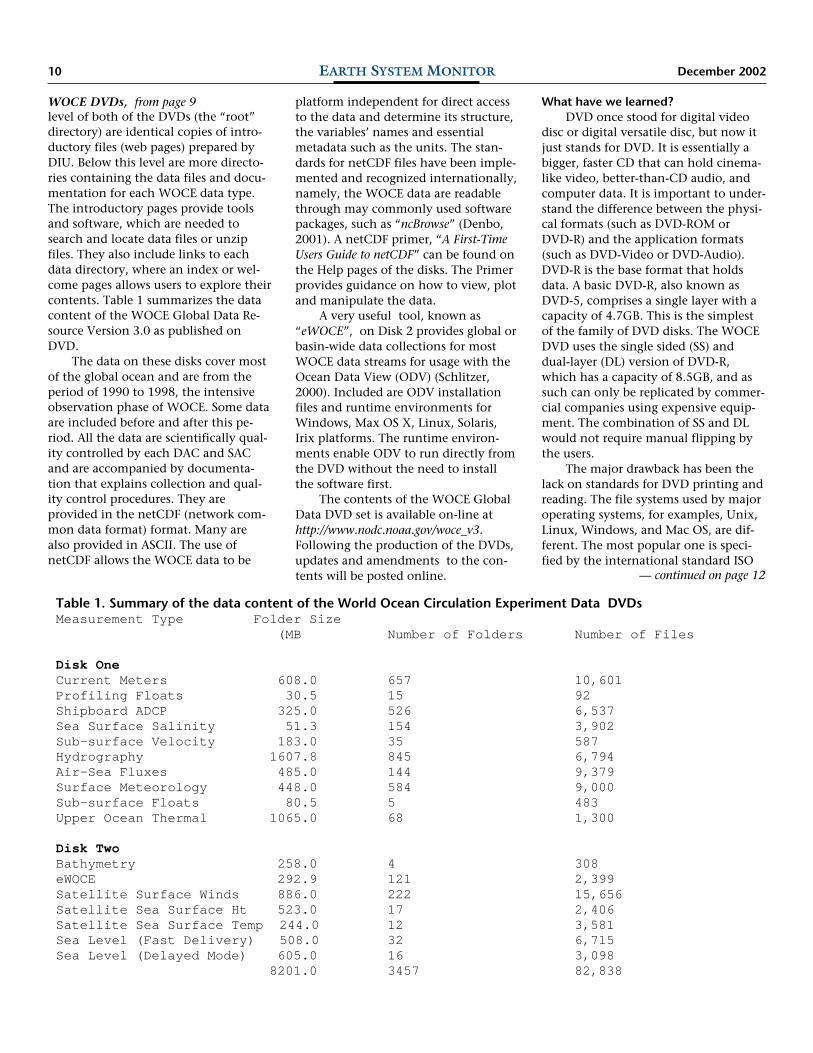
level of both of the DVDs (the “root”directory) are identical copies of intro-ductory files (web pages) prepared byDIU. Below this level are more directo-ries containing the data files and docu-mentation for each WOCE data type.The introductory pages provide toolsand software, which are needed tosearch and locate data files or unzipfiles. They also include links to eachdata directory, where an index or wel-come pages allows users to explore theircontents. Table 1 summarizes the datacontent of the WOCE Global Data Re-source Version 3.0 as published onDVD.
The data on these disks cover mostof the global ocean and are from theperiod of 1990 to 1998, the intensiveobservation phase of WOCE. Some dataare included before and after this pe-riod. All the data are scientifically qual-ity controlled by each DAC and SACand are accompanied by documenta-tion that explains collection and qual-ity control procedures. They areprovided in the netCDF (network com-mon data format) format. Many arealso provided in ASCII. The use ofnetCDF allows the WOCE data to be
platform independent for direct accessto the data and determine its structure,the variables’ names and essentialmetadata such as the units. The stan-dards for netCDF files have been imple-mented and recognized internationally,namely, the WOCE data are readablethrough may commonly used softwarepackages, such as “ncBrowse” (Denbo,2001). A netCDF primer, “A First-TimeUsers Guide to netCDF” can be found onthe Help pages of the disks. The Primerprovides guidance on how to view, plotand manipulate the data.
A very useful tool, known as“eWOCE”, on Disk 2 provides global orbasin-wide data collections for mostWOCE data streams for usage with theOcean Data View (ODV) (Schlitzer,2000). Included are ODV installationfiles and runtime environments forWindows, Max OS X, Linux, Solaris,Irix platforms. The runtime environ-ments enable ODV to run directly fromthe DVD without the need to installthe software first.
The contents of the WOCE GlobalData DVD set is available on-line athttp://www.nodc.noaa.gov/woce_v3.Following the production of the DVDs,updates and amendments to the con-tents will be posted online.
What have we learned?DVD once stood for digital video
disc or digital versatile disc, but now itjust stands for DVD. It is essentially abigger, faster CD that can hold cinema-like video, better-than-CD audio, andcomputer data. It is important to under-stand the difference between the physi-cal formats (such as DVD-ROM orDVD-R) and the application formats(such as DVD-Video or DVD-Audio).DVD-R is the base format that holdsdata. A basic DVD-R, also known asDVD-5, comprises a single layer with acapacity of 4.7GB. This is the simplestof the family of DVD disks. The WOCEDVD uses the single sided (SS) anddual-layer (DL) version of DVD-R,which has a capacity of 8.5GB, and assuch can only be replicated by commer-cial companies using expensive equip-ment. The combination of SS and DLwould not require manual flipping bythe users.
The major drawback has been thelack on standards for DVD printing andreading. The file systems used by majoroperating systems, for examples, Unix,Linux, Windows, and Mac OS, are dif-ferent. The most popular one is speci-fied by the international standard ISO
Table 1. Summary of the data content of the World Ocean Circulation Experiment Data DVDsMeasurement Type Folder Size
(MB Number of Folders Number of Files
Disk OneCurrent Meters 608.0 657 10,601Profiling Floats 30.5 15 92Shipboard ADCP 325.0 526 6,537Sea Surface Salinity 51.3 154 3,902Sub-surface Velocity 183.0 35 587Hydrography 1607.8 845 6,794Air-Sea Fluxes 485.0 144 9,379Surface Meteorology 448.0 584 9,000Sub-surface Floats 80.5 5 483Upper Ocean Thermal 1065.0 68 1,300
Disk TwoBathymetry 258.0 4 308eWOCE 292.9 121 2,399Satellite Surface Winds 886.0 222 15,656Satellite Sea Surface Ht 523.0 17 2,406Satellite Sea Surface Temp 244.0 12 3,581Sea Level (Fast Delivery) 508.0 32 6,715Sea Level (Delayed Mode) 605.0 16 3,098
8201.0 3457 82,838
WOCE DVDs, from page 9
— continued on page 12
11December 2002 EARTH SYSTEM MONITOR
Data productsand services
CONTACT POINTS
National Climatic Data Center(NCDC)
828-271-4800Fax: 828-271-4876
E-mail: Climate Services [email protected]
Satellite Services [email protected]
WWW: http://www.ncdc.noaa.gov/
National Geophysical Data Center(NGDC)
303-497-6826Fax: 303-497-6513
E-mail: [email protected]: http://www.ngdc.noaa.gov/
National Oceanographic Data Center(NODC)
301-713-3277Fax: 301-713-3302
E-mail: [email protected]: http://www.nodc.noaa.gov/
NOAAServer Data Directory301-713-0575
Fax: 301-713-0819E-mail: [email protected]
WWW: http://www.eis.noaa.gov/
NOAA Central LibraryReference Services:
301-713-2600Fax: 301-713-4599
E-mail: [email protected]: http://www.lib.noaa.gov/
GOES SXI archive and publicinterface
Several major milestones werereached in the FY02 phase in the develop-ment of the Geostationary OperationalEnvironmental Satellite Solar X-Ray Imager(GOES SXI) archive and public interface.Software was completed permitting usersto browse, summarize, and search SXIdata. Software to generate and accessmovies of all SXI images was also com-pleted. Hardware has been integrated intothe system that will permit the onlinestorage of all browse imagery. Archivaland retrieval of SXI images is accom-plished through a tape robotics system.The 100,000 images collected during thePost Launch Test phase have been used totest all phases of development and arecurrently available through the publicinterface at http://sxi.ngdc.noaa.gov.Contact: NGDC
New U.S. Climate Atlas nowavailable
The new CD-ROM (version 2.0) ofthe Climate Atlas of the United States,which contains climate maps for all 50states, is now available from the NationalClimatic Data Center. This atlas replacesthe popular paper copy of the ClimaticAtlas of the United States, published in1968, and supersedes the Climatic Atlasof the Contiguous United States CD-ROM(version 1.0), which was published in2000. The new atlas contains over 2000maps which depict temperature, precipi-tation, snow, and other parameters for allareas of the U.S. and includes Alaska andHawaii, which were not on the version1.0 CD-ROM. The station data for 7700locations used to produce the atlas maps,along with detailed documentation, arealso contained on the CD-ROM.Contact: NCDC
International Seabed Authority(ISA) Central Data Repository
The United Nations-sponsored ISAhas just released its new marine mineralsCentral Data Repository online. Currently,the repository consists of geochemicaldata on polymetallic nodules and ferro-manganese crusts obtained from theNOAA and Minerals Management Service(MMS) Marine Minerals CD-ROM dataset; this was produced by NGDC in coop-eration with NOS (NOAA’s NationalOcean Service) and MMS in 1992 from adecade-long collaboration.
The ISA has reformatted data fromthe original CD-ROM and is offering it onthe web, citing NGDC as the originalcompiler. The ISA intends to archive thepublic portions of their new Central DataRepository at NGDC through the mecha-nism of the World Data Center for MarineGeology and Geophysics, Boulder.Contact: NGDC
Nighttime lights featuredNGDC’s Nighttime Lights of the
World were featured on the cover of theSeptember-November (volume 39) issueof the UN Chronicle special issue titled”Sustainable?” The issue and cover areavailable online athttp://www.un.org/Pubs/chronicle/2002/issue3/0302cont.htm.Contact: NGDC
NOAA providing data for oil spillin Spain
On November 21, 2002, NOAA re-ceived an official request from the Gov-ernment of Spain for assistance with theoil spill from the tanker Prestige, whichbroke up and sank off the coast of Spainon November 18. In support of that re-quest, the National Satellite Data andInformation Service (NESDIS) is acquiringsynthetic aperture radar (SAR) data andwill provide the analysis for the NationalOcean Service response and restorationefforts. The SAR data provides imageryshowing oil location and extant, and canalso show water currents so as to assistwith assessment of spread. Additionally,NESDIS is providing available marine dataand near-coastal surface data for Spainand Portugal to NOAA’s Hazardous Mate-rials (HazMat) office. The data were re-quested to provide a climatology forlong-range forecasting. Using the histori-cal wind data extracted from NationalClimatic Data Center’s databases, theHazMat team can sample the data toascertain the probabilities of oil moving invarious directions.Contact: ESDIM
New image products availablethrough SSM/I browse system
A new version of the National Cli-matic Data Center’s Special Sensor Micro-wave Imager (SSM/I) Browse System wasplaced online to provide access to a sig-nificant number of new climate productsthat are derived from the SSM/I, a polar-orbiting satellite with global coverage.These new products include weekly andmonthly anomalies and full fields for sur-face wetness, temperature, and snowcover for 11 regions around the worldfrom the period January 1988 to the latestavailable week. Global-gridded data filesare also now accessible through the sys-tem for each SSM/I product. In all, over57,000 images and 4000 data files areavailable. In addition, a new JAVA loopingfeature has been added to the systemwhich allows users to view an animatedloop tailored to their specifications. TheSSM/I Browse System was created, and iscurrently maintained, via a cooperativeeffort involving personnel from NCDC’sData Access Branch and the ClimateAnalysis Branch.Contact: NCDC
12 December 2002EARTH SYSTEM MONITOR
Address C
orrection Requested
OFFIC
IAL BU
SINESS
Penalty for Private Use $300
40U
.S. DEP
AR
TM
ENT
OF C
OM
MER
CE
Natio
nal O
ceanic an
d A
tmo
sph
eric Ad
min
istration
Publication Distribution Facility
1315 East-West H
ighway
Silver Spring, M
D 20910-3282
ATTN
: Earth System M
onitor
WOCE DVDs, from page 109660. This standard specifies a veryminimal file system, which every oper-ating system should be able to map it toits native system. However, for normalUnix use, the ISO 9660 file system isnot usable. Unix only supports an ex-tension to the standard, called the RockRidge extension. Rock Ridge allowslonger filenames and symbolic links.Rock Ridge file system is still a valid ISO9660 file system, making it usable bynon-UNIX systems as well. Linux sup-ports both ISO 9660 and the Rock Ridgeextensions; the extensions are recog-nized and used automatically. However,the technology for creating a DVD withRock Ridge extensions was not reliableat the time when the WOCE DVDs wereproduced, we feel it is best to follow thepath of creating the DVDs using theISO/UDF (Uniform Data Format) bridgeoption with it’s 8-level and 32-characterfile naming convention limitations.The ISO/UDF format is the only formatwhich assures compatibility across dif-ferent platforms and Operating Systems.The drawback for Unix users is it shouldbe mounted as a UDF file system. De-spite extensive efforts, it has not beenpossible to master the DVDs with RockRidge (RR) extensions. There is plenty ofmastering software for single-layerDVDs with RR extensions, but only onethat we have found that could be uti-lized by the replication company toproduce double-layer DVDs with RRextensions. Unfortunately, this softwaredid not produce a robust, stable trialdisk. The disk caused various problemswhen mounted as “hsfs” in Solaris ma-chines. Therefore the WOCE V3 DVDsdo not have Rock Ridge extensions andthe current releases of Solaris do notmount it correctly. Sun is aware of theproblem (of udfs disks mounting ashsfs) and it has a bug number.
SummaryThe WOCE DVDs were produced
on time for distributing at the WOCEand Beyond Conference in San Antonio,Texas, November, 18 - 22, 2002. TheDVDs were a highlight of the meeting.The contents of the WOCE Global DataDVD set is available on-line at http://www.nodc.noaa.gov/woce_v3. Followingthe production of the DVDs, the US
NODC continue to provide supports forupdates and amendments to the con-tents of the DVDs. They will be postedonline.
The technology for creating a DVDwith Rock Ridge extensions was notreliable at the time when the WOCEDVDs were produced. The WOCE DVDuses the ISO/UDF (Uniform Data For-mat) bridge option with it’s 8-level and32-character file naming conventionlimitations. The ISO/UDF format is theonly format which assures compatibilityacross different platforms and OperatingSystems. The drawback for Unix users isit should be mounted as a UDF file sys-tem.
ReferencesDenbo, D.W. 2001. “ncBrowse: A Graphical
netCDF File Browser.” Presented at the17th International Conference on Interac-tive Information and Processing Systemsfor Meteorology, Oceanography, andHydrology, January 15-18, Albuquerque,NM.
Schlitzer, R., 2000: Electronic Atlas of WOCEHydrographic and Tracer Data Now Avail-able. EOS Trans. AGU 81(5), 45.
WOCE Data Products Committee, 2002: WOCEGlobal Data, Version 3.0. WOCE Interna-tional Project Office, WOCE Report No.180/02, Southampton, UK.
AcknowledgementsMany countries, agencies, institutions, and
individuals have played important roles in thecreation of the WOCE Data DVDs. It is notpossible to identify and thank individual sourcesof data here, but the most important contribu-tors are the collectors of the original data. With-out their efforts, this compilation of data andinformation would not have been possible.
The WOCE DPC devised the original con-cept of the WOCE Global Data disks, andguided their production and content. The DVDcontents were constructed by the DACs, SACs,and DIU. The author is very grateful for theircontribution to this package.
Thanks are also due to Ms. Shannon Nioufor checking the contents of the WODC DVDsand testing their web pages’ linkages. Theauthor would also like to thank American MediaInternational, Ltd. for DVD glass mastering,replication, and duplication of the DVDs .
The US NODC provided funding for theproduction of the WOCE Data DVDs. ■