VOIP WEATHERMAP A VOIP QOS COLLECTION …researchbank.rmit.edu.au/view/rmit:160037/Gao.pdf · 2.2...
112
i VOIP WEATHERMAP A VOIP QOS COLLECTION ANALYSIS AND DISSEMINATION SYSTEM A THESIS SUBMITTED IN FULFILLMENT OF THE REQUIREMENTS FOR THE DEGREE OF MASTER OF ENGINEERING Shengbin Gao B.Sc SCHOOL OF ELECTRICAL AND COMPUTER ENGINEERING SCIENCE, ENGINEERING AND TECHNOLOGY PORTFOLIO RMIT UNIVERSITY MELBOURNE, AUSTRALIA 2009
Transcript of VOIP WEATHERMAP A VOIP QOS COLLECTION …researchbank.rmit.edu.au/view/rmit:160037/Gao.pdf · 2.2...

i
VOIP WEATHERMAP
A VOIP QOS COLLECTION ANALYSIS
AND DISSEMINATION SYSTEM
A THESIS SUBMITTED IN FULFILLMENT
OF THE REQUIREMENTS FOR THE DEGREE OF MASTER OF
ENGINEERING
Shengbin Gao
B.Sc
SCHOOL OF ELECTRICAL AND COMPUTER ENGINEERING
SCIENCE, ENGINEERING AND TECHNOLOGY PORTFOLIO
RMIT UNIVERSITY
MELBOURNE, AUSTRALIA
2009

i
Preface
Abstract
Current trends point to VoIP as a cheaper and more effective long term solution than
possible future PSTN upgrades. To move towards greater adoption of VoIP the future
converged digital network is moving towards a service level management and control
regime. To ensure that VoIP services provide an acceptable quality of service (QoS) a
measurement solution would be helpful. The research outcome presented in this thesis is
a new system for testing, analysing and presenting the call quality of Voice over Internet
Protocol (VoIP). The system is called VoIP WeatherMap. Information about the current
status of the Internet for VoIP calls is currently limited and a recognised approach to
identifying the network status has not been adopted. An important consideration is the
difficulty of assessing network conditions across links including network segments
belonging to different telecommunication companies and Internet Service Providers. The
VoIP WeatherMap includes the use of probes to simulate voice calls by implementing
RTP/RTCP stacks. VoIP packets are sent from a probe to a server over the Internet. The
important characteristics of VoIP calls such as delay and packet loss rate are collected by
the server, analysed, stored in a database and presented through a web based interface.
The collected voice call session data is analysed using the E-model algorithm described
in ITU-T G.107. The VoIP WeatherMap presentation system includes a geographic
display and internet connection links are coloured to represent the Quality of Service
rank.

ii
Statement of Authorship
I certify that except where due acknowledgement has been made, the work is that of the
author alone; the work has not been submitted previously, in whole or in part, to qualify
for any other academic award; the content of the thesis is the result of work which has
been carried out since the official commencement date of the approved research program;
and, any editorial work, paid or unpaid, carried out by a third party is acknowledged; and,
ethics procedures and guidelines have been followed.
Shengbin Gao
March 30th, 2009

iii
Acknowledgements
I would like to take this opportunity to express my sincere gratitude to my supervisor Dr.
Mark Gregory, Program Director for Network Engineering from the School of Electrical
and Computer Engineering and Dr. Jidong Wang. Thanks for their guidance,
encouragement, suggestions and support during my research program. I would also like
to thank the members of the School of Electrical and Computer Engineering.
I would like to thank David and Robert for their countless hours of support and help.
Special thanks also go to my wife for all her on-going support, encouragement and
inspiration.

iv
Table of Contents
Preface.................................................................................................................................. i
Abstract ............................................................................................................................ i
Statement of Authorship.................................................................................................. ii
Acknowledgements ........................................................................................................ iii
Table of Contents ........................................................................................................... iv
List of Abbreviations...................................................................................................... vi
List of Tables................................................................................................................ viii
List of Figures ................................................................................................................ ix
List of Figures ................................................................................................................ ix
1 Introduction ................................................................................................................. 1
1.1 Scope................................................................................................................... 1
1.2 The structure of this thesis .................................................................................. 2
2 Background.................................................................................................................. 3
2.1 An overview of VoIP .......................................................................................... 3
2.1.1 How it works................................................................................................... 4
2.1.2 Benefits of VoIP ............................................................................................. 7
2.2 Exploring VoIP standards and technologies ....................................................... 9
2.2.1 Standards entities .......................................................................................... 10
2.2.2 H.323............................................................................................................. 11
2.2.3 SIP................................................................................................................. 15
2.2.4 RTP/RTCP .................................................................................................... 19
2.2.5 CODECs ....................................................................................................... 23
2.3 Quality of Service (QoS) for VoIP ................................................................... 25
2.3.1 Issues............................................................................................................. 25
2.3.2 Solutions ....................................................................................................... 29
2.4 Measuring quality of service............................................................................. 33
2.4.1 Mean Opinion Score (MOS)......................................................................... 33
2.4.2 E-model......................................................................................................... 34
2.4.3 Map E-model to MOS scale.......................................................................... 39
2.4.4 Benefits of QoS evaluation ........................................................................... 40
2.5 Brix Networks’ VoIP Weather.......................................................................... 40
3 Objectives .................................................................................................................. 42

v
3.1 Limitations ........................................................................................................ 42
3.2 Assumptions...................................................................................................... 43
4 VoIP WeatherMap prototype and implementation.................................................... 45
4.1 Introduction....................................................................................................... 45
4.2 Framework ........................................................................................................ 46
4.3 VoIP Session Simulator (VSS) ......................................................................... 50
4.3.1 Implementation ............................................................................................. 53
4.4 Data Collection, Storage and Analysis Server (DCSAS) ................................. 57
4.4.1 Receiver ........................................................................................................ 60
4.4.2 Analyser ........................................................................................................ 60
4.4.3 Data Processor .............................................................................................. 62
4.4.4 Implementation ............................................................................................. 62
4.5 Visual Representation System (VRS)............................................................... 67
4.5.1 Implementation ............................................................................................. 69
4.6 Summary........................................................................................................... 71
5 Result and analysis .................................................................................................... 73
5.1 Test strategy...................................................................................................... 73
5.2 Measurement..................................................................................................... 74
5.2.1 CODEC selection.......................................................................................... 76
5.3 Numerical results and discussion...................................................................... 76
5.4 Comparison ....................................................................................................... 83
5.5 Summary........................................................................................................... 84
6 Conclusion................................................................................................................. 86
6.1 VoIP WeatherMap benefits............................................................................... 87
6.1.1 Existing capabilities measurement................................................................ 87
6.1.2 Real-time performance monitoring............................................................... 88
7 Future Work............................................................................................................... 89
8 Bibliography.............................................................................................................. 91
Appendix A....................................................................................................................... 99

vi
List of Abbreviations
ACF Admission Confirm
ADPCM Adaptive Differential PCM
CC CSRC count
CODEC Compression and decompression
DCSAS Data Collection, Storage and Analysis Server
Diffserv Differentiated Services
GK Gatekeeper
GW Gateway
HTTP Hyper Text Transfer Protocol
IETF Internet Engineering Task Force
Intserv Integrated Services
IP Internet Protocol
MOS Mean Opinion Score
MPLS Multi Protocol Label Switching
P Padding
PCM Pulse Code Modulation
PT Payload Type
QoS Quality of Service
R Transmission Rating Factor
RTCP Real-time Transport Control Protocol

vii
RTP Real-time Transport Protocol
RTP/RTCP Real Time Protocol/Real Time Control Protocol
SIP Session Initiated Protocol
UAC User-agent client
UAS User-agent server
UDP User Datagram Protocol
VSS VoIP Session Simulator
VRS Visual Representation System
VoIP Voice over Internet Protocol
XML EXtensible Markup Language

viii
List of Tables
Table 2-1: Study groups of ITU-T .................................................................................... 10
Table 2-2: Working groups of IEFT (itef.org, 2008)........................................................ 11
Table 2-3: Main functions of H.323 Gatekeeper .............................................................. 15
Table 2-4: Five facets of establishing and terminating multimedia communication (J.
Rosenberg, 2002) .............................................................................................................. 16
Table 2-5: CODECs (Voip-info.org, 2008) ...................................................................... 24
Table 2-6: Algorithms for voice compression and decompression (F.Mohammed, 2005)
........................................................................................................................................... 26
Table 2-7: Delay specification .......................................................................................... 27
Table 2-8 Delays of different CODEC's (F.Mohammed, 2005)....................................... 27
Table 2-9: MOS five point scale....................................................................................... 34
Table 2-10: Provisional examples for the advantage factor A.......................................... 37
Table 2-11: E-model default values.................................................................................. 39
Table 4-1: Relationship between E-model and QCRM .................................................... 69
Table 5-1: Network connection of simulators .................................................................. 75
Table 5-2: Five most common CODECs (ixiacom.com, 2009)........................................ 76
Table 5-3: Simulator types................................................................................................ 80
Table 5-4: MOS value of test............................................................................................ 81

ix
List of Figures
Figure 2-1 Call setup by call server .................................................................................... 5
Figure 2-2: Simple VoIP transmission diagram (Scheets, 2002)........................................ 5
Figure 2-3: PC – PC communication .................................................................................. 6
Figure 2-4: PSTN telephone to PC communication ........................................................... 6
Figure 2-5: Typical VoIP System End Devices.................................................................. 8
Figure 2-6: A typical H.323 over IP stack ........................................................................ 12
Figure 2-7: H.323 Architecture......................................................................................... 13
Figure 2-8: Scenario Gateway (ITU-T, 2006) .................................................................. 14
Figure 2-9: SIP functional components (Cisco, 2008)...................................................... 17
Figure 2-10: SIP session setup example with SIP trapezoid............................................. 18
Figure 2-11: Full-duplex RTP communication................................................................. 20
Figure 2-12: Signal convert .............................................................................................. 23
Figure 2-13: MOS for the repetition concealment (Ding, 2003) ...................................... 28
Figure 2-14: Talker echo tolerance curve (ITU-T, 1996b) ............................................... 29
Figure 2-15: IPv4 header (cisco, 2005)............................................................................. 31
Figure 2-16: IPv4 TOS field (cisco, 2005) ....................................................................... 31
Figure 2-17: DS-Field (cisco, 2005) ................................................................................. 32
Figure 2-18: Reference connection of the E-model (ITU-T, 2003).................................. 34
Figure 2-19: Map E-model to MOS scale......................................................................... 39
Figure 2-20: VoIP Weather from testvoip.com (Testmyvoip.com, 2008)........................ 41

x
Figure 4-1: VoIP WeatherMap example........................................................................... 46
Figure 4-2: VoIP WeatherMap components ..................................................................... 47
Figure 4-3: Data flow between simulator and DCSAS..................................................... 49
Figure 4-4: SDL diagram of VSS ..................................................................................... 51
Figure 4-5: Protocol Stack ................................................................................................ 52
Figure 4-6: Message format .............................................................................................. 52
Figure 4-7: JMF high level architecture (java.sun.com)................................................... 54
Figure 4-8: RTP transmission (java.sun.com, 2008) ........................................................ 55
Figure 4-9: JMF RTP architecture .................................................................................... 55
Figure 4-10: DCSAS......................................................................................................... 57
Figure 4-11: Dataflow of DCSAS..................................................................................... 58
Figure 4-12: SDL diagram of DCSAS.............................................................................. 59
Figure 4-13: VoIP block diagram (George Scheets, 2002)............................................... 60
Figure 4-14: RD diagram of database design ................................................................... 63
Figure 4-15: SDL diagram of VRS................................................................................... 68
Figure 4-16: Sample result of VRS................................................................................... 71
Figure 4-17: Use case for VoIP WeatherMap................................................................... 72
Figure 5-1: VoIP Weathermap Test strategy .................................................................... 74
Figure 5-2: Topoloty of the test network ......................................................................... 75
Figure 5-3: CODEC comparision (ixiacom.com, 2009)................................................... 76
Figure 5-4: Transport delay of VSS1................................................................................ 77

xi
Figure 5-5: Transport delay of VSS2................................................................................ 77
Figure 5-6: Delay of VSS3 ............................................................................................... 78
Figure 5-7: Delay of VSS4 ............................................................................................... 78
Figure 5-8: Delay of VSS5 ............................................................................................... 79
Figure 5-9: VoIP WeatherMap of VSS1 and VSS2.......................................................... 81
Figure 5-10: VoIP WeatherMap of VSS3......................................................................... 82
Figure 5-11: VoIP WeatherMap for VSS4 ....................................................................... 82
Figure 5-12: VoIP WeatherMap for VSS5 ....................................................................... 83

1
1 Introduction
Voice over Internet Protocol (VoIP) is a new real-time connection oriented technique
used to provide voice telephony over the converged digital network. The future digital
network is a shared resource with services competing for bandwidth. Whilst modern
methods are being developed to provide better control over the allocation of bandwidth
on the digital network the current situation is not favourable for general use of VoIP as a
public switch telephone network (PSTN) replacement.
Current trends point to VoIP as a cheaper and more effective long term solution than
possible future PSTN upgrades. To move towards greater adoption of VoIP the future
converged digital network is moving towards a service level management and control
regime. To ensure that VoIP services have the conditions necessary for an acceptable
quality of service (QoS) many factors need to be taken into account including the choice
of CODEC, bandwidth, echo control, packet loss, delay, jitter and other factors (Goode,
2002).
The existing converged digital network provides two grades of service. The first is a
business grade VoIP service that provides guaranteed bandwidth, service management
and acceptable QoS. The second is the best effort grade of VoIP service. The best effort
grade of service does not provide guaranteed bandwidth or defined QoS for any of the
services using the network and therefore the services utilise the best available bandwidth
at the time.
The research focuses on how to measure VoIP QoS on the digital network and to provide
the measurements in real-time through an interactive application.
1.1 Scope
This research aims to provide an approach for VoIP QoS testing, assessment and
presentation. A creative presentation will be used to represent the VoIP QoS for different
network regions. Providing more timely information on the state of VoIP QoS across the
network is an essential step towards ensuring that the converged digital network provides
an acceptable solution for a modern digital telephone service.
2
The research included a review of current literature to identify the state of the research
area and alternative approaches that have been taken to achieve the research outcome.
The literature review is presented in Chapter 2.
The research proposes a system (VoIP WeatherMap) to test, analyse and present the
results of VoIP QoS across multiple networks and carrier regions. The E-model technique
as defined in ITU-T Recommendation G.107 is used to calculate the quality of service by
taking account in the underlying traffic characteristics associated with the VoIP call
traffic stream. The research included considering a suitable approach for the VoIP QoS
analysis results to be displayed in the presentation system using a colour coded
representation of the QoS outcome.
1.2 The structure of this thesis
The background literature review is presented in Chapter 2 and includes the current
research, key concepts and technologies. The research direction and approach used to
achieve the research goal is presented in Chapter 3. The VoIP WeatherMap is described
in detail in Chapter 4. The VoIP WeatherMap prototype and initial testing of the
prototype is described in Chapter 5. The research conclusion and statement of original
contribution is provided in Chapter 6. The options for future work are described in
Chapter 7.
3
2 Background
This chapter introduces the background information required to understand the VoIP
system and identifies the technologies needed to implement the VoIP QoS WeatherMap
system.
This chapter begins with a general overview of VoIP technology. It is followed by a
description of the fundamental protocols and standards used for VoIP applications. Two
popular models (E-Model and Mean Opinion Score (MOS)) used for assessing QoS of
VoIP system are described after that. And an introduction of a similar solution provided
by Brix Networks at testmyvoip.com (testmyvoip.com, 2008) is presented in detail in the
last section of this chapter.
2.1 An overview of VoIP
VoIP stands for Voice over Internet Protocol. VoIP uses the IP network as the
transmission medium to carry real-time digital audio stream of the human voice, as an
alternative to the traditional telephone service.
By providing very low cost calls, the VoIP service has attracted many businesses and
residential end-users. There is no surprise that VoIP would have a substantial effect on
the long-distance and international calls markets. The VoIP technology emerged in the
mid-1990s and the VoIP concept dates back to the early 1970s (Wiki.com, 2008).
However, whilst concepts were being developed during the 1970s and 1980s, the
networking devices, processors and computers were not capable of supporting real-time
multi-media applications during this period. Several major VoIP system quality issues
have been addressed recently and the voice stream can be provided with a higher priority
over other traffic in the digital network. Service providers may provide reliable and high
quality digital voice services by implementing peer agreements and Service Level
Agreements (SLA). VoIP services have been deployed in most carrier networks.
According to a Yankee Group study (YankeeGroup.com, 2008), the VoIP business
market is to grow as high as $3.3 billion worldwide by 2010. The rapid growth in VoIP
services and the associated growth in the number of VoIP end-users highlight an exciting
future for VoIP as a modern digital telephony service.

4
2.1.1 How it works
Simply speaking, VoIP is a digital telephony system where the audio is digitised and
transmitted over the Internet from one end-user to another. The principal difference
between VoIP and the existing digital telephony network is that VoIP uses the Internet,
where telephony exists with many other services and this is known as the “converged”
network.
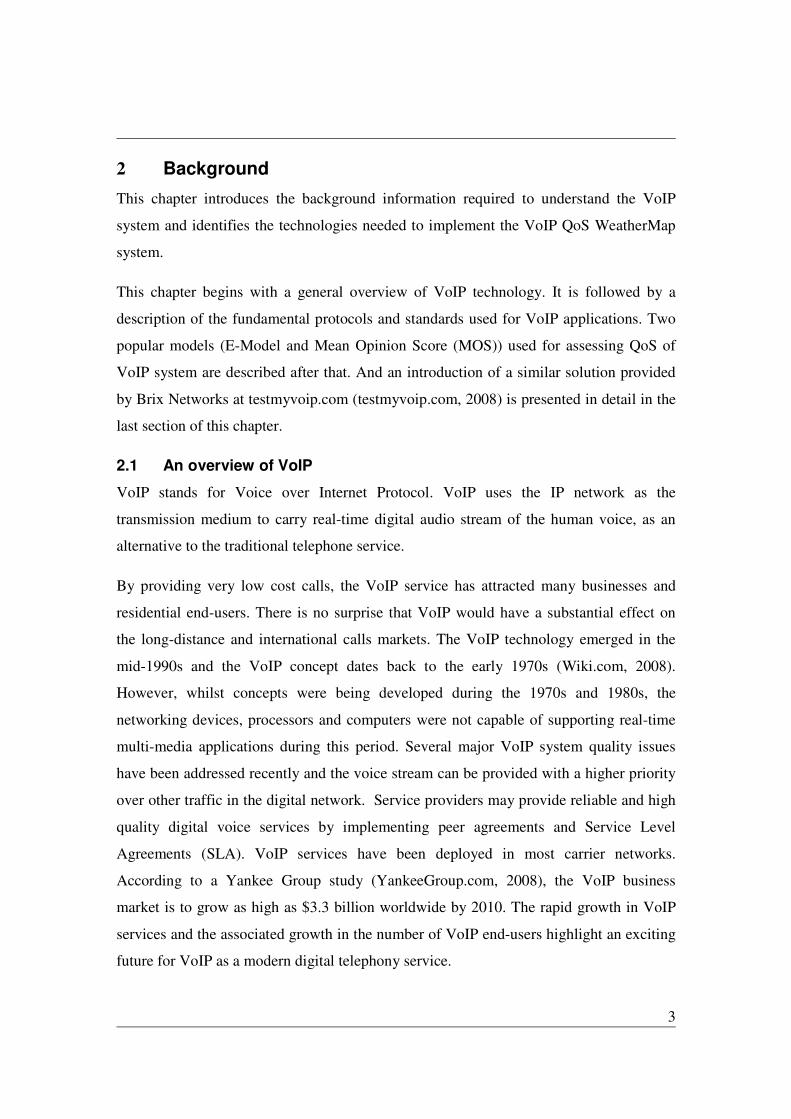
Assume two end-users wish to communicate with each other by using VoIP as shown in
Figure 2-1. Each user has an internet connection and a soft phone. The first problem that
needs to be addressed is “How to find the other user?” To address this problem there are
some industry standards being defined that enable users to establish communication with
each other, such as H.323 and Session Initiation Protocol (SIP). The signalling protocols
have the ability to set-up, authentication, modify and terminate a call. The details of these
two standards will be discussed later in this chapter. A central point call manager
provides users with a simplified connection service.
End users can find each other no matter if their location or IP is changed. End users can
always find each other even when their location or IP Address is changed. After
establishing a connection between two users, the next issue that needs be overcome is to
decide the media format. Media streams could be video, audio or data streams. Different
sample rates and compression methods may be used to reduce the bandwidth
requirement, the algorithm which is referred to as a CODEC. Later in this chapter,
CODECs will be discussed in more detail.
5
Figure 2-1 Call setup by call server
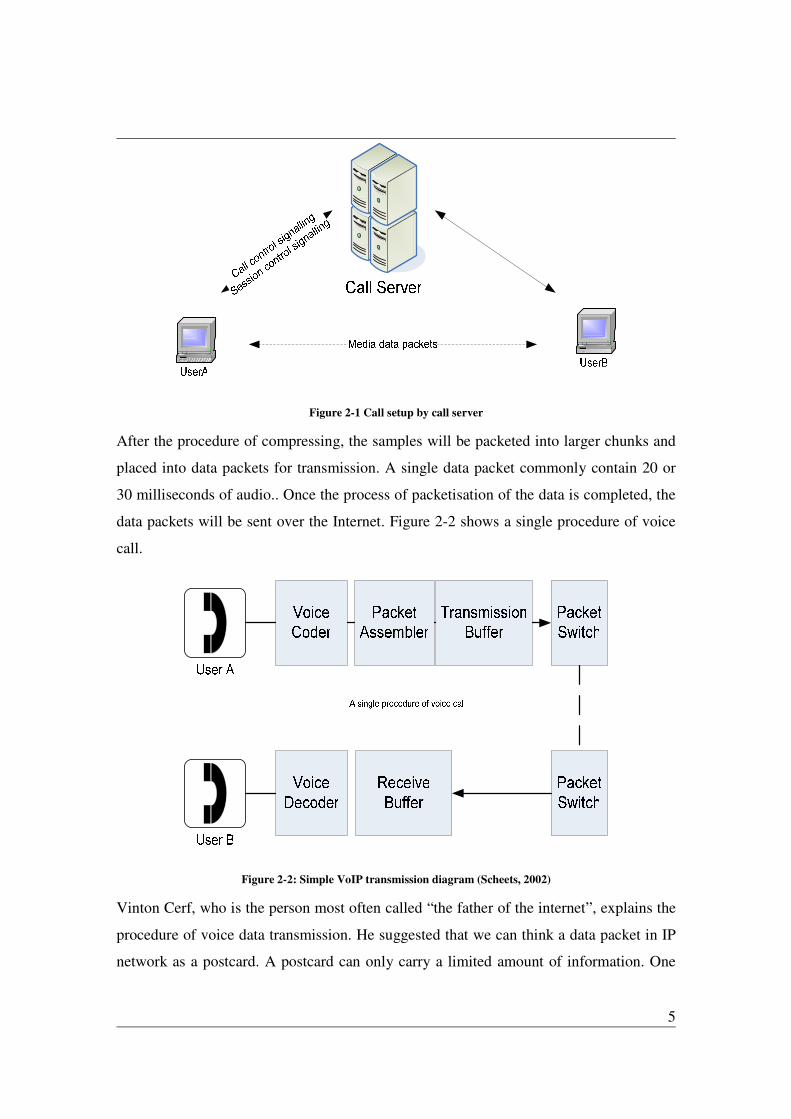
After the procedure of compressing, the samples will be packeted into larger chunks and
placed into data packets for transmission. A single data packet commonly contain 20 or
30 milliseconds of audio.. Once the process of packetisation of the data is completed, the
data packets will be sent over the Internet. Figure 2-2 shows a single procedure of voice
call.
Figure 2-2: Simple VoIP transmission diagram (Scheets, 2002)
Vinton Cerf, who is the person most often called “the father of the internet”, explains the
procedure of voice data transmission. He suggested that we can think a data packet in IP
network as a postcard. A postcard can only carry a limited amount of information. One

6
must send many postcards in order to send a very long message. In order to reassemble
the message, the sender must place a sequence number on each postcard. At the other
side, the receivers can reassemble the message according to the sequence number of each
postcard.
During transmission, some packets may be lost, delayed or mis-ordered. By using jitter-
buffer, the receiving client could reconstruct the packets and reduce the possibility of
packet loss and jitter. Clearly the jitter-buffer would increase the delay.
So it is a trade-off between buffer size and delay.
The signalling scheme will close the media streams and terminate the call when the
conversation is over.
2.1.1.1 General Scenarios for using VoIP
The client of VoIP can be soft-phone running on PC or can be using a traditional
telephone with an adapter. Below are four VoIP call usage scenarios:
� PC – PC (Soft phone to Soft phone)
Figure 2-3: PC – PC communication
� PC – PSTN Telephone
Figure 2-4: PSTN telephone to PC communication

7
� PSTN Telephone – PC
� PSTN Telephone – PSTN Telephone
2.1.2 Benefits of VoIP
The benefits of VoIP technologies are:
Cost saving – In traditional PSTN network, each end-user has a dedicated 64 kbps
bandwidth voice channel, which results in bandwidth being wasted when there is no
voice signal to transmit. By using an IP network, bandwidth can be shared among
multiple logical voice channels, which makes for efficient use of bandwidth. Voice
signals are transferred alongside data traffic which results in dramatic savings on
equipment and operation costs. Compared to the rates of traditional telephone service,
VoIP service is much cheaper, especially for long distance calls. That is a major reason
why the VoIP services are gaining in popularity.
Portability – The client device of VoIP can be computer, traditional telephone and IP
phone, as shown in Figure 2-5. Customers can make calls anywhere they have an internet
connection. If customers use softphone such as Free VoIP and Skype, the only thing they
need is a headphone.

8
Internet
PSTN Phone
Modem
`
Personal PC
Mobile Phone
Adapter
Figure 2-5: Typical VoIP System End Devices
Integration with video, audio and data application – By using VoIP technology, you can
integrate applications such as voice call, video phone, email, fax, video conferences
together to meet your business requirements.
9
Flexible call ID – In the traditional PSTN network, each end device has a unique number
to identify it. In VoIP network, you are not limited to the digit number. Your can choose
some meaningful words to name your call ID as long as it is different from others. Words
are easier to remember than the numbers.
Other advanced features – VoIP service providers also offer some other advanced
features to the customers, some of them need extra charges. For instance, Voicemail is an
attractive feature.
2.2 Exploring VoIP standards and technologies
Industry standards are required to ensure that VoIP service can cross boundaries between
different domains and service providers and to provide standards for the equipment
vendors and manufacturers. It is beneficial for both service providers and end users if
there are some globally agreed standards to follow.
The following list is the major standards catalogue:
• Signaling protocols
Signalling is needed to establish, monitor, modify and release connections between two
endpoints. In PSTN network, Signalling System 7 (SS7) is used to transport control
information in signalling network. For VoIP applications, several options are presented,
including ITU-T H.323, Session Initiation Protocol (SIP) and Media Gateway Control
Protocol (MGCP) (Network Working Group, 1999).
• Media Transport Protocol
Transport voice signals over the packet-based IP network is probably the most
fundamental function of any VoIP system. Voice conversation is time-sensitive. To
transport real-time media over Internet is crucial to the VoIP applications. RTP/RTCP
is the de-facto standard used for most VoIP system to transfer voice streams.
• CODECs
CODECs are technologies used to compress the voice signals. It reduces the
bandwidth requirement.
10
• QoS Mechanisms
The IP network is not designed for real-time media stream. In this case, mechanisms
need to be developed to enhance the quality of service.
2.2.1 Standards entities
It is important for the industry to establish common standards. Many groups are dedicated
to making standards for VoIP industry. Two of the most popular groups are introduced in
the following sections.
2.2.1.1 ITU-T
The International Telecommunication Union is an international organization based in
Switzerland. The ITU-T stands for the ITU Telecommunication Standardization Sector.
The standards of ITU-T are known as Recommendations.
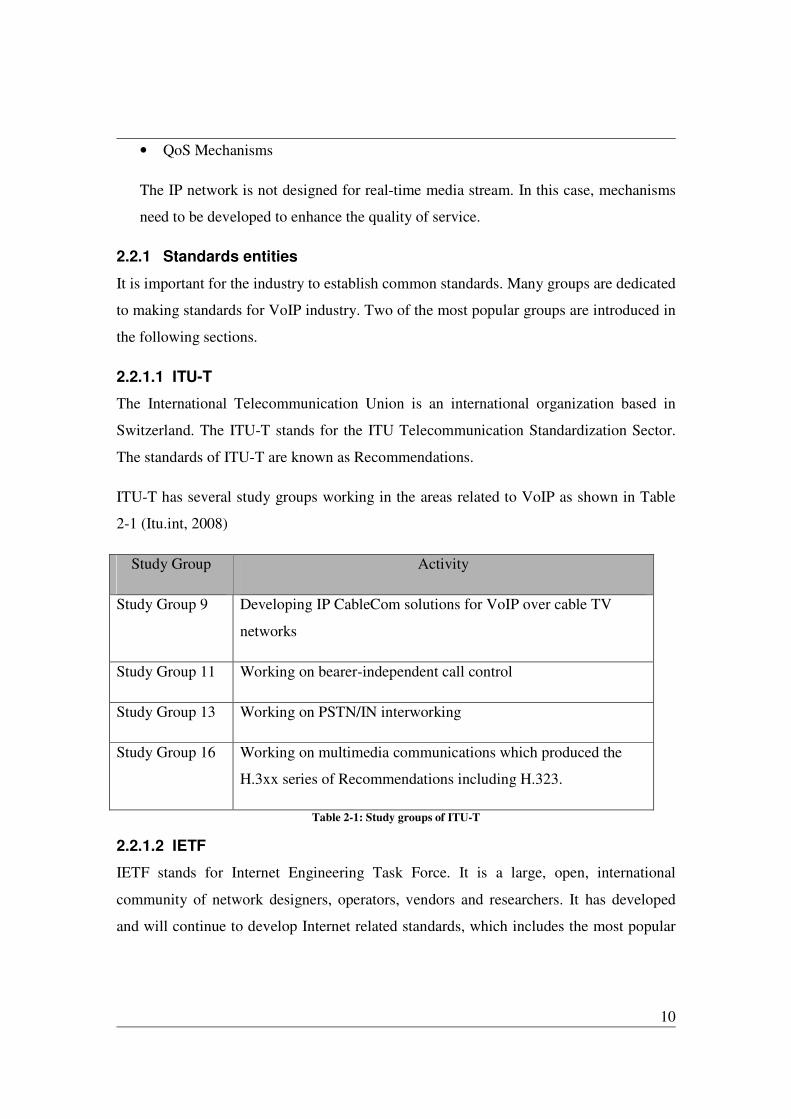
ITU-T has several study groups working in the areas related to VoIP as shown in Table
2-1 (Itu.int, 2008)
Study Group Activity
Study Group 9 Developing IP CableCom solutions for VoIP over cable TV
networks
Study Group 11 Working on bearer-independent call control
Study Group 13 Working on PSTN/IN interworking
Study Group 16 Working on multimedia communications which produced the
H.3xx series of Recommendations including H.323.
Table 2-1: Study groups of ITU-T
2.2.1.2 IETF
IETF stands for Internet Engineering Task Force. It is a large, open, international
community of network designers, operators, vendors and researchers. It has developed
and will continue to develop Internet related standards, which includes the most popular

11
TCP/IP protocol suite. There are two major formats of IETF documents which are
Internet-Drafts and Requests For Comment (RFC).
Some working groups related to VoIP and their works are listed in Table 2-2
Working Groups Activity
Audio/Video Transport (AVT) Working on the definition of real-time
transport protocol (RTP)
Session Initiation Protocol (SIP) Developing the session initiation protocol
Telephone Number Mapping (ENUM) The ENUM is working on the DNS-based
architecture for mapping a telephone
number to attributes such as URLs
Table 2-2: Working groups of IEFT (itef.org, 2008)
2.2.2 H.323
H.323 is a recommendation published by the International Telecommunication Union
(ITU-T, 2006). H.323 appears to be a very complex specification. Figure 2-6 is the
outline view of the current H.323 protocol stack. It was originally designed to provide
service for transferring audio/video on the packet-switched network. It has become the
standard for many video conferencing equipments.

12
IP
TCP UDP TCP/UDP TCP UDP
T.120
Audio
codecsG
.711
G.723.1
G.722.1
Video
codecs
H.261
H.263
H.264
RTCP
H.225.0
Call
signalling
H.245H.225.0
RAS
Data
Applicati
on
Media control Terminal control and management
Multimedia applications, user interface
Figure 2-6: A typical H.323 over IP stack
H.323 is a framework which is capable of constructing a wide range of multimedia
communication solutions. It does not address the quality of service (QoS) issues. Without
other QoS mechanisms supporting, it only delivers a best-effort service. H.323 was firstly
published back in 1996 and the latest version 5 was completed in 2003.
2.2.2.1 Functional components of H.323
In order to provide rich multimedia communication capabilities, the H.323 system
defines several network components which are shown in Figure 2-7. As we can see, it
includes Terminals, Multipoint Controllers, Multipoint Processors and Multipoint Control
Units (ITU-T, 2006).

13
Figure 2-7: H.323 Architecture
Terminals
The terminals in an H.323 are the devices providing point-to point or multipoint audio
and video conferences. The terminal includes the video/audio equipment, video/audio
CODEC, system control user interfaces, H.225 layer, and network interface. According to
the ITU-T Rec.H.323, all H.323 terminals have a System Control User Interface, H.225.0
layer, Network Interface and an Audio CODEC Unit. However, the Video CODEC Unit
and User Data Applications are optional.
Gateway
The gateway in the H.323 provides the appropriate translation between different
transmission formats (for example H.225.0 to/from H.221), and between communications
procedures (for example H.345 to/from H.242). The Gateway also performs setup and
clearing on both the network side and the SCN side (ITU-T, 2006).
Figure 2-8 shows a scenario for using gateway.

14
Figure 2-8: Scenario Gateway (ITU-T, 2006)
Since endpoints may directly connect to other endpoints on the same LAN, Gateway are
not always required if there is no need to connect to other networks.
Gatekeeper
Gatekeeper is an optional component in an H.323 system. It provides call control service
to the H.323 endpoints and acts as the central point for all calls within its zone. The
behavior of H.323 gatekeeper is that of a virtual switch.
Gatekeeper performs four major call control functions, which are listed in Table 2-3.
Function Description
Address Translation
Translates alias address to Transport Address by using updated
Registration messages. Other methods of updating the
translation table are also allowed.
Admissions Control Authorizes network access by using ARQ/ACF/ARJ H.225.0
messages.
Bandwidth Control Supports for Bandwidth Request, Confirm and Reject messages.

15
It may be based on bandwidth management.
Zone management Provides above functions for terminals, MCUs and Gateways
which have registered with it.
Table 2-3: Main functions of H.323 Gatekeeper
Multipoint Control Units (MCU)
The MCU is an endpoint which supports multipoint conferences. A H.323 MCU consists
of an MC and zero or more MPs. As described in ITU-T Rec.H.323, “A typical MCU that
supports centralized multipoint conferences consists of an MC and an audio, video and
data MP. A typical MCU that supports decentralized multipoint conferences consists of
an MC and a data MP supporting ITU-T Rec. T.120. It relies on decentralized audio and
video processing”.
2.2.3 SIP
SIP stands for Session Initiation Protocol. “SIP is an agile, general-purpose tool for
creating, modifying, and terminating sessions that works independently of underlying
transport protocols and without dependency on the type of session that is being
established” (J.Rosenbert, 2002).
SIP is designed as simple as it can be. It has high interoperability with other existing
protocols. And it is easy to bind SIP functions with other applications, such as e-main and
web browsers. As a signalling protocol, SIP is widely used for developing VoIP
applications.
SIP is situated at the application layer in the TCP/IP model. It was designed to be
independent of the transport layer protocols. It can run on TCP and UDP. The five facets
of SIP establishing and maintaining multimedia connections are shown in Table 2-4.
Facet Description

16
User location Determine the end system to be used for communication
User availability Determine the willingness of the call party to engage in
communications
User capabilities Determine the media and media parameters to be used
Session setup Establish session parameters at both called and calling party
Session
management
Transfer and terminate sessions, modify parameters, and invoke
services.
Table 2-4: Five facets of establishing and terminating multimedia communication (J. Rosenberg, 2002)
2.2.3.1 SIP Components
SIP is a peer-to-peer protocol. The peers in a session are named user agents (UAs).
Figure 2-9 shows the functional components of a SIP network. They can be grouped into
the following categories (Wallance, 2007):
• User Agents (UAs)
A user agent can be a User Agent Client (UAC) or a User Agent Server (UAS). UAC
initiates a SIP request while UAS responds to the request. The physical user agent
could be an IP phone or Gateway.
• SIP Servers
SIP server includes the following types:
� Proxy Server – A bridge to pass client request to next SIP server. It can
provide some services such as authentication, authorization and network
access control.
� Redirect Server – Enable UA to redirect an invitation to another server.
� Registrar Server – Provides service for UAs to register their locations.
� Location Server – Provides address resolve service to proxy or redirect servers.

17
Figure 2-9: SIP functional components (Cisco, 2008)
2.2.3.2 SIP Messages
SIP communication has a request and response model for message exchange. The
following list is the types of SIP message:
• INVITE – A message used by a client to invite server to participate in a session.
The session parameters are included in this message.
• ACK – It is used by client to inform the server that it has received response for
the last invitation.
• BYE – It is used for call termination.
• CANCEL – It is used to terminate all the requests in progress.
• OPTIONS – It can be used to query the ability of UAs.
• REGISTER – It used by a client to register an address.

18
Figure 2-10 shows a typical example of a SIP message exchange between two users,
which is given in RFC 3261. The formats of the message are defined in RFC 2822
(Network Working Group, 2001).
Figure 2-10: SIP session setup example with SIP trapezoid
2.2.3.3 Compare H.323 and SIP
H.323 networks have been widely deployed. H.323 defines an entire system for
performing functions in many aspects, such as video/audio CODECs and video/audio
conferences. In contrast, SIP was designed as a module to setup a “session” between two
end-points. H.323 has mechanisms to handle failure of intermediate network objects, but
SIP has no similar function. The definition of message and the encoding methods are
also different between these two protocols. H.323 uses ASN.1 (Abstract Syntax Notation
One) for the message definition and binary for encoding while SIP uses the ABNF
(Augmented Backus-Naur Form) as defined in RFC 2234 to define messages and ASCII
to format messages. SIP has better extensibility compare to H.323.

19
2.2.4 RTP/RTCP
Traditional telephony calls are transmitted over a dedicated network. But IP network does
not specially designed for real time services such as voice. The IP network operates on
‘best effort’ basis.
In order to transfer the real-time media over the IP network, the solution must have the
following characteristics (Swale, 2001):
• Timing and synchronization
• Minimizes packet loss
• Minimizes packet delay
• Identifies the packet type
• Monitor the transmission flow
Real-Time Transport Protocol (RTP) protocol was developed to address all these
concerns. It is the de facto protocol used for transferring time-sensitive streams. RTP
provides timely transport functions for real-time applications, such as video and audio.
RTP is a very important component of VoIP. It is possibly the most common element
found in all the VoIP applications.
Real-time Transport Control Protocol (RTCP) provides control information for RTP
packets. It enables the sender and receiver to exchange control messages and
performance statistic data.
Figure 2-11 shows two clients using RTP to communicate. They need four connections
between them – one each for RTP and RTCP in both directions.

20
Figure 2-11: Full-duplex RTP communication
RTP defines a standardized packet format for delivering audio and video over internet. It
was first defined in RFC 1889 by the Audio-video Transport Working Group in 1996.
“RTP does not address resource reservation and does not guarantee quality-of-service for
real-time services. The data transport is augmented by a control protocol (RTCP) to
allow monitoring of the data delivery in a manner scalable to large multicast networks,
and to provide minimal control and identification functionality.” (Jacobson, 1996)
The RTP protocol itself does not guarantee timely delivery, but relies on the support of
lower-layer protocols to do so. It does not guarantee delivery of the packets in sequence.
The client side needs to use the sequence numbers included in the RTP packets to
reconstruct the message. RTP was mainly designed to implement multi-participant
multimedia conferences. However, it can also be applied into other applications, such as
storage of continuous data, and control and measurement.
RFC 3550 defines RTP for carrying real-time data and RTCP for monitoring the QoS of a
session. While RTP transports the actually audio streams, RTCP monitors the quality of
service.
Scenarios for using RTP
Many applications have been developed based on RTP. Some scenarios for using RTP
are listed below:
• Simple Multicast Audio Conference
• Audio and Video Conference
• Mixers and Translators
• Layered Encodings

21
RTP header fields
The following diagram shows the format of the RTP header according to RFC 3550,
0 1 2 3
0 1 2 3 4 5 6 7 8 9 0 1 2 3 4 5 6 7 8 9 0 1 2 3 4 5 6 7 8 9 0 1
+-+-+-+-+-+-+-+-+-+-+-+-+-+-+-+-+-+-+-+-+-+-+-+-+-+-+-+-+-+-+-+-+
|V=2|P|X| CC |M| PT | sequence number |
+-+-+-+-+-+-+-+-+-+-+-+-+-+-+-+-+-+-+-+-+-+-+-+-+-+-+-+-+-+-+-+-+
| timestamp |
+-+-+-+-+-+-+-+-+-+-+-+-+-+-+-+-+-+-+-+-+-+-+-+-+-+-+-+-+-+-+-+-+
| synchronization source (SSRC) identifier |
+=+=+=+=+=+=+=+=+=+=+=+=+=+=+=+=+=+=+=+=+=+=+=+=+=+=+=+=+=+=+=+=+
| contributing source (CSRC) identifiers |
| .... |
+-+-+-+-+-+-+-+-+-+-+-+-+-+-+-+-+-+-+-+-+-+-+-+-+-+-+-+-+-+-+-+-+
Every RTP packet contains the first 12 bytes. The CSRC identifiers are present only
when inserted by a mixer. The meanings of all the fields are listed below,
• Version (V): 2 bits
This field is used to identify the version of RTP. The version number for the RTP
defined in RFC 3550 is two.
• Padding (P): 1 bit
This bit is used to identify whether the packet contains additional bytes at the end
which are not part of the payload.
• Externsion (X): 1 bit
The fixed header must be followed by exactly one header extension when this bit is
enabled.
• CSRC count (CC): 4 bits
The number of CSRC identifiers.
• Marker (M): 1 bit
This bit is used for other protocol to extend it.
• Payload type (PT): 5bits

22
It is used to define the type of the payload (For example the payload can be voice
message).
• Sequence number: 16 bits
It is an increment number for marking the sequence of the RTP packets. The receivers
can use it to reconstruct the packets and determine the number of packet loss.
• Timestamp: 32 bits
It is used to identify the instant of sampling the first octet in the RTP packet.
• SSRC: 32 bits
It represents the synchronization source.
• CSRC list: 0 to 15 items, 32 bits each
It identifies the contributing sources contained in the packet.
RTP Control Protocol (RTCP)
The RTCP is based on periodic transmission of control packets which are distributed as
the data packets. It provides control information for RTP flow. Some major functions of
RTCP are listed below,
• Records feedback on the quality of service (OoS) of the data transmission. RTCP
monitors the packet count, packet loss, delay and jitter for the data transmissions.
• Carries the transport-level identifier (called CNAME) for the RTP. Receivers
need CNAME to keep track of participants and synchronize audio and video.
• Evaluates the participants and adjusts the report rate.
The control traffic should be low. It is recommended that the bandwidth added for RTCP
should be fixed at 5%.
RTCP reports are generated at a certain interval during each RTP session. Packets
analyzer can use RTCP report to analyse the cause of the poor quality.

23
RTP and RTCP are independent of transport layer and network layer protocols. But for
real-time applications, packet delay is more unacceptable than packet loss, which is why
most RTP implementations are built on top of UDP. RTP itself does not provide any
mechanisms to ensure timely transport and any QoS guarantee. Other mechanisms are
needed to provide those functions. As discussed before, RTP header includes the time
stamp and sequence number, so it enables the destination device to reorder the voice
packet which is crucial for VoIP application. Through implementing a buffer, RTP can
remove jitter and delay at certain levels and play back the voice data more smoothly.
2.2.5 CODECs
CODECs are mathematical models used for coding and compressing audio information.
There are two general connection categories: analog lines and digital line. Digital lines
can carry more information than analog lines. That is why it is dominating in the modern
network. In order to transmit the analog signal over digital line, the analog signal needs to
be processed. The voice signal is sampled at a certain rate (8 kHz is the most frequently
used frequency in VoIP speech). The signal will then be converted into digital value. The
procedure is shown in Figure 2-12
Figure 2-12: Signal convert
In VoIP applications, CODECs are often used to compress the voice beyond the 64 kbps
stream to make more efficient use of bandwidth, for example, G.729 which is widely
used in WAN could compress the voice signals to 8 kbps.
24
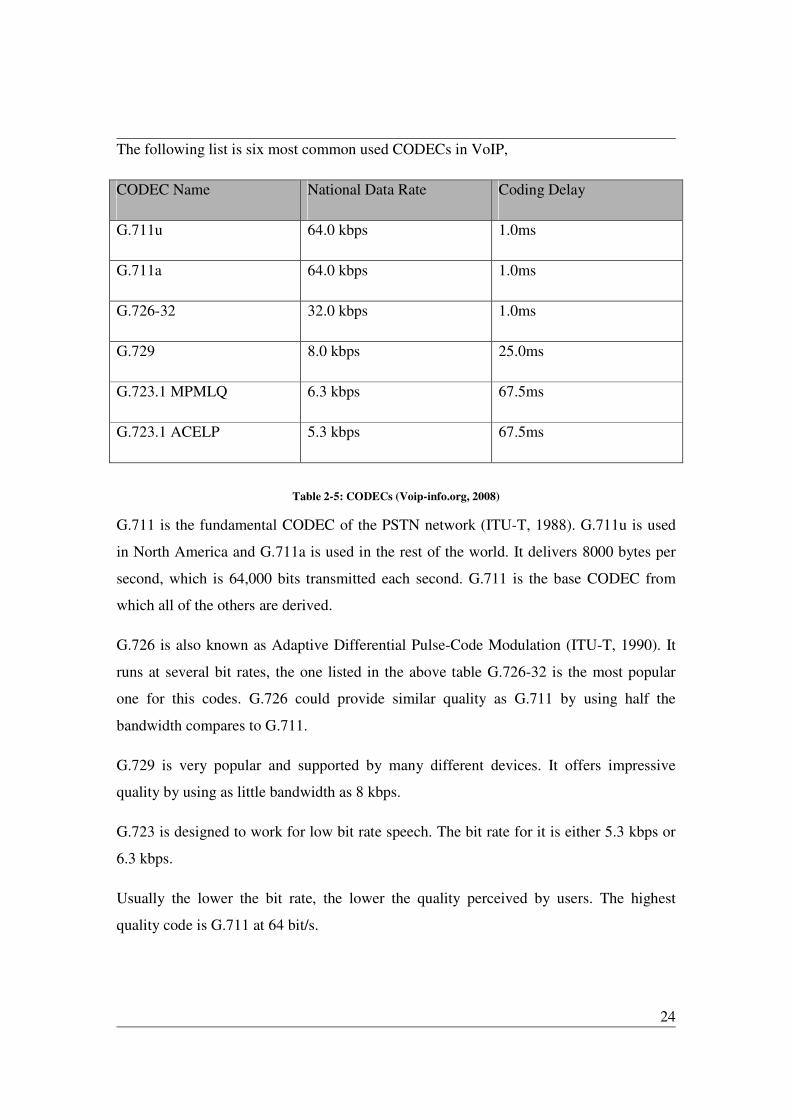
The following list is six most common used CODECs in VoIP,
CODEC Name National Data Rate Coding Delay
G.711u 64.0 kbps 1.0ms
G.711a 64.0 kbps 1.0ms
G.726-32 32.0 kbps 1.0ms
G.729 8.0 kbps 25.0ms
G.723.1 MPMLQ 6.3 kbps 67.5ms
G.723.1 ACELP 5.3 kbps 67.5ms
Table 2-5: CODECs (Voip-info.org, 2008)
G.711 is the fundamental CODEC of the PSTN network (ITU-T, 1988). G.711u is used
in North America and G.711a is used in the rest of the world. It delivers 8000 bytes per
second, which is 64,000 bits transmitted each second. G.711 is the base CODEC from
which all of the others are derived.
G.726 is also known as Adaptive Differential Pulse-Code Modulation (ITU-T, 1990). It
runs at several bit rates, the one listed in the above table G.726-32 is the most popular
one for this codes. G.726 could provide similar quality as G.711 by using half the
bandwidth compares to G.711.
G.729 is very popular and supported by many different devices. It offers impressive
quality by using as little bandwidth as 8 kbps.
G.723 is designed to work for low bit rate speech. The bit rate for it is either 5.3 kbps or
6.3 kbps.
Usually the lower the bit rate, the lower the quality perceived by users. The highest
quality code is G.711 at 64 bit/s.

25
2.3 Quality of Service (QoS) for VoIP
As we know, the traditional voice networks (such as the PSTN) are connection-oriented
networks. It guarantees a 64 Kbps channel for each end user, which can guarantee a good
quality voice conversation. During of a call, the resources needed for voice conversation
are reserved. This reservation of resources results in a high level of reliability.
In VoIP network, the voice signals share the same bandwidth with other data flows,
which means there is less liability of voice conversation over internet. As the IP network
is originally designed for transferring data, it can only provide best effort service, which
is inadequate for voice conversation. The way VoIP works decides that VoIP service
providers must pay more attention to the quality of service.
Voice conversation is time-sensitive. At the transport layer of TCP/IP model, there are
two implementations which are TCP and UDP. TCP has three time handshake process,
which can provide a reliable communication between two end-points. But for audio data,
the retransmission is useless. So many VoIP applications choose UDP as the transport
layer protocol because UDP is faster than TCP. However, UDP itself does not provide
any mechanism to guarantee the transmission of the packets. RTP is usually used together
with UDP/IP for voice and video conversations. The voice streams share bandwidth with
other traffic and would be affected by the network conditions. In the past years, various
mechanisms have been developed for VoIP to provide an acceptable quality of service.
2.3.1 Issues
The success of VoIP depends on the customers’ confidence in the call quality. Only if the
voice quality of VoIP compares with that of the PSTN, would it be the first choice for
voice conversation instead of PSTN in the future. Customers expect that the quality,
reliability and performance of a voice server should meet the following requirements:
� Constraining delay/latency
� Low errors
� Constraining jitter
� Minimum packet loss rate

26
2.3.1.1 Bandwidth requirement
As we know, the base band of the voice transmission frequency spectrum requirement is
0-3.4 KHZ, which is usually called a 4 KHz channel for convenience. For digital
telecommunication, the signal needs to be sampled at twice that rate, which means the
minimum sampling rate should be 8 KHz. If we use 8 bits to represent each sample, the
bandwidth required will be 64 Kbps for a voice conversation, which is exactly the
bandwidth of the phone line of traditional PSTN network. Some algorithms of
compression and decompression can be used to reduce the requirement of bandwidth.
Table 2-6 shows bandwidth requirements of some CODECs.
Input Range Transmission
Rate Standard
Linear predictive coding Algorithm 64 Kbps LPC-10 G.711
Code Excited linear prediction (CELP) 8 Kbps
G.729
G.729A
32 Kbps Adaptive Differential Pulse Code
Modulation (ADPCM) 32 Kbps G.721
Table 2-6: Algorithms for voice compression and decompression (F.Mohammed, 2005)
2.3.1.2 Delay/Latency
Delay or Latency is the amount of time it takes for speech to exit the speaker’s mouth to
reach the listener’s ear. Delay/Latency can also affect the quality of service. According to
ITU-T Recommendation G.114 (ITU-T, 2003), one-way delay can be defined into three
levels which are shown in Table 2-7.
Range in MS Description
0-150 Acceptable for most speech and non-speech applications.
150-400 Has impact on the user applications.

27
>400 Unacceptable for general network planning purposes.
Table 2-7: Delay specification
There are three types of delay in today’s telephony networks: propagation delay,
serialization delay, and handling delay (Davidson, 2006). Propagation delay is the time
for transferring signals in the medium from source to destination. The speed for electrons
to travel through copper or fibre is at approximately 125,000 miles per seconds. It takes
about 70 ms for transferring halfway around the world. Handling delay is caused by
devices that forward the packets through the network, including the time of packetisation,
compression and packet switching. Serialization delay is the time lost for placing a bit
onto an interface. It is relatively minimal. Table 2-8 shows the compression delay of
G.711 and G.729.
CODEC Bit Rate (Kbps) Compression Delay (MS)
G.711 PCM 64 5
G.729 CS-
ACELP
8 15
Table 2-8 Delays of different CODEC's (F.Mohammed, 2005)
2.3.1.3 Jitter
Jitter is the time difference between when the packets are expected to arrive to when they
actually arrived. It is another key factor that affects the QoS of voice conversation. In the
IP network, it is possible that the constant packets enter into its network will reach the
destination inconstantly. For non-real-time applications such as ftp service, this won’t be
a problem. However, for real-time application such as voice, the continuity of the stream
is important. The solution for this issue is to implement a jitter buffer which will make
the voice play smoothly. Unfortunately, the buffer adds overall latency of the packet
transmission. So the buffer size needs to be fine tuned to balance the effects of delay and
jitter.

28
2.3.1.4 Packet loss
Packets transferred in the IP network may fail to reach their destination which is called
packet loss. There are many factors that cause packet loss, such as signal degradation,
overloaded routing routines. Dropped packets may result in unacceptable performance
issues.
Lijing Ding and Rafik A. Goubran have done some research in assessing the effects of
packet loss on speech quality in VoIP. Figure 2-13 is the result they got for repetition
concealment. In their experiment, they use Mean Opinion Score (MOS) to represent the
quality. MOS is defined by ITU-T P.800 (ITU-T, 1996a). As we can see from the figure,
the speech quality drops with increasing packet loss rate.
Figure 2-13: MOS for the repetition concealment (Ding, 2003)
2.3.1.5 Echo
Echo is a phenomenon where you can hear your own voice back after some milliseconds.
It is caused by signal reflections in the transmission path. Most often this occurs because

29
of a mismatch in impedance from the four-wire network switch to the two-wire local
loop. An acoustic feedback from the earphone to microphone is also a reason for echo.
The speakers hear their own speech if the echo delay exceeds a few milliseconds. ITU
recommends that the echo delay should be kept below 5 milliseconds. The talker echo
tolerance time is shown in Figure 2-14. Echo cancellation needs to be employed to
overcome this problem.
Figure 2-14: Talker echo tolerance curve (ITU-T, 1996b)
2.3.2 Solutions
Because of the nature of IP networking, VoIP service providers face the challenges in
delivering voice signals correctly. How to improve the user experience is vital to the
success of VoIP applications. There are several ways to enhance the QoS of VoIP

30
applications. Service providers can do it by increasing the bandwidth, using priority
mechanisms.
Delivering voice service in a good quality is crucial for VoIP service providers. The
quality of voice service provided in traditional PSTN network is guaranteed. In order to
make VoIP as an acceptable alternative for the PSTN service, end-users must receive the
same quality of service in VoIP network. As we know, all real-time applications in the IP
network are restricted by the network conditions, such as bandwidth and delay.
In order to provide an acceptable level of service, the service providers must reduce the
impact of delay, packet loss and jitter as much as possible. Some approaches for
enhancing the quality of service are listed below:
• Ensuring the bandwidth – Voice service is time-sensitive. It needs a constant bit
stream. If the traffic in the network is too heavy, packet delay and latency will
dramatically increase. The solution is to limit the number of the calls to ensure
each channel has sufficient bandwidth. Some kind of connection admission
control (CAC) mechanism is developed to address this problem.
• Marking packets in different priorities – Delay is not vital to the data stream.
By marking the voice packets in a higher priority and delivering them first could
ensure the voice packets are delivered timely.
• Improving the design of Network – Designing the network and configuring the
WAN devices to deal with voice packets properly. It may need to update the
hardware and software of the career network or deploy dedicated bandwidth for
voice traffic. The disadvantage of this approach is the cost.
Few solutions are discussed in more detail in the following sections.
2.3.2.1 Differentiated Services (DiffServ)
DiffServ is a class of service that is used for IP network to classify network traffic and
provide layer3 quality of service guarantee. It marks packets with different priority values,
which can be used by network devices to provide different levels of service or bandwidth
allocation. It is defined in RFC 2474 (Definition of the differentiated Services Field in
31
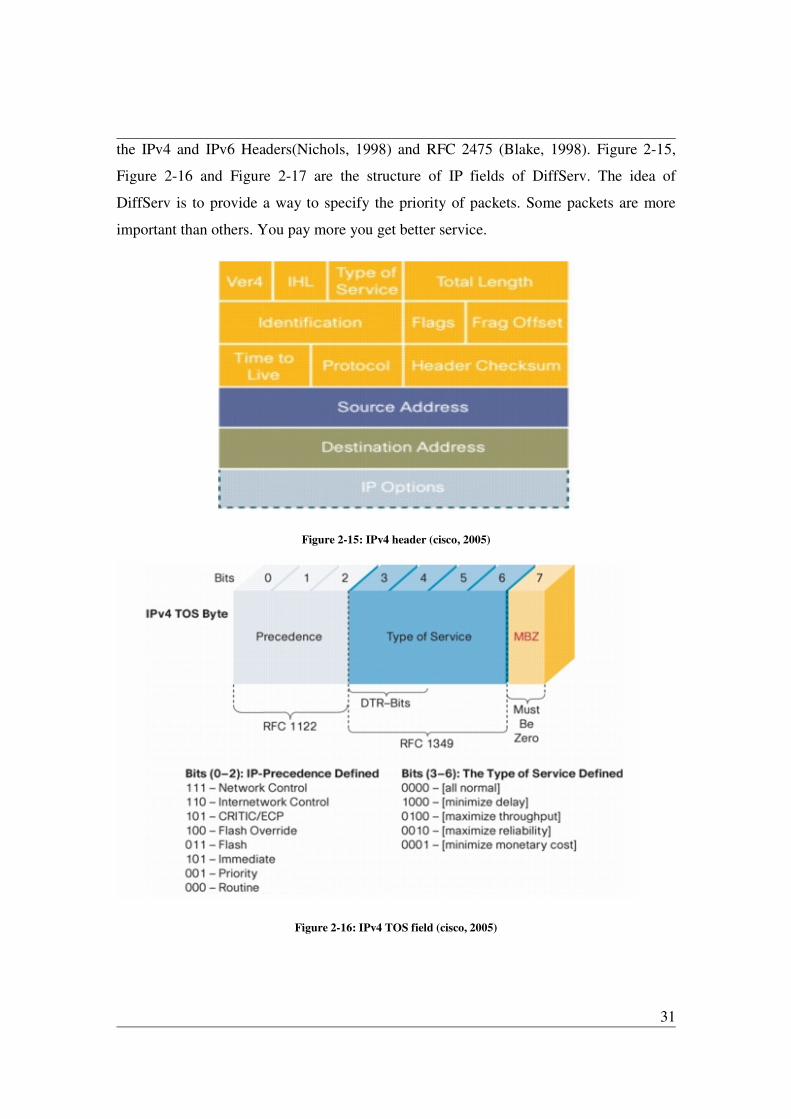
the IPv4 and IPv6 Headers(Nichols, 1998) and RFC 2475 (Blake, 1998). Figure 2-15,
Figure 2-16 and Figure 2-17 are the structure of IP fields of DiffServ. The idea of
DiffServ is to provide a way to specify the priority of packets. Some packets are more
important than others. You pay more you get better service.
Figure 2-15: IPv4 header (cisco, 2005)
Figure 2-16: IPv4 TOS field (cisco, 2005)

32
Figure 2-17: DS-Field (cisco, 2005)
2.3.2.2 Multiprotocol Label Switching
Multiprotocol Label Switching (MPLS) is a tag switching mechanism developed by
router vendors. MPLS operates between Layer 2 (Data Link Layer) and Layer 3
(Network Layer) of OSI model. By placing a 32-bit header between the local network
and IP headers of the packet, routers are able to interpret and act based on the new label.
Since the MPLS enabled routers to only check the MPLS header instead of the entire IP
header, it is more efficient to manage and transmit packets between endpoints. With the
convergence of video/audio and data applications, MPLS could be used to increase the
efficiency of transferring voice data by enabling class of service tagging and
prioritization of network traffic.
2.3.2.3 IntServ and Resource Reservation Protocol (RSVP)
IntServ (Integrated Services) is an architecture designed to guarantee quality of service
on networks. The architecture defines a set of extensions to allowing end-to-end QoS to
be provided to applications. It assumes some setup mechanism is used to convey
information to routers so that they can provide requested services to flows that require
them (Bernet, 2000). RSVP is the most widely used mechanism to signal it across the
network. RSVP is designed for the host to reserve resource across the network for certain
applications such as video and audio. The details of RSVP are defined in RFC 2205
(Braden, Sep/1997). According to the definition in RFC 2205, RSVP was designed to
operate with current and future unicast and multicast routing protocols such as Open
33
Shortest Path First (OSPF) and Border Gateway Protocols (BGP), and relies on these
routing protocols to determine where reservation requests should be sent.
2.4 Measuring quality of service
Several methods have been developed to measure the effectiveness of QoS mechanisms
for different traffic and network conditions. The Mean Opinion Score (MOS) test is a
well accepted standard for rating speech quality. It rates the speech quality one a scale
from 1 to 5, which is defined in the ITU-T Rec.P.800. The problem with this method is it
needs a large number of listeners in order to get a mean score, which is time-consuming,
expensive measurement.
In order to overcome the problem with MOS, some methods were developed in recent
years. The E-model which is defined by ITU-T G.107 (ITU-T, 2003) is a computational
model converting all parameters that affect a voice call into a single factor. It is able to be
converted into MOS value.
More detailed explanations of these two models are discussed below, followed by the
method to map the result between them.
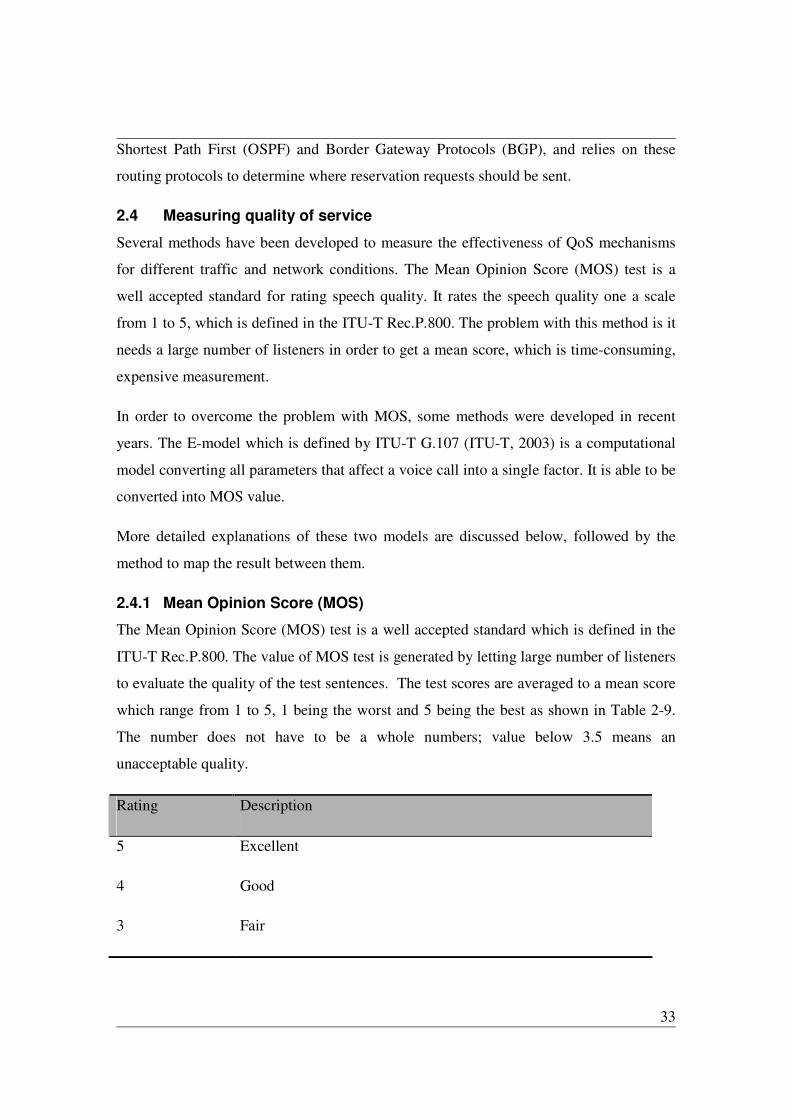
2.4.1 Mean Opinion Score (MOS)
The Mean Opinion Score (MOS) test is a well accepted standard which is defined in the
ITU-T Rec.P.800. The value of MOS test is generated by letting large number of listeners
to evaluate the quality of the test sentences. The test scores are averaged to a mean score
which range from 1 to 5, 1 being the worst and 5 being the best as shown in Table 2-9.
The number does not have to be a whole numbers; value below 3.5 means an
unacceptable quality.
Rating Description
5 Excellent
4 Good
3 Fair

34
2 Poor
1 Bad
Table 2-9: MOS five point scale
Since the test is based on people’s opinion, same difference of perception is expected. To
overcome it, a large number of people are used in the test, and the Mean of their
individual scores are used to rate the quality of service. The value of 4 is considered as
“toll quality” for the VoIP service.
2.4.2 E-model
The E-model which is defined by ITU-T Rec.G.107 (ITU-T, 2003) is a computational
model used to convert parameters that describe a voice call quality into a single known as
the R factor. The E-model is an important model used in this research and it is described
in detail in this section.
Figure 2-18: Reference connection of the E-model (ITU-T, 2003)

35
The E-model is a mathematical algorithm, with which the transmission parameters are
taken into account as different individual “impairment factors” that have additive effect
in a psychological scale. The transmission parameters used as E-model inputs are shown
in Figure 2-18.
Several of the parameters are described below:
• Loudness Ratings
The loudness is usually expressed in dB. The Overall Loudness Rating (OLR) defines
the sound power loss between the acoustical signal at the microphone and the
listeners’ ear. It can be decomposed into Send Loudness Rating (SLR), between the
microphone and the network interface and the output of the loudspeaker; Circuit
Loudness Rating (CLR), across the different circuits involved in the communication;
and Receive Loudness Rating (RLR) between the local loop and the signal at the
output. Since CLR = 0db in digital networks, the OLR can be defined as:
OLR = SLR + RLR
• Sidetone
Sidetone is the sound emanating from the surroundings and perceived by the listening
ear together with the received speech.
• Echo and stability
The talker can hear their own voice and the listener may receive multiple copies of
the original sound with slight delays due to echo.
• Mean end-to-end delay
The mean one way delay has an influence in the call quality. Excessive delays could
cause lack of interactivity in the conversations
• Noise and quantization distortion

36
Noise is any undesired sound mixed with the conversation. Digital networks do not
add noise in the line, leaving noise added at both end points.
In addition to parameters affecting the quality of circuit-switched telephone networks,
more parameters should be considered in IP network:
• Delay variation (jitter)
The only way to control jitter is to place a buffer at the receiver side. The size of the
buffer could be dynamically adjusted to meet the best result.
• Absolute delay
It is usually higher in packet switching networks.
• Packet loss
Including the long delayed packets and lost packets.
• Packet duplication
It mainly happen in multicast applications.
The result score of the E-model is the transmission QoS rating R factor, a scalar measure
that ranges from 0 (poor) to 100 (excellent). The R factor can be calculated by the
following equation:
AIIIRR effeds +−−−=−0 (2-1)
The brief explanations of each impairment factor are discussed below,
0R represents the basic SNR (signal-to-noise ratio); it can be expressed as:
)(1515 00 NSLRR +−= (2-2)
The term 0N represents the power addition of different noise sources (electric circuit
noise, the equivalent circuit noises caused by the room noise at each side and the noise

37
floor at Received side) in dBm0p. SLR stands for Send Loudness Rating between the
microphone and the network interface and the output of the loudspeaker.
sI represents the combination of those impairments which occur more or less
simultaneously with the voice signal. It is divided into three further factors: excessive
loudness ( olrI ), non optimal sidetone ( stI ) and PCM quantizing distortion ( qI ).
qstolrs IIII ++= (2-3)
dI accounts for the impairments caused by delay, it can be expressed as the sum of talker
and listener echoes (dledte II + ), and excessive delays with perfect echo cancellation (
ddI ):
dddledted IIII ++= (2-4)
The factor effeI−
represents impairments caused by low bit rate CODECs. The impact of
packet loss is also included here.
A is the advantage factor, that corresponds to the user allowance due to the convenience
in using a given technology. For example, users may accept the speech quality in GSM,
but the same quality would be considered poor in the PSTN network. Factor A is usually
set to zero for carriers providing tool quality speech communication through IP networks.
Some provisional values for factor A are given in Table 2-10
Communication system example Maximum value of A
Conventional 0
Cellular networks in a building 5
Mobility in a geographical area or moving
in a vehicle
10
Access to hard-to-reach locations 20
Table 2-10: Provisional examples for the advantage factor A

38
The default values of all input parameters used in the algorithm of the E-model are
provided in Table 2-11 (ITU-T, 2003).
Parameter Abbr Unit Default value
Send Loudness Rating SLR dB +8
Receive Loudness Rating RLR dB +2
Sidetone Masking Rating STMR dB 15
Listener Sidetone Rating LSTR dB 18
D-Value of Telephone, Send Side Ds - 3
D-Value of Telephone Receive Side Dr - 3
Talker Echo Loudness Rating TELR dB 65
Weighted Echo Path Loss WEPL dB 110
Mean one-way Delay of the Echo Path T ms 0
Round-Trip Delay in a 4-wire Loop Tr ms 0
Absolute Delay in echo-free Connections Ta ms 0
Number of Quantization Distortion Units qdu - 1
Equipment Impairment Factor Ie - 0
Packet-loss Robustness Factor Bpl - 1
Random Packet-loss Probability Ppl % 0
Burst Ratio BurstR - 1
Circuit Noise referred to 0 dBr-point Nc dBm0p -70
Noise Floor at the Receive Side Nfor dBmp -64
39
Room Noise at the Send Side Ps dB(A) 35
Room Noise at the Receive Side Pr dB(A) 35
Advantage Factor A - 0
Table 2-11: E-model default values
In the G.107 standard, it strongly suggested that the default values presented in the above
table are used for all parameters which are not varied during planning calculations.
By using these default values listed in Table 2-11, Equation (2-1) can be reduced to:
effedeffed IIIIR−−
−−=+−−−= 4.9304.18.94 (2-5)
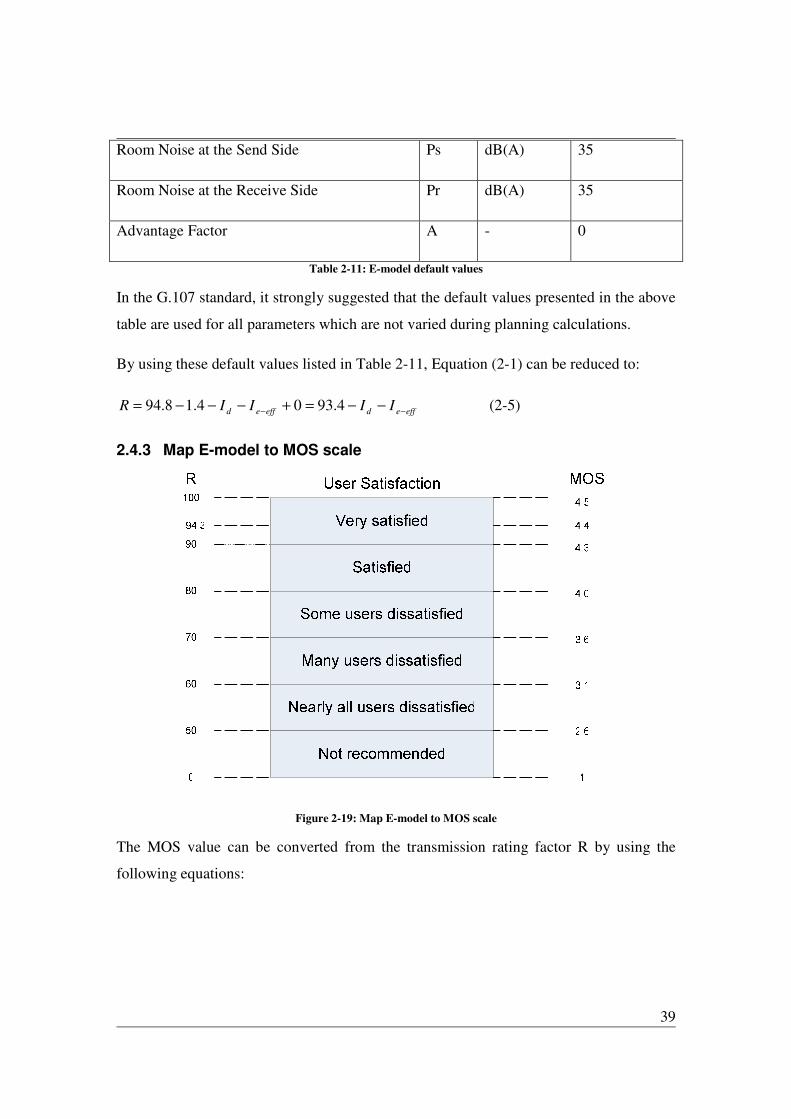
2.4.3 Map E-model to MOS scale
Figure 2-19: Map E-model to MOS scale
The MOS value can be converted from the transmission rating factor R by using the
following equations:

40
5.4:100
107)100)(60(035.01:1000
1:0
6
=>
∗−−++=<<
=<
−
CQE
CQE
CQE
MOSRFor
RRRRMOSRFor
MOSRFor
(2-6)
2.4.4 Benefits of QoS evaluation
This research is going to propose a new solution to testing and representing quality of
service. By evaluating the effective performance of VoIP, both the service providers and
clients could benefit from it as follows:
• Service providers
- Gain visibility of performance of their service
- Test their network availability
- Plan for the future enhancement of their service
• End users
- The evaluation would drive the service providers to bring better quality
service to end users. End users could enjoy a better quality conversation along
with low cost
2.5 Brix Networks’ VoIP Weather
Brix Networks is a company that provides service assurance solutions that proactively
monitor next-generation, IP service quality. Their unique Brix Tri-Q Analysis provides
total VoIP and IP video-based service testing.
TESTMYVOIP.COM is provided by Brix Networks. It allows registered user to make
calls to one of their test locations and report the result in their VoIP Weather.
41
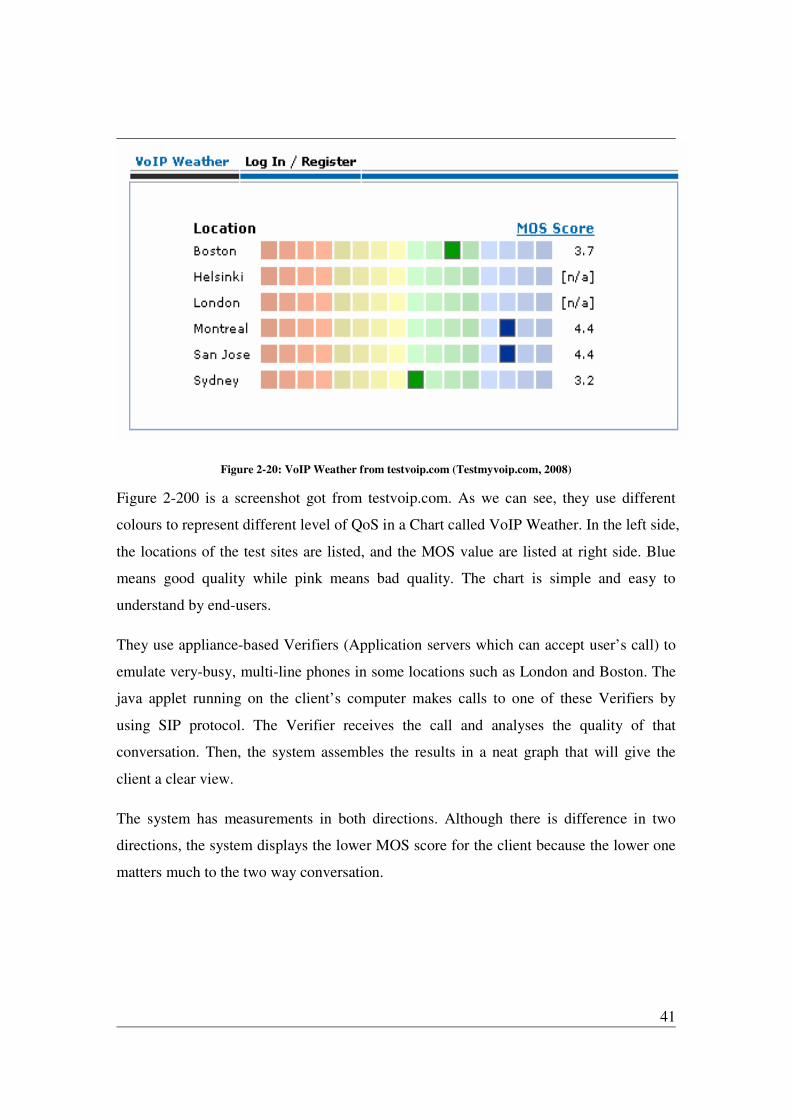
Figure 2-20: VoIP Weather from testvoip.com (Testmyvoip.com, 2008)
Figure 2-200 is a screenshot got from testvoip.com. As we can see, they use different
colours to represent different level of QoS in a Chart called VoIP Weather. In the left side,
the locations of the test sites are listed, and the MOS value are listed at right side. Blue
means good quality while pink means bad quality. The chart is simple and easy to
understand by end-users.
They use appliance-based Verifiers (Application servers which can accept user’s call) to
emulate very-busy, multi-line phones in some locations such as London and Boston. The
java applet running on the client’s computer makes calls to one of these Verifiers by
using SIP protocol. The Verifier receives the call and analyses the quality of that
conversation. Then, the system assembles the results in a neat graph that will give the
client a clear view.
The system has measurements in both directions. Although there is difference in two
directions, the system displays the lower MOS score for the client because the lower one
matters much to the two way conversation.
42
3 Objectives
The research objectives included gaining an understanding of VoIP QoS assessment
techniques and proposing a new approach, the VoIP WeatherMap, for the collection,
assessment and visual representation of VoIP QoS for individual VoIP sessions and
aggregated VoIP QoS results for Internet links.
Initial research included a literature review of the fundamental technologies used in the
development of the VoIP WeatherMap prototype. Technologies reviewed included Real-
time Transport Protocol (RTP/RTCP), voice quality assessing models (MOS and E-
model) and software concepts including overlaying results onto a map using the Google
Application Programming Interface (API).
During the VoIP WeatherMap prototype development a suitable implementation of the
RTP/RTCP protocol stack was identified and used as part of the data collection system.
The data collection system permitted an automated VoIP session to be carried out across
the Internet and VoIP QoS to be measured for the test VoIP session.
The research included identifying a suitable approach to utilize a VoIP quality
measurement technique in the VoIP WeatherMap.The VoIP WeatherMap included a
logic capability that would permit VoIP QoS results to be calculated based upon the test
VoIP sessions and sent back to the VoIP WeatherMap for collation and display. VoIP
quality measurement techniques review included MOS and the E-model.
The VoIP WeatherMap prototype utilized Google Maps because Google Maps provides a
convenient means of overlaying information on detailed maps covering the world. An
objective of the VoIP WeatherMap was to provide a more convenient method for
displaying VoIP QoS results.
3.1 Limitations
The research objectives included development of the VoIP WeatherMap prototype. The
prototype provided the basis for research objective analysis, discussion and comparison

43
with alternative approaches identified during the literature review and later stages of the
research.
Due to the limited time available for prototype development, the VoIP WeatherMap
prototype did not include features that would have been added if time permitted. A
discussion of prototype enhancements is provided with justification, though without the
analytic results that would have been obtained if the additional features were
implemented.
The research includes VoIP session simulation. The simulation results may be affected by
the choice of RTP/RTCP stack used in the prototype. The Java Media Framework (JMF)
RTP/RTCP APIs were used for development the VoIP simulator. The JMF supports
changing the VoIP CODECs programmatically and this was an important requirement for
the prototype to be automated. An analysis of different RTP/RTCP stacks being used as
part of the VoIP WeatherMap prototype is left for future work.
Limitations of the systems used in the VoIP WeatherMap prototype are:
• Java is an interpreter language. Java is usually slower than applications developed
using optimized c or c++. Java was utilized because prototype development time
was reduced.
• The JMF is an open source media framework. It does not implement all the
functions that are defined in the RTP/RTCP standards.
• The VoIP session simulator does not support all the functions supported by
current VoIP softphones. The VoIP session simulator was used to generate RTP
packets carrying voice clips only.
• The VoIP WeatherMap was not designed for any specific networks. Results may
vary slightly when the VoIP WeatherMap is operated on different networks.
3.2 Assumptions
The VoIP WeatherMap was designed to assess the network conditions at the time of each
VoIP session. Assumptions were made to ensure that the test conditions were such that

44
reasonable results could be collected and an analysis carried out. The major assumptions
made in this research were:
• An ideal transmission medium was assumed, the network over which the test
VoIP sessions occurred were available and bandwidth to make a VoIP call was
also available.
• The JMF RTP/RTCP library and APIs were well designed and tuned to provide
an optimal traffic flow.
• The VoIP WeatherMap test locations were representative of a real carrier network.

45
4 VoIP WeatherMap prototype and implementation
The rapid growth of VoIP as a key service and technology has highlighted the benefits of
the digital network, but has also demonstrated drawbacks in digital network performance
when transporting real-time traffic. To provide a high quality of service equivalent to the
public switched telephone network (PSTN), there is a need to continually improve the
performance of the digital network for VoIP. The question of how to assess the fitness of
the digital network for VoIP has not been universally addressed and the VoIP
WeatherMap system is one way to provide timely information about the current state of
the digital network for VoIP use. This is an important requirement for VoIP users and
VoIP service providers that is not currently available.
This chapter gives the details of the VoIP WeatherMap prototype and describes the
demonstration prototype implementation, including an explanation of each component of
the prototype. The chapter includes discussion about the prototype capabilities and its
limitations, which were necessary to achieve a prototype implementation within the
research program timeline.
4.1 Introduction
The VoIP WeatherMap is a solution, designed to enable VoIP QoS testing, assessment
and presentation, which uses cutting-edge technologies to present the performance of
VoIP services on digital network. The system uses a simulator for IP VoIP calls. Multiple
VoIP session simulators are deployed to send real-time transport protocol (RTP) packets
to several application servers deployed in different geographical regions. As each VoIP
call takes place important information about the VoIP call QoS is collected and stored in
a central database. The collected data is then analysed using VoIP QoS measures. The
voice call is classified by the measured call quality level. Then a map tool is used to
generate the map of the QoS of different regions. In this map, different colours represent
different levels of service. For example, if a VoIP service provider has two
communication servers and three end users, the VoIP WeatherMap can be used to
determine the QoS of each path between any end-point to any server as shown in Figure
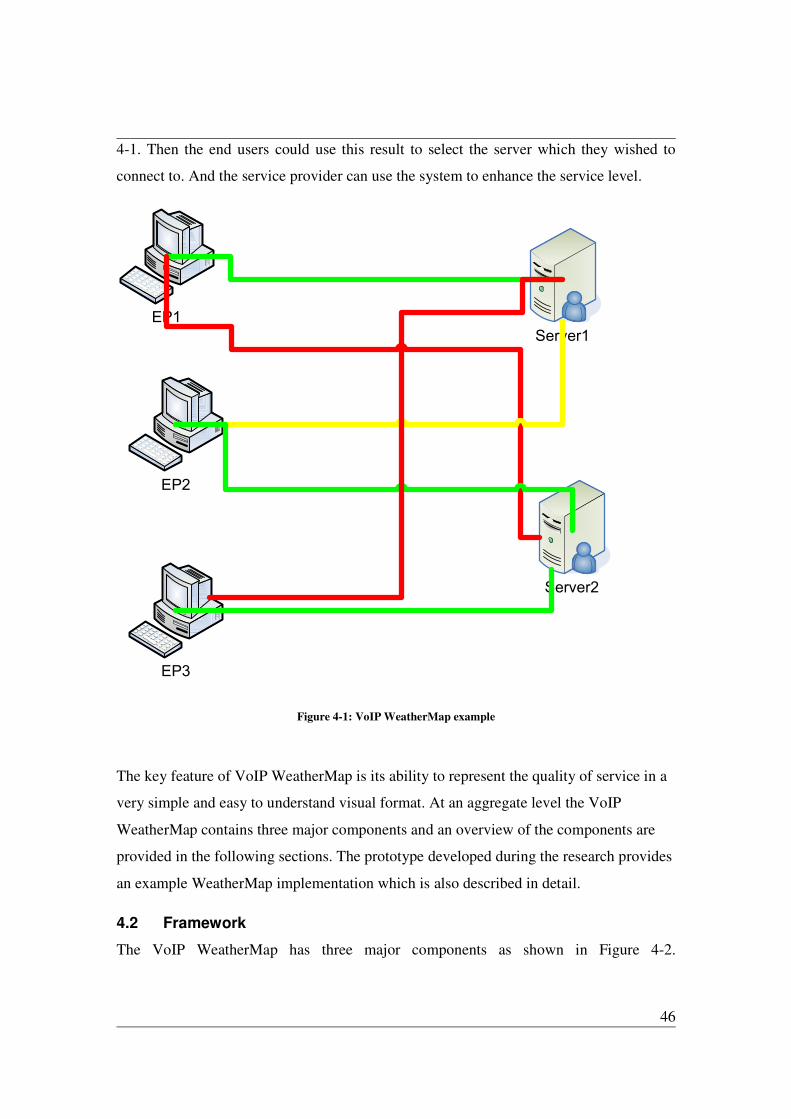
46
4-1. Then the end users could use this result to select the server which they wished to
connect to. And the service provider can use the system to enhance the service level.
`
EP1
`
EP2
`
EP3
Server1
Server2
Figure 4-1: VoIP WeatherMap example
The key feature of VoIP WeatherMap is its ability to represent the quality of service in a
very simple and easy to understand visual format. At an aggregate level the VoIP
WeatherMap contains three major components and an overview of the components are
provided in the following sections. The prototype developed during the research provides
an example WeatherMap implementation which is also described in detail.
4.2 Framework
The VoIP WeatherMap has three major components as shown in Figure 4-2.
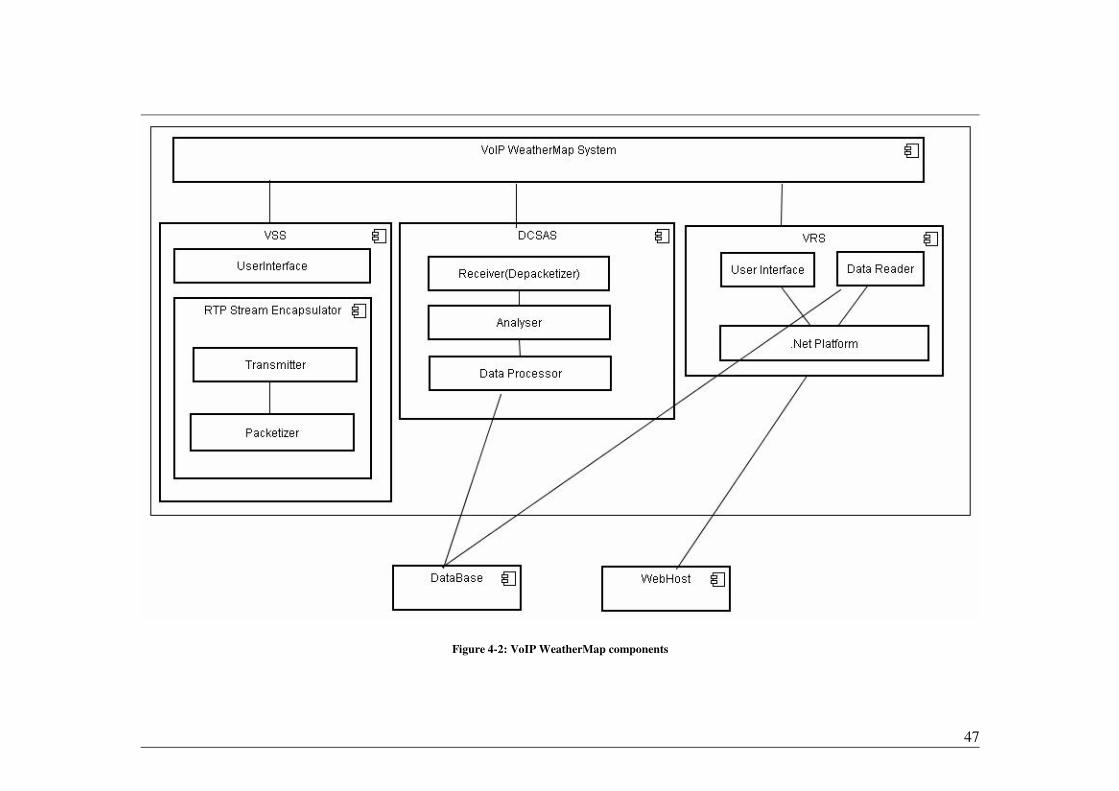
47
Figure 4-2: VoIP WeatherMap components

48
The three VoIP WeatherMap components are the VoIP Session Simulator System (VSS), the Data Collection, Storage and Analysis
System (DCSAS) and Visual Representation System (VRS).
• VoIP Session Simulator (VSS) - simulates a VoIP call by sending voice data in an RTP stream to the VoIP WeatherMap
system server. The VSS periodically packetizes the sample audio into RTP packets and transfers it into the internet within IP
packets, creating a constant stream simulating a VoIP call session.
• Data Collection, Storage and Analysis Server (DCSAS) – The DCSAS sub-system is used to collect, store and analyse data.
It de-packetizes the VoIP stream packets received from the VSS and then analyses the received packet and calculates factors
such as the delay, jitter and packet loss rate. The results of the analysis are stored in the server database. Further analysis of the
information store in the database may occur prior to the information being used to display the network status.
• Visual representation system (VRS) - displays the VoIP QoS status level for the communication path between the VSS and
the DCSAS. The VRS is a web based map display that has been created using Google Maps and an overlay that represents the
network status using colours for the VoIP QoS level.
The major data flow between the three sub-systems is provided in Figure 4-3 and functions of each sub-system are shown in Figure
4-3.

49
Figure 4-3: Data flow between simulator and DCSAS

50
The functionality features provided by VoIP WeatherMap are described as:
• VSS:
• Specifies audio sample
• Sets up packets sending interval
• Encapsulates RTP packets
• Sends out RTP packets
• DCSAS
• De-packetizes received RTP packets
• Collects data parameters for calculating QoS value
• Analyses and calculates QoS
• Stores information into database
• VRS
• Generates User Interface like a television news weather map
• Marks test paths in corresponding colours
• Interacts with end-users through web pages
4.3 VoIP Session Simulator (VSS)
VSS is the component which simulates voice streams and transmits the streams across
Internet. The advantages of simulation are the tests are cost effective and easy to measure
and repeat. The simulator has two major parts: a packetiser and a transmitter. The
packetiser is used to encapsulate voice sample into RTP packets whilst the transmitter
passes the packets to the network. The networking protocol stack and message format are
illustrated in Figure 4-5 and Figure 4-6.
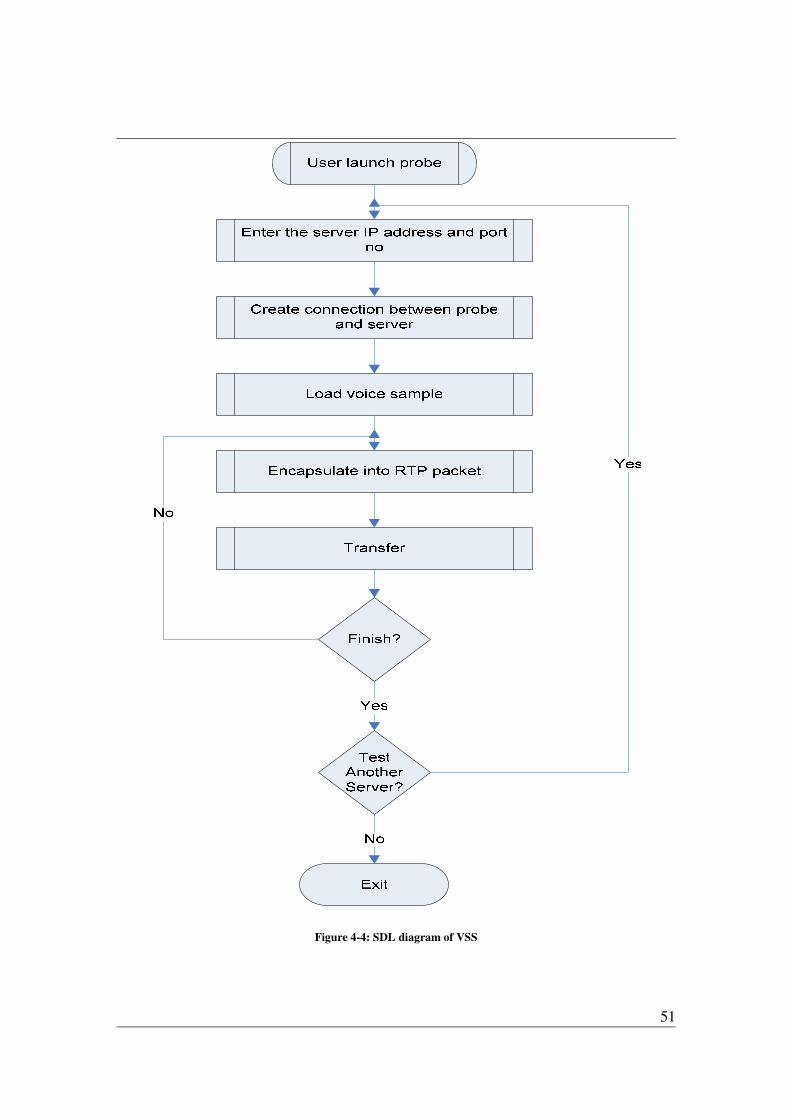
51
Figure 4-4: SDL diagram of VSS

52
Figure 4-5: Protocol Stack
Figure 4-6: Message format
RTP is the de facto standard for media transmitting applications such as VoIP
applications. The simulator is an implementation of RTP/RTCP protocol. Due to the
characteristics of UDP protocol, it is widely used as the transport layer protocol in many
VoIP applications. And it is also selected as the transport layer protocol for implementing
the simulators in this research.

53
4.3.1 Implementation
Java Media Framework (JMF) is used to implement VSS. JMF APIs provides technology
for enabling audio/video and other real-time media to be added to applications. The
package can capture, playback, stream and transfer multiple media formats based on the
java technology.
JMF2.1.1 supports audio sample rates from8 KHz to 48 KHz. The RTP formats
supported by JMF2.1.1 are listed below:
• Audio: G.711 (U-law) 8KHz
• Audio: GSM mono
• Audio: G.723 mono
• Audio: 4-bit mono DVI 8KHz
• Audio: 4-bit mono DVI 11.025 KHz
• Audio: 4-bit mono DVI 22.05 KHz
• Audi: MPEG Layer I, II
JMF can be used to create applications that present, capture, manipulate and store time-
based media. Figure 4-7 shows the high level architecture of JMF framework.

54
Figure 4-7: JMF high level architecture (java.sun.com)
JMF APIs have three packages that support RTP, including javax.media.rtp,
javax.media.rtp.event, javax.media.rtp.rtcp. The following functions are supported by
these packages:
• Open RTP sessions and send outgoing RTP streams from a data source
• Receive RTP stream and playback by using the JMF player
• Monitor the session by using RTCP information
• Access receive stream and send stream statistics
• Register Dynamic payload with the RTPSessionManager
• JMF plugin architecture allows user to plugin their own encodings into RTP
JMF has two simple wrapper classes, VideoTransmit and AVTransmit that can be used to
take media input from a source and transmit the media to a destination. VideoTransmit is
a class used for transfer video only. But AVTransmit is used to transmit all available
media from the input.

55
The RTP APIs can be used to transmit media steams over the Internet. The media source
can originate from either a file or a capture device. Figure 4-8 shows a diagram of RTP
Transmission.
Figure 4-8: RTP transmission (java.sun.com, 2008)
Similarly, the RTP APIs can also be used to receive media streams over the Internet.
Figure 4-9 is the architecture of the RTP framework.
Figure 4-9: JMF RTP architecture
JMF supports RTP/RTCP stacks. It could be used by developers to program scalable real-
time transferring applications. RTP is used to provide end-to-end real-time data delivery

56
service. Although RTP is not dependent on any transport and network layers protocols, it
is often used over UDP.
RTCP packet contains the QoS information for the session participants. It is sent
periodically to all the participants in the session. There are five major types of RTCP
packets:
• Sender Report
• Receiver Report
• Source Description
• Bye
• Application-specific
Several major objects of JMF RTP APIs are discussed below:
• Session Manager – A sessionManager is like a coordinator of a RTP session,
which tracks of the session participants and the transmitted streams. It enables the
application to initialise, remove and close the entire session.
• Session Statistics – Session statistic maintains the statistics on all the RTP/RTCP
packets sent and received.
• Session Participants – Session participant tracks all of the participants in a session.
Session manager will create a participant whenever a RTCP packet arrives
contains a source description.
• Session Streams – It is used to maintains an RTP stream object for each stream of
RTP data packets.
JMF has an example RTP transmitter application. It has most functions needed by this
research. Additional functions were added by me to mark timestamps and synchronise
time.

57
4.4 Data Collection, Storage and Analysis Server (DCSAS)
DCSAS is used to analyze received RTP packets and to calculate and store the critical
data into the database. Figure 4-10 shows the major components of DCSAS and Figure
4-11 and Figure 4-12 show the workflow and SDL diagram of this sub-system.
Figure 4-10: DCSAS

58
Figure 4-11: Dataflow of DCSAS
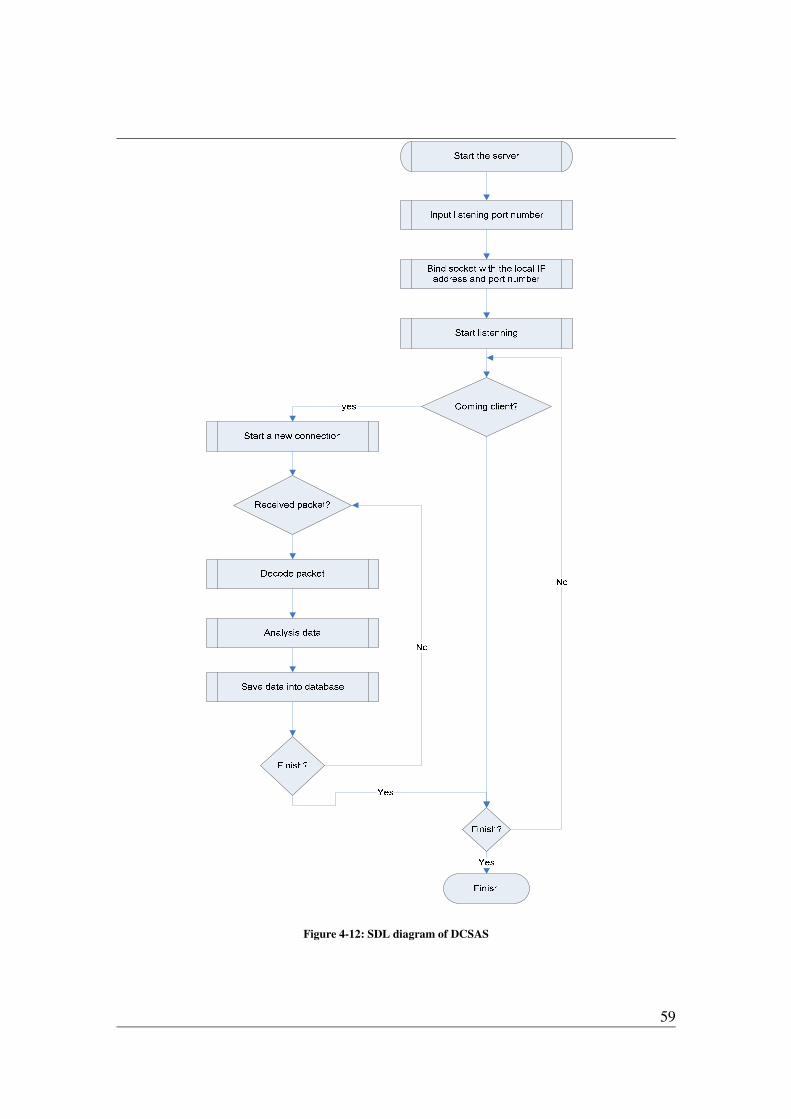
59
Figure 4-12: SDL diagram of DCSAS
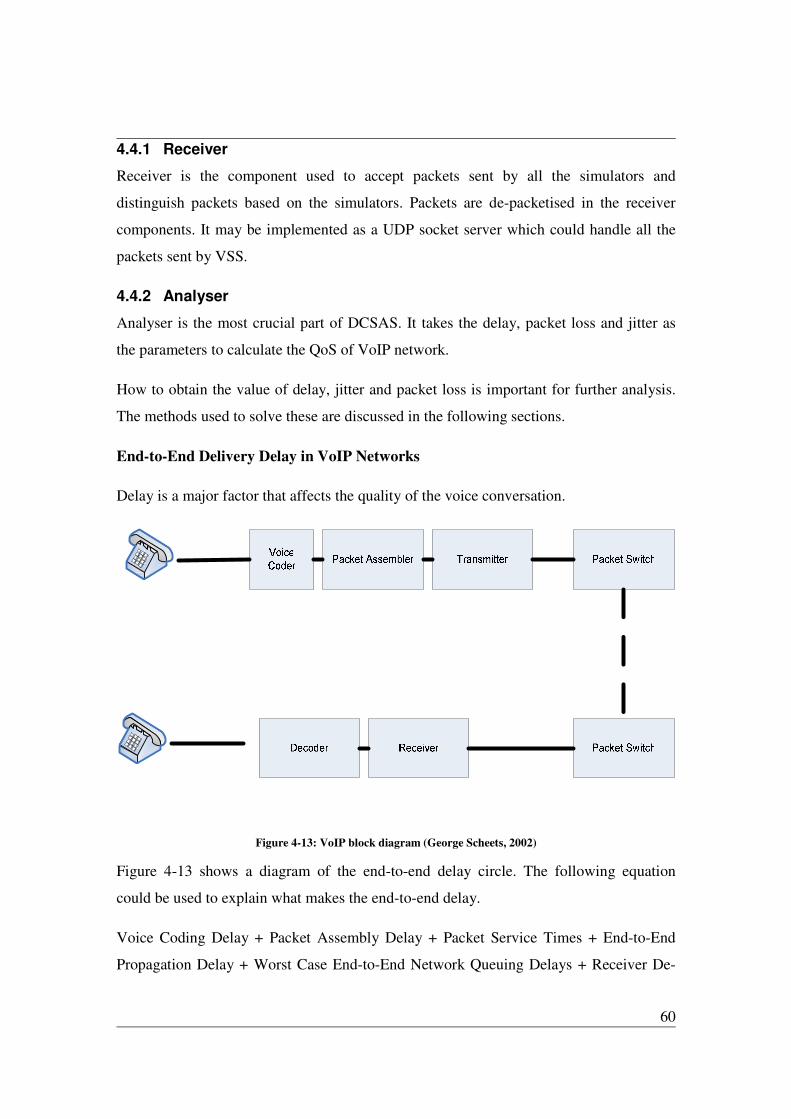
60
4.4.1 Receiver
Receiver is the component used to accept packets sent by all the simulators and
distinguish packets based on the simulators. Packets are de-packetised in the receiver
components. It may be implemented as a UDP socket server which could handle all the
packets sent by VSS.
4.4.2 Analyser
Analyser is the most crucial part of DCSAS. It takes the delay, packet loss and jitter as
the parameters to calculate the QoS of VoIP network.
How to obtain the value of delay, jitter and packet loss is important for further analysis.
The methods used to solve these are discussed in the following sections.
End-to-End Delivery Delay in VoIP Networks
Delay is a major factor that affects the quality of the voice conversation.
Figure 4-13: VoIP block diagram (George Scheets, 2002)
Figure 4-13 shows a diagram of the end-to-end delay circle. The following equation
could be used to explain what makes the end-to-end delay.
Voice Coding Delay + Packet Assembly Delay + Packet Service Times + End-to-End
Propagation Delay + Worst Case End-to-End Network Queuing Delays + Receiver De-

61
Jitter Buffer Delay + Voice Decoding Delay <= Target End-to-End Voice Delivery Delay
(George Scheets, 2002)
The end-to-end delay is impacted on by a large number of factors. But as was discussed
in Chapter 2, the delay mainly happens in the media between the two end-points. The
delay equation can be reduced to:
Delay = T2 – T1 (4-1)
Where T2 means the time the packet is received and T1 means the time that the packet is
sent out. T1 can be found by reading the RTP header of the received packet (see Chapter
2), while T2 is the system time when the packet arrives. The time synchronization was
done by synchronizing all the receivers and senders to a same internet time server.
Packet Loss
If a voice packet is not received when expected, it is assumed to be lost. Packet loss is
common in data network. When the packet loss exceeds 1%, the quality of conversation
would be unacceptable.
It is important to control the amount of packet loss for good quality voice conversation in
data network. For normal data applications, only need to resend the all the lost packets,
which is totally transparent to end-users. But for the real-time applications such as
video/audio applications, the packet loss will result in poor user experience. Major
telecommunication device manufactures have developed many tools to keep the packet
loss to a minimum level. However, this research is mainly focused on the method to
assess the QoS. How to obtain the packet loss is now described.
In the RTP header, one of the fields contains the sequence number of the packet. We can
get the number of lost packets through comparing the sequence number of the last packet
received to the number of the packets that are expected to be received. The following
equation can be used to calculate the packet loss,
Packet loss = Packet sent – Packet received (4-2)
Jitter

62
Jitter is the delay variation. Excessive jitter causes quality degradation. A solution to this
problem is to create a jitter buffer which is responsible for reassembling packet streams.
But if the buffer size is too big, it creates other problems such as delay which can cause
clipped conversation. Adjust jitter to the proper size would balance jitter and latency.
We now discuss how to calculate the jitter. There is a solution given in RFC 3550. The
variance of the RTP data packet inter-arrival time is measured in timestamp units and
expressed as an unsigned integer.
D(i,j) = (Rj - Ri) - (Sj - Si) = (Rj - Sj) - (Ri - Si) (4-3)
J(i) = J(i-1) + (|D(i-1,i)| - J(i-1))/16 (4-4)
The above two equations are used to calculate jitter. In equation 1, the D means the
difference. Si is the RTP timestamp of packet i while Ri is the time of arrival of packet i.
If we have two packets, the D value would be calculated according to Equation 1.
Equation 2 is the formula to calculate jitter.
4.4.3 Data Processor
Data process is the component used to manipulate data. Mysql++ is a very good c++
wrapper class for accessing Mysql database. And it was used to implement data
manipulating classes in this research.
4.4.4 Implementation
DCSAS is also implemented by using JMF framework with additional java classes to
support database manipulation and communication parameters collection and calculation.
The following is a detailed description of the database design:
Database Design
The database carries information that needed for analysing end-to-end testing quality.
The major tables and relationships between them are as shown in Figure 4-14. Six major
tables are used in the demonstration implementation.

63
Figure 4-14: RD diagram of database design

64
The details of each table’s column definition are shown below,
ConnectionType
ColumnName DataType PrimaryKey NotNull Flags Default Value
Comment AutoInc
ConnectionTypeID INTEGER PK NN UNSIGNED AI
Description VARCHAR What kind of network connection
UploadSpeed INTEGER UNSIGNED
DownloadSpeed INTEGER UNSIGNED
ISP VARCHAR
IndexName IndexType Columns
PRIMARY PRIMARY ConnectionTypeID
ServerInfo
ColumnName DataType PrimaryKey NotNull Flags Default Value
Comment AutoInc
ServerID INTEGER PK NN UNSIGNED AI
HostName VARCHAR
IPAddress VARCHAR
Location VARCHAR
HostISP VARCHAR
IndexName IndexType Columns
PRIMARY PRIMARY ServerID
SimulatorInfo
ColumnName DataType PrimaryKey NotNull Flags Default
Value Comment AutoInc
SimulatorID INTEGER PK NN UNSIGNED AI
ConnectionType_ConnectionTypeID INTEGER NN UNSIGNED
HostName VARCHAR
IPAddress VARCHAR
Location VARCHAR
Physical location of
the refered
client
ConnectionTypeID INTEGER UNSIGNED
IndexName IndexType Columns
PRIMARY PRIMARY SimulatorID
ClientInfo_FKIndex1 Index ConnectionType_ConnectionTypeID
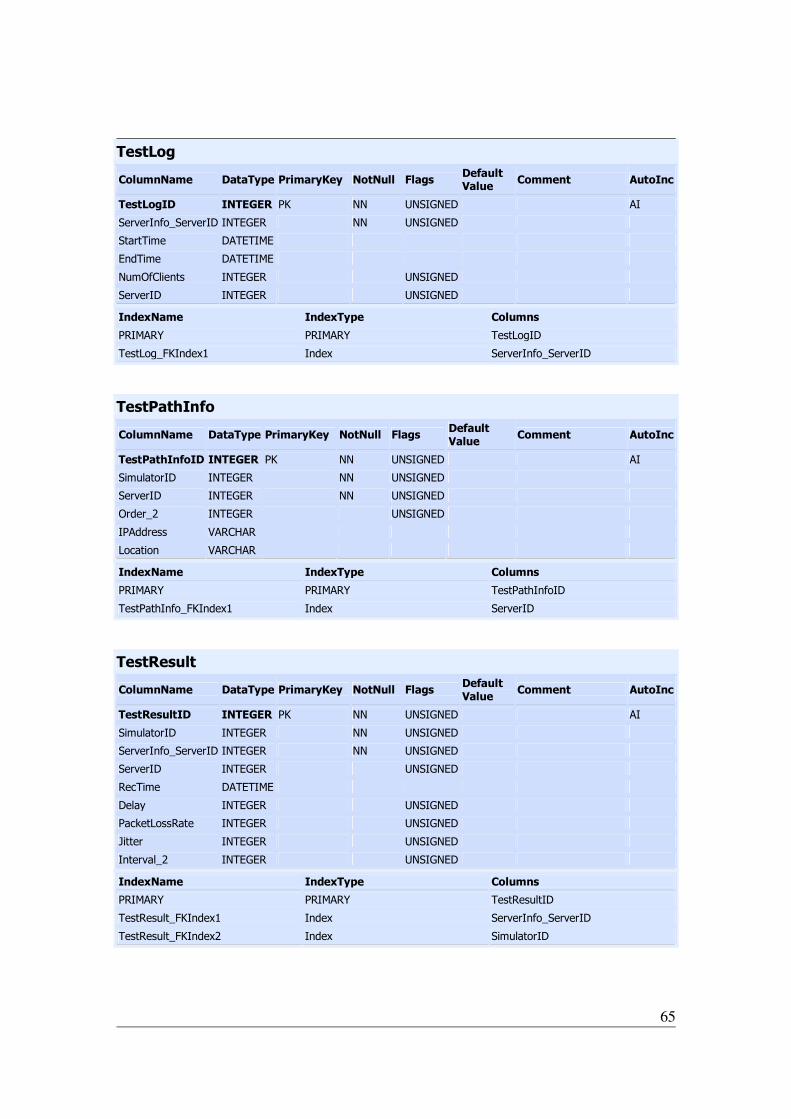
65
TestLog
ColumnName DataType PrimaryKey NotNull Flags Default Value
Comment AutoInc
TestLogID INTEGER PK NN UNSIGNED AI
ServerInfo_ServerID INTEGER NN UNSIGNED
StartTime DATETIME
EndTime DATETIME
NumOfClients INTEGER UNSIGNED
ServerID INTEGER UNSIGNED
IndexName IndexType Columns
PRIMARY PRIMARY TestLogID
TestLog_FKIndex1 Index ServerInfo_ServerID
TestPathInfo
ColumnName DataType PrimaryKey NotNull Flags Default Value
Comment AutoInc
TestPathInfoID INTEGER PK NN UNSIGNED AI
SimulatorID INTEGER NN UNSIGNED
ServerID INTEGER NN UNSIGNED
Order_2 INTEGER UNSIGNED
IPAddress VARCHAR
Location VARCHAR
IndexName IndexType Columns
PRIMARY PRIMARY TestPathInfoID
TestPathInfo_FKIndex1 Index ServerID
TestResult
ColumnName DataType PrimaryKey NotNull Flags Default Value
Comment AutoInc
TestResultID INTEGER PK NN UNSIGNED AI
SimulatorID INTEGER NN UNSIGNED
ServerInfo_ServerID INTEGER NN UNSIGNED
ServerID INTEGER UNSIGNED
RecTime DATETIME
Delay INTEGER UNSIGNED
PacketLossRate INTEGER UNSIGNED
Jitter INTEGER UNSIGNED
Interval_2 INTEGER UNSIGNED
IndexName IndexType Columns
PRIMARY PRIMARY TestResultID
TestResult_FKIndex1 Index ServerInfo_ServerID
TestResult_FKIndex2 Index SimulatorID

66
Definitions of some tables are described below,
Simulator information
• Simulator IDs that can be used to easily identify individual simulators
• Locations of simulators
• IP Address of each simulator
Test log
• TestlogID can be used to identify each test that carried out
• Start time of each test
• End time of each test
• Number of clients that take part in the test
• Number of data collection platforms that take part in the test
Test result
• ID which is used to identify each record
• Packet loss rate
• Delay
• Collect interval
• Simulator ID
Mysql server
Mysql server was used in my implementation. It is an open source relational database
management system. It is very popular in the developer’s communities with millions of
installations worldwide. Some features of MySql are listed below:
• Cross-platform support

67
• Stored procedures and triggers
• Query caching
• Commit grouping, gathering multiple transactions from multiple connections to
increase the number of commits per second.
• Free and open source
MySql is an accepted system that provides great flexibility for custom solution
development.
4.5 Visual Representation System (VRS)
VRS is the Graphic User Interface (GUI) of the VoIP WeatherMap. It visually displays
the levels of QoS for VoIP communication paths in different colours. It looks like a
weather map and is implemented by using the Google Maps API. Figure 4-15 shows the
main work flow of the VRS component.

68
Figure 4-15: SDL diagram of VRS
QCRM (QoS Colour rating model) is used in the VRS as the rating model, which uses
different colours to represents different levels of VoIP QoS, in which red represents bad
quality while green represents excellent quality. The E-model is employed to be the
calculating model for assessing the quality of service. By taking the delay, packet loss as
parameters, E-model calculates a number value which represents the level of quality of
service. By mapping the R value of E-model to a colour of the QCRM, the quality of
service can be represent in the very friendly UI.
The relationship between E-model value, MOS and QCRM is shown in Table 4-1.
QCRM MOS E-model R Value Description
Green >4.0 >80 Desirable
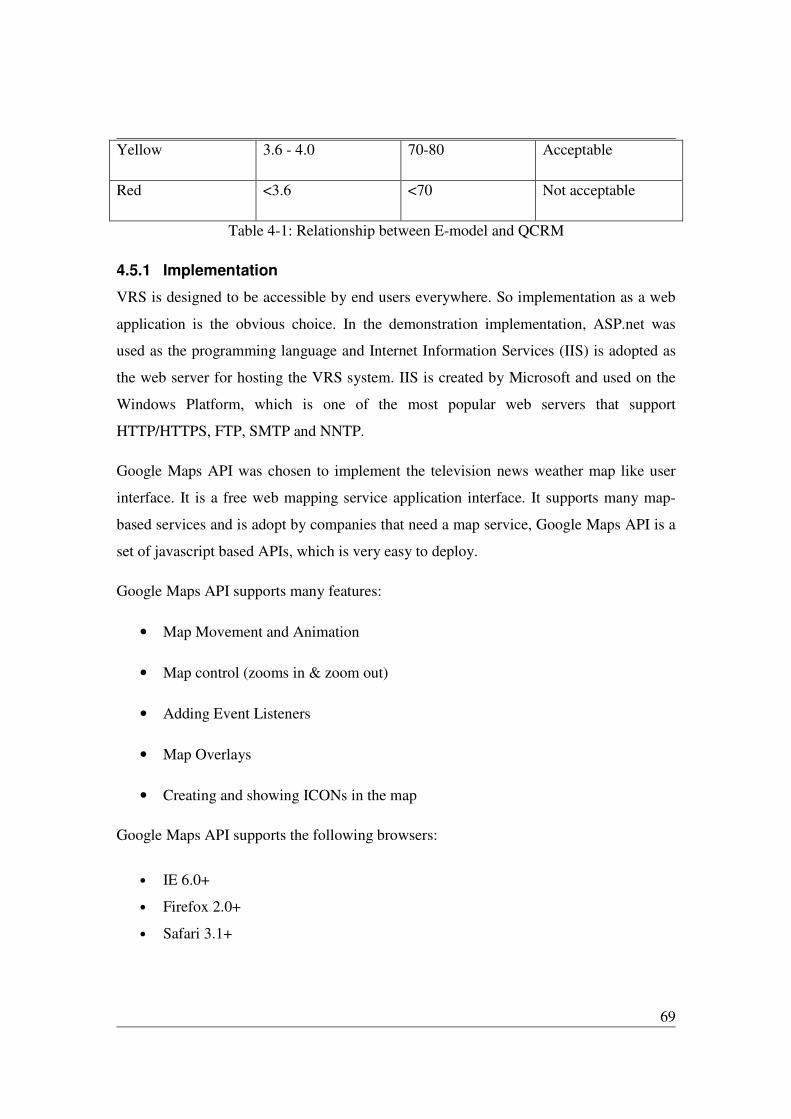
69
Yellow 3.6 - 4.0 70-80 Acceptable
Red <3.6 <70 Not acceptable
Table 4-1: Relationship between E-model and QCRM
4.5.1 Implementation
VRS is designed to be accessible by end users everywhere. So implementation as a web
application is the obvious choice. In the demonstration implementation, ASP.net was
used as the programming language and Internet Information Services (IIS) is adopted as
the web server for hosting the VRS system. IIS is created by Microsoft and used on the
Windows Platform, which is one of the most popular web servers that support
HTTP/HTTPS, FTP, SMTP and NNTP.
Google Maps API was chosen to implement the television news weather map like user
interface. It is a free web mapping service application interface. It supports many map-
based services and is adopt by companies that need a map service, Google Maps API is a
set of javascript based APIs, which is very easy to deploy.
Google Maps API supports many features:
• Map Movement and Animation
• Map control (zooms in & zoom out)
• Adding Event Listeners
• Map Overlays
• Creating and showing ICONs in the map
Google Maps API supports the following browsers:
• IE 6.0+
• Firefox 2.0+
• Safari 3.1+

70
It is easy to include the map service in your website by simply add the script reference.
The below is the command used to include the script:
<script type="text/javascript" src="http://www.google.com/jsapi?key=ABCDEFG"></script>
The most important object in Google Maps API is the “map” itself. The following code is
used to create the map object:
var map = new GMap2(document.getElementById("map_canvas"));
A map can be configured and customized by using the following code: this.map.addControl(new GSmallMapControl()); //which enable the map to zoom in/out this.map.addControl(new GMapTypeControl()); this.map.setCenter(new GLatLng(-30.0000, 135.1419), 4);// set the center of the map Overlay Icons can be added on the map object by specifying the locations. var redIcon = new GIcon(G_DEFAULT_ICON); //Which creates a Icon blueIcon.image = “redIcon.png” //which specifies the image for the Icon. var point = new GLatLng(Latitude, Longtitude); //which creates a point map.addOverlay(new GMarker(point, markerOptions));//which adds the Icon to the map
The following codes can be used to draw lines between server and probes: var polyline = new GPolyline([ //creates a polyline by using a list of points new GLatLng(37.4419, -122.1419), new GLatLng(37.4519, -122.1519) ], "#ff0000", 10); map.addOverlay(polyline); //adds lines on the map
VRS can be implemented to determine which path has higher service quality between end
point and server as shown in Figure 4-16. There are two paths between Server S1 to
Simulator Probe1. The pink spot represents the major network boundary nodes between
the server and the simulator. The IP addresses of the nodes can be obtained by using the
same mechanisms as the “Tracert” utility (Tracert is tool used to determine the route
taken by IP packets across network) does in Windows. And then by checking the IP
location database (which is available in the market), the physical location of each node

71
can be obtained. Due to the current technology limit, the end users can not select the
actually path for communication, but if it is supported in the future by ISPs, the VoIP
WeatherMap system could be used for the end user to choose the path that has the best
quality.
Figure 4-16: Sample result of VRS
In this research, the VRS was implemented to assess the quality between end point and
communication server regardless of communication path.
4.6 Summary
VoIP WeahterMap System aims to provide a creative visual user interface for both end-
users and service providers. Figure 4-17 shows a sample use case for the system.

72
Figure 4-17: Use case for VoIP WeatherMap
VoIP WeatherMap may be implemented as a standalone system or alternatively
implemented in conjunction with the existing VoIP testing systems. The three
components of the VoIP WeatherMap can be separately integrated with other systems.

73
5 Result and analysis
This chapter presents the test results of the VoIP WeatherMap system. This is followed
by an analysis of the test results and comparison with an alternative system that was
launched recently.
The VoIP WeatherMap system is a solution proposed in this thesis for the testing,
analysis and presentation of the quality of service for VoIP applications. The VoIP
WeatherMap system includes three system elements: (1) VoIP Session Simulator (VSS),
(2) Data Collection, Storage and Analysis Server (DCSAS) and (3) Visual Representation
System (VRS). The simulator is a tool that initiates a VoIP test session with a test
location. The test location collects VoIP test session results and passes these to the server.
The server stores VoIP test session results and provides logic that is used to format the
collated VoIP test session results for display on the visual weather map. The visual
weather map is an overlay that has been added to Google maps which shows the VoIP
quality for network transmission paths.
The prime goal of this research has been to create an easy to use and user friendly system
for testing, analyzing and displaying the VoIP QoS for network transmission links.
5.1 Test strategy
Figure 5-1 shows the strategy used to assess the functionalities of the VoIP WeatherMap.
The test strategy has four major steps: (1) Functionality, (2) Functionality under stress, (3)
Long term stability, and (4) Performance testing.

74
Functionality
Functionality under
stress
Long term stability
Verify that all functions work properly
Verify that all functions work properly under stress
Make sure that all functions work properly in long term
Performance test Verify that the system work effectively
Figure 5-1: VoIP Weathermap Test strategy
5.2 Measurement
In this section, the details of the test environment and procedures used in testing are
described.
In order to represent common network conditions, five Visual Session Simulators were
deployed in different locations with different types of network connection. The locations
and network connections of the simulators are described in Table 5-1.
Simulator Physical Location Network Connection
VSS1
Melbourne Reside in same LAN with the
Data Collection, Storage and
Analysis Server (DCSAS)

75
VSS2 Melbourne Campus LAN (100 Mb)
VSS3 Greensborough, VIC Cable (20M)
VSS4 Sydney ADSL (2M)
VSS5 Beijing, China ADSL (1M)
Table 5-1: Network connection of simulators
A DCSAS and a VRS were deployed as well. They were running on a Windows 2003
Server, residing in the RMIT University network engineering research laboratory. The
topology of the test network is as shown in Figure 5-2.
DCSAS
WAN Router
LAN Router
Switch
Internet
`
VSS1
VRS Server
Database Server
`
VSS3
CABLE
`
VSS4
`
VSS5
ADSL
ADSL
Campus
LAN
`
VSS2
Figure 5-2: Topoloty of the test network

76
5.2.1 CODEC selection
Five most common CODECs used for VoIP applications are shown in Table 5-2.
CODEC Bit rate
(kbps) Frame time
(ms) Look ahead
(ms) CODEC
impairment
G.711 64.0 10 0 0
G.729 8.0 10 5 11
G.723.1-
MPMLQ 6.3 30 7.5 15
G.723.1-ACELP 5.3 30 7.5 19
G.726 32.0 10 0.125 7
Table 5-2: Five most common CODECs (ixiacom.com, 2009)
Figure 5-3 shows the estimated MOS value for each of the five CODECs.
Figure 5-3: CODEC comparision (ixiacom.com, 2009)
For this test, the G.729 was the chosen CODEC and the bit rate used was 8.0 kbps. And
the test was running for two hours continuously to collect data for subsequent analysis.
5.3 Numerical results and discussion
In this section, the details of test result will be provided and discussed.
Figure 5-4 and Figure 5-5 show 10 seconds of sample data transmission from VSS1 and
VSS2. As shown, the transport delay is very low, ranging from 2ms to 6ms. Packet loss
did not occur for VSS1 and VSS2 during this test. The quality of the transmission was
excellent.

77
VSS1
0
1
2
3
4
5
6
0 2 4 6 8 10 12
Time in second
Dela
y (M
S)
Delay
Figure 5-4: Transport delay of VSS1
VSS2
0
1
2
3
4
5
6
7
8
0 2 4 6 8 10 12
Time in second
Dela
y (M
S)
Delay
Figure 5-5: Transport delay of VSS2
Figure 5-6 shows 10 seconds of sample data transmission for VSS3. As we can see in the
figure, the delay average is between 12ms and 30ms. But the delay is not consistent, in
some instances the delay was more than 100ms. Since the delay was under 150ms during
the test interval and packet loss was low, the quality of the transmission was acceptable.
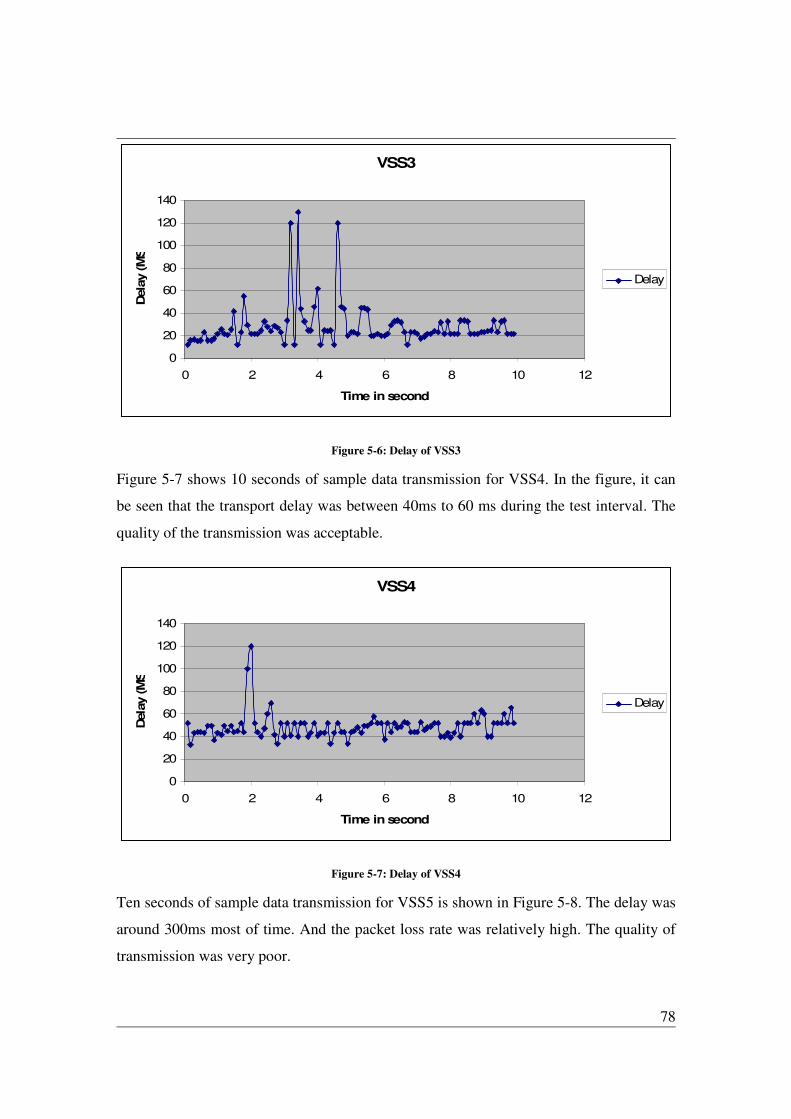
78
VSS3
0
20
40
60
80
100
120
140
0 2 4 6 8 10 12
Time in second
Dela
y (M
S)
Delay
Figure 5-6: Delay of VSS3
Figure 5-7 shows 10 seconds of sample data transmission for VSS4. In the figure, it can
be seen that the transport delay was between 40ms to 60 ms during the test interval. The
quality of the transmission was acceptable.
VSS4
0
20
40
60
80
100
120
140
0 2 4 6 8 10 12
Time in second
Dela
y (M
S)
Delay
Figure 5-7: Delay of VSS4
Ten seconds of sample data transmission for VSS5 is shown in Figure 5-8. The delay was
around 300ms most of time. And the packet loss rate was relatively high. The quality of
transmission was very poor.

79
VSS5
0
100
200
300
400
500
600
0 2 4 6 8 10 12
Time in second
Dela
y (M
S)
Delay
Figure 5-8: Delay of VSS5
Based on the network connections and the location that the simulators were deployed, the
test path is classified into 4 different types.
Type Simulators Locations Delay
A VSS1
VSS2
Melbourne. Resides in same
network with Data Collection,
Storage and Analysis Server
(DCSAS) as well as Visual
Representation System (VRS)
Since it resided in the same
LAN with the receivers, those
two paths had low propagation
delays which were below 10ms.
B VSS3 Melbourne. Connects to a Data
Collection, Storage and
Analysis Server (DCSAS)
through Optus’s cable
broadband
The delay of this path was
relatively low, being mainly
between 12ms and 20ms.
C VSS4 Sydney, Australia The delay was higher than the
first two types as expected. But

80
it was acceptable.
D VSS5 Beijing, China The delay and packet loss were
highest. During the test interval
the transmission quality was
unacceptable.
Table 5-3: Simulator types
In order to generate the VoIP WeatherMap, the parameters (delay and packet loss)
needed to be calculated into a single value and then mapped to a colour. In this research,
only the transport delay and packetisation delay were considered. The packetisation delay
is the time for the CODEC to digitize the analog signal and build frames - and do the
reverse at the other end. G.729 has an algorithmic delay of 5ms. The simulators sent out
packets every 10ms, giving an initial delay of 15 ms for all the frames.
After collecting the one- way transport delay, the R value can be obtained by passing the
value into the reduced E-model Equation (2-5). And then the R value can be converted
into MOS value by using Equation (2-6) discussed in Chapter 2. The java implementation
of these two equations can be seen in Appendix A).
The results calculated are shown in Error! Reference source not found..
Simulators Mean
one- way
transport
delay
Packet
loss rate
Packetisation
delay
E-model R
value
MOS Colour
VSS1 2ms 0 15ms 82.6 4.12 Green
VSS2 5ms 0 15ms 82.5 4.12 Green
VSS3 23ms 0 15ms 82.0 4.10 Green
VSS4 48 0.1% 15ms 73.7 3.77 Yellow

81
VSS5 300 0.88% 15ms 21.1 1.28 Red
Table 5-4: MOS value of test
As we can see from the results listed above, VSS1 has the highest R value and MOS
value which means VSS1 has the highest quality level. VSS2 and VSS3 have relatively
high R value and MOS value and the levels of quality of service are all good. In contrast,
VSS5 has the lowest R value and MOS value which is an unacceptable level of quality of
service.
Based on the results obtained, the VoIP WeatherMap generated is shown in Figure 5-9,
Figure 5-10, Figure 5-11 and Figure 5-12.
Figure 5-9: VoIP WeatherMap of VSS1 and VSS2

82
Figure 5-10: VoIP WeatherMap of VSS3
Figure 5-11: VoIP WeatherMap for VSS4
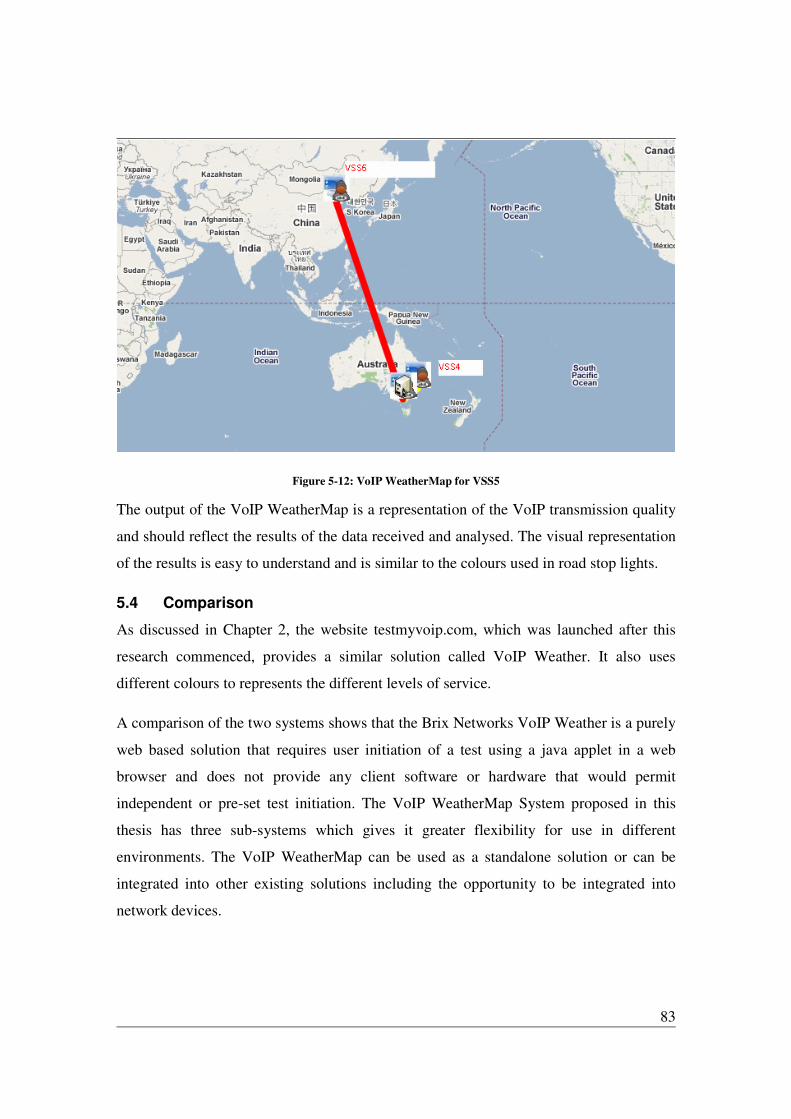
83
Figure 5-12: VoIP WeatherMap for VSS5
The output of the VoIP WeatherMap is a representation of the VoIP transmission quality
and should reflect the results of the data received and analysed. The visual representation
of the results is easy to understand and is similar to the colours used in road stop lights.
5.4 Comparison
As discussed in Chapter 2, the website testmyvoip.com, which was launched after this
research commenced, provides a similar solution called VoIP Weather. It also uses
different colours to represents the different levels of service.
A comparison of the two systems shows that the Brix Networks VoIP Weather is a purely
web based solution that requires user initiation of a test using a java applet in a web
browser and does not provide any client software or hardware that would permit
independent or pre-set test initiation. The VoIP WeatherMap System proposed in this
thesis has three sub-systems which gives it greater flexibility for use in different
environments. The VoIP WeatherMap can be used as a standalone solution or can be
integrated into other existing solutions including the opportunity to be integrated into
network devices.

84
The Brix Networks VoIP Weather cannot be used to constantly test VoIP call QoS
performance. According to the documentation provided by Brix Networks at
testmyvoip.com, only 64 bytes per server per test are used for the simulation. The results
given by the Brix Networks testmyvoip.com solution only reflect the status of the
connection during a very short time interval. These results would be very difficult to use
in identifying problems along the transmission communication path. By comparison, the
solution presented in this thesis can be run as long as required and used as a diagnostic
tool. It can be used for a short term test or as a service monitoring device, setup as an
operating system daemon or service program.
The Brix Networks VoIP Weather uses only six pre-defined servers. As such, all test
results provided only represent the quality of service of the connections between these
servers. End users cannot change the servers used and are not able to use this program to
test their own servers. The presented solution could be deployed for an ISP or enterprise
network at a substantial cost.
The Brix Networks VoIP Weather’s visual presentation layer is a table-based user
interface (UI), as shown in Figure 2-20. Compared to the Brix Networks VoIP Weather,
the solution presented in this thesis uses Google Maps API to implement the UI layer,
which presents a television news weather map like user interface.
5.5 Summary
In this chapter, the VoIP WeatherMap system was used to assess the quality of five
network connections to support VoIP applications. The test results were obtained from a
number of subjective tests carried out using the VoIP Weathermap system.
To support VoIP applications carrier network should either be over-provisioned and have
high levels of available bandwidth or have implemented a grade of service suitable for
business quality VoIP applications. The results show how the quality of network
connections may be tested, analysed and presented. The Voice Session Simulators were
simulated RTP packets and continuously worked in the expected way during the testing
showing the validity of the VoIP Weathermap approach and prototype implementation.
The Data Collection, Storage and Analysis Server (DCSAS) performed correctly during

85
the testing and provided a suitable approach for results to be collected, analysed and
made available for presentation. The Visual Representation System (VSS) was successful
in drawing the VoIP Weathmap and was capable of making the test paths visible by using
different colours, according to the level of quality of service. Overall, the VoIP
WeatherMap system meets all the requirements of this research and demonstrates a new
system that may be further developed and implemented to benefit VoIP application users.

86
6 Conclusion
The objectives set out for this research were to design and develop a solution to test and
display VoIP call quality of service in a creative and intuitive way that has not been done
before. The solution would help VoIP service providers and users determine the status of
their VoIP calls and help improve VoIP as an important real-time service. The objectives
and scope of the research have been successfully completed.
Initial investigation into the various technologies and standards used for VoIP were
detailed in Chapter 2. Chapter 2 starts by introducing the history of VoIP and the benefits
of VoIP are discussed. The fundamental concepts, standards and systems that are used in
an operational VoIP environment such as SIP, H.323 and RTP/RTCP were discussed in
detail. SIP is a signaling protocol which is currently the most popular protocol used for
creating, modifying, and terminating VoIP calls. H.323 an over-arching collection of sub-
protocols used in an alternative VoIP solution to that provided by SIP. H.323 is widely
used for video/audio applications today. RTP/RTCP is the de-facto protocol used for
transferring audio/video streams over the IP network. The current issues associated with
VoIP systems were presented and several solutions for providing a better QoS for VoIP
over the digital network are also discussed. The importance of quality measures for the
effective understanding of the state of VoIP calls was stated and the most significant
quality models used for assessing VoIP QoS were provided.
In Chapter 3 the objectives and scope of this research were defined. Limitations and
assumptions of this research were described and each was considered in detail in
subsequent chapters. Chapter 3 provided the overall path taken during the research
program and the research outcomes were within the boundaries as set out.
The system’s prototype and design details were described and discussed in Chapter 4.
This research aims to develop a new method of collecting, analyzing and displaying VoIP
call QoS. The VoIP WeatherMap system has three major components. The client side is
the probe which is an implementation of the RTP/RTCP stacks. By using the RTP stacks
APIs, the probe can transmit a VoIP stream. The next component is the server which
fulfills the role of voice stream receiver, database and provides the analysis logic layer.
87
The server uses the RTP/RTCP APIs provided in Java Media Framework to decode the
received VoIP stream, carried out analysis on the VoIP stream packets to collect
statistical information pertaining to the QoS and stores the analysis results in a database.
The last component is the Visual Representation System (VRS). The VRS prototype
described in Chapter 4 was built with the latest technologies such as ASP.Net with AJAX
and Google Maps API. The VRS is a web application which may be easily accessed by
both the service providers and end users. The original idea for the VoIP WeatherMap
system is to assess the VoIP call QoS by collecting the most important parameters that
determine the link and call QoS such as delay, packets loss and jitter and to display the
results in a creative online display.
The prototype simulation and test results and system analysis are discussed in Chapter 5.
The test results and analysis identified that the prototype system achieved the research
outcomes. Information presented and discussed in Chapter 5 highlight the value of the
VoIP WeatherMap to the VoIP providers and end users.
In summary, this research has successfully implemented the VoIP WeatherMap system.
Results show the system could be used in various carrier and service provider networks.
The prototype probe and server were implemented using a reliable solution that permitted
successful demonstration of the concepts being explored in this research. The Google
Maps API is a very useful tool for developing web based map related applications. The
VRS demonstrates a means to make VoIP call Qos information available in real-time
using the Internet.
6.1 VoIP WeatherMap benefits
6.1.1 Existing capabilities measurement
Organisations would benefit by gaining access to a publicly available system that
provides timely and accurate information about VoIP call QoS over the network. The
VoIP WeatherMap system provides this benefit and disseminates information in an easy
to understand and clear manner.

88
6.1.2 Real-time performance monitoring
Through the use of probes connected to central servers over the distributed network and
between organization sites it is possible to use the VoIP WeatherMap to monitor QoS of
VoIP systems. The VoIP WeatherMap is a low cost solution that would benefit
organizations and end users through the real-time nature of the information being
displayed about VoIP QoS.

89
7 Future Work
The VoIP WeatherMap proposed in this thesis is a solution to test, analysis and represent
the call quality of VoIP services. The research provides an approach to integrate different
technologies to test and monitor VoIP performance. Due to the time available for this
research program the prototype proposed in this thesis was not fully implemented. An
opportunity exists in future work for the prototype to be completed and improvements
made.
The research objectives were achieved, however during the research several areas were
identified where future work may be carried out including:
• Develop a two way testing system. The VoIP WeatherMap system proposed in
this thesis communicates information solely from the probe to the server. It may
be more suitable to have information passing in both directions and the results of
the bidirectional transmission analysed, stored and displayed on the VoIP
WeatherMap display. One of the reasons that this would be beneficial to the
overall understanding of the network status is the different network characteristics
for upstream and downstream traffic, especially where a user has an asymmetric
network link or the service provider is carrying out network traffic shaping.
• The VoIP WeatherMap display cannot automatically trace the route between the
probe and the server due to a lack of complete routing information and network
device hops. There is a need to enhance how the system gains information about
the network devices traversed along the session path and possibly linking the
system to an more accurate database containing accurate IP location information.
It is possible to gain a better understanding of the network configuration, though
there is a need to constantly update this information due to the very dynamic
nature of the digital network. The mechanism and protocol used to carry out a
trace route may be used to gain information about network paths, though this is
becoming more difficult as service providers limit the effectiveness of trace route
due to the negative effects of its overuse. There are a number of commercial IP
device location databases that also contain the physical location of all the IP

90
device addresses. There are limitations with these services as the information is
not guaranteed to be accurate nor up to date.
• The VoIP WeatherMap system is not using a suitable VoIP signaling protocol
which means that it cannot communicate directly with VoIP SIP servers or
commercial SIP systems. Enhancing the VoIP WeatherMap system to include
direct communication with deployed commercial SIP gateways would enhance
the overall effectiveness of the VoIP WeatherMap and limit the use of probes on
the network.
• The VoIP WeatherMap system was not designed to optimize the performance of
voice being used in the test sessions. One example is the play buffer was not
adopted and its use would ensure a smooth transmission of voice packets. In
future work there is an opportunity to consider how the VoIP WeatherMap could
incorporate some of the more complex methods and technologies being used to
improve VoIP calls.

91
8 Bibliography
A.D.Clark. 2001, ‘Modeling the effects of Burst Packet Loss and Recency on Subjective
Voice Quality’, Columbia University IP Telephony Workshop
Adil Raja, R. Muhammadatifazad, Colin Flanagan, Conor Ryan 2007, ‘Real-Time, Non-
intrusive Evaluation of VoIP’, Wireless Access Research Center, Department of
Electronic and Computer Engineering & Biocomputing and Developmental Systems
Group, Department of Computer Science and Information Systems, University of
Limerick, Limerick, Ireland
Agam, 0. 2001, ‘VoIP Testing – A Practical Guide’, www.radcom-inc.com
Bhupal, S.De, Parag P.Joshi, Vikas S. & Dale C. 2003, ‘End-to-end Voice over IP
Testing and the Effect of QoS on Signaling’, IEEE
Bernet,Y., Ford, P., Yavatkar, R., Baker, F.,Zhang, L., Speer, M., Braden, R., Davie,
B.,Wroclawski, J., and E. Felstaine 2000, "A Framework for Integrated Services
Operation over Diffserv Networks", RFC 2998
Braden, R. 1997, ‘RFC 2205 – Resource ReserVation Protocol (RSVP)’, Network
Working Group, RFC 2205
Carvalho, L.; Mota, E.; Aguiar, R.; Lima, A.F.; & de Souza, J.N, ‘An E-Model
Implementation for Speech Quality Evaluation in VoIP Systems’, Computers and
Communications, 2005. ISCC 2005. Proceedings. 10th IEEE Symposium on Volume ,
Issue , 27-30 June 2005 Page(s): 933 - 938
Cherry, S. 2005, ‘Seven myths about voice over IP’, Spectrum, IEEE Volume 42, Issue 3,
March 2005 Page(s):52 – 57
Cisco 2005, ‘DiffServ -- The Scalable End-to-End QoS Model’, [Online] available at:
http://www.cisco.com/en/US/technologies/tk543/tk766/technologies_white_paper09186a
00800a3e2f.html
92
Cisco 2008, ‘Cisco SIP IP Phone Administrator Guide’, [Online] available at:
www.cisco.com/.../guide/sipovr60.html
Conway, A.E. 2002, ‘A passive method for monitoring voice-over-IP call quality with
ITU-T objective speech quality measurement methods’, Communications, 2002. ICC
2002. IEEE International Conference on Volume 4, Issue, 2002 Page(s): 2583 - 2586
vol.4
Davidson, J. P., J&Bhatia, M, Kalidindk, S, Mukherjee, S 2006, ‘Voice over IP
Fundamentals’, Cisco Press
Ding, L. Goubran, R.A. ‘Speech quality prediction in VoIP using the extended E-model’,
Global Telecommunications Conference, 2003. GLOBECOM '03. IEEE, page(s): 3974-
3978 vol.7
Ding, L., Goubran, R.A. 2003, ‘Assessment of effects of packet loss on speech quality in
VoIP’, Haptic, Audio and Visual Environments and Their Applications, 2003. HAVE
2003. Proceedings. The 2nd IEEE Internatioal Workshop on Volume, Issue, 20-21 Sept.
2003 Page(s): 49 – 54
Estepa, A. Estepa, R. & Vozmediano, J.M. 2002, ‘On the suitability of the E-Model to
VoIP networks’, Proceedings of the Seventh International Symposium on Computer and
Communications (ISCC’02), IEEE
ETSI Technical Report ETR-250 1996, ‘Transmission and multiplexing (TM): Speech
communication quality from mouth to ear for 3.1 kHz handset telephony across
networks’, European Telecommunications Standards Institute, F-Sophia Antipolis
Fineberg, V. 2002, ‘A practical architecture for implementing end-to-end QoS in an IP
network’, Communications Magazine, IEEE Publication Date: Jan 2002 Volume: 40,
Issue: 1, on page(s): 122-130
F.Mohammed, M. 2005, ‘Quality of Service Issues in Voice over Internet Protocol’
Galiotos, P. Dagiuklas, T. Arkadianos, D. 2002, ‘QoS management for an enhanced
VoIP platform using R-factor and network load estimation functionality’, High Speed

93
Networks and Multimedia Communications 5th IEEE International Conference on
Publication Date: 2002 on page(s): 305- 314
Geobytes.com, ‘IP Address Locator’, [Online] available at:
http://www.geobytes.com/IpLocator.htm?GetLocation, last accessed on 16/01/2009,
Goodea, B. 2002, ‘Voice over Internet Protocol’, Proceedings of the IEEE Volume 90,
Issue 9, Sep 2002 Page(s): 1495 - 1517
Gokhale, S.S. & Jijun Lu 2005, ‘Signaling Performance of SIP Based VoIP: A
Measurement-Based Approach’, Global Telecommunications Conference, 2005.
Globecom apos; 05. IEEE Volume 2, Issue, 28 Nov.-2 Dec. 2005 Page(s): 5
Google.com, ‘Google Maps API’, http://code.google.com/apis/maps/, last accessed on
16/01/2009
Hoene, C.; Karl, H.; Adam Wolisz 2005, ‘A perceptual quality model intended for
adaptive VoIP applications’, International Journal of Communication Systems Volume
19 Issue 3, Pages 299 – 316
Ietf.org 2008, ‘Active IETF Working Groups’, [Online] available at:
http://www.ietf.org/html.charters/wg-dir.html
Itu.int, ‘ITU-T Study Groups’, [Online] available at: http://www.itu.int/ITU-
T/studygroups/
ITU-T 1988, ‘G.711: Pulse code modulation (PCM) of voice frequencies’
ITU-T 1990, ‘G.726 : 40, 32, 24, 16 kbit/s Adaptive Differential Pulse Code Modulation
(ADPCM)’
ITU-T 1996a, ‘P.800: Methods for subjective determination of transmission quality’
ITU-T 1996b, ‘Recommendation G.131: Control of talker echo’
ITU-T 2003, ‘G.107: A Computational Model for Use in Transmission Planning’

94
ITU-T 2006, ‘RecommendationcH.323: Packet-based multimedia communications
systems’
Ixia.com 2009, ‘Assessing VoIP Call Quality Using the E-model’, [online] available at:
http://www.ixiacom.com/library/white_papers/display?skey=voip_quality
James, J.H.; Bing Chen; Garrison, L. 2004, ‘Implementing VoIP: a voice transmission
performance progress report’, Communications Magazine, IEEE Volume 42, Issue 7,
July 2004 Page(s):36 – 41
Java.sun.com, ‘Java Media Framework API’,
http://java.sun.com/javase/technologies/desktop/media/jmf/, last accessed on 16/01/2009
Jong-Won Park; Jin-Gyu Shin; Young-Ho Kim; Myeong-Jin Lee 2005, ‘A VoIP QoS
guarantee method applying the adaptive committed information rate to downstream
service-flows in HFC network’, Multimedia Services Access Networks, 2005. MSAN
apos; 05. 2005 1st International Conference, on Volume, Issue, 13-15 June 2005 Page(s):
40 – 43
Java.sun.com 2008, ‘JMStudio User's Guide’, [Online] available at:
http://java.sun.com/javase/technologies/desktop/media/jmf/2.1.1/jmstudio/jmstudio.html,
last accessed ‘05/Jan/2009’
J.Rosenbert, H. S., G.Camarillo, A.Johnston, J.Peterson, R.Sparks, M.Handley &
E.Schooler 2002, ‘SIP: Session Initiation Protocol’
K.Chan, R.Sahita, S.Hahn, K.McCloghrie 2003, ‘Differentiated Services Quality of
Service Policy Information Base’, Network Working Group RTC 3317
Kitawaki, N. 2002, ‘PERCEPTUAL QoS ASSESSMENT METHODOLOGIES’, Speech
Coding, 2002, IEEE Workshop Proceedings. Publication Date: 6-9 Oct. 2002 Page(s):
80- 82
Klepec, B. & Kos, A. 2001, ‘Performance of VoIP applications in a simple differentiated
services network architecture’, EUROCON'2001, Trends in Communications,
International Conference on. Volume 1, 4-7 July 2001 Page(s):214 - 217 vol.1
95
Lakaniemi, A.; Rosti, J.; Raisanen, V.I. 2001, ‘Subjective VoIP speech quality evaluation
based on networkmeasurements’, Communications, 2001. ICC 2001. IEEE International
Conference on Volume 3, Issue , 2001 Page(s):748 - 752 vol.3
L.C.G.Lustosa, 2004, ‘E-Model Utilization For Speech Quality Evaluation Over VoIP-
Based Commnunication Systems’
Lee, Chang-Yong; Kim, Hwan-Kuk; Ko, Kyoung-Hee; Kim, Jeong-Wook; Jeong, Hyun-
Cheol 2008, ‘ A Study on Structure for Monitoring and Detecting VoIP Abnormal
Traffic’, Future Generation Communication and Networking, 2008. FGCN '08. Second
International Conference on Volume 2, 13-15 Dec. 2008 Page(s):178 – 182
Lingfen Sun Ifeachor, E.C. 2006, ‘Voice quality prediction models and their application
in VoIP networks’, Multimedia, IEEE Transactions on Publication Date: Aug.
2006 ,Volume: 8, Issue: 4, page(s): 809-820
Leandro Carvalho, E. M., Regeane Aguiar 2005, ‘An E-Model Implementation for
Speech Quality Evaluation in VoIP Systems’
Markopoulou, A.P.; Tobagi, F.A.; Karam, & M.J. 2001, ‘Assessment of VoIP Quality
over Internet Backbones’, Twenty-First Joint Conference of the IEEE Computer and
Communications Societies Proceedings, IEEE Volume 1, Issue, 2002 Page(s): 150-159
vol.1
Mase, K.; Kobayashi, H. 2004, ‘An efficient end-to-end measurement based admission
control for VoIP networks’, Communications, 2004 IEEE International Conference, on
Volume 4, Issue , 20-24 June 2004 Page(s): 1877 - 1881 Vol.4
Mehmood, M.A. Jadoon, T.M. Sheikh, N.M. 2005, ‘Assessment of VoIP Quality over
Access Networks’, Internet, 2005.The First IEEE and IFIP International Conference in
Central Asia on Publication Date: 26-29 Sept. 2005, On page(s): 5
Mochizuki, D. Furukawa, T. 2004, ‘A method for the end-to-end testing of VoIP service
networks ’, NTT Network Service System Laboratories, NTT Corporation

96
Moura, N.T.; Vianna, B.A.; Albuquerque, C.V.N.; Rebello, V.E.F.; Boeres, C. 2007,
‘MOS-Based Rate Adaption for VoIP Sources’, Communications, 2007. ICC apos;07.
IEEE International Conference on Volume , Issue , 24-28 June 2007 Page(s):628 - 633
Mysql.com 2008, ‘MySQL 5.0 documentation’, http://dev.mysql.com/doc/, last accessed
on 16/01/2009
Nichols, K. 1998, ‘Definition of the Differentiated Services Field (DS Field) in the IPv4
and IPv6 Headers’
Network Working Group 1999, ‘Media Gateway Control Protocol (MGCP)
Version 1.0’
Network Working Group 2001, ‘RFC2822: Internet Message Format’
Network Working Group 2001a, ‘RFC3001: Multiprotocol Label Switching
Architecture’
Pragtong, P. Ahmed, K. Erke, T. 2004, ‘Analysis of speech data rate in voice over IP
conversation’, TENCON 2004. 2004 IEEE Region 10 Conference, Publication Date: 21-
24 Nov. 2004, Volume: A, On page(s): 143- 146 Vol. 1
Scheets, G. Singh, R. & Parperis, M. 2002, ‘Analyzing End-to-End Delivery Delay in
Pure VoIP Networks’, Circuite and Systems, 2002. MWSCAS-2002. The 2002 45th
Midwest Symposium on
Shengquan Wang; Zhibin Mai; Magnussen, W.; Dong Xuan; Wei Zhao 2002,
‘Implementation of QoS-Provisioning system for voice over IP’, Real-Time and
Embedded Technology and Applications Symposium, 2002. Proceedings. Eighth IEEE
Volume , Issue , 2002 Page(s): 266 – 275
Shu Tao, Kuai Xu, Antonio Estepa, Teng Fei, Lixin Gao, Roch Guérin, Jim Kurose, Don
Towsley & Zhi-li Zhang 2005, ‘Improving VoIP quality through path switching’,
Infocom 2005. 24th Annual Joint Conference of the IEEE Computer and
Communications Societies. Proceedings IEEE Publication Date: 13-17 March
2005 ,Volume: 4, On page(s): 2268- 2278 vol. 4

97
S.Blake, D.Black & M.Carlson 2003, ‘RFC 2475: An Architechture for Differentiated
Service’
Shenquan Wang; Mai, Z.; Dong Xuan; Wei Zhao 2006, ‘Design and Implementation of
QoS-Provisioning System for Voice over IP’, Parallel and Distributed Systems, IEEE
Transactions onVolume 17, Issue 3, March 2006 Page(s): 276 – 288
SIPfoundry.org, ‘sipXtapi-User Agent Framework SDK’,
http://www.sipfoundry.org/sipxtapi-ua-sdk.html, last accessed on 16/01/2009
SIPfoundry.org, ‘SipXtapi’, http://sipxtapi.sipfoundry.org/wiki/SipXtapi, last accessed on
16/01/2009
Srinivasan, S.H. 2004, ‘Speech quality measure based on auditory scene analysis’,
Multimedia Signal Processing, 2004 IEEE 6th Workshop on, Page(s): 371- 374
Swale, R 2001, 'Voice over IP: systems and solutions', Institution of Electrical Engineers
TangentSoft 2008, ‘Mysql++’, http://tangentsoft.net/mysql++/, last accessed on
16/01/2009
Testmyvoip.com 2008, ‘VoIP Weather’, http://testmyvoip.com/index.html, last accessed
on 05/07/2008
Trad, A.; Munir, F.; Afifi, H. 2006, ‘Capacity evaluation of VoIP in IEEE 802.11e
WLAN environment’, Consumer Communications and Networking Conference, 2006.
CCNC 2006. 3rd IEEE Volume 2, Issue , 8-10 Jan. 2006 Page(s): 828 – 832
Jacobson, V., H. S. S. C. & R. F. 1996, ‘RTP: A Transport Protocol for Real-Time
Applications’
Voip-info.org, ‘CODECs’, [online] available at: http://www.voip-info.org/wiki-Codecs,
last assessed Jan/2009
Wallingford, T. 2005, ‘Switching to VoIP’, O'Reilly

98
Wallance, K. 2007, ‘Authorized Self-Study - Guide Cisco Voice over IP (CVoice)’,
ciscopress.com.
Wenyu Jiang Koguchi, K. Schulzrinne, H. 2003, ‘QoS evaluation of VoIP end-points’,
Communications, 2003. ICC '03. IEEE International Conference on Publication Date: 11-
15 May 2003 Volume: 3, On page(s): 1917- 1921 vol.3
Wiki.com, ‘Voice over Internet Protocol’, http://en.wikipedia.org/wiki/VoIP#History, last
accessed on 16/01/2009
Wiki.com, ‘H.323’, http://en.wikipedia.org/wiki/H.323, last access on 16/01/2009
Wiki.com, ‘Differentiated services’, http://en.wikipedia.org/wiki/Differentiated_services,
last accessed on 16/01/2009
YankeeGroup.com, ‘VoIP Business Opportunity Analysis’,
http://www.yankeeGroup.com, last accessed on 10/11/2008
Zurek, E.E. Leffew, J. Moreno, W.A. 2002, ‘Objective evaluation of voice clarity
measurements for VoIP compression algorithms’, Devices, Circuits and Systems, 2002.
Proceedings of the Fourth IEEE International Caracas Conference on Publication Date:
2002 On page(s): T033-1- T033-6

99
Appendix A
Source code for calculating E-model and MOS value in Java
public static double getRValue(double T, double Ppl)
{
double SLR = 8,
RLR = 2,
Ds = 3,
STMR = 15,
Dr = 3,
LSTR = STMR + Dr,
TELR = 65,
WEPL = 110,
Tr = 2*T,
Ta = T,
Ie = 10,
BPL = 1,
BurstR = 1,
A = 0,
Nc = -70,
Ps = 35,
Pr = 35,
qdu = 1,
Nfor = -64;
double Nfo = Nfor + RLR;
double OLR = SLR+RLR;
double Pre = Pr + 10*Math.log10(1+Math.pow(10,
((double)(10-LSTR))/(double)10));
double Nor = RLR - 121 +Pre
+ 0.008*Math.pow((Pre-35),2);
double Nos = Ps - SLR -Ds
- 100 +0.004*Math.pow((Ps-OLR -Ds - 14),2);
double No = 10*Math.log10((Math.pow(10, (double)Nc/(double)10))
+Math.pow(10, (double)Nos/(double)10)
+Math.pow(10, (double)Nor/(double)10)
+Math.pow(10, (double)Nfo/(double)10));
double Ro = 15 - 1.5*(SLR+No);
double Q = 37 - 15*(Math.log10(qdu));
double G = 1.07+0.258*Q+0.0602*Math.pow(Q, 2);
double Z = (double)46/(double)30-G/(double)40;
double Y = (double)(Ro-100)/(double)15+46/8.4-G/9;
double Iq = 15*Math.log10(1+Math.pow(10, Y)
+Math.pow(10, Z));
double STMRo = -10*Math.log10(Math.pow(10, -STMR/(double)10)
+ Math.exp(-T/(double)4)*Math.pow(10, -TELR/10));
double Ist = 12*Math.pow((1+Math.pow((STMRo-13)/(double)6, 8)),
1/(double)8)
-28*Math.pow((1+Math.pow((STMRo+1)/19.4, 35)), 1/(double)35)
-13*Math.pow((1+Math.pow((STMRo-3)/33, 13)), 1/(double)13)
+29;
double Xolr = OLR+0.2*(64+No-RLR);
double Iolr = 20* (Math.pow((1+Math.pow((Xolr/8),(double)8)),
((double)1/(double)8))-Xolr/(double)8);

100
double Is = Iolr + Ist + Iq;
double TERV = TELR - 40*Math.log10((1+T/10)/(1+T/150)
+6*Math.exp(-0.3*Math.pow(T,2)));
double Idd = 0;
if (Ta>100)
{
double X = Math.log10(Ta/(double)100)/Math.log10(2);
Idd = 25 * (Math.pow((1+Math.pow(X, 6)),1/(double)6)
-3*Math.pow((1+Math.pow(X/(double)3, 6)),
1/(double)6)+2);
}
if (STMR<9)
TERV = TERV + 0.5*Ist;
double Rle = 10.5 * (WEPL+7)*Math.pow(Tr+1, -0.25);
double Idle = (Ro-Rle)/(double)2
+ Math.sqrt(Math.pow(Ro-Rle, 2)/4+169);
double Roe = -1.5*(No-RLR);
double Re = 80+2.5*(TERV-14);
double Idte = ((Roe-Re)/2
+ Math.sqrt(Math.pow(Roe-Re, 2)/(double)4+100) -1)*(1-
Math.exp(-T));
if (STMR > 20)
Idte = Math.sqrt(Math.pow(Idte,2)+Math.pow(Ist,2));
double Id = Idte + Idle + Idd;
double Ieef = Ie+(95-Ie)*(Ppl/((Ppl/BurstR)+BPL));
double R = Ro - Is - Id - Ieef +A;
return R;
}
public static double getMOSValue(double R)
{
double mos = 0;
if (R<0)
mos =1;
else if (R>100)
mos = 4.5;
else
mos = 1 + 0.035*R +R*(R-60)*(100-R)*7*Math.pow(10, -6);
return mos;
}