
Vocal Characteristics, Speech, and Behavior of Telephone ...
157
Vocal Characteristics, Speech, and Behavior of Telephone Interviewers by Jessica Susan Broome A dissertation submitted in partial fulfillment of the requirements for the degree of Doctor of Philosophy (Survey Methodology) in The University of Michigan 2012 Doctoral Committee: Professor Frederick G. Conrad, Chair Professor Norbert Schwarz Research Scientist Steven G. Heeringa Professor Susan E. Brennan, State University of New York at Stony Brook
Transcript of Vocal Characteristics, Speech, and Behavior of Telephone ...

Vocal Characteristics, Speech, and Behavior of Telephone Interviewers
by
Jessica Susan Broome
A dissertation submitted in partial fulfillment of the requirements for the degree of
Doctor of Philosophy (Survey Methodology)
in The University of Michigan 2012
Doctoral Committee:
Professor Frederick G. Conrad, Chair Professor Norbert Schwarz Research Scientist Steven G. Heeringa Professor Susan E. Brennan, State University of New York at Stony Brook

ii
Acknowledgments This work would not have been possible without funding from several sources. I was honored to receive the Harvey G. and Joyce H. Behner Graduate Fellowship for the 2011-2012 academic year. The Charles Cannell Fund in Survey Methodology provided generous support, as did the A. Regula Herzog Young Investigators Fund and the Margaret Dow Towsley Scholarship. The original project, which included transcription and coding of contacts used in my research, was funded by the National Science Foundation (grant # SES-0819734 and # SES-0819725), the University of Michigan Survey Research Center, and the Department of Communicative Sciences & Disorders, Michigan State University. My chair, Fred Conrad, has been unwavering in his support of me, and in his belief in the importance of this work. I was grateful to have such a helpful and diverse committee. Norbert Schwarz inspired me with his enthusiasm and creative ideas. Susan Brennan offered a refreshing perspective from outside the Survey Methodology world. Steve Heeringa‘s support as the lone statistician on my committee helped to make my work better. Other faculty who had a hand in this project include Bob Groves, whose vision led to the creation of the unique dataset used in my dissertation; José Benkí, who offered crucial guidance on not only using Praat but also understanding concepts related to speech and language; Frauke Kreuter, who brought a unique perspective to the original ―Voices‖ project and was consistently encouraging; and Jim Lepkowski and Roger Tourangeau, who nurtured my research ideas when they were still in an embryonic stage. The Program in Survey Methodology administrative staff make everything happen. My sincere thanks to Jill Esau, Patsy Gregory, Nancy Oeffner, Annmarie Thomas, Jodi Holbrook, Elisabeth Schneider, and Sumi Raj. Thanks to all my colleagues at both Michigan and Maryland, past and present, for encouragement and advice, especially Brady West, Matt Jans, Rachel Levenstein, Jeff Gonzalez, and Chan Zhang. This work would have been much harder without Dave Childers from CSCAR; Jacki Spear and Steve Wisniewski from Lightspeed Research; Wil Dijkstra; my tireless coder Dylan Vollans; and Kristen Holt-Browning, whose editing eye proved invaluable. Huge thanks to Pete Batra, Joe Matuzak, and all 3,476 of my respondents!

iii
My heart is full of gratitude for so many people who never stopped believing in me: Jennifer Scott, Heidi D‘Agostino, Sarah Peterson, Lenore Robison, Manfred Kuechler, Pam Stone, Robert Gay, Dana Levin, Jay Pearson, Jeffrey Hudson, Lily Baldwin, Jenny Smith, Diane Wohland, Eleanor Stanford, Dan Imaizumi, Corin Hirsch, Damian Beil, Nicole Ray, Sam Wotring, Alisha Deen-Steindler, Jason Steindler, Guy Oliveri, Jared Pinnell, Susan Gottesfeld, Dean Hadin, Todd Tesen, Natalie Donnellon, Fred Bigliardi, Christine Young, Christian Breheney, Sheila Donnelly, Melina Shannon-diPietro, Chris Weiser, Kate Davidson, Christine Koch, Anna Daigle, Amanda Box, and most of all, Mom and Dad, Edythe and Johnny, Michael and Paul, thank you for everything you‘ve done, always and in all ways.

iv
Table of Contents Acknowledgements ............................................................................................... ii
List of Figures ....................................................................................................... v
List of Tables ........................................................................................................ vi
List of Appendices .............................................................................................. viii
Abstract………… .................................................................................................. ix
Chapter 1: A Proposed Conceptual Model for the Association Between
Interviewers‘ Speech and Vocal Characteristics and Success ............................. 1
Chapter 2: Examining the Role of First Impressions ........................................... 17
Chapter 3: Interviewer Responsiveness ............................................................. 54
Chapter 4: Conclusion ........................................................................................ 97
Appendices ....................................................................................................... 116
References ....................................................................................................... 142

v
List of Figures
Figure 1.1: A Proposed Conceptual Model of Interviewer Behavior ..................... 3
Figure 3.1: Sequence Viewer Screen Shot ......................................................... 62
Figure 3.2: Interviewer Responsive Behavior against Tailoring Opportunities .... 67
Figure 3.3: Proportion of Answerer Moves ......................................................... 69
Figure 3.4: Scriptedness/ Responsiveness Paths .............................................. 92

vi
List of Tables
Table 1.1: Summary of Studies on Interviewer Vocal Characteristics .................. 7
Table 2.1: Rated Interviewer Characteristics ...................................................... 21
Table 2.2: Audio File Groupings ......................................................................... 27
Table 2.3: Audio File Groupings by Study .......................................................... 27
Table 2.4: Audio File Groupings by Outcome ..................................................... 28
Table 2.5: Description of Ratings ........................................................................ 32
Table 2.6: Factor Loadings ................................................................................. 33
Table 2.7: Correlations Between Ratings of Positive Interviewer Characteristics
........................................................................................................................... 34
Table 2.8: Factor Loadings When Likelihood is Included ................................... 35
Table 2.9: Predicting Likelihood Ratings ............................................................ 37
Table 2.10: Practitioners‘ Ratings of Importance to Interviewer‘s Success ........ 42
Table 2.11: Emphases in Interviewer Training ................................................... 43
Table 2.12: Predicting Ratings with Interviewer Speech Rate (controlling for
exposure length and accounting for clustering by interviewer) ........ 45
Table 2.13: Predicting Ratings with Interviewer Fundamental Frequency
(controlling for exposure length and accounting for clustering by
interviewer) ...................................................................................... 46

vii
Table 2.14: Practitioners‘ Emphases in Hiring Telephone Interviewers .............. 48
Table 2.15: Importance of Vocal Attributes in Hiring Decisions .......................... 48
Table 3.1: Inter-coder Reliability Measures ........................................................ 64
Table 3.2: Proportion Contacts with One or More Concerns Expressed by
Outcome ........................................................................................... 70
Table 3.3: Concern Rates by Outcome .............................................................. 71
Table 3.4: Concerns Expressed in Agree Contacts, by Call Number ................. 71
Table 3.5: Distribution of Call Number by Outcome ............................................ 72
Table 3.6: Prevalence of Concerns by Outcome in Contacts Containing any
Concerns ........................................................................................... 74
Table 3.7: Proportion Contacts with Conversation Starters by Outcome ............ 77
Table 3.8: Conversation Starter Rates by Outcome ........................................... 78
Table 3.9: Mean Responsiveness Score by Outcome ........................................ 79
Table 3.10: Decomposing Responsiveness Scores ........................................... 80
Table 3.11: Concerns Addressed by Outcome ................................................... 82
Table 3.12: Distribution of Contacts Containing Statements of Disinterest by
Outcome .......................................................................................... 83
Table 3.13: Model Predicting Log Odds of Agree ............................................... 89
Table 3.14: Model Predicting Contact Length ..................................................... 89
Table 3.15: Agree Rates by Scriptedness/Responsiveness Quadrant ............... 91

viii
List of Appendices
Appendix 1: Details on Preliminary Studies ...................................................... 116
Appendix 2: Listeners‘ Survey .......................................................................... 124
Appendix 3: Sampling Structure ....................................................................... 129
Appendix 4: Practitioners‘ Survey ..................................................................... 130
Appendix 5: Email Request Sent to Practitioners ............................................. 135
Appendix 6: Details on Reliability of Initial Move Coding .................................. 137
Appendix 7: Move Codes ................................................................................. 138
Appendix 8: Tailoring Study: Coding Scheme .................................................. 140

ix
Abstract
Growing rates of nonresponse to telephone surveys have the potential to
contribute to nonresponse error, and interviewers contribute differentially to
nonresponse. Why do some telephone interviewers have better response rates
than others? What should interviewers be trained to say or do to improve their
performance in recruitment—and how do these recommendations differ from
current practice?
This dissertation uses three studies to answer these questions. A
―Practitioners‘ Survey‖ among individuals responsible for hiring and training
telephone interviewers found that practitioners place tremendous importance on
the first impression an interviewer gives to sample members, including whether
s/he sounds confident, competent, and professional, but far less importance on
an interviewer sounding natural or unscripted.
This widespread belief in the industry contrasts sharply with results from the
―Listeners‘ Study,‖ which exposed over 3,000 web survey respondents to brief
excerpts of interviewer speech from audio recorded survey introductions and
asked them to rate twelve personality characteristics of the interviewer. First
impressions of confidence, competence, professionalism and other traits had no
association with the actual outcome of the call, while ratings of ―scriptedness‖
were significantly negatively associated with the likelihood of agreement. At the
same time, ratings of positive personality traits were positively associated with

x
predictions by different groups of raters as to the outcome of the call. Further,
significant relationships were found between measured speech rate and
fundamental frequency in the excerpts and characteristic ratings.
Beyond first impressions, the ―Tailoring Study‖ uncovered a critical and
trainable behavior of successful telephone interviewers over the course of
introductions. Using detailed coding of 626 introduction transcripts, interviewers‘
responsiveness to specific concerns such as ―I don‘t have time‖ or ―What is this
about?‖ and conversation starters by potential respondents or telephone
―answerers‖ is analyzed across contacts with three outcomes: agree, refusal, and
scheduled callback. Results show that interviewers are most responsive to
answerers in calls that result in a scheduled callback and least responsive in
refusals.
Practical applications for telephone interviewer training are discussed,
including suggested approaches to both ―red flags‖ indicating an imminent hang-
up and ―green lights‖ suggesting likely agreement.

1
Chapter 1: A Proposed Conceptual Model for the Association Between Interviewers’
Speech and Vocal Characteristics and Success
1.1 Problem Statement, Significance, and Research Aims
Nonresponse to telephone surveys has the potential to bias survey estimates
(Groves, Presser, and Dipko 2004), which in turn can have policy and
programmatic implications. It has been demonstrated (Oksenberg and Cannell
1988) that some telephone interviewers have higher response rates––that is,
more success recruiting sample members to participate––than others. Identifying
vocal characteristics and techniques of successful telephone interviewers
promises to have a potentially broad impact on data quality, by allowing for more
targeted screening and training of interviewers with the aim of reducing
nonresponse, which can in turn benefit any disciplines in which telephone survey
data is used.
Literature from both survey methodology (Oksenberg, Coleman, and Cannell
1986) and telemarketing (Ketrow 1990) has found that a pleasing or attractive
voice in the initial seconds of a phone call is imperative in extending the
interaction. Further, Ketrow (1990) discusses the importance of giving an initial
impression of competence, and Lois Oksenberg and colleagues (Oksenberg and
Cannell 1988; Oksenberg, Coleman, and Cannell 1986; ) find that judges‘ ratings
of competence were associated with phone interviewers‘ success. This is not to
imply that, in the context of a survey interview introduction, having a pleasing,

2
competent-sounding voice in the opening statement is enough to guarantee
success. However, a voice which gives listeners a positive first impression may
provide an interviewer with an entrée into a longer conversation and, by
extension, more opportunities to tailor their introduction to a specific sample
member. The theory of tailoring (Groves and Couper 1998) states that successful
interviewers tend to adapt their recruitment approach to particular sample
members, for example by modifying their attire, using arguments that they
believe will resonate with an individual, or changing their style of speech. Most
studies of tailoring have focused on face-to-face studies, although Maynard,
Freese, and Schaefer (2010) find that telephone interviewers who fail to adapt
their approach (for example, by being ―presumptive‖ when a ―cautious‖ approach
is warranted) have less success. Introductions in telephone studies are
admittedly brief, and interviewers are limited in this setting not only in the
information they can glean from the sample members who answer the phone
(referred to hereafter as phone ―answerers‖), but also in the ways they are able
to adapt their approach. Displaying responsiveness to sample members‘
concerns is one method of adapting that may occur in a telephone survey
context.
This dissertation proposes a three-stage model of successful recruiting by a
telephone interviewer, illustrated in Figure 1.1. The model is based on an
interdisciplinary framework that draws on theories of survey methodology
(tailoring), sociolinguistics (including theories of politeness and conversational
grounding), and psychology (the theory of person perception). Some phone

3
answerers will be determined not to participate, and no aspect of the
interviewer‘s voice or speech can persuade them otherwise. Notwithstanding the
proclivities of these individuals, I posit that the initial impression of an interviewer
as warm and competent can allow him or her to get a ―foot in the door,‖ so to
speak. Groves and Couper (1998) suggest that interviewers who are able to
prolong interactions will be able to obtain more information for effective tailoring.
Beyond the initial impression, displays of responsiveness and competence can
increase the likelihood that a sample member will participate.
This chapter reviews the existing literatures on person perception and
tailoring. While both of these ideas are relevant to survey nonresponse, they
have not been examined in combination; I propose that they are, in fact,

4
interrelated and should all be considered in discussions of telephone survey
response. I will integrate these concepts to develop a model from the perspective
of the interviewer (as opposed to the answerer) that can begin to explain
differences in success between interviewers based on their vocal characteristics,
speech, and behaviors.
1.2 Overview of Studies
This dissertation begins with results from a study I conducted measuring the
impact of initial judgments of telephone interviewers‘ personality and vocal
characteristics on their success at turning answerers into respondents. In
particular, the study asked 3,403 judges to rate speech and personality traits of
interviewers based on audio recordings presented online; this was administered
as a Web survey in which the judges were respondents. These ratings were used
to predict the outcome of the contact. My second study assessed how
interviewers‘ subsequent responsiveness to sample members‘ concerns and
conversation starters after the initial impression affect their success. This study
relied on coded interactions to assess the interviewers‘ responsiveness. The third
study collected survey practitioners‘ beliefs about the importance of interviewers‘
speech, voices, and behaviors in obtaining interviews. The findings provide
context and a point of contrast for results from the other two studies.
Specifically, the first study collected ratings of interviewers on the following
traits: enthusiastic, happy, genuine, pleasant to listen to, confident, professional,
competent, knowledgeable, natural-sounding, irritating, uncertain, and scripted.
This study tested the hypothesis that ratings of the first nine of these

5
characteristics, either alone or in combination, predicted interviewer success as
measured by the actual outcome of the recorded contact. A secondary
hypothesis tested is that these traits will cluster into two factors representing
warmth and competence––two dimensions widely assumed to be crucial to
person perception (Asch 1946). Judges were also asked to predict the likelihood
that a contact resulted in agreement to test the hypotheses that these predictions
are associated with ratings of interviewer characteristics, as well as with the
actual outcome of a contact. A further question explored in the first study is the
association of vocal characteristics to these ratings. I hypothesize that vocal
characteristics associated with competence, such as a faster rate of speech and
lower fundamental frequency (Brennan and Williams 1995; Ketrow 1990), will
correlate with judges‘ ratings of competence, confidence, knowledge and
professionalism. Additionally, vocal characteristics associated with warmth, such
as a higher fundamental frequency, will correlate with judges‘ ratings of
enthusiasm, happiness, how genuine the voice sounds , and how pleasant the
voice is to listen to.
The second study explored which interviewer behaviors and vocal
characteristics predict a contact outcome of agreement. I hypothesize that
interviewers who provide relevant responses to answerer concerns or remarks,
and/or adapt their speech to the individual situation (for example, by slowing
down their speech for an answerer who is struggling to understand), will be more
successful than interviewers who do not.

6
1.3 Literature Review
Nonresponse to telephone surveys has been increasing steadily over the past
25 years (Curtin, Presser, and Singer 2005). Declining response rates have the
potential to increase nonresponse error, as a greater number of nonrespondents
can increase the opportunity for differences to be observed between respondents
and nonrespondents (Groves, Presser, and Dipko 2004; Teitler, Reichman, and
Sprachman 2003). Further, nonresponse rates vary by interviewer (Morton-
Williams 1993; Oksenberg and Cannell 1988; O‘Muircheartaigh and Campanelli
1999; Snijkers, Hox, and de Leeuw 1999). Oksenberg and Cannell (1988) find
that even when telephone interviewers read identical scripts, their refusal rates
ranged from 6 percent to 42 percent. Attitudinal and behavioral differences
between face-to-face interviewers are found in studies by Campanelli, Sturgis,
and Purdon (1997); Durrant et al. (2010); Hox and de Leeuw (2002); Pondman
(1998); and Snijkers, Hox, and de Leeuw (1999). Blom, de Leeuw, and Hox
(2010) find that variation in response rates between countries can be partially
attributed to differences in interviewer behavior. Uncovering the characteristics
and behaviors of successful interviewers can help to reduce nonresponse.
1.3.1 Vocal Characteristics and Survey Response
In contrast to face-to-face interviewers, telephone survey interviewers have
only two tools at their disposal in the effort to persuade answerers to participate:
what they say (speech) and how they say it (vocal characteristics). Vocal
characteristics such as rate and pitch are considered more important to
persuasion in situations where a listener has less rather than more involvement
7
and investment in the outcome (Gelinas-Chebat and Chebat 1992; Smith and
Shaffer 1995). This distinction may be applicable to the survey invitation, a
situation in which potential respondents tend to have low involvement.
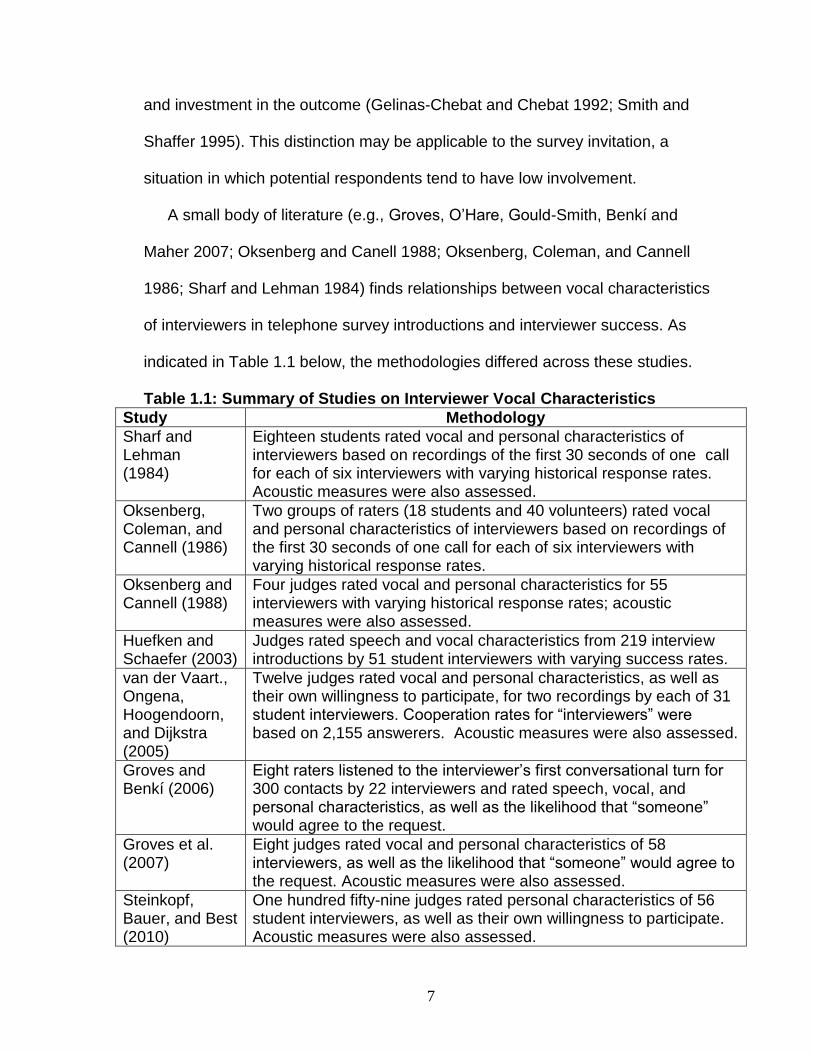
A small body of literature (e.g., Groves, O‘Hare, Gould-Smith, Benkí and
Maher 2007; Oksenberg and Canell 1988; Oksenberg, Coleman, and Cannell
1986; Sharf and Lehman 1984) finds relationships between vocal characteristics
of interviewers in telephone survey introductions and interviewer success. As
indicated in Table 1.1 below, the methodologies differed across these studies.
Table 1.1: Summary of Studies on Interviewer Vocal Characteristics
Study Methodology
Sharf and Lehman (1984)
Eighteen students rated vocal and personal characteristics of interviewers based on recordings of the first 30 seconds of one call for each of six interviewers with varying historical response rates. Acoustic measures were also assessed.
Oksenberg, Coleman, and Cannell (1986)
Two groups of raters (18 students and 40 volunteers) rated vocal and personal characteristics of interviewers based on recordings of the first 30 seconds of one call for each of six interviewers with varying historical response rates.
Oksenberg and Cannell (1988)
Four judges rated vocal and personal characteristics for 55 interviewers with varying historical response rates; acoustic measures were also assessed.
Huefken and Schaefer (2003)
Judges rated speech and vocal characteristics from 219 interview introductions by 51 student interviewers with varying success rates.
van der Vaart., Ongena, Hoogendoorn, and Dijkstra (2005)
Twelve judges rated vocal and personal characteristics, as well as their own willingness to participate, for two recordings by each of 31 student interviewers. Cooperation rates for ―interviewers‖ were based on 2,155 answerers. Acoustic measures were also assessed.
Groves and Benkí (2006)
Eight raters listened to the interviewer‘s first conversational turn for 300 contacts by 22 interviewers and rated speech, vocal, and personal characteristics, as well as the likelihood that ―someone‖ would agree to the request.
Groves et al. (2007)
Eight judges rated vocal and personal characteristics of 58 interviewers, as well as the likelihood that ―someone‖ would agree to the request. Acoustic measures were also assessed.
Steinkopf, Bauer, and Best (2010)
One hundred fifty-nine judges rated personal characteristics of 56 student interviewers, as well as their own willingness to participate. Acoustic measures were also assessed.

8
The methods summarized above point to challenges in conducting research
in this area. Often the independent variables are judges‘ ratings of an
interviewer‘s pitch, speech rate, or other vocal characteristics. When such ratings
are used, small sample sizes tend to be the norm; for example, the two earliest
studies were each based on six recordings. Studies with larger sample sizes,
such as Huefken and Schaefer (2003), Steinkopf, Bauer, and Best (2010), and
van der Vaart et al. (2005), are based on the work of student (rather than
professional) interviewers, limiting the applicability of findings. In addition, while
subjective ratings of vocal characteristics such as pause frequency and fluency
demonstrate listeners‘ impressions of interviewers, none of the studies
mentioned captured these variables objectively (for example, by computing rates
of fillers such as ―um‖ and ―uh‖). Further, the content of interviewers‘ speech is
not considered in any existing work on interviewer vocal characteristics.
Certainly, while capturing the content of an introduction is labor-intensive,
including it in analyses will give a more complete picture of the introduction.
Existing studies do not take conversational interaction into account; judges‘
ratings are based on interviewers‘ speech and vocal characteristics, to the
exclusion of utterances by potential respondents. Finally, dependent variables
assessed in existing studies are either interviewers‘ historical response rates,
judges‘ own willingness to comply, or judges‘ beliefs that someone will comply;
no study has yet associated vocal characteristics with actual contact outcomes.
Despite these limitations and variations in measures and sample sizes, some
vocal characteristics have consistently correlated with interviewer success. In

9
general, successful interviewers have been ones who spoke louder (Oksenberg
and Cannell 1988; Oksenberg, Coleman, and Cannell 1986, van der Vaart et al.
2005), faster (Oksenberg and Cannell 1988; Oksenberg, Coleman, and Cannell
1986), and with more falling intonation (Oksenberg and Cannell 1988; (Sharf and
Lehman 1984). In addition, success has been shown to be correlated with both
higher mean fundamental frequency (Sharf and Lehman 1984) and higher
perceived pitch (Oksenberg, Coleman, and Cannell 1986), as well as variable
fundamental frequency (Groves et al. 2007; Sharf and Lehman 1984) and
variable pitch (Oksenberg, Coleman, and Cannell 1986). (The terms ―pitch‖ and
―fundamental frequency‖ are often used interchangeably, but a necessary
distinction is that fundamental frequency is an acoustic measure of vocal chord
vibrations, while pitch is a listener‘s perception of frequency, or how ―high‖ or
―low‖ a voice sounds.) More recent studies find nonlinear relationships between
success and speed (Groves et al. 2007; Steinkopf, Bauer, and Best 2010).
1.3.2 Formation of First Impressions
One critical question concerns what underlies these associations; what is it
about an interviewer who speaks faster or with more variable pitch that leads to
success, especially given the limited amount of exposure an answerer has to the
interviewer‘s voice? Two dimensions of person perception, ―warmth‖ and
―competence,‖ have been shown to be universally relevant to the development of
impressions of other people (Asch 1946; Fiske, Cuddy, and Glick 2007; Kelley
1950; Rosenberg, Nelson, and Vivekanathan 1968). Fiske, Cuddy, and Glick
(2007) explain these perceptions from an evolutionary perspective: warmth, or

10
determining whether a stranger is a potential friend or foe, is by necessity the first
judgment made of another person, and it is made, to some degree, in under a
second. Judgments about competence are secondary to warmth judgments; from
an evolutionary perspective, these judgments involved determining whether an
encountered stranger had the ability to act on any threats or helping tendencies
that may have been suggested by the warmth judgment (Fiske, Cuddy, and Glick
2007). Although these evolutionary needs for quick judgments of others have
become largely obsolete, the importance of first impressions on subsequent
interactions, behavior, and expectations persists in many contexts (Jones 1990).
Person perception is generally assumed to occur in two stages: first, an
automatic ―gut feeling,‖ and then, a more controlled process (Ambady,
Krabbenhoft, and Hogan 2006). First impressions can be developed very quickly.
Ambady and colleagues (Ambady, Krabbenhoft, and Hogan 2006; Ambady and
Rosenthal 1992) collect judgments based on what they refer to as ―thin slice‖
exposures of as short as 20 seconds to a voice and found that ―snap‖ judgments,
particularly on an interpersonal dimension, are the same as those made based
on more exposure.
Still briefer exposures to voices are used by Hecht and LaFrance (1995) in
their study of telephone operators. In this study, exposures of only five seconds
allowed judges to make ratings that correlated with operators‘ job performance.
These authors found that ratings of operators as enthusiastic, sympathetic,
confident, professional, and friendly were highly correlated, and concluded that
judges used some ―underlying dimension of positivity or vocal attractiveness to

11
make their evaluations‖ (p. 2095). Operators who were ranked highly on these
characteristics tended to also rate highly on the job performance measure at
issue––speed––and were also described as having less monotonous voices, and
clearer pronunciation. Despite the difference in context between calls to phone
operators and calls from survey interviewers, the finding that ―a positive tone in
the initial seconds may set the stage for a smooth, coordinated interchange of
information‖ (p. 2095) is relevant to the introduction to phone surveys: a voice
that gives an immediately positive impression may have the potential to make
even a request for participation sound appealing.
There is support for the idea that positive first impressions are critical in a
telephone, and specifically a telephone survey, context. Oksenberg, Coleman,
and Cannell (1986) emphasize the importance of an initially appealing voice in a
survey interview introduction context, stating that ―if vocal characteristics lead the
respondent to perceive the interviewer as unappealing, cooperation will be less
likely‖ (p. 99). The telemarketing literature also stresses the importance of an
appealing voice in the first 10 to 15 seconds of a sales call (Ketrow 1990), and
Sanchez (1985) notes that content is irrelevant if a salesperson‘s voice is
deemed unappealing in the initial seconds of a call. The importance of pleasing
voices in brief telephone encounters is demonstrated in Bartsch‘s (2009) study of
voice-to-voice customer service encounters. This study finds that not only were
ratings of vocally attractive service representatives‘ efforts and abilities rated
higher than their vocally unattractive counterparts, but expectations of these

12
attributes were rated higher based on brief initial exposures to a vocally attractive
service representative.
While first impressions are formed quickly, their impact is long lasting. Judges
tend to form stable impressions of a person after an initial exposure––what
Zuckerman et al. (1979) call a ―demeanor effect.‖ Zuckerman and Driver (1989)
extend this effect to vocal attractiveness, finding that differences in vocal
attractiveness led to different impressions of personality, but that these
differences held regardless of the message presented by the speaker.
1.3.3 Voice and Personality Characteristics
Several studies in the literature on interviewer vocal characteristics suggest
that ratings of personal characteristics on the two dimensions of person
perception (warmth and competence) are associated with both interviewer
success and vocal characteristics. These studies involve collecting ratings of
several interviewer personality characteristics, which were then successfully
reduced to two dimensions interpretable as ―warmth‖ and ―competence.‖
Characteristics on the ―warmth‖ dimension included cheerful, friendly,
enthusiastic, interested in the task, and pleasant to listen to. Characteristics
assessing the ―competence‖ dimension included educated, intelligent, and
professional. Oksenberg, Coleman, and Cannell (1986) find correlations between
high ratings on both of these dimensions and vocal characteristics including
variation in pitch, higher pitch, loudness, a faster rate of speech, and more
distinct pronunciation. Van der Vaart et al. (2005) find that interviewers rated
highly on characteristics on the warmth dimension (enthusiastic, friendly, social,

13
personal, not aloof, and polite) tended to have higher and more variable pitch,
while those rated highly on ―competence‖ characteristics such as overriding, self-
assured, objective, and professional tended to have lower pitch.
Both Oksenberg, Coleman, and Cannell (1986) and van der Vaart et al.
(2005) find that high ratings on a ―warmth‖ dimension correlated with ratings of
judges‘ willingness to participate. This aligns with Morton-Williams‘ (1993) finding
that warm or ―likable‖ interviewers increased perceived benefits to potential
respondents and improved participation rates, and also with Cialdini‘s (1984)
―Liking‖ Principle of Compliance: people are more likely to comply with a request
from someone they like.
Oksenberg and Cannell (1988) find that ratings of how pleasant an
interviewer was to listen to were positively related to several subjective ratings of
vocal characteristics, including ―stress or emphasis of words and phrases,‖ ―flow
of words,‖ and ―spontaneity.‖ Interviewers who were ―pleasant to listen to‖ had
greater success, indicating that an underlying dimension of vocal attractiveness
is related to survey response. Judgments of vocal attractiveness have been
shown in a number of studies (Bartsch 2009; Berry, Hansen, Landry-Pester, and
Meier 1994; Zuckerman and Miyake 1993) to be highly reliable between raters
and also to be positively correlated with judgments of desirable personality traits
on the dimensions of warmth and competence, including warmth, honesty,
competence, leadership, dominance (Berry et al. 1994), achievement, and
likability (Zuckerman and Driver 1989). Zuckerman and colleagues (Zuckerman
and Driver 1989; Zuckerman, Hodgins, and Miyake 1990) attribute the

14
assignment of desirable personality traits to vocally attractive people to what they
term the ―what sounds beautiful is good‖ stereotype. The ―what‘s beautiful is
good‖ stereotype, whereby physically attractive people are associated with
desirable personality traits, has roots in the physical attractiveness realm; it was
first demonstrated by Dion, Berscheid, and Walster (1972).
While an appealing voice contributes to positive first impressions, Zuckerman
and Miyake (1993) caution that vocal attractiveness is low in salience and
listeners are often not aware of it. In keeping with the dual-component model of
person perception, it makes sense to also account for the role of competence in
first impressions. Maddux and Rogers (1980) determine that physical
attractiveness has no main effect on persuasion. Instead, attractive people may
need expertise or supporting arguments in order to persuade others. It is not
terribly far-fetched to think that the same may be true of vocal attractiveness or
appeal: in and of itself it is not particularly persuasive, and competence and
credibility of a speaker are also necessary for persuasion. Cialdini (1984)
suggests a compliance heuristic based on the principle of authority; an
authoritative requester is more likely than one without authority to have a request
granted. Findings from qualitative interviews conducted as part of my preliminary
studies (discussed in detail in Appendix 1) suggest that respondents cannot
reliably rate broad, global characteristics of interviewers, such as ―authority‖ or
―likability.‖ However, respondents often use evidence of specific characteristics
such as competence, confidence, enthusiasm, and genuineness to make
assessments of wide-reaching characteristics such as ―authority‖ and ―likability.‖

15
Impressions of competence and confidence, in turn, have been shown to be
associated with interviewer success (Oksenberg and Cannell 1988; Oksenberg,
Coleman, and Cannell 1986; Steinkopf, Bauer, and Best 2010).
1.3.4 Tailoring and Responsiveness
The initial impression of a phone interviewer‘s voice as warm and competent
(stage 1 in the model depicted in Figure 1.1) may offer the interviewer the
proverbial ―foot in the door,‖ giving the interviewer an opportunity to tailor their
introduction to be more relevant to the individual by keeping a potential
respondent on the phone longer. Groves and Couper (1996) name ―prolonging
interaction‖ as a key strategy of successful interviewers for this reason.
Interviewer responsiveness has been shown to be effective in persuasion.
Campanelli, Sturgis and Purdon (1997) find that relevant interviewer responses
to specific householder concerns, indicating adaptation, are a successful
interviewer technique. Groves and McGonagle (2001) are able to quantify this
association with their finding that interviewers‘ cooperation rates in telephone
surveys improved after interviewers went through a training program to increase
their use of tailoring techniques, specifically by focusing on giving relevant
responses to concerns expressed by sample members. Similarly, Pondman
(1998) finds a 49% refusal rate among interviewers who were trained in a
responsive strategy (compared to a 60% refusal rate among interviewers who did
not participate in the training): in response to refusals, rather than asking ―why‖ or
repeating the refusal (―You don‘t want to participate?‖), interviewers were
instructed to offer to call back if answerers indicated not having time at the

16
moment to take part in the interview, and also to ―apply the provision of relevant
information about features of the interview in reaction to refusals based on
reasons other than time‖ (p. 75).
Viewed through the lens of vocal characteristics, responsiveness may be
indicated by linguistic convergence, or the ―mirroring‖ by one conversational
partner of the other‘s speech. According to Communication Accommodation
Theory (Giles, Coupland, and Coupland 1991), convergence of communication
elements is a method of reducing social distance that can have positive
outcomes for conversational interactions; that is, people who mirror their
conversational partner are perceived more positively by that partner than those
who do not. Convergence has been demonstrated with linguistic and
paralinguistic elements including speech rate, accent, and response latency
(Giles, Coupland, and Coupland 1991). Chartrand and Bargh (1999) discuss this
―chameleon effect,‖ and find that individuals were more favorably inclined toward
a conversational partner who mirrored their vocal and nonvocal characteristics.
While a small body of literature has shown that telephone interviewers‘
personality traits (such as being warm and competent), vocal characteristics
(including a faster rate of speech and a higher fundamental frequency), and
behaviors (specifically, responsiveness to answerers‘ concerns) are, in fact,
associated with their success, many of these studies have been fairly ad hoc,
and lacking in strong theoretical grounding. This dissertation helps fill this gap in
the literature by developing a conceptual model for interviewer behavior which is
based on interdisciplinary ideas about communication.

17
Chapter 2: Examining the Role of First Impressions
2.1 Introduction
This chapter asks whether first impressions, formed in the initial seconds of a
telephone interviewer‘s introduction, are critical in determining the outcome of the
contact. I intend to answer several questions concerning first impressions of
telephone interviewers:
Which first impressions of interviewer characteristics related to
―warmth‖ and ―competence‖ are predictive of a successful outcome?
How do vocal characteristics relate to first impressions?
How accurately can listeners predict contact success based only on
the initial seconds of an interviewer‘s introduction?
How do listeners‘ first impressions of an interviewer relate to other
listeners‘ predictions of a contact‘s outcome?
How do actual relationships between first impressions and success
compare or contrast with survey practitioners‘ ideas about what makes
a successful interviewer?
While this work is largely exploratory in nature, it is structured by the following
hypotheses:
H1: Ratings of nine interviewer characteristics in will cluster into two factors
representing the two dimensions of person perception (warmth and competence).

18
H2: Judges’ ratings of the likelihood that a contact resulted in agreement will be
associated with the actual outcome of the contact.
H3a: Higher ratings of the nine positive characteristics will be associated with
higher ratings by other judges of the likelihood that the contact resulted in
agreement.
H3b: Lower ratings of the three negative characteristics will be associated with
higher ratings by other judges of the likelihood that the contact resulted in
agreement.
H4: Ratings of interviewer characteristics based on first impressions will be
associated with greater success of a survey invitation.
H4a. Higher ratings of nine positive interviewer characteristics (enthusiastic,
friendly, genuine, pleasant to listen to, confident, professional, competent,
knowledgeable, and natural-sounding), either alone or in combination, will be
associated with greater success of a survey invitation.
H4b. Lower ratings of three negative characteristics (scripted, uncertain, and
irritating) will be associated with greater success of a survey invitation.
H5: Survey practitioners will rank telephone interviewers’ personality
characteristics as more important than their vocal characteristics in contributing
to an interviewer’s success.
H6: Practitioners will view as important those characteristics that are associated
with greater actual success.

19
H7: Vocal characteristics associated with competence, such as a moderately fast
rate of speech and lower fundamental frequency, will be associated with higher
ratings in the categories of competent, confident, knowledgeable, and
professional.
H8: Vocal characteristics associated with warmth, such as a higher fundamental
frequency, will be associated with judges’ ratings in the categories of
enthusiastic, friendly, genuine, and pleasant to listen to.
This chapter begins with a description of data collected in two Web surveys.
The first, referred to as the ―listeners‘ study,‖ was conducted among Internet
survey panel members who answered questions after listening to brief excerpts
of interviewer speech from telephone survey introductions. The second was
conducted among survey practitioners and is referred to as the ―practitioners‘
study.‖ Results from the listeners‘ study testing the hypotheses above are
described and contrasted with results from the practitioners‘ study. I finish with
conclusions, a discussion of limitations, and suggestions for future research in
this area.
2.2 Data and Methods
The data described in this chapter are drawn from two Web surveys. The first
was a survey among 3,403 adult, English-speaking members of an Internet
survey panel. The second was a smaller survey of 44 survey practitioners who
are responsible for the hiring and training of survey interviewers. Respondents to
the practitioners‘ study represented academic, government, and for-profit survey
organizations.

20
2.2.1 Listeners’ Study: Questionnaire Development
The study referred to as the ―listeners‘ study‖ used online presentation of
audio recordings, fielded by Lightspeed Research as a Web survey and designed
to elicit listeners‘ judgments about telephone interviewers‘ personality
characteristics and the success of telephone survey invitations. In this survey,
3,403 members of an online survey panel listened to interviewer speech from
selected phone survey introductions (the selection process is described in
Section 2.2.2). The stimuli to which listeners were exposed consisted of brief
introductory statements by the interviewer, such as: ―Hello, my name is ___ and
I‘m calling from the University of Michigan about our survey on____.‖ No
answerer speech was included in the excerpts. (As discussed in Section 1.1, the
term telephone ―answerer‖ refers to a sample member.)
All listeners heard excerpts from ten telephone survey introductions randomly
selected from a corpus containing 283 introductions by 49 different interviewers,
meaning that it was possible for some listeners to hear multiple introductions by
one interviewer, and for others to hear ten different interviewers. The particular
group of excerpts presented to each listener contained two excerpts in each of
five length categories, outlined below in table 2.2. While the same group of ten
contacts could be heard by multiple listeners, assignment and order of excerpts
was random so as to avoid context effects from presenting excerpts in set groups
or a set order.

21
For the first five excerpts, listeners were asked only to predict the likelihood
that the sample member would agree to participate. These are referred to as
―likelihood ratings‖ in what follows.
For five other contacts, listeners were asked to rate the interviewer on the
twelve characteristics outlined in Table 2.1 using a scale from 1 (not at all) to 6
(extremely). These are referred to as ―characteristic ratings‖ below. Many of the
characteristics rated were mentioned by respondents in the preliminary
qualitative study, mentioned in Chapter One, which explored perceptions of
interviewers‘ voices; others have been shown in the literature (Oksenberg and
Cannell 1988; van der Vaart et al. 2005) to be related to interviewer success.
Table 2.1: Rated Interviewer Characteristics
Characteristic Rationale for including
Pleasant to listen to
Oksenberg and Cannell (1988) find an association with success.
Enthusiastic Explored by Groves et al. (2007); find no relationship with success. Mentioned repeatedly by respondents to preliminary study described in Appendix 1.
Friendly Rated in studies by Oksenberg and Cannell (1988) and van der Vaart et al. (2005); results mixed as to an association with success.
Genuine Used repeatedly by respondents in the preliminary study.
Confident Oksenberg and Cannell (1988) find an association with success. Van der Vaart et al. (2005) find ―self-assured‖ loaded highly on an ―authority‖ factor, which is associated with interviewers‘ historical response rates.
Professional Van der Vaart et al. (2005) find ―professional‖ loaded highly on an ―authority‖ factor.
Competent Oksenberg and Cannell (1988) find a positive association between competency ratings and success.
Scripted Groves et al. (2007) find a negative association between scriptedness and success.
Knowledgeable Often used in the preliminary qualitative study when respondents discuss whether the interviewer is ―good at her job,‖ a measure used by Oksenberg, Coleman, and Cannell (1986).

22
Characteristic Rationale for including
Natural-sounding
All included as a check on data quality, with the assumption that judges who give high ratings for ―scripted,‖ ―confident,‖ and ―pleasant to listen to‖ would choose low ratings for ―natural sounding,‖ ―uncertain,‖ and ―irritating.‖
Uncertain
Irritating
The full listeners‘ questionnaire can be found in Appendix 2.
2.2.2 Selection of Contacts
Contacts were selected from 1,380 audio-recorded telephone survey
introductions. These introductions were transcribed, coded, and acoustically
measured as part of a project, funded by the National Science Foundation, which
explored the impact of interviewer vocal and speech characteristics on
nonresponse (Benkí, Broome, Conrad, Groves and Kreuter 2011; Conrad,
Broome, Benkí, Groves, Kreuter and Vannette 2010). Contacts used in this
project were selected from five telephone surveys conducted at the University of
Michigan, using a sampling structure involving stratification both by interviewer
and outcome. This sampling structure, described in detail in Appendix 3, ensured
that the dataset contained a number of successful contacts sufficient for analysis.
All contacts were classified into five outcomes: ―agree,‖ where the answerer
agrees to participate; ―refuse,‖ where there is an explicit refusal (for example, ―I
will not take the survey. Please do not call again‖); ―scheduled callback,‖ where
the interviewer either schedules a time to call back or asserts that she will call
again; ―hang up,‖ where the answerer hangs up but never clearly refuses; and
―other.‖
A subset of the 1,380 contacts described above was used for the listeners‘
study described here. To facilitate comparisons (particularly in analyses of vocal

23
characteristics such as pitch), only introductions by female interviewers were
selected. In addition, contacts in the original dataset from the Gujarati
Community Study, a study conducted among members of a distinct linguistic and
cultural community, were excluded from selection because they often included
labored communication between interviewers and answerers. Finally, contacts
where the answerer hangs up during or directly following the interviewer‘s first
speaking turn were excluded, using the rationale that these are ―hard-core
nonrespondents‖ who are determined not to become respondents, and nothing in
the interviewer‘s voice or speech can convince them otherwise.
After these criteria were applied, 674 invitations remained. Only agrees and
refusals were included in this analysis, so as to foster a cleaner comparison.
Three hundred twenty-four contacts with outcomes that were not clearly ―agree‖
or ―refusal‖ were excluded (276 had the outcome ―scheduled callback,‖ nine had
the outcome ―hang-up,‖ and 39 had the outcome ―other‖).
Because listeners were asked to make judgments about the interviewer‘s
personality, contacts had to contain enough speech to make these
determinations. The minimum amount of speech required for inclusion was a
statement of name and affiliation. Ten contacts were omitted because no
speaking turn contained enough introductory interviewer speech for listeners to
assign ratings. Another 51 contacts were omitted because the interviewer asked
for a particular person by name (indicating that the interviewer had already
spoken at length to someone in the household, and the persuasion process was
likely to be quite different than in the other contacts), and six more were left out

24
because the interviewer indicated that the interview had already been started in a
previous contact, so the outcome of the invitation was no longer in question.
The 283 contacts ultimately selected for inclusion included 118 (42 percent)
with an outcome ―agree‖ and 165 (58 percent) with an outcome of ―refuse.‖
Listeners were not told the likelihood of either outcome.
Selected contacts were from three studies: the Survey of Consumer Attitudes,
or SCA (n=168), the National Study on Medical Decisions, or NSMD (n=110),
and the Mississippi Community Study, or MCS (n=5). A total of 49 interviewers
were represented in the dataset.
2.2.3 Listeners’ Survey: Editing of Contacts
The selected contacts were edited using Praat software for acoustic analysis
(http://www.fon.hum.uva.nl/praat/). All speech other than the selected interviewer
turn was cut from the contact. Typically, the interviewer‘s first turn was used,
although for 15 contacts, a later turn was used, generally because there was not
enough uninterrupted interviewer speech in the first turn, or because it was clear
to the interviewer that she was speaking to a child (for example, ―Is your mom or
dad home?‖). In 165 contacts, an entire turn was used; in the remaining 118
contacts, the turn was cut short to avoid places where interviewer and answerer
were speaking simultaneously; for example, ―I‘m calling about our study on
medical decisions‖ was cut to ―I‘m calling about our study‖ if the answerer started
talking during ―medical.‖
After selecting the interviewer speech to be used, the recording was amplified
to use the full range of sounds that a recorded voice would make. Amplification

25
was maintained at the same level for all contacts, thus making all contacts
comparable in volume.
Finally, to preserve interviewers‘ anonymity, the interviewer‘s name in each
contact was replaced with a quarter-second-long tone. For consistency, this was
done even in the few cases where the interviewer only said her first name.
2.2.4 Listeners’ Survey: Data Collection
Data collection was conducted by a commercial vendor, Lightspeed Research
(http://www.lightspeedresearch.com/). Fifteen thousand invitations were sent to
members of Lightspeed‘s own volunteer online panel, and the study was fielded
from August 12–18, 2011 among 3,403 panel members, referred to hereafter as
―listeners.‖
Listeners were screened to ensure that they were 18 years of age or older (as
would be any eligible respondents to the surveys represented by these contacts),
and that they characterized their ability to understand spoken English as
―excellent‖ or ―good.‖ This screening criterion was deemed necessary for
listeners to be expected to make personality judgments about the interviewer
based on brief speech clips. Thirty-nine potential listeners were screened out at
this stage: eight who were under age 18, and 31 who did not have the required
English abilities.
After their eligibility for the study was determined, listeners were exposed to
an ―introductory‖ audio clip and asked to identify one of the words in the clip. The
purpose of this exercise was threefold: first, to ensure that listeners were using a
computer with working audio; second, to familiarize them with the type of audio

26
they would be hearing during the survey; and third, as a quality-control check to
ensure that listeners could sufficiently distinguish words in the contact. One
hundred twenty-six potential listeners were screened out at this stage.
While the mean exposure length of introduction excerpts was 10.32 seconds,
the range was wide: from 2.3 to 49.2 seconds. To roughly match the burden on
raters and ensure that none received multiple long introductions, excerpts were
stratified into five groups based on logical length categories. Each listener
received two sets of five introductions, each consisting of one randomly selected
excerpt from each length category. For each of the first five introductions,
listeners predicted the likelihood that the introduction had resulted in agreement;
for each introduction in the second group, none of which overlapped with the first
group, they rated the interviewer on the 12 characteristics outlined in Table 2.1.
With the resources available, it was possible to obtain 30 responses for each
of the 283 contacts in the corpus. This allowed me to use all available resources
while making the best possible use of the large corpus of contacts available. I
considered an alternative design whereby a greater number of listeners would
hear a smaller number of contacts (to obtain, for example, 100 responses per
contact) but recognized that one of the strengths of this project, particularly
compared to other studies in this area, was the large number of contacts
available.
In order to obtain at least 30 responses per introduction in the likelihood
prediction section and at least 30 sets of judgments in the ratings section, while
still exposing each listener to one excerpt from each length group for each

27
section, introductions in the smaller groups were played for more listeners than
the introductions in the larger groups.
For example, as Table 2.2 shows, Group 2 was the smallest group,
containing 45 contacts. Each one was included in a set with a contact from each
of the other, larger groups. Even after 30 ratings were collected for each of the
contacts in Group 2, exposure of these contacts continued until a minimum of 30
ratings had been obtained for every contact in the larger groups.
Table 2.2: Audio File Groupings
Group Length Number of contacts
Mean number of listeners
1 Under 5 seconds 62 54.4
2 5–6.9 seconds 45 76.0
3 7–9.9 seconds 53 64.2
4 10–14.9 seconds 70 48.6
5 15 seconds or more 53 64.2
As Table 2.3 demonstrates, the distribution of contact lengths was similar
across studies, with approximately a quarter of SCA contacts, and a fifth of
NSMD and MCS contacts, falling into the shortest group. Between 17 percent
and 21 percent of contacts fell into the longest group. NSMD had a greater
percentage of contacts in the 10–14.9 second range, while SCA had a greater
percentage in the 7–9.9 second range, and MCS had a greater percentage in the
5–6.9 second range.
Table 2.3: Audio File Groupings by Study
Length SCA NSMD MCS
Under 5 seconds 24% 19% 20%
5–6.9 seconds 16% 15% 40%
7–9.9 seconds 23% 13% 0
10–14.9 seconds 20% 33% 20%
15 seconds or more 17% 21% 20%
Total contacts 168 110 5

28
Table 2.4 shows that the proportion of contacts with each outcome was
similar for each length category. There were slightly more refusals in the 7–9.9
second group and slightly more agrees in the 5–6.9 and 10–14.9 second groups,
but virtually no difference in the shortest and longest length categories.
Table 2.4: Audio File Groupings by Outcome
Length Agree Refuse Total
Under 5 seconds 23% 24% 22%
5-6.9 seconds 19% 13% 16%
7-9.9 seconds 14% 22% 19%
10-14.9 seconds 27% 23% 25%
15 seconds or more 20% 18% 19%
Total contacts 118 165 283
Listeners were required to play each contact before they were allowed to
listen to the next contact. They were given the option to play each contact as
many times as they wanted before advancing. On average, listeners listened to
audio clips 1.07 times for the likelihood predictions and 1.10 times for the ratings.
The number of listens decreased monotonically for each subsequent exposure
(e.g., the first clip heard for a given question in the ratings task generated the
largest number of listens).
2.2.5 Practitioners’ Survey: Questionnaire Development
A questionnaire was developed to assess practitioners‘ ratings of the
importance of various behaviors and attributes to telephone interviewers‘
success, as well as to illuminate practitioners‘ current focuses in hiring and
training telephone interviewers. This questionnaire was developed based on
preliminary qualitative conversations with two employees at the University of

29
Michigan Survey Research Operations (UM SRO) unit: one a former call center
manager and one a Survey Specialist.
Areas of investigation covered in the survey included:
Size, workload, and clientele of organization;
Contributors to a telephone interviewer‘s success;
Importance of different vocal and personality traits in hiring
telephone interviewers; and
Emphases in telephone interviewer training.
All questions measuring importance used a four-point scale, with a midpoint
deliberately excluded to avoid respondents defaulting to this point.
The final survey (see Appendix 4) was programmed in Qualtrics, an online
survey tool which the University of Michigan is licensed to use.
2.2.6 Practitioners’ Study: Sampling
A sampling frame was developed which included some personal contacts of
the investigator, but relied heavily on a list of all members of the Association of
Academic Survey Research Organizations (AASRO). For organizations for which
a named individual was not known, the investigator looked at the organization‘s
Web site to find a relevant contact. Targeted titles included ―Field Supervisor,‖
―Call Center Manager/ Supervisor,‖ and ―Operations Manager.‖ For smaller
organizations or those with limited staff, the director or assistant director was
contacted.
The final sample consisted of 113 individuals at 108 organizations, including 2
government, 92 academic, 3 not-for-profit, and 11 for-profit organizations.

30
2.2.7 Practitioners’ Study: Data Collection and Respondent Overview
An email invitation (see Appendix 5) was sent to all 113 individuals on June 5,
2011 from the investigator‘s University of Michigan email address.
Two weeks after the initial invitation was sent, a reminder email was sent to
all members of the original frame with working email addresses, with the
exception of those participants who had already provided their email addresses
(respondents were given the option to provide their email addresses if they
wished to receive a copy of the results), and those sample members who had
requested no further contact.
The survey was completed by 44 respondents before it was closed on July
12, 2011, resulting in a 42 percent response rate.
Respondents represented a wide range of organizations in size, workload,
and clientele. The median number of computer-assisted telephone interviewing
(CATI) stations in respondent organizations was 25 and the mean was 56, but
number of stations ranged from 9 to 450. Close to half (42 percent) of
respondents reported that their organization had conducted fewer than 5,000
telephone interviews in 2010, while an equal percentage reported that their
organization had conducted 10,000 or more interviews. The remaining 16
percent of respondents reported that their organization had conducted between
5,000 and 10,000 interviews in 2010.
Respondents were not asked to indicate the sector they worked in; however,
of the 32 email addresses provided by respondents who wished to receive the

31
survey results, five included domain names of for-profit organizations, one of a
government organization, and 26 of academic organizations.
On average, 80 percent of the work from respondents‘ organizations was
conducted for government, non-profit, or academic organizations, while 15
percent of the work was done for for-profit organizations, and 2 percent for
―other‖ organizations (3 percent of respondents answered ―not sure‖ to this
question).
2.3 Results
2.3.1 Listeners’ Survey: Respondent Overview
Respondents were evenly divided between males (49 percent) and females
(51 percent). One-third (33 percent) were aged 60 or older, while 20 percent
were 50–59, 18 percent were 40–49, 17 percent were 30–39, and 12 percent
were 18–29. Eighty-eight percent of respondents were white, and 81 percent had
at least some college education.
2.3.2 Listeners’ Survey: Descriptives
On a six-point scale, the mean ratings for each characteristic ranged from
2.50 to 3.89, with standard errors of these means in the .02 to .04 range. The fact
that the mean ratings across contacts for each characteristic spanned at least
1.78 scale points indicates that respondents were able to differentiate among the
introductions they heard, and spread their ratings out over the whole scale, rather
than consistently default to the middle of the scale.

32
Table 2.5: Description of Ratings
Characteristic Overall mean (se)
Minimum Maximum Spread
Friendly 3.89 (.02) 2.84 4.62 1.78
Scripted 3.78 (.02) 2.70 4.67 1.97
Professional 3.70 (.03) 1.85 4.73 2.88
Competent 3.67 (.03) 1.90 4.67 2.77
Natural-sounding 3.65 (.02) 2.35 4.47 2.12
Confident 3.62 (.03) 1.77 4.63 2.86
Knowledgeable 3.61 (.03) 2.13 4.75 2.62
Genuine 3.59 (.02) 2.41 4.45 2.04
Pleasant to listen to 3.54 (.03) 2.13 4.49 2.36
Enthusiastic 3.43 (.03) 2.25 4.51 2.26
Uncertain 2.70 (.03) 1.83 4.55 2.72
Irritating 2.50 (.02) 1.73 3.51 1.78
2.3.3 Dimensions of Person Perception: Warmth and Competence
The first hypothesis tested was that contact-level ratings of the nine positive
characteristics would cluster into two factors representing the two dimensions of
person perception described in the literature: warmth and competence. A factor
analysis (shown in Table 2.6) was conducted in an attempt to distill the
characteristic ratings into fewer categories.
Due to high correlations between ratings of all positive characteristics (shown
in Table 2.7), this factor analysis revealed that only one factor, explaining 86
percent of total variance, had extremely high loadings for all nine positive
characteristics. Two characteristics expected to be on a ―warmth‖ dimension,
―enthusiastic‖ and ―friendly,‖ also loaded on a second factor, offering some
support for the idea that a ―warmth‖ dimension can be distinguished from a
―competence‖ dimension. When two factors are considered, 94 percent of the
variance in ratings is explained.

33
Note that two undesirable characteristics, ―uncertain‖ and ―irritating,‖ loaded
negatively, while ―scripted‖ had an extremely low loading on the first factor.
Table 2.6: Factor Loadings
Factor 1 Factor 2
Confident 0.96 -0.16
Friendly 0.86 0.37
Professional 0.95 -0.22
Pleasant to listen to 0.94 0.09
Competent 0.97 -0.15
Knowledgeable 0.92 -0.17
Natural-sounding 0.93 0.16
Enthusiastic 0.79 0.31
Genuine 0.94 0.16
Scripted 0.03 -0.59
Uncertain -0.83 0.27
Irritating -0.79 0.04
A correlation analysis, shown in Table 2.7, found that ratings for all nine
positive characteristics were highly correlated. Of note, the three strongest
correlations were found between characteristics hypothesized to make up a
―competence‖ dimension: ―confident‖ and ―competent‖ (.97), ―professional‖ (.94),
and ―knowledgeable‖ (.92). Correlations across dimensions were lower, such as
the correlation of .66 between ―enthusiastic‖ and ―professional‖ (compared to .88
between ―enthusiastic‖ and ―friendly). While it is clear that all positive
characteristics are strongly correlated, the higher correlations between
characteristics within one dimension compared to characteristics across
dimensions may indicate that listeners do distinguish, to some degree, between
the two dimensions of person perception.

34
Table 2.7: Correlations Between Ratings of Positive Interviewer Characteristics
Conf Prof Pleas Com Knowl Nat Enthus Gen Frien
Confident 1.00
Professional 0.94 1.00
Pleasant 0.86 0.88 1.00
Competent 0.97 0.97 0.88 1.00
Knowledgeable 0.92 0.92 0.82 0.94 1.00
Natural 0.84 0.88 0.93 0.88 0.83 1.00
Enthusiastic 0.78 0.66 0.72 0.73 0.68 0.69 1.00
Genuine 0.87 0.88 0.91 0.90 0.89 0.93 0.75 1.00
Friendly 0.77 0.72 0.86 0.76 0.70 0.81 0.88 0.84 1.00
Ratings of ―uncertain‖ and ―irritating‖ were highly correlated with each other
(.71), but ratings of ―scripted‖ (the only rating to predict outcome, as will be
discussed in Section 2.3.4) were not highly correlated with ratings of any other
characteristic. The mean correlation between scripted and positive
characteristics was .01.
In summary, the high level of correlation between ratings of all nine positive
characteristics indicates that raters make judgments on all of these traits based
on a single overall impression of positivity. While there is not unequivocal support
for the hypothesis that rated characteristics would cluster into two factors
representing the ―warmth‖ and ―competence‖ dimensions, there is some evidence
that ―friendly‖ and ―enthusiastic‖ may be perceived as being on a different (but
not entirely independent) dimension from characteristics such as ―competent,‖
―confident,‖ ―professional,‖ and ―knowledgeable.‖
2.3.4 Judged Likelihood Ratings: Association with Rated Characteristics
and Contact Outcome
The first section of the listeners‘ study asked judges to predict, on a scale
from 1 to 6, the likelihood that a contact resulted in agreement with the survey

35
request. The mean likelihood rating was 3.36 (se=.04). Contrary to my
hypothesis, likelihood ratings did not differ significantly by actual contact
outcome: the mean likelihood rating for contacts that resulted in refusal was 3.39
(se=.05), while for those with an outcome of agreement, the mean was 3.32
(se=.07).
While likelihood ratings are not associated with actual contact outcome, these
ratings are relatively highly correlated with ratings of all positive characteristics
(ranging from .46 to .69), and when likelihood was included in a factor analysis, it
loaded highly on a factor with all positive characteristics (which explained 85
percent of variance), as shown in Table 2.8. Since judges rated characteristics
for one group of contacts and predicted likelihood for another group, this
correlation cannot be attributed to the same judges giving high ratings for both
positive characteristics and likelihood.
Table 2.8: Factor Loadings When Likelihood is Included
Factor 1
Confident 0.96
Friendly 0.85
Professional 0.95
Pleasant to listen to 0.94
Competent 0.97
Knowledgeable 0.93
Natural-sounding 0.92
Enthusiastic 0.79
Genuine 0.94
Scripted 0.05
Uncertain -0.84
Irritating -0.79
Likelihood .64
Twelve separate linear regression models were constructed to predict judges‘
likelihood ratings on the basis of one rated characteristic. All of these models

36
controlled for the length of exposure, which, as mentioned, ranged from 2.3 to
49.2 seconds. This variable was included in the models to guard against the
possibility that judges assigned different ratings when they heard a longer,
compared to a shorter, stimulus. Since the same interviewers conducted multiple
contacts (the 283 contacts in the dataset were conducted by 49 interviewers), a
term was also added to account for clustering by interviewer. This takes into
account any random effects of interviewers. For example, an interviewer with a
Southern accent or a lisp may be consistently (over all her contacts) rated as
more ―friendly‖ or less ―professional.‖ Since ―accent‖ and ―lisp‖ are not included in
the model as variables, these attributes would be captured by the random effects
term.
These twelve models revealed that all positive characteristics, and ―scripted,‖
were significant positive predictors of likelihood judgments, while ―uncertain‖ and
―irritating‖ significantly predicted likelihood judgments in a negative direction. As
mentioned above, no raters judged the same contacts for likelihood and
characteristics; therefore, it can be concluded that ratings of positive
characteristics by some judges are predictive of higher likelihood ratings by other
judges. At the same time, higher ratings of negative characteristics, such as
―uncertain‖ and ―irritating,‖ predict that other judges will rate the likelihood of
success for these contacts lower.
A larger model was constructed to predict judges‘ ratings of the likelihood that
a contact resulted in agreement. Similar to the individual models described

37
above, this model controlled for exposure length and accounted for clustering by
interviewer. This model included three covariates:
The contact‘s factor score (from the factor analysis described in Table 2.6)
for the factor which encompassed the nine positive characteristics but
excluded likelihood ratings. The factor score is calculated for each contact
by multiplying the mean rating for a characteristic by that characteristic‘s
factor loading, then summing all products. It can be interpreted as an
aggregate measure of all positive characteristics and is more
parsimonious than modeling with all nine highly correlated characteristics
separately.
The contact‘s mean scriptedness rating, which did not load highly on the
factor but was shown in an individual model to be predictive of higher
likelihood ratings.
The interviewer‘s length of tenure (in days) at the time of the contact.
Longer tenure has been shown in the literature (Singer, Frankel, and
Glassman 1983) to be associated with a higher response rate.
As shown in Table 2.9, in this model, both scriptedness and the factor score
encompassing all positive characteristics predict higher ratings by judges of the
likelihood that a contact would result in agreement. Interviewer experience was
not a significant predictor of likelihood ratings.
Table 2.9: Predicting Likelihood Ratings
Coefficient SE Z P
Scriptedness .42 .09 4.59 0.000
Factor score .40 .03 13.40 0.000
Interviewer experience -.00001 .00003 -0.55 .584
Length of exposure .02 .004 4.99 0.000

38
It is clear from this analysis that interviewers who are perceived more
positively are also judged (by other raters) as more likely to have success in their
contacts. Similarly, more scripted interviewers are expected to be more
successful. However, listeners‘ ratings of the likelihood of agreement were poor
predictors of the actual outcome. In a model predicting actual outcome while
controlling for length of exposure and accounting for clustering by interviewer,
likelihood ratings were not a significant predictor of actual contact outcome. This
contradicted my hypothesis that judges‘ likelihood predictions would accurately
predict the actual outcome of a contact.
2.3.5 Characteristic Ratings as Predictors of Actual Contact Outcome
The following hypotheses were tested: that when ratings of nine positive
interviewer characteristics (enthusiastic, friendly, natural, genuine, pleasant to
listen to, confident, professional, competent, and knowledgeable) were high and
ratings of three negative characteristics (irritating, uncertain, and scripted) were
low, a contact‘s actual success would be more likely than when the positive
characteristics were rated lower and the negative characteristics were rated
higher.
This hypothesis was partially supported. Twelve bivariate models were
constructed, using the mean rating on each characteristic to predict agreement
and accounting for clustering by interviewers. Of these, only the model for
scripted had a significant coefficient (b=-1.05, standard error=.40, z=-2.59,
p=0.010), indicating that perceptions of the interviewer as more scripted

39
decrease the likelihood of a contact‘s success. These results persisted when the
models controlled for the length of exposure (ranging from 2.3 to 49.2 seconds),
and also when only the subset of 123 contacts with the longest exposure lengths
(at least 10 seconds) were analyzed.
For contacts resulting in agreement, the mean scriptedness rating was 3.72
(se=.03), while for contacts resulting in refusal, the mean rating was 3.82
(se=.02). A t-test showed these means to be significantly different (t [281]=2.67,
p=0.004).
In addition, the factor score from the first factor in the factor analysis
described in Table 2.6 (which includes all rated characteristics and is a measure
of how positive an interviewer is) was computed and used as a covariate in a
multiple logistic regression model. This model predicted contact outcome using
the factor score and the contact‘s mean scriptedness rating, while controlling for
exposure length and interviewer experience and accounting for clustering by
interviewer. Only scriptedness was a significant predictor in this model (t=-2.53,
p=0.012); the factor score was not.
Interviewer experience at the time of the contact ranged from 18 days of
performing this type of work to 8,324 days, with a median value of 309 days.
Interviewer experience significantly predicted ratings of scriptedness when
controlling for the length of exposure and accounting for clustering by interviewer
(b=-.000035, se=.00002, z=-2.21, p=0.0127), indicating that as interviewers gain
more experience, they become less scripted. This may be a contributor to the

40
greater success rates of more experienced interviewers, which have been
documented in the literature (e.g., Singer, Frankel, and Glassman 1983).
In summary, there was no support for the hypothesis that positive
characteristics would predict a successful outcome. Of all characteristics rated,
only scriptedness was associated with success, with less scripted interviewers
being more successful than those who were rated as more scripted. The
association between scriptedness and outcome held when interviewer
experience (which is negatively associated with scriptedness) was controlled for.
As a precaution against a type one error due to multiple testing effects, the
rigorous Bonferroni correction was applied to this result, leading to the
disappearance of the relationship between scriptedness and contact success.
While this result is disappointing, I would argue that the independence of
scriptedness from all other characteristics tested (as shown in the factor analysis
in Table 2.6, where scriptedness has an extremely low loading compare to all the
other, highly correlated characteristics) does not in fact necessitate a Bonferroni
correction.
2.3.6 Importance of First Impressions: Comparison Between Listeners’ and
Practitioners’ Surveys
The pattern that has emerged, showing a relationship between ratings of an
interviewer‘s scriptedness and contact outcome (but no relationship between
other ratings and outcome), may be at odds with widely held assumptions in the
research industry as to which interviewer attributes lead to greater success in
obtaining interviews. To explore this, I conducted a survey of individuals in

41
survey organizations who were responsible for hiring and/or training telephone
interviewers.
Before the listeners‘ study was conducted, an online survey was sent to
survey practitioners to collect their views on important traits and skills of
telephone interviewers. The results show that the practitioners‘ opinions aligned
with the characteristics which predicted higher likelihood ratings (such as
competence and confidence), but pointed to a gap between what survey
practitioners believe contributes to interviewer success and which ratings predict
actual success.
Regardless of whether they were responsible for interviewer hiring, training,
or both, all respondents to the practitioners‘ survey were asked to rate 18
attributes on their importance to an interviewer‘s response rate. A four-point
importance scale was used, from ―not at all‖ important to ―extremely‖ important.
(A mean score of 4 indicates that all respondents rated this attribute as
―extremely‖ important.) It is not known whether practitioners based their ratings
on the importance of these elements to an interviewer‘s overall performance, as
the question intended to measure, or to her performance in converting the most
resistant answerers.
Of the 18 elements rated, the one judged most important by survey
practitioners was ―the initial impression an interviewer gives to sample members.‖
This contrasts sharply with the finding in the listeners‘ survey that, aside from
scriptedness, no ratings of interviewer characteristics based on early impressions

42
can predict success on a given contact. However, these ratings do predict
judgments of the contact‘s likelihood of success.
While results from the listeners‘ study indicated that impressions of
scriptedness are, in fact, important to the success of a contact (with lower ratings
of scriptedness found in successful contacts), just 29 percent of practitioners
rated ―an interviewer‘s ability to ‗ad lib‘ or deviate from a script during an
introduction‖ as ―extremely important‖ to that interviewer‘s success. Far more
important, according to practitioners, were traits such as competence,
professional demeanor, and confidence—ratings of which were predictive of
listeners‘ judgments about the likelihood of success, but not of contact-level
outcome. Practitioners viewed characteristics on a ―warmth‖ dimension, such as
friendly and enthusiastic, as less important to an interviewer‘s success than traits
along a competence dimension.
Table 2.10: Practitioners’ Ratings of Importance to Interviewer’s Success
Mean (sd)
% Extremely Important
1 The initial impression an interviewer gives to sample members.
3.88 (.33) 88%
2 The ability to address concerns expressed by potential respondents.
3.84 (.38) 83%
3 How competent the interviewer sounds to potential respondents.
3.84 (.38) 83%
4 Professional demeanor when talking to potential respondents.
3.81 (.44) 86%
5 How confident the interviewer sounds to potential respondents.
3.81 (.45) 83%
6 The ability to convey knowledge about the study. 3.72 (.46) 71%
7 How genuine the interviewer sounds to potential respondents.
3.70 (.47) 69%
8 An interviewer‘s voice that does not sound monotonous (has pitch variability).
3.58 (.5) 57%

43
9 How friendly the interviewer sounds to potential respondents.
3.53 (.55) 57%
10 The interviewer‘s speech rate. 3.42 (.59) 48%
11 How enthusiastic the interviewer sounds to potential respondents.
3.42 (63) 50%
12 A pleasant-sounding voice. 3.41 (.59) 45%
13 The interviewer‘s ability to follow a script during an introduction.
3.30 (.78) 48%
14 The interviewer speaks without any ―um‘s‖ or ―uh‘s.‖ 3.16 (.71) 36%
15 The interviewer‘s ability to ―ad lib‖ or deviate from a script during an introduction.
2.95 (.89) 29%
16 How high or low the interviewer‘s voice sounds (pitch). 2.70 (.74) 12%
17 The interviewer emphasizes the length of the survey. 2.67 (.67) 12%
18 The interviewer emphasizes the incentive. 2.47 (.74) 10%
Further, among practitioners responsible for training telephone interviewers,
just 15 percent (the lowest overall percentage) report that ―developing a
personalized or non-scripted introduction‖ is a primary focus of their
organization‘s interviewer training, while 44 percent reported that it is not a focus
at all. ―Following introductory scripts,‖ by contrast, was a primary training focus
for 78 percent of trainers surveyed. This aligns with practitioners‘ assertion that
an interviewer‘s ability to ―ad lib,‖ or deviate from a script during an introduction,
is relatively unimportant to the interviewer‘s overall success, but contrasts with
literature finding that interviewers who are allowed to adapt their script have
greater success (Houtkoop-Steenstra and van den Bergh 2000; Morton-Williams
1993); it also contradicts the finding in the listeners‘ survey that higher ratings of
scriptedness predict less success at the contact level.
Table 2.11: Emphases in Interviewer Training
Mean (sd) % primary focus
1 Administering interviews. 2.98 (.16) 98%
2 Importance of data quality. 2.98 (.16) 98%
3 Standardized interviewing skills. 2.90 (.30) 90%
4 Obtaining interviews in general. 2.80 (.46) 83%
5 Use of CATI system. 2.76 (.42) 78%

44
6 Following introductory scripts. 2.76 (.53) 78%
7 Responding appropriately to arguments or concerns expressed by potential respondents.
2.76 (.49) 78%
8 Being able to answer questions about the study or organization.
2.68 (.53) 70%
9 Presenting a confident demeanor. 2.61 (.59) 65%
10 Developing knowledge about the study.
2.49 (.6) 53%
11 Obtaining interviews from reluctant respondents (including refusal conversion).
2.41 (.55) 45%
12 Recruiting respondents. 2.35 (.71) 49%
13 Developing a personalized or non-scripted introduction.
1.73 (.72) 15%
The results discussed in this section demonstrate a disconnect between
listeners and practitioners. While the listeners‘ data indicate that no
characteristics other than scriptedness are necessary to a contact‘s success,
practitioners place less emphasis on reducing scriptedness, and more on other
impressions conveyed by interviewers.
2.3.7 Relationship Between Vocal Characteristics, Ratings, and Contact
Outcome
Two hypotheses were tested involving interviewers‘ vocal characteristics. It
was hypothesized that vocal characteristics shown in the literature (Oksenberg,
Coleman, and Canell 1986; van der Vaart et al. 2005) to be associated with
competence––such as a moderately fast rate of speech and lower voice
(measured by fundamental frequency)––would predict higher ratings of
characteristics on this dimension (competent, confident, knowledgeable, and
professional), while vocal characteristics associated with warmth––such as a
higher fundamental frequency––would predict higher ratings of characteristics on

45
a ―warmth‖ dimension, including enthusiastic, friendly, genuine, natural, and
pleasant to listen to.
While some vocal characteristics are predictive of ratings, these hypotheses
were not supported in my dataset. A faster speech rate is associated with higher
ratings on all positive characteristics. Faster speech predicts, as hypothesized,
higher ratings of competent, confident, knowledgeable, and professional. Faster
speech also predicts higher ratings of ―warmth‖ characteristics such as
enthusiastic, friendly, genuine, natural, and pleasant to listen to, although the
coefficients for these variables are slightly lower than those in the models
predicting traits on a competence dimension. Table 2.12 describes 11 separate
models, one predicting each characteristic. The significance of the coefficients for
speech rate in all of the models outlined in the below table remain even when a
Bonferroni correction is applied.
Table 2.12: Predicting Ratings with Interviewer Speech Rate (controlling for exposure length and accounting for clustering by interviewer)
Dependent Variable Coefficient SE Z P
Confident .29 .06 5.25 0.000
Professional .26 .05 4.80 0.000
Competent .25 .05 4.90 0.000
Knowledgeable .26 .05 5.34 0.000
Friendly .16 .04 4.18 0.000
Pleasant to listen to .22 .05 4.82 0.000
Natural .21 .04 5.11 0.000
Enthusiastic .23 .05 4.75 0.000
Genuine .20 .04 5.34 0.000
Irritating -.13 .04 -3.59 0.000
Uncertain -.22 .05 -4.28 0.000
As shown in Table 2.13 below, in general, lower voices are associated with
desirable characteristics and higher voices are associated with undesirable

46
characteristics. One exception to this pattern is the desirable trait ―enthusiastic‖:
interviewers with higher voices were rated as more enthusiastic. Application of a
Bonferroni correction resulted in significant coefficients for fundamental
frequency as a predictor in six models: those predicting professional,
knowledgeable, pleasant to listen to, natural, irritating, and enthusiastic.
Table 2.13: Predicting Ratings with Interviewer Fundamental Frequency (controlling for exposure length and accounting for clustering by interviewer)
Dependent variable
Coefficient SE Z P
Confident -.002 .001 -1.99 0.047
Professional -.004 .001 -3.88 0.000
Competent -.003 .001 -2.74 0.006
Knowledgeable -.003 .001 -2.89 0.004
Scripted -.001 .001 -1.94 0.05
Pleasant to listen to
-.003 .001 -3.03 0.002
Natural -.003 .001 -3.19 0.001
Genuine -.002 .001 -2.11 0.035
Irritating .003 .001 4.15 0.000
Uncertain .002 .001 2.12 0.034
Enthusiastic .003 .001 3.05 0.002
In summary, the hypothesis that vocal characteristics would have different
relationships with traits on a ―warmth‖ versus a ―competence‖ dimension is not
supported. However, this analysis does show that lower, faster voices are more
appealing than higher and slower voices.
Next, a model using interviewer speech rate and fundamental frequency in
the clip to which listeners were exposed (controlling for length of exposure and
accounting for clustering by interviewer) was constructed to predict likelihood
ratings. An interviewer‘s speech rate was positively associated with higher
likelihood ratings (z=3.09, p=0.002). Similarly, a lower fundamental frequency

47
was a marginally significant predictor of higher likelihood ratings (z=-1.75,
p=0.08). However, neither rate nor fundamental frequency in the exposed clip is
significant in a logistic model predicting contact outcome, which controlled for
length of exposure and accounted for clustering by interviewer.
Importantly, the vocal characteristics discussed here are only measured for
the (often very short) clips of interviewer speech tested in the Web survey. While
work by Benkí et al. (2011) finds higher rates of agreement when the interviewer
speaks at a rate of approximately 3.5 words per second over the course of the
introduction, this finding does not hold in the current study, where only the rate in
the brief introduction excerpt comprising the exposed clip was measured.
2.3.8 Vocal Characteristics: Contrast with Practitioners’ Study
In the practitioners‘ survey, those who indicated that they were responsible for
hiring telephone interviewers were asked to rate the importance of 12 criteria
(again from not very important to extremely important) in their hiring decisions. A
total of 40 individuals responded to this battery.
English language fluency, trainability, and reliability were the most important
hiring criteria, with speaking voice ranked fifth, indicating that it carries moderate
importance in hiring decisions—more so than prior experience or references from
previous employers. This is in surprising contrast to the practitioners‘ view,
shown in Table 2.10, that ―a pleasant speaking voice‖ is perceived to be among
the least important contributors to an interviewer‘s response rate.

48
Table 2.14: Practitioners’ Emphases in Hiring Telephone Interviewers
Mean (sd) % Extremely Important
1 Candidate seems trainable. 3.83 (.38) 85%
2 English language fluency. 3.83 (.43) 88%
3 Candidate seems reliable. 3.80 (.41) 80%
4 Literacy level. 3.78 (.42) 78%
5 Speaking voice. 3.71 (.45) 73%
6 Beliefs about how the individual will interact with respondents and potential respondents.
3.56 (.50) 58%
7 Performance in training exercises. 3.43 (.55) 43%
8 Beliefs about how the individual will get along with other team members.
2.88 (.67) 15%
9 Ability to multi-task. 2.73 (.84) 18%
10 References from previous employers. 2.51 (.78) 13%
11 Professional appearance. 2.46 (.75) 8%
12 Prior experience. 2.37 (.81) 10%
Practitioners who indicated that a candidate‘s speaking voice was
―somewhat‖ or ―extremely‖ important to their hiring decisions were asked to rate
the importance of nine attributes of voice in their hiring decisions. Here, the
impressions conveyed by the voice (professionalism, confidence, enthusiasm,
and knowledge) were considered much more important than vocal characteristics
such as rate, volume, and pitch.
Table 2.15: Importance of Vocal Attributes in Hiring Decisions
Mean % Extremely important
1 Voice conveys confidence. 3.63 (.59) 68%
2 Voice sounds professional. 3.61 (.59) 65%
3 Voice sounds friendly. 3.59 (.55) 60%
4 Voice conveys knowledge. 3.56 (.6) 60%
5 Voice conveys enthusiasm. 3.46 (.64) 53%
6 Voice is pleasant to listen to. 3.32 (.65) 40%
7 How slow or fast the individual speaks (speech rate).
3.20 (.72) 35%
8 How soft or loud the voice sounds (volume).
3.00 (.6) 15%
9 How high or low the voice sounds (pitch).
2.76 (.71) 10%

49
Practitioners‘ low ratings of the importance of vocal characteristics such as
rate and pitch indicate that they may not be aware that these characteristics
actually drive perceptions of characteristics which they deem as important, such
as sounding professional, confident, and enthusiastic.
2.4 Conclusions
This exploratory research has found that survey practitioners believe firmly
that initial impressions of an interviewer are critical to that interviewer‘s success.
These impressions, measured by judges‘ ratings of interviewer characteristics in
a short clip of an early speaking turn by an interviewer in a telephone survey
introduction, align with ratings by different judges, again based on this brief clip,
of whether or not the contact resulted in success.
However, despite practitioners‘ belief that these traits are key to success,
most ratings of interviewer traits such as competence, confidence, and
professionalism based on this brief exposure are not predictive of the ultimate
outcome of the conversation. One exception to this is ratings of scriptedness,
which decrease with interviewer experience and are significant predictors of
contact outcome. This can be an important finding for survey practice, as an
emphasis on decreasing the scripted or ―robotic‖ nature of survey introductions
may well serve to increase response rates. Currently, practitioners do not
recognize scriptedness as detracting from an interviewer‘s success. In fact,
practitioners widely believe that an interviewer‘s ability to follow a script is far
more important than the ability to ―ad lib‖ during an introduction—precisely the
opposite of what the contact-level ratings suggest.

50
The salience of scriptedness compared to other attributes may be due to the
fact that scriptedness is easiest to discern in such a brief exposure, while other
attributes require longer exposure to become apparent. A study which exposes
listeners to longer excerpts of interviewer speech may obtain different results.
It should also be noted that the difference in the importance of scriptedness
between listeners (who considered it very important to success) and practitioners
(for whom this was not as important) may be due to different interpretations of
the word ―scripted.‖ Listeners may have taken this term to mean that an
interviewer sounded more robotic or like she was reading from a script in the
brief excerpt, while practitioners may have been thinking about scriptedness over
the life of a contact. A more ―apples to apples‖ comparison between these two
groups, using different question wording, is necessary to further solidify this
conclusion.
It is important to note that the contacts selected came from a ―shared sample‖
environment, where cases, or households, requiring multiple calls are called back
by multiple interviewers, in contrast to assigning one interviewer to continually
follow up with the same household. In such an environment, some interviewers
who are expert ―refusal converters‖ are assigned difficult cases, where answerers
have repeatedly refused to participate. Such an interviewer may be perceived as
having many positive characteristics, but still have calls which do not result in
agreement, because of the nature of answerers being called.
Additionally, there is the issue of ―hard-core nonrespondents‖ who will not
respond to a survey regardless of what the interviewer says or how she sounds.

51
While these analyses attempted to exclude such individuals by eliminating
invitations in which the answerer hangs up during or directly after the
interviewer‘s first speaking turn, it may be that a higher threshold is needed to
truly rule them out. Some hard-core nonrespondents may stay on the phone
slightly longer, but still have no intention of being persuaded to respond.
The ability of listeners to tease apart the classic person perception
dimensions of ―warmth‖ and ―competence‖ based on brief exposures to an
interviewer‘s speech remains an open question. All ratings of positive
characteristics are highly intercorrelated, indicating that these two dimensions
are correlated with each other and may not be easily discerned. However, slightly
higher correlations among ratings on a ―competence‖ dimension compared to
correlations of characteristics across dimensions, coupled with the finding from a
factor analysis that ―enthusiastic‖ and ―friendly‖ were the only characteristics to
load on a second factor, indicate that these dimensions may in fact be
differentiated in this setting. The finding that practitioners consider these
dimensions differentially important to an interviewer‘s success further indicates
that it may be possible to tease apart ―warmth‖ and ―competence.‖
Finally, vocal characteristics such as rate and fundamental frequency, while
not considered by practitioners to be of tremendous importance in relation to an
interviewer‘s success, are positively associated with not only ratings of
personality characteristics, but also with judges‘ predictions of the likelihood of a
contact‘s success. Interviewers with lower voices and those who spoke faster
were perceived more favorably, and their contacts were judged as more likely to

52
succeed, compared to their slower speaking and more high-pitched counterparts.
Since rate in particular is trainable, this finding could provide a basis for the
recommendation that survey practitioners instruct interviewers to aim for an
optimal rate of speech (3.5 words per second according to Benkí et al. 2011) in
their introductions.
2.5 Limitations and Suggestions for Future Research
This study was not without limitations. First, the raters were not actual
respondents; rather, they heard recordings of the interviewers‘ voices via a Web
survey instead of on the phone. Further, Web survey panel members who served
as raters did not match the United States population in terms of education (81
percent of raters had at least some college education, compared to 55 percent of
the national population, according to the 2010 US Census). Having ―real‖
respondents to a telephone survey rate an interviewer on these characteristics
(perhaps via a Web survey immediately after hearing a survey introduction on the
telephone) could lead to results that more accurately show the relationship
between perceptions of an interviewer and contact outcome. This idea will be
discussed further in Section 4.4.8.
Also, because recordings from actual contacts were used, the length of
exposure varied and was often as short as 2.3 seconds. While there did not
seem to be any differences in results based on exposure length, it is possible
that exposing respondents to only longer excerpts may change the results. For
example, in short exposures, scriptedness may simply be more salient than other
characteristics, but this difference may disappear if longer contacts are used.

53
While scriptedness was a significant predictor of outcome in models
controlling for exposure length and accounting for random interviewer effects, the
possibility exists that the significance of this variable may be due to multiple
testing effects; when a Bonferroni correction was applied, scriptedness was no
longer significant in predicting outcome. If the effect of scriptedness can be
replicated, it can be stated with greater certainty that reducing perceived
scriptedness in survey invitations impacts an interviewer‘s success.
Finally, analyses at the contact level, incorporating only one side of the
conversation, may be unreliable and marred by noise. An interviewer could
receive high ratings on all the ―right‖ characteristics, but still be met with rejection
if a ―hard-core‖ nonrespondent is reached; conversely, an interviewer with low
ratings may still have success on individual contacts with answerers who are less
discerning about the impressions given by their conversational partners.
Interviewer-level analyses could provide greater stability than contact-level
predictions. Given the small number of contacts per interviewer in this dataset (a
mean of 10.4 contacts per interviewer, with only 7 interviewers having 10 or more
contacts), such analyses were not conducted.
A larger study, collecting ratings of characteristics for a larger number of
contacts per interviewer to measure the impact of ratings on overall success
rates, is recommended.

54
Chapter 3: Interviewer Responsiveness
3.1 Introduction
An initial impression of an interviewer as less scripted may be enough to get
his or her foot in the door, so to speak, by keeping an answerer on the phone for
a few additional seconds. However, this first impression in and of itself is likely
not to be enough to guarantee cooperation with the survey request. In this
context, interviewers need to be responsive to answerers throughout the contact.
Survey introduction contacts (defined as consisting of the exchange from the
first ―hello‖ until either the first question of the interview or until the answerer
hangs up) are a unique type of conversation. In most conversations, the
participants are working together toward a common goal (Clark and Schaefer
1989). However, in this instance, they are often oriented toward opposing goals:
the interviewer wants to complete the survey, while the answerer wants to get off
the phone as quickly as possible. I posit that responsiveness on the part of the
interviewer can help an interviewer convert an answerer to the goal of survey
completion.
The exploratory study described in this chapter will address the following
questions:
Are more concerns expressed by answerers who ultimately agree to,
refuse, or defer from survey completion?

55
Do the types of concerns that are most frequently expressed by
answerers differ whether they ultimately agree to, refuse, or defer from
survey completion?
Are answerers more likely to use conversation starters such as
questions or topics not directly related to the task at hand, which give
interviewers an opportunity to tailor or personalize their introductions, if
they ultimately agree, refuse, or defer?
Are interviewers more responsive to concerns and conversation
starters in contacts that result in agreement, refusal, or deferral?
Are interviewers more or less responsive to different types of concerns
(for example, concerns about length versus statements of disinterest)?
Are interviewers consistent in their levels of responsiveness, or does
responsiveness vary for each interviewer between contacts?
Does the association between interviewer scriptedness and ultimate
contact outcome, found in Chapter 2, persist when responsiveness is
included in the models?
I hypothesize that interviewers who are more responsive to answerer
concerns and conversation starters will be more successful in individual
invitations than interviewers who are not. At the same time, I hypothesize that
answerers who are destined for agreement will provide interviewers with more
conversation starters, in the form of peripheral conversation and questions, than
those who ultimately refuse, who will express more concerns. Finally, I
hypothesize that concerns expressed by answerers to calls which result in

56
scheduled callbacks will be predominantly related to the timing of the call, while
answerers who refuse will be more likely to express concerns such as ―I‘m not
interested.‖
The study described in this chapter used a detailed coding scheme to count
and classify opportunities posed by answerers for interviewer responsiveness.
The prevalence of different types of opportunities (both concerns and
conversation starters) across different outcomes (agree, refuse, scheduled
callback) is discussed. This is followed by an explanation of the construction of
an interviewer responsiveness score, where points are added or subtracted
based on the interviewer‘s responses to concerns or conversation starters
presented by the answerer, and the presentation of differing responsiveness
scores for contacts with different outcomes. Interviewer techniques for
addressing particular concerns are also explored. The final two subsections of
results connect this work to the studies described in Chapter 2, by presenting the
results of models predicting contact-level success based on both listeners‘ first
impressions and interviewer responsiveness, and discussing the responsiveness
results in light of the practitioners‘ study detailed in Chapter 2. This chapter
concludes with practical implications and suggestions for future research.
3.2 Data and Methods
The corpus of 1,380 contacts described in Chapter 2 was the basis for
contacts included in this study. All of these contacts were transcribed by speech-
language pathology students at Michigan State University. They transcribed the
interactions at the turn level, where a turn is defined as all the speech by one

57
speaker that occurs before the other speaker begins to talk. Transcripts used
standardized notation to indicate repairs (such as ―Mon-Sunday‖), restarts (―Mon-
Monday‖), and rising intonation. The following example transcript shows two
answerer and two interviewer turns:
Answerer: Hello?
Interviewer: Hello, this is Jane Doe from the University of Michigan.
Answerer: Ok?
Interviewer: Um, you may have gotten a letter from us recently, um, about
a chance for you or someone in your family to earn twenty dollars for
participating in a research study about the economy.
Following transcription, seven undergraduate and graduate (master‘s level)
students in the humanities and social sciences at the University of Michigan
coded the content and paralinguistic behavior in each transcript. Prior to coding
the interaction, coders decomposed each conversational turn into one or more
moves. Good reliability was achieved on both the decomposition and coding
portions of this task (see Appendix 6). A list of 61 mutually exclusive move
descriptions was created, including ―incentive-related question‖ (householder),
―not enough time‖ (householder),‖ ―offer to break interview into pieces‖
(interviewer), ―description of survey‖ (interviewer), and ―backchannel‖ (interviewer
or answerer); see Appendix 7 for a complete list of move codes. The following
hypothetical contact illustrates the kinds of codes (in parentheses) that were
assigned to each move (segment of the transcripts beginning with ―Answerer:‖ or
―Interviewer:‖).
58
Answerer: Hello? (formal greeting)
Interviewer: Hello, (formal greeting)
Interviewer: this is Jane Doe from the University of Michigan. (self-
identification)
Answerer: Ok? (backchannel)
Interviewer: Um, you may have gotten a letter from us recently (follow-up
statement)
Interviewer: about a chance for you or someone in your family to earn
twenty dollars for participating in a research study (incentive related comment)
Interviewer: about the economy. (description of survey)
A subset of these transcribed, coded contacts was used for the study
described in this chapter. As in the listeners‘ study described in Chapter 2,
contacts were excluded if they were conducted by male interviewers; were
conducted as part of the Gujarati Community Study (a study conducted among
members of a particular linguistic and cultural group); or involved the answerer
hanging up during or immediately following the interviewer‘s first turn. A total of
674 contacts met the inclusion criteria; of these, 48 with outcome ―hang up‖ or
―other‖ were excluded, leaving 626 contacts to be analyzed in this chapter. Of
these, 157 had the outcome ―agree,‖ 194 had the outcome ―refuse,‖ and 275 had
the outcome ―scheduled callback,‖ in which an interviewer stated that she or a
colleague would call the household again. Contacts were selected from four
studies: Interests of the General Public (n=45); Mississippi Community Study
(n=12); National Study on Medical Decisions (n=208); and the Survey of

59
Consumer Attitudes (n=361). A total of 58 interviewers were represented in this
dataset.
Additional coding was done on the 626 contacts in this subset to capture two
types of tailoring opportunities expressed by answerers: concerns and
conversation starters. A coding scheme (see Appendix 8) was developed to
classify 13 specific concerns expressed by answerers and responses to the
concerns by interviewers. Common concerns included the timing of the call, the
length of the survey, an inability to hear the interviewer clearly, or lack of interest
in participation. Coding of interviewer moves indicated if the interviewer
addressed a concern with a relevant response.
The examples below (from actual contacts) show (1) a successful interviewer
attempt at responsiveness, and (2) an irrelevant interviewer response to the
answerer‘s concern.
1) Answerer: There's a lot of questions that we probably couldn't even
answer.
Interviewer: Well, it's not a test or anything.
2) Answerer: There's only two of us and my husband's in the shower and
I'm in the middle of making dinner.
Interviewer: Well, this is a very important study.
Concerns may also be related not to the larger survey request but to
characteristics of the call, for example, ―I can‘t hear you,‖ ―You‘re talking too fast,‖
or ―I‘m in a hurry, can we do this quickly?‖ Since both transcripts and audio
recordings were used, in these instances, coders were able to assess

60
interviewers‘ responsiveness not only by what they said (for example, ―I‘ll fix the
headset. Can you hear me now?‖), but also by how they said it, that is, whether
they adjusted their speaking volume or speed. Interviewers who acknowledged a
concern (for example, ―I understand‖ or ―Oh, you‘re busy now?‖) were not
considered to have addressed or offered a solution to a concern.
Concerns can be expressed either as questions, statements, or commands,
as shown in the following examples:
1) Answerer: How long is it going to take?
2) Answerer: Uh, excuse me, I do not speak, uh, really much English.
3) Answerer: Listen, please don't call me. I'm on a Do Not Call list.
Answerers may also present what I will refer to as ―conversation starters,‖
which are moves that are not concerns, but that provide opportunities for
interviewers to give a response that demonstrates their attentiveness. Such
remarks could be phrased as either comments or questions; they could include
observations about the survey task, or they could be peripheral to the task––the
point is that the interviewer can respond in a way that shows she has understood
and thought about the answerer‘s comment. As in any conversation, the
interviewer can ―take the bait‖ and acknowledge these remarks with a relevant
response—what Clark and Schaefer (1989) refer to as ―contributing to
discourse.‖ Interviewers can also fail to effectively respond to answerers‘
conversation starters, either by offering content that is not relevant to what the
answerer has said, or by saying something with no substance, as in example (2)
below. The examples below show a relevant interviewer response to an

61
answerer‘s conversation starter (1) and a missed opportunity to respond to a
conversation starter (2).
1) Answerer: You can just put that everything is way out of control. I work
twelve hours a day to pay for everything.
Interviewer: Well, that‘s why we do want to get your opinions. It is very
important.
2) Answerer: The economy? I don‘t like it and that‘s the end of it.
Interviewer: Oh. Well.
Transcripts were coded and analyzed in Sequence Viewer, which is software
designed specifically to analyze relationships between sequential events. Using
this software allows for analysis not only as to whether one event follows another
(for example, is an answerer‘s concern about the survey length followed by the
interviewer addressing this concern?), but also the lag (in speaking turns)
between events (for example, does the interviewer address the answerer‘s
concern immediately, or are there several intervening turns?). Coders viewed
each contact as a whole and indicated when concerns were addressed or
conversation starters responded to later in a contact. Lag is important for the
analyses in which responding to concerns or conversation starters immediately
after they are uttered (as in the first example below) is given more weight than
doing so later within the exchange (as in the second example below).
1) Answerer: I‘m sorry dear, I‘m on my way out the door.
Interviewer: Ok, we‘ll call back.
2) Answerer: We‘re just about to have dinner.
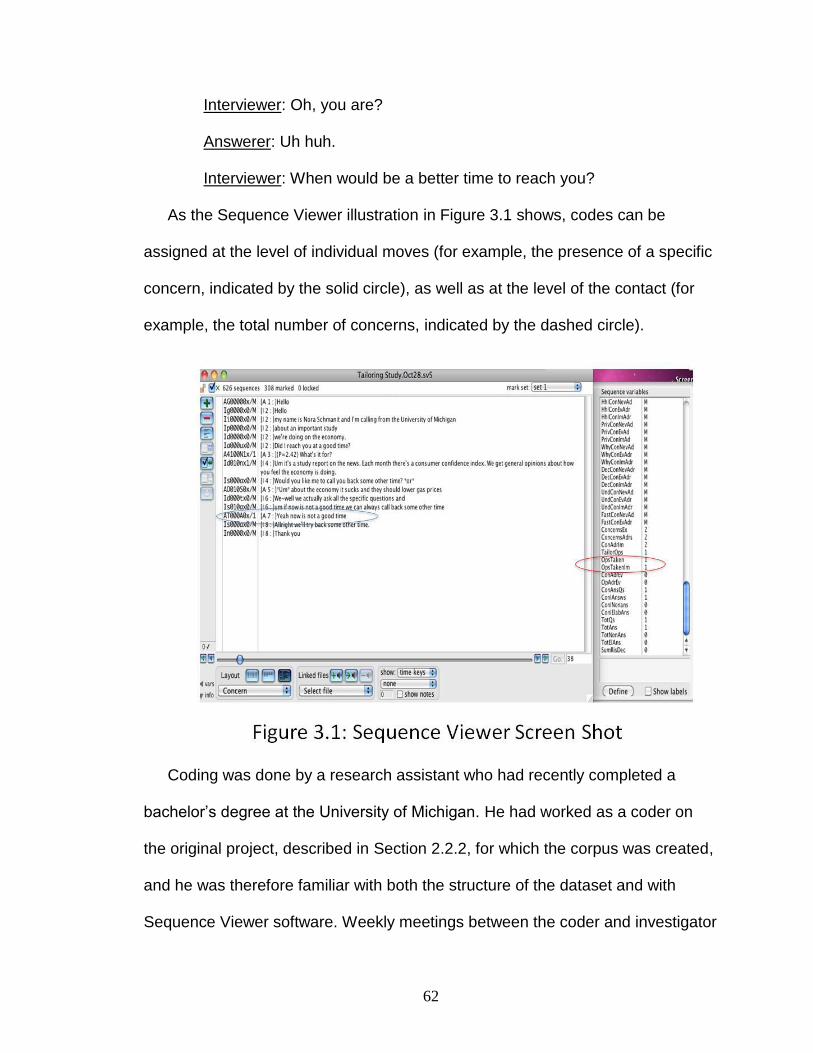
62
Interviewer: Oh, you are?
Answerer: Uh huh.
Interviewer: When would be a better time to reach you?
As the Sequence Viewer illustration in Figure 3.1 shows, codes can be
assigned at the level of individual moves (for example, the presence of a specific
concern, indicated by the solid circle), as well as at the level of the contact (for
example, the total number of concerns, indicated by the dashed circle).
Coding was done by a research assistant who had recently completed a
bachelor‘s degree at the University of Michigan. He had worked as a coder on
the original project, described in Section 2.2.2, for which the corpus was created,
and he was therefore familiar with both the structure of the dataset and with
Sequence Viewer software. Weekly meetings between the coder and investigator

63
allowed for discussion and resolution of questions about the coding scheme, as
well as the ongoing adaptation of the coding scheme. Of the 626 contacts used
in this study, 200 randomly selected contacts (stratified by outcome) were
double-coded by the investigator and coder. Inter-coder reliability was assessed
using Cohen‘s kappa, which ranges from zero to one; Landis and Koch (1977)
characterized kappa values of 0–.20 as slight, .21–.40 as fair, .41–.60 as
moderate, .61–.80 as substantial, and .81–1 as almost perfect agreement.
Using Landis and Koch‘s characterizations, there was substantial inter-coder
reliability (.689) for the variable capturing expression of concerns, conversation
starters, and responses. This variable had 30 possible values: 15 options for
answerer turns (turns could be one of 13 concerns, a conversation starter, or
none of these) and 15 for interviewer turns (a response to one of 13 concerns, a
response to a conversation starter, or none of these). Coders agreed on the
assignment of this code in 80 percent of moves.
There was substantial inter-coder reliability (.674) as to whether a move
contained a conversation starter, and moderate reliability (.485) on coding
whether an interviewer move was a response to a conversation starter. Reliability
between coders as to whether an answerer move contained a concern was
assessed by recoding all 13 ―concern‖ codes into one value and computing
kappa; the value of kappa for this code, .840, was in the range considered
―nearly perfect.‖ Similarly, all 13 ―response to concern‖ codes were collapsed into
one value and a ―substantial‖ kappa (.751) was computed. Values of kappa for
specific and ―umbrella‖ codes are shown in Table 3.1.

64
Table 3.1: Inter-coder Reliability Measures
Number of moves in this category as judged by the primary coder
Kappa
Answerer move is a conversation starter (as opposed to concern or neither of these).
449 .674
Interviewer move is a response to conversation starter (as opposed to a response to a concern or neither of these).
226 .485
Answerer move is a concern (as opposed to a conversation starter or neither of these).
674 .840
Interviewer move is a response to a concern (as opposed to a response to a conversation starter or neither of these).
884 .751
Overall assignment of variable capturing conversation starter/ specific concern/ response/ no conversation starter or response by interviewer or answerer.
6,817 .689
Upon completion of coding, an interviewer responsiveness score was
computed for each contact. This summary measure takes into account the
following elements:
Concerns addressed within one turn (CA1): The number of concerns
expressed by an answerer that are addressed by an interviewer in the
interviewer‘s next speaking turn. I considered this the most responsive
way for interviewers to address concerns, and this ideal receives ―full
credit‖ in the overall score.

65
Concerns addressed later (CAL): The number of concerns expressed by
an answerer that are addressed by an interviewer later in the contact, but
not in the interviewer‘s next turn. This still can be considered responsive,
but not to the same extent as the previous code; it therefore is given less
weight in the calculation of the overall score, earning an interviewer half a
point (whereas an immediate response earns one point).
Concerns never addressed (CNA): The number of concerns expressed by
an answerer that are never addressed by the interviewer. This is
considered detrimental to an interviewer‘s success and is assigned a
score of -1.
Conversation starters addressed within one turn (CSA1): The number of
conversation starters as described above made by an answerer that are
responded to by an interviewer in the interviewer‘s next turn. Just like
concerns, immediately addressed conversation starters earn the
interviewer one point.
Conversation starters addressed later (CSAL): The number of
conversation starters by an answerer that are responded to by an
interviewer later in the contact but not in the interviewer‘s next turn. As in
the concern calculations detailed above, conversation starters addressed
later in the contact are worth half a point.
Conversation starters never addressed (CSNA): The number of
conversation starters made by an answerer that are never addressed by
the interviewer. As with concerns, showing a lack of responsiveness by

66
not addressing these conversation starters is considered detrimental to
the success of a contact; therefore, for each instance of a conversation
starter never addressed, an interviewer‘s score is ―docked‖ one point.
The total number of chances for interviewer responsiveness, calculated as
the sum of all concerns and conversation starters:
CA1+CAL+CAN+CSA1+CSAL+CSNA.
Each contact‘s interviewer responsiveness score, therefore, is the sum of
responses to all concerns and conversation starters over the total number of
concerns and conversation starters. The score is computed as follows:
[(CA1) + (CAL / 2) – (CNA) + (CSA1) + (CSAL/2) – (CSNA)] / [Total number of
concerns + Total number of conversation starters].
Figure 3.2 shows a plot of decomposed interviewer responsiveness scores for
all contacts in this study. The numerator, interviewer responsive behavior, is
computed as [(CA1) + (CAL / 2) – (CNA) + (CSA1) + (CSAL/2) – (CSNA)] and is
shown on the x-axis, while the total number of opportunities (concerns +
conversation starters) is on the y-axis. This plot shows that, in general,
interviewers are able to keep pace with the tailoring opportunities presented by
answerers; the numerator of responsiveness scores increases in tandem with the
number of opportunities. A handful of outliers show the opposite pattern, with low
responsiveness to a high number of opportunities.

67
The structure of the responsiveness score assumes that never responding to
a concern or conversation starter is detrimental to an interviewer‘s success, while
an immediate response is the most effective. Addressing a concern or
conversation starter after some delay is assumed to be somewhat effective, and
half a point was determined to be the fairest value to assign to this type of
response; giving no credit for addressing a concern later would not acknowledge
the potential benefits of eventually addressing the concern, but a later response
is presumably not as helpful as an immediate response and so should not be
assigned as large a value. An alternative option was considered: a ―sliding scale‖
where different fractions of a point would be awarded to a response depending
on how close it was to the concern (a response within 2 turns would get .9 points,
for example, while one addressed 6 turns later would get .5 points). While the
capabilities of Sequence Viewer made it possible to impose this type of structure,
in reality it would not be accurate: sometimes an answerer‘s concern goes on for

68
several turns, with the interviewer offering only backchannels (such as ―mm
hmm‖ or ―I see‖ in intervening turns); in the example below, the interviewer
addresses the concern (―What‘s the study about?‖) as soon as she can without
interrupting the answerer, but in the scheme discussed above, she would only
get ―credit‖ for addressing the concern within three turns.
Answerer: Ok well what––what's the study about?
Interviewer: [breath] Well,
Answerer: I have a thirteen- and a sixteen-year-old.
Interviewer: Uh huh,
Answerer: So what is it that I can help you with? [laughs]
Interviewer: Oh [breath], well, this is, um, just on how people make––
make medical decisions [breath].
3.3 Results
3.3.1 Prevalence of Answerer Concerns
This section describes the range of concerns expressed by answerers, with
particular attention paid to differences across contacts with different outcomes.
While concerns by answerers are common in survey introductions, they range in
content and severity. Concerns are expressed with different frequencies in
contacts with different outcomes.
Figure 3.3 shows the distribution of answerer moves in the dataset. A total of
7,342 answerer moves were coded (an average of 11.73 moves per contact, with
contacts ranging from 4 to 245 moves). Over half (58 percent) of these contained
no opportunity for interviewer tailoring (including answerer backchannels, such

69
as ―uh huh,‖ greetings, and responses to standard interviewer questions, such as
―This is a home‖ or ―There are two adults in this household‖).
A substantial proportion (42 percent) of answerer moves provided an
opportunity for interviewer responsiveness: 15 percent were conversation
starters (described in Section 3.2), and about a quarter (27 percent) were
concerns. This pattern varied depending on the outcome of the contact. While
similar proportions of answerer moves were conversation starters in all outcomes
(agrees 16 percent, refusals 14 percent, scheduled callbacks 16 percent), the
proportion of moves which were concerns varied widely: 43 percent of answerer
moves in refusal contacts were concerns, compared to 26 percent in scheduled
callbacks and just 10 percent in agrees.
Overall, in 85 percent of the 626 coded contacts, answerers expressed some
type of concern about either participating in the study, characteristics of the call
(such as the volume), or the interviewer‘s speech (such as the speed).

70
The likelihood that an answerer will express any concerns varies across
contacts that result in agree, refusal, or scheduled callback. As shown in Table
3.2, close to half of those who ultimately agree express no concerns. In contrast,
when contacts result in scheduled callbacks, the expression of some type of
concern is nearly universal. Concerns are expressed in nearly all refusals as
well.
Table 3.2: Proportion Contacts with One or More Concerns Expressed by Outcome
Proportion contacts with one or more concerns expressed
N
Agree .55 157
Refuse .89 194
Scheduled callback
.99 275
Table 3.3 shows that the mean rate of concerns (number of concerns/
number of answerer speaking turns) is highest for refusals (.35 concerns per
turn) and lowest for agrees (.08 concerns per turn), while scheduled callbacks fall
in the middle (.21 concerns per turn). The rates are significantly different between
agrees and scheduled callbacks (t[430]=-10.41, p<.001) and between scheduled
callbacks and refusals (t[467]=8.57, p<.001). These differences in rates occur
despite the fact that refusal contacts are less than half the length of agrees and
scheduled callbacks. This may be an indicator that refusers tend to express
concerns, but are not swayed by the interviewer‘s response, or they express
concerns that are difficult for the interviewer to address (ease of addressing
different concerns will be discussed further in Section 3.3.5).

71
Table 3.3: Concern Rates by Outcome
Mean concerns expressed (se)
Mean answerer turns (se)
Mean rate of concerns (se)
Agree 1.09 (.10) 13.03 (.61) .08 (.01)
Refuse 1.88 (.10) 6.13 (.37) .35 (.02)
Scheduled callback 2.16 (.10) 13.75 (.78) .21 (.01)
The lower rates of concerns among agreers begs the question as to why
those who agree are so much less concerned than refusers or deferrers. I
explored the possibility that their concerns have already been addressed in prior
calls. Importantly, the only data available concerned call, not contact, number.
While all human-to-human contacts are counted as calls, calls can also
encompass messages left on answering machines, or calls where the household
phone rings but no one answers.
In contacts where the outcome is ―agree,‖ the number of calls does not have
an impact on the number of concerns expressed. Answerers express 1.08
concerns if the contact is the first, second, or third call to their household, and
1.11 concerns if it is at least the fourth call, as shown in Table 3.4. This finding
offers evidence that those who agree are not doing so because their concerns
have been addressed on prior calls; they express the same number of concerns
in later calls as earlier ones.
Table 3.4: Concerns Expressed in Agree Contacts, by Call Number
Call number Mean number of concerns expressed
N (number of contacts)
1-3 1.08 77
4 or greater 1.11 80
Further evidence indicating that call number does not affect the number of
answerer concerns comes from a comparison between agrees and scheduled

72
callbacks. Table 3.5 shows the distribution of call numbers among contacts in
this dataset, and the mean call number, for each outcome, and demonstrates
that the mean call number for agrees is not significantly different from that for
scheduled callbacks (t[430]=.89, p=0.37). This could indicate that some
answerers are simply more inclined to agree and less inclined to express
concerns, an idea which will be discussed further in section 3.3.4.
Table 3.5: Distribution of Call Number by Outcome
Call number Agree Refuse Scheduled callback
Total contacts
1 17% (27) 7% (14) 23% (63) 17% (104)
2 19% (30) 14% (28) 15% (41) 16% (99)
3 13% (20) 10% (19) 9% (25) 10% (64)
4 7% (11) 12% (23) 8% (22) 9% (56)
5 6% (9) 9% (17) 7% (19) 7% (46)
6 or higher 38% (60) 48% (93) 38% (105) 41% (258)
Mean call number
6.88 8.76 6.25 7.19
Total number of contacts in dataset
157 194 275 626
In some cases, scheduled callbacks result from an answerer‘s willingness to
say anything, including agreeing to a future call, in order to get off the phone.
One motivator for these ―false deferrals‖ may be politeness. As Brown and
Levinson (1987) define it, politeness includes allowing one‘s conversational
partner to maintain positive face or ―the want of every [person] that his wants be
desirable to at least some others‖ (p. 322). By allowing interviewers to schedule a
callback they have no intention of honoring, these answerers are being ―polite‖
and pretending that they share the interviewer‘s ―want.‖ The role of politeness will
be discussed further in Section 4.4.7.

73
Just as each contact to a household is assigned an outcome (agree, refuse,
or scheduled callback), the ultimate outcome for each ―case,‖ or household, is
assigned. Analysis at the case level shows that for contacts in the corpus which
are scheduled callbacks, approximately half (56 percent) are nested within cases
where the household ultimately refuses to participate in the survey,
demonstrating the polite ―false deferral‖ phenomenon explained above. At the
same time, close to half (42%) of contacts are in cases where the final outcome
is participation. This supports the position that interviewers should schedule
callbacks whenever possible, and that scheduled callbacks can often be seen as
―salvaged‖ refusals.
3.3.2 Classification of Answerer Concerns
As shown in Table 3.6, the most common concern expressed across all
contacts, regardless of outcome, was that interviewers were calling at an
inconvenient time. Other common concerns included statements of general
disinterest, queries about the length or purpose of the survey, issues related to
the pre-notification letter (such as not receiving or not understanding it), and
issues of comprehension (such as not hearing or understanding the interviewer).
The prevalence of different concerns varied across contacts that resulted in
different outcomes. In contacts where the answerer ultimately agreed to
participate, the most common concern expressed was one which was easily
addressed by interviewers: questions about the purpose or content of the survey.
Among the 272 contacts containing concerns that resulted in a deferral or
scheduled callback, 73 percent contained a concern about the timing of the call—

74
also an issue which interviewers can (and did, as will be shown in Table 3.10)
easily address, by offering to call again later. Indeed, addressing this concern in
this way is what defines a scheduled callback. In contrast, in contacts that
resulted in refusal, only 28 percent contained concerns about the call‘s timing,
while far more (55 percent) contained an expression of disinterest—a concern
which is rarely addressed directly, as will be seen in Table 3.11. Refusers were
also much more likely than deferrers to express concerns about being ―taken off
the list‖ (21 percent versus 1 percent, respectively).
Table 3.6 describes the percentage of concern-containing contacts, by
outcome, that contain each specific concern. Eighty-five percent of all contacts
(531 out of 626) had at least one concern expressed; column 1 shows the
percentage of all concern-containing contacts that contained each concern, while
columns 2–4 show the percentage of concern-containing contacts of each
outcome (agree, refuse, scheduled callback) that contained each concern. Note
that the percentages for individual concerns add up to more than 100 percent,
since most contacts with concerns contained multiple concerns. An average of
2.1 concerns per contact (excluding contacts with no concerns) were expressed,
and 58 percent of contacts with any concerns contained more than one concern.
Table 3.6: Prevalence of Concerns by Outcome in Contacts Containing any Concerns
Concern % all Outcomes(n=531)
% agrees (n=86)
% refusals (n=173)
% SCBs (n=272)
Bad time 39 5 28 73
Not interested 22 2 55 9
Other person not available
19 3 11 35
Length of survey 16 25 5 19

75
Purpose/ content of survey
15 15 13 15
Harassment 7 0 19 2
Pre-notification letter 13 13 8 16
Comprehension (includes hearing/ speed)
10 14 6 12
Do not call list/ take me off list
7 1 21 1
Selection processes 6 4 4 8
Not suitable respondent 4 4 7 3
Other 4 0 6 4
Privacy/ confidentiality 4 4 3 4
Incentive 3 6 <1 2
% OF CONTACTS WITH ANY CONCERN
85 55 89 99
3.3.3 Conversation Starters
Beyond the expression of concerns, answerers often give opportunities for
interviewers to tailor or personalize their conversation or deviate from a
standardized script. I call these ―conversation starters.‖ As Figure 3.3 showed, 15
percent of answerer moves contain conversation starters; while they are less
prevalent than concerns, at least one such conversation starter appears in 54
percent of contacts.
As described in Section 3.2, examples of conversation starters include
questions addressed to the interviewer, conversation peripheral to the task at
hand, and any chance for an interviewer to acknowledge an answerer‘s remark.
Two examples of effective interviewer responses to conversation starters are
below. In the first, the interviewer‘s response to the answerer‘s question show
that she is contributing to discourse, or adhering to conversational norms by
answering a question addressed to her; her second turn, ―Oh, thank you,‖ is an
expression of politeness. In the second, the interviewer‘s response is more
76
substantial and demonstrates attention, adaptation to the answerer‘s comment,
and quick thinking to build rapport with the answerer:
1) Answerer: Um, this is your job right?
Interviewer: Yes sir it is.
Answerer: Oh [laughs] oh, ok well we want you to keep your job.
Interviewer: [laughs] Oh, thank you.
2) Answerer: Just so you know, the next time Nebraska plays Michigan
[laughs] we're going to root for Nebraska even though you're giving us fifty
bucks.
Interviewer: That's all right. I'll root for Nebraska if you do the interview.
How's that?
Conversation starters can also include less overt comments by answerers, as
demonstrated in the following two examples. In both of the examples below, the
answerer responds to a nonstandardized question asked by the interviewer.
However, interviewer responsiveness is different. In the first example, the
interviewer acknowledges the answerer‘s response to her question, showing that
she has heard the answerer. In the second example, the interviewer does not
―take the bait‖ when given an opportunity to tailor her speech to the answerer‘s
response; she does not acknowledge the answerer‘s ―yes‖ but instead moves
right into her introduction:
1) Interviewer: You may have received a letter regarding the study.
Answerer: Uh-huh.
Interviewer: You received a letter?

77
Answerer: Uh, yeah.
Interviewer: Oh, good.
2) Interviewer: We were wondering if you received our letter in the mail?
Answerer: Yes.
Interviewer: Well we're hoping, um, to have a few minutes of your time at
your convenience.
The distribution of conversation starters is very different from the distribution
of concerns. Recall from Section 3.3.1 that nearly all scheduled callbacks and
refusals contained at least one concern, while only 55 percent of agrees did. In
contrast, conversation starters are much more common in agrees. Interviewers
should be aware that while concerns indicate wariness about participation, an
answerer who offers conversation starters seems to be indicating engagement or
interest and may be headed for agreement. Further discussion of these ―green
lights‖ can be found in Section 4.3.
Table 3.7: Proportion Contacts with Conversation Starters by Outcome
Proportion contacts with conversation starters N
Agree .73 157
Refuse .40 194
Scheduled callback
.53 275
Table 3.8 shows that, while the raw number of conversation starters in
refusals is low, the mean rate (computed as number of conversation starters /
number of answerer speaking turns and presented as column three in the table)
is comparable to that in scheduled callbacks. Agrees stand out as having the
highest rate of conversation starters compared to refusals (t [349]=1.92, p=0.03)
and scheduled callbacks (t [430]=3.78, p<0.001).

78
Table 3.8: Conversation Starter Rates by Outcome
Mean (se) conversation starters
Mean (se) answerer turns
Mean rate of conversation starters (se)
Agree 1.59 (.14) 13.03 (.61) .12 (.01)
Refuse .60 (.07) 6.13 (.37) .09 (.01)
Scheduled callback 1.51 (.18) 13.75 (.78) .08 (.01)
3.3.4 Interviewer Responsiveness Scoring
As discussed in Section 3.2, an interviewer responsiveness score for each
contact is computed as follows:
[Concerns addressed immediately + (Concerns addressed later/2) – Concerns
never addressed + Conversation starters addressed immediately +
(Conversation starters addressed later/2) – Conversation starters never
addressed]/ (Total concerns expressed + Total conversation starters)
Thirty-six contacts with no conversation starters or concerns were dropped
from this analysis. In addition, concerns are not counted in this analysis if they
are expressed as the last turn of a contact––that is, if the answerer hangs up
immediately after stating the concern, thus leaving the interviewer no chance to
respond.
Groves and McGonagle (2001) found that interviewers who were trained in
addressing specific concerns were more successful than their counterparts who
did not receive this training. Along these lines, and as discussed in Section 3.1, I
hypothesize that interviewers who are responsive to answerer concerns and
conversation starters will be more successful in individual invitations than
interviewers who are not. This is supported: responsiveness scores are higher for
agrees than refusals (t[315], =12.65 p<0.001). The negative mean

79
responsiveness score for refusals indicates that interviewers are not responding
to concerns or conversation starters in these contacts, either because they are
not performing well or because the concerns presented are difficult to respond to
(such as ―I‘m not interested.‖). However, the highest responsiveness scores are
seen in scheduled callbacks, as shown in Table 3.9. The mean responsiveness
score for scheduled callbacks, .80, is significantly higher than that for agrees, .63
(t[406]=-3.02, p<0.01). The differences in responsiveness scores by outcome
reported here are significant at the (.05/3)= 0.16 level when a Bonferroni
correction is applied.
Table 3.9: Mean Responsiveness Score by Outcome
Mean (se) responsiveness score
Agree .63 (.05)
Refuse -.32 (.05)
Scheduled callback .80 (.03)
The pattern shown above in Table 3.9 indicates that responsiveness does not
necessarily convert answerers to agreement. As shown in Tables 3.3 and 3.5,
answerers to agree contacts are less likely than those to scheduled callbacks to
express concerns, despite having received the same number, on average, of
prior calls. Therefore, it seems plausible that answerers who ultimately agree are
simply more inclined to do so, and that they express fewer concerns for some
reason other than the fact that their concerns have already been addressed. The
reason may be one (or several) of the four categories of reasons for
nonresponse outlined by Groves et al. (2009): the social environment, the
person, the interviewer, or features of the survey design.

80
Although clear cause and effect patterns cannot be established in this study
(could it be that answerers to scheduled callbacks simply more inclined to defer,
and agreers more inclined to participate, regardless of the interviewer‘s
behavior?), it appears that addressing concerns effectively can be a powerful
technique in converting potential refusals to scheduled callbacks—which
ultimately become agrees in future calls close to half of the time, as mentioned in
Section 3.3.1.
Interviewer responsiveness to concerns and conversation starters follows the
same pattern across outcomes. Interviewers are most responsive (to both
concerns and conversation starters) in scheduled callbacks, and least responsive
in refusals. Table 3.10 shows responsiveness scores decomposed into an
―addressing concerns‖ portion, computed as (CA1+(CAL/2)-CAN)/total concerns
expressed, and a ―responding to conversation starters‖ portion, calculated as
(CSA1+(CSAL/2)-CSAN)/total conversation starters.
While responding to conversation starters may be less critical than
addressing concerns, an interviewer‘s overall responsiveness (to both concerns
and conversation starters) is important to the success of a contact.
Table 3.10: Decomposing Responsiveness Scores
Mean (se) Addressing Concerns score
Mean (se) Responding to Conversation Starters score
Agree .76 (.07) .54 (.07)
Refuse -.37 (.06) .10 (.11)
Scheduled callback .86 (.03) .64 (.06)
It should also be noted that responsiveness is a contact-level variable, which
cannot be used to draw conclusions about interviewers in this dataset. Of the 58

81
interviewers represented in this dataset, 32 had at least 10 contacts. For these
32 interviewers, a mean responsiveness score was computed for all of their
contacts; these means ranged from -.18 to .72. The standard deviations for
individual interviewers ranged from.08 to 1.59, with an average value of .74. This
indicates that often, responsiveness scores are not consistent within interviewers
across contacts. It can be concluded that interviewer responsiveness, then, is not
entirely in the hands of the interviewer; it also depends in part on the speech and
the actions of the answerer. Whether an interviewer is responsive to a concern
depends largely on the type of concern presented by the answerer, as will be
discussed in Section 3.3.5; difficult to address concerns such as ―I‘m not
interested‖ or ―I don‘t do surveys‖ are most prevalent in refusals and are
addressed infrequently.
3.3.5 Addressing Specific Concerns
This section explores interviewers‘ responses to specific concerns, with
particular attention paid to answerers‘ statements of disinterest. As shown above
in Table 3.6, the distribution of concerns expressed varies widely by ultimate
contact outcome, with concerns about the timing of the call dominating scheduled
callbacks. Questions regarding the length of the survey are the most frequently
expressed concern among contacts that result in agreement––paralleling the
finding by Schaeffer, Garbarski, Maynard and Freese (2011) that when
answerers ask about interview length, acceptance is more likely––while
expressions of disinterest are the most common concern in refusals.

82
As Table 3.11 shows, concerns are also not only expressed, but are also
addressed, at different rates. For example, while 93 percent of concerns about
the survey‘s length were addressed, only 51 percent of concerns about
prenotification letters were. Additionally, the same concerns are addressed at
different rates across different outcomes. The lower rates of address in refusals
compared to other outcomes (for example, concerns about the Do Not Call list,
pre-notification letters, or not being a suitable respondent) point to the
importance of interviewer responsiveness to answerer concerns.
Table 3.11: Concerns Addressed by Outcome
Concern Total addressed (as % of # expressed)
% addressed in agrees
% addressed in refusals
% addressed in SCBs
Bad time 88 75 53 94
Not interested 6 0 5 12
Other person not available
85 40 63 92
Length of survey 93 97 90 90
Purpose/ content 93 96 88 95
Pre-notification letter
51 60 31 55
Comprehension 82 86 82 78
Do not call list/ take me off list
62 100 35 50
Harassment 5 0 5 0
Not suitable respondent
52 67 31 75
Selection process 71 100 25 95
Privacy/ confidentiality
91 100 80 91
Incentive 94 100 100 83
Other 41 0 25 60
The different responsiveness scores across different outcomes may be
driven by the ease with which an interviewer can respond to different concerns.

83
For example, concerns about call timing or survey length (most common in
agrees and scheduled callbacks, respectively) are relatively straightforward for
interviewers to address:
1) Answerer: But you're calling at a bad time because we have company.
Interviewer: Oh, oh, I see. Is there a better time that we could call back?
2) Answerer: How many minutes is the survey?
Interviewer: It takes maybe ten minutes. It's pretty short.
Sweeping statements of disinterest, such as ―I‘m not interested‖ or ―I don‘t
want to participate,‖ and personal policies such as ―I don‘t do surveys,‖ are much
harder for interviewers to respond to. Because of the small number of personal
policy concerns, all concerns of this nature were coded as ―expression of
disinterest.‖ Such concerns were expressed in 135 contacts and were most
common in refusals, as shown in Table 3.12.
Table 3.12: Distribution of Contacts Containing Statements of Disinterest by Outcome
Outcome % of contacts with this outcome containing statement of disinterest
% of all contacts containing statement of disinterest that have this outcome
Agree 2% 2%
Refuse 55% 79%
Scheduled callback
9% 19%
As shown in Table 3.11, ―not interested‖ concerns are among the least
frequently addressed: only 6 percent of instances of these concerns are
addressed by interviewers. Often, this is because interviewers do not have a
chance to address the concerns: in 26 percent of contacts containing an
expression of disinterest, the answerer did not say anything after the statement

84
of disinterest before hanging up, showing no willingness to react to an
interviewer‘s response. These statements, then, should be interpreted by
interviewers as ―red flags‖ that indicate that unless drastic action is taken, the
contact is about to be terminated.
Statements of disinterest are often presented in combination with another,
more easily addressable concern, and interviewers often default to addressing
these concerns, rather than the answerer‘s lack of interest. In the following
examples, the interviewer chooses to respond to other issues brought up by the
answerers (repeated calls in the first example and a misunderstanding of the
purpose of the call in the second):
1) Answerer: I really don't want to take it. So I need you to take me off the list
or quit calling here because I don't have time to do a survey. I've already
declined. They've called me like three or four times. I told them the last
time that I just wasn't interested in doing it.
Interviewer: Oh, I do apologize ma‘am for all the calls. We are actually
coming to the end of our study and we really do need representation from
your area.
2) Answerer: Yeah well I won't be interested in that. I don't even know what
it's about. And then plus I'm tired of telemarketers calling here.
Interviewer: Oh I completely understand ma‘am. You know a lot of times
we do get confused with telemarketers. We are not telemarketers.
In 21 percent of contacts containing an expression of disinterest, interviewers
seek out an addressable concern by asking why the answerer does not want to

85
participate. Interviewers may do this as a means to establish common ground or
a mutual understanding with the answerer, but Pondman (1998) found that this
type of query prompts answerers to verbalize or repeat their reasons for not
wanting to participate and rarely leads to conversions; interviewers at the
University of Michigan (where all studies in this dataset were fielded) are advised
to ―break the habit of asking what the concerns are‖ (Joe Matuzak, personal
communication, 2011). However, this is not an uncommon technique among
interviewers. Such an approach can be beneficial, as it sometimes prompts the
answerer to express a concern that the interviewer can easily address. Indeed,
among the 28 contacts where interviewers responded to a statement of
disinterest by asking why the respondent did not want to participate, interviewers
managed to turn six (21 percent) of them into scheduled callbacks and one (3
percent) into an agree, often by following their question with a barrage of
information intended to assuage myriad possible concerns, as in this example:
Answerer: Uh, you know, I‘m not interested in that.
Interviewer: Ok, are there any concerns you have? This study is one of the
most important studies in the country. It‘s looked at by the Federal
Reserve Board. Your number was chosen to represent your part of
California and you really can‘t be replaced in the study. It‘s just general
opinion questions.
Answerer: Ok, all right, let‘s do it.
Still, 76 percent of contacts where interviewers responded to a statement of
disinterest by asking answerers to elaborate on their concerns resulted in refusal.

86
This shows not much improvement over the refusal rate of 79 percent in any
contacts where an expression of disinterest was expressed (whether interviewers
responded or not).
Instead of probing for a specific concern, other techniques for responding to
expressions of disinterest included ignoring, acknowledging, or rejecting them, as
in the examples below. It cannot be said with certainty that these responses
improve response likelihood; instead, they are presented as options for
interviewers to consider in lieu of asking disinterested answerers to elaborate on
their concerns.
Here the interviewer bypasses the answerer‘s statement of disinterest and
moves into the household listing:
Answerer: I don‘t think I‘m interested.
Interviewer: We can just do the first part to determine who is eligible and
then after that we can just set up an appointment to call back later. It just
takes two minutes to find out who in your household the computer will pick
to participate. So what‘s your first name?
In the examples below, rather than ignoring the statement of disinterest, the
interviewer acknowledges it directly. Faber and Mazlish (1980) suggest that
acknowledging and naming negative feelings when they are expressed, rather
than rejecting or downplaying them, is an effective tactic for engaging children in
distress; it appears that some interviewers employ this technique with potential
respondents as well:
1) Answerer: Well, I ain‘t interested.

87
Interviewer: I know you‘re saying you‘re not interested, but I‘d be more
than willing to talk about the study with you right now so you can
familiarize yourself with it.
2) Answerer: I just don‘t want to do it is what it comes down to.
Interviewer: Yeah, I understand that part. Right.
Sometimes interviewers offer an explanation as to why the answerer‘s policy
of nonresponse does not apply in this situation, as in this example:
Answerer: I just don‘t like to participate in phone surveys.
Interviewer: Well this is actually not a typical phone survey.
Addressing the lack of interest––that is, treating a statement of disinterest or
a nonresponse policy as a legitimate and addressable concern, rather than
asking answerers to elaborate on the reasons for their disinterest––may help
interviewers to avoid the phenomenon observed in this dataset and discussed by
Pondman (1998), where answerers who are probed to express their reasons for
not wanting to participate are less likely to be converted to agreement. Other
examples of rebuttals to statements of disinterest included:
1) Interviewer: Most people find this a pretty interesting study and this is
really the first time it‘s ever been done.
2) Interviewer: A lot of people who haven‘t wanted to do it did participate in it
and found it quite interesting.

88
3.3.6 Predictions of Contact Length and Outcome using Responsiveness
Score and First Impressions
Recall that the key finding from Chapter 2 was that contacts where
interviewers are rated as less scripted are more likely to result in success. In this
section, I test the hypothesis that contacts where interviewers have both lower
ratings of scriptedness and higher responsiveness scores will be the most likely
to result in agreement. Data from the listeners‘ study discussed in Chapter 2 are
analyzed in conjunction with interviewers‘ responsiveness scores.
Analyses were conducted on a subset of 283 of the 626 coded contacts. All
contacts in this subset were included in the listeners‘ survey described in Chapter
2, where excerpts from the first interviewer turn were rated on twelve personality
characteristics by respondents to a Web survey. All contacts in this subset either
resulted in agreement (n=118) or refusal (n=165).
In two separate logistic regression models, each using a single predictor (both
of which accounted for clustering by interviewers using multilevel, mixed effects
modeling), both ratings of scriptedness (z= -2.59, p=0.010) and an interviewer‘s
responsiveness score (z=8.01, p=0.000) were related to the likelihood of the
contact resulting in agreement. However, when a multiple logistic regression
model was constructed (controlling for interviewer experience and exposure
length in the listeners‘ study, and accounting for clustering by interviewer) using
both scriptedness and responsiveness as predictors of outcome, only
responsiveness was associated with the likelihood of agree, indicating that

89
responsiveness across the entire contact is more important to outcome than
scriptedness in the initial turn. Results from this model are shown in Table 3.13.
Table 3.13: Model Predicting Log Odds of Agree
Coefficient SE Z P
Scripted -.31 .50 -0.62 0.537
Responsive 1.94 .25 7.85 0.000
Experience .0001 .0001 1.06 .291
Exposure length .007 .02 .29 .768
Contact length of the introduction (the number of seconds from the first ―hello‖
until either the hang-up or the first question of the interview) was also used as a
measure of a successful contact. Groves and Couper (1998) observe that
interviewers who are able to prolong interactions will be more likely to have
success, and it was observed in this dataset that the mean length of agree
contacts is 170.69 seconds, significantly longer than that for refusals (48.47
seconds, t[281]=17.25, p<.001). A model predicting contact length was
constructed, with scriptedness and responsiveness as predictors, controlling for
exposure length (the length of the rated excerpt) and interviewer experience
(which is associated not only with contact length, but also likelihood of
agreement) and accounting for clustering by interviewer. Results shown in Table
3.14 mirrored those from the logistic model predicting the likelihood of agreement
described above. An interviewer‘s responsiveness is associated with a longer
contact length, while an initial rating of scriptedness is not.
Table 3.14: Model Predicting Contact Length
Coefficient SE Z P
Scripted 54.28 143.78 0.38 0.706
Responsive 597.01 54.08 11.04 0.000
Experience .026 .04 0.74 .459
Exposure length 11.36 6.17 1.84 0.240

90
When an interaction of scriptedness and responsiveness is added to these
models, it is not significant.
There seems to be a ―tipping point‖ above which ratings of scriptedness have
an impact on not only agreement, but the likelihood that an interviewer will be
responsive. Scriptedness was rated in the listeners‘ study on a six-point scale,
with a median rating of 3.78. At a point slightly below the median, 3.7, we
observe substantial shifts in the impact of scriptedness. Thirty-seven percent of
contacts with scriptedness scores at or above 3.7 result in agreement, compared
to 50 percent of contacts with scriptedness scores below 3.7 (t [281] =2.2,
p=0.03). The difference in agree rates persists when contacts with no tailoring
opportunities are removed from the analysis (high scripted: 35 percent agree, low
scripted: 47 percent agree; t [253]=2.0, p=0.02). When we perform this
comparison by splitting contacts at the median of 3.78, 46 percent of low scripted
and 37 percent of highly scripted contacts result in agreement, a difference which
is not significant (t [253]=.79, p=0.22).
Similarly, comparing contacts with scriptedness ratings above and below 3.7
shows a significantly higher proportion of contacts with high responsiveness
scores (above the median), compared to low responsiveness scores (at or below
the median). Eliminating contacts with no tailoring opportunities, 57 percent of
low scripted contacts have high responsiveness scores, compared to 46 percent
of highly scripted contacts (t [253]=1.6, p=0.05). In comparison, when
scriptedness is split at the median, 52 percent of low scripted and 48 percent of
high scripted contacts have high responsiveness scores (t [253]=.69, p=0.25).

91
This indicates that some interviewers may make use of two techniques (low
scriptedness and high responsiveness) to improve cooperation, while other
interviewers used neither.
The agree rates in Table 3.15 demonstrate that the optimal combination of
behaviors for interviewers is low scriptedness and high responsiveness. At the
same time, it is preferable to be highly scripted and highly responsive than less
scripted and less responsive: among the 55 contacts where interviewers
had a mean scriptedness rating above 3.7 and a responsiveness score at or
above the median score of .083, 62 percent resulted in agreement. In
comparison, among the 85 contacts with high scriptedness ratings (at or above
3.7) and low responsiveness scores (below .083), only 9 percent resulted in
agreement.
Table 3.15: Agree Rates by Scriptedness/Responsiveness Quadrant
Responsiveness
Scriptedness
High Low
High 64% 9%
Low 73% 14%
Interviewers who are less scripted and more responsive are marginally more
successful than those who are more scripted and more responsive (t[154]= .17,
p=0.09). The ideal combination, clearly, is being unscripted and responsive, but
even highly scripted interviewers can redeem contacts by being responsive.
However, the effect of being highly responsive, regardless of level of
scriptedness, is strong: overall, 68 percent of contacts with highly responsive
interviewers resulted in agreement, while 11 percent of contacts where
interviewers received low responsiveness scores did.

92
3.3.7 Comparison to Practitioners’ Study
The importance of responsiveness to an interviewer‘s success was clearly
understood by the 44 survey practitioners surveyed in the study discussed in
Chapter 2. ―The ability to address concerns expressed by potential respondents‖
was considered ―extremely important‖ to an interviewer‘s success by 83 percent
of practitioners surveyed, behind only ―the initial impression an interviewer gives
to sample members (88 percent)‖ and ―professional demeanor when talking to
potential respondents‖ (86 percent). However, when it comes to training,
practitioners seem to underemphasize the importance of addressing concerns
relative to other interviewer skills, mostly related to question administration. Only

93
78 percent of practitioners surveyed reported that ―responding appropriately to
arguments or concerns expressed by potential respondents‖ was a primary
training focus in their organization, in comparison to 98 percent of respondents
who named ―administering interviews‖ and ―importance of data quality‖ as
primary foci, and 93 percent who named ―standardized interviewing skills.‖
Along similar lines, practitioners who had responsibility for interviewer hiring
were asked to rate how important ―beliefs about how the individual will interact
with respondents and potential respondents‖ were to their hiring decision. While
not ranked as highly as ―hard‖ job skills such as English fluency, literacy level,
and speaking voice, nor as highly as attributes such as reliability and trainability,
these perceptions were ―extremely important‖ to 58 percent of practitioners
surveyed. This ranked above a candidate‘s performance in training exercises,
experience, references from previous employers, and beliefs about how the
candidate would get along with other team members.
3.4 Conclusions
This study clearly demonstrates the importance of responsiveness on the part
of a telephone interviewer. Responsive behavior can overcome the negative
effect of first impressions of an interviewer as scripted; even interviewers who are
initially scripted, if they can keep the answerer on the phone, will be more
successful if they are responsive to answerer concerns and conversation
starters.
The work of an interviewer in being responsive varies greatly. Answerers who
ultimately agree tend to express fewer concerns, but make more conversation
94
starters. In contacts that result in refusal, answerers express a relatively high
number of concerns in a shorter time period, and often do not give the
interviewer a chance to respond. Answerers who defer have a similar rate of
concerns to refusers, but they are spread out over a longer contact. Interviewer
responsiveness to concerns plays the greatest role in attaining scheduled
callbacks.
The types of tailoring opportunities (conversation starters and concerns)
expressed by answerers can offer the interviewer a clue as to where the contact
is headed. Concerns about the purpose or content of the survey, or the length of
the interview, are most common in contacts where the answerer ultimately
agrees to participate, as are conversation starters. If an answerer states that the
interviewer has called at a ―bad time,‖ the contact can often be converted into a
scheduled callback, although some wariness about the true intentions of the
deferring answerer is recommended, since over half (56 percent) of households
where a callback was scheduled ultimately refused. Expressions of disinterest or
―personal policies,‖ such as ―I don‘t do surveys,‖ should be viewed as red flags
and handled with caution. Interviewer responses to these concerns are often
ignored and followed or interrupted by hang-ups. In responding to this type of
move, probing for more information or asking the answerer to elaborate on his or
her concerns may not be an interviewer‘s best strategy, as it prompts answerers
to descend into a spiral of negativity. Interviewers may have a better chance of
success if they treat and address ―I‘m not interested‖ as a concern in and of itself,
rather than view it as a symptom of another concern.

95
3.5 Limitations A limit of this study is the lack of clear cause and effect patterns. As
discussed in section 3.3.4, it is impossible to know in an observational study such
as this one if answerers who defer are simply less prone to outright refusal
regardless of interviewers‘ responsiveness, or if it is interviewers‘ responsive
behavior that converts these answerers to scheduled callbacks instead of
refusals.
Another limitation of this work is that it may not be applicable to all surveys.
The contacts in this corpus were selected from five studies conducted at the
University of Michigan and were not intended to be representative of all
telephone surveys.
At the same time, the richness of the qualitative data analyzed here should
be further explored as likely having some relevance for other surveys. While the
content of concerns may differ slightly among, for instance, sample members
from list samples, previous respondents (or nonrespondents) to panel surveys, or
potential respondents to establishment surveys, I suspect that the importance of
an interviewer‘s responsiveness will not change. Future work replicating this type
of methodology on a larger dataset, encompassing contacts from different survey
institutions and types of surveys (such as the examples listed above), could help
to solidify these findings.
Additionally, the analysis including both first impressions and responsiveness
was limited by the data collected in the listeners‘ study. While only agrees and
refusals were analyzed in that study by design (to facilitate cleaner comparisons),

96
future work looking at first impressions and responsiveness in a corpus which
includes scheduled callbacks is recommended.
It is also important to point out the heterogeneous nature of contacts
classified as ―scheduled callbacks.‖ Some of these contacts are genuine
deferrals, where the answerer honestly does not have time and initiates the
callback. Others reflect an interviewer‘s last-ditch effort to save the case, blurting
―We‘ll call you back!‖ even as the answerer hangs up. Analyses of
responsiveness conducted on a more fine-grained division of scheduled
callbacks could be very informative. For example, is ultimate agreement more
likely when an answerer initiates a scheduled callback rather than waiting for the
interviewer to do so, or when an answerer expresses a concern in the form of a
question rather than a statement?
Finally, future work might also look further at the different impact of
responding to concerns versus conversation starters. Even more granular
analysis could look at the impact of addressing versus ignoring particular
concerns, or particular types of conversation starters.

97
Chapter 4: Conclusion
4.1 Introduction
This chapter will summarize the findings from the previous chapters, as well as
discuss practical implications from these studies for survey practice, and make
suggestions for future research on telephone interviewer speech and behaviors.
4.1.1 Review of Methods
This dissertation discussed three studies. The listeners‘ study was a Web
survey conducted among over 3,000 members of a commercial online survey
panel. Listeners heard brief excerpts of interviewer speech from five actual
telephone survey introductions and rated twelve characteristics of the
interviewer. For five other excerpts, listeners rated the likelihood that the contact
resulted in agreement.
The second study, also an online survey, was conducted among research
practitioners, all of whom are responsible for hiring and/or training telephone
interviewers. This study explored practitioners‘ opinions about the attributes of a
successful interviewer, as well as their priorities in hiring and training
interviewers.
Finally, the tailoring study involved detailed coding of the transcripts of
telephone survey introductions, capturing concerns and conversation starters

98
presented by answerers, as well as interviewer responses to both concerns and
conversation starters.
4.2 Summary of Findings
This dissertation was based on a model which proposed that when, excluding
―hard-core‖ nonrespondents, an initial voice which was competent and warm
could get an interviewer ―over the hump‖ of an interaction––that is, past an
immediate refusal. According to this model, after giving a positive initial
impression, an interviewer who was responsive to an answerer would have more
success in persuading the answerer to comply with the survey request. I also
hypothesized that survey practitioners would place emphases on the attributes of
interviewers that were rated highly in successful contacts.
4.2.1 Findings on Distinction of Person Perception Dimensions
Support for my hypotheses was mixed. As discussed in Chapter 2, survey
practitioners believed that characteristics along a ―competence‖ dimension,
including being competent, confident, and professional, were more important to
interviewers‘ success than ―warmer‖ traits, such as being friendly and
enthusiastic. This suggests that common wisdom among practitioners
distinguishes between warmth and competence of interviewers. In contrast, and
also discussed in Chapter 2, judges listening to brief excerpts from the start of
survey introductions did not distinguish between the ―warmth‖ and ―competence‖
dimensions of person perception; instead, ratings of all nine positive
characteristics rated by judges (competent, confident, knowledgeable,
professional, friendly, genuine, enthusiastic, natural-sounding, and pleasant to

99
listen to) were highly correlated, indicating that interviewers who are positively
perceived on one dimension are positively perceived on the other.
4.2.2 Associations Between First Impressions, Vocal Characteristics,
Predicted Outcomes, and Actual Outcomes
For a separate set of five contacts––that is, not the contacts for which they
provided ratings––judges also rated the likelihood that a contact resulted in
success. While ratings of positive characteristics were predictive of other judges‘
ratings of the likelihood that contacts resulted in success, neither these likelihood
ratings nor ratings of any positive characteristics were predictive of the actual
outcome of the contacts (see Chapter 2). This demonstrates that the first
impression of an interviewer may not be the most important determinant to a
contact outcome, despite practitioners‘ belief that ―the initial impression an
interviewer gives to sample members‖ is of high importance to an interviewer‘s
overall success, as are answerers‘ impressions of the interviewer as competent,
confident, genuine, and knowledgeable.
As discussed in Chapter 2, ratings of interviewer characteristics were associated
with vocal characteristics, with interviewers who spoke more quickly and at a lower
pitch in the brief excerpts to which listeners were exposed being rated more highly
on nearly all positive characteristics (the only exception being friendliness, which
was associated with higher pitch). However, in contrast to Benkí, Broome, Conrad,
Groves, and Kreuter‘s (2011) finding that speech rate and fundamental frequency
over the course of an interviewer‘s introduction can affect response likelihood, this

100
study found that interviewer speech rate and pitch in the initial interviewer turn have
no impact on a contact‘s success.
While vocal characteristics and ratings of positive personality characteristics
were both unrelated to contact success, ratings of an interviewer‘s scriptedness
were significantly negatively associated with agreement, indicating that an
interviewer who comes across to the listener as less scripted in the initial
seconds of a contact has a greater chance of success.
4.2.3 Contrast Between Practitioners’ and Listeners’ Studies
The negative association between scriptedness and success discussed in
Chapter 2 contrasted with the dominant belief among survey practitioners that
the ability to follow an introductory script is important to an interviewer‘s success.
Similarly, practitioners placed limited emphasis on training interviewers to ―ad lib‖
or deviate from scripts, but comparatively more importance on training
interviewers to follow introductory scripts, despite literature finding that
interviewers who are allowed to improvise their introductions have more success
than those who are required to follow a verbatim script (Houtkoop-Steenstra and
van den Bergh 2000; Morton-Williams 1993).
Further reflection leads to the conclusion that judges and practitioners may be
perceiving the word ―scripted‖ differently based on the context. In a brief excerpt,
judges‘ ratings of scriptedness are likely based on whether the interviewer
sounds robotic, uses unnatural intonation, or sounds like she is reading. For
survey practitioners, a ―scripted‖ introduction may well be one where the
interviewer touches on all the key points from an introductory agenda: name,

101
affiliation, sponsor, purpose of the study, confidentiality assurance, and incentive.
From this perspective, an interviewer could speak very naturally, and even have
―personalized‖ the script by presenting these elements in her own voice, but by
covering all of these topics, she is deemed to have ―followed the script.‖
Suggestions for future research to resolve this possible conflict between raters
and practitioners will be discussed in Section 4.4.
4.2.4 Interviewer Responsiveness
While an initial impression of an interviewer as non-scripted is important,
findings from the tailoring study discussed in Chapter 3 found that an
interviewer‘s ability to be responsive to an answerer over the course of the
survey introduction is far more important to her success than any initial
impression.
Two components of interviewer responsiveness were explored: addressing
answerer concerns, and responding to conversation starters presented by
answerers. Answerer utterances were coded to indicate if they contained one of
thirteen specific concerns, including ―bad time,‖ ―purpose,‖ or ―not interested,‖ or
provided the interviewer with a conversation starter, either by answering a
question posed by the answerer or engaging in conversation peripheral to the
task at hand. Similarly, codes were assigned to interviewer utterances to indicate
if the interviewer appropriately addressed a concern (for example, by responding
to ―I‘m too busy‖ with ―We can call you back later‖) or ―took the bait‖ and engaged
in conversation when a conversation starter was presented.

102
For each contact, the interviewer received a score reflecting if she responded
to concerns and conversation starters immediately, after a delay, or not at all.
Scores varied by contact outcome, with a negative mean responsiveness score
among refusals and the highest mean responsiveness score in contacts where
the interviewer scheduled a callback.
Analyses revealed that while overall responsiveness by an interviewer is
important, an interviewer‘s ability to address concerns trumps her responses to
conversation starters in persuading an answerer to participate.
4.2.5 Scriptedness and Responsiveness
Interviewers who start out as scripted but are highly responsive as the
answerer raises concerns or presents conversation starters are nearly as
successful as their counterparts who begin with a low level of scriptedness and
then act responsively. Thus, while being less scripted can help interviewers get
past the initial ―hump,‖ in contacts that survive the initial stage, interviewer
responsiveness is crucial to success.
4.3 Recommendations for Telephone Interviewing Practice Based on these
and Other Studies
The findings discussed above, coupled with other findings in the survey
methodology literature, can be applied to the practice of telephone interviewing to
improve response rates. This section will discuss applications of these results for
survey practice.

103
Recommendation #1: Train interviewers to switch gears from
conversational introductions to standardized interviews.
The finding (see Chapter 2) that judgments of an interviewer‘s scriptedness in
the initial seconds of a contact are negatively associated with contact success
should be considered by those responsible for hiring, training, and monitoring
interviewers. Interviewers should be encouraged to make their speech as natural
as possible, through the use of intonation patterns and word selection.
Interviewers can be exposed to contacts with both high and low ratings of
scriptedness to make clear the difference.
While interviewers may be required to mention particular points in their
introduction or even to follow a verbatim introductory script, they should be
trained to sound as conversational as possible, particularly at the start of their
introduction. Both Houtkoop-Steenstra and van den Bergh (2000) and Morton-
Williams (1993) found that interviewers who were allowed to adapt their
introductory script had greater success.
Further, work by Conrad, Broome, Benkí, Groves, Kreuter and Vannette
(2010), which uses the same corpus of introductions from which the introductions
in the listeners‘ study were culled, demonstrates that a moderate use of fillers
such as um and uh by interviewers can lead to greater success—possibly
because these interviewers sound like they are engaged in a natural
conversation, rather than following a script.
It could behoove survey organizations to conduct research around which
elements of speech (increased use of fillers, maintenance of natural intonation

104
patterns, and ―on the spot‖ adaptation of scripts) can be taught, and then to focus
on training interviewers to use these techniques.
Beyond the introduction, the issue of standardized interviewing, and what
departures from verbatim interview scripts can mean for data quality, is the
subject of much debate. Schober and Conrad (1997) and Conrad and Schober
(2000) found clear evidence that ―conversational‖ interviewing, or less rigid
adherence to interview scripts, can enhance data accuracy. Along similar lines,
Dykema, Lepkowski, and Blixt (1997) found that interviewer deviations from
standard question wording had minimal impact on respondents‘ reports. Still,
―reading the questions exactly as worded‖ is a tenet of interview administration
which is upheld and enforced in most survey organizations, and it is clear from
results of the practitioners‘ study that standardized interviewing skills are a high
priority in nearly all organizations. Because emphasizing the need to read
questions in a standardized manner may seem in conflict with emphasis on less
scripted delivery of introductions, interviewers need to be trained to ―wear two
hats.‖ It needs to be made explicit to interviewers that there are two distinct (but,
arguably, equally important) elements of the phone component of their job, each
requiring a different style of speech and interaction. In the introductory or
persuasive portion, scriptedness may be a liability, and the ability to ―think on
one‘s feet‖ to respond to answerers is an asset. In contrast, in the interviewing
portion, deviating from a script may have ramifications for data quality, or at the
very least, will represent a lack of adherence to the organization‘s procedures.
Interviewers should be trained to ―switch gears‖ between these two speech

105
styles, and perhaps even be encouraged to acknowledge to respondents that
their delivery of the questions will sound different from their introduction.
Recommendation #2: Train interviewer speech rates; consider
implementing hiring criteria around vocal pitch.
It may be a worthwhile investment by research organizations to place greater
emphasis on interviewers‘ vocal characteristics. Speech rate in particular is
something that can be trained and monitored. Findings in Chapter 2 indicate that
interviewers who speak faster in the initial excerpt are rated more highly on all
positive characteristics. While speech rate in this initial excerpt was not
associated with the success of a contact, attention should be paid to the work of
Benkí et al. (2011) finding that a rate of 3.5 words per second during the
introduction is ideal in obtaining cooperation. This rate is fast enough to sound
self-assured, but not so fast as to be incomprehensible. Notably, this is higher
than the rate of two words per second, which is often suggested anecdotally as
an ideal speech rate for delivering interview questions. Just as interviewers may
be able to be trained to speak in a less scripted manner during an introduction
and more so during an interview, they can be trained to slow down their speech
noticeably after the introduction. This type of training could be implemented with
the use of software measuring speech rate and displaying it to the interviewer as
she talks (similar to speed clocks which show drivers their current speed);
interviewers could slow down or speed up their speech in response, and
eventually learn how it feels and sounds to speak at a rate of 3.5 (for an
introduction) or 2.0 (for question delivery) words per second.

106
Additionally, while interviewer fundamental frequency in this study was not
related to contact outcome, it was related to perceptions of interviewers. On eight
of nine positive characteristics, female interviewers with lower voices received
higher ratings than their higher-voiced counterparts. Benkí et al. (2011) found
lower pitch over the course of a contact to be associated with success. If further
research can substantiate these findings, survey organizations may want to limit
their hiring to interviewers who are capable of hitting an optimal pitch range (or
avoiding a pitch range which is associated with negative impressions and lower
success).
Recommendation #3: Emphasize responsiveness to answerer concerns.
While scriptedness and vocal characteristics in the initial seconds of a survey
introduction are important (see Chapter 2), it is clear from my tailoring study (see
Chapter 3) that an interviewer‘s ability to be responsive to answerers is
absolutely critical. Practitioners agree that responding to sample members‘
concerns is an important ability of a successful interviewer, and most emphasize
this in training, though not as much as other elements. Practicing by interviewers
of appropriate responses to common answerer concerns should be a top priority
in interviewer training; as Groves and McGonagle (2001) demonstrated,
interviewers trained in effective responding have greater success.
Recommendation #4: Train interviewers to be aware of and respond to both
“red flags” and “green lights” from answerers.
Some answerer comments should be viewed as ―red flags,‖ or warnings that
the contact is about to end. Particular attention should be paid to concerns in the

107
―I‘m not interested‖ category. Interviewers often treat statements in this category
as symptoms of a different concern and, instead of addressing the answerer‘s
stated lack of interest, attempt to uncover a more addressable concern, such as
a lack of time or worries about privacy. Findings by Pondman (1998), and results
discussed in Section 3.3.5, show that asking answerers to elaborate on this type
of remark (as in, ―May I ask why you don‘t want to participate?‖) can have
disastrous consequences, sending the answerer on a tirade of negativity and
leading to hang-ups at comparable rates as when this question is not asked.
Instead, I propose that lack of interest in and of itself can be a legitimate concern,
and not necessarily a symptom of another concern; it should be treated as such
and addressed directly. Still, statements of disinterest often indicate an
impending hang-up and should be treated as red flags by interviewers.
On the other hand, some answerer utterances can be viewed as ―green
lights,‖ or signals that the answerer is open to participating. Questions about the
length or content of the survey are more common in contacts where the answerer
ultimately agrees to participate. Similarly, the presentation of conversation
starters by answerers, such as questions directed at the interviewer or comments
peripheral to the task at hand, are not only more frequent than concerns in agree
contacts, but are much more frequent in agree compared to refusal contacts, and
should be viewed as signs of engagement and likely participation.
Other research has looked at utterances by answerers that may indicate a
greater likelihood of agreement. Work by Conrad et al. (2010), discussed in
Section 4.3, found that answerers who use more backchannels such as ―mm-

108
hmm‖ or ―I see‖ seem to be indicating engagement in the conversation. These
answerers are more likely to agree with the survey request than those who use
fewer backchannels.
Being attuned to green lights in answerer speech, such as backchannels,
questions about length or content, or the presentation of more conversation
starters relative to the expression of concerns, can help interviewers know when
an answerer is likely to agree and adapt their introduction in turn. In such a case,
backing off from a ―hard sell‖ may be recommended; however, it may also be
advisable for interviewers to gently urge the answerer to begin the interview,
rather than schedule a callback.
4.4 Suggestions for Future Research
Future research should be conducted to further this work and increase its
applicability to different practice settings.
4.4.1 Rewording to Clarify Contrast between Listeners and Practitioners
Firstly, the contrast between listeners‘ ratings of interviewer scriptedness and
practitioners‘ opinions about the importance of ―following a script‖ should be
revisited to ensure that this is an ―apples to apples‖ comparison. As discussed in
Section 2.4, practitioners may be thinking about scriptedness over the course of
the whole introduction, possibly in terms of mentioning key points such as name,
affiliation, and sponsor, while listeners are likely to be rating whether an
interviewer sounds robotic or like she is reading. I would recommend repeating
this research using a different word in the listeners‘ study, such as ―robotic,‖ and
asking practitioners to rate the importance to an interviewer‘s success of not only
109
following a script but also ―sounding natural or not robotic in the initial seconds of
an introduction.‖
4.4.2 Exposure to Longer Clips of Interviewer Speech
Another expansion of the listeners‘ study could include setting a higher
threshold for inclusion of interviewer turns. As described in Section 2.2.2, the
minimum amount of interviewer speech required for inclusion of a contact in this
study was a statement of the interviewer‘s name and affiliation. Replicating the
listeners‘ survey with longer excerpts of interviewer speech may show that
characteristics which are not salient to judges during brief excerpts may actually
be so, and may be associated with contact outcome, if they are rated based on a
lengthier exposure. The listeners‘ study used content from actual survey
introductions, and only used the amount of interviewer speech that was uttered
without any intervening speech from the answerer. To extend this, one could
splice together multiple interviewer turns, while still removing any answerer
speech. For example, a typical sequence in many contacts is:
Interviewer: Hello, this is ___ calling from the University of Michigan.
Answerer: Uh huh?
Interviewer: I‘m calling about our nationwide study on the economy.
In the listeners‘ study, judges were only exposed to the first interviewer turn,
but a recommended extension would be to delete the answerer turn and present
the two interviewer turns as one. Including answerer speech could influence
judges to rate contacts based on the exchange (rather than the interviewer‘s
speech) or on how they think the answerer perceives the interviewer (rather than

110
how they themselves perceive her). However, omitting brief answerer turns, such
as backchannels (as in the example above), could expand the amount of
interviewer speech included.
4.4.3 Content Analyses of Interviewer Speech
An additional expansion of the listeners‘ study could include analyses of the
content of the interviewer speech to which answerers are exposed, or at least
controlling for this in models. This information is coded in the existing datasets,
but was not explored at all in these analyses. It may be that mentioning the
incentive in the initial move (which was done in 80 of 283, or 28 percent of
contacts in the listeners‘ study) has more of an effect on response likelihood than
judgments of interviewer characteristics. Further analyses on the same dataset
used in the listeners‘ study could explore the order in which different factors
(incentive, length, sponsor, etc.) are mentioned, and if there is any effect of
earlier mentions of particular factors on response likelihood. Further, this type of
data could offer an interesting comparison with the practitioners‘ study;
practitioners rated as low the importance of ―emphasizing the length of the
survey‖ and ―emphasizing the incentive‖ to an interviewer‘s success.
4.4.4 Interviewer-level Analyses
Replicating the listeners‘ study using a greater number of contacts by the
same interviewers may shed light on those interviewer characteristics or
behaviors across multiple contacts that lead to greater success. Conducting
interviewer-level rather than contact-level analyses would necessitate a larger
and differently structured corpus of contacts (for example, 50 contacts by each of

111
50 interviewers), but could better answer questions about best practices of
interviewers.
4.4.5 Analyses of Variation in Ratings by Rater Characteristics
Another variation in design of the listeners‘ study could focus on how different
raters judge the same contact. Results of this research could inform targeting of
particular groups of respondents by interviewers with particular characteristics.
For example, if it could be determined that men are more sensitive than women
to an interviewer‘s scriptedness, then more experienced interviewers (who tend
to be less scripted, as discussed in Section 2.3.4) could be assigned to call
sample members who are known to be male. Obviously, this application is not
feasible in a random-digit-dial survey, but could be considered when a list sample
indicating gender is used.
Rater characteristics such as age, race, and education could be considered
(implementing this would require a more diverse sample than the one used in the
listeners‘ study). In addition, if both rater and interviewer age are known,
analyses could explore how raters judge interviewers who are older than,
younger than, or the same age as themselves. If there are differences, findings
could be applied to targeted calling of sample members; for example, if it was
known that female judges tend to rate male interviewers who are older than they
are as competent and professional, and are more likely to respond to competent
and professional interviewers, interviewers with these characteristics could be
matched to sample members matching this profile. This may be most applicable
in a list-based or longitudinal survey.

112
4.4.6 Analyses by Different Types of Scheduled Callbacks
An intriguing finding from the tailoring study is that interviewers‘
responsiveness scores are higher in scheduled callbacks than in cases of either
agrees or refusals. This could indicate that by being highly responsive,
interviewers are able to convert possible refusals to scheduled callbacks;
however, further analyses of contacts that resulted in scheduled callbacks are
recommended. Contacts are classified as scheduled callbacks if the interviewer
states that she will call back, but there are several situations where this may
occur: the interviewer and answerer can agree on a time for a subsequent call (a
conversation which can be initiated by either the answerer or the interviewer); the
interviewer can offer to call back as a response to a refusal by the answerer; or
the interviewer can offer to call back to reach a specific household member who
is not home at the time of the call. Repeating the analysis of responsiveness for
each of these types of scheduled callbacks may reveal different levels of
responsiveness in each category. Additionally, incorporating case-level data such
as ultimate outcome and identifiers for all interviewers who had contact with the
household can demonstrate differences among answerers who defer agreement.
Specific questions to be addressed could include:
Is ultimate agreement more likely if an answerer initiates the scheduled
callback (as opposed to an interviewer-initiated callback)?
Is ultimate agreement more likely if an answerer is called back by the
same interviewer, rather than a different interviewer? I would hypothesize
that if a particular interviewer has been accommodating by allowing the

113
answerer to reschedule the interview at their convenience (rather than
imposing at the first call), an answerer might feel obligated to talk to the
same individual in a callback, but would not feel the same obligation to an
unknown interviewer.
4.4.7 Distinguishing True from False Concerns
Another extension of the tailoring study discussed in Chapter 3 might look
at the expression of concerns through the lens of Brown and Levinson‘s (1987)
model of politeness. According to this model, answerers may express concerns
in lieu of simply hanging up. By stating a concern, even if it is false, they are
refraining from threatening the interviewer‘s ―positive face,‖ which Brown and
Levinson define as ―the positive consistent self-image . . . including the desire
that this self-image be appreciated and approved of‖ (p. 323). Concerns may be
genuine, but may also be an ―off the record‖ way of expressing a lack of desire to
participate. Using data on final case outcome, a hypothetical project could
address the following research questions around distinguishing true from false
concerns:
Do paralinguistic elements such as intonation (―I don‘t have time‖ versus ―I
DON‘T HAVE TIME!!!‖) or pauses before stating concerns offer any clues
as to whether the case will eventually become an agree? One hypothesis
might be that an answerer who pauses before offering, ―Call me back
tomorrow,‖ is mentally reviewing his or her schedule, while one who does
not pause is trying to end the call as quickly as possible.

114
Does the content of answerer moves (concrete excuses such as ―I‘m
having dinner‖ as opposed to generic concerns such as ―It‘s a bad time‖)
offer clues as to whether a concern expressed during a scheduled
callback is ―legitimate?‖ I hypothesize that answerers who take the time to
explain their concerns are more likely to be willing to participate than those
who do not.
4.4.8 Collecting Interviewer Ratings in a “Live” Situation
Finally, the possibility should be explored that perceptions of interviewers by
Web survey respondents (judges) are vastly different from the perceptions of
actual answerers to telephone survey requests. In a mixed-mode design, which
would necessitate a rich frame containing both telephone numbers and email
addresses, one could recontact both survey respondents and nonrespondents
immediately after they have heard part or all of a telephone survey interviewers‘
request, and ask for their participation in a brief Web survey in which they would
rate interviewer characteristics. Comparisons of these data to those collected in
the listeners‘ study may show that characteristics are rated differently, and are
differentially important, when contacts are heard in a Web survey compared to
―live‖ on the telephone.
Obviously, it would be difficult to contact and persuade people who have just
refused to participate in a traditional landline telephone survey to then participate
in a Web survey. One remedy for this could be conducting the survey among
mobile device users. After taking (or refusing to take) a brief survey on their
mobile phone, sample members would receive a text message directing them to

115
take a Web survey. To increase the likelihood that nonrespondents to the phone
survey would participate in the Web survey, a sizable incentive could be offered
for participation in a short survey, which would result in high costs for this study.
Another obvious limitation is that a sample of mobile device users is not directly
comparable to the original respondents to the listeners‘ study, although 88
percent of Lightspeed panel members (of whom listeners‘ study respondents are
representative) reported owning a mobile phone.

116
Appendices Appendix 1: Details on Preliminary Studies Preliminary Study 1
Cialdini‘s (1984) Principles of Compliance state that compliance with a
request is more likely if the requester is authoritative (as opposed to
unauthoritative) or likable (as opposed to unlikable). Groves, Couper, and Cialini
(1992) attempted to link Cialdini‘s Principles of Compliance to the survey
participation decision, but could find no evidence that these principles actually
guide a potential respondent‘s decision. Work by van der Vaart et al. (2005) used
factor analysis to derive overall interviewer approaches, which they called
―authority‖ and ―likability,‖ from rated interviewer characteristics such as friendly,
professional, and objective. However, a direct link between perceived authority/
likability and survey participation is a gap in the literature. Therefore, a
preliminary study was developed which intended to use ratings of interviewers‘
authority and likability as predictors of contact outcome.
Objectives and Hypotheses
The first aim of the preliminary study was to test the hypothesis that inter-rater
reliability of judges‘ assessments of authority and likability could be attained. The
literature indicates a precedent for reliable ratings of interviewer characteristics
(Oksenberg and Cannell 1988; van der Vaart et al. 2005), and it was
hypothesized that detailed definitions and instructions would result in reliable
judgments of authority and likability. This preliminary study also had the aim of

117
exploring what personality traits or elements of interviewer speech drive
judges‘ ratings of authority and likability.
Data and Methods
A preliminary data set of 1,215 contacts was stratified by outcome (agree,
refuse, scheduled callback) and by presence or absence of a household listing
(an often lengthy exchange which was excluded from transcription and coding).
Contacts in the top and bottom length quintiles were excluded from the sampling
frame. Additionally, contacts that were outliers in interviewer‘s rates of repairs
(utterances such as ―Sun-Monday‖), restarts (utterances such as ―to-tomorrow‖)
(top 2 percentile), fillers (top 10 percentile) or pauses (top 1 percentile) were
dropped, as were contacts with multiple answerers. After these criteria were
applied to the corpus, 1,084 contacts remained. Contacts were randomly
selected from each stratum; a total of 12 contacts were selected with varying
outcomes (five5 agree, 5 refuse, 2 scheduled callbacks).
A convenience sample of twelve raters (6 males and 6 females, aged 26 to
66) was used. All rated each interviewer‘s authority and likability on a scale from
1 to 7 (full details provided in Appendix 3).
All raters listened to the same 12 contacts; however, to control for order
effects, the order of presentations was varied, with half of the raters hearing one
random order, and half hearing the contacts in reverse order. The design is
summarized below.

118
Design of Preliminary Study 1
Order of questioning
Order of contact presentation Likability-Authority Authority-Likability
Order 1 3 raters 3 raters
Order 2 3 raters 3 raters
Following each contact, a brief, unstructured interview was conducted with
questions probing the drivers of authority and likability ratings. Questions asked
included: ―Why did you choose that number?‖ ―What else helped the interviewer‘s
authority/likability?‖ ―You said the interviewer was _____. Did that help or hurt her
authority or likability?‖ ―What other words would you use to describe the
interviewer?‖
Findings
While ratings of broad concepts such as ―authority‖ and ―likability‖ were not
reliable, qualitative findings were rich and informative as to the characteristics
that influenced ratings of these concepts. Common dimensions were repeatedly
mentioned as drivers of authority (e.g., competent) and likability (e.g., pleasant to
listen to). The concept of tailoring or adaptability was also cited by judges as an
important element in the introductory interaction.
When asked about the interviewer‘s authority, respondents often discussed
the idea of competence, or ―understanding what was going on.‖
“She stated the purpose of the study, she seemed to know what she was
talking about.”
“He didn’t understand what was going on. There were pauses and a few
uhhhs; he sounded scared.”

119
Raters alluded to vocal attractiveness, or the idea that someone was
―pleasant to listen to,‖ and some made links between attractive voices and their
response propensity, stating that they ―wouldn‘t‖ or ―couldn‘t‖ listen to unattractive
voices for an extended period of time.
“He had a nice voice. A nice-sounding voice. That’s really all.”
“Her voice was annoying. I wouldn’t want to listen to her for an hour. It was a
nasally tone, and slow.”
Interviewers‘ responsiveness or ability to adapt to answerers was a common
theme, although it was not consistently associated with authority or likability,
indicating that tailoring is indeed a critical feature of an interview request:
“He sounded like he would work with you. If you asked him something, he’d
do it. That made him likable.”
“When the man made a request, he said he could accommodate it. That
made him more authoritative—he had control over it, he could adjust what would
happen.”
Findings from this study motivate the investigation of specific interviewer
tactics, such as tailoring, and personality traits, rather than broader global
concepts such as authority and likability. At the same time, these findings offer
justification for the hypothesis that a warm and competent interviewer may garner
responses, based on the Authority and Likability heuristics discussed by Cialdini
(1984).

120
Preliminary Study 2
Objectives and Hypotheses
Two small Web surveys were conducted to test the feasibility of rating vocal
attractiveness, and also to perform preliminary analyses testing the hypothesis
that more attractive voices lead to longer contracts.
Data and Methods
Due to budget constraints, the design of these surveys was not elegant.
Potential respondents received an email from the investigator which contained a
link to a survey in Survey Monkey as well as an attached audio file, consisting of
concatenated excerpts from actual contacts. These contacts were selected
through stratified random sampling from a dataset of 496 contacts (all contacts
by female interviewers with at least 10 contacts in the dataset, excluding contacts
from the Gujarati Community Study but including those with only two interviewer
turns), where strata were all contacts conducted by a particular interviewer.
Excerpts from contacts were presented with five seconds of silence between
them. The survey asked respondents to ―please rate each voice's
ATTRACTIVENESS on a scale from 1 (extremely unattractive) to 7 (extremely
attractive).‖
In the first survey, five audio excerpts of the first interviewer turn (typically
along the lines of ―Hello, my name is ____ and I‘m calling from the University of
Michigan about an important economic study‖) were used. These were presented
in two different orders, with half of respondents receiving the first order and half
receiving the second order. Fifteen people responded to this survey.

121
In the second survey, 10 audio excerpts were used. Half of these contained
the first use of ―Hi‖ or ―Hello‖ by the interviewer and half contained the interviewer
saying ―University of Michigan.‖ These were also presented in two different
orders. Eleven people responded to this survey.
Findings
The first study, involving longer exposures but more variable content, resulted
in agreement among respondents that two of the voices were clearly attractive
and three were clearly unattractive. In the second study, although some contacts
clearly fell on one side or the other of the scale, there was greater variance
between respondents. For example, the same contact was rated as unattractive
(1, 2, or 3 on a 7-point scale) by four respondents and attractive (5, 6, or 7) by
four respondents. This result motivates the use of longer exposures (specifically,
the first interviewer turn) in order to obtain greater inter-rater reliability.
In both studies, positive correlations were observed between the average
attractiveness rating and the total number of conversational turns in the contact
(.14 in the first survey and .28 in the second), as well as the number of answerer
turns (.14 in the first survey and .27 in the second), offering support for the
hypothesis that a more attractive voice can lead to longer contacts, but indicating
that there may be an additional component driving length.
Preliminary Study 3
Objectives and Hypotheses
An additional Web survey was conducted to explore the hypothesis that
length is driven not only by attractiveness, but also by competence.

122
Data and Methods
The design of this study was similar to the Web studies in Preliminary Study
2. Potential respondents received an email from the investigator which contained
a link to a survey in Survey Monkey as well as an attached audio file, consisting
of concatenated excerpts from actual contacts. These contacts were selected
from a subset of contacts which included all contacts by female interviewers with
at least 10 contacts in the dataset, excluding contacts from the Gujarati
Community Study and those with only 2 interviewer turns. Contacts were
selected based on length: four from the 25th percentile and four from the 75th
percentile were included.
First turns from contacts were presented with five seconds of silence between
them. The survey asked respondents to ―please rate HOW COMPETENT the
speaker sounds. Use a scale from 1 (not competent at all) to 6 (extremely
competent).‖
These were presented in two different orders, with half of respondents
receiving the first order and half receiving the second order. Eight people
responded to this survey.
Findings
While results were reliable across respondents (average weighted kappa of
.23), the correlation between average competence rating and contact length was
in the opposite direction as expected. Anecdotal feedback from respondents
indicated that there was some uncertainty around the concept of ―competent.‖

123
For this reason, I plan to ask questions about multiple characteristics, including
competent but also including ―professional,‖ ―confident,‖ and ―knowledgeable.‖

124
Appendix 2: Listeners’ Survey
PROGRAMMING INSTRUCTIONS:
EACH RESPONDENT RECEIVES 10 CLIPS: 5 IN PART 2 (LIKELIHOOD PREDICTION) AND 5 IN PART 3 (RATINGS). DO NOT USE THE SAME CLIP FOR BOTH PARTS FOR THE SAME RESPONDENT.
EACH CLIP RECEIVES RATINGS FROM 60 RESPONDENTS: 30 ON PART 2 AND 30 ON PART 3.
RANDOMIZE ORDER OF PRESENTATION OF CLIPS IN EACH PART (I.E., NO CLIP SHOULD CONSISTENTLY BE IN THE SAME POSITION).
I. SCREEN
1. What is your gender?
a. Male b. Female
2. Which of the following categories includes your age?
a. Under 18 [TERMINATE] b. 18-29 c. 30-39 d. 40-49 e. 50-59 f. 60+
3. Would you say that your ability to understand spoken English is… a. Excellent b. Good c. Fair [TERMINATE] d. Poor [TERMINATE]
QC. You will now hear a brief clip of someone speaking, similar to the clips you will hear during this survey. [PLAY CLIP] Which of the following words did you hear? [RANDOMIZE. ALLOW ONE.] 1. Miniature 2. Nightmare 3. Michigan 4. Tennessee 5. Relative
PN: CONTINUE IF PRECODE 3 IS SELECTED.
*SET UP 5 BLOCKS OF RANDOMIZATION (UNDER 5SECS TO MORE THAN 15 SECS)

125
*SELECT 2 FROM EACH BLOCK USING A LEAST QUOTA SET UP. EXAMPLE (RANDOMIZE ORDER): Q4=<5SECS, 5-6.9SECS, 7-9.9SECS, 10-14.9SECS AND >15SECS Q5=<5SECS, 5-6.9SECS, 7-9.9SECS, 10-14.9SECS AND >15SECS
II. LIKELIHOOD PREDICTION
4. You are about to hear the beginning of a few phone conversations. In each, the person speaking wants to convince the person on the other end of the phone to participate in a survey interview. You will only hear one person speaking for between 3 and 30 seconds. Just based on this, please give us your best guess as to HOW LIKELY it is that the person on the other end of the phone WILL AGREE TO PARTICIPATE in the survey. You are free to listen to each recording as many times as you need to, although once might be enough! [RESPONDENTS CAN HEAR MULTIPLE TIMES. CAPTURE NUMBER OF LISTENS FOR EACH CLIP. KEEP INTRO TEXT VISIBLE FOR ALL. PRESENT SCALE INDIVIDUALLY FOR EACH CONTACT, NOT AS GRID; RESPONDENTS SHOULD NOT BE ABLE TO SEE THEIR PRIOR RATINGS.] Second screen: Here‘s the second phone conversation. Please give us your best guess as to HOW LIKELY it is that the person on the other end of the phone WILL AGREE TO PARTICIPATE in the survey. You are free to listen to each recording as many times as you need to, although once might be enough! Third screen: Here‘s the third phone conversation. Please give us your best guess as to HOW LIKELY it is that the person on the other end of the phone WILL AGREE TO PARTICIPATE in the survey. You are free to listen to each recording as many times as you need to, although once might be enough! Fourth screen: Here‘s the fourth phone conversation. Please give us your best guess as to HOW LIKELY it is that the person on the other end of the phone WILL AGREE TO PARTICIPATE in the survey. You are free to listen to each recording as many times as you need to, although once might be enough! Fifth screen: Here‘s the last phone conversation. Please give us your best guess as to HOW LIKELY it is that the person on the other end of the phone WILL AGREE TO PARTICIPATE in the survey.

126
You are free to listen to each recording as many times as you need to, although once might be enough!
Not at all likely
Extremely likely
How likely is it that the person on the other end of the phone will AGREE TO PARTICIPATE in a survey?
1 2 3 4 5 6
III. RATINGS
5. You will now hear the beginning of a few more phone conversations. Again, the person speaking wants to convince the person on the other end of the phone to participate in a survey interview. And again, you will only hear one person speaking for between 3 and 30 seconds. Just based on this, please rate the speaker on the following characteristics. You are free to listen to each recording as many times as you need to, although once might be enough!
Second screen: Here‘s the second phone conversation. Just based on this, please rate the speaker on the following characteristics. You are free to listen to each recording as many times as you need to, although once might be enough! Third screen: Here‘s the third phone conversation. Just based on this, please rate the speaker on the following characteristics. You are free to listen to each recording as many times as you need to, although once might be enough! Fourth screen: Here‘s the fourth phone conversation. Just based on this, please rate the speaker on the following characteristics. You are free to listen to each recording as many times as you need to, although once might be enough! Fifth screen: Here‘s the last phone conversation. Just based on this, please rate the speaker on the following characteristics. You are free to listen to each recording as many times as you need to, although once might be enough!
[ROTATE ATTRIBUTES. ASK ALL FOR EACH OF 5 CLIPS.]
Not at all
Extremely
1 2 3 4 5 6
Confident
Professional
Pleasant to listen to

127
Competent
Knowledgeable
Natural-sounding
Enthusiastic
Genuine
Scripted
Friendly
Uncertain
Irritating
IV. DEMOGRAPHICS
We just have a few more questions for classification purposes.
D1. In which state do you currently reside? AK ID MT RI AL IL NE TN AR IN NV TX AZ KS NH UT CA KY NJ VA CO LA NM VT CT ME ND SD DC MD NC SC DE MA NY WA FL MI OH WI GA MN OK WV IA MO OR WY HI MS PA
NORTHEAST Maine (ME), New Hampshire (NH), Vermont (VT), Massachusetts (MA), Rhode Island (RI), Connecticut (CT).New York (NY), New Jersey (NJ), Pennsylvania (PA) MIDWEST Ohio (OH), Indiana (IN), Illinois (IL), Michigan (MI), Wisconsin (WI) Minnesota (MN), Iowa (IA), Missouri (MO), North Dakota (ND), South Dakota (SD), Nebraska (NE), Kansas (KS) SOUTH Delaware (DE), Maryland (MD), Washington DC, Virginia (VA), West Virginia (WV), North Carolina (NC), South Carolina (SC), Georgia (GA), Florida (FL) Kentucky (KY), Tennessee (TN), Alabama (AL), Mississippi (MS) Arkansas (AR), Louisiana (LA), Oklahoma (OK), Texas (TX) WEST Montana (MT), Idaho (ID), Wyoming (WY), Colorado (CO), New Mexico (NM), Arizona (AZ), Utah (UT), Nevada (NV) Washington (WA), Oregon (OR), California (CA), Alaska (AK), Hawaii (HI)

128
D2. Which of the following best describes your ethnicity or race? White Black or African-American Asian American Indian or Alaskan Native Other ethnic group Prefer not to answer
D3. Are you of Hispanic or Latino origin?
c. Yes d. No
D4. Into which of the following categories does your 2010 household income fall?
a. Less than $30,000 b. $30,000 to $39,999 c. $40,000 to $49,999 d. $50,000 to $59,999 e. $60,000 to $69,999 f. $70,000 to $79,999 g. $80,000 to $89,999 h. $90,000 to $99,999 i. $100,000 or more j. Prefer not to answer
D5. What is the highest level of education you have completed?
a. Less than high school b. High school diploma or GED c. Some college d. College degree e. Some graduate school f. Graduate degree
Thank you for your participation!

129
Appendix 3: Sampling Structure
For each study in the sampling frame, a sample of households, referred to as
―cases,‖ was selected. The sampling frame consisted of all contacts from the five
selected studies (558,695 contacts in total). To select the cases included in the
dataset, the investigators stratified the cases first by interviewer and then by the
outcome of the case‘s first contact. For purposes of stratification by interviewer,
cases were assigned to the interviewer who made the first contact on the case;
100 interviewers have first contacts. For each interviewer, up to eighty cases
were sampled: up to forty cases where the first contact was positive (agreement)
and up to forty cases where the first contact was negative (refusal or ―other
outcome‖). If an interviewer had fewer than forty cases in either stratum, all
cases in that stratum for that interviewer were included. For each sampled case,
all contacts in the case were selected; however, approximately 30 percent of
sampled contacts were not included in the dataset due to random recording
failures.
Forty-one replicates were created. Each of the first forty replicates had all
contacts from two cases (one with a positive first contact and one with a negative
first contact) assigned to each interviewer. An additional replicate, referred to as
the ―take-all‖ replicate, included all contacts from cases where the first contact
was by an interviewer who had fewer than forty positive or negative first contacts.
Cases were assigned to replicates using a systematic selection of cases with a
single random start within each interviewer set. All contacts from the ―take-all‖
replicate and the first four regular replicates were transcribed, coded, and rated.

130
Appendix 4: Practitioners’ Survey
I. SCREEN
1.In which of the following areas do you have decision-making authority? [SELECT MULTIPLE UNLESS C]
a. Interviewer hiring b. Interviewer training c. Neither of these
[TERMINATE IF C TO Q1]
II. ORGANIZATION INFORMATION
2.How many CATI stations does your organization have? [NUMERIC TEXT BOX. INCLUDE NOT SURE OPTION.]
3.What percentage of the telephone interviews conducted by your organization are for[A,B,C MUST SUM TO 100% IF D NOT SELECTED]
a. Government, nonprofit, or academic organizations b. For-profit organizations c. Other d. Not sure
4.Approximately how many telephone interviews did your organization complete during the 2010 calendar year? [SELECT ONE]
a. Fewer than 1,000 b. 1,000–4,999 c. 5,000–9,999 d. 10,000 or more e. Not sure
III. WHAT MAKES A GOOD INTERVIEWER?
5.In your opinion, how important is each of the following to an interviewer‘s response rate, that is, success in obtaining interviews? [ROTATE. SELECT ONE PER ROW.]

131
Extremely important
Somewhat important
Not very important
Not at all important
A pleasant-sounding voice
The ability to convey knowledge about the study
Professional demeanor when talking to potential respondents
The ability to address relevant concerns expressed by potential respondents
The initial impression an interviewer gives to sample members
The interviewer‘s speech rate
How high or low the interviewer‘s voice sounds (pitch)
An interviewer‘s voice that does not sound monotonous (has pitch variability)
The interviewer‘s ability to follow a script during an introduction
The interviewer‘s ability to ―ad lib‖ or deviate from a script during an introduction
Frequency of disfluencies, such as ―um‖ and ―uh‖
How confident the interviewer sounds to potential respondents
How competent the interviewer sounds to potential respondents
How enthusiastic the interviewer sounds to potential respondents

132
How friendly the interviewer sounds to potential respondents
How genuine the interviewer sounds to potential respondents
6.Are there other elements not mentioned above that you think are important to an interviewer‘s response rate? What are they? [OPEN ENDED]
IV. HIRING INTERVIEWERS [ASK THIS SECTION ONLY IF Q1=A] 7. When you are HIRING interviewers, how important are each of the following criteria to your hiring decisions? [ROTATE. SELECT ONE PER ROW.]
Extremely important
Somewhat important
Not very important
Not at all important
English language fluency
Literacy level
Ability to multitask
Performance in training exercises
Speaking voice
Personality
Prior experience
References from previous employers
Candidate seems reliable
Candidate seems trainable
8.Are there other elements not mentioned above that are important criteria to your hiring decisions? What are they? [OPEN ENDED]
9.[IF SPEAKING VOICE IS SOMEWHAT/EXTREMELY IMPORTANT IN Q7] You indicated that a candidate‘s SPEAKING VOICE was [SOMEWHAT/ EXTREMELY] important to your HIRING DECISIONS. How important are each of the following elements of a candidate‘s voice to your hiring decisions? [ROTATE. SELECT ONE PER ROW.]

133
Extremely important
Somewhat important
Not very important
Not at all important
Rate of speaking
Pitch of voice, that is, how high or low the voice sounds
Volume of voice
Voice conveys enthusiasm
Voice conveys confidence
Voice conveys knowledge
Voice sounds professional
Voice is pleasant to listen to
Voice sounds friendly
10.[IF SPEAKING VOICE IS SOMEWHAT/ EXTREMELY IMPORTANT IN Q7] Are there other elements of an interviewer‘s speaking voice not listed above that are important to your hiring decisions? What? [OPEN ENDED]
11.Have you ever, even once, NOT HIRED a candidate for a telephone interviewer position because of their voice? [SELECT MULTIPLE.]
a. Yes b. No
12.[IF Q11=A] You indicated that you have had the experience of NOT HIRING a candidate for a telephone interviewer position because of their voice. What was it about the voice that kept you from hiring the person?
V. TRAINING INTERIEWERS [ASK THIS SECTION ONLY IF Q1=B]
13.For each of the following, please indicate if it is a primary focus, a secondary focus, or not a focus at all in telephone interviewer training. [KEEP 1 AND 2 TOGETHER. ROTATE.]
Primary focus
Secondary focus
Not a focus
Obtaining interviews in general
Obtaining interviews from reluctant respondents (including refusal conversion)
Standardized interviewing skills
Use of CATI system

134
Presenting a confident demeanor
Responding appropriately to sample members‘ arguments or concerns
Developing knowledge about the study
Being able to answer questions about the study or organization
Importance of data quality
Following introductory scripts
Developing a personalized or non-scripted introduction
Recruiting respondents
Administering interviews
14.Are there other elements of interviewer training that are PRIMARY FOCUSES in your organization? What are they? [OPEN ENDED]

135
Appendix 5: Email Request Sent to Practitioners
Dear Colleague,
My name is Jessica Broome and I am a PhD candidate in Survey
Methodology at the University of Michigan. I am conducting research on
telephone interviewers and would love to hear the thoughts of an individual in
your organization responsible for hiring and training telephone
interviewers. I hope you can contribute 15 or 20 minutes of your time to
complete a brief survey. It can be found
at http://umichisr.qualtrics.com/SE/?SID=SV_3wJBdT1iLeNGuQ4. If someone
other than you is better suited to answer questions about hiring and training
telephone interviewers in your organization, I hope you will forward this message
to him or her.
Responses will never be linked to the identity of the respondent or their
organization! However, if you would like to receive a copy of the results, please
provide your contact information at the end of the survey.
If you have any questions, please feel free to contact me at
[email protected] or my advisor, Dr. Frederick Conrad,
My sincere thanks for your time and participation.
Warmly, Jessica Jessica Broome PhD Candidate Michigan Program in Survey Methodology

136
NOTE: This email was sent to all members of the sampling frame using the
blind copy function. However, because too many characters were entered into
the blind copy field, most recipients received the message multiple times (reports
indicated some respondents receiving as many as 93 copies of the survey
invitation).
Thirty-seven recipients emailed the investigator, with messages ranging from
concerned to irate. That day and the next, individual apologies were sent to all
message recipients individually, explaining the situation and urging them to
consider participating. Of these, five emails failed; three people responded and
explained that they had no research staff; and one responded that he was not
interested.

137
Appendix 6: Details on Reliability of Initial Move Coding
Two subsets of twenty contacts (audio recordings and transcripts) were
randomly selected for a reliability test among the five coders who coded more
than 90 percent of the contacts. Because decomposing turns into moves is itself
a judgment about which there can be disagreement, we tested two subsets of
contacts in order to measure agreement with and without the ―turn
decomposition‖ task. One subset of contacts was presented to the coders with
transcripts in their original form, that is, not broken into moves. A second subset
of twenty contacts for which the transcripts had already been broken into moves
was coded by all five coders and tested for reliability. Each of the five coders
decomposed the turns in the first subset of twenty contacts into moves and
assigned codes to each move. Weighted kappa, as opposed to simple kappa,
was used to measure reliability because with the multivariate coding system, the
chances of perfect agreement on 28 variables is very remote; weighted kappa
takes into account the complexity of the coding structure and essentially gives
―partial credit.‖ Weighted kappa for each pair of coders ranged from .53 to .93,
mean = .74. For the second set of twenty contacts (already structured by moves)
weighted kappas ranged from .77 to .86, mean = .82. We interpret these scores
as indicating strong agreement among coders.

138
Appendix 7: Move Codes Answerer: 1: Expression of enthusiasm (I was waiting for your call). 2: Expression of interest. 3: Acknowledge interviewer (I know it‘s you). 4: Request clarification. 5: Suspicion or misunderstanding of purpose (I don‘t want to buy anything, take me off your list). 6: Past experience with research (I did a survey last week). 7: UM-related. 8: Expression of disinterest. A: Statement of ambivalence. B: General confirmation (Yes, that‘s right). C: Contact information/ confirmation (This is a home). D: Duration question (How long will this take?). E: Duration comment. F: Follow-up comment (My wife said you called). G: Formal greeting (Hello). H: Answer to household roster question. I: Self-Identification (This is Mike). J: Informal greeting. K: Follow-up question (Didn‘t you call before?). L: Procedural question (How does the randomization work?). M: Incentive question. N: Not interested but not explicit refusal. O: Other. P: Willing to participate. Q: Procedural comment. R: Explicit refusal. S: Scheduling statement (10:00 would be fine). T: Not enough time. U: Backchannel. V: Incentive comment. X: Scheduling question. W: Personal conversation—non-interview related. Y: Request for identification (Who is this?). Z: Eligibility-related (This is not my home).

139
Interviewer: 9: first question of interview. a: indirect invitation. b: direct invitation. c: contact information/ confirmation (Have I reached you at . . .). d: description of survey (This survey helps us understand what people think about the US economy). e: why not participate. f: follow-up: any (reference past call, other household member, or object). g: formal greeting. h: household listing statement/question (How many adults live in this household? The computer is going to choose the person I need to speak with). i: self-identification. j: informal greeting. k: duration comment. l: apology. m: incentive-related. n: expression of gratitude. o: other. p: persuasive statement (Your opinions are very important to us.). q: establishing legitimacy (You can visit our Web site). r: procedural information (This call may be recorded for quality control). s: scheduling statement (Is there a better time?). t: break into pieces (We can just do a few questions). u: backchannel. v: general confirmation. w: sweetening the pot (Now I can offer you $20 . . .). x: personal conversation—non-interview related. y: acknowledge imposition (I know it is late/ It sounds like you‘re busy). z: scarcity reference (There are only two days left).

140
Appendix 8: Tailoring Study: Coding Scheme Variable: TailorMove Answerer codes: 0: no tailoring or tailoring opportunity. A: concern: time. B: concern: incentive. C: concern: don‘t know anything / not suitable respondent (I don‘t have insurance/ I don‘t know anything about that). D: concern: privacy/confidentiality. E: concern: hearing. F: concern: sick. G: concern: other person needs to be involved in decision. H: concern: don‘t understand. I: concern: too fast. J: concern: letter. K: concern: not interested. L: concern: do not call list/ take me off list (includes How did you get this number). M: concern: don‘t want to buy anything. N: concern: purpose/ content. O: concern: other. P: concern: other person (not interested/ not available). Q: concern: length. R: concern: household listing. S: conversation starter. T: concern: why was this number selected. U: concern: harassment.

141
Interviewer codes: a: address concern: time. b: address concern: incentive. c: address concern: don‘t know anything/ not suitable. d: address concern: privacy/ confidentiality. e: address concern: hearing (INCLUDES PERCEIVED INCREASE IN VOLUME). f: address concern: sick. g: address concern: other person needs to be involved in decision. h: address concern: don‘ t understand. i: address concern: too fast (INCLUDE JUDGED CHANGE IN SPEED). j: address concern letter. k: address concern not interested. l: address concern: do not call list/ take me off list. m: address concern: don‘t want to buy anything. n: address concern: purpose/ content. o: address concern: other. p: address concern: other person (not available/ not interested). q: address concern: length. r: address concern: hhl. s: reference earlier call with specifics. t: response to A question or comment. u: answerer-centric remark (address A by name; is this a good time). v: acknowledge concern without addressing (oh absolutely or yes i see). w: address concern: why household selected. x: address concern: harassment.

142
References
Ambady, Nalini, Mary Anne Krabbenhoft, and Daniel Hogan. 2006. ―The 30-
Second Scale: Using Thin-Slice Judgments to Evaluate Sales Effectiveness.‖
Journal of Consumer Psychology 16(1):4–13. Ambady, Nalini, and Robert Rosenthal. 1992. ―Thin Slices of Expressive Behavior as Predictors of Interpersonal Consequences: A Meta-Analysis.‖ Psychological Bulletin 111:256–274. Asch, Solomon E. 1946. ―Forming Impressions of Personality.‖ Journal of Personality and Social Psychology 9:283-294. Bartsch, Silke. 2009. ―‗What Sounds Beautiful is Good?‘ How Employee Vocal Attractiveness Affects Customer‘s Evaluation of the Voice-To-Voice Service Encounter.‖ Aktuelle Forschungsfragen im Dienstleistungsmarketing: 45-68. Benkí, José, Jessica Broome, Frederick Conrad, Robert Groves, and Frauke Kreuter. 2011. Effects of Speech Rate, Pitch, and Pausing on Survey Participation Decisions. Paper presented at the 66th annual conference of the American Association for Public Opinion Research, Phoenix, AZ, May 14. Berry, Diane S., Jane S. Hansen, Julie C. Landry-Pester, and Jo A. Meier. 1994. ―Vocal Determinants of First Impressions of Young Children.‖ Journal of Nonverbal Behavior 18:187–197. Blom, Annelies G., Edith de Leeuw, and Joop Hox. 2010. ―Interviewer Effects on Nonresponse in the European Social Survey.‖ MEA Discussion Paper No. 202-10. http://ssrn.com/abstract=1663704 Brennan, Susan E., and Maurice Williams. 1995. ―The Feeling of Another‘s Knowing: Prosody and Filled Pauses as Cues to Listeners about the Metacognitive States of Speakers.‖ Journal of Memory and Language 34(3):383–398. Brown, Penelope, and Stephen C. Levinson. 1987. Politeness: Some Universals in Language Usage. Cambridge, UK: Cambridge University Press. Campanelli, Pamela, Patricia Sturgis, and Susan Purdon. 1997. Can You Hear Me Knocking: An Investigation into the Impact of Interviewers on Survey Response Rates. London: National Center for Social Research. Chartrand, Tanya L., and John A. Bargh. 1999. ―The Chameleon Effect: The Perception-Behavior Link and Social Interaction.‖ Journal of Personality and Social Psychology 29:211–221.

143
Cialdini, Robert B. 1984. Influence: Science and Practice. New York: Harper Collins. Clark, Herbert H., and Edward F. Schaefer. 1989. ―Contributing to Discourse.‖ Cognitive Science 13:259_294. Conrad, Frederick, Jessica Broome, José Benkí, Robert Groves, Frauke Kreuter, and David Vannette. 2010. To Agree or Not to Agree? Impact of Interviewer Speech on Survey Participation Decisions. Paper presented at the 65th annual conference of the American Association for Public Opinion Research, Chicago, IL, May 2010. Conrad, Frederick G., and Michael F. Schober. 2000. Clarifying Question Meaning in a Household Telephone Survey. Public Opinion Quarterly 64:1–28. Curtin, Richard, Stanley Presser, and Eleanor Singer. 2005. ―Changes in Telephone Survey Nonresponse over the Past Quarter Century.‖ Public Opinion Quarterly 69(1): 87–98.
Dion, Karen K., Ellen Berscheid, and Elaine Walster. 1972. ―What is Beautiful is
Good.‖ Journal of Personality and Social Psychology 24:285–290. Durrant, Gabriele B., Robert M. Groves, Laura Staetsky, and Fiona Steele. 2010. ―Effects of Interviewer Attitudes and Behaviors on Refusal in Household Surveys.‖ Public Opinion Quarterly 74(1):1–36.
Dykema, Jennifer, James M. Lepkowski, and Steven Blixt. 1997. ―The Effect of Interviewer and Respondent Behavior on Data Quality: Analysis of Interaction Coding in a Validation Study.‖ In Survey Measurement and Process Quality, ed. Lars E. Lyberg, Paul Biemer, Martin Collins, Edith de Leeuw, Cathryn Dippo, Norbert Schwarz, and Dennis Trewin, pp. 311–330. New York: Wiley.
Faber, Adele, and Elaine Mazlish. 1980. How to Talk So Kids Will Listen & Listen
So Kids Will Talk. New York: Harper Collins. Fiske, Susan T., Amy J. C. Cuddy, and Peter Glick. 2007. “Universal Dimensions of Social Cognition: Warmth and Competence.‖ Trends in Cognitive Science 11: 77–83. Gelinas-Chebat, Claire, and Jean-Charles Chebat. 1992. ―Effects of Two Voice Characteristics on the Attitudes toward Advertising Messages.‖ The Journal of Social Psychology 132: 447–459.

144
Giles, Howard, Justine Coupland, and Nikolas Coupland. 1991. Contexts of Accommodation: Developments in Applied Sociolinguistics. Cambridge, UK: Cambridge University Press. Groves, Robert M., and José R. Benkí. 2006. 300 Hellos: Acoustic Properties of Initial Respondent Greetings and Response Propensities in Telephone Surveys. Paper presented at the 17th International Workshop on Household Survey Nonresponse, Omaha, Nebraska, August 2006. Groves, Robert M., and Mick P. Couper. 1998. Nonresponse in Household Interview Surveys. New York: John Wiley and Sons. Groves, Robert M., Mick P. Couper and Robert Cialdini. 1992. ―Understanding The Decision to Participate in a Survey.‖ Public Opinion Quarterly 56(4): 475–494. Groves, Robert M., and K. McGonagle. 2001. ―A Theory-Guided Interviewer Training Protocol Regarding Survey Participation.‖ Journal of Official Statistics 17:249–265. Groves, Robert M., Floyd J. Fowler, Jr., Mick P. Couper, James M. Lepkowski, Eleanor Singer, and Roger Tourangeau. 2009. Survey Methodology. Hoboken, NJ: Wiley. Groves, Robert M., Barbara C. O‘Hare, Dottye Gould-Smith, José Benkí, and Patty Maher. 2007. ―Telephone Interviewer Voice Characteristics and the Survey Participation Decision.‖ In Advances in Telephone Survey Methodology, ed. James M. Lepkowski, Clyde Tucker, J. Michael Brick, Edith D. de Leeuw, Lilli Japec, Paul J. Lavrakas, Michael W. Link, and Roberta L. Sangster, pp. 385–400. New York: Wiley. Groves, Robert M., Stanley Presser, and Sarah Dipko. 2004. ―The Role of Topic Interest in Survey Participation Decisions.‖ Public Opinion Quarterly 68(1): 2–31.
Hecht, Marvin A., and Marianne LaFrance. 1995. ―How (Fast) Can I Help You? Tone of Voice and Telephone Operator Efficiency in Interactions.‖ Journal of Applied Social Psychology 25:2086–2098. Houtkoop-Steenstra, Hanneke, and Huub van den Bergh. 2000. ―Effects of Introductions in Large-Scale Telephone Survey Interviews.― Sociological Methods and Research 28(3):281–300. Hox, Joop, and Edith D. de Leeuw. 2002. ―The Influence of Interviewers‘ Attitude and Behavior on Household Survey Nonresponse: An International Comparison.‖ In Survey Nonresponse, ed. Robert M. Groves, Don A. Dillman, John L. Eltinge, and Roderick J. A. Little, pp. 103-120, New York: John Wiley and Sons.

145
Huefken, Volker, and Anne Schaefer. 2003. ―Zum Einfluss Stimmlicher Merkmale und Ueberzeugungsstrategien der Interviewer auf die Teilnahme in Telefonumfragen.― Koelner Zeitschrift fuer Soziologie und Sozialpsychologiei 55(2):321–339. Jones, Edward Ellsworth. 1990. Interpersonal Perception. New York: Freeman. Kelley, Harold H. 1950. ―The Warm-Cold Variable in First Impressions of Persons.‖ Journal of Personality 18:431–439.
Ketrow, Sandra M. 1990. ―Attributes of a Telemarketer‘s Voice and Persuasiveness: A Review and Synthesis of the Literature.‖ Journal of Direct Marketing 4:7–21.
Landis, J. Richard and Koch, Gary G. 1977. "The Measurement of Observer
Agreement for Categorical Data.‖ Biometrics 33 (1): 159–174.
Maddux, James E., and Ronald W. Rogers. 1980. ―Effects of Source Expertness,
Physical Attractiveness, and Supporting Arguments on Persuasion: A Case of
Brains Over Beauty.‖ Journal of Personality and Social Psychology 39:235–244.
Maynard, Douglas W., Jeremy Freese, and Nora Cate Schaeffer. 2010. ―Calling
for Participation: Requests, Blocking Moves, and Rational (Inter)action in Survey
Introductions.‖ American Sociological Review 75:791–814.
Morton-Williams, Jean. 1993. Interviewer Approaches. Cambridge, UK: Cambridge University Press. Oksenberg, Lois, and Charles Cannell. 1988. ―Effects of Interviewer Vocal Characteristics on Nonresponse.‖ In Telephone Survey Methodology, ed. Robert M. Groves, Paul B. Biemer, Lars E. Lyberg, James T. Massey, William L. Nichols II, and Joseph Waksberg, pp. 257–272. New York: John Wiley and Sons. Oksenberg, Lois, Lerita Coleman, and Charles Cannell. 1986. ―Interviewers‘ Voices and Refusal Rates in Telephone Surveys.‖ Public Opinion Quarterly 50(1):97–111. O‘Muircheartaigh, Colm, and Pamela Campanelli. 1999. ―A Multilevel Exploration of the Role of Interviewers in Survey Non-Response.‖ Journal of the Royal Statistical Society Series A 162(Part 3):437–446. Pondman, Lisette Maria. 1998. ―The Influence of the Interviewer on the Refusal Rate in Telephone Interviews.‖ Ph.D. dissertation, Vrije Universiteit, Amsterdam.

146
Rosenberg, Seymour, Carnot Nelson, and P. S. Vivekananthan, P. S. 1968. ―A Multidimensional Approach to the Structure of Personality Impressions.‖ Journal of Personality and Social Psychology 9:283–294. Sanchez, D. 1985. ―When Your Company Speaks, Do People Listen?‖ Telemarketing (July): 70–72. Schaefer, Nora Cate, Dana Garbarski, Douglas W. Maynard, and Jeremy Freese. 2011. ―Interactional Environments, Requests, and Participation in the Survey Interview.‖ Paper presented at the annual meeting of the American Association for Public Opinion Research, Phoenix, Arizona, May 2011. Schober, Michael F., and Frederick G. Conrad. 1997. ―Does Conversational Interviewing Reduce Survey Measurement Error?‖ Public Opinion Quarterly 61: 576-602. Sharf, Donald J., and Mark E. Lehman. 1984. ―Relationship Between the Speech Characteristics and Effectiveness of Telephone Interviewers.‖ Journal of Phonetics 12(3): 219–228. Singer, Eleanor, Martin R. Frankel, and Marc B. Glassman. 1983. ―The Effect of Interviewer Characteristics and Expectations on Response.‖ Public Opinion Quarterly 47(1): 68–83. Smith, Stephen M., and David R. Shaffer. 1995. ―Speed of Speech and Persuasion: Evidence for Multiple Effects.‖ Personality and Social Psychology Bulletin 21: 1051–1060. Snijkers, Ger, Joop Hox, and Edith D. de Leeuw. 1999. ―Interviewers‘ Tactics for Fighting Survey Nonresponse.‖ Journal of Official Statistics 15(2):185–198. Steinkopf, Leander, Gerrit Bauer, and Henning Best. 2010. ―Nonresponse in CATI-Surveys.― Methods, Data, and Analysis 4(1):3–26. Teitler, Julien O., Nancy E. Reichman, and Susan Sprachman. 2003. ―Costs and Benefits of Improving Response Rates for a Hard-to-Reach Population.― Public Opinion Quarterly 67:126–138. United States Census Bureau. 2010. ―Educational Attainment.‖ http://www.census.gov/hhes/socdemo/education/data/cps/2010/tables.html. Van der Vaart, Wander, Yfke Ongena, Adriaan Hoogendoorn, and Wil Dijkstra. 2005. ―Do Interviewers‘ Voice Characteristics Influence Cooperation Rates in Telephone Surveys?‖ International Journal of Opinion Research 18(4):488–499.

147
Zuckerman, Miron, Richard S. Defrank, Judith A. Hall, Deborah T. Larrance, and Robert Rosenthal. 1979. ―Facial and Vocal Cues of Deception and Honesty.‖ Journal of Experimental Social Psychology 15:378-396. Zuckerman, Miron, and Robert E. Driver. 1989: ―What Sounds Beautiful is Good: The Vocal Attractiveness Stereotype.‖ Journal of Nonverbal Behavior 13:67-81. Zuckerman, Miron, Holley Hodgins, and Kunitate Miyake. 1990: ―The Vocal Attractiveness Stereotype: Replication and Elaboration.‖ Journal of Nonverbal Behavior 14:97–112. Zuckerman, Miron, and Kunitate Miyake. 1993. ―The Attractive Voice: What Makes it So?‖ Journal of Nonverbal Behavior 17:119–135.


