Vmware 2015 with vsphereHigh performance application platforms
140
Emad Benjamin VMware High Performance Application Platforms CPV4202
-
Upload
solarisyougood -
Category
Technology
-
view
543 -
download
1
Transcript of Vmware 2015 with vsphereHigh performance application platforms

Emad Benjamin
VMware
High Performance Application PlatformsCPV4202

Student Guide & Internal & Confidential Update Daily
https://goo.gl/VVmVZ0
Download more at https://goo.gl/VVmVZ0
vSphere Optimization Assessment Showcase http://ouo.io/a8I2mV
Virtual SAN Hardware Guidance & Best Practices http://ouo.io/1S6WBj
Business Critical Applications and SDDC Transformation Solutions http://ouo.io/JmsBF
High Performance Application Platforms http://ouo.io/0mw6P
A Deep Dive: VMware IT's migration of 13 TB EBS Production to 5 node 11gR2 RAC on vSphere http://ouo.io/Nqt7u
Technical Deep Dive -Differentiating vSphere and the vSOMsuite from Windows Server 2012 R2 http://ouo.io/sh6G89
Automation Tips & Tricks: Achieving Results Faster http://ouo.io/z026s
Competing Against Microsoft –Your Top 10 Things to Know http://ouo.io/cs4wj
Best Practices for Installing and Upgrading to the Latest vSphere and vSphere with Operations Management Releases http://ouo.io/IBp3FO
Gain a Solid Entry into your Customers' Remote and Branch Offices (ROBO) http://ouo.io/9CoOM
Virtualizing Hadoop Workloads with vSphere Big Data Extensions -What's New in version 2.1 http://ouo.io/LNZ6zQ
vSphere 6 Local Availability Technical Deep Dive http://ouo.io/Qi0zp
vSphere Product Marketing Projects Survey for Business Critical Applications http://ouo.io/PVC2y
VMware vSphere 6 What’s New http://ouo.io/JunBO

Agenda From the EA2 LiVefire Program a three day program
• To book an event for your team reach out to Phil Starke [email protected], Scott Salyer [email protected]
• For technical Questions on EA2 or Todays presentation [email protected]
• EA2 LiVefire Agenda
– Day-1
• Enterprise Architecture and EA2 Overview
• Introducing XYZCars.com Use Case
• External Application Architecture and Design Exercise
– Day-2
• Internal Applications Architecture
• Design Exercise
– Day-3
• Data Platforms and Data warehousing
• Design Exercise
CONFIDENTIAL 2

But today !!!We cover a portion of content from Day-1 Virtualizing and Tuning Custom ApplicationsIntroducing EA2, the XYZCars.com use case current state, and proposed to-be architecture for external apps
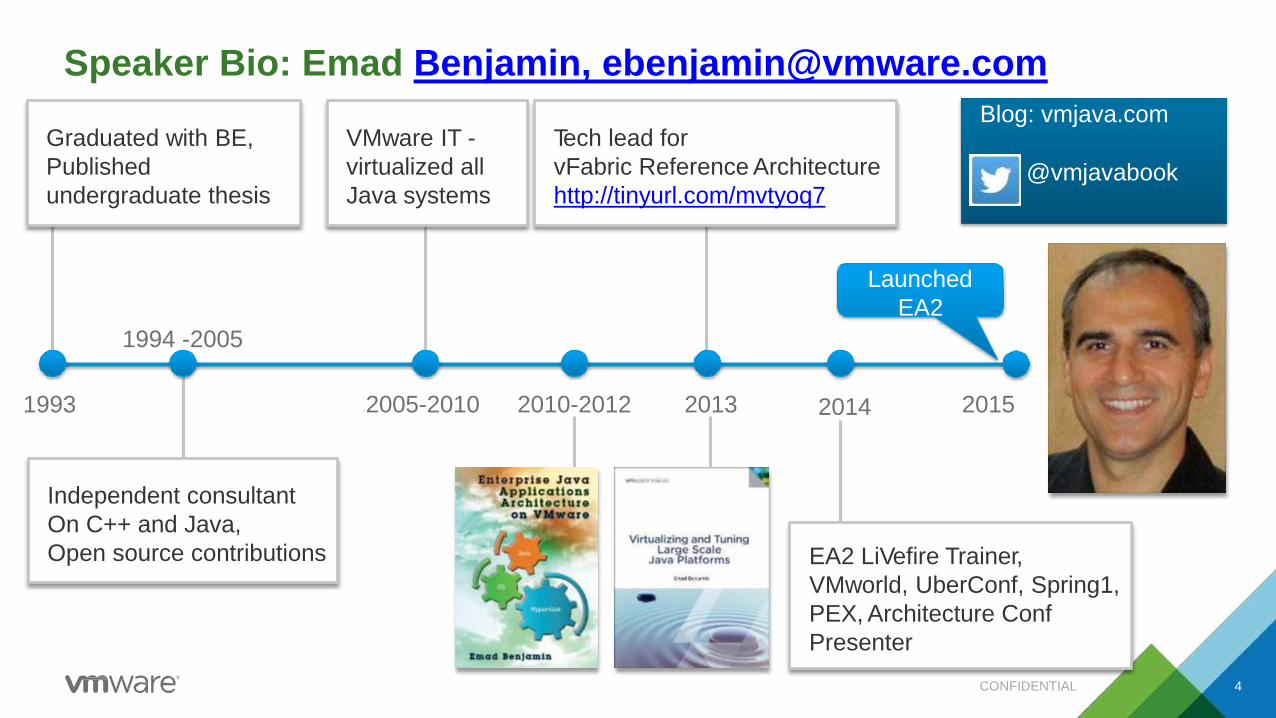
Speaker Bio: Emad Benjamin, [email protected]
Graduated with BE,
Published
undergraduate thesis
1993
Independent consultant
On C++ and Java,
Open source contributions
2010-2012 2013 2015
EA2 LiVefire Trainer,
VMworld, UberConf, Spring1,
PEX, Architecture Conf
Presenter
Launched
EA2
1994 -2005
VMware IT -
virtualized all
Java systems
2005-2010
Tech lead for
vFabric Reference Architecture
http://tinyurl.com/mvtyoq7
Blog: vmjava.com
@vmjavabook
2014
CONFIDENTIAL 4

Enterprise Architecture andEA2 Overview

Enterprise Architecture Defined
• Enterprise architecture is a comprehensive framework used to manage and align anorganization's Information Technology (IT) assets, people, operations, and projects with its operational characteristics.
• Many standards exist today, http://www.opengroup.org/standards/ea, TOGAF and Zachman toname a couple.
Business Process IT Services
Apps
Data
Ops/Infrastructure
Governance, Architecture, Program and Project Mgmt.
CIO
Business Sponsors
VPApps
VP Ops
Enterprise Architect
Achieve Contracted SLA to Business Sponsor
Enterprise Application
(EA2) Architecture Focus CONFIDENTIAL 7

EA2 Defined
Business Process IT Services
Apps
Data
Ops/Infrastructure
Governance, Architecture, Program and Project Mgmt.
CIO
Business Sponsors
VPApps
VP Ops
Enterprise Architect
Achieve Contracted SLA to Business Sponsor
EA2
EA2 is best implemented through
robust Platform Engineering
An intersection of three disciplines
Most misunderstood discipline
Developers size/wrongly-size
this, but Ops own it.
A battle is brewing over who
seeks control
Enterprise Application
(EA2) Architecture Focus CONFIDENTIAL 8

Introducing the XYZCars.com Use CaseCurrent State Overview

XYZCars.com
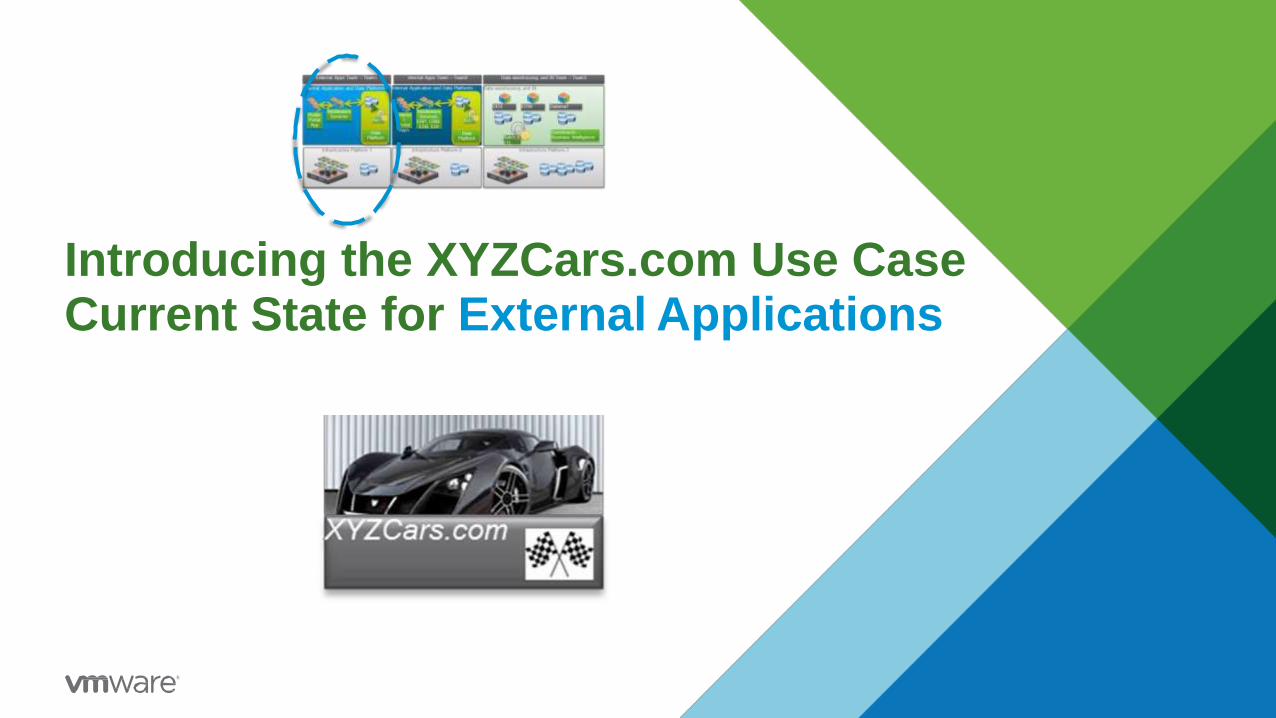
High Level Current Architecture
• The External Apps Team – Team 1, manages the external applications and platforms associated with this, and it owns all of the applications deployments and associated infrastructure.
• The Internal Apps Team - Team 2, manages the internal applications and data platforms, and the entire associated infrastructure.
• The Data Warehousing and BI Team - Team 3, manages all of the application, databases, and infrastructure associated with managing the EDW, ODS, and associated datamart
External Application and Data Platforms
PublicPortalApp
Middleware Services
DataPlatform
InternalApplication and Data Platforms
Internal Portal Apps
MiddlewareServices,
ERP, CRM, ESB, EDI
Data Platform
Data warehousing and BI
EDW
Dashboards –Business Intelligence
ODS Datamart
Batch &
ETL
Infrastructure Platform-2Infrastructure Platform-1 Infrastructure Platform-3
External Apps Team – Team1 Internal Apps Team – Team2 Data warehousing and BI Team – Team3
CONFIDENTIAL

External Application and Data Platforms
PublicPortalApp
MiddlewareServices
Data Platform
InternalApplication and Data Platforms
Internal Portal Apps
Middleware Services,
ERP, CRM, ESB, EDI
Data Platform
Data warehousing and BI
EDW
Dashboards –Business Intelligence
ODS Datamart
Batch &
ETL
External Apps Team – Team1 Internal Apps Team – Team2 Data warehousing and BI – Team3
XYZCars.com
SDDC
Storage Network OS Virtualization Infrastructure OperationsMultiple
vSphere
EnterpriseArchitecture Group
Platforms Architect
Virtualization Architect
Network DatacenterArchitect Architect
StorageArchitect
Apps Data Operations Enterprise Architect Architect Architect Architect
Holistic Monitoring
vRealize Ops
Manager
DevOps Team
CIO DashboardHigh Level To-Be Architecture
Security Architect
Clusters CONFIDENTIAL
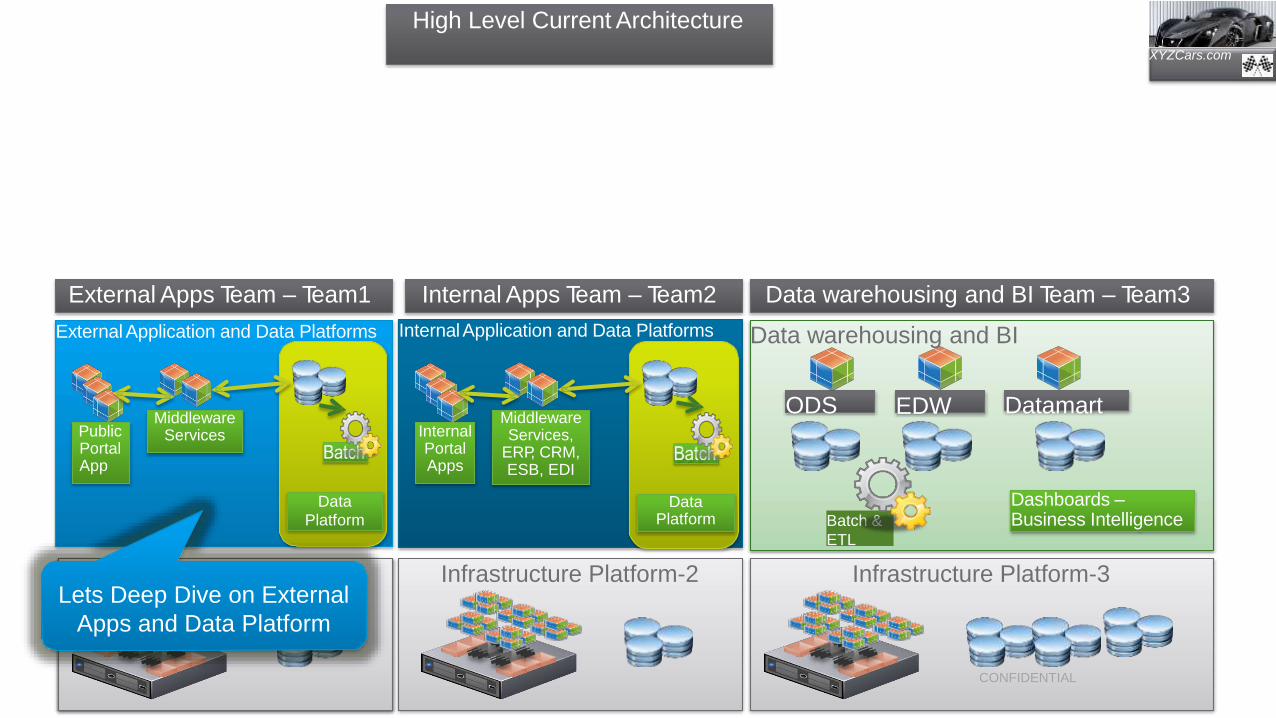
Introducing the XYZCars.com Use CaseCurrent State for External Applications
XYZCars.com
High Level Current Architecture
External Application and Data Platforms
PublicPortalApp
Middleware Services
DataPlatform
InternalApplication and Data Platforms
Internal Portal Apps
Middleware Services,
ERP, CRM, ESB, EDI
Data Platform
Data warehousing and BI
EDW
Dashboards –Business Intelligence
ODS Datamart
Batch &
ETL
Infrastructure Platform-2Infrastructure Platform-1 Infrastructure Platform-3
CONFIDENTIAL
External Apps Team – Team1 Internal Apps Team – Team2 Data warehousing and BI Team – Team3
Lets Deep Dive on External
Apps and Data Platform

Current State Architecture – External Apps and Data PlatformsExternal Application and Data Platforms
PublicPortalApp
Middleware Services
Data Platform
Public Portal App
20 hosts,4 socket s per host, 40 cores per host, 256GB RAM
• 2000 JVMs, made of 100 unique apps• 1GB heap on each JVM• 2000/100 => 20 JVM instances for
each unique app• 20 JVMs per app for scaled-out• CPU Utilization is 10% at peak
Middleware Services
16 hosts,2 socket s per host, 16 cores per host, 96GB RAM
• 400JVMs hosting REST services• 1GB heap on each JVM• 1 app made of 25 unique REST
services, collectively are same service• 1 REST Service per JVM• CPU utilization 15% at peak
Data Platform5 hosts,4 socket s per host, 40 cores per host, 512GB RAM
• 4 node RAC for Portal App DB• 20,000 DB connections• SGA 64GB on each RAC node• CPU utilization 30% at peak
• 1 Single instance (SI) for Middleware Services
• 6000 DB Connections• 64 GB SGA• CPU utilization is 30% at peak
• Batch process runs on the Oracle SIDB C, O12NGFIBDEhNeTaIApL, 3% CPU at peak 13

Current State External Enterprise Apps Data Platforms
Data Platform
RACNode1
RACNode2
RACNode3
RACNode4
RAC DB
Oracle SIDB
App Cluster Middleware
5 hosts,4 socket s per host, 40 cores per host, 512GB RAMCurrent Peak CPU 30%
4 hosts,4 socket s per host, 40 cores per host, 512GB RAM
1 host,4 socket s per host, 40 cores per host, 512GB RAM
Public PortalApp
Middleware Services
CONFIDENTIAL 14

Introducing the XYZCars.com Use CaseCurrent State for Internal Applications

External Application and Data Platforms
PublicPortalApp
Middleware Services
DataPlatform
InternalApplication and Data Platforms
Internal Portal Apps
Middleware Services,
ERP, CRM, ESB, EDI
Data Platform
Data warehousing and BI
EDW
Dashboards –Business Intelligence
ODS Datamart
Batch &
ETL
Infrastructure Platform-2 Lets Deep Dive on Internal
Apps and Data Platform
Infrastructure Platform-1 Infrastructure Platform-3
CONFIDENTIAL
External Apps Team – Team1 Internal Apps Team – Team2 Data warehousing and BI Team – Team3
XYZCars.com
High Level Current Architecture

XYZCars.com Use Case Proposed To-Be Architecture for External Apps

External Application and Data Platforms
PublicPortalApp
Middleware Services
DataPlatform
InternalApplication and Data Platforms
Internal Portal Apps
Middleware Services,
ERP, CRM, ESB, EDI
Data Platform
Data warehousing and BI
EDW
Dashboards –Business Intelligence
ODS Datamart
Batch &
ETL
External Apps Team – Team1 Internal Apps Team – Team2 Data warehousing and BI – Team3
XYZCars.com
SDDC
Storage Network OS Virtualization Infrastructure OperationsMultiple
vSphere
Clusters
EnterpriseArchitecture Group
Platforms Architect
Virtualization Architect
Storage Network DatacenterArchitect Architect Architect
Apps Data Operations Enterprise Architect Architect Architect Architect
Holistic Monitoring
vRealize Ops
Manager
DevOps Team
CIO DashboardHigh Level To-Be Architecture
Security Architect
CONFIDENTIAL
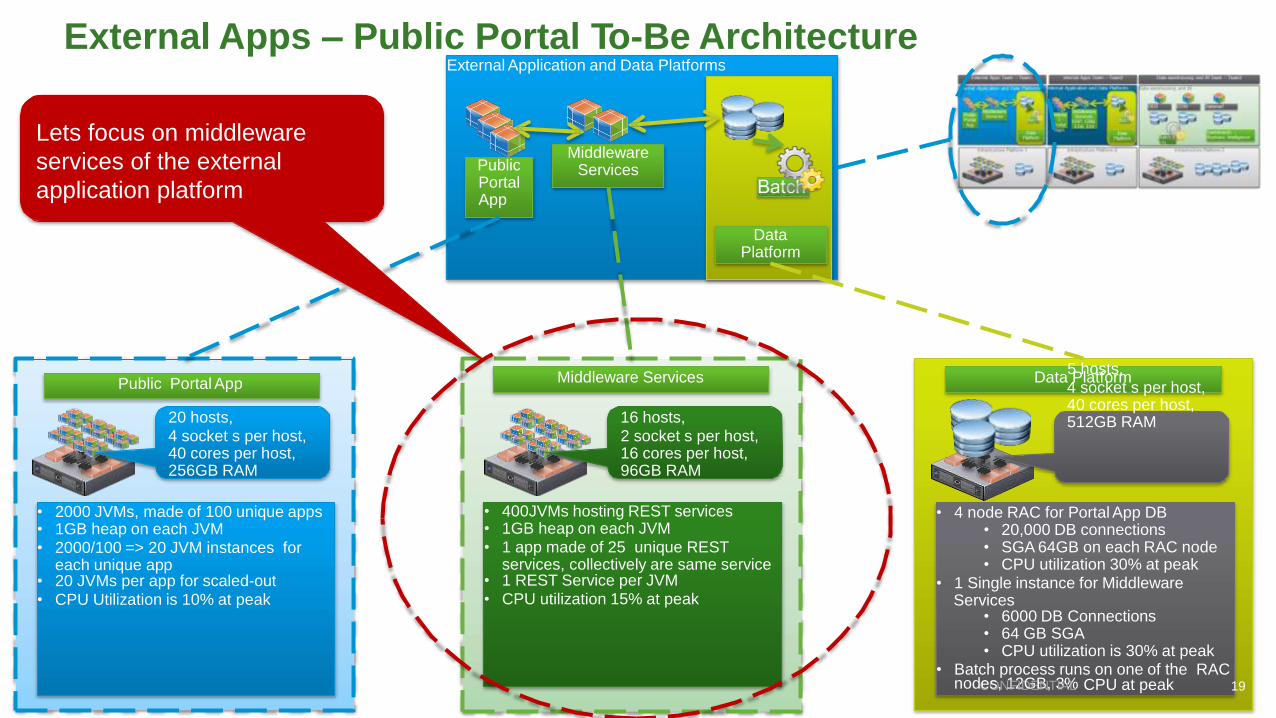
External Apps – Public Portal To-Be ArchitectureExternal Application and Data Platforms
PublicPortalApp
Middleware Services
Data Platform
Public Portal App
20 hosts,4 socket s per host, 40 cores per host, 256GB RAM
• 2000 JVMs, made of 100 unique apps• 1GB heap on each JVM• 2000/100 => 20 JVM instances for
each unique app• 20 JVMs per app for scaled-out• CPU Utilization is 10% at peak
Middleware Services
16 hosts,2 socket s per host, 16 cores per host, 96GB RAM
• 400JVMs hosting REST services• 1GB heap on each JVM• 1 app made of 25 unique REST
services, collectively are same service• 1 REST Service per JVM• CPU utilization 15% at peak
Data Platform5 hosts,4 socket s per host, 40 cores per host, 512GB RAM
• 4 node RAC for Portal App DB• 20,000 DB connections• SGA 64GB on each RAC node• CPU utilization 30% at peak
• 1 Single instance for Middleware Services
• 6000 DB Connections• 64 GB SGA• CPU utilization is 30% at peak
• Batch process runs on one of the RAC
Lets focus on middleware
services of the external
application platform
nodCeOs,N1F2IDGEBN,T3IA%L CPU at peak 19
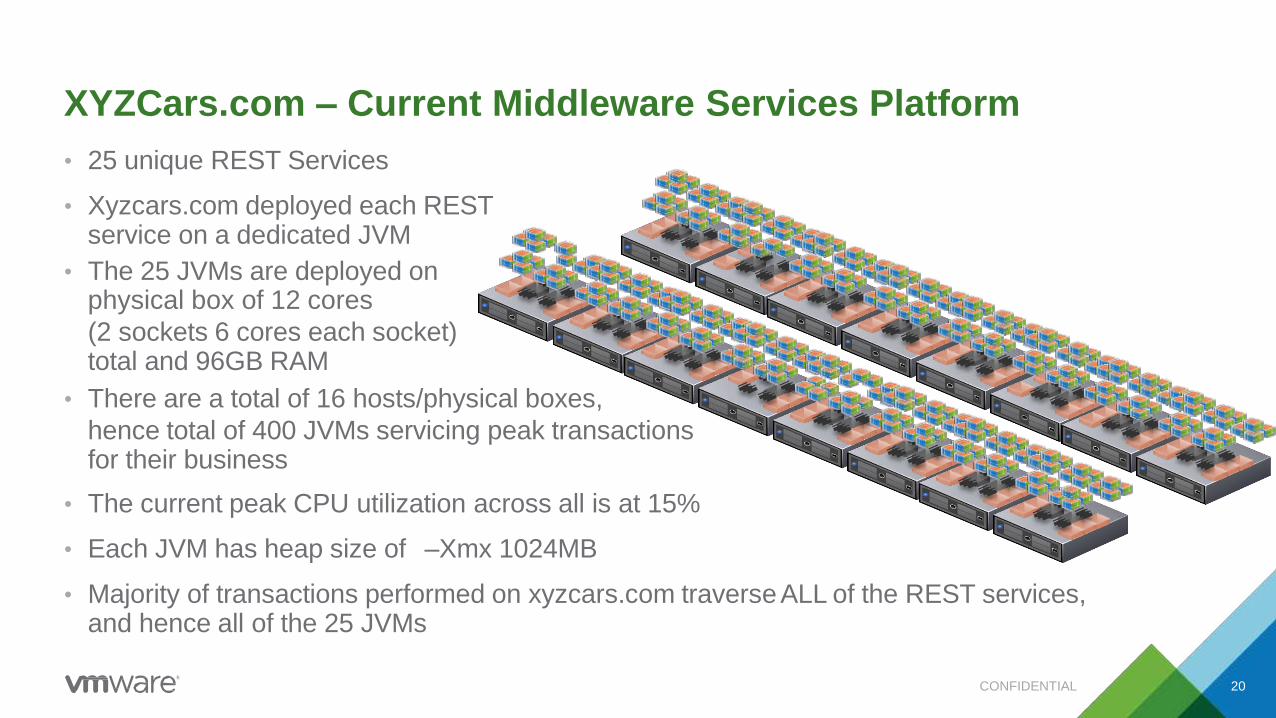
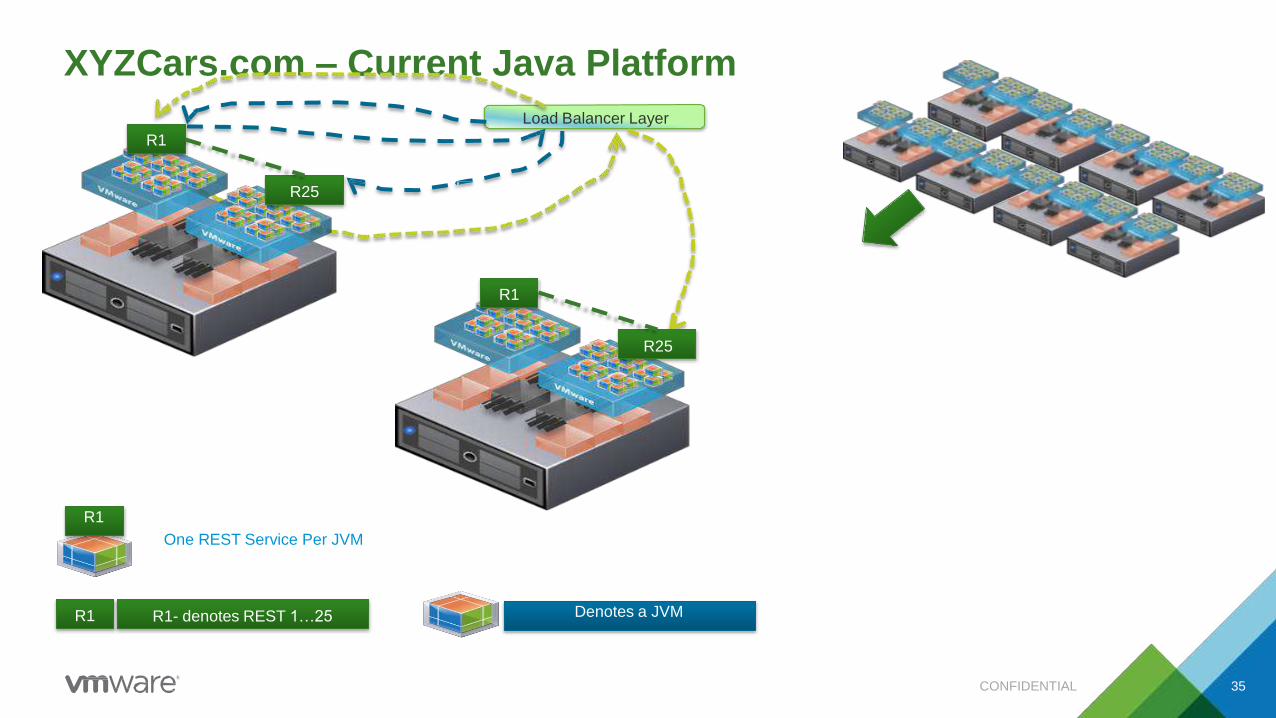
XYZCars.com – Current Middleware Services Platform
• 25 unique REST Services
• Xyzcars.com deployed each RESTservice on a dedicated JVM
• The 25 JVMs are deployed onphysical box of 12 cores
(2 sockets 6 cores each socket) total and 96GB RAM
• There are a total of 16 hosts/physical boxes,
hence total of 400 JVMs servicing peak transactions for their business
• The current peak CPU utilization across all is at 15%
• Each JVM has heap size of –Xmx 1024MB
• Majority of transactions performed on xyzcars.com traverseALL of the REST services, and hence all of the 25 JVMs
CONFIDENTIAL 20

But Wait!?Lets provide some key aspects of Java deployments, packaging, and sizing platforms

Three Minutes Detour on Java Deployment – Quick Introduction
• Java source code files are saved as .java
• Java (.java) is compile into .class
• Likely you have multiple .java and .class files
• .class files are packaged into .jar files
• If you are using Web services/RESTservices, or Servlets you will need a warfile, all jar files and other artifacts will be packaged into a .war file
• If you have EJBs you will need .ear files
.class.class
.class
.jar
or
.jar.jar
compiled
packaged
packaged deployed
Perm Gen
Initial
Heap
Guest OS
Memory
Java Stack
JVM Heap
.java source code
CONFIDENTIAL 22

Application Servers
• EJB capable full JEE containers, you candeploy .ear, .war, .jars, Web services, EJBs, RESTService
• Non EJB application containers, also called servlet containers or web container, you candeploy .war, .jars, Web services, RESTService. You cannot deploy EJB andhence cannot deploy .ear files
Pivotal tcServer
DB ServersJava Applications
Load Balancer Tier
Load Balancers Web Servers
IT Operations Network
Team
IT Operations Server
Team
IT Apps – Java Dev
Team
IT Ops & Apps Dev
Team
Organizational Key Stakeholder Departments
Web Server Tier Java App Tier DB Server Tier
CONFIDENTIAL 23

HotSpot JVMs on vSphere
JVM Max Heap-Xmx
JVMMemory
Perm Gen
Initial Heap
Guest OS Memory
VMMemory
-Xms
Java Stack
-Xss per thread
-XX:MaxPermSize
Other mem
Direct native
Memory
“off-the-heap”
Non Direct
Memory
“Heap”
CONFIDENTIAL 25
HotSpot JVMs on vSphere
CONFIDENTIAL 26
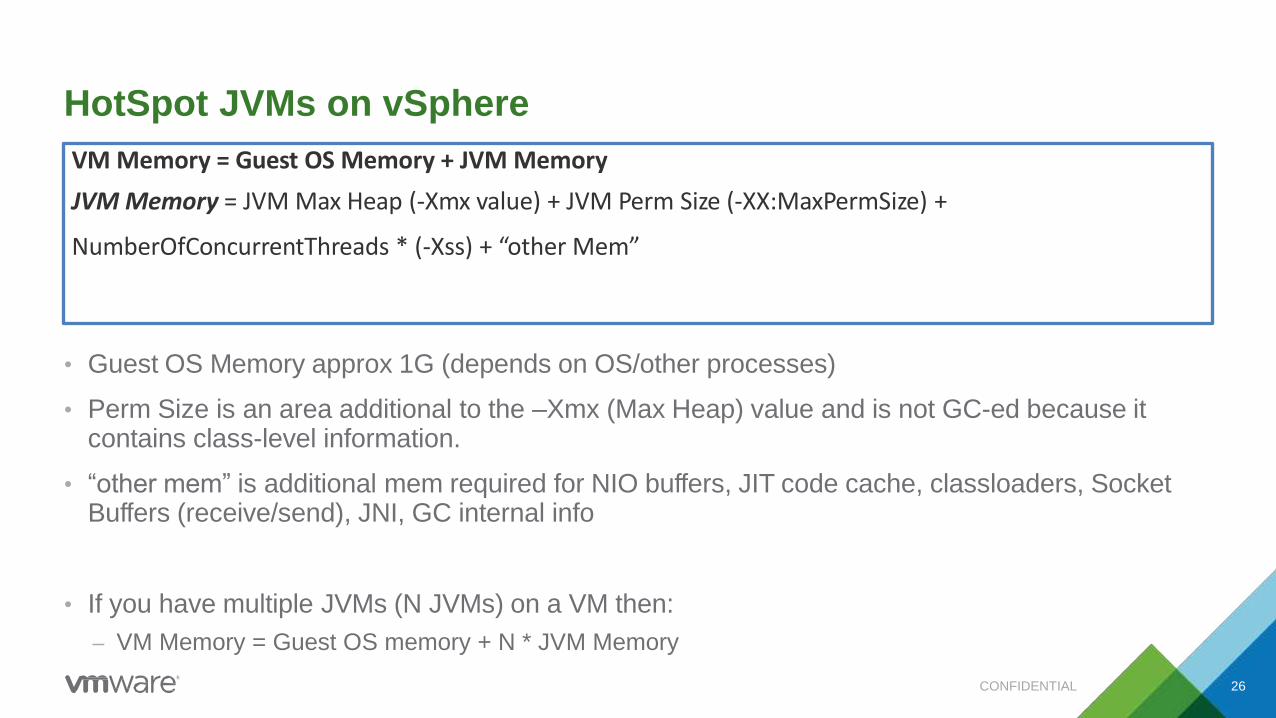
• Guest OS Memory approx 1G (depends on OS/other processes)
• Perm Size is an area additional to the –Xmx (Max Heap) value and is not GC-ed because itcontains class-level information.
• “other mem” is additional mem required for NIO buffers, JIT code cache, classloaders, SocketBuffers (receive/send), JNI, GC internal info
• If you have multiple JVMs (N JVMs) on a VM then:
– VM Memory = Guest OS memory + N * JVM Memory
VM Memory = Guest OS Memory + JVM Memory
JVMMemory = JVM Max Heap (-Xmx value) + JVM Perm Size (-XX:MaxPermSize) +
NumberOfConcurrentThreads * (-Xss) + “other Mem”

Sizing Example
JVM Max Heap-Xmx(4096m)
JVMMemory(4588m) Perm Gen
Initial Heap
Guest OS Memory
VMMemory (5088m)
-Xms (4096m)
Java Stack
-XX:MaxPermSize (256m)
Other mem (=217m)
500m used by OS
-Xss per thread (256k*100)
set mem Reservation to 5088m
CONFIDENTIAL 27

96 GB RAM
on Server
Each NUMA
Node has 94/2
45GB
8 vCPU VMs
ESX Scheduler
less than
45GB RAM
on each VM
If VM is sized greater
than 45GB or 8 CPUs,
Then NUMA interleaving
Occurs and can cause
30% drop in memory
throughput performance
CONFIDENTIAL 28

NUMA Local Memory Optimized VM Size =
[Total RAM on Host –{(Total RAM On Host*nVMs * 0.01) + 1GB }] /Number of Sockets
NUMA Local Memory with Overhead AdjustmentPrior to vSphere 5.1
Physical RAM
On vSphere host
Number of VMs
On vSphere host
1% RAM
overhead
vSphere RAM
overhead
Number of Sockets
On vSphere hostTotalvSphere Overhead
Physical RAM
On vSphere host
CONFIDENTIAL 29

NUMA Local Memory Optimized VM Size =
[Total RAM on Host –{(Total RAM On Host*nVMs * 0.01) + 2GB }] /Number of Sockets
NUMA Local Memory with Overhead Adjustment vSphere 5.1 In vSphere 5.1, its 2GB
NUMA Local Memory with Overhead Adjustment vSphere 5.5
NUMA Local Memory Optimized VM Size =
[Total RAM on Host –{(Total RAM On Host*nVMs * 0.01) + 4GB }] /Number of Sockets
In vSphere 5.5, its 4GB
CONFIDENTIAL 30

Now Back to XYZCars
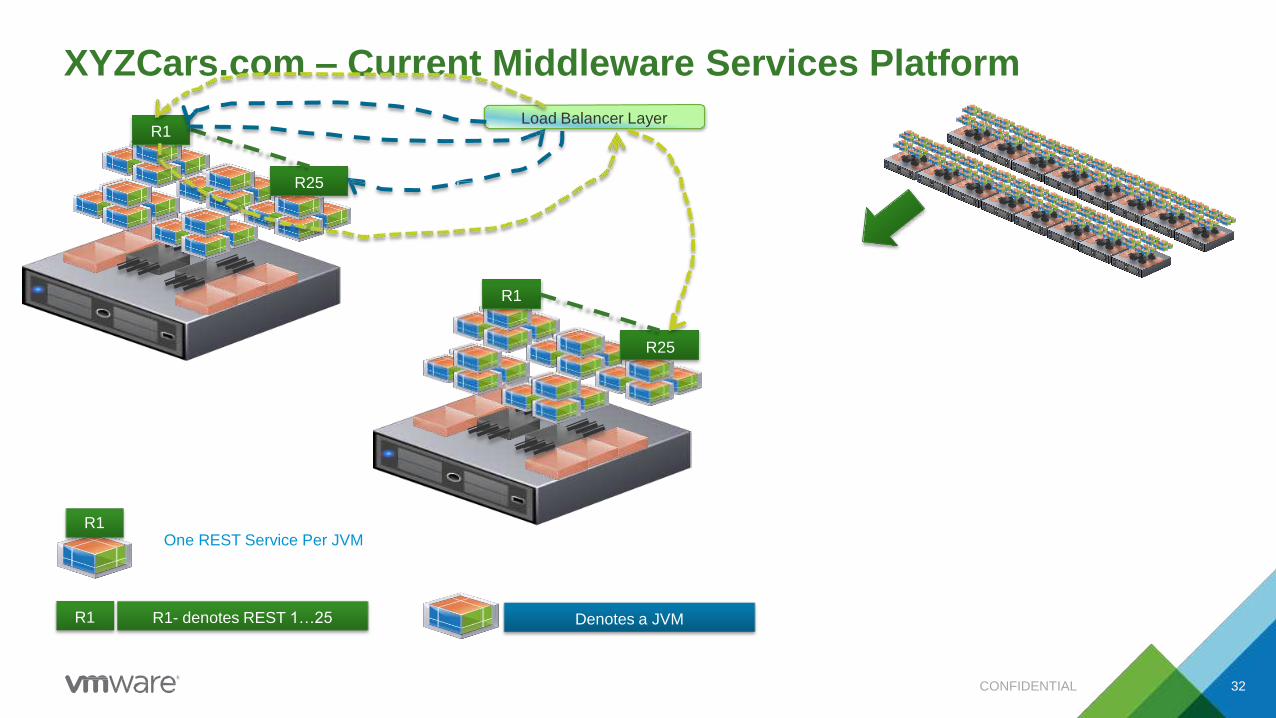
XYZCars.com – Current Middleware Services Platform
R1 R1- denotes REST 1…25 Denotes a JVM
R1One REST Service Per JVM
R1
R25
R1
R25
Load Balancer Layer
CONFIDENTIAL 32

Solution 1 – Virtualize 1 REST : 1 JVM with 25 JVMs Per VM, 2 VMS Per Host
25 JVMs, 1
REST per JVM
On 1 VM
CONFIDENTIAL 33

Solution 1 (400GB) – Virtualize1 REST : 1 JVM with 25 JVMs Per VM, 2 VMs Per Host
• Sized for current workload, 400GB Heap space
• Deployed 25 JVMs on each VM, each JVM is 1GB
• Accounting for JVM off the heap overhead
– 25GB*1.25=31.25GB
• Add Guest OS 1GB
– 31.25+1=32.25GB
• 8 Hosts
• 25 unique REST Services
– Each REST Service deployed in its own JVM
– Original call paradigm has not changed
50 JVMs to 12 cores, this maybe an issue, while the CPU utilization is
originally at 15% you can assume 30%+ CPU utilization is the new level.
However in actual fact response time may suffer significantly due to coinciding
GC cycles that can cause CPU contention
CONFIDENTIAL 34
XYZCars.com – Current Java Platform
R1 R1- denotes REST 1…25 Denotes a JVM
R1
One REST Service Per JVM
Load Balancer Layer
R1
R25
R1
R25
CONFIDENTIAL 35

Solution 1 (800GB) – Virtualize 1 REST : 1 JVM with 25 JVMs Per VM, 2 VMs Per Host
• Sized for current workload, 800GB Heap space
• Deployed 25 JVMs on each VM, each JVM is 1GB
• Accounting for JVM off the heap overhead
– 25GB*1.25=31.25GB
• Add Guest OS 1GB
– 31.25+1=32.25GB
• 16 Hosts
• 25 unique REST Services
– Each REST Service deployed in its own JVM
– Original call paradigm has not changed
50 JVMs to 12 cores, this maybe an issue, while the CPU utilization is
originally at 15% you can assume 30%+ CPU utilization is the new level.
However in actual fact response time may suffer significantly due to coinciding
GC cycles that can cause CPU contention
THIS SOLUTION IS NOT GREAT BUT ITS LEAST INTRUSIVE
NOTE: We had to use 16 hosts, as the 8
hosts in the 400GB case, already had 50
JVMs per host, which is significant
CONFIDENTIAL 36
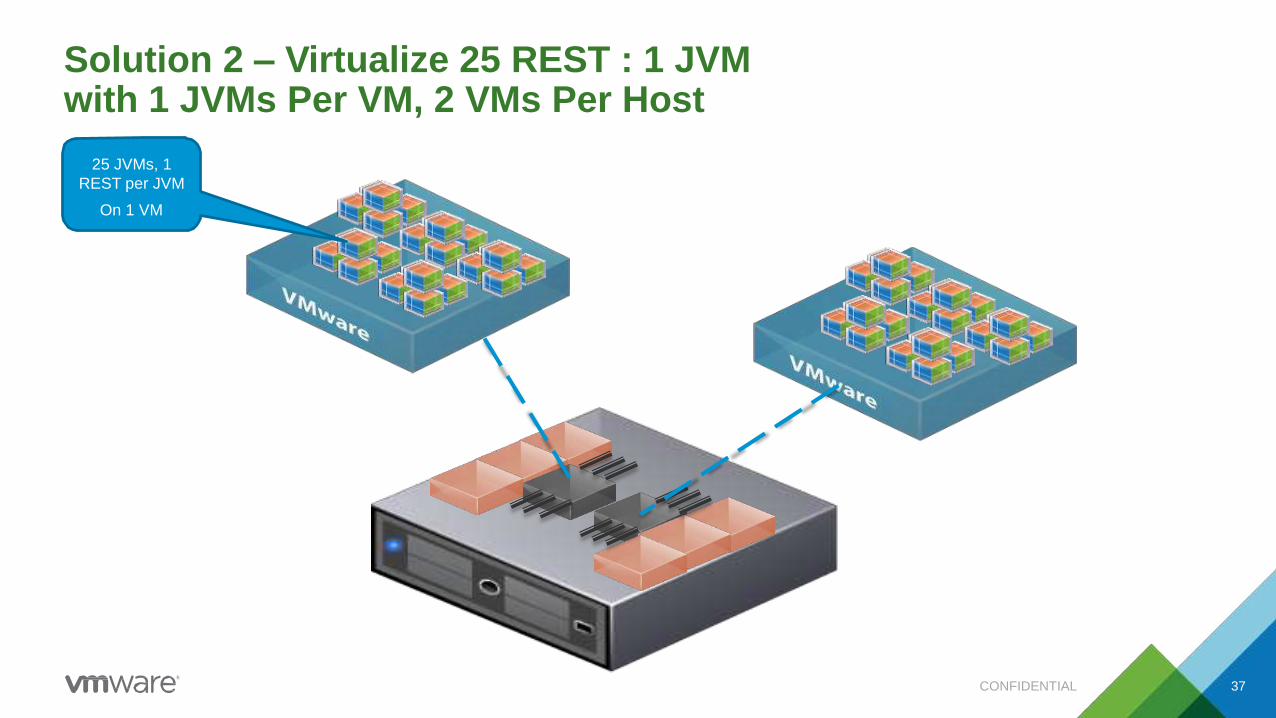
Solution 2 – Virtualize 25 REST : 1 JVM with 1 JVMs Per VM, 2 VMs Per Host
25 JVMs, 1
REST per JVM
On 1 VM
CONFIDENTIAL 37

Solution 2 – Virtualize 25 REST : 1 JVM with 1 JVMs Per VM, 2 VMS Per Host
CONFIDENTIAL 38

Solution 2 – Virtualize 25 REST : 1 JVMwith 1 JVMs Per VM, 2 VMS Per Host
R1R2
R3R4
R5
R25
R1R2
R3R4
R5
R25
Load Balancer Layer
R1
R25
R1
R25
Load Balancer Layer
3x better response time using this approach
CONFIDENTIAL 39
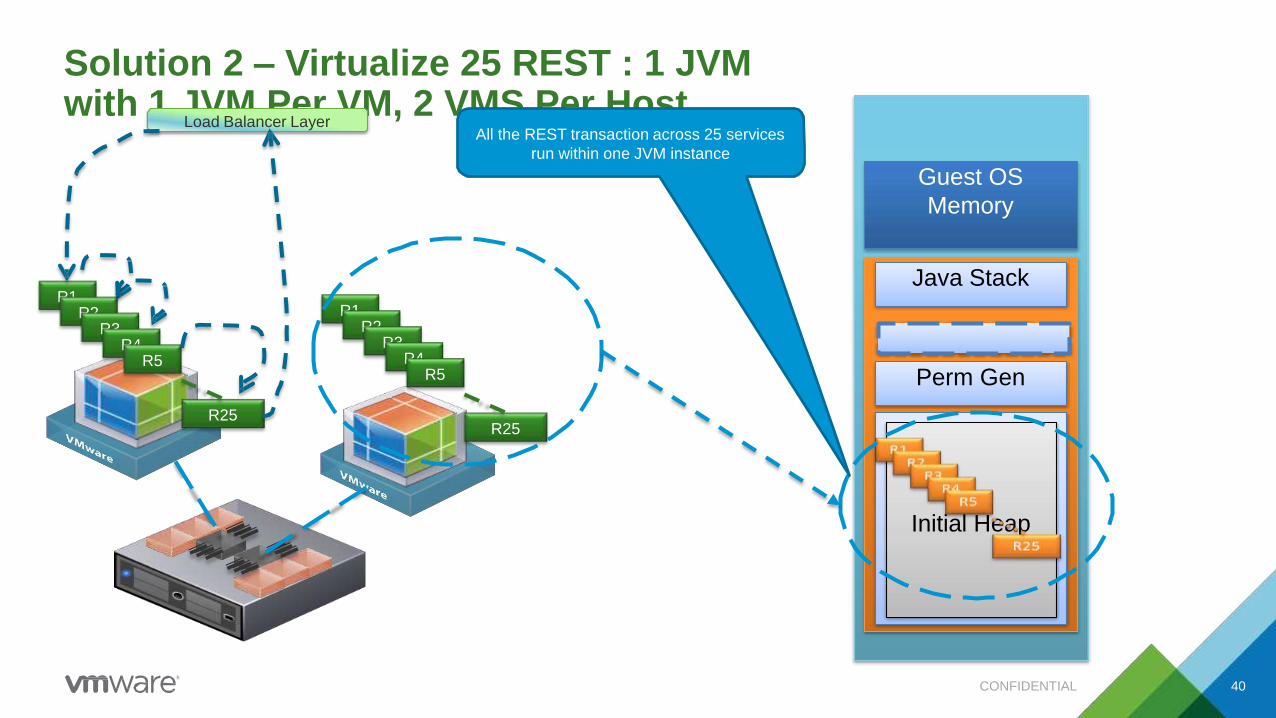
Solution 2 – Virtualize 25 REST : 1 JVMwith 1 JVM Per VM, 2 VMS Per Host
R1R2
R3R4
R5
R25
R1R2
R3R4
R5
R25
Load Balancer Layer
Perm Gen
Initial Heap
Guest OS
Memory
Java Stack
All the REST transaction across 25 services
run within one JVM instance
CONFIDENTIAL 40

Solution 2 – Virtualize 25 REST : 1 JVM with 1 JVM Per VM, 2 VMS Per Host
CONFIDENTIAL 41
Description Today’s Traffic Load Future Traffic Load (2.x
current load)
Comment
VM Size (theoretical ceiling
NUMA optimized)
[96-{(96*0.02)+1}]/2 = 46.5GB [96-{(96*0.02)+1}]/2 = 46.5GB Using NUMA overhead equation,
this VM of 46.5GB and 6vCPU will
be NUMA local
VM Size for Prod 46.5*0.95=44.2GB 46.5*0.95=44.2GB
JVM Heap Allowable (44.2-1)/1.25=34.56GB (44.2-1)/1.25=34.56GB Working backwards from the
NUMA size of 44.2, minus 1GB for
Guest OS, and then accounting for
25% JVM overhead by dividing by
1.25
Number of JVMs needed 400/34.56=11.59 => 12 JVMs 800/34.56=23.15 => 24 JVMs Total heap needed divided by how
much heap can be placed in each
NUMA node
Number of Hosts 6 12 1 JVM per VM, 1 VM per NUMA
node
Solution Highlights 6 hosts used instead of 16,
62.5% less hardware and
hence reduced licensing cost
(3.x better response time)
12 hosts, vs., what would have
been 32 hosts 16*2,
62.5%saving, or 25% if you
take 16 hosts as the base
The 12 hosts solution handles 2.x
amount of current traffic at 25%
less hardware than the existing
16hosts that are handling x load

Cluster Layout for Solution 2
Current Arch uses 16
hosts for servicing
400GB heap
Improved to-beArch uses
6 hosts for servicing
400GB heap
Improved to-beArch
uses 12 hosts for
servicing 800GB heap
• This solution uses 62.5% less
hardware
• 3.x better response time
• Substantial software license
saving
• Huge potential for further
scalability
CONFIDENTIAL 42

Solution 2 – Virtualize 25 REST : 1 JVM with 1 JVM Per VM, 2 VMS Per Host
JVM Max
Heap
-Xmx
(34.5GB)
Total JVM Memory
(max=42.5GB
Min=37.5)Perm Gen
Initial Heap
Guest OS
Memory
VM
Memory
(43.5)
-Xms (34.5GB)
Java Stack
1GB used by OS
-Xss per thread (256k*1000)
-XX:MaxPermSize (1GB)
Other mem (=1GB)
All REST Services in one Heap
Set memory Reservation to 43.5GBIncrease thread pool to 1000 to
take on more load since heap is
much larger
CONFIDENTIAL 43

Time Check -Let’s See if We have Time forAnother [email protected]@vmjavabook
http://tinyurl.com/lrkhakf

Day-1External Applications(Public Portal)Design Exercise

Current State Architecture – External Apps and Data PlatformsExternal Application and Data Platforms
PublicPortalApp
Middleware Services
Data Platform
Public Portal App
20 hosts,4 socket s per host, 40 cores per host, 256GB RAM
• 2000 JVMs, made of 100 unique apps• 1GB heap on each JVM• 2000/100 => 20 JVM instances for
each unique app• 20 JVMs per app for scaled-out• CPU Utilization is 10% at peak
Middleware Services
16 hosts,2 socket s per host, 16 cores per host, 96GB RAM
• 400JVMs hosting REST services• 1GB heap on each JVM• 1 app made of 25 unique REST
services, collectively are same service• 1 REST Service per JVM• CPU utilization 15% at peak
Data Platform5 hosts,4 socket s per host, 40 cores per host, 512GB RAM
• 4 node RAC for Portal App DB• 20,000 DB connections• SGA 64GB on each RAC node• CPU utilization 30% at peak
• 1 Single instance for Middleware Services
• 6000 DB Connections• 64 GB SGA• CPU utilization is 30% at peak
• Batch process runs on Single InstanceOraCclOeNsFeIDrvEeNr,TI1A2LGB, 3% CPU at peak 47

How to Design To-Be Architecture for Public Portals Platform
• In this design exercise you will be split into teams where you will come up with a cluster design for the public portals of the external applications platform of XYZCars.com
CONFIDENTIAL 48
Discovery Questions Posed to Customer Answer
How many hosts supporting this app 2000 hosts
What is the Host configuration 4 sockets per host, with 10 cores per socket, and 256GB
RAM
How many JVMs (App Server Instances) 2000
How big is each JVM heap size (-xmx) 1GB
Do all of the JVMs host the same app or
different apps, how many unique apps
2000 JVMs service different apps, there 100 unique apps,
each app has 20 HA/scaled-out instances for each unique
app
What is the current CPU utilization at peak
across the cluster
10%

Stepwise Design Considerations
CONFIDENTIAL 49
• Step 1 – Should you consolidate JVMs? Describe your answer pros and cons
• Step 2 – New JVM Heap Size? Would Customer Allow you to change Heap? Describe your answer pros/cons
• Step 3 - How Many JVMs do you have per Applications Instance and How many across all Applications? Show calculation, what is your consolidation ratio
• Step 4 - What is the size of the building block VM for this new platform, assuming you choose a NUMA optimized configuration?
• Step 5 - How many JVMs will be placed per the new VM configuration?
• Step 6 – draw your entire cluster design showing how many JVMs per VM and how many VMs per host, and how many total hosts are being used in the new platform
• Step 7 – Describe the perceived performance of the new platform, along with any savings made in hardware and software licensing costs
• Step 8 – describe how the management complexity of the new system compares to the old one
• Step 9 – Describe the new uptime SLA, availability and overall scalability of the new system, how will you achieve 99.99% uptime, or better?
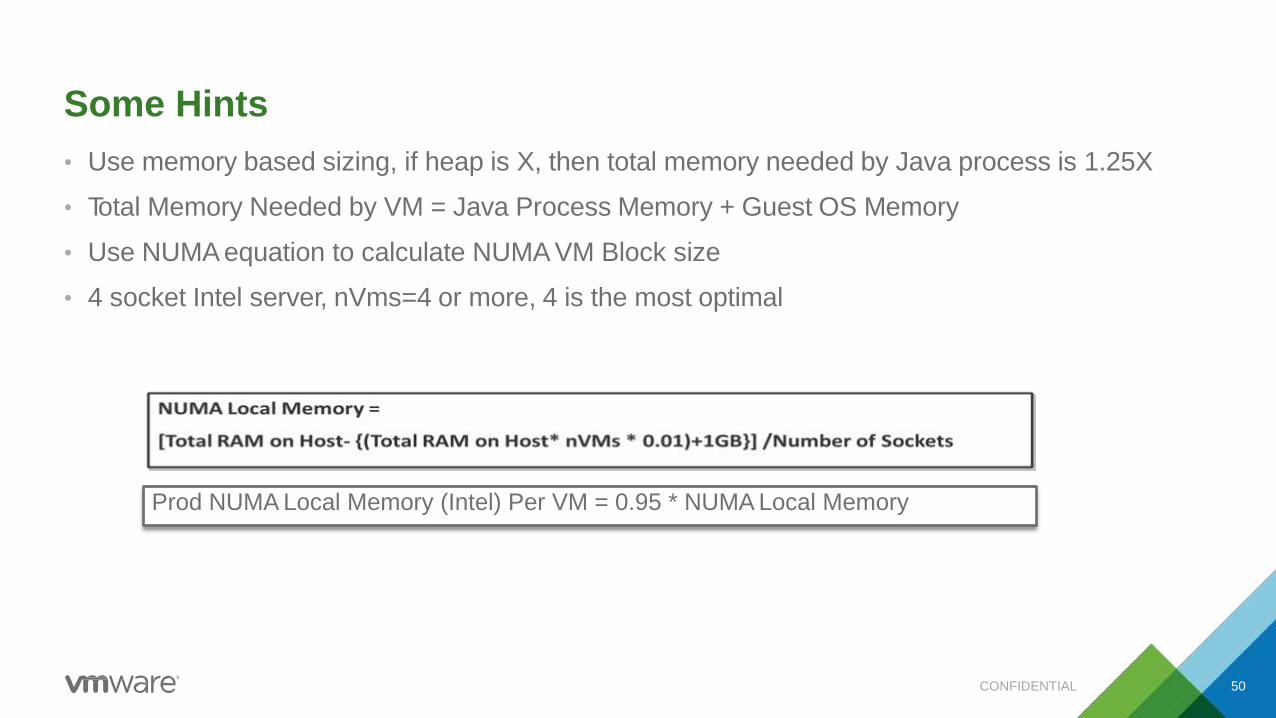
Some Hints
• Use memory based sizing, if heap is X, then total memory needed by Java process is 1.25X
• Total Memory Needed by VM = Java Process Memory + Guest OS Memory
• Use NUMA equation to calculate NUMA VM Block size
• 4 socket Intel server, nVms=4 or more, 4 is the most optimal
Prod NUMA Local Memory (Intel) Per VM = 0.95 * NUMA Local Memory
CONFIDENTIAL 50
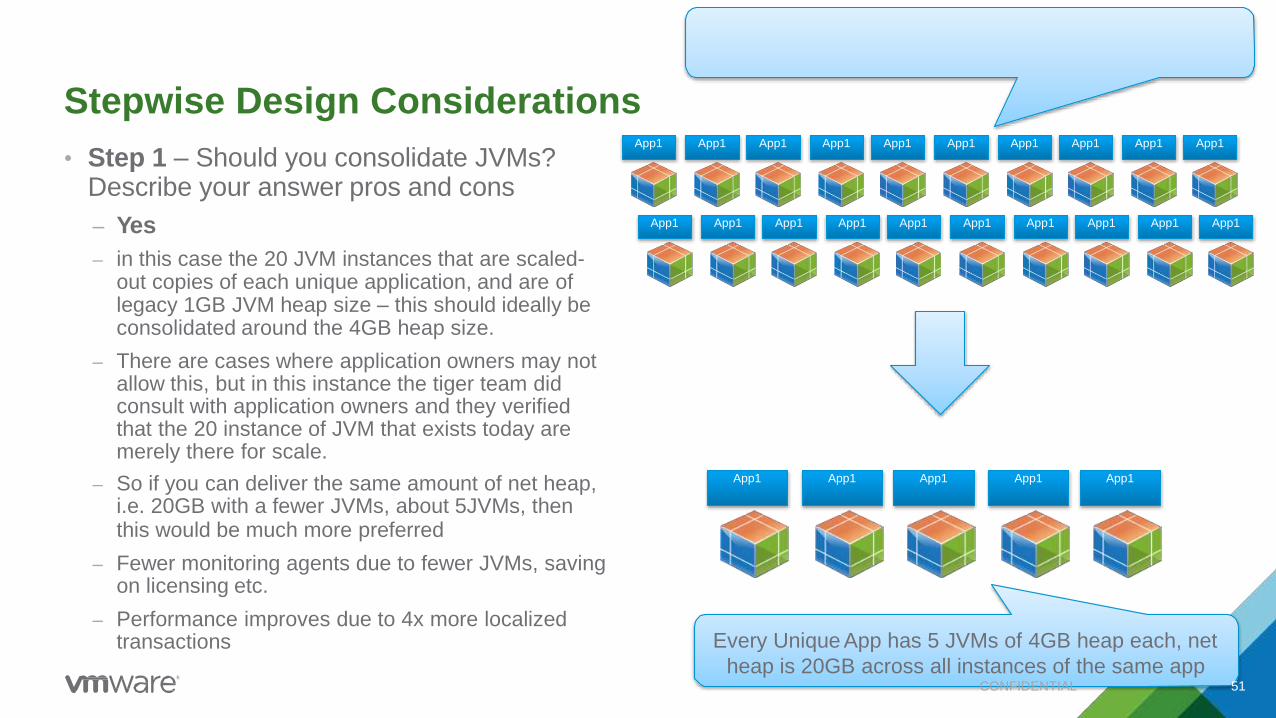
Every Unique App has 20 JVMs of 1GB heap each, net
heap is 20 GB across all instances of the same app
Stepwise Design Considerations
• Step 1 – Should you consolidate JVMs?Describe your answer pros and cons
– Yes
– in this case the 20 JVM instances that are scaled-out copies of each unique application, and are of legacy 1GB JVM heap size – this should ideally be consolidated around the 4GB heap size.
– There are cases where application owners may not allow this, but in this instance the tiger team did consult with application owners and they verified that the 20 instance of JVM that exists today are merely there for scale.
– So if you can deliver the same amount of net heap,i.e. 20GB with a fewer JVMs, about 5JVMs, thenthis would be much more preferred
– Fewer monitoring agents due to fewer JVMs, saving on licensing etc.
– Performance improves due to 4x more localized transactions
App1 App1 App1 App1 App1 App1 App1 App1 App1 App1
App1 App1 App1 App1 App1 App1 App1 App1 App1 App1
App1 App1 App1 App1 App1
Every Unique App has 5 JVMs of 4GB heap each, net
heap is 20GB across all instances of the same appCONFIDENTIAL 51
Stepwise Design Considerations
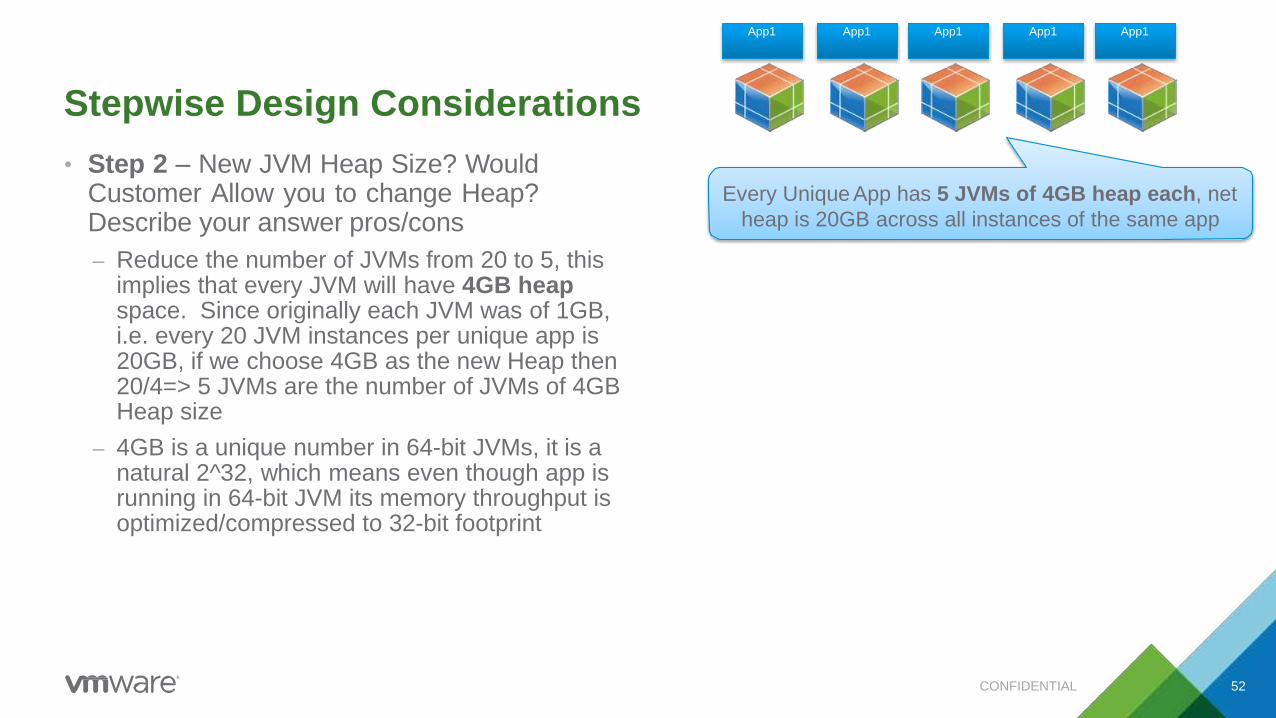
• Step 2 – New JVM Heap Size? WouldCustomer Allow you to change Heap?Describe your answer pros/cons
– Reduce the number of JVMs from 20 to 5, this implies that every JVM will have 4GB heap space. Since originally each JVM was of 1GB,i.e. every 20 JVM instances per unique app is 20GB, if we choose 4GB as the new Heap then 20/4=> 5 JVMs are the number of JVMs of 4GB Heap size
– 4GB is a unique number in 64-bit JVMs, it is a natural 2^32, which means even though app is running in 64-bit JVM its memory throughput is optimized/compressed to 32-bit footprint
App1 App1 App1 App1 App1
Every Unique App has 5 JVMs of 4GB heap each, net
heap is 20GB across all instances of the same app
CONFIDENTIAL 52

Stepwise Design Considerations
• Step 3 - How Many JVMs do you have per Applications Instance and How many across all Applications? Show calculation, what is your consolidation ratio
– 5 JVMs
– JVM consolidation ratio 4:1
App1 App1 App1 App1 App1
Every Unique App has 5 JVMs of 4GB heap each, net
heap is 20GB across all instances of the same app
JVM Consolidation ratio 4:1
CONFIDENTIAL 53

Stepwise Design Considerations
• Step 4 - What is the size of the building blockVM for this new platform, assuming youchoose a NUMA optimized configuration?
– Host= 40 cores, 4 sockets
– the most optimal configuration on this hostwould be a 4VMs setup.
– In above formula, nVMs = 4,as indicated earlier by the vendor
– NumberOfSockets = 4 and
– Total RAM on Host = 256GB
• NUMA Local Memory =
• [256 – {(256*4*0.01)+1GB}]/4=> 61.19GB
• this amount of memory is the absolute ceiling that guarantee memory NUMAlocality.
• NUMA Local Memory with Safety Buffer = 0.95 * 61.19GB => 58.13GB
4 VMs per host, each VM is of 10vCPU, each VM has 58GB RAM
10vCPU, 58GB VM
4 VMs
4 socket, 10 cores
per socket, 256GB
RAMCONFIDENTIAL 53

4 VMs
10vCPU, 58GB VM
Stepwise Design Considerations
• Step 5 - How many JVMs will be placed per the new VMconfiguration? First Determine How many Hosts you need?– You can use a building block VM size discovered earlier at 58GB Step 4,
where a host would have 4 such VMs
– Allow 1GB for each Guest OS, this means 58GB -1GB = 57GB
– Now lets determine how much RAM we need to service to the applications
• We originally had 2000 JVMs, consolidated down to 500 JVMs of 4GB, net heap in either case is 2TB (500 * 4GB or 2000 * 1GB)
• Total mem for Java process = 1.25 * heap = 1.25 * 2TB = 2.5TB
– Number of Building Blocks VMs needed 2500GB/57GB =>44VMs
– If every hosts can accommodate 4VMs (best practice 1 VM per socket), then this implies 44VMs/4=>11 hosts
– We decided on 500 JVMs earlier, this means 500/44 => 11.36 JVMs per VM
– Now since this leads to an odd number placement of JVMs per VM, we can add more hosts to even out the ratio, adding 2 more hosts will result in having 50VMs, for en even number of 10 JVMs per VM
– 11,12, or 13 hosts are possible numbers
4 socket, 10 cores
per socket, 256GB
RAM
10 JVMs per VM
CONFIDENTIAL 54

4 VMs
10vCPU, 58GB VM
Stepwise Design Considerations
• Step 6 – draw your entire cluster design showing how many JVMsper VM and how many VMs perhost, and how many total hostsare being used in the newplatform
10 JVMs per VM
4 socket, 10 cores
per socket, 256GB
RAM
15 hosts (2.5 hosts for HA spare),
4 VMs per host, total of 50 VMs,
10 JVMs per VM, VM is 58GB,
10vCPU, JVM is 4GB heap
2 .5 hosts as HA
spares
CONFIDENTIAL 55
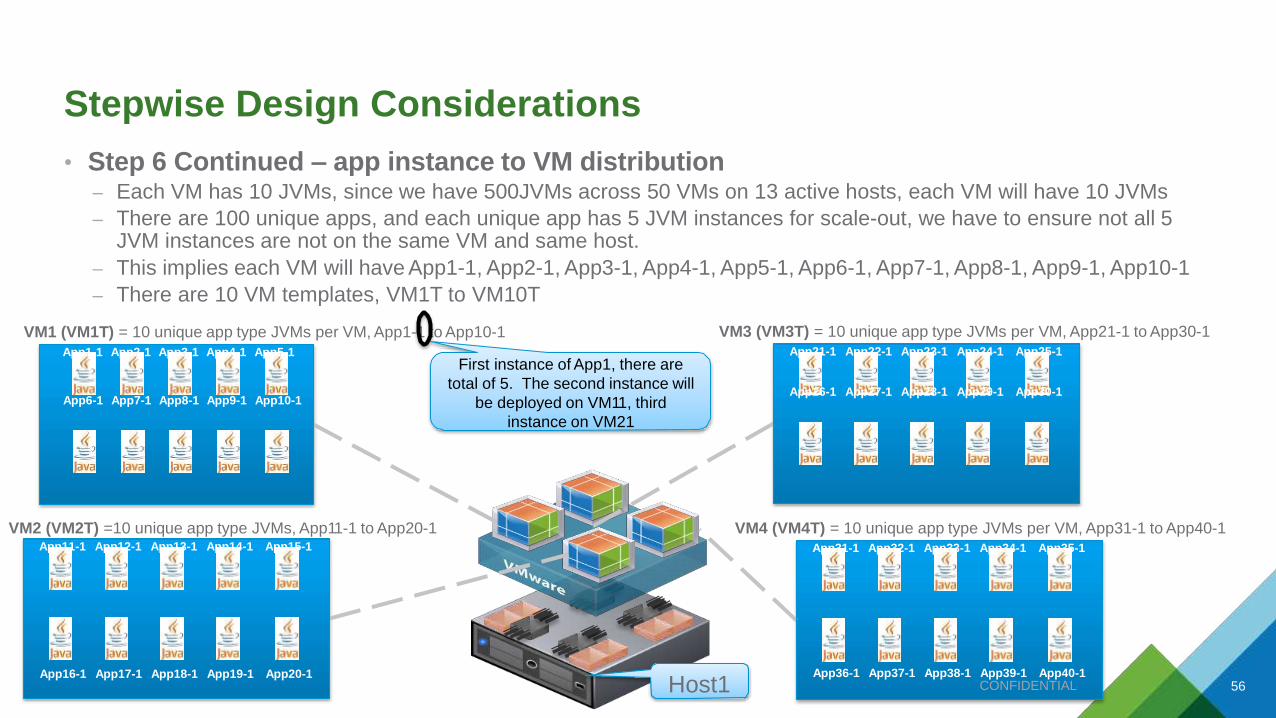
Stepwise Design Considerations
• Step 6 Continued – app instance to VM distribution– Each VM has 10 JVMs, since we have 500JVMs across 50 VMs on 13 active hosts, each VM will have 10 JVMs
– There are 100 unique apps, and each unique app has 5 JVM instances for scale-out, we have to ensure not all 5 JVM instances are not on the same VM and same host.
– This implies each VM will have App1-1, App2-1, App3-1, App4-1, App5-1, App6-1, App7-1, App8-1, App9-1, App10-1
– There are 10 VM templates, VM1T to VM10T
VM1 (VM1T) = 10 unique app type JVMs per VM, App1-1 to App10-1 VM3 (VM3T) = 10 unique app type JVMs per VM, App21-1 to App30-1
App1-1 App2-1 App3-1 App4-1 App5-1
App6-1 App7-1 App8-1 App9-1 App10-1
App11-1 App12-1 App13-1 App14-1 App15-1
App21-1 App22-1 App23-1 App24-1 App25-1
App26-1 App27-1 App28-1 App29-1 App30-1
App31-1 App32-1 App33-1 App34-1 App35-1
VM2 (VM2T) =10 unique app type JVMs, App11-1 to App20-1 VM4 (VM4T) = 10 unique app type JVMs per VM, App31-1 to App40-1
First instance of App1, there are
total of 5. The second instance will
be deployed on VM11, third
instance on VM21
App16-1 App17-1 App18-1 App19-1 App20-1 App36-1 App37-1 App38-1 App39-1 App40-1CONFIDENTIALHost1 56

Stepwise Design Considerations
• Step 6 Continued – app instance to VM distribution– Host-2 follows similar pattern continuing on with deploying VMs with 10 JBMs of the next set of unique
apps Apps41 to Apps80, instance-1
App51-1 App52-1 App53-1 App54-1 App55-1
App61-1 App62-1 App63-1 App64-1 App65-1
App66-1 App67-1 App68-1 App69-1 App70-1
App71-1 App72-1 App73-1 App74-1 App75-1
App41-1 App42-1 App43-1 App44-1 App45-1
App46-1 App47-1 App48-1 App49-1 App50-1
App56-1 App57-1 App58-1 App59-1 App60-1 App76-1 App77-1 App78-1 App79-1 App80-1CONFIDENTIALHost2 57
VM5 (VM5T) = 10 unique app type JVMs per VM, App41-1 to App50-1
VM6 (VM6T) = 10 unique app type JVMs, App51-1 to App60-1
VM7 (VM7T) = 10 unique app type JVMs per VM, App61-1 to App70-1
VM8 (VM8T) = 10 unique app type JVMs per VM, App71-1 to App80-1

Stepwise Design Considerations
• Step 6 Continued – app instance to VM distribution– Host-2 follows similar pattern continuing on with deploying VMs with 10 JVMs of the next set of unique
apps Apps81-1 to Apps100-1, instance-1, and App1-2 to App20-2, instance-2
– The first 10 VMs deployed are all of the instance-1 for all of the 100-apps, and now starting 11th VM we are deploying instance-2, this will repeat till we deploy all 50 VMs.
App91-1 App92-1 App93-1 App94-1 App95-1
App1-2 App2-2 App3-2 App4-2
App6-2 App7-2 App8-2 App9-2
App5-2
App10-2
App11-2 App12-2 App13-2 App14-2 App15-2
App81-1 App82-1 App83-1 App84-1 App85-1
App86-1 App87-1 App88-1 App89-1 App90-1
VM9 (VM9T) = 10 unique app type JVMs per VM, App81-1 to App90-1
VM10T end of template sequence
VM10 (VM10T) = 10 unique app type JVMs, App91-1 to App100-1
VM11 (VM1T) = 10 unique app type JVMs per VM, App1-2 to App10-2
VM12 (VM2T) = 10 unique app type JVMs per VM, App11-2 to App20-2
The second instance of App1 is
deployed on VM11 with VM1T
Starting at
VM1T for the
next 10 VMs
App96-1 App97-1 App98-1 App99-1 App100-1 App16-2 App17-2 App18-2 App19-2 App20-2CONFIDENTIALHost3 58

Stepwise Design Consideration
• Step 6 – Since we want to ensure the 5 scale-out/HA pair instances of each of the 100 uniqueApps are not all placed on the same host, we need to setup VM-VM Affinity rules, with type “Separate Virtual Machines”
CONFIDENTIAL 60
VM-VM
Affinity
Rule
VM pairs that will be kept separate
from each other, on separate
hosts
Comment
Rule 1 VM1, VM11,VM21,VM31,VM41 VMs with VM1T, these VMs have all 5 instances of unique apps 1 to 10
Rule 2 VM2,VM12,VM22,VM32,VM42 VMs with VM2T, these VMs have all 5 instances of unique apps 11 to 20
Rule 3 VM3,VM13,VM23,VM33,VM43 VMs with VM3T, these VMs have all 5 instances of unique apps 21 to 30
Rule 4 VM4,VM14,VM24,VM34,VM44 VMs with VM4T, these VMs have all 5 instances of unique apps 31 to 40
Rule 5 VM5,VM15,VM25,VM35,VM45 VMs with VM5T, these VMs have all 5 instances of unique apps 41 to 50
Rule 6 VM6,VM16,VM26,VM36,VM46 VMs with VM6T, these VMs have all 5 instances of unique apps 51 to 60
Rule 7 VM7,VM17,VM27,VM37,VM47 VMs with VM7T, these VMs have all 5 instances of unique apps 61 to 70
Rule 8 VM8,VM18,VM28,VM38,VM48 VMs with VM8T, these VMs have all 5 instances of unique apps 71 to 80
Rule 9 VM9,VM19,VM29,VM39,VM49 VMs with VM9T, these VMs have all 5 instances of unique apps 71 to 90
Rule 10 VM10,VM20,VM30,VM40,VM50 VMs with VM10T, these VMs have all 5 instances of unique apps 81 to 100

Stepwise Design Considerations
• Step 7 – Describe the perceived performance of the new platform, along with any savings made
in hardware and softwa e licensing costs
CONFIDENTIAL 61
Component Original Value Improved Value Comments
Hosts 20 r12.5
(15 with HA)
37.5% or with HA 25% fewer servers being used
since the overall CPU utilization is low, you could be more aggressive about
eliminating few hosts, but the limiting factor to consolidation ratio will be amount
of memory available on the hosts to service the total heap.
JVMs 2000 500 75% fewer JVMs, 75% app server license saving, 75% of monitoring agents
saved
JVM to CPU
Ratio
2000/40*20=
2.5JVMs per
core
(12*40+20)/500
1 JVM per core
CPU contention/utilization is improved by 60% here, this implies if the original
cluster was utilizing 10%, then the new cluster may use 4%. Now there are
variations to this and it is workload dependent.
Avg. Response
time
1sec 0.5sec (for actual
R/T need to load
test)
It is typical in this case since the heap size was dramatically increased by 4.x,
while load stayed constant, it is possible for response time to improve anywhere
from 50% to 300% in some cases. The response time can be further improved
since CPU utilization is very low, more CPU cycles can be allocated to the Java
garbage collection threads to clean out memory faster.
Next year if they grow by 2.x in terms of traffic, they have ample CPU cycles to
handle additional traffic.

Comparing Scenario-1 of 4 JVMs vs. Scenario-2 of 2 JVMs
• Scenario-1 4 JVMs off 1GB Heap on each, Average R/T 166ms
• Scenario-2 2 JVMs of 2GB Heap on each, Average R/T 123ms
600
200
100
0
300
400
500
1 2 3 4 5 6 7 8 9 10 11 12 13 14 15 16 17 18 19 20 21 22 23 24 25
Series1
Series2
Scenario-2 has 26% better
response time
CONFIDENTIAL 62

Comparing 4 JVMs vs. 2 JVMs
Scenario-2 (2 JVMs, 2GB heap each) has 60% less
CPU utilization than scenario-1
Scenario-1 (4JVMs, 1GB Heap Each)
CONFIDENTIAL 63

Stepwise Design Considerations
• Step 8 – describe how the management complexity of the new system compares to the old one
10vCPU, 58GB VM,
10 JVMs per VM
4 VMs
total 40
JVMs
4 socket, 10 cores
per socket, 256GB
RAM
4 socket, 10 cores
per socket, 256GB
RAM, running
single OS with 100
JVMsCONFIDENTIAL 63
Component Original
Value
Improved Value Comments
Number of Hosts 20 12 to 15 Substantially fewer servers to manage
Host OS RHEL vSphere with RHEL All of the benefits of virtualization – HA, vMotion, DRS, templates etc. Substantially
improved management
JVMs per host 100 10 JVMs per VM, 4 VMs per
host, 40JVMs per host
The old system used scripts that deployed 100 unique instances, in the new system
we deploy 40 unique app instances. The new deployment leverages VM templates,
and it has 60% fewer unique apps to deployed.

Stepwise Design Considerations
CONFIDENTIAL 65
• Step 8 – describe how the management complexity of the new system compares to the old one
Component Original Value Improved Value Comments
OS Image
Complexity
100 apps setup 10 apps setup The original host OS has 100 unique apps with varied complexity, the
Guest OS on the VM has 10 unique apps, 90% less complex.
Application
Deployment Window
every month
3hours (need
to load
minimum 3
hosts+ DB)
1.3hrs to deploy
10VMs
In the new system we deploy 10 VMs of equivalent functionality to the
old system (2.5Hosts). These VMs have 1 unique app instance of each
of the 100 apps. Used automation with load balancer to do rolling restart
– no outage needed for deployments, but does allow for 54minute
outage per year in case database schema changes are needed and/or
unsuspected outage. Hence 99.99% is the SLA uptime.
Apps Deployment 20 very large
RHEL Host OS
copies to deploy
and manage
10 Guest OS
managed in 10 VM
templates, 50 VM
instances
The old systems has 20 big OS copies to manage with very complex
100 unique apps setup.
The new system has 50 VMs, 50 OS instances, but the instance are of
10 template types, so really you only have 10 different OS types to
manage. While the deployment is across 50 OS copies which
introduces slight more OS management and cost, the savings made
else where in terms of license saving, hardware, reduced JVM
instances, reduced JVM monitoring agent cost, and flexibility/vSphere
benefits, out weigh the fact we have more OS copies.

Step 9 – Stepwise Design Considerations
• Step 9 – Describe the new uptime SLA, availability and overall scalability of the new system,how will you achieve 99.99% uptime, or better?
CONFIDENTIAL 66
Component Original Value Improved Value Comments
DR No DR DR with SRM The nearby data center in phase-1 to be setup as DR, but in phase 2 the
DR site could be treated as active-active, made of secondary cluster or
stretched cluster.
Middleware Services
and associated DB
Single Instance
Oracle DB
Moved to Oracle
RAC DB
The public portal instability is because it depends on M/W services,
which in turn points to a oracle single instance, changing this to RAC,
will help in getting 99.999%
Public Portal App 99% uptime 99.99% The weekly outages from Oracle Single instance of Middleware services
will no longer negatively impact the SLA due to RAC migration. This
saves 52hrs of downtime.
The deployment window of 3hrs originally, has been reduced to 0 , this is
largely an application deployment change.
Availability 1/20 with HA N/A (-25%) From 20 hosts without HA to 15 hosts with HA, so really old MTTR of 2hr
to 5 minutes. The fact that the number hosts has dropped it doesn’t
mean HA has dropped, in fact it has improved due to vSphere HA
functionality
Discuss JVM scalability

Step 9 – Stepwise Design Considerations
• Step 9 – Uptime? Host Availability? VM Availability? App/Service Availability?
– It all boils down to Service Availability
– We can use MTBF - Mean Time Between Failures and MTTR- Mean Time To Repair
– An absolute theoretical calculation would be Availability of each components from Host, Hypervisor, OS, JVM, and App/Service.But it turns out that all of this is really dependent on the Host availability and we will base our calculation on this
Availability (physical) = MTBF/ (MTBF + MTTR)
MTTR = 2hrsMTBF = 17520hours (2 years approx.)
Availability = 17520/ (17520+ 2) = 0.99988
10 VMs = 100 JVMs = 100 app instances
= 1 complete service
Availability (virtual) = MTBF/ (MTBF + MTTR)
MTTR_VM (VM restart) = 5minutes MTTR_4VMs_Host = 20minutes MTTR_10VMs_Service_Set = 50minutes MTBF = 17520hours (1 per year approx.)
Availability_VM = 17520/ (17520+ 5/60) = 0.99999Availability_4VMs_Host = 17520/(17520 + 20/60) = 0.99998Availability_10VMs_Service_Set = 17520/(17520+5C0O/N6F0I)DE=N0TI.A9L9995 66
Step 9 – How About DR?
CONFIDENTIAL 67
• Re-purpose the 5 servers saved from external apps consolidation
• Purchase additional 1 4 socket server, by selling the unused 2 sockets 6core per socket servers saved from the middleware project
• Use SRM for Apps and Dataguard for DBs

Stepwise DesignConsiderations
External Apps
Public Portal
ESXi Cluster
(50VMs)
External
Apps
Improved to-be
Arch uses 6 hosts
for servicing
400GB heap
(12VMs)External Apps
Middleware
Cluster
LLB
LLB
50 VMs down to20 Portal VMs
12 VMs down to 4 VMs (but larger JVMs, 10vCPU VM instead of original 6vCPU, 58GB VM instead of 45GB, 43GB Java heap instead of 34GB )
External Apps
Public Portal &
M/W ESXi
Cluster (20
portal VMs + 4
M/W VMs)
GLB
Apps via
SRM
Oracle RAC4 VMsusing Dataguard
DB RAC and
Batch cluster in
dedicated ESXi
cluster due to
CONFIDENTIAL 68Databases
Oracle
licensing

Backup Slides

What ElseDo I needTo Know?Next Generation Platforms, Summarizing Day-1, and a final note on Deep Dive Tuning of Java Platforms

Containers .class.class
.class
.jar
or
.jar.jar
compiled
packaged
packaged deployed
Stack
Perm
Gen
Initial
Heap
Guest
OS
MemoryJava
JVM Heap
Host
Hypervisor
App + VM Process
Bins/Libs/JVMs
Guest OS
Virtualization based process
and app encapsulation, with
Guest OS overhead/burden
Host
App1
OS
App1
Container
Bins/Libs/JVMs
Guest OS
Earlier we talked about
code packaging into war
and jar file archives
Server Client
App2
Container 1Container 2
Command Line
control
LXC/
libcontainerContainer
Engine
CONFIDENTIAL 72

Containers – How Are They Used Today!?
• Developer packages the necessary software components, bins/libs, and other related processes into a container and ships it
• An application or a set of services that collectively make an application may have many developers, each deploying their owncontainer. Collectively they form the platform. This is short sighted and causesfragmented scale-out and poor responsetime
Developer1
App1
Creates container
Developer2
App1
Creates container
Platform 1 (QA)
App1 App1
Ships container
Ships container
Platform 2 (PROD)App1 App1
Ships containers to another environment
CONFIDENTIAL 74

VM and Container Isolation are Better Together
VMs
Containers
• Hardware level isolation
• Focused on security andmulti-tenancy
• 15 years in production, battle tested
• OS level isolation
• Focused on environmentalconsistency
• Emerging, still maturing
Great for security Great for reproducibility
rs
VMs
Best of both worlds
CONFIDENTIAL 75
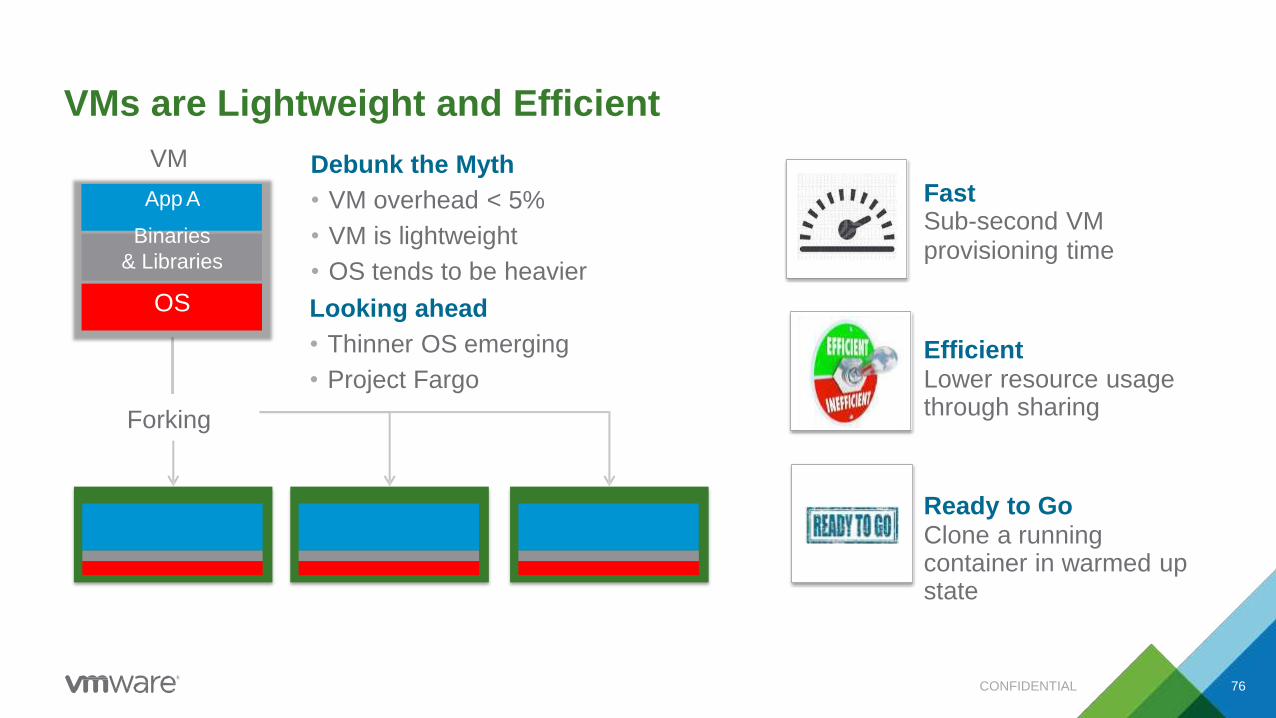
VMs are Lightweight and Efficient
Forking
FastSub-second VMprovisioning time
EfficientLower resource usage through sharing
Ready to GoClone a runningcontainer in warmed upstate
App A
Binaries
& Libraries
OS
CONFIDENTIAL 76
VM Debunk the Myth
• VM overhead < 5%
• VM is lightweight
• OS tends to be heavier
Looking ahead
• Thinner OS emerging
• Project Fargo

VMfork
CONFIDENTIAL 77
• VMfork addresses VM’s weaknesses:
• VMfork allows us to leapfrog:
– VMfork VMs with running containers
– Avoid container start up/warm up time entirely
– Better than physical solution
Containers VMs w/ VMfork
Layer of abstraction Application Operating System
Resource consumption More efficient As efficient
Provisioning time Fast Fast
Security Less secure More secure
Isolation Less isolation More isolation

Microservices?
• Microservices is a software architecture design pattern, in which complex applications are composed of small, independent processes communicating with each other using language-agnostic APIs.
• These services are small, highly decoupled and focus on doing a small task.
• Co-location of services next to each other on basis of offering best response time, remains a challenge, but a good designer will know how to define Microservices but deploy them in a macro fashion in order toimprove response time and reduce network hops
• Everything remote is not always best
• This is a great approach if you are building 3rd platform apps, and you can afford to build
functionality, so you subscribe to service providers for certain functions
Function1
Function2
Function3
Traditional non
microservices
approach, all
functionality
into one app
archive
Function1
Service 1
Function2
Service 2
Function3
Service 3
Microservice
approach
CONFIDENTIAL 78

XYZCars.com – External Apps Platform's Middleware Services is an Example of Microservices Architecture
• 25 unique REST Services
• Xyzcars.com deployed each REST service on a dedicated JVM
• Microservices approach
• Micro defined
• Micro deployed
• Costly architecture and poor performance
• Offers ultimate flexibility, but this is not practical
Current Arch uses 16
hosts for servicing
400GB heap
Improved to-beArch uses
6 hosts for servicing
400GB heap
CONFIDENTIAL 79
• 25 unique REST Services
• 1 JVM has 25 REST service instances
• Microservices approach
• Micro defined
• Macro deployed
• Cost efficient
• High performing
• Good enough flexibility that is practical

XYZCars.com – External Apps PAplaprtofaochr1m- M'sicroMDeifdinedd l&eMwicrao re Services isan Example of Microservices Architecture
Improved to-beArch uses
6 hosts for servicing
400GB heap
• 25 unique REST Services
• 1 JVM has 25 REST service instances
• Microservices approach
• Micro defined
• Macro deployed
• Cost efficient
• High performing
Rest1 Rest2 Rest3 Rest25
Deployed Fragmented Scale out
consumes more resources, more
VMs, has poor response time
Rest1
Container
Rest2
Rest25
Rest1
Rest2
Rest25
Rest1
Rest2
Rest25
Approach 2 - Micro Defined Microservices
BUT & MACRO Deployed NON-Fragmented
Scale out consumes less resources, fewer
VMs, has GRCEOANFTIDrEeNsTIpALonse time
25 container
types, 400
container
instances
1 container
type, 12
container
instances
79

3rd Platform?
• 2nd Platforms are stateful, need lots of care, supposedly difficult to change
• 3rd platform are all around microservices/macroservices concepts, independent software services, called in a sequence to formulate overall application logic
– Touted as stateless, if you lose one, it doesn’t matter you always haveanother copy somewhere else
– Supposedly easy to re-deploy/flexible, but this is not always the case
2nd Platform
3rd Platform
Web tier
App tier
DB tier
2nd Platform
Load
BalancerAuthentication Licensing
Session
Store
Provisioning Monitoring
DNSContentDatabase
x3
Web
Server
x3
…
3rd Platform
CONFIDENTIAL 81

Multi-tenancy and Cloud
CONFIDENTIAL 82
• Cloud efficiency can only be achieved if you have true and cost effective multi tenancy
• 3rd platforms quickly drive the cost of operation in cloud due to massive-scale-out nature, hence density compaction in order to be cost efficient becomes paramount
– Will it be the container that plays a solution here?
– Others think that multi-tenant JVMs will short circuit the entire movement as it offers containerization atthe

Where Is Java on VMware Stack?
• vCenter – 3 or more JVMs, for example Inventory Service, Webservice JVM, Web Client, Storage Service, SSO, Log Browser
– Set –Xms=-Xmx
– I am currently helping engineering with https://bugzilla.eng.vmware.com/show_bug.cgi?id=1363812
CONFIDENTIAL 83

Where Is Java on VMware Stack?
CONFIDENTIAL 84

Where Is Java on VMware Stack?
• vRealize Ops – 3 main JVMs but the Analytics JVM is the largest –I recently worked on a GA bug tomore appropriately size and tune the JVM from our product perspective
• Log Insight
• vRealize Automation
• NSX Manager
-agentpath:/usr/yjp-2013-build-13072/bin/linux-x86-
64/libyjpagent.so=builtinprobes=none,delay=10000,port=110
01
-Djava.rmi.server.hostname=10.143.120.164
-XX:PermSize=1024m
-XX:+CMSParallelRemarkEnabled
-XX:+UseParNewGC
-server
-Xmn9g
-XX:+ScavengeBeforeFullGC
-XX:TargetSurvivorRatio=80
-XX:SurvivorRatio=8
-XX:+UseBiasedLocking
-XX:MaxTenuringThreshold=15
-XX:ParallelGCThreads=8
-XX:+OptimizeStringConcat
-XX:+UseCompressedStrings
-XX:+UseStringCache
-XX:+DisableExplicitGC
-XX:+AlwaysPreTouch
-Xms29696m
-Xmx29696m
CONFIDENTIAL 85

What Are Some Java/Erlang/C/C++ Products We Have Virtualized?
Pivotal tcServer
Java, C, .netAPIs
Erlang
Java App Servers
Java Search Engines
Modern DBS: Java/other In Memory DBs, NoSQL, or HDFS
More DBs: http://kkovacs.eu/cassandra-vs-mongodb-vs-couchdb-vs-redis
C++
Hudson
Pure Java
Hadoop Distributions
(Hadoop is Java based)
Java Based Build
Systems (CI)
CONFIDENTIAL 86

The Famous Continuous Integration (CI) Use Case
• This use case is being talked about across VMware a lot
• While it is a key entry point for us, it is a much narrower use case than holistic EA2
• In EA2 you learn the entire architecture o the enterprise and all of the important u cases, as opposed to just one in the cas of CI
• Every developer has these under the hood
– DevOps would love to own them
– vRealize Code Stream is effectively awrapper for Artifactory
– Sold as stand alone product
• See engineering page:http://url.vmware.com/gxjb
fsee
CI Servers
CONFIDENTIAL 87
Version Control
Build Systems
Repository for Binaries

Day-1 Summary
CONFIDENTIAL 88
• Typical Enterprise Application Architecture – EA2
• XYZCars.com Use Case
• Platform Engineering, and various platform architectures
• Saw how the m/w platform for XYZCars.com could be refined
• Applied learning during design exercise to create to-be architecture for the public portal of 100apps that are part of the XYZcar.com external platform

Application Platforms Are Multi-TierJava Platforms are multitier and multi org
DB ServersJava Applications
Load Balancer Tier
Load Balancers Web Servers
IT Operations
Network Team
IT Operations
Server Team
ITApps –
Java Dev Team
IT Ops &
Apps Dev Team
Organizational Key Stakeholder Departments
Web Server Tier Java App Tier DB Server Tier
CONFIDENTIAL 89

DB Servers
Load Balancer Tier Web Server Tier
Java App Tier
DB Server Tier
Web Server Pool
App Server Pool
DB Connection Pool
Html static lookup
requests (load on
webservers)
Dynamic Request to DB,
create Java Threads
(load on Java App server
and DB)
CONFIDENTIAL 90

Java Platform Categories – Category 1(many smaller JVMs)
• Smaller JVMs < 4GB heap, 4.5GBJava process, and 5GB for VM
• vSphere hosts with <96GB RAM is more suitable, as by the time you stack the many JVM instances, you are likely to reach CPU boundary before you can consume all of the RAM. For example if instead you chose a vSphere host with 256GB RAM, then 256/4.5GB=> 57JVMs, this would clearly reach CPU boundary
• Multiple JVMs per VM
• Use Resource pools to manage different LOBs
• Consider using 4 socket servers to get more cores
Category 1: 100s to 1000s of JVMs
CONFIDENTIAL 91
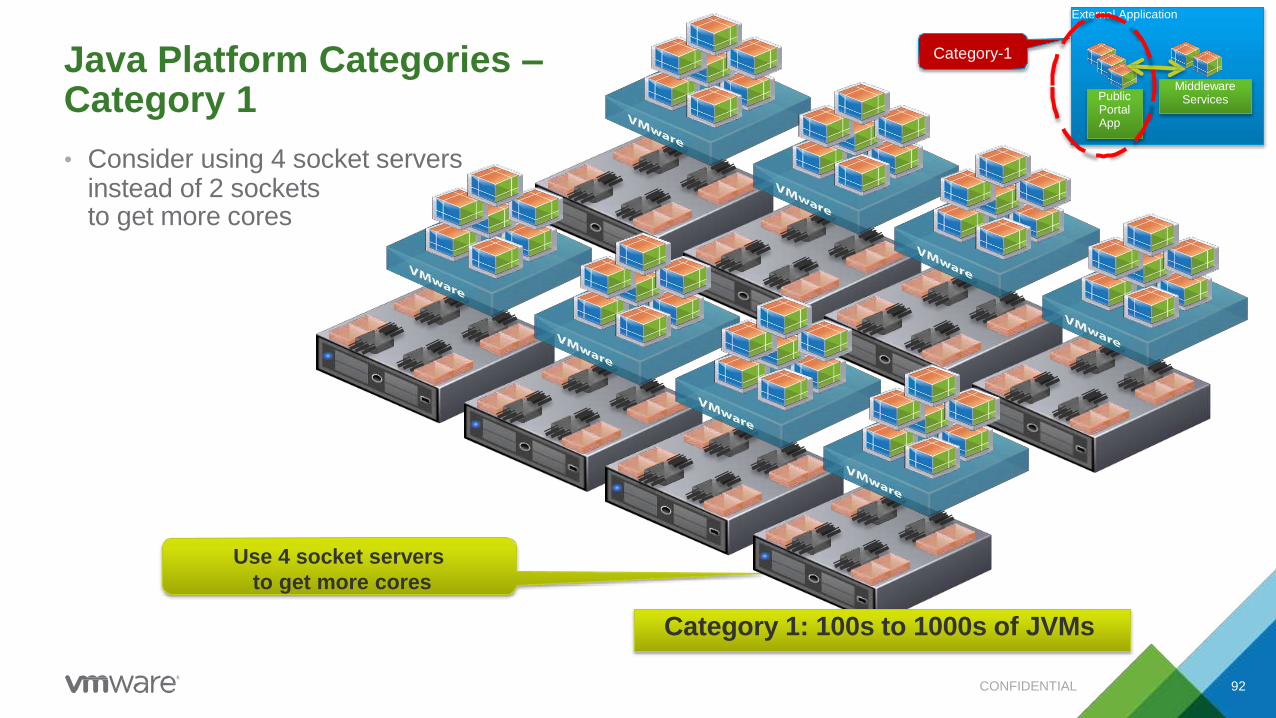
Java Platform Categories –Category 1
• Consider using 4 socket servers instead of 2 socketsto get more cores
Use 4 socket servers
to get more cores
Category 1: 100s to 1000s of JVMs
External Application
PublicPortalApp
Middleware Services
Category-1
CONFIDENTIAL 92

Java Platform Categories – Category 2fewer larger JVMs
• Fewer JVMs < 20
• Very large JVMs, 32GB to 128GB
• Always deploy 1 VM per NUMA nodeand size to fit perfectly
• 1 JVM per VM
• Choose 2 socket vSphere hosts, andinstall ample memory128GB to 512GB
• Example is in memory databases, like SQLFire and GemFire
• Apply latency sensitive BP disable interrupt coalescing pNIC and vNIC
• Dedicated vSphere cluster
Category 2: a dozen of very large JVMs
Use 2 socket servers
to get larger NUMA
nodes
External Application
Category-2
PublicPortalApp
Middleware Services
CONFIDENTIAL 93
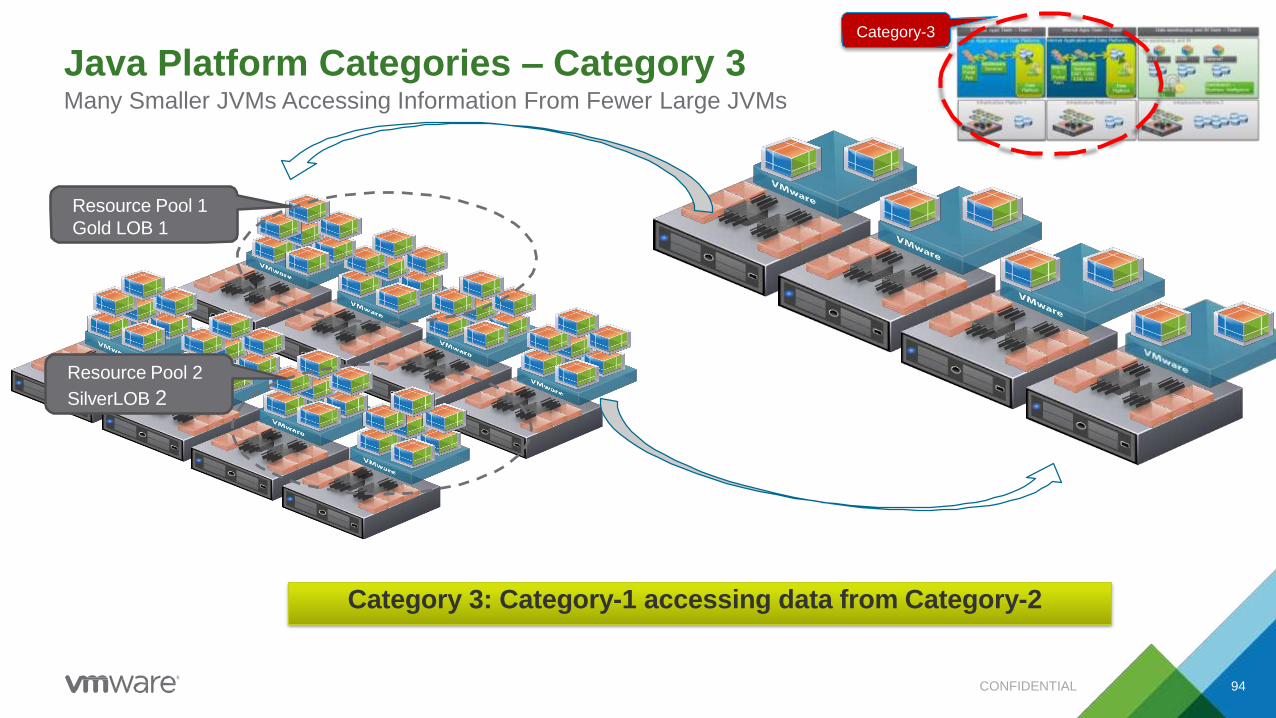
Java Platform Categories – Category 3Many Smaller JVMs Accessing Information From Fewer Large JVMs
Category 3: Category-1 accessing data from Category-2
Resource Pool 1
Gold LOB 1
Resource Pool 2
SilverLOB 2
Category-3
CONFIDENTIAL 94

Design and Sizing of Application Platforms
Step 1-
Establish Load profile
• From production logs/monitoring reports measure:
• ~Concurrent Users
• ~Requests Per Second
• ~Peak Response Time
• ~Average Response Time
• ~Establish your response time SLA
Step2
Establish Benchmark
• Iterate through Benchmark test until you are satisfied with the Load profile metrics and your intended SLA
• ~after each benchmark iteration you may have to adjust the Application Configuration
• ~Adjust the vSphere environment to scale out/up in order to achieve your desired number of VMs, vCPU and RAM configurations
Step 3-
Size Production Env.
• The size of the production environment would have been established in Step2, hence either you roll out the environment from Step-2 or build a new one based on the numbers established
CONFIDENTIAL 95

Step 2 – Establish Benchmark
DETERMINE HOW MANY VMs
Establish Horizontal Scalability
Scale Out Test
• How many VMs do you need to meet your
Response Time SLAs without reaching
70%-80% saturation of CPU?
• Establish your Horizontal scalability Factor
before bottleneck appear in your application
Scale Out Test
Building Block VM Building Block VM
SLA
OK?
Test
complete
Investigate bottlnecked layer
Network, Storage, Application
Configuration, & vSphere
If scale out bottlenecked
layer is removed,
iterate scale out test
If building block app/VM
config problem, adjust &
iterate No
ESTABLISH BUILDING BLOCK VM
Establish Vertical scalability
Scale Up Test
• Establish how many JVMs on a VM?
• Establish how large a VM would be in terms
of vCPU and memory
Scale
Up
Test
Building Block VM
CONFIDENTIAL 96

HotSpot JVMs on vSphere
JVM Max
Heap
-Xmx
JVM
Memory
Perm Gen
Initial Heap
Guest OS
Memory
VM
Memory
-Xms
Java Stack
-Xss per thread
-XX:MaxPermSize
Other mem
Direct native
Memory
“off-the-heap”
Non Direct
Memory
“Heap”
CONFIDENTIAL 97
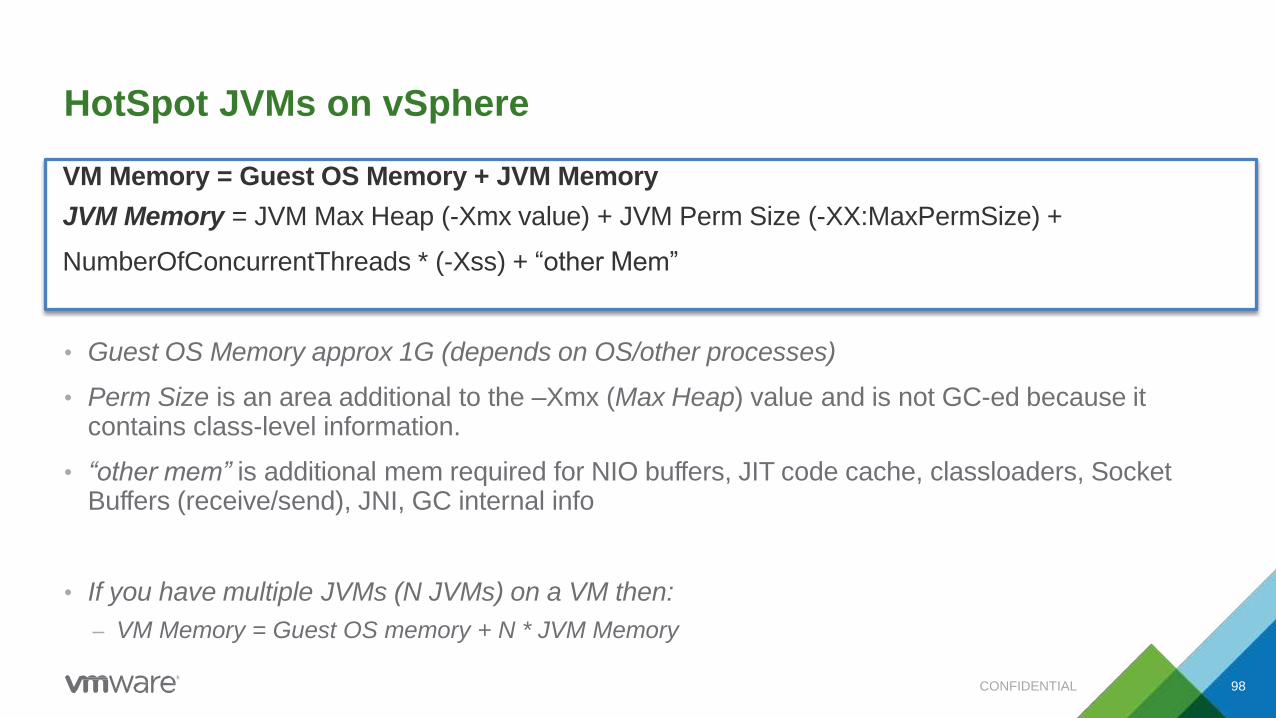
HotSpot JVMs on vSphere
• Guest OS Memory approx 1G (depends on OS/other processes)
• Perm Size is an area additional to the –Xmx (Max Heap) value and is not GC-ed because itcontains class-level information.
• “other mem” is additional mem required for NIO buffers, JIT code cache, classloaders, SocketBuffers (receive/send), JNI, GC internal info
• If you have multiple JVMs (N JVMs) on a VM then:
– VM Memory = Guest OS memory + N * JVM Memory
VM Memory = Guest OS Memory + JVM Memory
JVM Memory = JVM Max Heap (-Xmx value) + JVM Perm Size (-XX:MaxPermSize) +
NumberOfConcurrentThreads * (-Xss) + “other Mem”
CONFIDENTIAL 98

Sizing Example
JVM Max
Heap
-Xmx
(4096m)
JVM
Memory
(4588m) Perm Gen
Initial Heap
Guest OS
MemoryVM
Memory
(5088m)
-Xms (4096m)
Java Stack -Xss per thread (256k*100)
-XX:MaxPermSize (256m)
Other mem (=217m)
500m used by OS
set mem Reservation to 5088m
CONFIDENTIAL 99
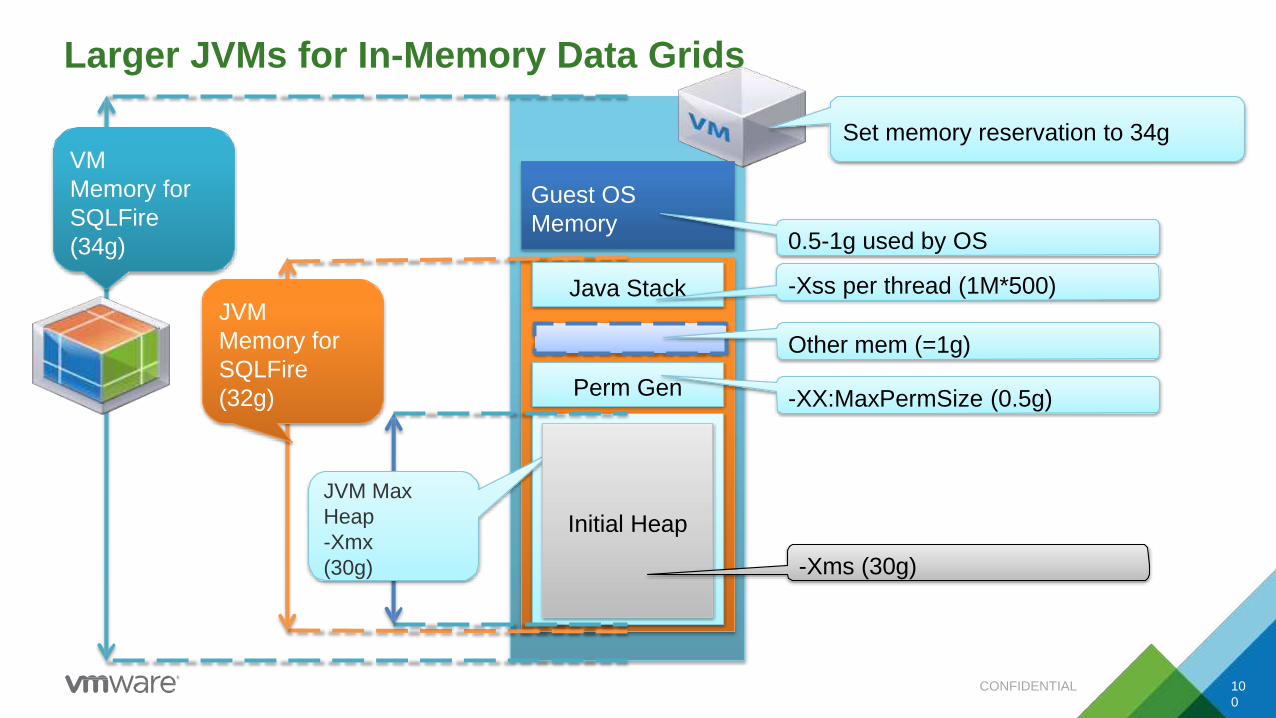
JVM Max
Heap
-Xmx
(30g)
Perm Gen
Initial Heap
Guest OS
Memory
-Xms (30g)
Java Stack
0.5-1g used by OS
-Xss per thread (1M*500)
-XX:MaxPermSize (0.5g)
Other mem (=1g)
Set memory reservation to 34g
JVM
Memory for
SQLFire
(32g)
VM
Memory for
SQLFire
(34g)
Larger JVMs for In-Memory Data Grids
CONFIDENTIAL 10
0

96 GB RAM
on Server
Each NUMA
Node has 94/2
45GB
8 vCPU VMs
less than
45GB RAM
on each VM
If VM is sized greater
than 45GB or 8 CPUs,
Then NUMA interleaving
Occurs and can cause
30% drop in memory
throughput performance
ESXi Scheduler
CONFIDENTIAL 100

Application Performance
Quick Notes

Performance PerspectiveSee the Performance of Enterprise Java Applications on VMware vSphere 4.1 and SpringSource tc Serverat http://www.vmware.com/resources/techresources/10158 .
CONFIDENTIAL 10
3

Performance PerspectiveSee the Performance of Enterprise Java Applications on VMware vSphere 4.1 and SpringSource tc Serverat http://www.vmware.com/resources/techresources/10158 .
80% Threshold
CONFIDENTIAL 10
4
% CPU
R/T

Virtualized Websphere Performance StudyIBM and HP joint performance study:
http://www.vmware.com/resources/techresources/10095
CONFIDENTIAL 10
5

Virtualized Websphere Performance Study
CONFIDENTIAL 10
6

Virtualized Websphere Performance Study
App bottleneck
appeared
Result not valid
2 & 4 vCPU outperform
physical due to ESXi L3
cache hit rate is better than
GuestOS L3 hit rate
CONFIDENTIAL 10
7

Inside the Java Heap
CONFIDENTIAL 10
8
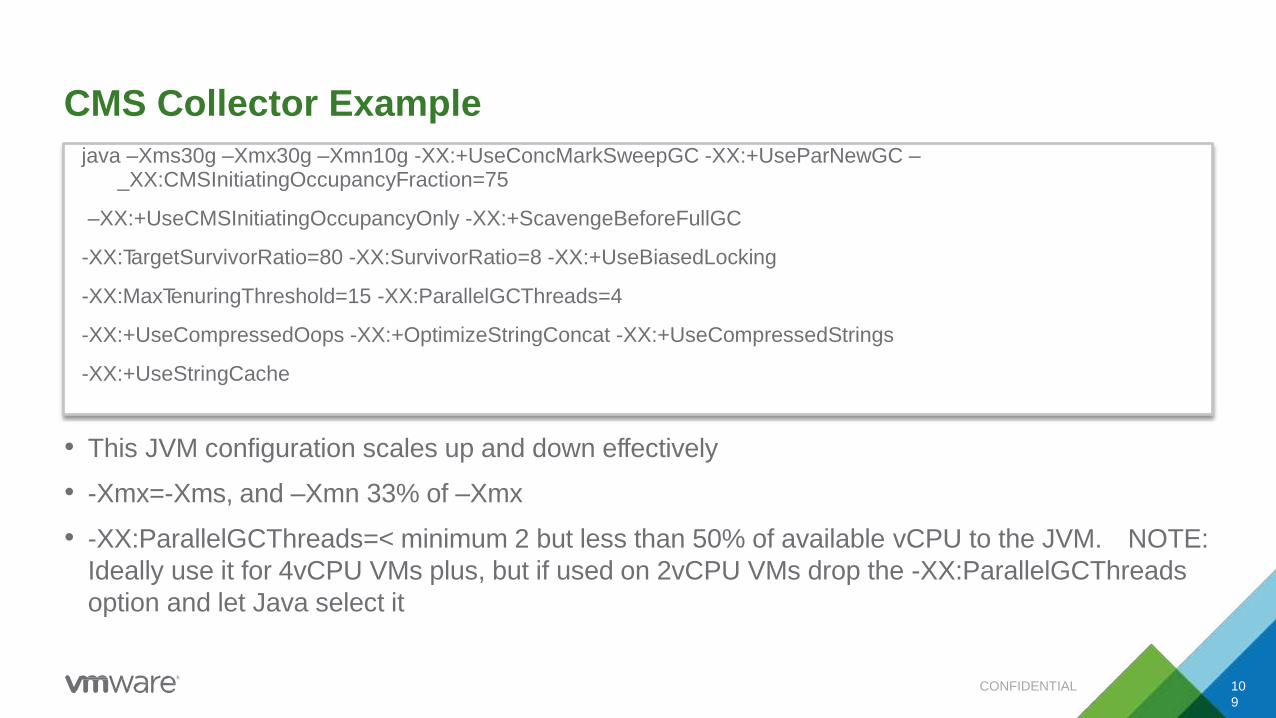
CMS Collector Example
java –Xms30g –Xmx30g –Xmn10g -XX:+UseConcMarkSweepGC -XX:+UseParNewGC –_XX:CMSInitiatingOccupancyFraction=75
–XX:+UseCMSInitiatingOccupancyOnly -XX:+ScavengeBeforeFullGC
-XX:TargetSurvivorRatio=80 -XX:SurvivorRatio=8 -XX:+UseBiasedLocking
-XX:MaxTenuringThreshold=15 -XX:ParallelGCThreads=4
-XX:+UseCompressedOops -XX:+OptimizeStringConcat -XX:+UseCompressedStrings
-XX:+UseStringCache
CONFIDENTIAL 10
9
• This JVM configuration scales up and down effectively
• -Xmx=-Xms, and –Xmn 33% of –Xmx
• -XX:ParallelGCThreads=< minimum 2 but less than 50% of available vCPU to the JVM. NOTE:
Ideally use it for 4vCPU VMs plus, but if used on 2vCPU VMs drop the -XX:ParallelGCThreads
option and let Java select it

Another Example (360GB JVM)
• A monitoring system that does not scale out, runs in a large single JVM of –Xmx360g, i.e. 360GB
• The server has 512GB and 2 sockets of 10 cores each
• 360GB + 1GB for OS + 25% * 360GB for off-the-heap overhead
– => 360GB + 1GB + 90GB => 451GB is the VMs memory Reservation
• The VM has 20 vCPUs
java –Xms360g –Xmx360g –Xmn10g –Xss1024k -XX:+UseConcMarkSweepGC -XX:+UseParNewGC –_XX:CMSInitiatingOccupancyFraction=75
–XX:+UseCMSInitiatingOccupancyOnly -XX:+ScavengeBeforeFullGC
-XX:TargetSurvivorRatio=80 -XX:SurvivorRatio=8 -XX:+UseBiasedLocking
-XX:MaxTenuringThreshold=15 -XX:ParallelGCThreads=10 -XX:+OptimizeStringConcat -XX:+UseCompressedStrings
-XX:+UseStringCache –XX:+DisableExplicitGC –XX:+AlwyasPreTouch
CONFIDENTIAL 11
0

IBM JVM - GC Choice
-Xgc:mode Usage Example
-Xgcpolicy:Optthruput
(Default)
Performs the mark and sweep operations during
garbage collection when the application is paused to
maximize application throughput. Mostly not suitable
for multi CPU machines.
Apps that demand a high throughput
but are not very sensitive to the
occasional long garbage collection
pause
-Xcpolicy:OptavgpausePerforms the mark and sweep concurrently while the
application is running to minimize pause times; this
provides best application response times.
There is still a stop-the-world GC, but the pause is
significantly shorter.After GC, the app threads help
out and sweep objects (concurrent sweep).
Apps sensitive to long latencies
transaction-based systems where
Response Time are expected to be
stable
-Xgcpolicy:Gencon
Treats short-lived and long-lived objects differently to
provide a combination of lower pause times and high
application throughput.
Before the heap is filled up, each app helps out and
mark objects (concurrent mark).
Latency sensitive apps, objects in the
transaction don't survive beyond the
transaction commit
Job
Web
Web
CONFIDENTIAL 11
1

Customer Success Stories

NewEdge
• Category-2 Workload
• Virtualized GemFire workload
• Multiple geographic active-activedatacenters
• Multiple Terabytes of data kept in memory
• 1000s of transactions per second
• Multiple vSphere clusters
• Each cluster 4 vSphere hosts and 8 large98GB+ JVMs
http://www.vmware.com/files/pdf/customers/VMware-Newedge-12Q4-EN-Case-Study.pdf
CONFIDENTIAL 11
3

Cardinal Health Virtualization Journey
Consolidation
• < 40% Virtual
• <2,000 VMs
• <2,355 physical
Data Center Optimization
• 30 DCs to 2 DCs
Transition to Blades
• <10% Utilization
• <10:1 VM/Physical
Low Criticality Systems
• 8X5 Applications
Internal cloud
>58% Virtual
>3,852 VMs
<3,049 physical
Power Remediation
P2Vs on refresh
HW Commoditization
15% Utilization
30:1 VM/Physical
Business Critical Systems
SAP ~ 382
WebSphere ~ 290
Unix to Linux ~ 655
Cloud Resources
• >90% Virtual
>8,000 VMs
<800 physical
Optimizing DCs
Internal disaster recovery
Metered service offerings (SAAS,PAAS, IAAS)
Shrinking HW Footprint
> 50% Utilization
> 60:1 VM/Physical
Heavy Lifting Systems
Database Servers
Virtual
HW
SW
Timeline 2005 – 2008 2009 – 2011 2012 – 2015
DC
CONFIDENTIAL 11
4
Theme Centralized IT
Shared Service
Capital Intensive - High Response Variable Cost SubscriptionServices

Middleware on VMware – Best Practices
CONFIDENTIAL 11
5
Enterprise Java Applications
on VMware Best Practices
Guide
http://www.vmware.com/resources/techresources/1087
Best Practices for
Performance Tuning of
Latency-Sensitive Workloads
in vSphere VMs
http://www.vmware.com/resources/techresources/10220
vFabric SQLFire Best
Practices Guide
http://www.vmware.com/resources/techresources/10327
vFabric Reference Architecture http://tinyurl.com/cjkvftt

Who Is Interested in Deep Dive Tuning?Tuning Large Scale Java Platforms
“It’s not that I’m so smart, it’s justthat I stay with problems longer.”

Which GC?
• VMware doesn’t care which GC you select, because of the degree of independence of Java to OS and OS to Hypervisor
CONFIDENTIAL 11
7
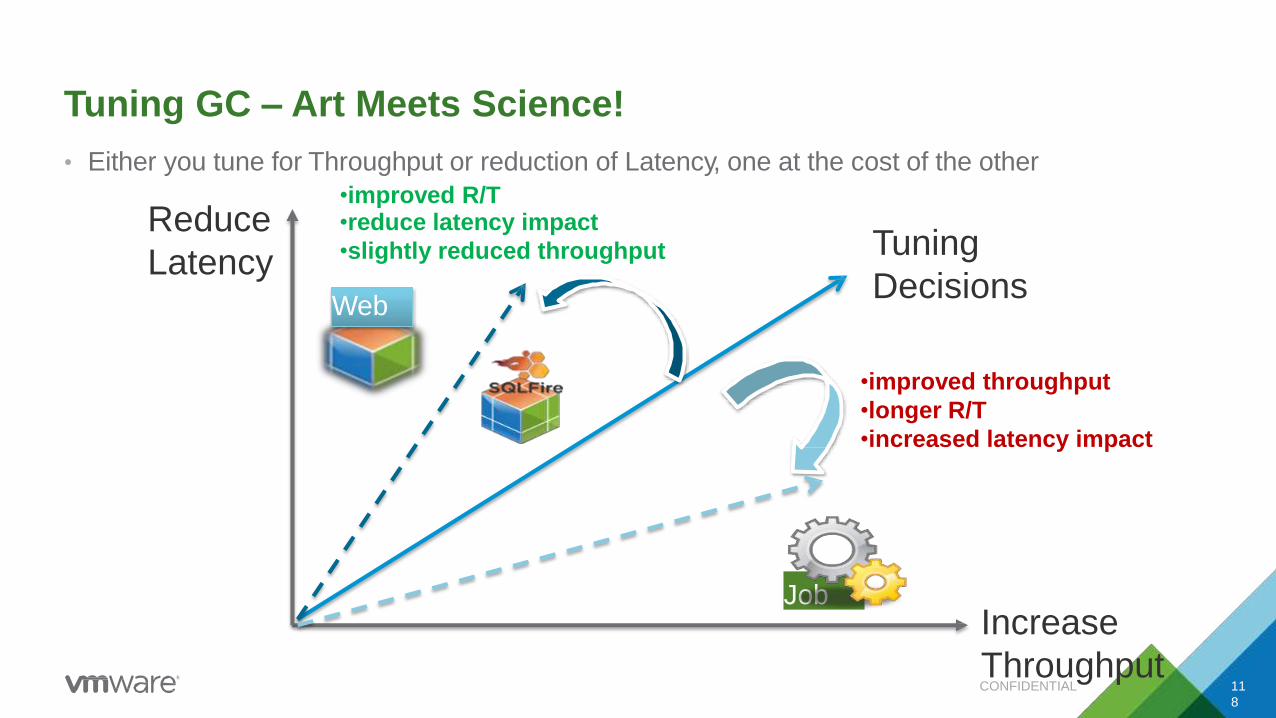
Tuning GC – Art Meets Science!
• Either you tune for Throughput or reduction of Latency, one at the cost of the other
•improved R/T
Increase
Throughput
Reduce
LatencyTuning
Decisions
•reduce latency impact
•slightly reduced throughput
•improved throughput
•longer R/T
•increased latency impact
Job
Web
CONFIDENTIAL 11
8

Sizing the Java Heap
JVM Max
Heap
-Xmx
(4096m)
Eden Space
Survivor
Space 2
Old Generation
Survivor
Space 1
Slower
Full GC
Quick
Minor GCYoungGen
-Xmn
(1350m)
OldGen
CONFIDENTIAL 11
9
2746m

Inside the Java Heap
CONFIDENTIAL 12
0

Parallel Young Gen and CMS Old Gen
application threadsminor GC threads concurrent mark and sweep GC
Young Generation Minor GCParallel GC in YoungGen using
XX:ParNewGC & XX:ParallelGCThreads
-Xmn
Old Generation Major GCConcurrent using in OldGen using
XX:+UseConcMarkSweepGC
Xmx minus Xmn
S S
0 1
CONFIDENTIAL 12
1

High Level GC Tuning Recipe
Measure Minor
GC Duration
and Frequency
Adjust –Xmn Young
Gen size
and /or
ParallelGCThreads
Measure
Major GC
Duration
And
Frequency
Adjust
Heap space
–Xmx
Adjust –Xmn
And/or
SurvivorSpaces
Step A-Young Gen Tuning
Step B-Old Gen Tuning
Step C- Survivor
Spaces Tuning
Applies to
Category-1 and 2 Platforms
Applies to
Category-2 Platforms
CONFIDENTIAL 12
2
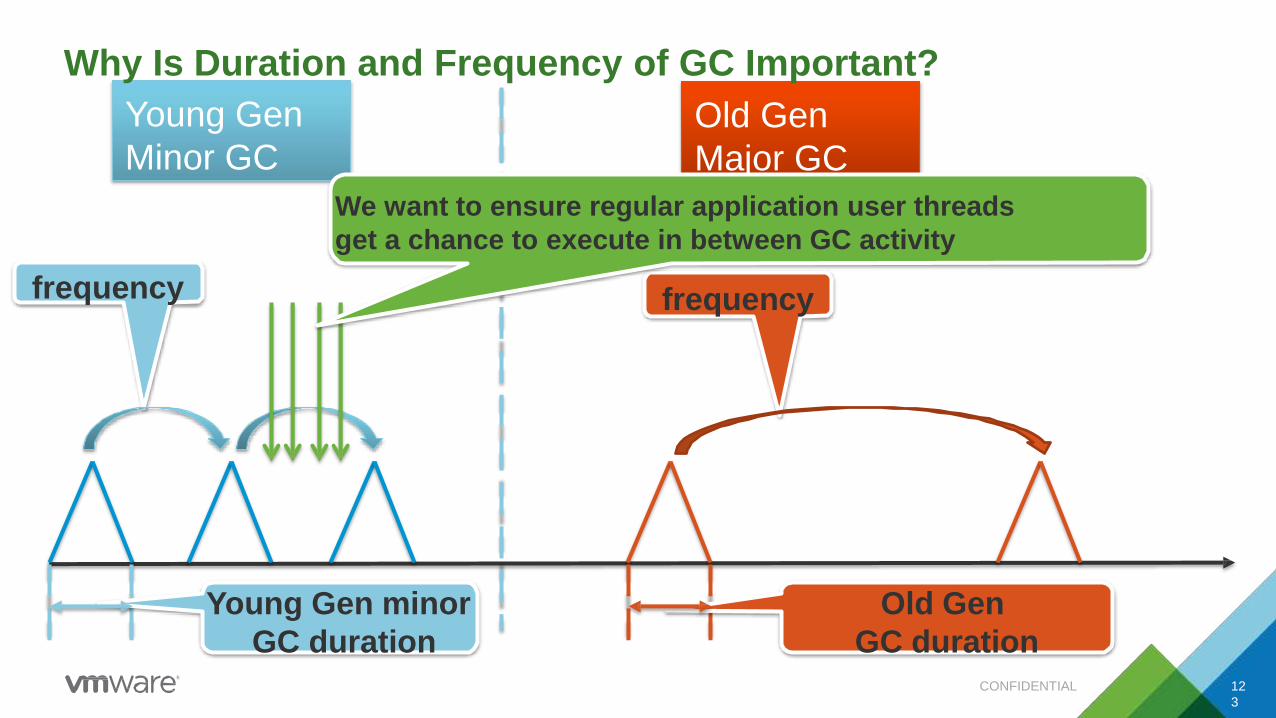
Young Gen
Minor GC
Old Gen
Major GC
Young Gen minor
GC duration
frequency frequency
Old Gen
GC duration
We want to ensure regular application user threads
get a chance to execute in between GC activity
CONFIDENTIAL 12
3
Why Is Duration and Frequency of GC Important?

Young Gen
Minor GC
Old Gen
Major GC
less frequent Minor GC
but longer duration
You can mitigate the
increase in Minor GC
duration by
increasing
ParallelGCThreads
CONFIDENTIAL 12
4
potentially increased
Major GC frequency
You can mitigate the
increase in GC
frequency
by increasing -Xmx
Impact of Increasing Young Generation (-Xmn)

Young Gen
Minor GC
Old Gen
Major GC
more frequent
Minor GC but shorter
duration
Potentially increased
Major GC duration
You can mitigate the
increase in Major GC
duration by
decreasing -Xmx
CONFIDENTIAL 12
5
Impact of Reducing Young Generation (-Xmn)
Survivor Spaces
CONFIDENTIAL 12
6
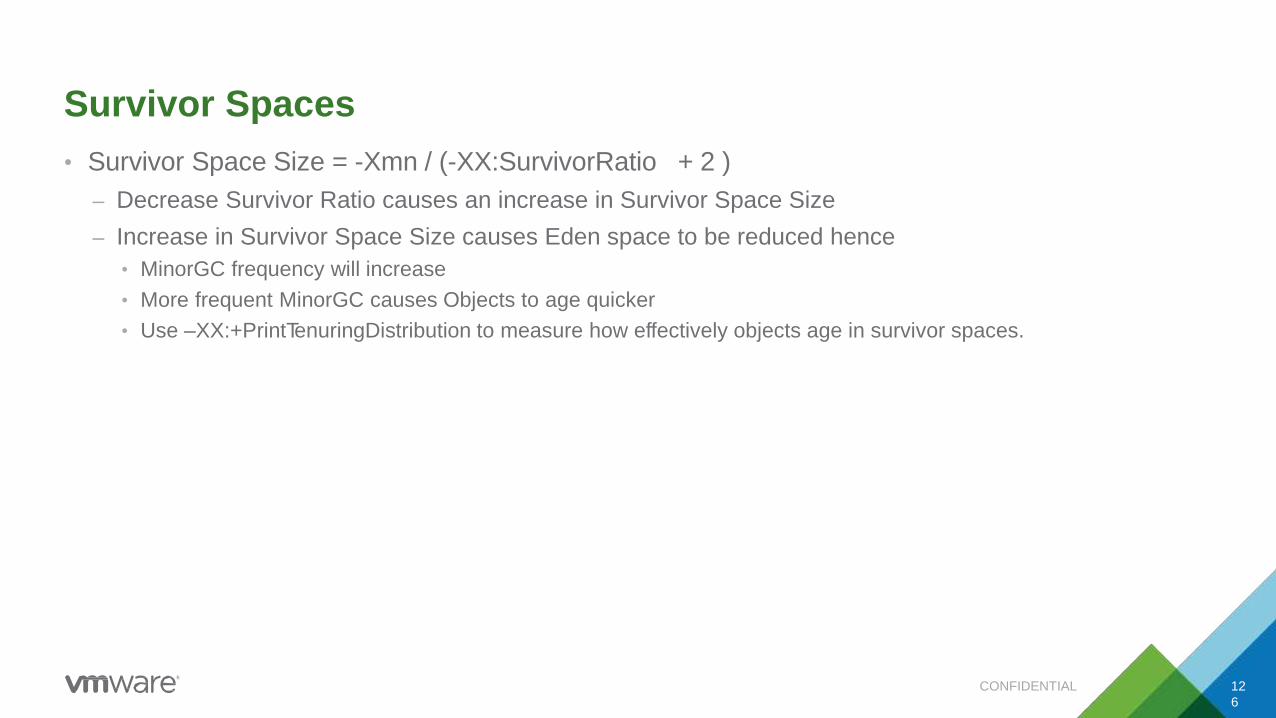
• Survivor Space Size = -Xmn / (-XX:SurvivorRatio + 2 )
– Decrease Survivor Ratio causes an increase in Survivor Space Size
– Increase in Survivor Space Size causes Eden space to be reduced hence
• MinorGC frequency will increase
• More frequent MinorGC causes Objects to age quicker
• Use –XX:+PrintTenuringDistribution to measure how effectively objects age in survivor spaces.
Young Gen
Minor GC
Old Gen
Major GC
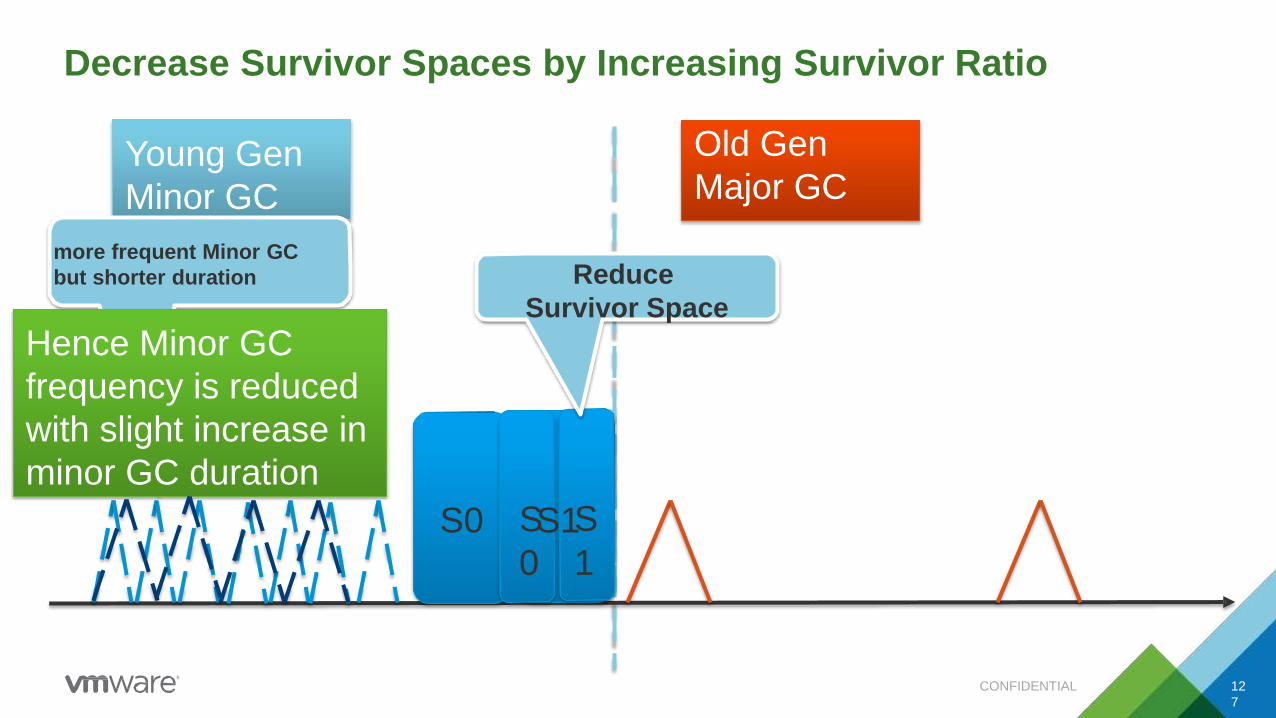
more frequent Minor GC
but shorter duration
Hence Minor GC
frequency is reduced
with slight increase in
minor GC duration
S0 SS1S
0 1
Reduce
Survivor Space
CONFIDENTIAL 12
7
Decrease Survivor Spaces by Increasing Survivor Ratio
Young Gen
Minor GCOld Gen
Major GC
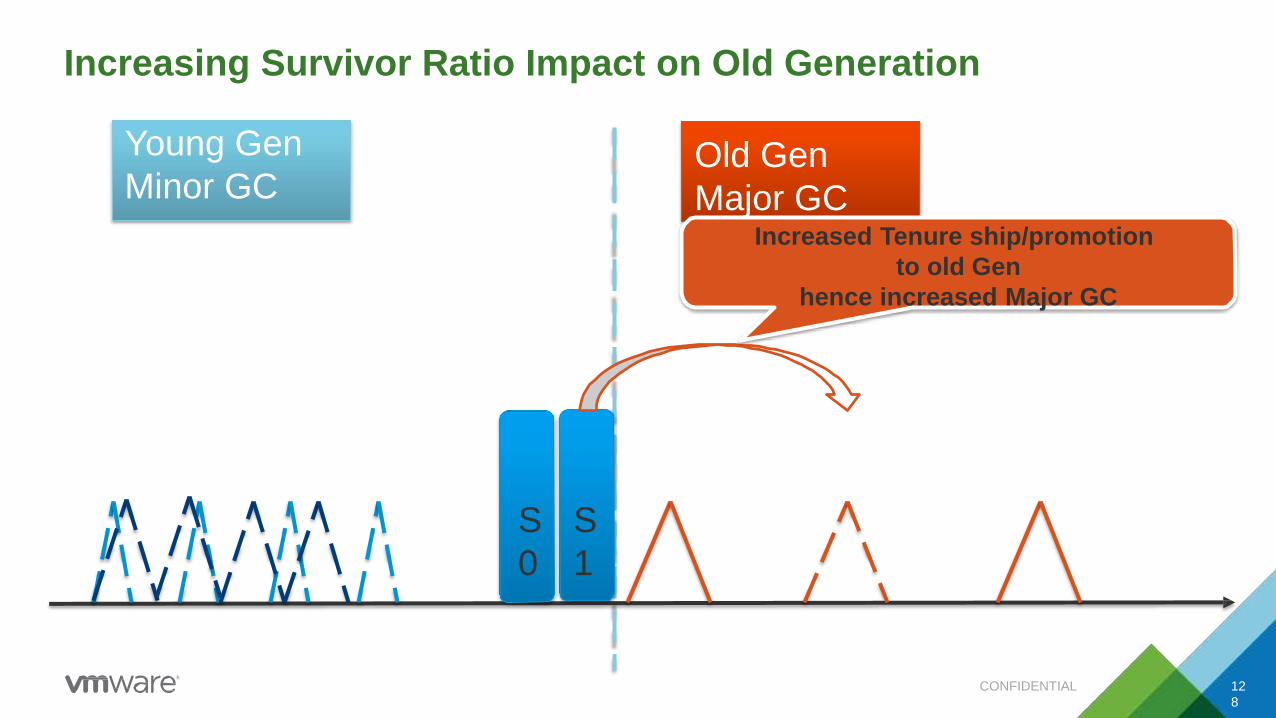
S S
0 1
Increased Tenure ship/promotion
to old Gen
hence increased Major GC
Increasing Survivor Ratio Impact on Old Generation
CONFIDENTIAL 12
8

CMS Collector Example
CONFIDENTIAL 12
9
• FullGC every 2hrs and overall Heap utilization down by 30%
java -Xms50g -Xmx50g -Xmn16g -XX:+UseConcMarkSweepGC -XX:+UseParNewGC –XX:CMSInitiatingOccupancyFraction=75
–XX:+UseCMSInitiatingOccupancyOnly -XX:+ScavengeBeforeFullGC
-XX:TargetSurvivorRatio=80 -XX:SurvivorRatio=8 -XX:+UseBiasedLocking
-XX:MaxTenuringThreshold=15 -XX:ParallelGCThreads=6
-XX:+OptimizeStringConcat -XX:+UseCompressedStrings -XX:+UseStringCache

Young Gen Old GenMinor GC Major GC
Application user threads
Parallel/Throughput GC in
YoungGen using
XX:ParNewGC
XX:ParallelGCThreads
Concurrent using
XX:+UseConcMarkSweepGC
Minor GC threads Concurrent Mark and Sweep
Parallel Young Gen and CMS Old Gen
CONFIDENTIAL 13
0
CMS Collector Example
CONFIDENTIAL 13
1
• Customer chose not to use LargePages:
– They were content with performance they already achieved and did not want to make OS level changes that may impact the amount of total memory available to other processes that may or may not be using LargePages.
• -XX:+UseNUMA JVM option also does not work with -XX:+UseConcMarkSweepGC
• Alternate would be to experiment with
• numactl --cpunodebind=0 --membind=0 myapp
• However we found ESX NUMA locality algorithms were doing great at localizing and did not need further NUMA tuning.

CMS Collector Example
java –Xms30g –Xmx30g –Xmn10g -XX:+UseConcMarkSweepGC -XX:+UseParNewGC –_XX:CMSInitiatingOccupancyFraction=75
–XX:+UseCMSInitiatingOccupancyOnly -XX:+ScavengeBeforeFullGC
-XX:TargetSurvivorRatio=80 -XX:SurvivorRatio=8 -XX:+UseBiasedLocking
-XX:MaxTenuringThreshold=15 -XX:ParallelGCThreads=4
-XX:+UseCompressedOops -XX:+OptimizeStringConcat -XX:+UseCompressedStrings
-XX:+UseStringCache
• This JVM configuration scales up and down effectively
• -Xmx=-Xms, and –Xmn 33% of –Xmx
• -XX:ParallelGCThreads=< minimum 2 but less than 50% of available vCPU to the JVM. NOTE:Ideally use it for 4vCPU VMs plus, but if used on 2vCPU VMs drop the -XX:ParallelGCThreads option and let Java select it
CONFIDENTIAL 13
2

CMS Collector Example
CONFIDENTIAL 13
3
JVM Option Description
-Xmn10g Fixed size Young Generation
-XX:+UseConcMarkSweepGC The concurrent collector is used to collect the tenured generation and
does most of the collection concurrently with the execution of the
application. The application is paused for short periods during the
collection. A parallel version of the young generation copying collector is
used with the concurrent collector.
-XX:+UseParNewGC This sets whether to use multiple threads in the young generation (with
CMS only!). By default, this is enabled in Java 6u13, probably any Java
6, when the machine has multiple processor cores.
–XX:CMSInitiatingOccupancyFraction=75 This sets the percentage of the heap that must be full before the JVM
starts a concurrent collection in the tenured generation. The default is
some where around 92 in Java 6, but that can lead to significant
problems. Setting this lower allows CMS to run more often (all the time
sometimes), but it often clears more quickly to avoid fragmentation.

CMS Collector Example
CONFIDENTIAL 13
4
JVM Option Description
–XX:+UseCMSInitiatingOccupancyOnly Indicates all concurrent CMS cycles should start based on –
XX:CMSInitiatingOccupancyFraction=75
-XX:+ScavengeBeforeFullGC Do young generation GC prior to a full GC.
-XX:TargetSurvivorRatio=80 Desired percentage of survivor space used after scavenge.
-XX:SurvivorRatio=8 Ratio of eden/survivor space size

CMS Collector Example
CONFIDENTIAL 13
5
JVM Option Description
-XX:+UseBiasedLocking Enables a technique for improving the performance of uncontended
synchronization. An object is "biased" toward the thread which first
acquires its monitor via a monitorenter bytecode or synchronized method
invocation; subsequent monitor-related operations performed by that
thread are relatively much faster on multiprocessor machines. Some
applications with significant amounts of uncontended synchronization may
attain significant speedups with this flag enabled; some applications with
certain patterns of locking may see slowdowns, though attempts have
been made to minimize the negative impact.
-XX:MaxTenuringThreshold=15 Sets the maximum tenuring threshold for use in adaptive GC sizing. The
current largest value is 15. The default value is 15 for the parallel collector
and is 4 for CMS.

CMS Collector Example
CONFIDENTIAL 13
6
JVM Option Description
-XX:ParallelGCThreads=4 Sets the number of garbage collection threads in the young/minor garbage
collectors. The default value varies with the platform on which the JVM is
running.
-XX:+UseCompressedOops Enables the use of compressed pointers (object references represented
as 32 bit offsets instead of 64-bit pointers) for optimized 64-bit
performance with Java heap sizes less than 32gb.
-XX:+OptimizeStringConcat Optimize String concatenation operations where possible. (Introduced in
Java 6 Update 20)
-XX:+UseCompressedStrings Use a byte[] for Strings which can be represented as pure ASCII.
(Introduced in Java 6 Update 21 Performance Release)
-XX:+UseStringCache Enables caching of commonly allocated strings

Customer Example – Mutual Funds App Service Provider
CONFIDENTIAL 13
7
• Customer has 80 mutual funds customers
• Each customer has 5 JVMs, 3 JVMs are for the App, and 2 JVMs are for the batch processes
• The 3 app nodes are scribed in a application cluster, while the 2 batch JVMs are stateless andnot in a cluster
• Service provider wants to run each JVM in its own VM, as they feel this is more prudent for HAand flexibility of deployment
• They have selected 12 hosts of 2 sockets, 10 cores on each socket and 512GB of RAM ($25Kserver cost)
• What should the cluster design look like?
– One potential is 40 VMs of 1vCPU, 5GB memory reservation and heap a 4GB
– Since current heap is 2GB, by going to 4GB, we will decrease CPU pressure
– Each of the 5 JVMs and matching VM must run in a separate host in order to guarantee availability
– Note customer bought 512GB on each host, but memory is not the issue, JVM to CPU ratio is the issue. It is more prudent to buy 256GB servers and get more servers for the same amount of money.

Please submit your feedback via our mobile app.
137
Thank you!

139