VM0038 Methodology for Electric Vehicle Charging Systems€¦ · Plug-in Hybrid Electric Vehicle...
59
VCS Methodology VM0038 Methodology for Electric Vehicle Charging Systems Version 1.0 18 September 2018 Sectoral Scopes 1 & 7
Transcript of VM0038 Methodology for Electric Vehicle Charging Systems€¦ · Plug-in Hybrid Electric Vehicle...

VCS Methodology
VM0038
Methodology for Electric Vehicle Charging Systems
Version 1.0
18 September 2018
Sectoral Scopes 1 & 7

VM0038, Version 1.0 Sectoral Scopes 1 & 7
2
This methodology was developed by the Climate Neutral Business Network, a project of Strategic
Environmental Associates Inc, based upon generous support from the EV Charging Carbon Coalition
(EVCCC).
The EVCCC seeks to open up access to the carbon capital markets for EV charging systems in order to
strengthen their business case fundamentals and accelerate deployment. Beyond GM’s business case
development, founding members include:
• Electrify America LLC/Audi of America
• Exelon
• EVgo Services LLC
• Siemens
• Connecticut Green Bank
• Carbon Neutral Cities Alliance (including Portland, San Francisco, Seattle, Palo Alto, NYC,
Minneapolis, Vancouver BC, Sydney, Adelaide, AU)

VM0038, Version 1.0 Sectoral Scopes 1 & 7
3
Table of Contents
1 Sources ................................................................................................................................................. 4
2 Summary Description of the Methodology ............................................................................................ 4
3 Definitions .............................................................................................................................................. 5
4 Applicability Conditions ......................................................................................................................... 8
5 Project Boundary ................................................................................................................................. 10
6 Baseline Scenario ............................................................................................................................... 12
7 Additionality ......................................................................................................................................... 12
8 Quantification of GHG Emission Reductions and Removals .............................................................. 13
Baseline Emissions ..................................................................................................................... 13
Project Emissions ........................................................................................................................ 14
Leakage ....................................................................................................................................... 19
Net GHG Emission Reductions and Removals ........................................................................... 19
9 Monitoring ............................................................................................................................................ 20
Data and Parameters Available at Validation ............................................................................. 20
9.2 Data and Parameters Available at Verification ........................................................................... 22
9.3 Description of the Monitoring Plan .............................................................................................. 50
10 References .......................................................................................................................................... 52
APPENDIX 1: Calculation of Baseline Default Values for the US and Canada .......................................... 53
APPENDIX 2: Guidance for Design of Adequate Metering Systems for AI Projects .................................. 56

VM0038, Version 1.0 Sectoral Scopes 1 & 7
4
1 SOURCES
This methodology uses the latest version of the following module:
VMD0049 Activity Method for Determining Additionality of Electric Vehicle Charging
Systems
This methodology used the latest version the following tools:
CDM methodological tool Demonstration of additionality of small-scale project activities
CDM methodological Tool for the demonstration and assessment of additionality
This methodology is based upon approaches used in the following methodology:
CDM methodology AMS-III.C. Emission Reductions by Electric and Hybrid Vehicles1.
2 SUMMARY DESCRIPTION OF THE METHODOLOGY
Additionality and Crediting Method
Additionality Projects eligible to apply module VMD0049: Activity method
All other projects: Project method
Crediting Baseline Project method
This methodology applies to the charging of electric vehicles (EVs) through EV charging systems,
including their associated infrastructure, whose GHG emission reductions are achieved through
the displacement of emissions from conventional fossil fuel vehicles used for passenger and
freight transportation as a result of the electricity delivered by the project chargers.
This methodology provides easy-to-use monitoring parameters to quantify emission reductions,
and also establishes default factors for the estimation of certain parameters for projects located in
the United States and Canada as an alternative to project-specific calculations.
Finally, this methodology is applicable globally, and provides a positive list for determining
additionality for regions with less than five percent market penetration of electric vehicles. The
positive list is found in VCS module VMD0049 Activity Method for Determining Additionality of
Electric Vehicle Charging Systems.
1 This methodology was based on AMS.III.C.,version 15.0. See CDM website: https://cdm.unfccc.int/methodologies/index.html

VM0038, Version 1.0 Sectoral Scopes 1 & 7
5
3 DEFINITIONS
In addition to the definitions set out in VCS document Program Definitions, the following
definitions apply to this methodology:
Applicable Fleets
The class of EVs eligible and technically able to charge at EV chargers associated with the
project. For LDV projects, these applicable fleets comprise2 BEVs and PHEVs for L1 and L2
chargers, and BEVs for DCFCs. For HDV projects, these applicable fleets comprise the
MDV/HDV electric vehicles eligible to charge at the project’s set of EV chargers.
Associated Infrastructure (AI)
Stationary battery storage devices3 and dedicated renewable energy systems (e.g., solar or
biofuel from on-site or other locations which use dedicated direct transmission lines) integrated as
part of EV charging systems and managed by their control units. Associated infrastructure
includes on-site battery storage systems which can store and dispatch electricity to and/or from
any on-site renewable power systems, the grid, and/or the EV batteries. Associated infrastructure
also includes the EV batteries themselves and thus includes EV vehicle-to-grid (V2G) and EV to
on-site battery exchanges of electricity.
Associated Infrastructure Metering Systems
Systems used to track electricity flows between AI devices, whether using meters and/or
associated measurement systems within or external to the EV charger. These may include
upstream metering on the grid-side of the adequate metering system (e.g., where meters are
installed grid-side of an on-site battery) and/or downstream metering (e.g., where metering takes
place within the charger unit itself, downstream of the on-site battery).
Battery Electric Vehicle (BEV)
An EV which relies exclusively upon electricity delivered from an external EV charging system for
its power in order to propel its motion
Charging Networks
A collection of charging systems which service any given applicable fleet
Closed Charging Networks
A collection of charging systems for which composition of the applicable fleet is constrained to a
particular sub-set of EVs whose composition and operating characteristics of both the applicable
2 There may be a very few PHEVs which also have the plug capability to charge at DCFCs (e.g., Mitsubishi Outlander); these are considered de minimis. Similarly, the BMW i3 REX (with range extender) is technically a PHEV, but only 5% of i3s use the range extender in practice. Moreover, Argonne National Laboratory and California classify the REX as a BEV, and therefore it is included in the BEV category for default factor calculation purposes in this methodology. 3 For larger powered systems (e.g., 150kw, 320kw), stationary battery systems may become a more typical integrated part of the EV charging system infrastructure over time (e.g., to mitigate demand peak charges from utilities); they are controlled by the charging system’s control unit and are located close to the site within the charging system’s metering to the utility.
VM0038, Version 1.0 Sectoral Scopes 1 & 7
6
and comparable fleets can be specifically identified and documented (e.g., a transit agency’s e-
bus charging network)
Comparable Fleets
Those fossil-fuel vehicles whose travel characteristics have been defined to be comparable to the
EVs in each applicable fleet as determined in Section 4 below
DC Fast Charger (DCFC)
A charger which provides direct current charging (typically at 200-1000V) from an off-board4
charger with a power rating above 11kw. Typical DCFC ratings are 50kw, with the newest
systems for passenger vehicles in the 150kw and 320 kw ranges. DCFC classifications are
defined as:
DCFC 50kw: capable of delivering maximum power from 11kw to 62.5kw
DCFC 100kw: capable of delivering maximum power from 63kw to 110kw (i.e., 200A)
DCFC 150kw: capable of delivering maximum power from 111kw to 160kw (i.e.,
200A@800V or 350A@400V, some with cooled connectors)
DCFC 320kw: capable of delivering maximum power from 161kw and 360kw (i.e., cooled
connectors)
DCFC 500kw: capable delivering maximum power from 361kw and above (i.e., different
connectors)
Where no kw classification is specified in this methodology, DCFC includes all classes defined
above.
Dedicated Renewable Energy
Renewable power (e.g., solar, wind, and bio-fuel) supplied either from sources on-site within the
associated infrastructure of the project, or received from a dedicated supply source via a direct
transmission line. These renewable sources represent a distinct segment, differentiated from the
renewable electricity supplied via the broader grid. These dedicated renewables may also be
delivered in part for use on the main grid.
Electric Vehicle (EV)
Vehicles, including BEVs and PHEVs, spanning both passenger cars, LDVs and HDVs, powered
by the external electricity sources of charging systems. EVs do not include hybrid-only vehicles
since they do not consume electricity from externally generated sources.
4See SAE standards: http://grouper.ieee.org/groups/earthobservationsSCC/IEEE_SAE_J1772_Update_10_02_08_Gery_Kissel.pdf

VM0038, Version 1.0 Sectoral Scopes 1 & 7
7
EV Chargers
Charging dispensers and their metering systems including L1, L2 and/or DCFC units which
provide electricity to EVs within an applicable fleet and which may form part of an EV charging
system
EV Charging Systems
A set of EV chargers including L1, L2 and/or DCFC and their associated infrastructure (if any)
which, when located at a given charging site, provide electricity to EVs within a given applicable
fleet, and which may form part of a charging network
EV Market Share
The number of EVs on the road within a geographic region, expressed as a percentage of total
vehicles on the road within a geographic region, segmented for applicable fleets across LDV and
HDV sectors
Heavy Duty Vehicles (HDV)
Vehicles consistent with definitions provided by the governing national regulatory system(s) of the
project location. HDVs may also include medium duty vehicles (MDVs). These must be consistent
with the data sources used in the standardized tests and default ER factors applied, if any5.
Kwh/100 Mile Ratings
Ratings as provided by credible national government/regulatory sources which establish the kwh
consumed to travel 100 miles, sourced for each EV model within applicable fleets, and used to
calculate the weighted average Applicable Fleet’s Electricity Consumption (AFEC) rating
Level 1 Charger (L1)
A charger which provides 120V alternating current charging services to the vehicle’s on-board
charger with a power rating up to 1.8kw
Level 2 Charger (L2)6
A charger which provides 240V alternating current charging services to the vehicle’s on-board
charger with a power rating up to 20kw (typically from 3.3kw to 6.6 kw)
Light Duty Vehicles (LDV)
Cars and trucks consistent with definitions provided by the governing national regulatory
system(s) of the project location. These must be consistent with the data sources used in the
standardized tests and default ER factors applied, if any7.
5 For example, in the United States, HDVs are specified as including both HDVs and those MDVs with Gross Vehicle Weight Ratings (GVWR) of more than 14,000lbs (typically from class 4 and above), consistent with the IHS Markit data sources applied in the development of the default factors. HDV vehicles include both e-buses and e-trucks. 6 Note that, in London UK, L2 chargers have been referenced as fast chargers. And, DCFCs are referenced as rapid chargers. Regardless of nomenclature, the chargers will be defined against the technical criteria provided in this methodology. 7 For example, in the United States, LDVs are specified as including vehicles with) GVWR up to and including 14,000lbs, (classes 1, 2, and 3) and must therefore include those Medium Duty Vehicles (MDVs) up to this same

VM0038, Version 1.0 Sectoral Scopes 1 & 7
8
Medium and Heavy Duty Electric Vehicle (HDV EV)
Medium duty and heavy duty vehicles (collectively defined as HDV) comprising both BEV and
PHEV HDV electric vehicles, including e-buses and e-truck categories, which rely upon electricity
delivered from external EV charging systems for their power
Miles per gallon (MPG) ratings
Mile per gallon ratings as provided by credible national government/regulatory sources establish
the miles traveled per gallon of fuel consumed, for those fossil fuel vehicles deemed comparable
per Section 4 to the EV’s applicable fleet8
Open Charging Networks
A charging network where the applicable fleet is not constrained to a particular sub-set of EVs
whose composition and operating characteristics of both the applicable and comparable fleets
can be identified and documented, as with a closed charging network
Plug-in Hybrid Electric Vehicle (PHEV)
A vehicle combining an internal combustion engine and one or more electric motors, which must
also be capable of receiving delivered electricity by plugging into an external EV charging system
for its power in order to propel its motion
Private Charging Networks
Charging systems where charger access is limited to a defined applicable fleet. For example,
residential chargers would be considered private since access is restricted, as would a city’s
chargers if their use was limited to the charging of the city’s own EV fleet vehicles. Private refers
to the limited degree of access to the chargers, not the charging system’s owner’s status (since
public city chargers can use private charging networks). The composition of those EVs accessing
the network need not be known (that is, both open (e.g., residential) and closed (e.g., e-bus
transit agency charging) networks can be private if access is limited).
4 APPLICABILITY CONDITIONS
This methodology applies to project activities which install EV charging systems, including their
associated infrastructure, in order to charge EV applicable fleets whose GHG emission reductions
are achieved through the displacement of conventional fossil fuel vehicles used for passenger
and freight transportation as a result of the electricity delivered by project chargers.
weight limit, consistent with the IHS Markit data sources applied in the development of the default factors. This 14,000lbs GVWR values is based upon definitions used and supplied by IHS Markit data for light duty vehicles, whose data forms the basis for most US EV market analysis publications. Commercial applications in the 8500-14000 lb Class 2b and 3 are a de minimis proportion of total LDV’s. See also: http://changingears.com/rv-sec-tow-vehicles-classes.shtml and https://www.afdc.energy.gov/data/10380 Lighter MDV’s include the types of vehicles which also use the main LDV charging networks (e.g., retirement home vans). 8 For countries using other metrics (e.g., ratings in Europe for CO2 per km), conversion guidance is given in Section 8 below.

VM0038, Version 1.0 Sectoral Scopes 1 & 7
9
Projects must comply with all applicability conditions set out below:
1) The applicable fleets of projects applying this methodology are limited to all LDV BEVs
and PHEVs9, and HDV EVs. For LDV projects, these applicable fleets comprise10 BEVs
and PHEVs for L1 and L2 chargers, and BEVs for DCFCs. For HDV projects, these
applicable fleets comprise MDV/HDV electric buses and trucks, both BEV and PHEV,
eligible to charge at the project’s set of EV charging systems.
2) Project proponents must demonstrate that the EV models comprising the applicable fleet
of the project are comparable to their conventional fossil fuel baseline vehicles using the
following means:
Project and baseline vehicles belong to the same vehicle category (e.g., car,
motorcycle, bus, truck, LDV, MDV, HDV);
Project and baseline vehicles have comparable passenger/load capacity
(comparing the baseline vehicle with the respective project vehicle).
Note that where project proponents apply the baseline emission default factors for MPG
and AFEC determined for the US and Canada, this comparability requirement between
applicable and comparable fleet models has already been completed and satisfied.
3) In order to demonstrate that double counting of emission reduction will not occur, the
project proponent must maintain an inventory of EV chargers included in the project,
including their L1/L2/DCFC classifications and unique identifiers; other measures may
include disclosure of credit ownership to EV drivers. Double counting relative to any
issued GHG credits11 from projects that introduce EV fleets12 will be addressed using the
emission reduction discount adjustments in Section 8.4 below13. Where associated
infrastructure and/or renewable power (on-site and/or direct transmission) are included in
an EV charging system, this must be referenced and described in the charging system’s
inventory. Project documentation must also include the following for each EV charger:
Classification using the performance voltage, AC/DC basis and kw power
specifications given for L1, L2 and DCFC 50/100/150/320/500 definitions
9 Hybrid-only vehicles, which do not have batteries capable of receiving electricity to propel their motion, are not eligible under this methodology 10 There may be a very few PHEVs which also have the plug capability to charge at DCFCs (e.g., Mitsubishi Outlander); these are considered de minimis. Similarly, the BMW i3 REX (with range extender) is technically a PHEV, but only 5% of i3s use the range extender in practice. Moreover, Argonne National Laboratory and California classify the REX as a BEV, and therefore it is included in the BEV category for default factor calculation purposes in this methodology. 11 Credits for GHG emission reductions issued by a GHG program such as the American Carbon Registry (ACR) Climate Action Reserve (CAR), Verified Carbon Standard (VCS), or the UNFCCC’s Clean Development Mechanism (CDM). 12 For example, projects that apply CDM methodology AMS.III.C. 13 Double counting related to any jurisdictional emission trading systems or commitments (e.g., cap-and-trade programs, etc.) must still be assessed per the VCS rules.

VM0038, Version 1.0 Sectoral Scopes 1 & 7
10
Unique identifiers, including the geo-spatial coordinates and one other unique
reference such as NEMA codes, customer codes, equipment serial numbers,
charger ID codes, or AFDC ID codes
4) This methodology is applicable to EV charging systems utilizing AI to provide electricity to
and from EVs, on-site batteries and renewables14 under the condition that the AI must
include adequate metering systems (e.g., meters/sub-meters and/or associated
measurement systems). These metering systems must measure and accurately trace all
electricity deliveries and receipts from all such interrelated associated infrastructure
sources. This includes electricity sourced from/returned to the grid, dedicated renewable
energy generated on-site (including RE sourced from direct transmission lines), on-site
storage batteries, and/or the EV’s on-board battery.
5) Projects with estimated annual emission reductions of over 60,000 tCO2e15 (large-scale)
are permitted where project proponents can demonstrate that the project is located in a
country with credible national data sources for GHG emission calculations. Otherwise,
projects are limited to annual emission reductions equal to or under 60,000 tCO2e (small-
scale). Projects located in Annex I and II countries, and countries referenced by EIA data
sources, are automatically eligible to be of any scale. All regions listed in module
VMD0049 Activity Method for Determining Additionality of Electric Vehicle Charging
Systems meet these criteria and thus are not limited in scale.
6) Project proponents must demonstrate proof of ownership of emission reductions which
may be achieved through the following:
With the charging system owners through contractual agreements, terms of
service, utility program participation rules, or other means, and/or
With EV drivers through disclosure of credit ownership (e.g., through dispenser
notices, screen displays, terms of service, etc.).
5 PROJECT BOUNDARY
The project boundary is comprised of the following:
1) The applicable fleets for the project EV chargers;
2) The geographic boundaries where the EV charging systems are located;
3) The EV charging systems of the project activity including their electricity supply sources
and associated infrastructure.
The greenhouse gases included in or excluded from the project boundary are shown in Table 1
below.
14 AI may store and dispatch electricity both to and from multiple sources, both on site and regionally. 15 The small and large scale boundary was drawn from CDM methodology AMS-III.C.

VM0038, Version 1.0 Sectoral Scopes 1 & 7
11
Table 1: GHG Sources Included In or Excluded From the Project Boundary
Source Gas Included? Justification/Explanation
Baselin
e
Fossil fuel
combustion
of vehicles
displaced by
project
activities
CO2 Yes Main emission source
CH4 Optional May be excluded for simplification
N2O Optional May be excluded for simplification
Other No Not Applicable
Pro
ject
Electricity
consumption
via grid
CO2 Yes Main emission source
CH4 Optional May be excluded for simplification. Where
included in the baseline, source must also be
accounted in project emissions.
N2O Optional May be excluded for simplification. Where
included in the baseline, source must also be
accounted in project emissions.
Other No Not Applicable.
Renewables
via on-
site/direct
transmission
CO2 Yes Main emission source
CH4 Optional May be excluded for simplification. Where
included in the baseline, source must also be
accounted in project emissions.
N2O Optional May be excluded for simplification. Where
included in the baseline, source must also be
accounted in project emissions.
Other No Not Applicable
On-site
battery
storage
CO2 Yes Main emission source
CH4 Optional May be excluded for simplification. Where
included in the baseline, source must also be
accounted in project emissions.
N2O Optional May be excluded for simplification. Where
included in the baseline, source must also be
accounted in project emissions.
Other No Not Applicable
CO2 Yes Derived emission source16
16 The EV battery is a derived emission source based upon the kwh received from the grid, dedicated renewables and on-site battery. It does not have a separate independent emissions factor since any kwh the EV battery returns to the grid or the on-site battery are netted out (in NEC and NECT) against the kwh delivered to the EV from these sources using their respective emissions factors. See Equations 7, 8, and 9 and Appendix 2.

VM0038, Version 1.0 Sectoral Scopes 1 & 7
12
Source Gas Included? Justification/Explanation
EV battery
storage in
vehicle
CH4 Optional May be excluded for simplification. Where
included in the baseline, source must also be
accounted in project emissions.
N2O Optional May be excluded for simplification. Where
included in the baseline, source must also be
accounted in project emissions.
Other No Not Applicable
6 BASELINE SCENARIO
The baseline scenario is the operation of comparable fleets (the comparability of baseline and
project applicable fleet vehicles to be demonstrated as per indicators set out in applicability
conditions in Section 4 above), that would have been used to provide the same transportation
service in the absence of the project.
7 ADDITIONALITY
Project proponents applying this methodology must determine additionality using the procedure
described below:
Step 1: Regulatory Surplus
Project proponents must demonstrate regulatory surplus in accordance with the rules and
requirements regarding regulatory surplus set out in the latest version of the VCS Standard.
Step 2: Positive List
The applicability conditions of the latest version of VCS module VMD0049 Activity Method for
Determining Additionality of Electric Vehicle Charging Systems represent the positive list. The
positive list was established using the activity penetration option (Option A in the VCS Standard).
Projects that meet all applicability conditions of this methodology and VCS module VMD0049
Activity Method for Determining Additionality of Electric Vehicle Charging Systems are deemed
additional.
Step 3: Project Method
Where Step 2 is not applicable, project proponents may apply the following17:
Where the project is small-scale, the project proponent must demonstrate that the project
activity would otherwise not be implemented due to the existence of one or more
17 When applying either tool, regardless of which entity is implementing the project, project proponents may demonstrate that barriers apply for charging service providers and/or their associated partners (e.g., installation customers, utilities, end-users, charging system network service providers, and EV manufacturer/retailer).

VM0038, Version 1.0 Sectoral Scopes 1 & 7
13
barrier(s) listed in the latest version of the CDM methodological tool Demonstration of
additionality of small-scale project activities.
Where the project is large-scale, the project proponent must apply the latest version of
the CDM Tool for the demonstration and assessment of additionality.
8 QUANTIFICATION OF GHG EMISSION REDUCTIONS AND REMOVALS
Baseline Emissions
Baseline emissions are calculated by converting the electricity used to charge project applicable
fleet vehicles at the EV chargers into distance travelled, and multiplying this by the emission
factor for fossil fuels used by baseline comparable fleet vehicles to travel the same distance.
Baseline emissions must be calculated as follows:
𝐵𝐸𝑦 = ∑ 𝐸𝐷𝑖𝑦 ∗ 𝐸𝐹𝑖𝑓𝑦 ∗ 100 ∗ 𝐼𝑅𝑖𝑦−1
/(𝐴𝐹𝐸𝐶𝑖𝑦 ∗ 𝑀𝑃𝐺𝑖𝑦)𝑖,𝑓 (1)
Where:
BEy = Baseline emissions in year y (tCO2e)
EDi,y = Electricity delivered by project charging systems serving applicable fleet i in project
year y (kwh)
EFj,f,y = Emission factor for the fossil fuel f used by comparable fleet vehicles j in year y
(tCO2e/gallon)
IRi, = Technology improvement rate factor for applicable fleet i
AFECi,y = Weighted average electricity consumption per 100 miles rating for EVs in applicable
fleet i in project year y (kwh/100 miles)
MPGi,y = Weighted average miles per gallon rating for the fossil fuel vehicles comparable to each
EV in applicable fleet i, in project year y (miles per gallon)
Default values for MPGi,y, AFECi,y, EFj,f,y, and IRi, across both LDV and HDV applicable fleets can
be found in the parameter tables in Section 9.1 below for the United States and Canada.
The weighted average electricity consumption per 100 miles rating for EVs in applicable fleet i, is
calculated as follows:
𝐴𝐹𝐸𝐶𝑖𝑦 = ∑ (𝐸𝑉𝑎𝑖𝑦𝑎 ∗ 𝐸𝑉𝑅𝑎𝑖𝑦)/ ∑ 𝐸𝑉𝑅𝑎𝑖𝑦𝑎 (2)
Where:
AFECi,y = Weighted average electricity consumption per 100 miles rating for EVs in applicable
fleet i in project year y (kwh/100 miles)
EVa,j,y = Electricity consumption per 100 miles rating for model a EV in applicable fleet i in
project year y (kwh/100 miles)
EVRa,j,y = Total number of model a EV in applicable fleet i on the road by project year y
(cumulative number of EVs)

VM0038, Version 1.0 Sectoral Scopes 1 & 7
14
The weighted average miles per gallon rating for the comparable fleet associated with each
applicable fleet i, is calculated as follows:
𝑀𝑃𝐺𝑖𝑦 = ∑ (𝑀𝐺𝑃𝑎𝑖𝑦 ∗ 𝐸𝑉𝑅𝑎𝑖𝑦𝑎 )/ ∑ 𝐸𝑉𝑅𝑎𝑖𝑦𝑎 (3)
Where:
MPGi,y = Weighted average miles per gallon rating for fossil fuel vehicles comparable to each EV
in applicable fleet i in project year y (miles per gallon)
MPGa,j,y = Mile per gallon rating for the fossil fuel vehicle model deemed comparable to each EV
model a from applicable fleet i in project year y (miles/gallon)
EVRa,i,y = Total number of EV models within applicable fleet i on the road by project year y
(cumulative number of EVs)
Guidance regarding the calculation procedures for AFECi,y and MPGi,y and their associated
parameters is given in the parameter tables in Section 9.2 and applicability condition #2.
Further details for the calculation of the default values for MPGi,y, AFECi,y, can be found in
Appendix 1 and the accompanying Default MPG and AFEC Workbook on the Verra website.
Project Emissions
Project emissions include the electricity consumption associated with the operation of the
applicable fleet and must be calculated as follows:
𝑃𝐸𝑦 = ∑ 𝐸𝐶𝑖𝑗𝑦 ∗ 𝐸𝐹𝑘𝑤𝑖𝑗𝑦𝑖𝑗 (4)
Where:
PEy = Project emissions in year y (tCO2e)
ECi,j,y = Electricity consumed by project chargers sourced from region j serving applicable fleet i
in project year y (kwh/year)
EFkwi,j,y = Emission factor (average) for the electricity sourced from region j consumed by project
charging systems serving applicable fleet i in year y (tCO2e/kwh)
Where “time-of-day” estimates (i.e., estimates segmented by time periods within a single 24-hour
day) for project emissions are available, Equation 5 may be applied, thus replacing Equation 4,
provided that:
1) There are no time periods in which electricity is provided but not accounted for within PEy
(i.e., the sum of all such time-of-day time periods t equals 24 hours in any given full day
within the project).

VM0038, Version 1.0 Sectoral Scopes 1 & 7
15
2) Time-of-day estimates for electricity emission factors EFkwTODi,j,t,y are drawn from
credible, applicable sources and are provided on at least an hourly basis (e.g., the
regional Independent System Operation (ISO) or applicable utility generation sources).
𝑃𝐸𝑦 = ∑ 𝐸𝐶𝑇𝑂𝐷𝑖𝑗𝑡𝑦 ∗ 𝐸𝐹𝑘𝑤𝑇𝑂𝐷𝑖𝑗𝑡𝑦𝑖𝑗𝑡 (5)
Where:
PEy = Project emissions in year y (tCO2e)
ECTODi,j,t,y = Electricity consumed by project chargers sourced from region j serving
applicable fleet i during time of day period t in project year y (kwh/time period t)
EFkwTODj,,j,t,y = Emission factor for the electricity sourced from region j consumed by project
chargers serving applicable fleet i during time of day period t in year y
(tCO2e/kwh)
Where ISO does not provide greenhouse gas emission factors on an hourly basis in region j, but
does provide fuel consumption data for electricity generation on an hourly basis, EFkwTODji,j,t,y
may be estimated on a weighted average basis as follows:
1) Projects must combine the hourly fuel consumption figures (typically given as the
percentage of each type of fuel consumed that hour (e.g., 50% coal, 50% natural gas))
with the emission factors for these same fuels to create a weighted average emission
rate for each hourly period.
2) Emission rates for each fuel must be drawn from the same source (e.g., ISO) or
consistent publication sources for region j.
Equations supporting these fuel-consumption based time-of-day calculations for EFkwTODj,,jy are
given in the equation below:
EFkwTODijty = ∑ F%ijtfyf ∗ EFkwFijtfy (6)
Where:
EFkwTODj,j,t,y = Emission factor for the electricity sourced from region j consumed by project
chargers serving applicable fleet i during time of day period t in year y
(tCO2e/kwh)
EFkwFi,j,t,f,y = Emission factor applicable for the fuel type f used to generate the kwh sourced
from region j consumed by project charging systems serving applicable fleet i
during time of day period t in year y (tCO2e/kwh)
F%i,j,t,f,y = Percentage of fuel type f used to generate the kwh during each time of day
period t, sourced from region j and consumed by EV charging systems serving
applicable fleet i in year y (%)

VM0038, Version 1.0 Sectoral Scopes 1 & 7
16
Where projects include associated infrastructure within their charging systems, project emissions
must be quantified for all such sources s following Equation 7, which must replace Equation 4,
where the following applies:
1) The electricity emissions factor for the on-site battery must be calculated using the net
weighted average of the grid and on-site renewable emission factors as provided in
Equation 8 below.
2) The charging system’s metering system must adequately and accurately measure and
trace such net electricity kwh provided to the charging system (i.e., deliveries minus
receipts) from all electricity sourced from/returned to the grid and the dedicated
renewables. This includes, for example, electricity sourced from the grid, dedicated
renewables (e.g., on site) and delivered to the EV directly and/or via on-site batteries, net
of kwh returned back to such sources from the EV batteries18. See Appendix 2 for
guidance on adequate metering systems.
𝑃𝐸𝑦 = ∑ 𝑁𝐸𝐶𝑖𝑗𝑠𝑦 ∗ 𝐸𝐹𝑘𝑤𝐴𝐼𝑖𝑗𝑠𝑦 − ∑ 𝐿𝐸𝐶𝑖𝑗𝑦 ∗𝑖𝑗𝑖𝑗𝑠 𝐸𝐹𝑘𝑤𝑜𝑛𝑠𝑖𝑡𝑒𝑏𝑎𝑡𝑡𝑖𝑗𝑦 (7)
Where:
PEy = Total project emissions in year y (tCO2e)
NECi,j,s,y = Electricity consumed by EV charging systems supplied from associated
infrastructure source s net of any kwh EV/charger returned to this same
source within region j serving applicable fleet i in project year y (kwh/year)
EFkwAIj,,j,s,y = Emission factor for the electricity from each associated infrastructure source
s within region j consumed by project chargers serving applicable fleet i in
year y (tCO2e/kwh)
LECj,,j,y = Electricity provided to the grid and/or building from on-site storage battery
within region j serving applicable fleet i in project year y (kwh/year)
EFkwonsitebatti,j,y = Emission factor for the electricity from the on-site battery associated
infrastructure source s within region j consumed by project charging systems
serving applicable fleet i in year y (tCO2e/kwh)
Where projects include associated infrastructure, the emission factor for electricity from on-site
battery associated infrastructure must be calculated using the net weighted average of the grid
and on-site renewable emission factors as follows:
𝐸𝐹𝑘𝑤𝑜𝑛𝑠𝑖𝑡𝑒𝑏𝑎𝑡𝑡𝑖𝑗𝑦 = ∑ 𝐸𝐶𝐵𝑖𝑗𝑧𝑦 ∗ 𝐸𝐹𝑘𝑤𝐴𝐼𝑍𝑖𝑗𝑧𝑦𝑧 (8)
18 It should be noted that metering systems for associated infrastructure can include “downstream” meters close to
the EV, such as those provided by DCFC onboard meters, and “upstream” meters, located grid-side such as meters
monitoring kwh delivered to the on-site batteries. Guidance provided in Appendix 2 is designed to assist the
application of Eq 7 given the particular features of a project’s adequate metering systems.

VM0038, Version 1.0 Sectoral Scopes 1 & 7
17
Where:
EFkwonsitebatti,j,y = Emission factor for the electricity from the on-site battery associated
infrastructure source s within region j consumed by project charging systems
serving applicable fleet i in year y (tCO2e/kwh)
ECBi,j,z,y = Electricity consumed by on-site battery from associated infrastructure
sources z, which comprise only the grid-connected and dedicated renewable
sources, within region j serving applicable fleet i in project year y (kwh/year)
EFkwAI-Zi,j,z,y = Emission factor for the electricity from the associated infrastructure sources
z, which comprise only the grid-connected and dedicated renewable sources,
within region j consumed by on-site batteries serving applicable fleet i in year
y (tCO2e/kwh)
Guidance for sourcing the emission factors for the other associated infrastructure sources s is
provided in the monitoring parameter boxes found in Section 9; guidance regarding adequate
metering systems is found in Appendix 2.
Where projects include associated infrastructure and estimates for time-of-day project emissions
are available, Equation 9 may be followed, thus replacing Equations 4, 5 and 7, provided that:
There are no time periods in which electricity is provided but not accounted for within PEy
(i.e., the sum of all such time-of-day time periods, t, equals 24 in any given full day within
the project)
Time-of-day estimates for electricity emission factors, EFkwTODAIj,j,s,t,y are drawn from
credible, applicable sources (e.g., the regional ISO or applicable utility generation
source).
Equation 7 must be applied to calculate EFkwTODAIj,j,s,t,y where electricity generation’s
hourly fuel consumption data is relied up to provide time-of-day emission rates for each
associated infrastructure source (e.g., grid-derived electricity).
The electricity emissions factor for the on-site battery must be calculated using the net
and time weighted average of the grid and on-site renewable emission factors given in
Equation 8.
The provisions regarding the charging system’s adequate metering systems as given for
Equation 7 and 8 (including guidance offered in Appendix 2) also apply for Equation 9 in
order to adequately and accurately measure and trace net electricity consumption
(NECT) from sources s, but are applied during each time-of day period t provided that:
o For time-of-day applications of associated infrastructure calculations pertaining to
the NECT for an on-site battery’s kwh delivered to the EV charger, metering must
be applied “upstream”, on the grid-side of the on-site battery. That is, for the
calculation of NECT for an on-site battery, Equation 9 will, using upstream
meters, calculate the kwh delivered to EV chargers via the on-site battery from
grid and/or dedicated renewable sources during the time of day period t taking

VM0038, Version 1.0 Sectoral Scopes 1 & 7
18
into account when these kwh are actually delivered to the on-site battery (i.e., not
when delivered from this battery to the EV charger), since the GHG impacts for
these kwh arise on the grid system when they are first delivered into this
associated infrastructure system (that is, are delivered to the on-site battery)
o For these applications, kwh supplied by the EV to the on-site battery can be set
aside (since they return to the EV at a later date) unless, during a given time
period t, the LECT less the kwh received by the on-site battery from grid and
renewable sources less the on-site battery’s stored kwh is greater than zero –
that is, LECT is so large that it must have drawn upon the kwh delivered to the
on-site battery from the EV
In the context of these NECT calculations for the on-site battery, note that the electricity
supplied from the grid to the EV charging system directly, and the electricity supplied by
the EV back to the grid during any time period t are considered separately in the
calculation of NECT for the grid.
𝑃𝐸𝑦 = ∑ 𝑁𝐸𝐶𝑇𝑖𝑗𝑠𝑡𝑦 ∗ 𝐸𝐹𝑘𝑤𝑇𝑂𝐷𝐴𝐼𝑖𝑗𝑠𝑡𝑦 − ∑ 𝐿𝐸𝐶𝑇𝑖𝑗𝑡𝑦 ∗ 𝐸𝐹𝑘𝑤𝑜𝑛𝑠𝑖𝑡𝑒𝑏𝑎𝑡𝑡𝑖𝑗𝑡𝑦𝑖𝑗𝑡𝑖𝑗𝑠𝑡 (9)
Where:
PEy = Project emissions in year y (tCO2e)
NECTi,j,s,t,y = Electricity consumed by project chargers supplied from associated
infrastructure source s net of any kwh EV/charger returned to this same
source during time-of-day period t, within region j serving applicable fleet
i in project year y (kwh/time period t)
EFkwTODAIi,j,s,t,y = Emission factor for the electricity from associated infrastructure source
s within region j consumed by project chargers serving applicable fleet i
during time-of-day period t in year y (tCO2e/kwh)
LECTi,j,t,y = Electricity provided to the grid and/or building from on-site storage
battery during time-of-day period t within region j serving applicable fleet i
in project year y (kwh/year)
EFkwTODonsitebatti,j,t,y = Emission factor for the electricity from the on-site battery associated
infrastructure source s during time-of-day period t within region j
consumed by project chargers serving applicable fleet i in year y
(tCO2e/kwh)

VM0038, Version 1.0 Sectoral Scopes 1 & 7
19
Leakage
Leakage is not considered an issue under this methodology, and is therefore set at zero.19
Net GHG Emission Reductions and Removals
Net GHG emission reductions must be calculated as follows, including application of a discount
factor, Dy, to adjust pro-rata where EV fleet credits have been issued within the project region:
ERy = (BEy − PEy − LEy) ∗ Dy (10)
Where:
ERY = Net GHG emissions reductions and removals in year y (tCO2e)
BEY = Baseline emissions in year y (tCO2e)
PEy = Project emissions in year y (tCO2e)
LEy = Leakage in year y (tCO2e)
Dy = Discount factor to be applied in year y (%)
Where:
Dy = ERCy/(ERFy + ERCy) (11)
Where:
Dy = Discount factor to be applied in year y (%)
ERCy = Sum of GHG credits20 issued by all projects under this methodology (or others which
support the introduction of EV charging systems) across this project’s applicable fleet i
categories within this total project region in project year y-1 (tCO2e)
ERFy = Sum of GHG credits issued by all projects under methodologies which support the
introduction of EV fleets (e.g., CDM AMS.III.C) located within this project’s total region
19 This is consistent with CDM methodology AMS-III.C, which sets leakage at zero. Further analysis of crediting substitution risks between ineligible and eligible EV chargers confirmed substitution risks to be de minimis in the US due to a number of factors. These include: the large distances between public DCFC’s and unlikely substitution of public DCFC by public L2 charging; a very low portion of L2s are simultaneously public, accessible (e.g. not restricted workplaces) and excluded from project crediting period under VCS grandfathering rules (when 80-90% of L2 charging takes place in homes). Furthermore, L2 to L2 substitution between eligible and ineligible chargers in this de minimis segment can also be reciprocal reducing leakage still further. 20 Credits for GHG emission reductions issued under GHG programs such as the American Carbon Registry (ACR) Climate Action Reserve (CAR), Verified Carbon Standard (VCS), or the UNFCCC’s Clean Development Mechanism (CDM).

VM0038, Version 1.0 Sectoral Scopes 1 & 7
20
where the applicable fleet i categories are the same for both this EV charging system
project and projects introducing EV fleets21, in project year y-1 (tCO2e)
Where no GHG credits have been issued for projects that introduce EV fleets in the EV charging
system project’s region, Dy will be 1 (i.e., there is no discount applied).
Where project proponents can demonstrate that the EV charging systems included in the project
are comprised of a private or closed charging network (e.g., a private charging network that is in
secure garages, or a closed charging network for e-buses owned by a transit agencies where
chargers are reserved exclusively for its own public agency fleet), and can demonstrate that
relative to this closed or private charging network, no GHG credits have been issued for the
introduction of EVs using the network, then Dy will be 1 (i.e., there is no discount applied)22.
Where GHG credits have been issued for projects that introduce EV fleets for a region larger than
the proposed EV charging system project (e.g., a GHG project introducing a fleet of EVs U.S.-
wide, while the EV charging system project is confined to one state), then a sensible pro-rata
share of the GHG credits issued for the introduction of EV fleets can be estimated for the EV
charging system project’s region (e.g., using the pro-rata number of EVs on the road in the EV
charging system project state compared to the total in the US, using sources such as
ZEVFacts.com).
9 MONITORING
Project proponents must follow the monitoring procedures provided below, noting that Sections
9.1., 9.2 and 9.3 below set out parameters and requirements for monitoring projects.
Data and Parameters Available at Validation
In addition to the parameters given below, estimates for project parameters EF, AFEC, MPG, EV, EVR, MPGa,I,y and ED, which are found in section 9.2, will also be provided as needed at validation.
Data / Parameter: IRi
Data unit Number
Description Technology improvement factor for applicable fleet i in year y for
default value BE calculations.
21 Therefore, to determine ERFy, project proponents must assess projects that introduce EV fleets both based on
their location and applicable fleet category to address any potential double counting between GHG credits issued for
such projects which introduce fleets of EVs and the GHG credits issued for this EV charging system project. 22 This is allowed as private and closed charging networks, even if publicly owned, are not subject to the risk that EV
fleets with issued certified GHG credits would have access to its charging network, and the EV fleets that do use the
network have not issued separate GHG credits of their own. Public charging system operating as open networks
would not normally be able to demonstrate such lack of access and therefore must determine if a discount factor
must be applied.

VM0038, Version 1.0 Sectoral Scopes 1 & 7
21
Equations 1
Source of data CDM AMS-III.C which uses the same discount rate in baseline
calculations
Value applied If baselines are calculated using updated BEy parameters for each
project year y, IRi = 1
If default values are used for these BEy parameter calculations,
For LDV applicable fleets, IRi = 1
For HDV applicable fleets, IRi = 0.99
Justification of choice of
data or description of
measurement methods
and procedures applied
If the baseline is calculated each year using the applicable fleet
and conventional fleet statistics in each project year y, then no
technology improvement rates need to be applied (since annual
accurate data is used each year) IRi,y is therefore set to be 1.
IRi when applied to LDV projects using default values is 1 because
default values for MPG factors use individual, specific MPG figures
for each fossil fuel vehicle comparable to each EV model in the
applicable fleet (see Appendix 1). These MPG figures only
change substantially when a fossil fuel model is re-
designed/updated by manufacturers which takes place on a 7-10
year cycle: this timeframe is longer than the Verra five year update
cycle for parameter updates.
IRi when applied to HDV projects using default values is 0.99
because the defaults values use market-wide, class based
comparable MPG factors for default calculations rather than
individual, specific MPG figures for the fossil fuel vehicles
comparable to each EV model (see Appendix 1) provided that:
This 0.99 improvement rate is applied to each calendar year.
This rate is taken to be 0.99 consistent with the IR default in
CDM-III.C.
For project year 1, IR^(y-1) must be 1 (since any number to
power 0 is 1).
See justification in MPG below.
Purpose of Data Calculation of baseline emissions
Comments For LDV projects, the default equivalent MPG are taken from
specific comparable vehicles (rather than classes of vehicles)
whose MPG are only likely to change with major model upgrades
(and thus remain steady for many years).

VM0038, Version 1.0 Sectoral Scopes 1 & 7
22
Data and Parameters Available at Verification
Data / Parameter: EFj,f,y
Data unit tCO2 or CO2e/gallon
Description Emission factor for the fossil fuel f used by the fossil fuel vehicles
deemed comparable to each EV in applicable fleet i in year y
Equations 1
Source of data Use values from credible international or national government
sources such as, for the US, the EPA emissions factor23.
Value applied For LDV projects located in the US and Canada:
L1/L2 (BEV and PHEV average) = 0.0088 tCO2 or 0.0088 tCO2e
per gallon
DCFC (BEV average) = 0.0088 tCO2 or 0.0088 tCO2e per gallon
For HDV projects located in the US:
e-buses = 0.0102 tCO2 or 0.0102 tCO2e per gallon
e-trucks = 0.0102 tCO2 or 0.0102 tCO2e per gallon
Projects must apply the default value using units (CO2 or CO2e)
consistent with their project boundary choices, consistent across
all project activity sources.
Justification of choice of
data or description of
measurement methods
and procedures applied
International and national government transportation fuel emission
rates have been widely established and peer reviewed.
US & Canada default values calculated in Appendix 1.
Note that if countries provide EF fuel emission factors using
slightly different units such as CO2 per liter simple conversions
must be made during validation One common conversation from
CO2 per liter to CO2 per gallon is given below:
CO2 per gallon = CO2 per liter * 3.785 Based upon conversion factors of: 1 gall = 3.785 liters
Purpose of Data Calculation of baseline emissions
Comments Calculated annually, based on the fuels consumed by the fossil
fuel vehicles deemed comparable to the EV models on the road
each year in the applicable fleet, unless default values for
baseline calculations for LDVs and/or HDVs are used.
23 https://www.epa.gov/sites/production/files/2015-11/documents/emission-factors_nov_2015.pdf

VM0038, Version 1.0 Sectoral Scopes 1 & 7
23
Data / Parameter: AFECiy
Data unit kwh/100 miles
Description Weighted average electricity consumption per 100 miles rating for
EVs in applicable fleet i in project year y
Equations 1 and 2
Source of data Calculated in Equation 2
Value applied For LDV projects located in the US:
L1/L2 (BEV and PHEV average) = 33.32
DCFC (BEV average) = 31.88
For HDV projects located in the US:
e-buses = 300
e-trucks = 140
For LDV projects located in Canada:
L1/L2 (BEV and PHEV average) = 35.44
DCFC (BEV average) = 33.00
Justification of choice of
data or description of
measurement methods
and procedures applied
Analysis calculations can be found in Appendix 1.
Changes in the value of AFECiy are very gradual over time.
Default values for AFECiy must be updated each 5 years alongside
the activity method updates
US & Canada default values calculated in Appendix 1.
Purpose of Data Calculation of baseline emissions
Comments Calculations for AFEC for open networks (where the exact EV
models charging are not known) must be established using such
data sources which must be compiled on a national basis (that is,
for example, the number of BEV’s of each model on the road in
the US for open DCFC networks). Calculations for AFEC for
closed networks (e.g. where the composition and operating
characteristics of both the applicable and comparable fleets are
known and documented, such as with transit agency e-bus fleets)
may be made using the specific composition of these fleets (that
is, for example, EVR must be the number of e-buses on the road
for that particular transit agency fleet).
For both open and closed networks, the individual EV model’s EV
ratings (kwh/100 miles) must be used as applicable to the
government rating agencies from which they have been sourced,
(e.g. nationally for US; supra-nationally for EU), including in the
periodic update of default values.

VM0038, Version 1.0 Sectoral Scopes 1 & 7
24
Note again that if EVs are rated using slightly different variables
such as kwh/100 km in Europe simple conversions must be made
during validation. One common conversation from kwh/100km to
kwh/100 miles is given below:
kwh per 100 miles = kwh per 100km * 0.6215 Based upon conversion factors of: 100 km = 62.15 miles
Data / Parameter: MPGiy
Data unit miles per gallon
Description Weighted average miles per gallon rating for fossil fuel vehicles
deemed comparable to each EV in applicable fleet i in project year
y
Equations 1 and 3
Source of data Derived in Equation 3
Value applied For LDV projects located in the US:
L1/L2 (BEV and PHEV average) = 29.18
DCFC (BEV average) = 29.10
For HDV projects located in the US:
e-buses = 4.34
e-trucks = 8.60
For LDV projects located in Canada:
L1/L2 (BEV and PHEV average) = 29.65
DCFC (BEV average) = 27.71
Justification of choice of
data or description of
measurement methods
and procedures applied
US & Canada default values calculated in Appendix 1
For LDV projects, changes in the value of MPGiy are very gradual
over time given that a particular EV model’s comparable fossil fuel
vehicle rating must remain relatively steady for many years until
the vehicle is significantly re-engineered. Thus for LDV projects,
the default equivalent MPG’s are taken from specific comparable
vehicles (rather than classes of vehicles) whose MPG’s are only
likely to change with major model upgrades (and thus remain
static for many years).
For HDV projects, the class average MPG has been taken as the
source data (see Appendix 1) so the discount rate IRi of 0.99 must
still apply.
Default values for MPGiy must be updated each 5 years with the
activity method updates.

VM0038, Version 1.0 Sectoral Scopes 1 & 7
25
Purpose of Data Calculation of baseline emissions
Comments Consistent with guidance provided in AFEC above, weighted
average is calculated for project year y based upon the number of
EVs of each EV model type a in applicable fleet i on the road in
project year y (EVRaiy) combined with the mile per gallon ratings
for each of these EV model’s comparable fossil fuel vehicle
(MPGa,I,y).
Calculations for comparable fleet’s average MPG for open
networks (where the exact EV models charging are not known)
must be established using such data sources which must be
compiled on a national basis (that is, for example, the number of
BEV’s of each model on the road in the US for open DCFC
networks).
Calculations for these fleet’s MPG for closed networks (e.g. where
the composition and operating characteristics of both the
applicable and comparable fleets are known and documented,
such as with transit agency e-bus fleets) may be made using the
specific composition of these fleets (that is, for example, EVR must
be the number of e-buses on the road for that particular transit
agency fleet).
For HDV closed networks, if the composition and operating
characteristics of both the applicable and comparable fleets are
known and documented (e.g. for transit agency EV charging
infrastructure where the MPG’s for the agency’s own baseline bus
operations can be established as the agency’s comparable fleet of
fossil fuel buses) using any of the CDM AMS-III.C Approach 1,
Options 1 – 5, paragraphs 32 - 37.
For both open and closed networks, the individual fossil fuel
model’s MPG ratings must be used as applicable to the
government rating agencies from which they have been sourced
(e.g., nationally for US; supra-nationally for EU), including in the
periodic update of default values.
MPGiy is calculated annually unless the default values for baseline
calculations for LDVs and/or HDVs is used following Equation 4,
which employs the default value DMPGiy.
US & Canada default values calculated in Appendix 1.
If standard emission values are provided using different
parameters (such as CO2/km as fossil fuel vehicle emission
factors in Europe) conversions to given variable units will be
made. One common conversation from liters per 100 km to miles
per gallon is given below:

VM0038, Version 1.0 Sectoral Scopes 1 & 7
26
MPG = 235.24 / liters per 100 km Based upon conversion factors of: 1 gall = 3.785 liters 100 km = 62.15 miles
Data / Parameter: EVaiy
Data unit kwh/100 miles
Description Electricity kwh consumption per 100 miles rating for EV model a
within applicable fleet i in project year y
Equations 2
Source of data Use values from credible national governmental sources such as
the ratings for the US provided by US DoE Fuel Economy
program24.
Value applied N/A
Justification of choice of
data or description of
measurement methods
and procedures applied
National, governmental ratings provide independent third party
public source.
Purpose of Data Calculation of baseline emissions
Comments See guidance for AFEC above.
For both open and closed networks, the EVaiy ratings must be
used as applicable to the government rating agencies from which
they have been sourced, e.g. nationally for US; supra-nationally
for EU.
Data / Parameter: EVRaiy
Data unit Cumulative number of EVs
Description Total number of EV model a within applicable fleet i on the road by
project year y
Equations 2 and 3
Source of data Use values from credible national governmental sources such as
the statistics provided for the US provided by the Argonne National
Laboratory’s monthly email updates25
24 https://www.fueleconomy.gov/feg/evsbs.shtml 25 Such as the U.S. E-Drive vehicle monthly updates_February 2017 provided via email by ANL. The main ANL web link is found here including the email address for the database manager: https://www.anl.gov/energy-systems/project/light-duty-electric-drive-vehicles-monthly-sales-updates 25 https://www.fueleconomy.gov/feg/pdfs/guides/FEG2016.pdf

VM0038, Version 1.0 Sectoral Scopes 1 & 7
27
Closed networks may also use the number of EV’s on the road
using their known composition and operating characteristics of the
applicable fleets they serve.
Value applied N/A
Justification of choice of
data or description of
measurement methods
and procedures applied
Argonne National Laboratory is an independent, trusted
government source of EV data for the US market.
Purpose of Data Calculation of baseline emissions
Comments This value is calculated for project year y based upon the
cumulative number of EVs of each EV model type a in applicable
fleet i on the road by project year y, consistent with AFEC
guidance above.
In the USA, statistics for the number of EVs on the road by model
type is available from several sources including Argonne National
Laboratory, in their monthly emails26, which draws upon data from
hybridcars.com27.
Data / Parameter: MPGa,I,y
Data unit miles/gallon
Description Mile per gallon rating for fossil fuel vehicle model(s) deemed
comparable to EV model a from applicable fleet i in project year y
Equations 3
Source of data See guidance for MPGiy above.
Use values from credible national government sources such as the
US rating found in the 2016 Fuel Economy Guide28
For both open and closed networks, the MPG a,I,y ratings must be
used as applicable to the government rating agencies from which
they have been sourced (e.g., nationally for US; supra-nationally
for EU.)
Value applied N/A
26 See U.S. E-Drive vehicle monthly updates_February 2017 provided via email by ANL. https://www.anl.gov/energy-systems/project/light-duty-electric-drive-vehicles-monthly-sales-updates 27 Argonne National Lab’s (ANL) monthly emails uses data sourced from the hybridcars.com web site: http://www.hybridcars.com/december-2016-dashboard/ The main ANL web link is found here including the email address for the database manager: https://www.anl.gov/energy-systems/project/light-duty-electric-drive-vehicles-monthly-sales-updates 28 https://www.fueleconomy.gov/feg/pdfs/guides/FEG2016.pdf

VM0038, Version 1.0 Sectoral Scopes 1 & 7
28
Justification of choice of
data or description of
measurement methods
and procedures applied
National governmental ratings such as those found in the US Fuel
Economy Guides for the US market are independent, trusted
government sources of fuel consumption ratings.
Purpose of Data Calculation of baseline emissions
Comments If standard emission values are provided using parameters which
already incorporate fuel emission factors such as CO2/km ratings
for fossil fuel vehicle emission factors in Europe then conversions
to the appropriate combination of variables must be made to
establish equivalence to the parameters in these equations.
For example, in Europe, fossil fuel vehicle are rated in terms of
CO2 per km (given here as EFEU). Therefore, if the EV ratings
are still given as kwh per 100 miles, then such a conversion would
be: CO2 per mile = EFj,f,y / MPGa,I,y = EFEU / 0.62.
Data / Parameter: EDi,y
Data unit Kwh/year
Description Quantity of electricity delivered to EV’s by project chargers serving
applicable fleet i in project year y
Equations 1
Source of data kwh delivered to EV’s for project charging network using systems’
actual or estimated kwh values, as below.
Note that for L2 chargers, the electricity delivered, ED, will be
considered the same as electricity consumed by the chargers EC
since L2’s are highly efficient chargers with de minimis losses due
to their own power consumption. (i.e. ED = EC)
For DCFC, baseline emission calculations must use ED which
must be based upon the kwh delivered to the EV’s which is what
the chargers’ own internal smart DCFC’s meter measure.
(By contrast, for project emissions measurements which are based
on the electricity consumed by the DCFC (where efficiency losses
can be more material) kwh data can be sourced either A) from this
ED provided that a DCFC efficiency factor is applied or B) from
kwh data metered on the grid-side of the charging system and any
associated AI. See EC, ECTOD, NEC and NECT parameter
boxes below for PE applications.)
Value applied Measured value based on kwh delivered by charging systems in
year y

VM0038, Version 1.0 Sectoral Scopes 1 & 7
29
Description of
measurement methods
and procedures to be
applied
The kwh delivered by the charging systems for each applicable
fleet i must be sourced using the following hierarchy, where
projects must apply first those listed highest on the list:
1) Actual kwh sourced using smart charger measurement
systems or (for L2’s only) on-site grid electricity meters
2) Estimates for a project’s dumb network charger segments
based upon the portions of the project which has available
such smart network project averages or utility-style project
user survey data applicable to these same segments (e.g. for
each applicable fleet across comparable segments (public,
workplace, residential etc))
3) Investments to upgrade chargers to provide actual “smart”
data results by installing technologies which effectively retrofit
metering29
4) Use of reasonable regionally applicable pilot project data (such
as local utility project results) for non-metered project chargers
that don’t have smart actual measurements when this pilot
data reasonably corresponds to comparable utilization rates to
those in the project
5) In the US, use of the Department of Energy/Idaho National
Laboratory’s (DoE/INL) EV Project data30 to apply average
kwh per charging event data which is provided across a)
different settings (public, residential, non-private residential)
and b) for each US state
For #2 and 4, validator reviews must consider whether projects are
applying “smart”/utility/pilot project data using an appropriate
project segmentation basis, so that there is a reasonably
comparable basis upon which chargers operate in the “dumb” and
“smart” segments. This comparability provides a reasonable basis
upon which to apply the representative smart segment averages to
the corresponding dumb segments of the project.
Use calibrated electricity meters/smart charging system
measurement systems. Calibration must be conducted according
to the equipment manufacturer’s specifications.
Frequency of
monitoring/recording
Measured actual data must be monitored and recorded on at least
an annual basis; monitoring periods for metered data can be
consistent with utility reports. Estimated consumption can be
29 For example, EMotorWerks Juicebox 30 https://avt.inl.gov/project-type/ev-project

VM0038, Version 1.0 Sectoral Scopes 1 & 7
30
made on annual basis from sources which monitor using
measured/actual or metered sources per the hierarchy above.
QA/QC procedures to be
applied
The consistency of metered electricity consumption should be
cross-checked with receipts from electricity purchases where
applicable
Purpose of Data Calculation of baseline emissions
Calculation method:
Comments N/A
Data / Parameter: ECi,y
Data unit Kwh/year
Description Quantity of electricity consumed by project chargers serving
applicable fleet i in project year y
Equations 4
Source of data kwh consumption for project charging network using systems’
actual or estimated kwh values, as below
Note that for L2 chargers, the electricity consumed EC will be
considered the same as electricity delivered to the EV’s by the
chargers, ED, since L2’s are highly efficient chargers with de
minimis losses due to their own power consumption. (i.e. ED =
EC)
For DCFC, EC must be based upon the kwh consumed by the
charging system (since efficiency losses can be more material for
DCFC’s). DCFC EC data can therefore either be sourced via: A)
ED, the chargers’ own internal smart DCFC’s meter data, provided
that a DCFC efficiency factor of 92.3% is applied to the smart
charger metered data31 or B) meters which are on the grid-side of
the DCFC units/AI
If a project can demonstrate to validators a more accurate
efficiency factor for their particular DCFC systems (for example
due to improvements in DCFC technology efficiencies over time)
this updated accurate efficiency factor may be substituted for the
92.3% default efficiency value.
Value applied Measured value based on kwh consumed by charging systems in
year y
For DCFC, using approach A, ECi,y = EDi,y/0.923
31 The 92.3% DCFC efficiency factor is derived from Idaho National Lab powerpoint findings as reviewed with the VVB.

VM0038, Version 1.0 Sectoral Scopes 1 & 7
31
Description of
measurement methods
and procedures to be
applied
The kwh consumed by the charging systems for each applicable
fleet i must be sourced using the following hierarchy, where
projects must apply first those listed highest on the list:
1) Actual kwh consumed using smart charger measurement
systems or on-site electricity meters
2) Estimates for a project’s dumb network charger segments
based upon the portions of the project which has available
such smart network project averages or utility-style project
user survey data applicable to these same segments (e.g. for
each applicable fleet across comparable segments (public,
workplace, residential etc))
3) Investments to upgrade chargers to provide actual “smart” data
results by installing technologies which effectively retrofit
metering32
4) Use of reasonable regionally applicable pilot project data (such
as local utility project results) for non-metered project chargers
that don’t have smart actual measurements when this pilot
data reasonably corresponds to comparable utilization rates to
those in the project
5) In the US, use of the Department of Energy/Idaho National
Laboratory’s (DoE/INL) EV Project data33 to apply average kwh
per charging event data which is provided across a) different
settings (public, residential, non-private residential) and b) for
each US state
For #7 and 9, validator reviews must consider whether projects are
applying “smart”/utility/pilot project data using an appropriate
project segmentation basis, so that there is a reasonably
comparable basis upon which chargers operate in the “dumb” and
“smart” segments. This comparability provides a reasonable basis
upon which to apply the representative smart segment averages to
the corresponding dumb segments of the project.
Use calibrated electricity meters/smart charging system
measurement systems. Calibration must be conducted according
to the equipment manufacturer’s specifications.
Frequency of
monitoring/recording
Measured actual data must be monitored and recorded on at least
an annual basis; monitoring periods for metered data can be
consistent with utility reports. Estimated consumption can be
made on annual basis from sources which monitoring using
measured/actual or metered sources.
32 For example, EMotorWerks Juicebox 33 https://avt.inl.gov/project-type/ev-project

VM0038, Version 1.0 Sectoral Scopes 1 & 7
32
QA/QC procedures to be
applied
The consistency of metered electricity consumption should be
cross-checked with receipts from electricity purchases where
applicable
Purpose of Data Calculation of baseline and project emissions
Calculation method:
Comments N/A
Data / Parameter EFkwi,j,y
Data unit tCO2e/kwh
Description Emission factor for the electricity sourced from region j consumed
by project chargers serving applicable fleet i in year y
Equations 4
Source of data Use credible government data sources such as, for the US, the
regional eGRID emission factors published by EPA34
Description of
measurement methods
and procedures to be
applied
The emission factor must be consistent with the region j from
which electricity is sourced (e.g. for the US with the utility’s eGRID
region35).
Published utility specific emission factors are allowed for the kwh
consumed from that source consistent with VCS practices which
allow well documented more local electricity sources’ GHG
emission factors to be applied.
Average emission factors (not marginal) must be used
Grid-sourced and dedicated renewable kwh is treated as having
zero tCO2e/kwh.
Biogenic sources used on-site to generate electricity are
considered dedicated renewables. Other on-site biofuels used to
generate electricity must apply and justify their own emission
factors for the biofuel used, such as those referenced in the same
EPA source from which the other fuel emission default factors
(EF) were derived36.
Frequency of
monitoring/recording
Annual updates from these published sources
QA/QC procedures to be
applied
Purpose of data Calculation of project emissions
34 https://www.epa.gov/energy/emissions-generation-resource-integrated-database-egrid 35 https://www.epa.gov/sites/production/files/2017-02/documents/egrid2014_summarytables_v2.pdf 36 https://www.epa.gov/sites/production/files/2015-07/documents/emission-factors_2014.pdf

VM0038, Version 1.0 Sectoral Scopes 1 & 7
33
Calculation method: Look up value
Comments: Region j represents any region from which electricity is sourced,
each of which must have a well-documented emissions factor for
the electricity provided.
For US projects, electricity emissions must be estimated using the
EPA regional eGRID emission rates, unless other more accurate
local/regional sources are available (e.g. from utilities directly
serving the charging network).
Data / Parameter ECTODi,j,t,y
Data unit Kwh/time period t
Description Quantity of electricity consumed by project chargers sourced from
region j serving applicable fleet i during time of day period t in
project year y
Equations 5
Source of data kwh consumption for project charging network using systems’
actual values provided these are generated using time-of-day
metering
The same guidance provided for ECi,y relative to the sources of
data for L2 and DCFC apply here. So L2 data can be sourced
from kwh measured as delivered to EV’s or consumed by the
chargers since efficiency losses are de minimis. And DCFC data
may either be sourced via A) DCFC’s own internal smart meter
systems, provided that a DCFC efficiency factor of 92.3% is
applied; or B) meters which are on the grid-side of the DCFC
units/AI.
Thus again for DCFC, using approach A, the value applied would
be ECTODi,j,t,y/0.923
If a project can demonstrate to validators a more accurate
efficiency factor for their particular DCFC systems (for example
due to improvements in DCFC technology efficiencies over time)
this updated accurate efficiency factor may be substituted for the
92.3% default efficiency value.
Description of
measurement methods
and procedures to be
applied
The kwh supplied by the charging systems applying time of day
calculations in equation 6 must be sourced as follows:
1. Using actual time-of-day kwh measurements using smart
charger measurement systems or on-site electricity meters,
capable of recording/monitoring kwh consumption on at minimum
an hourly basis

VM0038, Version 1.0 Sectoral Scopes 1 & 7
34
3. Investments to upgrade chargers to provide such time-of-day
actual data results are permitted provided they supply comparable
hourly reporting
Electricity meters’ calibration must be conducted according to the
equipment manufacturer’s specifications.
Frequency of
monitoring/recording
Data must be monitored continuously and recorded on at least an
hourly basis.
QA/QC procedures to be
applied
The consistency of metered electricity generation should be cross-
checked with receipts from electricity purchases where applicable
Purpose of data Calculation of project emissions
Calculation method:
Comments: The sum of all such time-of-day time periods, t, must equal 24 in
any given full day within the project (i.e. there are no time periods
in which electricity is provided but not accounted for within PEy).
This is applicable only if PE emissions are to be calculated on a
time-of-day basis.
Data / Parameter EFkwTODj,j,t,y
Data unit tCO2e/kwh
Description Emission factor for the electricity sourced from region j consumed
by project chargers serving applicable fleet i during time of day
period t in year y
Equations 5
Source of data Use credible governmental or regional utility data sources such
as, for the US, those published in the US by ISO’s which rely upon
utilities’ hourly fuel consumption figures (e.g. see PJM
publications37)
Time of day estimates for electricity emission factors, EFkwi,j,t,y
must be drawn from credible, applicable sources (e.g. the regional
ISO or applicable utility generation sources).
Description of
measurement methods
and procedures to be
applied
If EFkwTODj,j,y has already been published by utilities in region j
on an hourly basis, then these figures must be used.
Since hourly EFkwTOD publications may not readily be available,
if in region j utilities or ISOs are publishing time of day emission
factors on a basis other than hourly, then projects may use this
other basis provided it is accepted by validators as reasonable (for
37 http://www.monitoringanalytics.com/data/marginal_fuel.shtml

VM0038, Version 1.0 Sectoral Scopes 1 & 7
35
example PJM publishes on-peak and off-peak emission factors) in
order to accommodate ISO/utility gradual improvements in best
practices for time of day emission factor reporting38.
If in region j, the ISO provides fuel consumption data on an hourly
basis, EFkwTODj,j,y may be estimated on a weighted average
basis using equation 6
Grid-sourced and dedicated renewable kwh is treated as having
zero tCO2e/kwh
Biogenic sources used on-site to generate electricity are
considered dedicated renewables. Other on-site biofuels used to
generate electricity must apply and justify their own emission
factors for the biofuel used, such as those referenced in the same
EPA source from which the other fuel emission default factors
(EF) were derived39.
Frequency of
monitoring/recording
Source data (for emission factor EFkwTODj,j,y) must be monitored
continuously and recorded on at least an hourly or prevailing best
practice basis.
QA/QC procedures to be
applied
Purpose of data Calculation of project emissions
Calculation method: If EFkwTODj,j,y is estimated using hourly fuel consumption reports
(e.g. from an ISO), the weighted average calculations are given in
equation 6
Comments: The sum of all such time-of-day time periods, t, must equal 24 in
any given full day within the project (i.e. there are no time periods
in which electricity is provided but not accounted for within PEy).
This is applicable only if PE emissions are to be calculated on a
time-of-day basis
Data / Parameter EFkwFj,j,t,f, y
Data unit tCO2e/kwh
Description Emission factor applicable for the fuel type f used to generate the
kwh during time of day period t sourced from region j consumed
by project chargers serving applicable fleet i in year y
Equations 6
38 There are no utility/ISO EFkw hourly published rates yet available (only fuel consumption rates) but as the PJM on-peak/off-peak publications indicate such TOD rates will become more accessible over time 39 https://www.epa.gov/sites/production/files/2015-07/documents/emission-factors_2014.pdf

VM0038, Version 1.0 Sectoral Scopes 1 & 7
36
Source of data Use credible governmental or regional utility data sources such
as, for the US, those published in the US by ISO’s which rely upon
utilities’ hourly fuel consumption figures (e.g. see PJM
publications40)
Description of
measurement methods
and procedures to be
applied
If in region j, the ISO provides fuel consumption data on an hourly
basis, EFkwFj,j,t,f,y may be estimated on a weighted average basis
using equation 6 as follows:
Projects must combine the hourly fuel consumption figures
(typically given as the percentage of each type of fuel
consumed that hour (50% coal, 50% natural gas)) with the
emission factors for these same fuels to create a weighted
average emission rate for each hourly period.
Emission rates for each fuel must be drawn from the same
(e.g. the ISO) or consistent publication sources for region j
(noting that these need not be generated on an hourly basis
but must be updated on at least an annual basis)
Frequency of
monitoring/recording
Each fuel’s emission rate need not be generated on an hourly
basis but averages must be generated on at least an annual
basis.
QA/QC procedures to be
applied
Purpose of data Calculation of project emissions
Calculation method:
Comments: Applicable only if PE emissions are to be calculated on a time-of-
day basis using utility/ISO hourly fuel consumption inputs
Data / Parameter F%ijtfy
Data unit %
Description Percentage of fuel type f used to generate the kwh DURING
EACH time of day period t, sourced from region j and consumed
by project chargers serving applicable fleet I in year y
Equations 6
Source of data Use credible governmental or regional utility data sources such
as, for the US, those published in the US by ISO’s which rely upon
utilities’ hourly fuel consumption figures (e.g. see PJM
publications41)
40 http://www.monitoringanalytics.com/data/marginal_fuel.shtml 41 http://www.monitoringanalytics.com/data/marginal_fuel.shtml

VM0038, Version 1.0 Sectoral Scopes 1 & 7
37
Description of
measurement methods
and procedures to be
applied
The hourly fuel consumption figures are typically given as the
percentage of each type of fuel consumed that hour (50% coal,
50% natural gas)).
Frequency of
monitoring/recording
This fuel sourced parameter data must be monitored and recorded
on at least an hourly basis.
Since the emission factors for each fuel type f need not be
generated on an hourly but can be supplied on an annual basis,
the percentage of each fuel type f used to generate the kwh during
each time period will be supplied for each such time period.
QA/QC procedures to be
applied
Typically a look up value
Purpose of data Calculation of project emissions
Calculation method:
Comments: Applicable only if PE emissions are to be calculated on a time-of-
day basis using utility/ISO hourly fuel consumption inputs
Data / Parameter NECi,j,s,y
Data unit kwh/year
Description Electricity consumed by project chargers supplied from associated
infrastructure source s net of any kwh EV/charger returned to this
same source within region j serving applicable fleet i in project
year y
Equations 7
Source of data Net kwh consumption/generation for project chargers must be
secured for each associated infrastructure source (whether
derived from the grid, dedicated renewables or the on-site battery)
as actual net kwh values using chargers’ adequate metering
systems
The same core guidance provided for ECi,y relative to the sources
of data for L2 and DCFC apply here. So L2 data can be sourced
from kwh measured as delivered to EV’s by the charger meter or
as the kwh consumed by the chargers from a grid-based source
since losses are de minimis. And DCFC data may either be
sourced via A) DCFC’s own internal smart meter systems capable
of differentiating the net kwh delivered to the EV’s from each
source s, provided that a DCFC efficiency factor of 92.3% is
applied; or B) meters which are on the grid-side of the DCFC
units/AI for each source s.

VM0038, Version 1.0 Sectoral Scopes 1 & 7
38
Thus again for DCFC, using approach A, the value applied would
be NECi,j,s,y /0.923
If project can demonstrate to validators a more accurate efficiency
factor for their particular DCFC systems (for example due to
improvements in DCFC technology efficiencies over time) this
updated accurate efficiency factor may be substituted for the
92.3% default efficiency value.
Description of
measurement methods
and procedures to be
applied
Projects must track the net kwh consumption/generation for
charging systems from across all potential associated
infrastructure sources, s, (whether grid, dedicated renewable
sources, on-site battery), net of kwh supplied back from the EV
battery to such sources, using the charger’s metering system to
track such net kwh calculations.
To apply equation 7, such net kwh values must be sourced as
follows:
1) Using actual kwh consumption and generation
measurements using on-site or smart chargers’ metering
systems, capable of recording/monitoring kwh both
consumed and generated on at minimum a yearly basis
2) Investments to upgrade chargers to provide such net
metered actual data results are permitted provided they
supply comparable reporting
Associated infrastructure sources, s, for which NEC is calculated
include:
grid-connected electricity from region j
and/or dedicated renewable energy generated on-site
(including RE sourced from direct transmission lines)
and/or the EV vehicle’s on-board battery
Each of the grid and renewables sources, s, must have a well-
documented emissions factor for the electricity sourced and/or
dispatched
Project metering systems’ calibration must be conducted
according to the equipment manufacturer’s specifications.
Projects must incorporate adequate metering systems when
applying Eq 7. Guidance for the design/application of such
metering systems is provided in Appendix 2.
Frequency of
monitoring/recording
Measured actual data must be monitored and recorded on at least
an annual basis.
Monitoring periods for metered net data can be consistent with
reports which the charging systems’ metering system provides.

VM0038, Version 1.0 Sectoral Scopes 1 & 7
39
QA/QC procedures to be
applied
The consistency of net metered electricity generation should be
cross-checked with receipts and invoices from electricity
purchases and sales where applicable
Purpose of data Calculation of project emissions
Calculation method:
Comments: The charging system’s metering system must adequately and
accurately measure and traces such electricity deliveries and
receipts from these associated infrastructure sources, (including
for example electricity sourced from/returned to the grid, on-
site/dedicated renewables, on-site batteries, EV batteries).
Applicable only if PE emissions are to be calculated on a net
metered basis integrating multiple associated infrastructure
sources, s.
Note: time of day, hourly monitoring of EV charging/associated
infrastructure deliveries and receipts is not a necessary
requirement to apply Equation 7. For combined associated
infrastructure metering and time of day PE estimates, see
parameters for equation 9.
Data / Parameter EFkwAIi,,j,s,y
Data unit (tCO2e/kwh)
Description Emission factor for the net electricity from each associated
infrastructure source s within region j consumed by project
chargers serving applicable fleet i in year y
Equations 7
Source of data Each of associated infrastructure source, s, must have a well-
documented emissions factor for the electricity it supplies and/or
dispatches as follows:
Grid-connected electricity from region j must follow the
same procedures as for parameter EFkwi,j,y in Equation 4
(see above)
Dedicated renewable energy generated on-site, including
renewable energy sourced via direct transmission lines,
must set emission factors at zero
On-site storage batteries must assume the weighted
average emission factor based upon the proportionate net
consumption of grid and dedicated renewable energy at
the charging system (see equation 8)

VM0038, Version 1.0 Sectoral Scopes 1 & 7
40
Description of
measurement methods
and procedures to be
applied
For grid-connected electricity, see procedures for parameter
EFkwi,j,y in Equation 4
For dedicated renewables, emission factors are set at zero.
For on-site storage batteries, the calculations are given in
equation 8.
Projects must incorporate adequate metering systems when
applying Eq 7 and 8. Guidance for the design/application of such
metering systems is provided in Appendix 2.
Frequency of
monitoring/recording
Annual, per procedures for parameter EFkwi,j,y in Equation 4
QA/QC procedures to be
applied
Purpose of data Calculation of project emissions
Calculation method: For on-site batteries see equation 8
Comments: Applicable only if PE emissions are to be calculated on a net
metered basis integrating multiple associated infrastructure
sources, s.
Note: time of day, hourly monitoring of EV charging/associated
infrastructure deliveries and receipts is not a necessary
requirement to apply Equation 7. For combined associated
infrastructure metering and time of day PE estimates, see
parameters for equation 9.
Data / Parameter LECj,,j,y
Data unit kwh/year
Description Electricity provided to the grid and/or building from on-site storage
battery within region j serving applicable fleet i in project year y
(kwh/year)
Equations 7
Source of data From on-site battery/charging system’s adequate measurement
systems
Description of
measurement methods
and procedures to be
applied
LEC arises if on-site batteries provide kwh back to the grid or local
building (for example if used as back up generators/sources of
power). These kwh are not supplied to the EV charging system

VM0038, Version 1.0 Sectoral Scopes 1 & 7
41
and do not result in EV miles drive and so are deducted out in Eq
7.
Projects must incorporate adequate metering systems when
applying Eq 7. Guidance for the design/application of such
metering systems is provided in Appendix 2.
Project metering systems’ calibration must be conducted
according to the equipment manufacturer’s specifications.
Frequency of
monitoring/recording
Measured actual data must be monitored and recorded on at least
an annual basis.
QA/QC procedures to be
applied
The consistency of such kwh should be cross-checked with other
information sources where applicable
Purpose of data Calculation of project emissions
Calculation method:
Comments: Applicable only if PE emissions are to be calculated on a net
metered basis integrating multiple associated infrastructure
sources, s.
Note: time of day, hourly monitoring of EV charging/associated
infrastructure deliveries and receipts is not a necessary
requirement to apply Equation 7. For combined associated
infrastructure metering and time of day PE estimates, see
parameters for equation 9.
Data / Parameter EFkwonsitebatti,j,s,y
Data unit (tCO2e/kwh)
Description Emission factor for the electricity from the on-site batteries as
associated infrastructure sources s within region j consumed by
project chargers serving applicable fleet i in year y
Equations 8
Source of data See data sources for Equation 8 variables below
Description of
measurement methods
and procedures to be
applied
The emission factors for the on-site battery as an associated
infrastructure source are calculated using the net weighted
average of the grid and on-site renewable emission factors given
using equation 8
On-site storage batteries must assume the weighted
average emission factor based upon the proportionate net
consumption of grid and dedicated renewable energy at
the charging system (using equation 8)

VM0038, Version 1.0 Sectoral Scopes 1 & 7
42
Projects must incorporate adequate metering systems when
applying Eq 8. Guidance for the design/application of such
metering systems is provided in Appendix 2.
Frequency of
monitoring/recording
Annual
QA/QC procedures to be
applied
As for equation 8 variables below
Purpose of data Calculation of project emissions
Calculation method:
Comments: Applicable only if PE emissions are to be calculated on a metered
basis integrating multiple associated infrastructure sources, s.
Data / Parameter ECBi,j,z,y
Data unit kwh/year
Description Electricity consumed by on-site battery from associated
infrastructure sources z, which comprise only the grid-connected
and dedicated renewable sources, within region j serving
applicable fleet i in project year y
Equations 8
Source of data As for NECi,j,s,y in equation 7
Description of
measurement methods
and procedures to be
applied
As for NECi,j,s,y in equation 7
Projects must incorporate adequate metering systems when
applying Eq 8. Guidance for the design/application of such
metering systems is provided in Appendix 2.
In particular, metering systems must need to measure the kwh
delivered to the onsite battery from grid and/or renewable sources
as distinct from those delivered directly to the EV charger from the
grid and/or dedicated renewable sources
Frequency of
monitoring/recording
As for NECi,j,s,y in equation 7
QA/QC procedures to be
applied
Purpose of data Calculation of project emissions
Calculation method: As for NECi,j,s,y in equation 7
Comments: Applicable only if PE emissions are to be calculated on a metered
basis integrating multiple associated infrastructure sources, s,
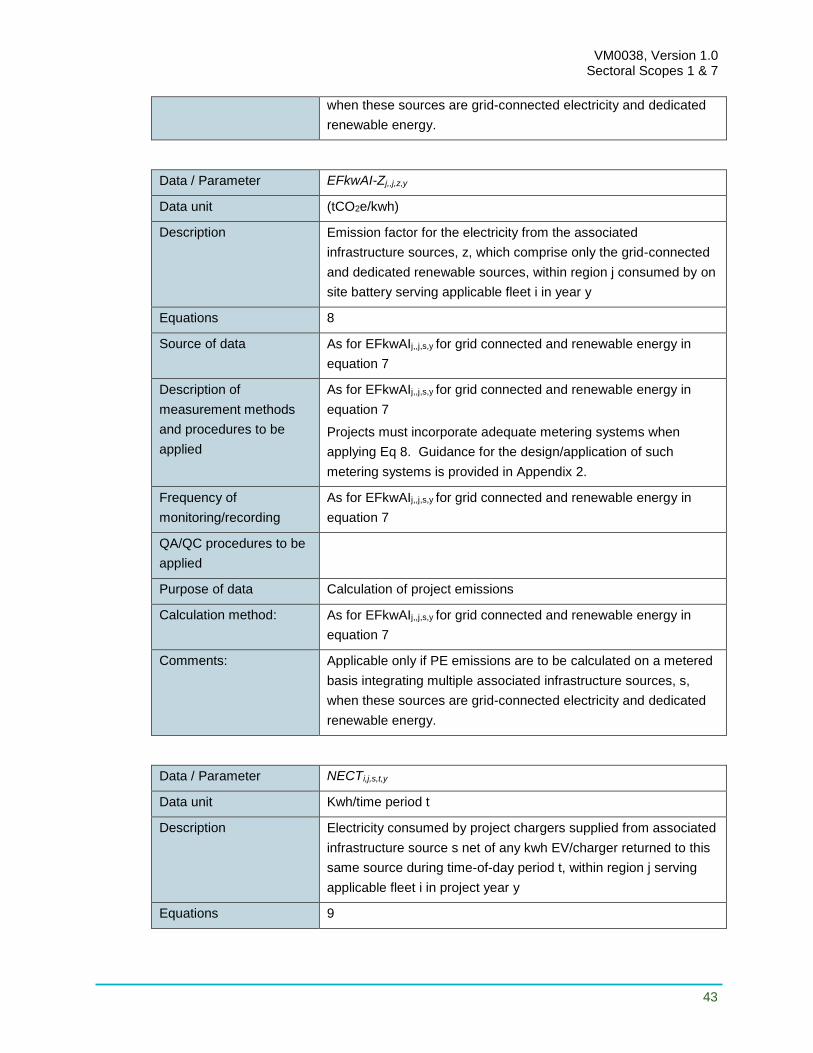
VM0038, Version 1.0 Sectoral Scopes 1 & 7
43
when these sources are grid-connected electricity and dedicated
renewable energy.
Data / Parameter EFkwAI-Zj,,j,z,y
Data unit (tCO2e/kwh)
Description Emission factor for the electricity from the associated
infrastructure sources, z, which comprise only the grid-connected
and dedicated renewable sources, within region j consumed by on
site battery serving applicable fleet i in year y
Equations 8
Source of data As for EFkwAIj,,j,s,y for grid connected and renewable energy in
equation 7
Description of
measurement methods
and procedures to be
applied
As for EFkwAIj,,j,s,y for grid connected and renewable energy in
equation 7
Projects must incorporate adequate metering systems when
applying Eq 8. Guidance for the design/application of such
metering systems is provided in Appendix 2.
Frequency of
monitoring/recording
As for EFkwAIj,,j,s,y for grid connected and renewable energy in
equation 7
QA/QC procedures to be
applied
Purpose of data Calculation of project emissions
Calculation method: As for EFkwAIj,,j,s,y for grid connected and renewable energy in
equation 7
Comments: Applicable only if PE emissions are to be calculated on a metered
basis integrating multiple associated infrastructure sources, s,
when these sources are grid-connected electricity and dedicated
renewable energy.
Data / Parameter NECTi,j,s,t,y
Data unit Kwh/time period t
Description Electricity consumed by project chargers supplied from associated
infrastructure source s net of any kwh EV/charger returned to this
same source during time-of-day period t, within region j serving
applicable fleet i in project year y
Equations 9

VM0038, Version 1.0 Sectoral Scopes 1 & 7
44
Source of data Net electricity consumed by project chargers during time-of-day
period t from associated infrastructure sources s, within region j
serving applicable fleet i in project year y
The same core guidance provided for ECi,y relative to the sources
of data for L2 and DCFC apply here. So L2 data can be sourced
from kwh measured as delivered to EV’s by the charger meter or
as the kwh consumed by the chargers from a grid-based source
since losses are de minimis. And DCFC data may either be
sourced via A) DCFC’s own internal smart meter systems capable
of differentiating the net kwh delivered to the EV’s from each
source s during time period t, provided that a DCFC efficiency
factor of 92.3% is applied; or B) meters which are on the grid-side
of the DCFC units/AI for each source s and time period t.
Thus again for DCFC, using approach A, the value applied would
be NECTi,j,s,t,y /0.923
If a project can demonstrate to validators a more accurate
efficiency factor for their particular DCFC systems (for example
due to improvements in DCFC technology efficiencies over time)
this updated accurate efficiency factor may be substituted for the
92.3% default efficiency value.
Description of
measurement methods
and procedures to be
applied
Follow those for parameters ECi,j,t,y in equation 5 and NECi,j,s,y in
equation 7
Projects must incorporate adequate metering systems when
applying Eq 9. Guidance for the design/application of such
metering systems, considered as applied to each time period t, is
provided in Appendix 2.
In addition, for time of day applications of associated infrastructure
calculations pertaining to the NECT for an on-site battery’s kwh
delivered to the EV charger, metering must be applied “upstream”,
on the grid-side of the on-site battery. That is for the calculation of
NECT for an on-site battery, Eq 9 must, using upstream meters,
calculate the kwh delivered to EV chargers via the on-site battery
from grid and/or dedicated renewable sources during the time of
day period t taking into account when these kwh are actually
delivered to the on-site battery (not when delivered from this
battery to the EV charger) since the GHG impacts for these kwh
arise on the grid system when they are first delivered into this
associated infrastructure system (that is are delivered to the on
site battery)
For these applications, kwh supplied by the EV to the on-site
battery can be set aside (since they return to the EV at a later

VM0038, Version 1.0 Sectoral Scopes 1 & 7
45
date) unless, during a given time period t, the LEC less the kwh
received by the on site battery from grid and renewable sources
less the on-site battery’s stored kwh is greater than zero – that is
LEC is so large that it must have drawn upon the kwh delivered to
the on-site battery from the EV
In the context of these NECT calculations for the on-site battery, it
should be noted that the kwh supplied from the grid to the EV
charging system directly – and those kwh supplied by the EV back
to the grid – during any time period t are still considered
separately in the calculation of NECT for the grid.
Frequency of
monitoring/recording
Follow those for parameters ECi,j,t,y in equation 5 and NECi,j,s,y in
equation 7
QA/QC procedures to be
applied
Follow those for parameters ECi,j,t,y in equation 5 and NECi,j,s,y in
equation 7
Purpose of data Calculation of project emissions
Calculation method:
Comments: Follow those for parameters ECi,j,t,y in equation 5 and NECi,j,s,y in
equation 7
Applicable only if PE emissions are to be calculated on a time-of-
day basis when also incorporating charging systems’ associated
infrastructure sources on a metered basis.
Data / Parameter EFkwTOD-AIi,j,s,t,y
Data unit tCO2e/kwh
Description Emission factor for the electricity from associated infrastructure
source s within region j consumed by project chargers serving
applicable fleet i during time-of-day period t in year y
Equations 9
Source of data Follow those for parameters EFkwTODj,,j,t,y in equation 5 and
EFkwAIj,,j,s,y in equation 7
Description of
measurement methods
and procedures to be
applied
Follow those for parameters EFkwTODj,,j,t,y in equation 5 and
EFkwAIj,,j,s,y
in equation 7
Projects must incorporate adequate metering systems when
applying Eq 9. Guidance for the design/application of such
metering systems, considered as applied to each time period t, is
provided in Appendix 2.

VM0038, Version 1.0 Sectoral Scopes 1 & 7
46
Frequency of
monitoring/recording
Follow those for parameters EFkwTODj,,j,t,y in equation 5 and
EFkwAIj,,j,s,y in equation 7
QA/QC procedures to be
applied
Purpose of data Calculation of project emissions
Calculation method: Follow those for parameters EFkwTODj,,j,t,y in equation 5 and
EFkwAIj,,j,s,y in equation 8
Comments: Follow those for parameters EFkwTODj,,j,t,y in equation 5 and
EFkwAIj,,j,s,y in equation 8
Applicable only if PE emissions are to be calculated on a time-of-
day basis when also incorporating charging systems’ associated
infrastructure sources on a net metered basis.
Data / Parameter LECTj,,j,t, y
Data unit kwh/time period t
Description Electricity provided to the grid and/or building from on-site storage
battery during time-of-day period t within region j serving
applicable fleet i in project year y (kwh/year)
Equations 9
Source of data From on-site battery/charging system’s adequate measurement
systems
Description of
measurement methods
and procedures to be
applied
Project metering systems’ calibration must be conducted
according to the equipment manufacturer’s specifications.
Projects must incorporate adequate metering systems when
applying Eq 9. Guidance for the design/application of such
metering systems, considered as applied to each time period t, is
provided in Appendix 2.
Frequency of
monitoring/recording
Measured actual data must be monitored and recorded on at least
an annual basis.
QA/QC procedures to be
applied
The consistency of such kwh should be cross-checked with other
information sources where applicable
Purpose of data Calculation of project emissions
Calculation method:
Comments: Applicable only if PE emissions are to be calculated on a net
metered basis integrating multiple associated infrastructure
sources, s.

VM0038, Version 1.0 Sectoral Scopes 1 & 7
47
Data / Parameter EFkwTODonsitebatti,j,s,t,y
Data unit tCO2e/kwh
Description Emission factor for the electricity from the on-site battery during
time-of-day period t (both on-site infrastructure and EV on-board
batteries) associated infrastructure source s within region j
consumed by project chargers serving applicable fleet i in year y
Equations 9
Source of data See data sources for Equation 8 variables above
Description of
measurement methods
and procedures to be
applied
The emission factors for one associated infrastructure source --
for the on-site battery -- are calculated using the net weighted
average of the grid and on-site renewable emission factors given
using equation 8, but this time applied for each time-of-day period
t
On-site storage battery must assume the weighted average
emission factor based upon the proportionate net consumption of
grid and dedicated renewable energy at the charging system
(using equation 9 applied during each time of day period basis)
Projects must incorporate adequate metering systems when
applying Eq 9. Guidance for the design/application of such
metering systems, considered as applied to each time period t, is
provided in Appendix 2.
Frequency of
monitoring/recording
Consistent with the practices applied for monitoring the
EFkwTOD-AIi,j,s,t,y in equation 9
QA/QC procedures to be
applied
As for equation 8 variables
Purpose of data Calculation of project emissions
Calculation method:
Comments: Applicable only if PE emissions are to be calculated on a metered
basis integrating multiple associated infrastructure sources, s, on
a time-of-day basis.
Data / Parameter Dy
Data unit %
Description Discount factor to be applied in year y
Equations 10 and 11
Source of data See data sources for data parameters in equation 13

VM0038, Version 1.0 Sectoral Scopes 1 & 7
48
Description of
measurement methods
and procedures to be
applied
Discount factor applied if GHG credits have been issued in the
project region for GHG credits issued for projects that introduce
EV fleets (e.g. using the CDM AMS-III.C EV fleet methodology)
Frequency of
monitoring/recording
Annual
QA/QC procedures to be
applied
Purpose of data Calculation of emission reductions
Calculation method: Look up value
Comments: If there are no GHG credits issued for projects that introduce EV
fleets in the project region, Dy must be 1 (ie there is no discount
applied). Private networks can also demonstrate that D = 1 if
there is no access to chargers beyond a defined set of EV’s for
which it can be demonstrated that no GHG credits from projects
that introduce EV fleets have been issued. See guidance in
section 8.4 regarding open and closed networks.
If GHG credits have been issued for projects that introduce EV
fleets for a region larger than the proposed EV charging project
(e.g. the project introducing EVs is US-wide while the EV charging
system project is confined to one state), then a sensible pro-rata
share of the GHG credits issued to projects that introduce EV
fleets can be made (e.g. using the pro-rata number of EV’s on the
road in the EV charging system project state compared to the total
in the US, using sources such as ZEVFacts.com).
Data / Parameter ERCy
Data unit tCO2e
Description Sum of GHG credits issued by all projects under this
methodology (or others which support the introduction of EV
charging systems) across this project’s applicable fleet i
categories within this total project region in project year y-1
Equations 11
Source of data VCS (and other voluntary and regulated credit registries if they
develop similar EV charging system methodologies), with GHG
credits issued from EV charging system projects within this same
project’s region (e.g. for complementary charging networks)

VM0038, Version 1.0 Sectoral Scopes 1 & 7
49
Description of
measurement methods
and procedures to be
applied
Simple tallies of the total GHG credits issued from EV charging
system project year 1 through year y-1 within this project’s region
These GHG credits include those issued under this VCS charging
system methodology (or similar ones developed by other
certification groups) whose credits arise within the same region as
this project but cover credits issued from complementary charging
network systems (e.g. workplace chargers from a complementary
project located in the same region as this project’s residential
chargers).
Frequency of
monitoring/recording
Annual
QA/QC procedures to be
applied
Purpose of data Calculation of emission reductions
Calculation method: Look up values
Comments: N/A
Data / Parameter ERFy
Data unit tCO2e
Description Sum of GHG credits issued by all projects under methodologies
which support the introduction of EV fleets (e.g., CDM AMS.III.C)
within this project’s same total region where the applicable fleet i
categories are the same for both this EV charging system project
and projects introducing EV fleets, in project year y-1
Equations 11
Source of data VCS and other voluntary and regulated credit registries, with GHG
credits issued from projects that introduce EV fleets within the
project region
Description of
measurement methods
and procedures to be
applied
Simple tallies of the total GHG credits issued for projects that
introduce EV fleets within this project’s region from project year 1
through year y-1
These GHG credits are those issued under EV fleet
methodologies such as CDM AMS-III.C whose credit potentially
double count with those issued through EV charging system
projects where the applicable fleet of the EV charging system
project include those that were introduced in the EV fleet project
Frequency of
monitoring/recording
Annual

VM0038, Version 1.0 Sectoral Scopes 1 & 7
50
QA/QC procedures to be
applied
Purpose of data Calculation of emission reductions
Calculation method:
Comments: If GHG credits have been issued projects introducing EV fleets for
a region larger than the proposed EV charging system project
(e.g. the project introducing EVs s US-wide while the EV charging
system project is confined to one state), then a sensible pro-rata
share of the GHG credits issued to the project that introduced EV
fleets can be made (e.g. using the pro-rata number of EV’s on the
road in the EV charging system project state compared to the total
in the US, using sources such as ZEVFacts.com).
9.3 Description of the Monitoring Plan
The project proponent must establish, maintain and apply a monitoring plan and GHG information
system that includes criteria and procedures for obtaining, recording, compiling and analyzing
data, parameters and other information important for quantifying and reporting GHG emissions.
All data collected as part of monitoring should be archived electronically and be kept at least for
two years after the end of the last project crediting period. All data must be monitored unless
indicated otherwise in the tables above.
Project reporting must include the following information for EV charging systems included in a
project:
For activities monitored once up-front during project validation or as new project activity instances
are admitted to a grouped project during verification:
1) Inventory and geographic location for each EV charging system included in the project.
2) Where EV charging systems’ AI is utilized to provide electricity to EVs, in order to store
and dispatch electricity to and from multiple sources, both on site and regionally, the
monitoring plan must include plans for how data will be processed from the AI’s metering
systems (e.g., meters/sub-meters and/or associated measurement systems). Guidance
for such metering is provided in Appendix 2.
3) Review of any previously issued VCUs for EV charging projects to verify that there is no
overlap of ownership with chargers included in the project description, for example, using
the unique EV charging identifiers supplied in the project description’s EV charging
system inventory. For grouped projects, such verification must apply to any new project
activity instances and for new chargers subsequently added to the grouped project (e.g.,

VM0038, Version 1.0 Sectoral Scopes 1 & 7
51
by referencing the unique EV charging identifiers for these new project activity instances
in project monitoring reports).
4) Review of any previously issued EV fleet credits to confirm the value established for the
discount factor, Dy.
For activities monitored each year during verification for credit issuance:
1) Data on electricity consumption consistent with guidance provided in the parameter
boxes above for each EV charger, which must be reported in a consistent manner with
supporting data, such as invoices or utility or on site meter records. Where projects
include LDV and HDV applicable fleets, electricity consumption must be monitored
separately.
2) Supporting documentation used to determine parameters for use in quantification of
annual baseline emissions if default factors (per Appendix 1) are not used.
The project proponent must establish and apply quality management procedures to manage data
and information. Written procedures must be established for each measurement task outlining
responsibility, timing and record location requirements. Record keeping practices must include:
Electronic recording of values of logged parameters for each monitoring period
Offsite electronic back-up of all logged data
Maintenance of all documents and records in a secure and retrievable manner for at least
two years after the end of the project crediting period.
Quality assurance/quality control procedures must also be applied to add confidence that all
measurements and calculations have been made correctly. These may include, but are not
limited to:
Protecting monitoring equipment (sealed meters and data loggers)
Protecting records of monitored data (hard copy and electronic storage)
Checking data integrity on a regular and periodic basis (manual assessment, comparing
redundant metered data, and detection of outstanding data/records)
Comparing current estimates with previous estimates to identify any abnormal readings
Providing sufficient training to project participants to install and maintain project devices
Establishing minimum experience and requirements for operators in charge of project
and monitoring
Performing recalculations to make sure no mathematical errors have been made

VM0038, Version 1.0 Sectoral Scopes 1 & 7
52
10 REFERENCES
US Environmental Protection Agency (2017). eGRID2014v2 Summary Table.
US Department of Energy (2018). Model Year 2016 Fuel Economy Guide.
Idaho National Laboratory. The EV Project. Retrieved from https://avt.inl.gov/project-type/ev-
project
Zhou, Y. Light Duty Electric Drive Vehicles Monthly Sales Updates. Retrieved from Argonne
National Laboratory: https://www.anl.gov/energy-systems/project/light-duty-electric-drive-vehicles-
monthly-sales-updates

VM0038, Version 1.0 Sectoral Scopes 1 & 7
53
APPENDIX 1: CALCULATION OF BASELINE DEFAULT VALUES FOR THE US AND
CANADA
This appendix outlines the basis for the calculation of the optional default values used in the baseline
emission calculations for U.S. LDV and HDV projects, and Canadian HDV projects. Values used to
calculate the default value results were presented to the VVB via a separate Excel workbook during the
approval process of the methodology.
Projects must apply the default value using units for EF (CO2 or CO2e) consistent with their project
boundary choices, consistent across all project activity sources.
LDV Weighted Averages in the United States
Weighted averages for LDVs are based upon:
The total number of each BEV and PHEV model on the road by end of 2015, based upon
cumulative US sales data for 2010-2015 sourced from Argonne National Laboratories’ monthly
emails and web site42
Kwh/100 mile and MPG ratings sourced from www.fueleconomy.gov or the 2016 Fuel Economy
Guide, https://www.fueleconomy.gov/feg/pdfs/guides/FEG2016.pdf
Gasoline was the fuel which the comparable fossil fuel cars consumed
The simple weighted average has been calculated for each applicable fleet (BEV+PHEV and BEV) based
upon the number of EV models of each type on the road by end of 2015 multiplied by its corresponding
kwh/100 mile value (AFEC) and equivalent fossil fuel vehicle’s MPG value (MPG), which are listed in the
table below.
Table A1: LDV Project Default Value Table
Applicable fleet AFECiy MPGjy EFjy
L1/L2 (BEV and PHEV average) 33.32 29.18 19.56 lbs CO2/gal = 0.0088 tCO2/gal
or 0.0088 tCO2e/gal
DCFC (BEV average) 31.88 29.10 19.56 lbs CO2/gal = 0.0088 tCO2e/gal
or 0.0088 tCO2e/gal
HDV Weighted Averages in the United States
Each of these e-bus and e-truck weighted averages are based upon:
The total number of each e-bus and e-truck models on the road in the US by beginning of 2017,
based upon on data sourced from IHS Markit
42 Argonne National Lab’s (ANL) monthly emails uses data sourced from the hybridcars.com web site: http://www.hybridcars.com/december-2016-dashboard/ The main ANL web link is found here including the email address for the database manager: https://www.anl.gov/energy-systems/project/light-duty-electric-drive-vehicles-monthly-sales-updates

VM0038, Version 1.0 Sectoral Scopes 1 & 7
54
The corresponding GWV classification for each model of e-bus and e-truck on the road, based
upon data sourced from IHS Markit
Kwh/mile data sourced for e-buses from commercial sources (confidential) and for e-trucks from
Smith Electric and NREL reports for e-delivery truck vehicles as follows:
o http://insideevs.com/smith-electric-vehicles-distance-energy-consumption/
o http://www.nrel.gov/docs/fy17osti/66382.pdf
Average MPG ratings for the corresponding class of MDV/HDV, as sourced from independent
academic sources, specifically: https://www.nap.edu/read/12845/chapter/4#18
Diesel fuel was the dominant baseline bus and truck fuel
The simple weighted average is calculated for each applicable fleet (e-bus and e-truck) based upon the
number of EV models of each type on the road by beginning of 2017 multiplied by its corresponding
kwh/100 mile value (AFEC) and equivalent GWV class of fossil fuel vehicle’s average MPG value (MPG),
which are listed in the table below.
Table A2: HDV Project Default Value Table
Applicable fleet AFECiy MPGjy EFjy
e-buses 300 4.34 22.4 lbs CO2/gal = 0.0102 tCO2/gal
or 0.0102 tCO2e/gal
e-trucks 140 8.60 22.4 lbs CO2/gal = 0.0102 tCO2e/gal
or 0.0102 tCO2e/gal
LDV Weighted Averages in Canada
These weighted averages are based upon:
The total number of each BEV and PHEV model on the road by end of 2016, based upon
cumulative Canada data; kwh/100 mile and MPG ratings, all sourced from Natural Resources
Canada
Gasoline was the fuel which the comparable fossil fuel cars consumed
The simple weighted average has been calculated for each applicable fleet (BEV+PHEV and BEV) based
upon the number of EV models of each type on the road by beginning of 2017 multiplied by its
corresponding kwh/100 mile value (AFEC) and equivalent fossil fuel vehicle’s MPG value (MPG), which
are listed in the table below.
Table A3: LDV Project Default Value Table for Canada
Applicable fleet AFECiy MPGjy EFjy
L1/L2 (BEV and PHEV average) 35.44 29.65 19.56 lbs CO2/gal = 0.0088 tCO2/gal
or 0.0088 tCO2e/gal

VM0038, Version 1.0 Sectoral Scopes 1 & 7
55
DCFC (BEV average) 33.00 27.71 19.56 lbs CO2/ga = 0.0088 tCO2/gall
or 0.0088 tCO2e/gal

VM0038, Version 1.0 Sectoral Scopes 1 & 7
56
APPENDIX 2: GUIDANCE FOR DESIGN OF ADEQUATE METERING SYSTEMS FOR AI PROJECTS
This appendix outlines guidance for the design and application of metering systems of charging systems
to adequately measure electricity exchanges when associated infrastructure (AI) is incorporated into
projects when they apply to the determination of project emissions, as shown in Figure A1. If associated
infrastructure is incorporated into the project boundary, PE equations 7, 8, or 9 are applicable.
Figure A1: Examples of Associated Infrastructure and Electricity Flows
When incorporating associated infrastructure, the charging system’s metering system must adequately
and accurately measure and trace the net electricity kwh provided to the charging system (i.e., deliveries
minus receipts) from all electricity sourced from and returned to the grid, and the dedicated renewables.
This may include dedicated renewable energy (e.g., on site) delivered to the EV directly and/or via on-site
batteries, and net of kwh returned back to such sources from the EV batteries.
Note that metering systems for associated infrastructure can include “downstream” meters close to the
EV, such as those provided by DCFC onboard meters (and referenced specifically in the ED parameter
for kwh delivered by a charger to the EV which applies to the BE calculations), and “upstream” meters,
located grid-side such as meters monitoring electricity (in kwh) delivered to the on-site batteries (which
could be designed/applied to measure the kwh which a charger consumes in the EC parameter
measurements which applies to the PE calculations).
Where the system’s meters are located further “upstream”, in order to not include any electricity lost to the
EV charging system, any electricity sourced from associated infrastructure sources (notably from solar
and the on-site battery) but delivered outside the EV charging system (e.g. delivered to the grid or the

VM0038, Version 1.0 Sectoral Scopes 1 & 7
57
local building when the on-site battery is used as a back up generator source), must be sensibly taken
into account for quantification. This includes the following examples:
1) Where the metered kwh to the on-site battery is located “upstream” on the grid side (rather than
downstream of the on-site battery in the charger where electricity delivered to the EV is
measured), any electricity that the on-site battery provides back to the grid, or its building in a
given year must be measured and subtracted -- as LECijy -- since these kwh represent losses to
the overall charging system and do not result in EV miles driven.
2) Where the on-site battery is not connected to the grid or building (i.e., it does not serve as a
power back up system), then the on-site battery does not need to be accounted for as a separate
source, since it merely acts as a flow through for the grid and renewables sources. Any electricity
received from the EV would also be returned to the EV. Therefore, the on-site battery would
supply electricity consistent with the change in stored power between the year’s starting and end
points which, compared to the kwh supplied by the grid and/or dedicated renewables, would be
de minimis.
3) Any transfer of electricity from the EV to the onsite battery represent internal flows within the
system and can be set aside since the electricity must either be returned downstream to the EV
at a later date or tracked via LEC if subsequently delivered back to the grid via the on-site battery.
Therefore, transfers of electricity from the EV to the onsite battery can be set aside.
4) Projects must be able to measure or sensibly estimate the electricity supplied from the grid and/or
from dedicated renewable sources to the charger system and this may be a subset of the total
electricity from this source. For example, the electricity delivered to the charging system may be
less than the total electricity generated by the onsite renewables if these renewables also provide
power back to the grid within a particular associated infrastructure system43. Similarly, the total
grid electricity delivered to the system may be shared across both the EV charger if delivered
directly while also supplying in parallel electricity to the on-site battery – the former contributing to
NEC from the grid source and latter to NEC for the on-site battery.
Where the systems meters are located “downstream”, in order to not include any electricity lost to the EV
charging system, any electricity sourced from associated infrastructure sources must be sensibly taken
into account for quantification. This includes the following examples:
1) Although upstream-metering, (the measurement of kwh consumed by the chargers for parameter
EC), typically applies for the PE calculations, the calculation of PE values can be made using
downstream meters located in the chargers’ internal systems provided appropriate efficiency
factors are applied to take account of chargers’ own electricity consumption. Where downstream
measurement of PE is applied:
For PE calculations using downstream metering, consistent with the guidance in the
parameter boxes for EC, ECTOD, NEC and NECT, efficiency factors must be applied to
43 At a future date, projects may wish to consider issuing GHG credits for the subset of kwh delivered from the dedicated renewables to the grid (but not to the EV charger) using methodologies such as AMS-I.F https://cdm.unfccc.int/methodologies/DB/9KJWQ1G0WEG6LKHX21MLPS8BQR7242

VM0038, Version 1.0 Sectoral Scopes 1 & 7
58
account for potential efficiency losses due to the chargers’ own kwh consumption. For L2s,
such efficiency losses are de minimis44 and so no efficiency factor is applied in the L2 EC,
ECTOD, NEC and NECT parameter applications (since “downstream” meters would have de
minimis variances with upstream meters). For DCFCs, if kwh data is sourced from
“downstream” meters located within their own DCFCs internal smart meter systems
(assuming as needed across these parameters that these smart meters are capable of
differentiating inter alia the net kwh delivered to the EV’s from each source s during time
period t), then to establish the PE equation electricity consumed by the DCFC charger a
DCFC default efficiency factor of 92.3% is applied to these internal smart DCFC metered kwh
readings (i.e., using approach A in the parameter boxes)).
Alternatively, DCFCs can use approach B applying “upstream” meter kwh measurements
which are on the grid-side of the DCFC units/AI (e.g., for each source s and time period t).
However, often relative to time-of-day periods t for NECT and ECTOD measurements, it is a
DCFC’s own “downstream” internal “smart” meters which have the most sophisticated
metering capabilities for such time-of-day applications (whereupon approach A would be
followed and the DCFC default efficiency factor applied).
For DCFC using approach A, the default efficiency value applied would be the “downstream”
smart meter’s reading divided by the efficiency factor of 0.923 in order to estimate the kwh
consumed by the DCFC fast charger on an “upstream kwh consumed” basis (as needed for
the PE equations).
If a project can demonstrate a more accurate efficiency factor for their particular DCFC
systems (for example due to improvements in DCFC technology efficiencies over time), this
updated accurate efficiency factor may be substituted for the 92.3% default efficiency value.
2) Where meters are located downstream for the measurement of NEC pertaining to the on-site
battery, then the electricity measured must already be net of any LEC losses from the on-site
battery to the grid – and thus LEC must be set at zero. This basis for such on-site battery net
electricity measurements would be consistent with DCFC’s measurement systems which track
the electricity exchanges close the point of delivery to the EV. Additionally, for downstream
metering, the electricity provided by the EV to the onsite battery must be measured for the
calculation of NEC for the on-site battery (that is, it cannot be set aside for downstream metering).
3) Where the EV is delivering vehicle-to-grid (V2G) services where electricity from the car’s on-
board battery is returned directly to the grid, these EV-sourced electricity are netted out in the
grid-sourced net-kwh (that is, in the calculation of NEC for the grid source s).
4) Where charging systems include simple associated infrastructure settings, such as residences
using L1/L2 systems where “upstream” metering systems apply and where the associated
infrastructure system elements can be limited (e.g. no on-site battery).
Note that the quantification of emissions from project associated infrastructure systems can be
simplified using sensible estimates. For example, where a household residence has a solar panel
44 Per INL: https://avt.inl.gov/evse-type/ac-level-2

VM0038, Version 1.0 Sectoral Scopes 1 & 7
59
that is grid-connected – which, while its total solar kwh production and grid-sales are metered,
does not have a separate sub-meter to establish the solar kwh supplied to the EV charging
system specifically -- it is acceptable to assume that the kwh delivered to the EV charger is the
same weighted average as the solar/grid kwh mix the household itself consumed (i.e., sources
whose electricity would have been separately metered). Utility-style modeling is also acceptable
for settings where only the net electricity consumption/generation is measured for a household in
order to establish the electricity delivered by both the grid and the on-site renewables and thus
the required weighted average.