
VLFV 7KLVMRXUQDOLV WKH2ZQHU6RFLHWLHV … s3.The initial chemical species of our thermal simulations...
11
Cluster Evolution during the Early Stages of Heating Explosives and its Relationship to Sensitivity: A Comparative Study of TATB, -HMX and PETN by Molecular Reactive Force Field Simulations Yushi Wen, Chaoyang Zhang,*Xianggui Xue, and Xinping Long Institute of Chemical Materials, China Academy of Engineering Physics (CAEP), P. O. Box 919-327, Mianyang, Sichuan 621900, China. Electronic Supplementary Information Table of Contents S1. The detailed information of the supercells. S2. Validation of ReaxFF_lg to this work. S3. List of bond order minimum values used to determine molecules. S4. The products in different temperatures of TATB, HMX and PETN. S5. The evolutions of atom-atom pair correlation functions of TATB, HMX, and PETN heated at 2500 K. S6. References s1 Electronic Supplementary Material (ESI) for Physical Chemistry Chemical Physics. This journal is © the Owner Societies 2015
Transcript of VLFV 7KLVMRXUQDOLV WKH2ZQHU6RFLHWLHV … s3.The initial chemical species of our thermal simulations...

Cluster Evolution during the Early Stages of Heating Explosives and its Relationship to Sensitivity: A Comparative Study of TATB, -HMX and PETN by Molecular Reactive Force Field Simulations
Yushi Wen, Chaoyang Zhang,*Xianggui Xue, and Xinping Long
Institute of Chemical Materials, China Academy of Engineering Physics (CAEP), P. O. Box
919-327, Mianyang, Sichuan 621900, China.
Electronic Supplementary Information
Table of Contents
S1. The detailed information of the supercells.
S2. Validation of ReaxFF_lg to this work.
S3. List of bond order minimum values used to determine molecules.
S4. The products in different temperatures of TATB, HMX and PETN.
S5. The evolutions of atom-atom pair correlation functions of TATB, HMX, and PETN heated
at 2500 K.
S6. References
s1
Electronic Supplementary Material (ESI) for Physical Chemistry Chemical Physics.This journal is © the Owner Societies 2015

S1. The detailed information of the supercells
Table s1. The detailed information of the supercellssupercells TATB HMX PETN
enlargement times from unit
cells6×6×6 8×5×5 4×3×7
a b c a b c a b c
54.06 Å
54.17 Å
40.87 Å
52.32 Å
55.25 Å
43.50 Å
53.16 Å
40.47 Å
47.81 Å
α β γ α β γ α β γLattice
Parameters
108.58°119.97
°91.82° 90.00° 90.00° 90.00° 90.00° 90.00° 90.00°
Amounts of molecules
432 400 336
Amounts of atoms
10368 11200 9744
Fig. s1. Supercells of TATB, -HMX and PETN. The carbon, hydrogen, oxygen and nitrogen
atoms are indicated in grey, white, red and blue, respectively.
s2
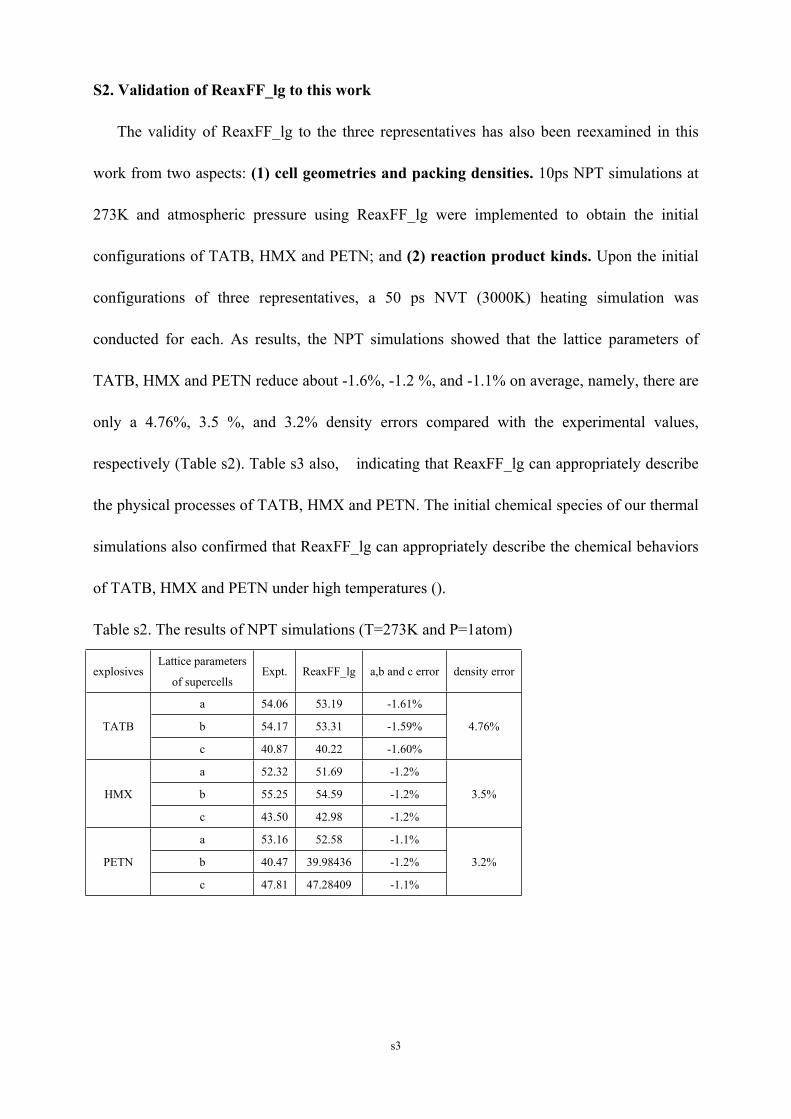
S2. Validation of ReaxFF_lg to this work
The validity of ReaxFF_lg to the three representatives has also been reexamined in this
work from two aspects: (1) cell geometries and packing densities. 10ps NPT simulations at
273K and atmospheric pressure using ReaxFF_lg were implemented to obtain the initial
configurations of TATB, HMX and PETN; and (2) reaction product kinds. Upon the initial
configurations of three representatives, a 50 ps NVT (3000K) heating simulation was
conducted for each. As results, the NPT simulations showed that the lattice parameters of
TATB, HMX and PETN reduce about -1.6%, -1.2 %, and -1.1% on average, namely, there are
only a 4.76%, 3.5 %, and 3.2% density errors compared with the experimental values,
respectively (Table s2). Table s3 also, indicating that ReaxFF_lg can appropriately describe
the physical processes of TATB, HMX and PETN. The initial chemical species of our thermal
simulations also confirmed that ReaxFF_lg can appropriately describe the chemical behaviors
of TATB, HMX and PETN under high temperatures ().
Table s2. The results of NPT simulations (T=273K and P=1atom)
explosivesLattice parameters
of supercellsExpt. ReaxFF_lg a,b and c error density error
a 54.06 53.19 -1.61%
b 54.17 53.31 -1.59%TATB
c 40.87 40.22 -1.60%
4.76%
a 52.32 51.69 -1.2%
b 55.25 54.59 -1.2%HMX
c 43.50 42.98 -1.2%
3.5%
a 53.16 52.58 -1.1%
b 40.47 39.98436 -1.2%PETN
c 47.81 47.28409 -1.1%
3.2%
s3

Table s3.The initial chemical species of our thermal simulations
TATB HMX PETN
chemical species a DFT CalculationReaxFF_lg
Calculationb Expt. ReaxFF_lg c Expt. ReaxFF_lg
CO2 √ √ √ √ √ √
CO exists √ √ √ √
C(s) exists exists √ exists
H2O √ √ √ √ √ √
N2 √ √ √ √ √ √
H2 exists √ √ √ √ √
CH4 exists √ exists exists exists
HCN exists exists
Other
(very tiny)NCO, NCO2, CN2
NO,NO2,HONO,
HON,NH3,OH,HNot detected
NO,NO2,HONO,
HON,NH3,OH,H,
CON,CH2O
NH3
NO,NO2,HONO,
HON,NH3,OH,
C2O3,CH2O
√-main products
a Calculated by Manaa et al.1
b Observed by Donald L. Ornellas.2
c Observed by Donald L. Ornellas.3
s4

S3. List of bond order minimum values used to determine molecules
Table s4. List of bond order minimum values used to determine molecules.
Atom type Atom type Bond orderC N 0.3C C 0.55C O 0.65C H 0.4O O 0.65N O 0.4O H 0.4H H 0.55H N 0.55N N 0.55
s5

S4. The products in different temperatures of TATB, HMX and PETN
0
50
100
150
200300400500
0
50
100
150
200400600800
1000
0 10 20 30 40 500
50
100
150
200400600800
1000
N fragm
ents
TATB NO2 NO HONO H2O N2 CO2 HON H2 OH NH3 H
(a) 2000 K
(b) 2500 K
N fragm
ents
(c) 3000 K
N fragm
ents
time, ps
Fig. s2. The products in different temperatures of TATB
s6

50
100
150
200300400500600700
50
100
150
250500750
1000
0 10 20 30 40 500
50
100
150
250500750
10001250
HMX NO2 NO HONO H2O CH2O N2 CO2 HON H2 OH NH3 CON H CHON
N fragm
ents
(a) 2000 K
(b) 2500 K
N fragm
ents
(c) 3000 K
N fragm
ents
time, psFig. s3. The products in different temperatures of HMX.
s7

0
50
100
150
200300400500
50
100
150
250500750
1000
0 10 20 30 40 500
50
100
150
250500750
1000
N fragm
ents
PETN NO2 NO HONO H2O CH2O N2 CO2 HON H2 HO NH3 C2O3 O2
(a) 2000 K
(b) 2500 K
N fragm
ents
(c) 3000 K
N fragm
ents
time, ps
Fig. s4. The products in different temperatures of PETN
s8

S5. The evolutions of atom-atom pair correlation functions of TATB, HMX, and PETN heated at 2500 K
5
10
15
20
25
0
1
2
3
4
5
0 2 4 6 8 100
2
4
6
8
10
2 4 6 8 10 2 4 6 8 10
1.45Å C-C 0 ps
1.45Å
C-C 25 ps
1.45Å
C-C 50 ps
2.35Å C-O 0 ps
1.25Å
C-O 25 ps C-O 50 ps
1.25Å
g(r)
g(r)
3.05Å
g(r)
A
N-N 0ps 1.15Å
r
N-N 25 ps 1.15Å
r
N-N 50 ps
Fig. s5.Evolution of atom-atom pair correlation functions of TATB heated at 2500 K.
2468
1012141618
0
1
2
3
4
5
6
7
0 2 4 6 8 100
24
6
8
1012
14
16
2 4 6 8 10 2 4 6 8 10
1.45Å
r r
1.15Å1.15Å
1.35Å
1.25Å1.25Å
2.75Å
1.45Å
2.55Å
N-N 50 psN-N 25 psN-N 0 ps
C-O 50 psC-O 25 psC-O 0 ps
C-C 50 psC-C 25 psC-C 0 ps
g(r)
g(r)
g(r)
r
Fig. s6.Evolution of atom-atom pair correlation functions of HMX heated at 2500 K.
s9

5
10
15
20
25
30
35
2
4
6
8
10
12
0 2 4 6 8 100
5
10
15
20
25
2 4 6 8 10 2 4 6 8 10
1.55Å
g(r)
1.55Å
1.55Å
C-C 25 ps C-C 50 ps
1.45Å
1.15Å
1.15Å
3.75Å
1.25Å1.25Å
N-N 50 psN-N 25 psN-N 0 ps
C-O 50 psC-O 25 psC-O 0 ps
g(r)
g(r)
r r
C-C 0 ps
r
Fig. s7.Evolution of atom-atom pair correlation functions of PETN heated at 2500 K.
We used atom-atom pair correlation functions or radius distribution functions (RDFs, g(r))
shown by Figs. s5-s7 to describe the evolution of heated TATB, HMX and PETN at 2500 K.
For TATB (Fig. s5), the largest g(r) of C-C is always located at r=1.45 Å with different
intensity, suggesting the benzene structures retain during the heating. The largest g(r) of C-O
is transferred from 2.35 to 1.25 Å, denoting the CO and CO2 formation. Similarly, g(r) of N-N
of 1.15 Å suggests the formation of N2. Also, g(r) can used to analyze the reactions in heated
HMX and PETN.
S6. References
(1) M. R. Manaa, E. J. Reed, L. E. Fried, and N. Goldman, J. Am. Chem. Soc. 2009, 131, 5483.
(2) Donald L. Ornellas, The Journal of Physical Chemistry 1968, 72, 2390.
(3) Donald L. Ornellas, John H. Carpenter and Stuart R. Gunn, The Review of Scientific Insturments 1966,
37, 907.s10

s11