VIZBI 2013 - UX design tutorial
43
UX design: insight, empathy and evaluation User experience design Insight, empathy and evaluation Francis Rowland User experience designer EMBL European Bioinformatics Institute Vizbi 2013 Tutorial Vizbi 2013 @francisrowland Saturday, 23 March 2013
-
Upload
francis-rowland -
Category
Documents
-
view
115 -
download
1
description
Slides from the UX design tutorial I ran at VIZBI 2013 - a conference on visualising biological data, held at the Broad Institute, Cambridge, MA
Transcript of VIZBI 2013 - UX design tutorial
UX design: insight, empathy and evaluation
User experience designInsight, empathy and evaluation
Francis Rowland
User experience designer
EMBL European Bioinformatics Institute
Vizbi 2013 Tutorial
Vizbi 2013
@francisrowland
Saturday, 23 March 2013

What we’ll do during this tutorial
UX design: insight, empathy and evaluation Vizbi 2013
Introductions (15 mins)
Setting the theme (5)
Activity 1 (20)
research(5)
Activity 2 (10)
Activity 3 (20)
Activity 4 (20)
Activity 5 (15)
Activity 6 (15)
Activity 7 (15)
Q&A (15)
Users -> activities (5)
Evaluation (10)
Hypothesis/Experiment (5)
Round-up (5)
User
breakSaturday, 23 March 2013

So... who is this guy exactly?
UX design: insight, empathy and evaluation
User experience designer at EMBL-EBI
Background in web design
Distant background in environmental science
Organiser for EBI Interfaces and Cambridge
Usability Group
I try to help people identify and describe [design] problems,
connect with users, and deliver useful, usable services
Day-to-day, I do a lot of sketching and prototyping
Vizbi 2013
Francis Rowland
Saturday, 23 March 2013

Ice-breaker
UX design: insight, empathy and evaluation Vizbi 2013
FrancisUX designerexploring problemssketchingplaying the mandolin
Saturday, 23 March 2013

What is user experience (UX) design?
UX design: insight, empathy and evaluation Vizbi 2013
Let’s think about design as an approach to solving problems...
and striving to put things in context
Thank you to Dan Willis (@uxcrank) for permission to use this image
Saturday, 23 March 2013

...and what does it have to do with data visualisation?
UX design: insight, empathy and evaluation Vizbi 2013
Borrowing concepts and approaches from UX design will help you
close the gap between your data visualisations and your “users”...
your audience.
Your audience are your users
To paraphrase Nathan Yau:
“Approach your [audience] with a simple curiosity
... and go from there.”
Whether your visualisations are there to allow exploration, education
or persuasion, you need to know how to frame them in a way that is
meaningful and actionable for your audience
Saturday, 23 March 2013

The theme for today...
WEATHER DATA
UX design: insight, empathy and evaluation Vizbi 2013
Snow in Cambridge MA / evanzxcv (Flickr)
Saturday, 23 March 2013

The theme for today...
WEATHER DATA
UX design: insight, empathy and evaluation Vizbi 2013
Weather data on http://www.boston.com/weather/
precipitation
windspeed
wind direction
humidity
UV strength
pollen count
warnings & alerts
simple -> complex
Saturday, 23 March 2013

Tutorial activities
UX design: insight, empathy and evaluation Vizbi 2013
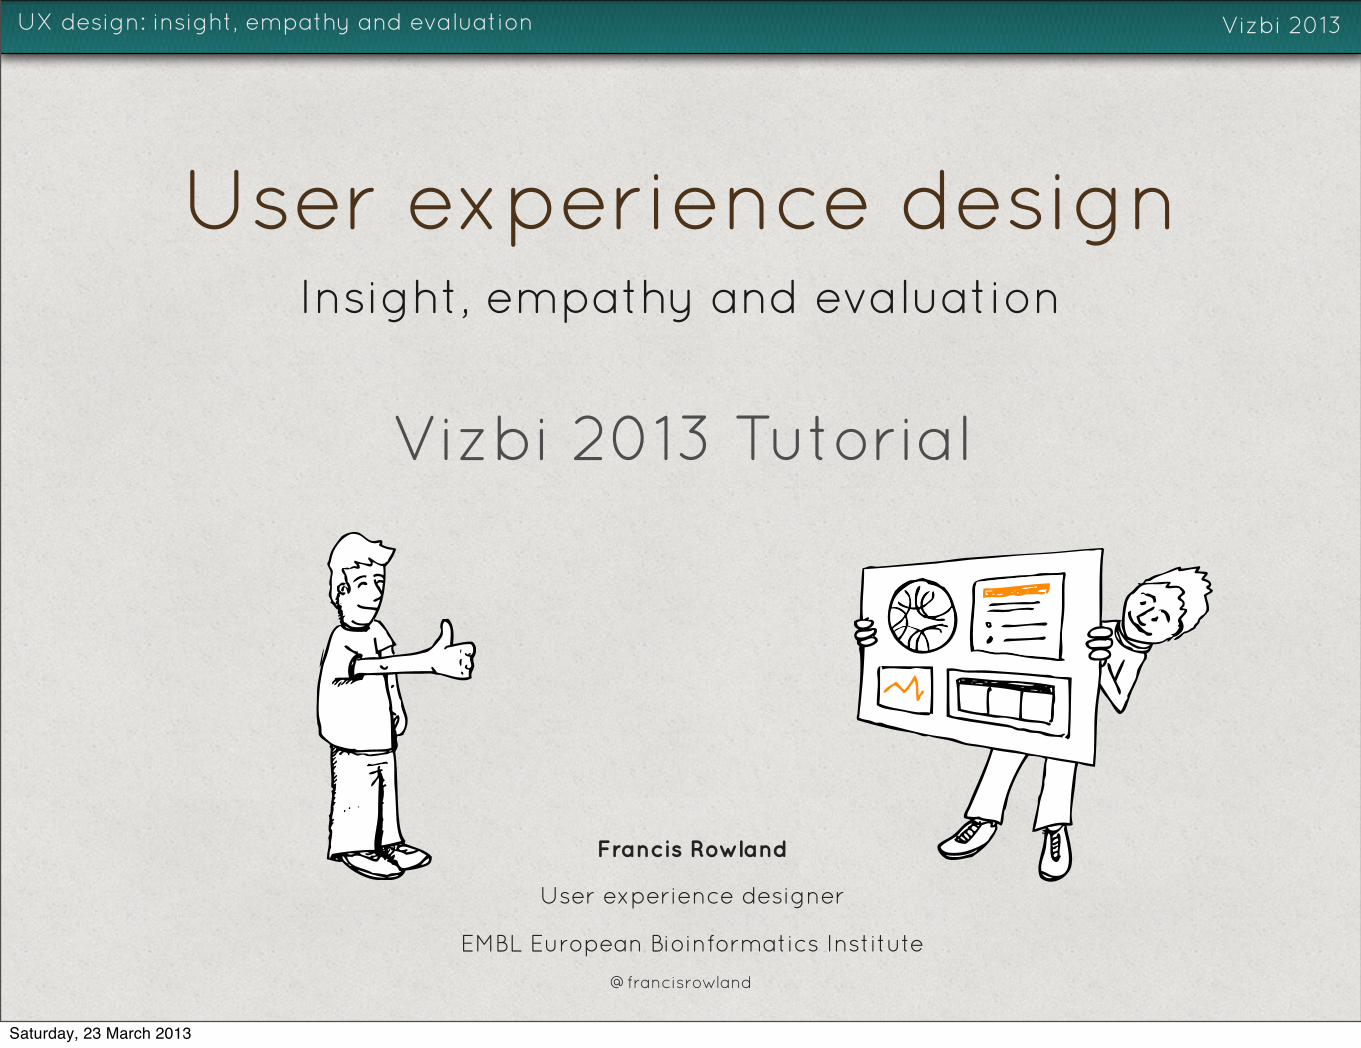
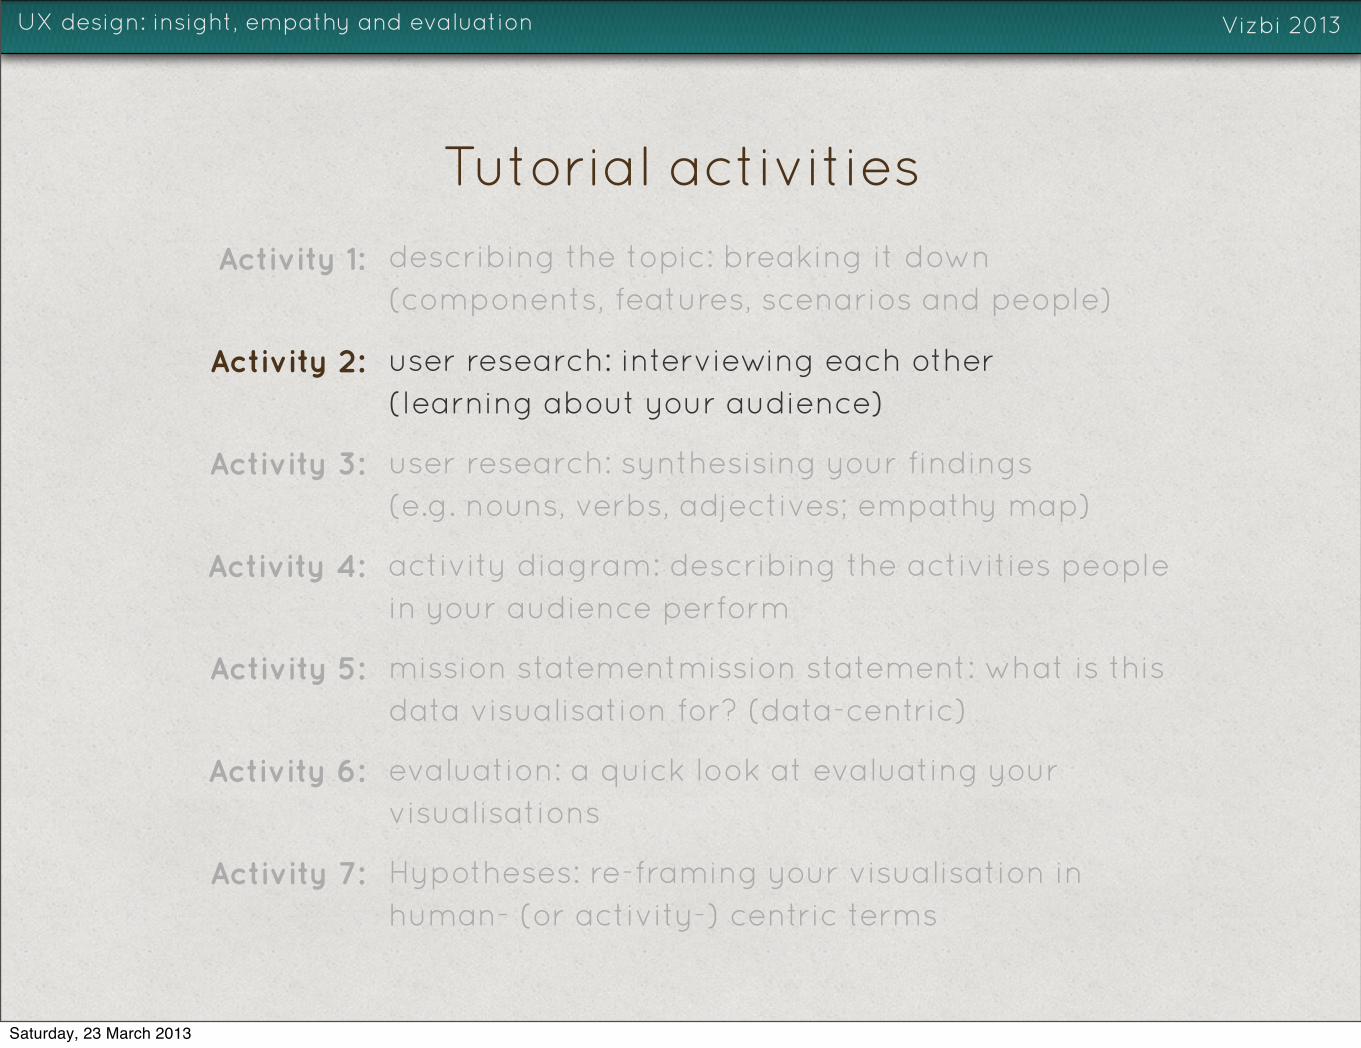
Activity 1: describing the topic: breaking it down
(components, features, scenarios and people)
Activity 2: user research: interviewing each other
(learning about your audience)
Activity 3: user research: synthesising your findings
(e.g. nouns, verbs, adjectives; empathy map)
Activity 4: activity diagram: describing the activities people in your audience
perform
Activity 5: mission statement: what is this data visualisation for? (data-centric)
Activity 6: evaluation: a quick look at evaluating your visualisations
Activity 7: Hypotheses: re-framing your visualisation in human- (or activity-)
centric terms
Visualising a topic
Zooming in: user research
Zooming out: supporting activities
Framing requirements as hypotheses to be tested
Evaluation: do people “get it”?
What is this visualisation for?
Saturday, 23 March 2013
Tutorial activities
UX design: insight, empathy and evaluation Vizbi 2013
Activity 1: describing the topic: breaking it down
(components, features, scenarios and people)
Activity 2: user research: interviewing each other
(learning about your audience)
Activity 3: user research: synthesising your findings
(e.g. nouns, verbs, adjectives; empathy map)
Activity 4: activity diagram: describing the activities people
in your audience perform
Activity 5: mission statement: what is this data visualisation
for? (data-centric)
Activity 6: evaluation: a quick look at evaluating your
visualisations
Activity 7: Hypotheses: re-framing your visualisation in
human- (or activity-) centric terms
Saturday, 23 March 2013

Activity 1: exploring the topic
UX design: insight, empathy and evaluation Vizbi 2013
components people
scenarios features
Making it more manageable
Derived from the 4 Cs game / Gamestorming - http://www.gogamestorm.com/?p=503
(20 mins)
Saturday, 23 March 2013

Activity 1: exploring the topic
UX design: insight, empathy and evaluation Vizbi 2013
components people
scenarios features
Examples...
Derived from the 4 Cs game / Gamestorming - http://www.gogamestorm.com/?p=503
radar mapsymbols
temperature
sailormeteorologist
planning a holidayinteractive
daily
Saturday, 23 March 2013

Zooming in: user research
curiosity -> insights -> empathy -> context
UX design: insight, empathy and evaluation
activities
goals
pain points
opportunities
“Validate that the problem you are solving actually
exists ... [and remember] the user is giving you data, not an expert opinion” - Elaine Wherry
Talking to users will help you learn more about
Vizbi 2013
Saturday, 23 March 2013
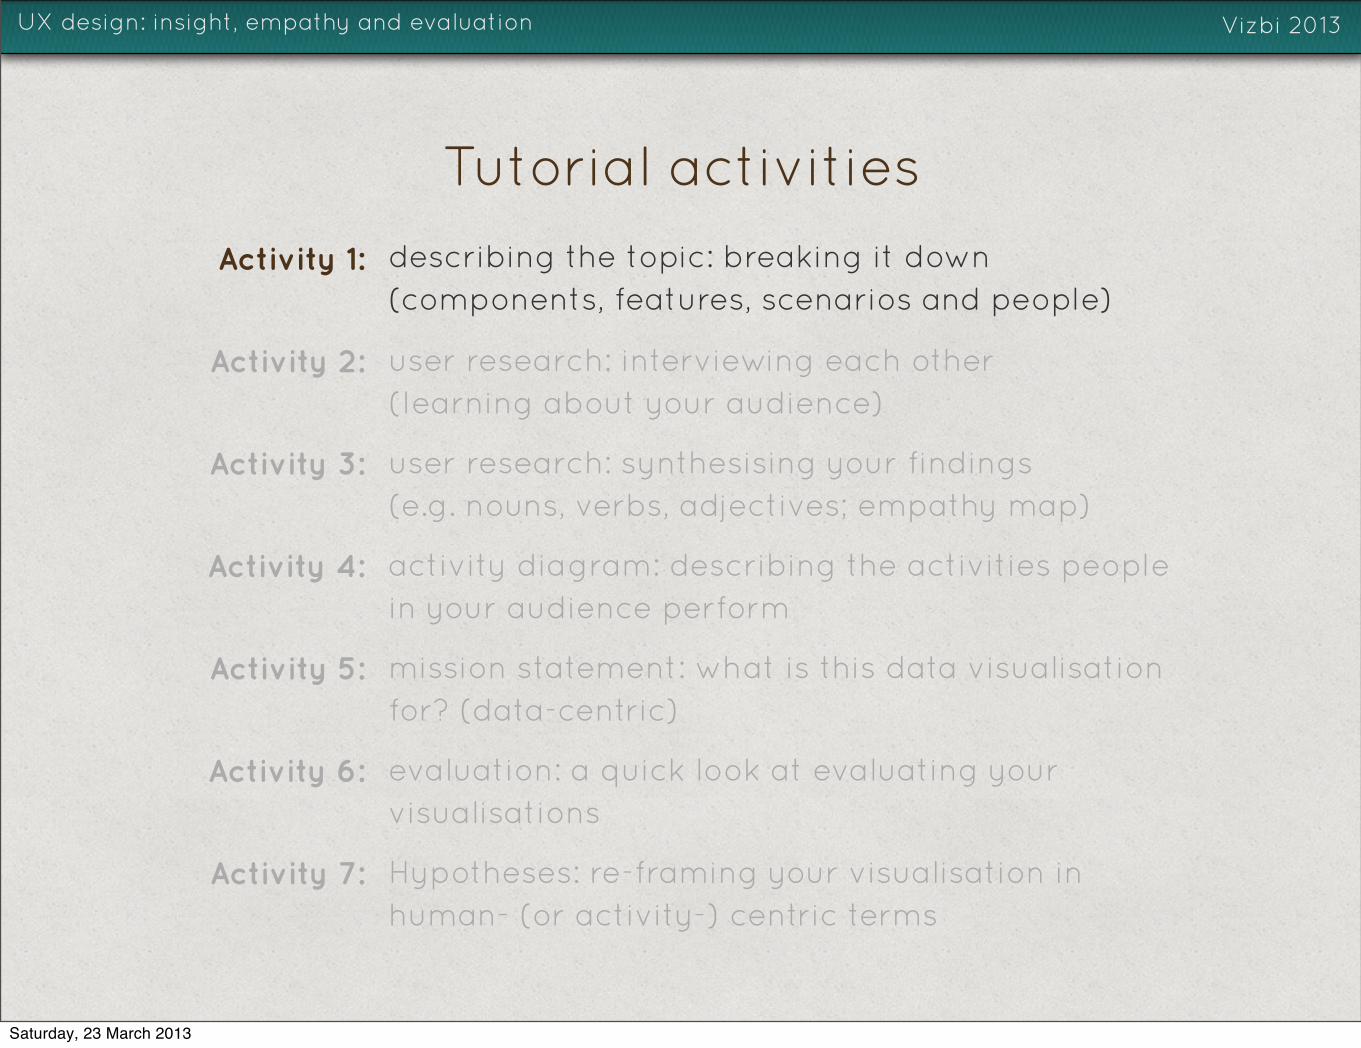
Be prepared to dig...
UX design: insight, empathy and evaluation
“WHY?”
Vizbi 2013
“Can you tell me more about that?”
“When... ?” “How often... ?”
“Why is that important to you?”
Saturday, 23 March 2013
Tutorial activities
UX design: insight, empathy and evaluation Vizbi 2013
Activity 1: describing the topic: breaking it down
(components, features, scenarios and people)
Activity 2: user research: interviewing each other
(learning about your audience)
Activity 3: user research: synthesising your findings
(e.g. nouns, verbs, adjectives; empathy map)
Activity 4: activity diagram: describing the activities people
in your audience perform
Activity 5: mission statementmission statement: what is this
data visualisation for? (data-centric)
Activity 6: evaluation: a quick look at evaluating your
visualisations
Activity 7: Hypotheses: re-framing your visualisation in
human- (or activity-) centric terms
Saturday, 23 March 2013

Activity 2: interviewing each other
UX design: insight, empathy and evaluation Vizbi 2013
Learning about your audience
Big thanks to Andrew Travers (@atrvrs) for advice & inspiration
• Take the time to listen to people (your audience)
• Use interviews to pursue “lines of enquiry”
• How do people talk about a topic?
• Body language?
• One person ask questions, the other is scribe
✓ What kind of weather data will be valuable?
✓ What do they need to be able to do?
✓ Motivations? Pain points? Plus points?
✓ Expose “latent needs”
In this case, try to explore the following:
(10 mins)
Saturday, 23 March 2013

Tutorial activities
UX design: insight, empathy and evaluation Vizbi 2013
Activity 1: describing the topic: breaking it down
(components, features, scenarios and people)
Activity 2: user research: interviewing each other
(learning about your audience)
Activity 3: user research: synthesising your findings
(e.g. nouns, verbs, adjectives; empathy map)
Activity 4: activity diagram: describing the activities people
in your audience perform
Activity 5: mission statement: what is this data visualisation
for? (data-centric)
Activity 6: evaluation: a quick look at evaluating your
visualisations
Activity 7: Hypotheses: re-framing your visualisation in
human- (or activity-) centric terms
Saturday, 23 March 2013

Activity 3: synthesising your findings
Vizbi 2013
A couple of ways to visualise what you’ve learned
Nouns, verbs, adjectives Empathy map
N V A
UX design: insight, empathy and evaluation Vizbi 2013
Thinking
Saying & Doing
SeeingHearing
Pain Gain
Empathy map / Gamestorming: http://www.gogamestorm.com/?p=42Pick out the nouns, verbs and adjectives from a discussion,to see how people talk about a topic
(20 mins)
Saturday, 23 March 2013
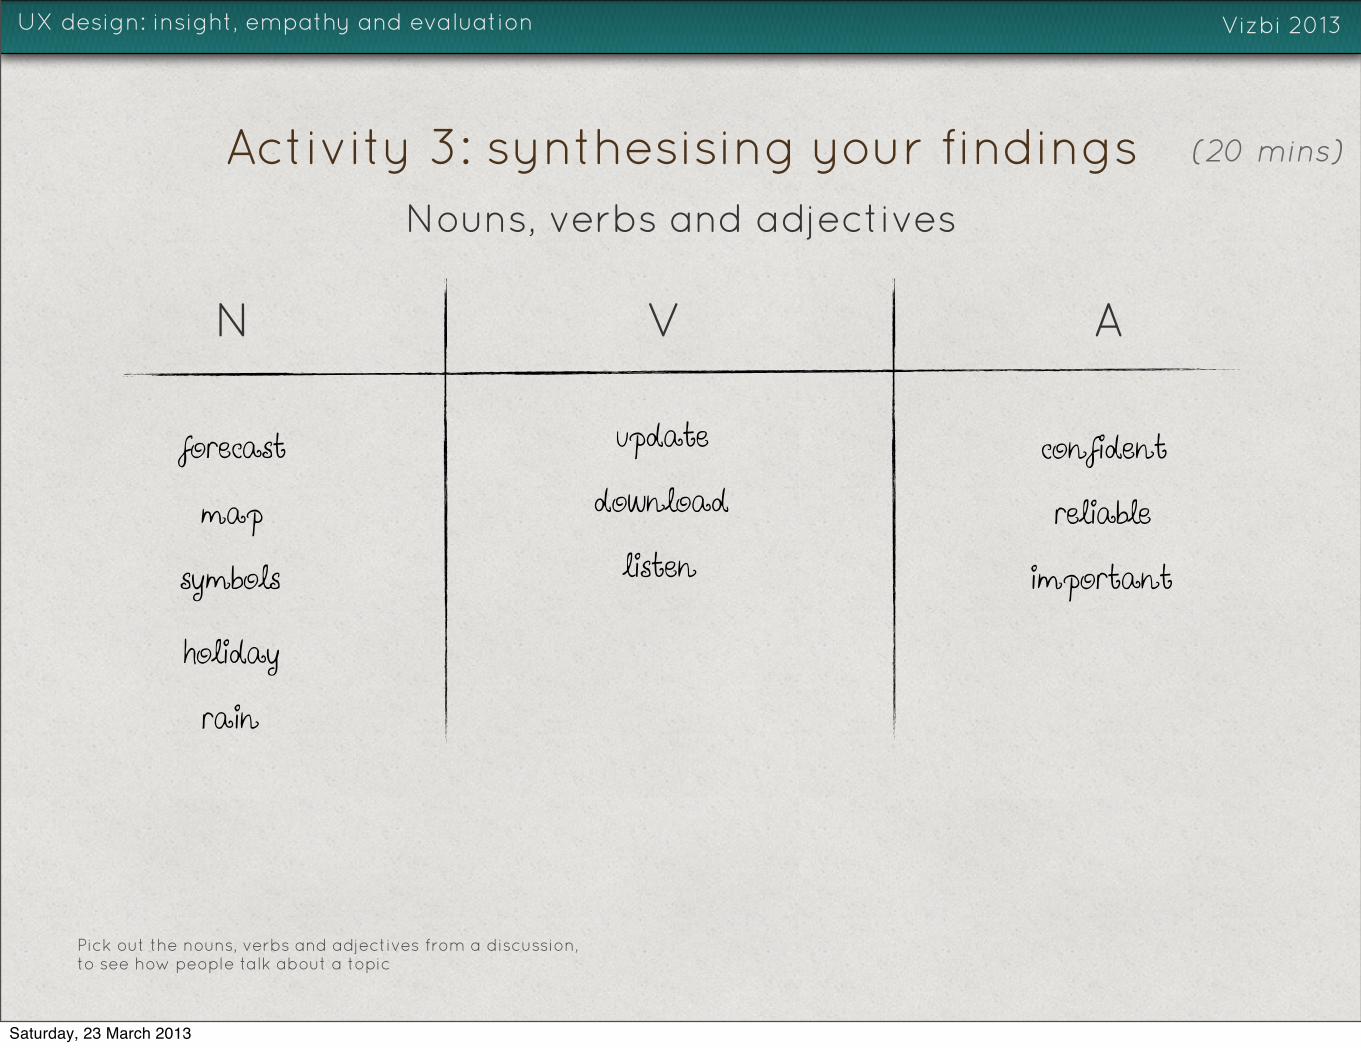
Activity 3: synthesising your findings
Vizbi 2013
Nouns, verbs and adjectives
UX design: insight, empathy and evaluation Vizbi 2013
Pick out the nouns, verbs and adjectives from a discussion,to see how people talk about a topic
(20 mins)
N V A
forecastmap
symbols
confidentreliable
important
updatedownloadlisten
holidayrain
Saturday, 23 March 2013

Activity 3: synthesising your findings
Vizbi 2013
Empathy map: mountaineer
UX design: insight, empathy and evaluation Vizbi 2013
(20 mins)
Thinking
Saying & Doing
SeeingHearing
Pain Gain
Empathy map / Gamestorming: http://www.gogamestorm.com/?p=42
Can I trust this?
animated radar maps
zooming in on map
“these data areupdated hourly”
not enough granularitysnow conditions?
updates from local guides
Saturday, 23 March 2013

Zooming out: supporting activities
UX design: insight, empathy and evaluation Vizbi 2013
Based on user research, can we see any patterns forming?
Let’s begin to look at how visualisation fits in with
activities, and how we can support them
goal
task
task
task
task
task
ACTIVITYYour visualisation may just need
to support this part of the activity
Saturday, 23 March 2013

Tutorial activities
UX design: insight, empathy and evaluation Vizbi 2013
Activity 1: describing the topic: breaking it down
(components, features, scenarios and people)
Activity 2: user research: interviewing each other
(learning about your audience)
Activity 3: user research: synthesising your findings
(e.g. nouns, verbs, adjectives; empathy map)
Activity 4: activity diagram: describing the activities people
in your audience perform
Activity 5: mission statement: what is this data visualisation
for? (data-centric)
Activity 6: evaluation: a quick look at evaluating your
visualisations
Activity 7: Hypotheses: re-framing your visualisation in
human- (or activity-) centric terms
Saturday, 23 March 2013

Activity 4: activity diagram
UX design: insight, empathy and evaluation Vizbi 2013
What are people doing?
Activity
“ ... ”
Participants Goal
RulesDivision of
labour
Heavily adapted from Yrjö Engetröm’s activity diagram
Tools
(20 mins)
Saturday, 23 March 2013

Activity 4: activity diagram
UX design: insight, empathy and evaluation Vizbi 2013
Example: planning a mountaineering trip
Activity
“planning a mountaineering trip”
Heavily adapted from Yrjo Engetröm’s activity diagram
GoalClimbing a peak and
being safe
ParticipantsMountaineers
Guides
Forecasters
ToolsMet. website; mountain guide info;
radio; apps; weather reports
RulesMust be up-to-date and accurate
Localised
Snow conditions
Division of labour
Mountaineers understand the data / info
Guides provide up-to-date data
Meteorologists assess confidence
Saturday, 23 March 2013

Activity 4: activity diagram
UX design: insight, empathy and evaluation Vizbi 2013
Examples of goals you could consider...
Activity
“Planning a trip for
the coming weekend”
Heavily adapted from Yrjo Engetröm’s activity diagram
Goal• Ski-ing
• Going sailing
• Camping with the kids
• Hang-gliding
• ...
Participants...
Tools...
Rules...
Division of labour...
Saturday, 23 March 2013

Tutorial activities
UX design: insight, empathy and evaluation Vizbi 2013
Activity 1: describing the topic: breaking it down
(components, features, scenarios and people)
Activity 2: user research: interviewing each other
(learning about your audience)
Activity 3: user research: synthesising your findings
(e.g. nouns, verbs, adjectives; empathy map)
Activity 4: activity diagram: describing the activities people
in your audience perform
Activity 5: mission statement: what is this data visualisation
for? (data-centric)
Activity 6: evaluation: a quick look at evaluating your
visualisations
Activity 7: Hypotheses: re-framing your visualisation in
human- (or activity-) centric terms
Saturday, 23 March 2013

Activity 5: mission statement
UX design: insight, empathy and evaluation Vizbi 2013
What is this visualisation for?
Noah Iliinsky (IBM) recommends writing a kind of “mission statement”
for your visualisation. In its basic form, this is a data-centric statement
but it can offer a useful global view of what your visualisation is for
Show the relationship between A and B
[and C...] across X [and Y] from m to n
(15 mins)
Saturday, 23 March 2013

Activity 5: mission statement
UX design: insight, empathy and evaluation Vizbi 2013
Example: snow conditions at
Wachusett mountain ski area
“Show the relationship between snow fall and
ski conditions across the Watchusett ski area
from March 19 to March 24”
(15 mins)
Saturday, 23 March 2013

Evaluation: do people “get it”?
UX design: insight, empathy and evaluation Vizbi 2013
Evaluate sketches and prototypes of visualisations early and often
Gather feedback from domain experts and your audience
Critique
Speed dating sessions
Heuristics
Blur test
5/10 second test
Usability testing
Some ways to do this...
Saturday, 23 March 2013

Tutorial activities
UX design: insight, empathy and evaluation Vizbi 2013
Activity 1: describing the topic: breaking it down
(components, features, scenarios and people)
Activity 2: user research: interviewing each other
(learning about your audience)
Activity 3: user research: synthesising your findings
(e.g. nouns, verbs, adjectives; empathy map)
Activity 4: activity diagram: describing the activities people
in your audience perform
Activity 5: mission statement: what is this data visualisation
for? (data-centric)
Activity 6: evaluation: a quick look at evaluating your
visualisations
Activity 7: Hypotheses: re-framing your visualisation in
human- (or activity-) centric terms
Saturday, 23 March 2013

Activity 6: evaluation
UX design: insight, empathy and evaluation Vizbi 2013
A quick look at evaluating visualisations
Critique
Speed dating sessions
Heuristics
Blur test
5/10 second test
Usability testing
(15 mins)
Saturday, 23 March 2013

Activity 6: evaluation
UX design: insight, empathy and evaluation Vizbi 2013
Blurring: what stands out?
(15 mins)
Weather in Boston
Saturday, 23 March 2013

Activity 6: evaluation
UX design: insight, empathy and evaluation Vizbi 2013
(15 mins)
Weather at ski resort
Blurring: what stands out?
Saturday, 23 March 2013

Activity 6: evaluation
UX design: insight, empathy and evaluation Vizbi 2013
(15 mins)
UK shipping forecast
Blurring: what stands out?
Saturday, 23 March 2013

Activity 6: evaluation
UX design: insight, empathy and evaluation Vizbi 2013
5 second test: what do you remember?
(15 mins)
Part of the boston.com weather page
Saturday, 23 March 2013

Activity 6: evaluation
UX design: insight, empathy and evaluation Vizbi 2013
(15 mins)
NOAA National Weather Service homepage
10 second test: what do you remember?
Saturday, 23 March 2013

Testing design “hypotheses”
UX design: insight, empathy and evaluation Vizbi 2013
“Turning requirements into hypotheses”
These are human-centric statements
Test your visualisation design “hypotheses”
with “experiments”... this is evaluation
http://www.flickr.com/photos/francisrowland/8281908252/
experiment
hypothesis
(evaluation)
Saturday, 23 March 2013

Tutorial activities
UX design: insight, empathy and evaluation Vizbi 2013
Activity 1: describing the topic: breaking it down
(components, features, scenarios and people)
Activity 2: user research: interviewing each other
(learning about your audience)
Activity 3: user research: synthesising your findings
(e.g. nouns, verbs, adjectives; empathy map)
Activity 4: activity diagram: describing the activities people
in your audience perform
Activity 5: mission statement: what is this data visualisation
for? (data-centric)
Activity 6: evaluation: a quick look at evaluating your
visualisations
Activity 7: Hypotheses: re-framing your visualisation in
human- (or activity-) centric terms
Saturday, 23 March 2013
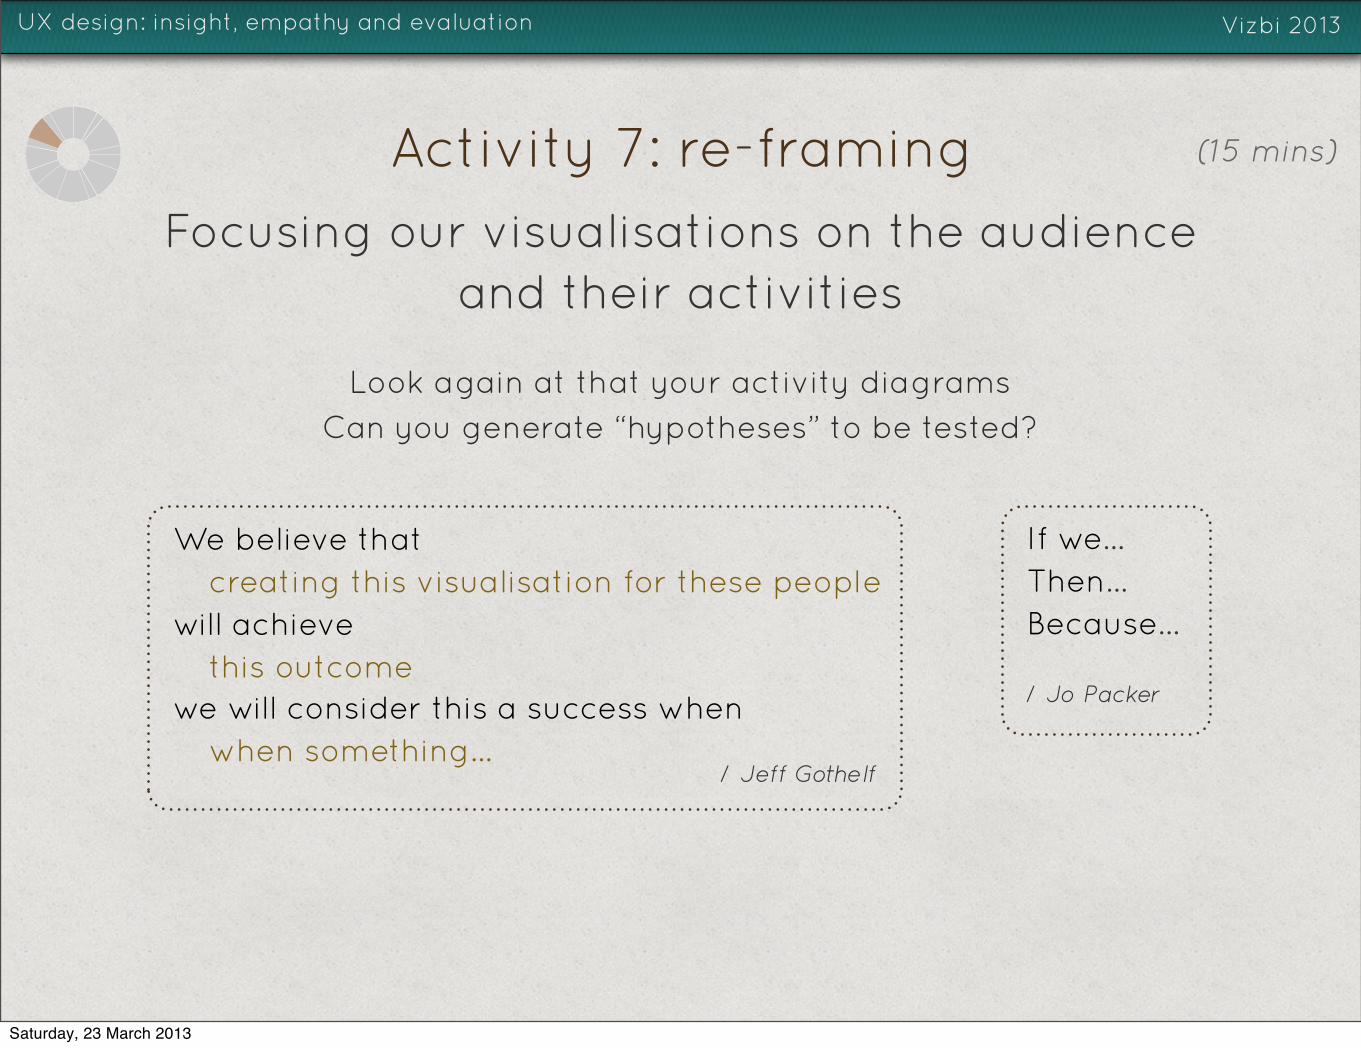
Activity 7: re-framing
UX design: insight, empathy and evaluation Vizbi 2013
Focusing our visualisations on the audience
and their activities
Look again at that your activity diagrams
Can you generate “hypotheses” to be tested?
/ Jeff Gothelf
We believe that
creating this visualisation for these people
will achieve
this outcome
we will consider this a success when
when something...
If we...
Then...
Because...
/ Jo Packer
(15 mins)
Saturday, 23 March 2013

Round-up
UX design: insight, empathy and evaluation Vizbi 2013
The important bits
✓ Data visualisation is about communication. This implies an audience
✓ Be curious. Talk to people - find the context of use for your visualisations
✓ Learn how your audience thinks and talks about your data
✓ Be prepared to dig: don’t take feedback at face value
✓ What goals do your audience have? What activities do they perform?
✓ Don’t leave “evaluation” until last
✓ Data visualisation is an iterative process; seek feedback [1]
✓ Don’t confuse iterative with incremental [2]
✓ Sketch, prototype, share and test. Ditch what doesn’t work
✓ Developing empathy will allow you to see your data from a new
perspective
[1] See the GA “Conversation with data visualization experts” http://bit.ly/XToBng[2] Quoting @cyetain, on Twitter
Saturday, 23 March 2013

Q&A
UX design: insight, empathy and evaluation Vizbi 2013
How did it go?
Outstanding questions?
Was it what you expected?
Will it change any of the conversations
you have this week?
Saturday, 23 March 2013

Thank you
UX design: insight, empathy and evaluation
Email: [email protected]
Web: flavors.me/francisrowland
Twitter: @francisrowland
Vizbi 2013
Photo: whatknot (CC) / Flickr http://bit.ly/W7OeCG
Keep in touch
THANKS
Andrew Cowley, Glen van Ginkel, Karyn Mégy and
Rui Wang for tutorial critique & feedback
Dan Willis, Noah Iliinsky, Andy Kirk, Andrew Travers,
Jo Packer and Jeff Gothelf for ideas & inspiration
Saturday, 23 March 2013

Suggested reading
UX design: insight, empathy and evaluation Vizbi 2013
READING
Data Visualization: a successful design process Andy Kirk (ISBN: 1849693463)
Visualize This: The Flowing Data Guide to Design, Visualization, and StatisticsNathan Yau (ISBN: 0470944889)
Design Study Methodology: Reflections from the Trenches and the StacksMichael Sedlmair, Miriah Meyer, and Tamara Munzner(see http://www.cs.ubc.ca/nest/imager/tr/2012/dsm/)
Designing data visualizationsNoah Iliinsky & Julie Steele (ISBN: 1449312284)
Lean UX: Applying Lean Principles to Improve User ExperienceJeff Gothelf & Josh Seiden
Interviewing for research Andrew Travers (April 2013) (see http://www.fivesimplesteps.com/products/interviewing-for-research)
Jakob Nielsen’s 10 usability heuristics for UI designhttp://www.nngroup.com/articles/ten-usability-heuristics/
Ben Schneiderman’s 8 golden rules of interaction designhttp://faculty.washington.edu/jtenenbg/courses/360/f04/sessions/schneidermanGoldenRules.html
PRESENTATIONS
Minimum viable research (Jo Packer)http://www.slideshare.net/badjuju/minimum-viable-research
From interview to insight (Andrew Travers) https://speakerdeck.com/trvrs/from-interview-to-insights-interviewing-for-design-research
User research: the gentle art of not asking users what they want (Francis Rowland)http://www.slideshare.net/francisrowlanduk/user-research-the-gentle-art-of-not-asking-users-what-they-want
Saturday, 23 March 2013