VIX AND VIX FUTURES: A TOOL OF RISK REDUCTION AND …summit.sfu.ca/system/files/iritems1/14413/Final...
56
VIX AND VIX FUTURES: A TOOL OF RISK REDUCTION AND DOWNSIDE PROTECTION FOR HEDGE FUNDS by Bei Feng Bachelor of Science in Statistics, Simon Fraser University, 2010 and Chuyue Wu Bachelor of Business Administration, Simon Fraser University, 2012 PROJECT SUBMITTED IN PARTIAL FULFILLMENT OF THE REQUIREMENTS FOR THE DEGREE OF MASTER OF SCIENCE IN FINANCE In the Master of Science in Finance Program of the Faculty of Business Administration © Bei Feng and Chuyue Wu, 2014 SIMON FRASER UNIVERSITY Summer, 2014 All rights reserved. However, in accordance with the Copyright Act of Canada, this work may be reproduced, without authorization, under the conditions for Fair Dealing. Therefore, limited reproduction of this work for the purposes of private study, research, criticism, review and news reporting is likely to be in accordance with the law, particularly if cited appropriately.
Transcript of VIX AND VIX FUTURES: A TOOL OF RISK REDUCTION AND …summit.sfu.ca/system/files/iritems1/14413/Final...

VIX AND VIX FUTURES: A TOOL OF RISK REDUCTION AND DOWNSIDE
PROTECTION FOR HEDGE FUNDS
by
Bei Feng
Bachelor of Science in Statistics, Simon Fraser University, 2010
and
Chuyue Wu
Bachelor of Business Administration, Simon Fraser University, 2012
PROJECT SUBMITTED IN PARTIAL FULFILLMENT OF
THE REQUIREMENTS FOR THE DEGREE OF
MASTER OF SCIENCE IN FINANCE
In the Master of Science in Finance Program
of the
Faculty
of
Business Administration
© Bei Feng and Chuyue Wu, 2014
SIMON FRASER UNIVERSITY
Summer, 2014
All rights reserved. However, in accordance with the Copyright Act of Canada, this work
may be reproduced, without authorization, under the conditions for Fair Dealing.
Therefore, limited reproduction of this work for the purposes of private study, research,
criticism, review and news reporting is likely to be in accordance with the law,
particularly if cited appropriately.

ii
Approval
Name: Bei Feng
Chuyue Wu
Degree: Master of Science in Finance
Title of Project: VIX AND VIX FUTURES: A TOOL OF RISK
REDUCTION AND DOWNSIDE PROTECTION FOR
HEDGE FUNDS
Supervisory Committee:
___________________________________________
Dr. Peter Klein
Senior Supervisor
Professor of Finance
___________________________________________
Dr. Jijun Niu
Second Reader
Associate Professor of Finance
Date Approved: ___________________________________________

iii
Abstract
We analyze VIX, VIX futures and hedge funds. VIX is a measure of the implied
volatility of S&P 500 index options. VIX futures performance is measured by the S&P
500 VIX Mid-Term Futures Index and the CBOE VIX Premium Strategy Index. Credit
Suisse Hedge Fund Index and Hedge Fund Research Indices represent hedge funds
performance.
In our project, we expand Dash and Moran (2005) by expanding the end period of
survey from December 2004 to May 2014 and including two hedge fund databases,
Credit Suisse and Hedge Fund Research. In addition, we conduct analyses on both VIX
index and VIX futures indices, which are not included in the Dash and Moran (2005).
Not only we check the addition of VIX index or VIX futures indices to hedge fund
portfolios for risk reduction or downside protection, but also our analysis pays more
attention to the period of 2008 financial crisis.
We find that broad-based hedge fund indices and most narrow hedge fund indices
are negatively and asymmetrically correlated with VIX. Addition of VIX index as well as
VIX futures indices protects hedge fund portfolios from major drawdowns and helps
reduce risk.
Keywords: VIX; VIX Futures; Hedge Fund; Correlation;

iv
Dedication
This project is dedicated to our families, for their continuous and unconditional
support.

v
Acknowledgements
We would like to extend our thanks to our senior supervisor Dr. Peter Klein, who
continuously helps us to improve our work. We also want to thank our supervisor
Dr. Jijun Niu.
Thanks to the faculty and our classmates for the last enjoyable year.
vi
Table of Contents
Approval .......................................................................................................................................... ii
Abstract .......................................................................................................................................... iii
Dedication ....................................................................................................................................... iv
Acknowledgements .......................................................................................................................... v
Table of Contents ............................................................................................................................ vi
1: Introduction ................................................................................................................................ 1
2: Literature Review ...................................................................................................................... 3
2.1 Hedge Funds and VIX ............................................................................................................. 3
2.2 VIX Futures ............................................................................................................................. 4
2.3 Review of Dash and Moran ..................................................................................................... 6
3: Data and Methodology ............................................................................................................... 8
3.1 Hedge Fund Indices ................................................................................................................. 8
3.2 VIX and VIX Futures Indices ................................................................................................. 8
3.3 Methodology ......................................................................................................................... 11
4: Results and Analyses – VIX Index .......................................................................................... 13
4.1 Correlations of Hedge Fund Returns and VIX Changes ....................................................... 13
4.1.1 Average Correlations................................................................................................ 13 4.1.2 Rolling 30-Month Correlations ................................................................................ 14
4.2 Efficient Frontiers with addition of VIX Index ..................................................................... 16
4.3 Allocating VIX index ............................................................................................................ 17
5: Results and Analyses – VIX Futures Indices ......................................................................... 21
5.1 CBOE VIX Premium Strategy Index (VPD) and Financial Crisis ........................................ 21
5.1.1 Correlations of Hedge Fund Returns and VPD Changes ......................................... 21 5.1.2 Efficient Frontiers with addition of VPD Index ....................................................... 22 5.1.3 Shorting VPD ........................................................................................................... 23
5.2 S&P 500 VIX Mid-term Futures Index (SPVIXMTR) ......................................................... 25
5.2.1 Correlation of Hedge Fund Returns and SPVIXMTR Changes ............................... 25 5.2.2 Allocating SPVIXMTR to Hedge Fund Index ......................................................... 26
6: Conclusions ............................................................................................................................... 30
7: Limitations ................................................................................................................................ 31
Appendices .................................................................................................................................... 32
Appendix 1: Code 1 ........................................................................................................................ 33
Appendix 2: Code 2 ........................................................................................................................ 39

vii
Appendix 3: Code 3 ........................................................................................................................ 44
Bibliography.................................................................................................................................. 48
Works Cited .................................................................................................................................... 48
Works Consulted ............................................................................................................................ 49

1
1: Introduction
Hedge funds represent one of the fastest growing asset classes in the financial
markets with a 20% yearly growth rate. As of June 2013, the estimated size of the global
hedge fund industry was 2.4 trillion USD. Traditionally, hedge funds were used as
hedging techniques. However, nowadays the major purpose of hedge fund investors is to
maximize returns instead of hedging risk. As a result, the volatility of hedge funds has
become larger. Therefore, it is essential to find a way to reduce hedge fund risk and
protect hedge funds.
In 1993, the Chicago Board Options Exchange (CBOE) introduced a new
volatility index, VIX, and in 2003, the CBOE introduced a more detailed methodology
for the VIX. VIX is a measure of the implied volatility of S&P 500 index options, and it
is calculated on a real-time basis throughout each trading day. Since 1993, VIX has been
considered one of the most important indicators of market volatility. Because VIX cannot
be traded, VIX futures and VIX options were launched in 2004 and 2006, respectively,
for those who want to trade in this instrument.
Dash and Moran (2005) discussed the relationship between VIX and broad-based
hedge fund portfolios. They pointed out that VIX is negatively correlated to hedge fund
return. They also found that when hedge fund return is positive, the correlation is weak,
while when hedge fund return is negative, the correlation is strong. Therefore, they
concluded that there is an asymmetric correlation between VIX and hedge fund return,
and VIX could protect and diversify the hedge fund portfolios. Another finding was that a
small allocation to VIX could reduce risk and protect the hedge fund portfolios during
financial crisis.
In our paper, we explore the relationship between VIX and different hedge fund
indices from two organizations, Credit Suisse and Hedge Fund Research. We first extend
the data end date from 2005 to 2014, and we pay extra attention to 2008 financial crisis
period (from 2007 to 2009). Other than the broad-based hedge fund portfolios, which

2
were used in Dash and Moran (2005), we also test the narrow hedge fund strategies. In
addition, we test whether the allocation of VIX can protect hedge funds. Furthermore, we
do similar analyses on VIX futures, which was suggested but not explored by Dash and
Moran (2005). We use S&P 500 VIX Mid-term Futures Index and CBOE VIX Premium
Strategy Index to represent VIX futures performance. Our finding is consistent with Dash
and Moran’s, and we also find that the relationship between VIX futures and hedge funds
is similar with the relationship between VIX and hedge funds.

3
2: Literature Review
2.1 Hedge Funds and VIX
Because of the rapid growth rate of hedge funds, many studies on hedge funds
have been done. Researchers are trying to find more ways to maximize the return and
reduce the risk of hedge funds. Some researchers focused on VIX. They found a negative
correlation between VIX and hedge fund returns, so they suggested that VIX could be
used to reduce the hedge fund risk.
Morgan (2013) studied how can the statistical arbitrage affect the hedge fund
performance, and he explored one of the hedge fund strategies, high frequency trading.
Also, he discussed about their impact on the business environment. He found that
although statistical arbitrage strategy produces more profit, it reduces the timelines of
profitability at the same time.
Billion, Getmansky, and Pelizzon (2009) focused on the performance of hedge
fund during financial crises, including the Long-Term Capital Management (LTCM)
crisis of 1998, subprime mortgage crisis of 2007, and the 2008 Global financial crisis.
They explored how the financial crises affect the hedge fund risk, and pointed out that
liquidity, credit, and volatility risks are systematic risk factors for hedge funds. They
found that the hedge fund volatility increased dramatically during financial crises, by
studying eight hedge fund index strategies. Another finding was that the correlation
between hedge fund strategies also increased during financial crises.
In the book edited by Gregoriou, Karavas, and Rouah (2003), the editors collected
many articles that discussed about hedge funds returns, risks, and strategies in more
details. The articles included both quantitative and qualitative analysis on hedge funds,
and introduced some important issues faced by hedge fund investors and researchers.
Whaley (2009) gave us a general introduction on VIX. He introduced the history
of VIX and how to calculate the VIX. Also, he explored the VIX in relation to the stock

4
market in quantitative respect. In addition, he claimed that VIX can be used as a predictor.
Based on his research, VIX can predict the expected range of S&P 500 index returns in
next 30 days. He double-checked the performance of VIX as a predictor by using
historical data, and the result showed that VIX is a good predictor of the future S&P 500
index changes. This paper was focus on the exploration on VIX and S&P 500 index
relationship, but it did not analyse the relationship between VIX and hedge funds.
Black (2006) studied on how to improve hedge fund risk exposures by using VIX.
Usually the returns of hedge funds are not normally distributed, but the Sharpe ratio is
based on the assumption of normal distribution. Therefore, we should not only focus on
the mean, variance and Sharpe ratio, but we should also look at the skewness and kurtosis
of the hedge funds returns. Skewness is a measure of symmetry of returns, while kurtosis
is a measure of tails. When kurtosis is higher than three, the tail is fat, which means that
there are more extreme returns than a normal distribution of equal variance. Investors
always want to have positive skewness and low kurtosis, in order to maximize their profit
and minimize their risk. However, most hedge fund returns have a lower skewness and
higher kurtosis than S&P 500, even if they have higher Sharpe ratio.
According to Black’s research, allocating a small portion of VIX can improve the
skewness and kurtosis of hedge fund returns, and as a result, the risk of hedge fund
investment can be reduced. He said that VIX not only hedge the traditional investment
portfolios, but also can be used to hedge the alternative investment portfolio. To get this
conclusion, he did some quantitative analysis on CBOE VIX and CSFB Hedge Fund
Index. He found that there is a strong negative correlation between VIX and hedge funds.
Therefore, allocating a long VIX position in investment portfolio can reduce the risk.
Also, the data showed that the skewness, kurtosis, and correlation to the S&P 500 can be
greatly improved by adding VIX into investment portfolio.
2.2 VIX Futures
Because VIX is an index that cannot be traded directly in practice, VIX futures
were introduced in May 2004. VIX futures are similar with other futures contracts, which

5
are exchange-traded contracts on a future VIX level derived from a basket of S&P 500
stock index options. There are many different VIX futures contracts based on their
maturity level, such as S&P 500 VIX Short-Term Futures Index, S&P 500 VIX Mid-
Term Futures Index, and S&P 500 VIX Long-Term Futures Index.
Zhang and Zhu (2006) studied VIX futures by using the data from the CBOE web
site. Because VIX cannot be traded, the non-arbitrage principle cannot be used to get the
relationship between VIX and VIX futures. Therefore, they want to find a good way to
price VIX futures. They built a model for VIX and VIX futures, and did a lot of
quantitative analysis using the historical data from 1990 to 2005.
Szado (2009) explored the portfolio diversification during 2008 financial crisis.
He observed that the correlation between VIX and S&P 500 was extremely strong during
financial crisis. Therefore, he got the same conclusion with Black (2006) that long VIX
can reduce portfolio’s risk. He built three portfolios: one is 100% equity, one is 60%
equity and 40% bonds, and one is equity, bonds and alternative assets. Then he added 2.5%
and 10% VIX futures to these three portfolios. He found that the VIX futures allocation
can increase the portfolio returns and decrease the volatilities. The statistics showed that
during financial crisis, the VIX futures can reduce losses dramatically. As a result,
allocating of VIX futures in portfolios can diversify the investment and protect the
investment during financial crisis.
Chen, Chuang and Ho (2010) also examined the diversification effects of VIX
futures on investment portfolios. They found that allocating VIX-related assets can
reduce the risk of portfolio, and the Sharpe ratios for portfolios with VIX-related assets
are significantly higher than the portfolios with no VIX. Also, the correlations between
VIX futures and portfolios are stronger, and the variances of portfolios with VIX futures
are lower. Therefore, they concluded that investors can gain diversification benefits from
investing in portfolios with VIX products, and also, the hedge fund managers can
improve their performance by trading the VIX products.

6
2.3 Review of Dash and Moran
Our project is based on Dash and Moran (2005). Dash and Moran explored the
relationship between VIX and hedge fund returns, and they also tested whether allocating
VIX in portfolio can reduce the risk and provide downside protection to investment.
Dash and Moran used the Credit Suisse Hedge Fund Index (HFI) and the CBOE
VIX data to do their analysis. The data time period was from 1995 to 2004. Note that
Credit Suisse HFI has many narrow hedge fund strategies, but Dash and Moran only
explored the broad-based hedge fund portfolio.
Dash and Moran first figured out that there is a negative correlative existed
between HFI and VIX. Then, they drew a graph of rolling 30-month correlations of HFI
with VIX, and found that the correlation is not stable. When the market went down, the
correlation was strong, while when the market rose up, the correlation became weaker.
Therefore, they conclude that the correlation between VIX and hedge fund returns is
asymmetric.
Next, they allocated VIX to a hedge fund portfolio to see that whether VIX can
improve hedge fund performance. They looked at the efficient frontier for an HFI and
VIX portfolio first, and found that the best allocation of VIX should be between 0% and
10%. Based on this finding, they built three portfolios. The first one is HFI with no VIX,
the second one is HFI with static 5% VIX, and the third one is HFI with tactical VIX.
They defined the tactical VIX as following: When VIX increased by more than 20% in
past quarter, they set the VIX allocation equal to 0%; when VIX decreased by more than
20% in past quarter, they set the VIX allocation equal to 10%; when the changes of VIX
was between -20% and 20% in past quarter, they set the VIX allocation equal to 5%.
They compared the cumulative returns, volatilities, Sharpe ratios, skewness and kurtosis
of these three portfolios, and concluded that the tactical allocation of VIX gives the best
outcome.
Finally, Dash and Moran suggested that VIX futures can be treated as one
implement of the allocation strategy. Because there is not enough data of VIX futures at
that time, they could not do the analysis on VIX futures. Also, they suggested that people

7
can study on the relationship between VIX and narrow hedge fund strategies to see
whether VIX can help to improve narrow hedge fund strategies as well.
In our project, we expand Dash and Moran’s paper by conducting following steps:
1. Expanding the end period of survey from December 2004 to May 2014.
2. Using two databases, Credit Suisse and Hedge Fund Research, and comparing
both outcomes.
3. Testing both VIX index and VIX futures indices.
4. Checking whether the 2008 financial crisis impacted the relationship between
VIX changes and hedge fund returns.
5. Checking the addition of VIX or VIX futures to hedge fund portfolios for risk
reduction or downside protection.

8
3: Data and Methodology
We conduct our research at index level and use two hedge fund index databases
and consider three indices as directional exposure to VIX. This section describes the data
we use and the analysis steps we follow.
3.1 Hedge Fund Indices
We use the Credit Suisse Hedge Fund Indices (HFI), which have been used in
Dash and Moran (2005), to represent returns to the universe hedge funds. The Credit
Suisse HFI as the industry leading asset-weighted hedge fund index provides an accurate
depiction of an investment in hedge fund. We include data from January 1998 to May
2014 to match the timeline of another hedge fund database we use. As Dash and Moran
(2005) suggested, we also include strategy-based hedge fund indices in our research to
narrow results. Those ten individual strategy indices are listed in our Results and
Analyses part.
We also include the hedge fund indices from Hedge Fund Research (HFR)
Database, one of the most comprehensive resources of hedge funds, to see whether Dash
and Moran’s results will still hold. We consider the investable HFRX Global Hedge Fund
Index as the representation of the hedge fund universe. Four other strategy-based indices
include HFRX Event Driven Index, HFRX Equity Hedge Index, HFRX Relative Value
Arbitrage Index, and HFRX Macro/CTA Index. The available sample period is from
January 1998 to May 2014.
3.2 VIX and VIX Futures Indices
Our research use the VIX index calculated using the new methodology and we
include the index data from January 1998 to June 2014. Instead of only using VIX index,
we find the S&P 500 VIX Mid-Term Futures Index (SPVIXMTR) and the CBOE VIX
Premium Strategy Index (VPD). These investable indices offer a directional exposure to
9
VIX Futures. The SPVIXMTR measures a daily rolling long position in the fourth, fifth,
sixth and seventh month VIX futures contracts. Introduced by Chicago Board Options
Exchanges in 2007, the VPD tracks the performance of a strategy that invests in Treasury
Bills and systematically sells one-month VIX futures. The SPVIXMTR has sample
period from July 2009 to May 2014, and the VPD data is available from July 2004 to
May 2014 including back-tested data.
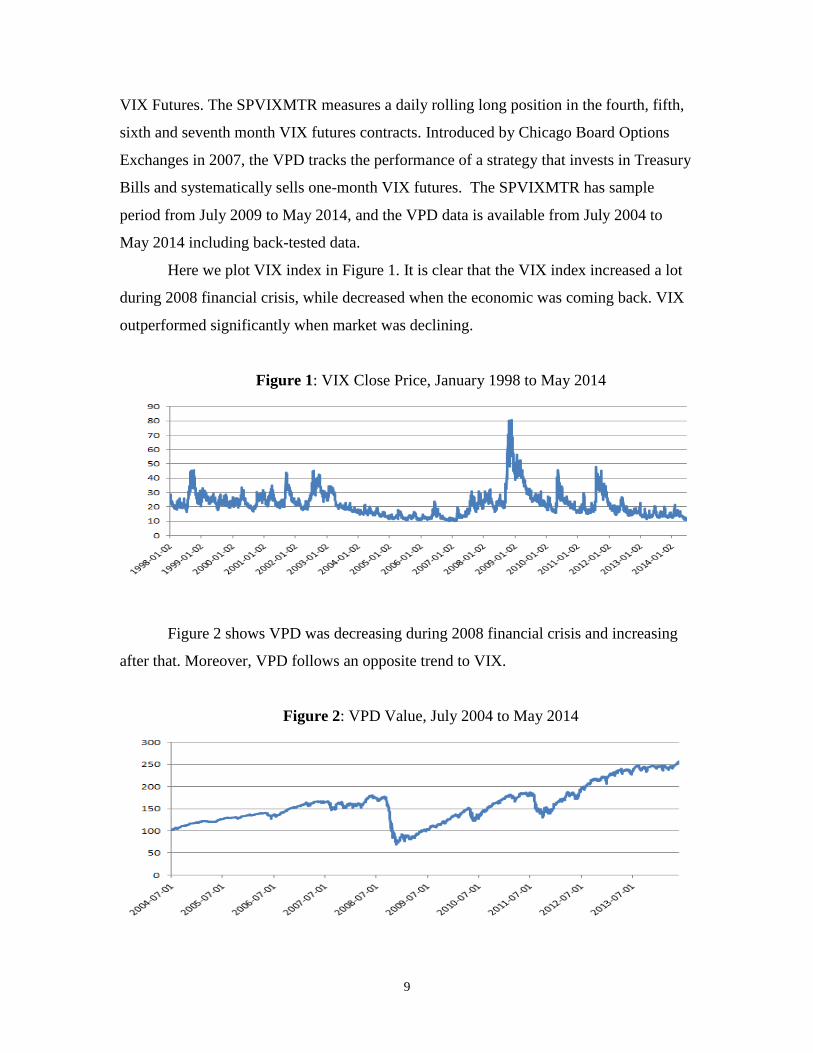
Here we plot VIX index in Figure 1. It is clear that the VIX index increased a lot
during 2008 financial crisis, while decreased when the economic was coming back. VIX
outperformed significantly when market was declining.
Figure 1: VIX Close Price, January 1998 to May 2014
Figure 2 shows VPD was decreasing during 2008 financial crisis and increasing
after that. Moreover, VPD follows an opposite trend to VIX.
Figure 2: VPD Value, July 2004 to May 2014

10
Figure 3 demonstrates that the SPVIXMTR follows the VIX from August 2009 to
May 2014. They both went up around July 2010 and December 2011. After 2012 they
both keep going down.
Figure 3: SPVIXMTR, August 2009 – May 2014
We summarize assets’ annualized returns and standard deviations in Table 1. In
Table 1 and in the following sections, HFI and HFRX stand for broad-based Credit
Suisse Hedge Fund Indices and HFRX Global Hedge Fund Index respectively.
Table 1: Summary Statistics
Annualized Return Standard Deviation
January 1998 - May 2014
VIX Index -4.15% 66.45%
HFI Index 6.94% 6.63%
HFRX Index 5.33% 6.40%
July 2004 - May 2014
VPD 9.74% 21.10%
HFI Index 6.14% 5.92%
HFRX Index 1.128% 6.32%
July 2009 - May 2014
S&P 500 Futures Indexes -30.92% 18.63%
HFI Index 7.978% 4.72%
HFRX Index 2.93% 4.18%
We find risk-free rate based on three-month Treasury bill yield. We assume the
average of corresponding three-month Treasury bill yield is the risk-free rate for that
period. As shown in Figure 4, Treasury bill rate has been very low since 2009. Therefore,
we assume risk-free rate equals zero after 2009.

11
Figure 4: Three-Month Treasury Bill Rate
3.3 Methodology
As we mentioned before, our research bases on the Dash and Moran (2005). We
use the similar methodology used by Dash and Moran (2005) but expand sample period
and include more data sources. Here are the analysis steps we follow:
1. Measure correlations of VIX changes to hedge fund index returns
2. Plot efficient frontier with addition of VIX exposure to hedge fund index
3. Allocate VIX exposure to hedge fund index
More details regarding how we conduct our analysis steps are described here.
To measure the relationship of hedge fund returns to VIX Changes, we calculate
average correlation and rolling 30-month correlations of broad-based hedge fund indices
returns (HFI and HFRX) to VIX changes. Same calculations have been done with
strategy-based indices.
In order to demonstrate the basic idea of adding VIX exposure to hedge funds, we
draw efficient frontiers. Addition of VIX index as well as two kinds of VIX futures
indices to the HFI and HFRX are considered.
To further access the risk protection or diversification effect of VIX exposure, we
first add VIX index exposure to HFI and HFRX. Although VIX is not investable, the
performance of VIX futures and options are based on the current expectation of VIX.
Therefore, we can see the basic effect of combining VIX index and hedge fund index. To

12
these hedge fund indices, static and tactical allocation strategies are used. When construct
tactical allocation, we rely on the mean reversion nature of VIX.
After finishing with VIX index, we conduct same analysis steps on two VIX
futures indices (SPVIXMTR and VPD). As stated by Szado (2009), although the prices
of VIX futures are based on the current expectation of VIX, the volatility of VIX futures
is much lower than that of VIX index. In addition to the fact that VIX index is not
investable we have to allocate investable VIX futures indices to hedge fund index.
For the sake of clarity we discuss each specific allocation strategy in our Results
and Analyses part. Moreover, our analysis was performed using all kinds of allocation
weights but not all results are included in our report. We only demonstrate several
numerical examples. In addition to the whole sample period (1998 to 2014), a sub-period
of 2008 financial crisis is discussed separately.
It is worth noting that our research is intended to access the impacts of VIX and
VIX Futures exposure. Therefore, we focus on demonstrating the possibility of
combining VIX or VIX futures to hedge funds for risk reduction or downside protection,
same as Dash and Moran (2005). We do not intend to find the optimal VIX Futures
investment strategy.

13
4: Results and Analyses – VIX Index
4.1 Correlations of Hedge Fund Returns and VIX Changes
4.1.1 Average Correlations
Table 2 summarizes the average correlations of VIX changes to Credit Suisse
Hedge Fund Indices. We see negative average correlations from HFI as well as from
most individual strategy indices. However, Dedicated Short Bias Hedge Fund Index and
Managed Futures Hedge Fund Index have positive average correlations.
Table 2: Average Correlations of Credit Suisse Hedge Fund Indices
Returns to VIX Changes, January 1998 to May 2014
Credit Suisse Hedge Fund Index (HFI) -0.4369
Credit Suisse Convertible Arbitrage Hedge Fund Index -0.3606
Credit Suisse Dedicated Short Bias Hedge Fund Index 0.5536
Credit Suisse Emerging Markets Hedge Fund Index -0.4963
Credit Suisse Equity Market Neutral Hedge Fund Index -0.0976
Credit Suisse Event Driven Hedge Fund Index -0.5355
Credit Suisse Fixed Income Arbitrage Hedge Fund Index -0.5142
Credit Suisse Global Macro Hedge Fund Index -0.1137
Credit Suisse Long/Short Equity Hedge Fund Index -0.5375
Credit Suisse Managed Futures Hedge Fund Index 0.0427
Credit Suisse Multi-Strategy Hedge Fund Index -0.3457
Table 3 summarizes the average correlations of HFRX Hedge Fund Indices
returns to VIX changes. Obviously, we only see negative average correlations.
Table 3: Average Correlations of HFRX Hedge Fund Indices
Returns to VIX Changes, January 1998 to May 2014
HFRX Global Hedge Fund Index (HFRX) -0.4146
HFRX Event Driven Index -0.5680
HFRX Equity Hedge Index -0.5368
HFRX Relative Value Arbitrage Index -0.3584
HFRX Macro/CTA Index -0.0855

14
4.1.2 Rolling 30-Month Correlations
Figure 5 shows the rolling 30-month correlations of Credit Suisse Hedge Fund
Indices with VIX. The VIX is negatively correlated with HFI during the whole sample
period. Most individual strategy indices follow the HFI demonstrating negative
correlations. For Dedicated Short Bias, VIX is only positively correlated even though its
pattern is very similar with HFI’s. Fixed Income Arbitrage and Multi-Strategy are
positively correlated with VIX before 2007, and negatively correlated with VIX after
2007. There are several strategies follow very different patterns, including Managed
Futures and Equity Market Neutral.
Figure 5: Rolling 30-Month Correlations of Credit Suisse HFI with VIX
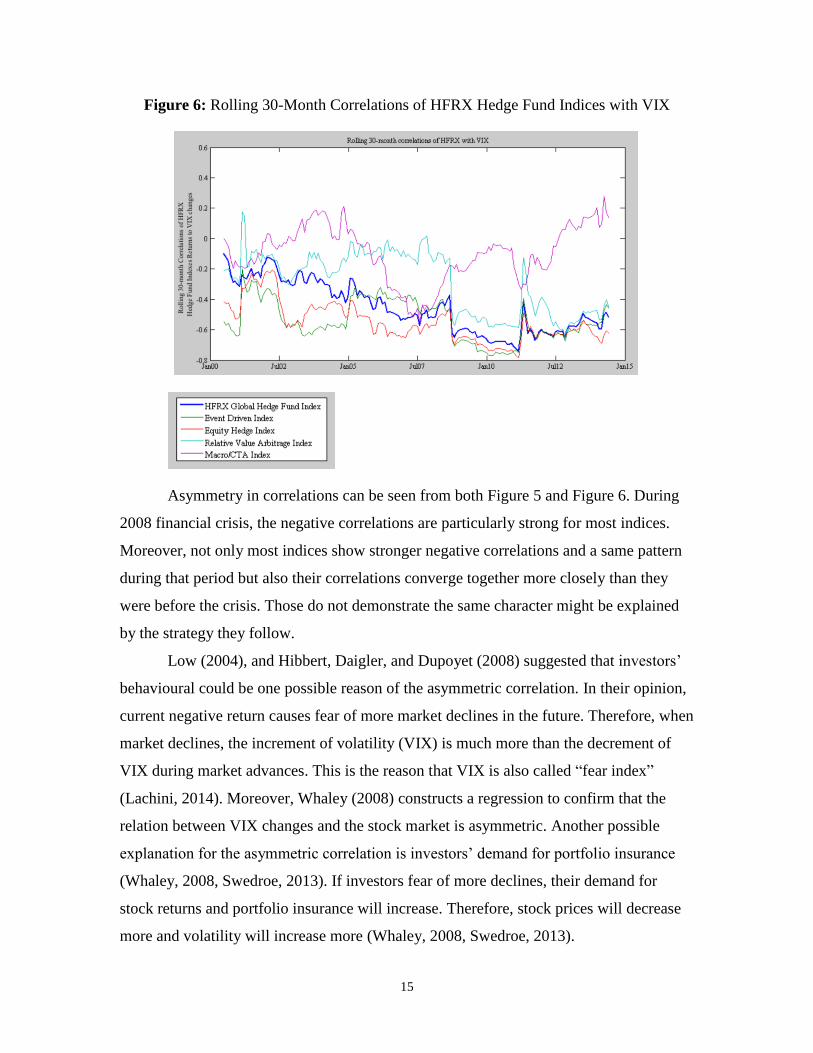
Figure 6 shows the rolling 30-month correlations of HFRX Hedge Fund Indices
with VIX. HFRX Macro/CTA Index is the only index that demonstrates a different
pattern than other four indices. The other four follow a same pattern and are negatively
correlated to VIX. There are few times that Relative Value Arbitrage is positively
correlated to VIX.
15
Figure 6: Rolling 30-Month Correlations of HFRX Hedge Fund Indices with VIX
Asymmetry in correlations can be seen from both Figure 5 and Figure 6. During
2008 financial crisis, the negative correlations are particularly strong for most indices.
Moreover, not only most indices show stronger negative correlations and a same pattern
during that period but also their correlations converge together more closely than they
were before the crisis. Those do not demonstrate the same character might be explained
by the strategy they follow.
Low (2004), and Hibbert, Daigler, and Dupoyet (2008) suggested that investors’
behavioural could be one possible reason of the asymmetric correlation. In their opinion,
current negative return causes fear of more market declines in the future. Therefore, when
market declines, the increment of volatility (VIX) is much more than the decrement of
VIX during market advances. This is the reason that VIX is also called “fear index”
(Lachini, 2014). Moreover, Whaley (2008) constructs a regression to confirm that the
relation between VIX changes and the stock market is asymmetric. Another possible
explanation for the asymmetric correlation is investors’ demand for portfolio insurance
(Whaley, 2008, Swedroe, 2013). If investors fear of more declines, their demand for
stock returns and portfolio insurance will increase. Therefore, stock prices will decrease
more and volatility will increase more (Whaley, 2008, Swedroe, 2013).

16
Overall, results on both Credit Suisse Hedge Fund Indices and Hedge Fund
Research Indices are consistent with Dash and Moran (2005), that broad-based hedge
fund indices are negatively correlated with VIX index. The asymmetric correlation
suggests that diversification benefit or risk protection effect from adding VIX should
have greater effect when in major crisis. Meanwhile, the convergence character provides
support for allocating VIX to most individual strategy hedge funds. As most individual
strategy indices have similar rolling correlations to HFI or HFRX, allocating VIX to
individual strategy index should work as well as allocating VIX to broad-based hedge
funds. In the following two allocation sections, we focus on the two representative
broad-based hedge fund indices, HFI and HFRX.
4.2 Efficient Frontiers with addition of VIX Index
We can see the idea of adding VIX exposure to hedge funds can benefit the
portfolio from Figure 7. With the addition of VIX, returns of HFI as well as HFRX are
increasing with risk decreasing. After reaching the minimum risk point, returns are
increasing with risk also increasing.
Figure 7: Efficient Frontier with Addition of VIX Index
Take a closer look at Figure 7, Figure 8 illustrates that the addition of up to 5% of
VIX index gives us a portfolio that is efficient. There are no efficient portfolios with VIX
allocation less than 5%. The diversification benefits are quite clear in those figures.

17
Figure 8: Efficient Frontier with Addition of VIX Index, weights 0% to 20%
Dash and Moran (2005) plotting an efficient frontier shows the diversification
effect of adding VIX to HFI. Here we have demonstrated that with the addition of VIX
exposure both HFI and HFRX can be benefited in a similar manner.
4.3 Allocating VIX index
As we found in the last section, addition of up to 5% VIX constructs an efficient
portfolio. In addition, we do not want to add to much risk, therefore we choice to allocate
VIX from 5% to 10%. Here are our four allocation combinations.
1. No VIX index
2. Static 5% VIX index
3. Static 10% VIX index
4. Tactical 0-10% VIX index
For the tactical strategy, we start with 5% VIX exposure. Based on the risk
aversion nature of volatility and Dash and Moran’s paper, if in the past quarter VIX
increased by more than 20%, we cut down VIX allocation to 0%. If in the past quarter
VIX decreased by more than 20%, we increase VIX allocation to 10%. If VIX changes
are between +20% and -20%, we keep the VIX allocation steady at 5%.
Table 4 summarizes performances of portfolios with VIX exposure. In general,
portfolios with VIX exposure outperform portfolios with no VIX. Skewness and kurtosis

18
are improved when there is VIX addition. From January 1998 to May 2014, portfolios
with VIX exposure outperform with higher annualized returns, higher Sharpe ratios, and
lower annualized standard deviations than portfolios with no VIX. The diversification
effect is clearly demonstrated.
Table 4: Summary of Portfolios with VIX Index
HFI HFRX
no VIX
static
5%
VIX
static
10%
VIX
tactical
0-10%
VIX
no VIX
static
5%
VIX
static
10%
VIX
tactical
0-10%
VIX
Risk-free rate: 2.224%
Jan
uar
y 1
99
8
- M
ay 2
01
4 Annualized Returns 6.92% 7.36% 7.80% 7.84% 5.37% 5.89% 6.41% 6.36%
Annualized Std 0.067 0.057 0.067 0.060 0.064 0.056 0.067 0.061
Sharpe Ratio 0.705 0.898 0.829 0.930 0.492 0.657 0.620 0.682
Skewness -0.489 0.324 0.332 0.186 -0.670 0.280 0.563 -0.341
Kurtosis 7.225 7.426 5.791 6.966 8.187 5.777 3.584 8.334
Risk-free rate: 1.956%
Jan
uar
y 2
00
7
- D
ecem
ber
20
09
Annualized Returns 2.92% 5.28% 7.64% 4.25% -2.85% -0.20% 2.45% -1.26%
Annualized Std 0.083 0.064 0.074 0.071 0.089 0.067 0.072 0.078
Sharpe Ratio 0.116 0.515 0.763 0.323 -0.537 -0.320 0.068 -0.413
Skewness -1.200 -0.706 -0.084 -1.204 -1.625 -1.096 -0.094 -1.976
Kurtosis 4.419 2.855 2.943 4.634 6.276 4.225 2.409 8.953
Risk-free rate: 0.758%
Jan
uar
y 2
00
8
- D
ecem
ber
20
09
Annualized Returns -1.63% -0.10% 1.42% -1.44% -6.43% -4.66% -2.89% -6.04%
Annualized Std 0.093 0.068 0.072 0.076 0.100 0.071 0.069 0.085
Sharpe Ratio -0.256 -0.127 0.093 -0.288 -0.718 -0.764 -0.526 -0.804
Skewness -0.964 -0.501 -0.334 -1.067 -1.553 -1.074 -0.249 -2.042
Kurtosis 3.437 2.398 2.437 3.875 5.296 3.857 2.046 8.146
We also analyse the effect of VIX index in two sub-periods (January 2007 -
December 2009, January 2008 - December 2009). Same as we expected, both tactical
portfolios and static portfolios outperform portfolios without VIX exposure on annualized
returns and standard deviations. The tactical strategy is not necessary outperform the
static portfolios as we do not intend to find an optimal strategy. However, during the
crisis, the negative Sharpe ratios do not tell us more information since the returns are
generally very small or negative.
Figure 9 plots cumulative portfolio values of investing $1 since January 1998 with
four strategies, no VIX, 5% VIX, 10% VIX, and tactical 0-10% VIX.

19
Figure 9: Addition of VIX Index to Hedge Fund Index
It is not hard to tell from Figure 9 that the portfolio value of no VIX exposure is
smaller than the portfolio value with VIX exposure. In addition to the value differences at
the end of the period, it is worth noting that the values of those four portfolios start to
diverge when there is a major crisis. Before the crisis, we do not see significant
differences among those values. Figure 9 confirms the risk protection effect of VIX and it
works well especially during bad times.
From Figure 10 we can closely look at the risk protection effect of VIX.
Figure 10: Addition of VIX Index to Hedge Fund Index under Crisis

20
In this section, we explore the relationship between VIX and different hedge fund
indices from two organizations, Credit Suisse and Hedge Fund Research, and we pay
special attention to financial crisis period. Our finding is consistent with Dash and Moran
(2005).
In the next section, as another expansion of Dash and Moran (2005), we explore
the relationship between VIX futures index and hedge fund index, and focus on testing
the possibility of adding investable VIX futures indices to hedge fund indices.

21
5: Results and Analyses – VIX Futures Indices
5.1 CBOE VIX Premium Strategy Index (VPD) and Financial Crisis
The VPD tracks the value of investing in both Treasury Bills and shorting one-
month VIX futures. Before we utilise the VPD index, since returns of Treasury bills
before 2008 are relatively high (Figure 11) we adjust VPD returns by subtracting
corresponding three-month Treasury bills returns to capture the effects of investing only
in VIX futures.
Figure 11: Three-month Treasury Bills Rate
5.1.1 Correlations of Hedge Fund Returns and VPD Changes
The average correlation of HFI and VPD is 0.6981 and the average correlation of
HFRX and VPD is 0.7521. As can be seen from Figure 12, the 30-month rolling
correlations of HFI or HFRX and VPD are positive. Especially during the 2008 financial
crisis, the positive correlations get larger. The positive correlations, just as we expected,
can be explained by the short VIX futures strategy using by the VPD index. If we
construct a portfolio by only shorting the VPD, then we will be able to get long exposure
of VIX futures and our portfolio will be negatively correlated to HFI or HFRX.

22
Figure 12: Rolling 30-Month Correlations
5.1.2 Efficient Frontiers with addition of VPD Index
We can see the idea of combining VPD and hedge fund index can benefit the
portfolio from Figure 13. Take a closer look at Figure 13, it illustrates that short 10% of
VPD gives us a portfolio that is less risky but still efficient. There are no efficient
portfolios shorting VPD more than 10%.
Figure 13: Efficient Frontier with Addition of VPD
Based on our analyses on VIX index, we need a long exposure of VIX to benefit
our portfolio. As VPD is positively correlated with hedge fund indices, the short strategy
observed from Figure 13 is consistent with our expectation.

23
5.1.3 Shorting VPD
Based on the efficient frontier we plotted, shorting 0% to 10% VPD constructs an
efficient portfolio. In addition, we do not want to sacrifice too many returns for reducing
risk, therefore we choice to short VPD from 5% to 10%. Here are our portfolios:
1. No VPD
2. Static short 5% VPD
3. Static short 10% VPD
4. Tactical short 0-10% VPD
We start with shorting 5% VPD. Based on the risk aversion nature of volatility, if
in the past quarter VPD increased by more than 20%, we stop shorting VPD (weight =
0%). If in the past quarter VPD decreased by more than 20%, we short more VPD
(weight = -10%). If VIX changes are between +20% and -20%, we keep the VPD
exposure steady at -5%.
Table 5 summarizes performances of portfolios with and without VPD. In
general, portfolios with VPD outperform portfolios with no VPD. However, skewness
and kurtosis are not improved.
Table 5: Summary of Portfolios with VPD
HFI HFRX
no
VPD
static
short
5%
VPD
static
short
10%
VPD
tactical
short 0-
10%
VPD
no
VPD
static
short
5%
VPD
static
short
10%
VPD
tactical
short 0-
10%
VPD
Risk-free rate: 1.956%
Jan
20
07 -
Dec
20
09
Annualized Returns 2.92% 3.23% 3.53% 3.42% -2.85% -2.83% -2.81% -2.62%
Annualized Std 0.083 0.081 0.081 0.081 0.089 0.088 0.090 0.088
Sharpe Ratio 0.116 0.157 0.195 0.181 -0.537 -0.541 -0.532 -0.517
Skewness -1.200 -1.225 -1.283 -1.255 -1.625 -1.687 -1.674 -1.705
Kurtosis 4.419 4.829 5.249 4.864 6.276 6.450 6.205 6.478
Risk-free rate: 0.758%
Jan
20
08 -
Dec
20
09 Annualized Returns -1.63% -1.52% -1.41% -1.23% -6.43% -6.56% -6.69% -6.24%
Annualized Std 0.093 0.090 0.089 0.090 0.100 0.098 0.099 0.098
Sharpe Ratio -0.256 -0.254 -0.243 -0.221 -0.718 -0.747 -0.754 -0.713
Skewness -0.964 -1.035 -1.145 -1.069 -1.553 -1.656 -1.658 -1.676
Kurtosis 3.437 3.937 4.417 3.949 5.296 5.595 5.444 5.614

24
When we compare Table 5 with Table 4, we find that under same period
portfolios adding VIX index are outperform portfolios shorting same portion of VPD.
This result can easily be explained by the gap between theory and practice. VIX products
that can mimic VIX bring possibilities of combining VIX to hedge funds for risk
reduction and downside protection (Dash and Moran, 2005). Although VIX futures are
based on spot VIX, they have different characteristics (Szado, 2009), which give VIX
futures and VIX index different returns and volatilities. The statistics of Table 4 and
Table 5 demonstrate possibilities of combining VIX futures to hedge funds for risk
reduction and downside protection, but also show the impacts of VIX products can hardly
achieve or outperform the impacts of VIX spot.
Figure 14 shows the portfolio value of $1 investment in HFRX with and without
VPD exposure from January 2007 to December 2009. Before the crisis those four
portfolios follow the same path with little deviations. Until the end of 2008, we do not see
significant differences among those values. The values of those four portfolios start to
diverge when there is a major crisis. Same as Figure 9 and Figure 10, Figure 14 confirms
the risk protection effect of VPD and it works well under crisis.
Figure 14: Addition of VPD to Hedge Fund Index Under Crisis

25
5.2 S&P 500 VIX Mid-term Futures Index (SPVIXMTR)
5.2.1 Correlation of Hedge Fund Returns and SPVIXMTR Changes
Table 6 and Table 7 illustrate that the relationship between SPVIXMTR and
hedge funds is similar with the relationship between VIX and hedge funds. The VIX
futures index has a strong negative correlation with the broad-based HFI and HFRX. Also,
it is negatively correlated with most narrow hedge fund strategies, and we find that the
correlation patterns are similar with the one with the broad-based hedge fund index.
Therefore, we use the broad-based hedge fund index to represent all hedge fund strategies
in our following analysis.
Table 6: Average Correlations of Credit Suisse Hedge Fund Indices Returns to
SPVIXMTR changes, August 2009 to May 2014
Credit Suisse Hedge Fund Index -0.6449
Credit Suisse Convertible Arbitrage Hedge Fund Index -0.4477
Credit Suisse Dedicated Short Bias Hedge Fund Index 0.6545
Credit Suisse Emerging Markets Hedge Fund Index -0.6301
Credit Suisse Equity Market Neutral Hedge Fund Index -0.5806
Credit Suisse Event Driven Hedge Fund Index -0.6858
Credit Suisse Fixed Income Arbitrage Hedge Fund Index -0.3172
Credit Suisse Global Macro Hedge Fund Index -0.0927
Credit Suisse Long/Short Equity Hedge Fund Index -0.7112
Credit Suisse Managed Futures Hedge Fund Index -0.0867
Credit Suisse Multi-Strategy Hedge Fund Index -0.7257
Table 7: Average Correlations of HFRX Hedge Fund Indices Returns to SPVIXMTR
changes, August 2009 to May 2014
HFRX Global Hedge Fund Index -0.6723
HFRX Event Driven Index -0.0500
HFRX Equity Hedge Index -0.6692
HFRX Relative Value Arbitrage Index -0.6406
HFRX Macro/CTA Index -0.5421
Figure 15 represents the rolling 30-month correlations of hedge funds with
SPVIXMRT. From January 2014, the correlations between SPVIXMTR and become
weaker. It might be caused by the economic recovery in US, and the returns of hedge
funds are more stable than before. Therefore, we can conclude that there is a negative,
asymmetric relationship between SPVIXMRT and hedge funds.

26
Figure 15 Rolling 30-Month Correlations of Hedge Fund Index with SPVIXMTR
5.2.2 Allocating SPVIXMTR to Hedge Fund Index
In order to determine how much SPVIXMTR we should allocate to hedge funds,
we first plot the efficient frontier of VIX futures index with hedge fund index (Figure 16).
Figure 16: Efficient Frontier with Addition of SPVIXMTR
We get the lowest volatility when we allocate approximately 10% VIX futures
index to HFI, while for HFRX, the combination of 15% VIX futures index and 85%
HFRX gives us the lowest risk.
Based on our observations above, we can decide our allocation strategy. For the
HFI, we have three allocation combinations:
100% HFI
90% HFI, 10% VIX Futures
80% HFI, 20% VIX Futures
100% HFRX
85% HFRX, 15% VIX Futures
80% HFRX, 20% VIX Futures

27
1. HFI with no SPVIXMTR
2. HFI with static 10% SPVIXMTR
3. HFI with tactical 0-10% SPVIXMTR
Same as usual, we define the tactical allocation as following: if in the past quarter,
the return of SPVIXMTR decreased by more than 20%, we set the weight of SPVIXMTR
to 10%; if the return of SPVIXMTR increased by more than 20% in last quarter, we set
the weight of SPVIXMTR to 0%; otherwise, the weight of SPVIXMTR equals to 5%.
Next, we plot the cumulative values of $1 hedge fund portfolio based on these
three combinations. From Figure 17, we can see the tactical allocation strategy gives us
more stable cumulative returns. The value of portfolios with SPVIXMTR increases
slower while with fewer fluctuations than how the value of HFI changes. The
SPVIXMTR can protect hedge funds when big drawdown occurs.
Figure 17: Addition of S&P 500 Mid-Term Futures Index to HFI
For the HFRX, we also have three allocation combinations.
1. HFI with no SPVIXMTR
2. HFI with static 15% SPVIXMTR
3. HFI with tactical 0-15% SPVIXMTR

28
The tactical strategy is similar with the previous one. Except when the return of
SPVIXMTR decreased by more than 20% in last quarter, we set the weight of
SPVIXMTR to 15%.
As Figure 18 illustrates, the performance of tactical strategy is also more stable
than hedge funds. When hedge fund returns falls down, the SPVIXMTR can help us to
reduce lost.
Figure 18: Addition of S&P 500 Mid-Term Futures Index to HFRX
Table 8 gives us more information about the allocation strategies. Although
portfolios with VIX futures exposure do not give superior returns, we can find that the
tactical strategy not only gives us a lower annualized standard deviation, but it also
improves the skewness and kurtosis of hedge fund portfolios.
Table 8: Summary of Portfolios with S&P 500 VIX Mid-Term Futures Index, 2009-2014
HFI HFRX
Risk-free rate: 0% no
SPVIXMTR static 10% SPVIXMTR
tactical 0-
10% SPVIXMTR
no SPVIXMTR
static 15% SPVIXMTR
tactical 0-
15% SPVIXMTR
Annualized Returns 7.41% 3.39% 5.56% 2.10% -1.90% 0.55%
Annualized Std 0.047 0.033 0.036 0.042 0.036 0.036
Sharpe Ratio 1.568 1.028 1.549 0.503 -0.522 0.154
Skewness -0.566 0.204 0.320 -0.925 -0.069 -0.273
Kurtosis 0.489 -0.214 0.266 1.206 -0.501 -0.247
29
In this section, we analyze VIX futures indices. It is obvious that during financial
crisis, the addition of VIX futures indices effectively protect hedge fund portfolios.
Starting from 2009, because economy is recovering from 2008 financial crisis, the
performance of hedge fund is generally good. As a result, the return of SPVIXMTR keep
decreasing, which is consistent with its negative correlation with hedge fund return, and
therefore allocating SPVIXMTR index to hedge funds does not give us a better return.
However, our analyses still provide support of risk reduction effect of VIX futures. We
believe that when financial crisis occurs, the performance of hedge funds with VIX
futures must be better than the hedge funds with no VIX futures.

30
6: Conclusions
We analyze VIX and hedge funds. Firstly, we confirm and expand the findings in
Dash and Moran (2005) by conducting analyses on two indices, Credit Suisse and Hedge
Fund Research Indices, and expand the end period of research from December 2004 to
May 2014. To explore the relationship between VIX and hedge fund indices, we not only
test the broad-based hedge fund indices, but also test the narrow hedge fund strategies.
We find that broad-based hedge fund indices and most narrow hedge fund indices are
negatively and asymmetrically correlated with VIX.
Then, we allocate VIX to broad-based hedge fund indices (HFI and HFRX). We
use Dash and Moran (2005)’s tactical allocation strategy. We pay more attention to the
period of 2008 financial crisis by including two sub-periods. Our finding is consistent
with Dash and Moran’s: allocating VIX index in hedge funds can protect hedge funds
from major drawdowns. Specifically, cumulative investment value, annualized return,
standard deviation, Sharpe ratio, skewness and kurtosis are improved.
We further expand Dash and Moran (2005) by conducting similar analyses on
VIX futures. We use the S&P 500 VIX Mid-term Futures Index and the CBOE VIX
Premium Strategy Index to represent VIX futures performance. The results suggest that
the addition of VIX futures indices can mimic the consequence of adding VIX, including
risk reduction and downside protection. Our analysis also shows that because some
differences between VIX index and VIX futures, such as costs, VIX futures brings less
significant beneficial impacts. Although the statistics during rising stage are not superior,
VIX futures is a nice feasible tool used to improve and protect hedge funds, especially
from sudden major drawdowns.

31
7: Limitations
The S&P 500 VIX Mid-Term Futures Index provides the risk exposure of longing
VIX futures, but the index is only available since 2009. We find there is back-tested data
till 2005 but is not available to us. Although we believe the index is a good proxy of
investing in VIX futures, missing the period of 2008 financial crisis the index cannot
provides us with the information of how VIX futures can hedge risk during downward.
The CBOE VIX Premium Strategy Index is different from S&P 500 VIX Mid-
Term Futures Index in the way that it tracks the value of a portfolio invests in Treasury
bill and shorts VIX futures. We have to short the index in order to get the long exposure
of VIX futures. Moreover, introduced in November 2007, the data before that is back-
tested. Therefore, some of the data we used are an estimated performance of the strategy
and limitations of back testing, such as over fitting, could influence our analyses results.

32
Appendices

33
Appendix 1: Code 1
VIX Index and Hedge Fund Indices
Correlations, Efficient Frontier and Allocation
Average and rolling 30-month correlations of Hedge Fund Returns with VIX changes
clear all;
close all;
clc;
%% Rolling 30-month correlations of Credit Suisse Hedge Fund Indices Returns with VIX
changes
filename1='HedgeFundData.xlsx';
[numHF,text] = xlsread(filename1);
ROR = numHF (1:end,[2:3:41]);
ROR = flip(ROR);
filename2='VIXdata.xlsx';
numVIX= xlsread(filename2,'Monthly returns');
numVIX= numVIX(:,1);
M=[numVIX, ROR];
corrla=corr(M);
avgCorrelation=[corrla(1,2:end)]';
Correlations=nan(168,14);
for i=31:168+30
Mroll=M(i-30:i-1,:);
corrla=corr(Mroll);
Correlations(i-30,:)=corrla(1,2:end);
end
text=flip(text(:,1));
date=text(30:end-2,1);
date=datenum(date);
plot(date,Correlations(:,[1,2,3,4,5,6,10,11,12,13,14]));
ylabel('Rolling 30-month correlations of Credit Suisse Hedge Fund Indexes Returns with VIX
changes');
datetick('x', 'mmmyy');
title('Figure 1: Rolling 30-month correlations of HFI with VIX');
%% Rolling 30-month correlations of Hedge Fund Research Indices Returns with VIX changes
filename1='HFRdata.xlsx';
[ROR,text] = xlsread(filename1);
ROR = flip(ROR);
filename2='VIXdata.xlsx';
numVIX= xlsread(filename2,'Monthly returns');

34
numVIX=numVIX(:,1);
M=[numVIX, ROR];
corrla=corr(M);
avgCorrelation=[corrla(1,2:end)]';
Correlations=nan(168,5);
for i=31:198
Mroll=M(i-30:i-1,:);
corrla=corr(Mroll);
Correlations(i-30,:)=corrla(1,2:end);
end
text=flip(text(:,1));
date=text(30:end-1,1);
date=datenum(date);
plot(date,Correlations(:,:));
ylabel('Rolling 30-month Correlations of HFRX Hedge Fund Indexes Returns to VIX changes');
datetick('x', 'mmmyy');
title('Figure 2: Rolling 30-month correlations of HFRX with VIX');
Efficient Frontier VIX allocate to Hedge Fund Indices Year 1998 to 2014 clear all;
close all;
clc;
%% Efficient Frontier VIX allocate to HFI
filename1='HedgeFundData.xlsx';
[numHF,text] = xlsread(filename1);
ROR = numHF (1:end,2);
ROR = flip(ROR);
filename2='VIXdata.xlsx';
VIXReturn = xlsread(filename2,'Monthly returns');
avgMonthlyROR=mean(ROR);
avgMonthlyVIXReturn=mean(VIXReturn);
annualizedROR=avgMonthlyROR*12
annualizedVIXRet=avgMonthlyVIXReturn*12
M=[ROR,VIXReturn];
vcv=cov(M).*12
n=1;
for wgt = 0:0.01:1
PortRet(n) = (1-wgt)*annualizedROR+wgt*annualizedVIXRet;
stnd(n) = sqrt((1-wgt)^2*vcv(1,1)+wgt^2*vcv(2,2)+2*vcv(1,2)*wgt*(1-wgt));
n=n+1;
end

35
plot(stnd,PortRet,'b');
title('Efficient Fontier Hedge Fund Index with VIX Index, Jan 1998 to May 2014');
xlabel('Annualized Std');
ylabel('Annualized Return');
hold on
%% Efficient Frontier VIX allocate to HFRX
filename1='HFRData.xlsx';
[numHF,text] = xlsread(filename1);
ROR = numHF (1:end,1);
ROR = flip(ROR*0.01);
filename2='VIXdata.xlsx';
VIXReturn = xlsread(filename2,'Monthly returns');
avgMonthlyROR=mean(ROR);
avgMonthlyVIXReturn=mean(VIXReturn);
annualizedROR=avgMonthlyROR*12
annualizedVIXRet=avgMonthlyVIXReturn*12
M=[ROR,VIXReturn];
vcv=cov(M).*12
n=1;
for wgt = 0:0.01:1
PortRet(n) = (1-wgt)*annualizedROR+wgt*annualizedVIXRet;
stnd(n) = sqrt((1-wgt)^2*vcv(1,1)+wgt^2*vcv(2,2)+2*vcv(1,2)*wgt*(1-wgt));
n=n+1;
end
plot(stnd,PortRet,'r');
Addition of VIX Index to Hedge Fund Index January 1998 - May 2014
clear all;
close all;
clc;
%% Addition of VIX Index to HFI January 1998 - May 2014
% tactical allocation 0% 5% 10%
filename1='HedgeFundData.xlsx';
[numHF,text] = xlsread(filename1);
ROR = numHF (1:end,2);
ROR = flip(ROR);
filename2='VIXdata.xlsx';
VIXReturn= xlsread(filename2,'Monthly returns');
VIXQReturn= xlsread(filename2,'Q returns');
wgt(1:3,1)=0.05;
n=4;
for i=1:65;

36
if VIXQReturn(i,2)>0.2
wgt(n:n+2,1)=0;
else if VIXQReturn(i,2)<-0.2
wgt(n:n+2,1)=0.1;
else
wgt(n:n+2,1)=0.05;
end
end
n=n+3;
end
cPortRet=nan(197,1);
PortRet=nan(197,1);
PortRet(1,1)= (1-wgt(1))*ROR(1,1)+wgt(1)*VIXReturn(1,1);
cPortRet(1,1)=PortRet(1,1)+1;
for i=2:size(ROR)
PortRet(i,1) = (1-wgt(i))*ROR(i,1)+wgt(i)*VIXReturn(i,1);
cPortRet(i,1) = (PortRet(i,1)+1)*cPortRet(i-1,1);
end
text=flip(text(:,1));
date=text(1:end-2,1);
date=datenum(date);
plot(date,cPortRet,'m');
title('Portfolio Value of $1 Investment with VIX index, January 1998 to May 2014')
datetick('x', 'mmmyy');
hold on
% no vix and static allocation
cPortRet=nan(197,11);
PortRet=nan(197,11);
wgt=0;
for j=1:11
PortRet(1,:)= (1-wgt)*ROR(1,1)+wgt*VIXReturn(1,1);
cPortRet(1,:)=PortRet(1,:)+1;
for i=2:size(ROR)
PortRet(i,j) = (1-wgt)*ROR(i,1)+wgt*VIXReturn(i,1);
cPortRet(i,j) = (PortRet(i,j)+1)*cPortRet(i-1,j);
end
wgt = wgt+0.01;
end
plot(date, cPortRet(:,[1 6 11]));
datetick('x', 'mmmyy');
%% Addition of VIX Index to HFRX January 1998 - May 2014
% tactical allocation 0% 5% 10%
filename1='HFRdata.xlsx';

37
[numHF,text] = xlsread(filename1);
ROR = numHF (1:end,1);
ROR = flip(ROR*0.01);
filename2='VIXdata.xlsx';
VIXReturn= xlsread(filename2,'Monthly returns');
VIXQReturn= xlsread(filename2,'Q returns');
wgt(1:3,1)=0.05;
n=4;
for i=1:65;
if VIXQReturn(i,2)>0.2
wgt(n:n+2,1)=0;
else if VIXQReturn(i,2)<-0.2
wgt(n:n+2,1)=0.1;
else
wgt(n:n+2,1)=0.05;
end
end
n=n+3;
end
cPortRet=nan(197,1);
PortRet=nan(197,1);
PortRet(1,1)= (1-wgt(1))*ROR(1,1)+wgt(1)*VIXReturn(1,1);
cPortRet(1,1)=PortRet(1,1)+1;
for i=2:size(ROR)
PortRet(i,1) = (1-wgt(i))*ROR(i,1)+wgt(i)*VIXReturn(i,1);
cPortRet(i,1) = (PortRet(i,1)+1)*cPortRet(i-1,1);
end
text=flip(text(:,1));
date=text(1:end-1,1);
date=datenum(date);
plot(date,cPortRet,'m');
title('Portfolio Value of $1 Investment in HFRX and VIX index, January 1998 to May 2014')
datetick('x', 'mmmyy');
hold on
% no vix and static allocation
cPortRet=nan(197,11);
PortRet=nan(197,11);
wgt=0;
for j=1:11
PortRet(1,:)= (1-wgt)*ROR(1,1)+wgt*VIXReturn(1,1);
cPortRet(1,:)=PortRet(1,:)+1;
for i=2:size(ROR)
PortRet(i,j) = (1-wgt)*ROR(i,1)+wgt*VIXReturn(i,1);
cPortRet(i,j) = (PortRet(i,j)+1)*cPortRet(i-1,j);

38
%stnd(n) = sqrt((1-wgt)^2*vcv(1,1)+wgt^2*vcv(2,2)+2*vcv(1,2)*wgt*(1-wgt));
end
wgt = wgt+0.01;
end
plot(date, cPortRet(:,[1 6 11]));
datetick('x', 'mmmyy');

39
Appendix 2: Code 2
VPD and Hedge Fund Indices
Correlations, Efficient Frontier and Allocation
Adjustment of VPD monthly return clear all;
close all;
clc
filename='VIXfuturesData.xlsx';
[num,text]= xlsread(filename,'vpddailyprice');
Datetext = datestr(text(2:end,1),'yyyy/mm/dd');
Dret=price2ret(num(:,1),[],'Periodic')+1;
filename2='TreasuryBills.xlsx';
TBret= xlsread(filename2);
TBret=TBret(:,6);
i = length(Dret(:,1));
k=1;
MRet = nan(119,1);
MRet(1) = Dret(1);
for j = 3:i
if Datetext(j-1,1:4) == Datetext(j,1:4)
if Datetext(j-1,6:7) == Datetext(j,6:7)
MRet(k) = Dret(j-1)*MRet(k);
else
k=k+1;
MRet(k)=Dret(j-1);
end
else
k=k+1;
MRet(k)=Dret(j-1);
j=j+1;
end
end
%adujst for returns of 3-month Treasury bills
MRet=MRet-TBret;
AdjMonthRet=MRet-1;
Average and rolling 30-month correlations of Hedge Fund Returns with VPD
%% Average and rolling 30-month correlations of HFI with VPD
filename1='HedgeFundData.xlsx';
[numHF,text] = xlsread(filename1);
ROR = numHF (1:end,2);

40
ROR = flip(ROR);
ROR = ROR(79:end,:);
M=[AdjMonthRet,ROR];
Correlations=nan(90,1);
for i=31:size(AdjMonthRet)+1
Mroll=M(i-30:i-1,:);
corrla=corr(Mroll);
Correlations(i-30,1)=corrla(1,2);
end
averageCorr=corr(M);
averageCorrelation(1,1)=averageCorr(1,2);
text=flip(text(:,1));
date=text(79+29:end-2,1);
date=datenum(date);
figure(1);
plot(date,Correlations(:,1));
ylabel('Rolling 30-month correlations of Hedge fund with VPD');
datetick('x', 'mmmyy');
title('Rolling 30-month correlations of Hedge fund with VPD');
hold on
%% Average and rolling 30-month correlations of HFRX with VPD
filename1='HFRData.xlsx';
[numHF,text] = xlsread(filename1);
ROR = numHF (1:end,1);
ROR = flip(ROR*0.01);
ROR = ROR(79:end,:);
M=[AdjMonthRet,ROR];
Correlations=nan(90,1);
for i=31:size(AdjMonthRet)+1
Mroll=M(i-30:i-1,:);
corrla=corr(Mroll);
Correlations(i-30,1)=corrla(1,2);
end
averageCorr=corr(M);
averageCorrelation(2,1)=averageCorr(1,2);
plot(date,Correlations(:,1),'r');
Addition of VPD to Hedge Fund Index January 2007 – December 2009
%% Addition of VPD to HFI January 2007 – December 2009
clear all;
close all;
clc
filename='VIXfuturesData.xlsx';

41
AdjMonthRet= xlsread(filename,'VPDR');
filename1='HedgeFundData.xlsx';
[numHF,text] = xlsread(filename1);
ROR = numHF (1:end,2);
ROR = flip(ROR);
ROR = ROR(79+30:79+30+35,:);
text=flip(text(:,1));
date=text(79+30:79+30+35,1);
date=datenum(date);
%% tactical
filename='VIXfuturesData.xlsx';
VPDQReturn= xlsread(filename,'VPDQreturns');
wgt(1:3,1)=-0.05;
n=4;
for i=1:39;
if VPDQReturn(i,1)>0.2
wgt(n:n+2,1)=0;
else if VPDQReturn(i,1)<-0.2
wgt(n:n+2,1)=-0.1;
else
wgt(n:n+2,1)=-0.05;
end
end
n=n+3;
end
wgt=wgt(30:30+35);
VPDReturn = AdjMonthRet(30:30+35);
PortRetT(1,1)= (1-wgt(1))*ROR(1,1)+wgt(1)*VPDReturn(1,1);
cPortRetT(1,1)=PortRetT(1,1)+1;
for i=2:size(ROR)
PortRetT(i,1) = (1-wgt(i))*ROR(i,1)+wgt(i)*VPDReturn(i,1);
cPortRetT(i,1) = (PortRetT(i,1)+1)*cPortRetT(i-1,1);
end
plot(date,cPortRetT,'m');
title('Portfolio Value of $1 Investment in HFRX and VPD, Januart 2007 to December 2009')
datetick('x', 'mmmyy');
hold on
%% Static allocation
cPortRet=nan(36,3);
PortRet=nan(36,3);
wgt=0;
for j=1:3
PortRet(1,j)= (1-wgt)*ROR(1,1)+wgt*VPDReturn(1,1);

42
cPortRet(1,j)=PortRet(1,j)+1;
for i=2:size(ROR)
PortRet(i,j) = (1-wgt)*ROR(i,1)+wgt*VPDReturn(i,1);
cPortRet(i,j) = (PortRet(i,j)+1)*cPortRet(i-1,j);
end
wgt = wgt-0.05;%short
end
monthlyRet(:,1:3)=PortRet;
plot(date,cPortRet(:,[1:3]));
datetick('x', 'mmmyy');
%% Addition of VPD to HFRX January 2007 – December 2009
clear all;
close all;
clc
filename='VIXfuturesData.xlsx';
AdjMonthRet= xlsread(filename,'VPDR');
filename1='HFRData.xlsx';
[numHF,text] = xlsread(filename1);
ROR = numHF (1:end,1);
ROR = flip(ROR*0.01);
ROR = ROR(79+30:79+30+35,:);
text=flip(text(:,1));
date=text(79+30:79+30+35,1);
date=datenum(date);
%% tactical
filename='VIXfuturesData.xlsx';
VPDQReturn= xlsread(filename,'VPDQreturns');
wgt(1:3,1)=-0.05;
n=4;
for i=1:39;
if VPDQReturn(i,1)>0.2
wgt(n:n+2,1)=0;
else if VPDQReturn(i,1)<-0.2
wgt(n:n+2,1)=-0.1;
else
wgt(n:n+2,1)=-0.05;
end
end
n=n+3;
end
wgt=wgt(30:30+35);
VPDReturn = AdjMonthRet(30:30+35);
PortRetT(1,1)= (1-wgt(1))*ROR(1,1)+wgt(1)*VPDReturn(1,1);
cPortRetT(1,1)=PortRetT(1,1)+1;

43
for i=2:size(ROR)
PortRetT(i,1) = (1-wgt(i))*ROR(i,1)+wgt(i)*VPDReturn(i,1);
cPortRetT(i,1) = (PortRetT(i,1)+1)*cPortRetT(i-1,1);
end
plot(date,cPortRetT,'m');
title('Portfolio Value of $1 Investment in HFRX and VPD, Januart 2007 to December 2009')
datetick('x', 'mmmyy');
hold on
%% Static allocation
cPortRet=nan(36,3);
PortRet=nan(36,3);
wgt=0;
for j=1:3
PortRet(1,j)= (1-wgt)*ROR(1,1)+wgt*VPDReturn(1,1);
cPortRet(1,j)=PortRet(1,j)+1;
for i=2:size(ROR)
PortRet(i,j) = (1-wgt)*ROR(i,1)+wgt*VPDReturn(i,1);
cPortRet(i,j) = (PortRet(i,j)+1)*cPortRet(i-1,j);
end
wgt = wgt-0.05;
end
monthlyRet(:,1:3)=PortRet;
plot(date,cPortRet(:,[1:3]));
datetick('x', 'mmmyy');

44
Appendix 3: Code 3
S&P 500 Mid-Term VIX Futures Index and Hedge Fund Indices
Correlations, Efficient Frontier and Allocation
%Import S&P 500 Midterm VIX futures index data from Excel
filename='VIXfuture_MidTerm.xlsx';
[num,text]= xlsread(filename);
%Set date type
Datetext = datestr(text(2:end,1),'yyyy/mm/dd');
%Calculate the daily return
DailyRet = price2ret(num(1:end),[],'Periodic')+1;
%Count number of days
i = length(DailyRet(:,1));
%Calculate monthly return
k=1;
Ret = nan(58,1);
Ret(1) = DailyRet(1);
for j = 3:i
if Datetext(j-1,1:4) == Datetext(j,1:4)
if Datetext(j-1,6:7) == Datetext(j,6:7)
Ret(k) = DailyRet(j-1)*Ret(k);
else
k=k+1;
Ret(k)=DailyRet(j-1);
end
else
k=k+1;
Ret(k)=DailyRet(j-1);
j=j+1;
end
end
MonthRet=Ret(1:end)-1;
%Import CSHFI data from Excel
filename='HedgeFundData.xlsx';
[num2, text2]= xlsread(filename);
CSROR = num2 (1:end-1, [2:3:41]);
CSROR = flip(CSROR);
%Calculate rolling correlation b/w CSHFI&SPVIXMTR
CorrMatrixCS = nan(29,14);
for j = 1:14
for i = 30:58

45
CorrMatrixCS(i-29,j) = corr(MonthRet(i-29:i), CSROR(i+187-29:i+187, j));
end
end
CSdateLabel = flip(text2(3:248,1));
CSDate = datenum(CSdateLabel(218:246));
%Import HFR data from Excel
filename='hfrx_historical_Summary.xlsx';
[num3, text3]= xlsread(filename);
HFRROR = flip(num3);
HFRROR=HFRROR*0.01;
%Calculate rolling correlation b/w HFR&SPVIXMTR
CorrMatrixHFR = nan(29,5);
for j = 1:5
for i = 30:58
CorrMatrixHFR(i-29,j) = corr(MonthRet(i-29:i), HFRROR(i+139-29:i+139, j));
end
end
HFRdateLabel = CSdateLabel(50:end);
HFRDate = datenum(HFRdateLabel(169:end));
% Plot the rolling correlation
figure(1)
plot(CSDate,CorrMatrixCS(:,1),HFRDate,CorrMatrixHFR(:,1));
datetick('x', 'mmmyy', 'keepticks')
% Calculate average yearly return for CS Hedge fund.
n=1;
for i = 1:12:240
AnnualROR(n) = sum(CSROR(i:i+11,1));
n=n+1;
end
AvgCSROR = mean(AnnualROR(17:20));
%Calculate average yearly return for VIX index.
n=1;
for i = 6:12:53
AnnualMonthRet(n) = sum(MonthRet(i:i+11,1));
n=n+1;
end
AvgVIXRet = mean(AnnualMonthRet);
%Calculate portfolio return and standard deviation
n=1;
CScovVIX=cov(AnnualROR(17:20),AnnualMonthRet);

46
for wgt = 0:0.001:0.15
PortRet(n) = (1-wgt)*AvgCSROR+wgt*AvgVIXRet;
stnd(n) = sqrt((1-
wgt)^2*var(AnnualROR(17:20))+wgt^2*var(AnnualMonthRet)+2*CScovVIX(1,2)*wgt*(1-
wgt));
n=n+1;
end
% Calculate average yearly return for HFR.
n=1;
for i = 1:12:192
AnnualHFRROR(n) = sum(HFRROR(i:i+11,1));
n=n+1;
end
AvgHFRROR = mean(AnnualHFRROR(13:16));
%Calculate portfolio return and standard deviation
n=1;
HFRcovVIX=cov(AnnualHFRROR(13:16),AnnualMonthRet);
for wgt = 0:0.001:0.15
HFRPortRet(n) = (1-wgt)*AvgHFRROR+wgt*AvgVIXRet;
HFRstnd(n) = sqrt((1-
wgt)^2*var(AnnualHFRROR(13:16))+wgt^2*var(AnnualMonthRet)+2*HFRcovVIX(1,2)*wgt*(
1-wgt));
n=n+1;
end
%Plot efficient frontier
figure(3);
plot(stnd,PortRet,HFRstnd,HFRPortRet);
% Calculate cumulative return with static VIX
PortMonthRet=zeros(58,11);
m=1;
for wgt2 = 0:0.01:0.2
PortMonthRet(1,m)= (1-wgt2)*CSROR(188,1)+wgt2*MonthRet(1)+1;
PortMonthRet(2,m) = ((1-
wgt2)*CSROR(189,1)+wgt2*MonthRet(2)+1)*(PortMonthRet(1,m));
for n=2:57
PortMonthRet(n+1,m) = ((1-
wgt2)*CSROR(n+187+1,1)+wgt2*MonthRet(n+1)+1)*(PortMonthRet(n,m));
end
m=m+1;
end
% Import SPVIXMTR quarterly changes data from Excel
filename='QChange_VIXfutureMT.xlsx';

47
[Qchange,Quater]= xlsread(filename);
% Calculate cumulative return with tactical VIX
PortMonthRet2=zeros(58,1);
wgt3 = 0.05;
PortMonthRet2(1)= (1-wgt3)*CSROR(188,1)+wgt3*MonthRet(1)+1;
PortMonthRet2(2) = ((1-wgt3)*CSROR(189,1)+wgt3*MonthRet(2)+1)*(PortMonthRet2(1));
PortMonthRet2(3) = ((1-wgt3)*CSROR(190,1)+wgt3*MonthRet(3)+1)*(PortMonthRet2(2));
PortMonthRet2(4) = ((1-wgt3)*CSROR(191,1)+wgt3*MonthRet(4)+1)*(PortMonthRet2(3));
PortMonthRet2(5) = ((1-wgt3)*CSROR(192,1)+wgt3*MonthRet(5)+1)*(PortMonthRet2(4));
k=1;
for n=5:57
if mod(n+187,3) == 0
if Qchange(k)>0.2
wgt3 = 0;
else if Qchange(k)<-0.2
wgt3 = 0.1;
else
wgt3 = 0.05;
end
end
k=k+1;
end
PortMonthRet2(n+1) = ((1-
wgt3)*CSROR(n+188,1)+wgt3*MonthRet(n+1)+1)*(PortMonthRet2(n));
end
% Plot cumulative returns
figure(4)
plot(datenum(CSdateLabel(189:246)),PortMonthRet(:,1),datenum(CSdateLabel(189:246)),PortM
onthRet(:,11),datenum(CSdateLabel(189:246)),PortMonthRet2);
datetick('x', 'mmmyy', 'keepticks')

48
Bibliography
Works Cited
Billio, M., M. Getmansky, & L. Pilizzon ,(2009). Crisis and Hedge Fund Risk. University Ca'
Foscari of Venice, Dept. of Economics Research Paper Series No. 10-08; UMASS-
Amherst Working Paper; Yale ICF Working Paper No. 07-14; University Ca' Foscari of
Venice, Dept. of Economics Research Paper Series No. 10-08.
Black, K.H., (2006). Improving Hedge Fund Risk Exposures by Hedging Equity Market
Volatility, or How the VIX Ate My Kurtosis. The Journal of Trading, 6-15
Chicago Board Options Exchange. (2009). The CBOE Volatility Index – VIX. Retrieved from
http://www.cboe.com/micro/vix/vixwhite.pdf
Chicago Board Options Exchange. (2007). Description of VIX Premium Index – VPD and VPN.
Retrieved from http://www.cboe.com/micro/vpd/VixPremiumIndexVPDVPN.pdf
Chen, H.C., S. Chung, & K. Ho, (2010). The diversification effects of volatility-related assets.
Journal of Banking and Finance
Dash, S., & Moran, M. T. (2005). VIX as a Companion for Hedge Fund Portfolios. The Journal
of Alternative Investments, 8(3), 75-80.
Hibbert, A.M, R.T. Daigler, & B. Dupoyet, (2008). A behavioral explanation for the negative
asymmetric return-volatility relation. Journal of Banking and Finance, vol. 32(10), 2254-
2266
Lachini, M., (2014). EFTs and VIX: The Facts and the Risk. Retrieved from
http://www.schwab.com/public/schwab/nn/articles/ETFs-and-VIX-The-Facts-and-the-
Risk
Low, C., (2004). The fear and exuberance from implied volatility of S&P 100 index options.
Journal of Business 77, 527–546
Morgan, J., (2013). Hedge funds: Statistical arbitrage, high frequency trading and their
consequences for the environment of businesses. Critical perspectives on international
business, Vol. 9 Iss: 4, pp.377 – 397
Rouah, F., Gregoriou, G. N., & Karavas, V. N., (2003). Hedge funds: strategies, risk assessment,
and returns. Washington, DC: Beard Books.
Whaley, R.E., (2009). Understanding the VIX. The Journal of Portfolio Management. 98-105
Swedroe, Larry, (2013). Do VIX futures hedge stock market risk?. Retrieved from
http://www.cbsnews.com/news/do-vix-futures-hedge-stock-market-risk/

49
Szado, E., (2009). VIX futures and options: A case study of portfolio diversification during the
2008 financial crisis. The Journal of Alternative Investments, 68-85
S&P Dow Jones Indices. (April, 2014). S&P VIX Futures Indices Methodology. Retrieved from
http://customindexcalculations.com/indices/strategy/sp-500-vix-mid-term-index-mcap
Zhu J.E., & Y. Zhu, (2006). VIX futures. The Journal of Futures Markets, Vol. 26, No. 6, 521–
531
Works Consulted
Chicago Board Options Exchange. New methodology: VIX data for 2004 to present. Retrieved
from http://www.cboe.com/micro/vix/historical.aspx
Chicago Board Options Exchange. New methodology: VIX data for 1990 to 2003. Retrieved
from http://www.cboe.com/micro/vix/historical.aspx
Chicago Board Options Exchange. VPD Price History. Retrieved from
http://www.cboe.com/micro/vpd/
Chicago Board Options Exchange. (2009). Using VIX in a Diversified Portfolio. Retrieved from
http://www.cboe.com/publish/ResearchNotes/research_notesV2.pdf
Credit Suisse Hedge Fund Indices. Retrieved from http://www.hedgeindex.com
Goldman Sachs Global Investment Research. (November, 2007). Volatility as an Asset. Retrieved
from http://www.altavra.com/docs/thirdparty/volatility-as-an-asset-class.pdf
HFR Database. Retrieved from https://www.hedgefundresearch.com/hfrx_reg/index.php
S&P Dow Jones Indices. Retrieved from http://customindexcalculations.com