Vitold Henisz slides: “Financial Returns to Stakeholder Capital: Tying Community Investment Back...
30
NEWMONT GHANA FV TOOL PROJECT Witold Henisz, Deloi/e & Touche Professor of Management, The Wharton School, University of Pennsylvania
-
Upload
sustainable-brands -
Category
Economy & Finance
-
view
244 -
download
1
Transcript of Vitold Henisz slides: “Financial Returns to Stakeholder Capital: Tying Community Investment Back...

NEWMONT GHANA
FV TOOL PROJECT
Witold Henisz, Deloi/e & Touche Professor of Management, The Wharton School, University of Pennsylvania
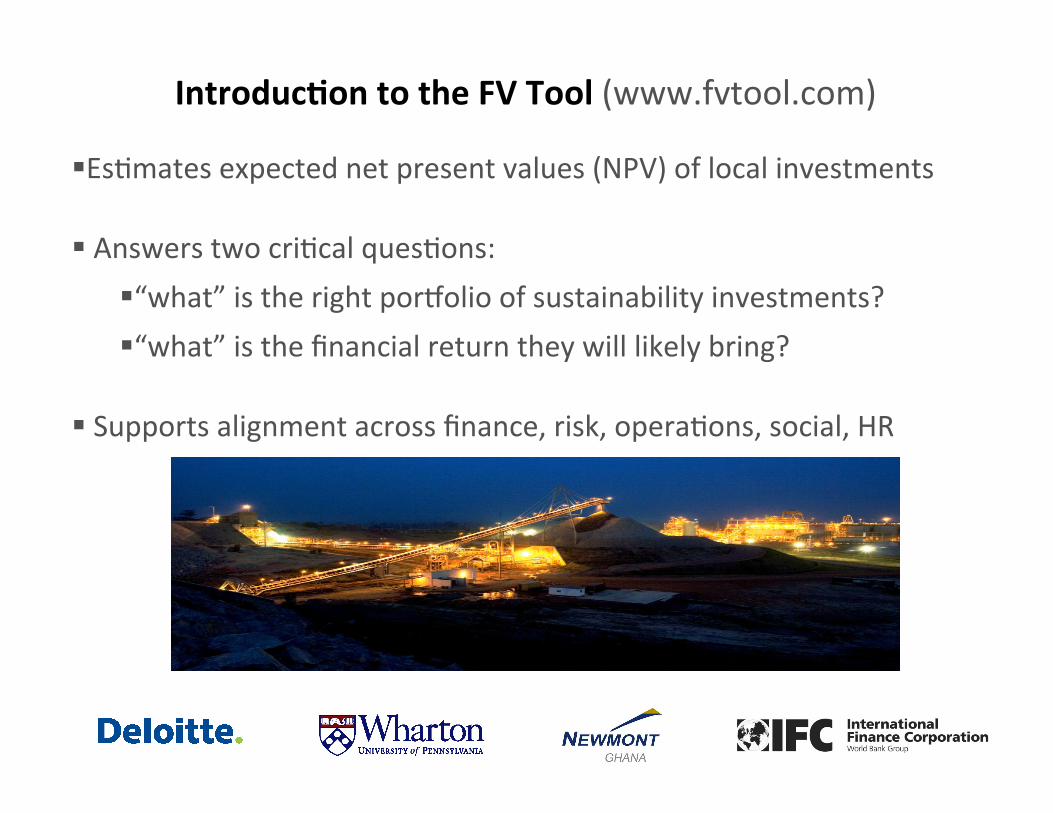
IntroducAon to the FV Tool (www.fvtool.com)
2
§ Es0mates expected net present values (NPV) of local investments
§ Answers two cri0cal ques0ons: § “what” is the right porDolio of sustainability investments? § “what” is the financial return they will likely bring?
§ Supports alignment across finance, risk, opera0ons, social, HR
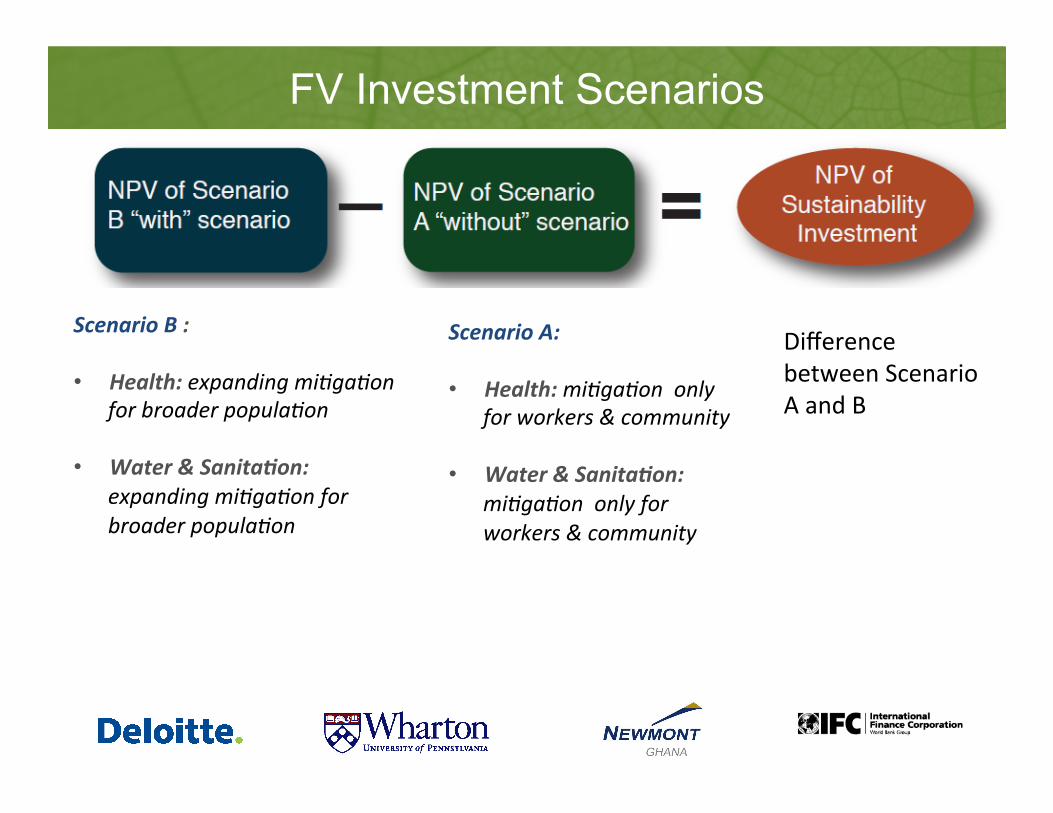
FV Investment Scenarios
Scenario B : • Health: expanding mi+ga+on
for broader popula+on • Water & Sanita2on:
expanding mi+ga+on for broader popula+on
Scenario A: • Health: mi+ga+on only
for workers & community
• Water & Sanita2on: mi+ga+on only for workers & community
Difference between Scenario A and B
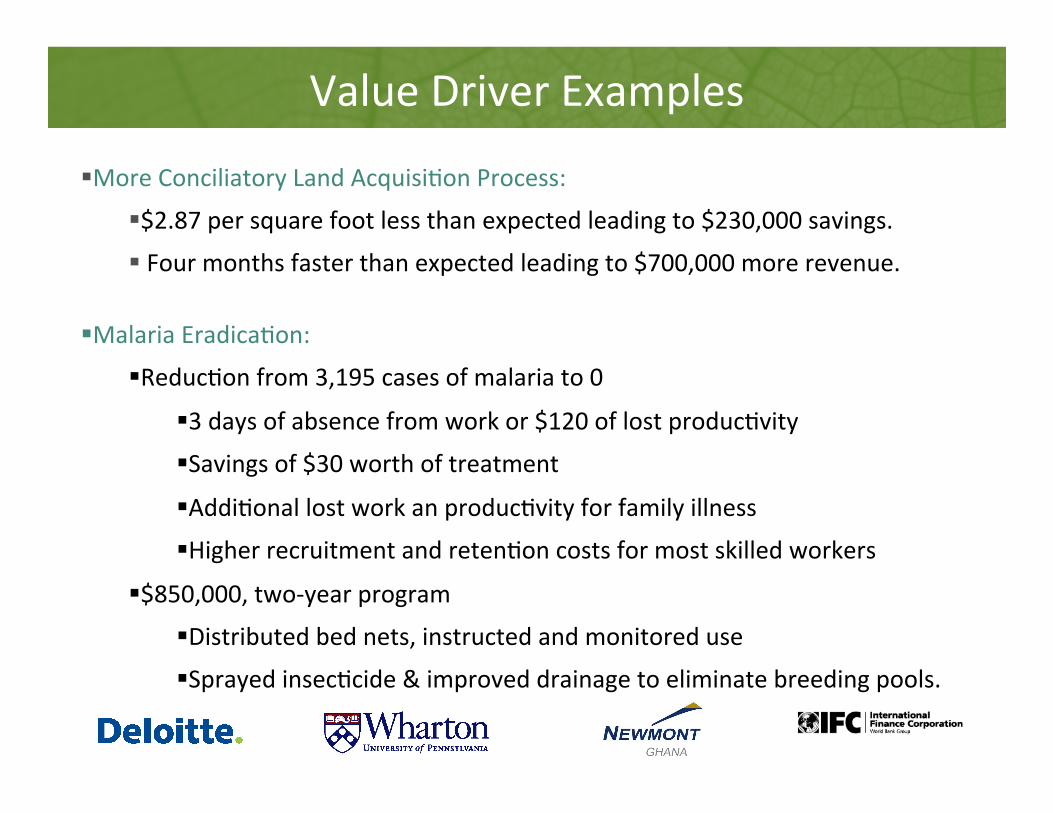
Value Driver Examples
§ More Conciliatory Land Acquisi0on Process:
§ $2.87 per square foot less than expected leading to $230,000 savings. § Four months faster than expected leading to $700,000 more revenue.
§ Malaria Eradica0on:
§ Reduc0on from 3,195 cases of malaria to 0
§ 3 days of absence from work or $120 of lost produc0vity
§ Savings of $30 worth of treatment
§ Addi0onal lost work an produc0vity for family illness
§ Higher recruitment and reten0on costs for most skilled workers
§ $850,000, two-‐year program
§ Distributed bed nets, instructed and monitored use
§ Sprayed insec0cide & improved drainage to eliminate breeding pools.
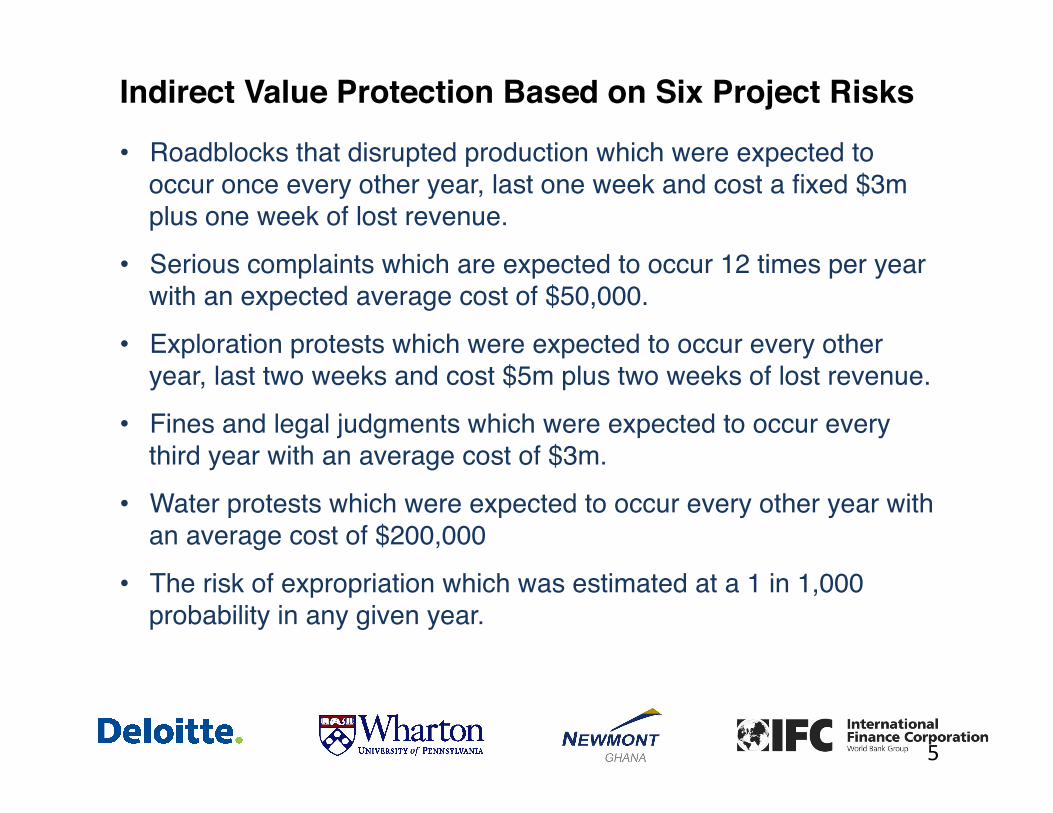
Indirect Value Protection Based on Six Project Risks!
• Roadblocks that disrupted production which were expected to occur once every other year, last one week and cost a fixed $3m plus one week of lost revenue."
• Serious complaints which are expected to occur 12 times per year with an expected average cost of $50,000. "
• Exploration protests which were expected to occur every other year, last two weeks and cost $5m plus two weeks of lost revenue."
• Fines and legal judgments which were expected to occur every third year with an average cost of $3m."
• Water protests which were expected to occur every other year with an average cost of $200,000"
• The risk of expropriation which was estimated at a 1 in 1,000 probability in any given year."
5
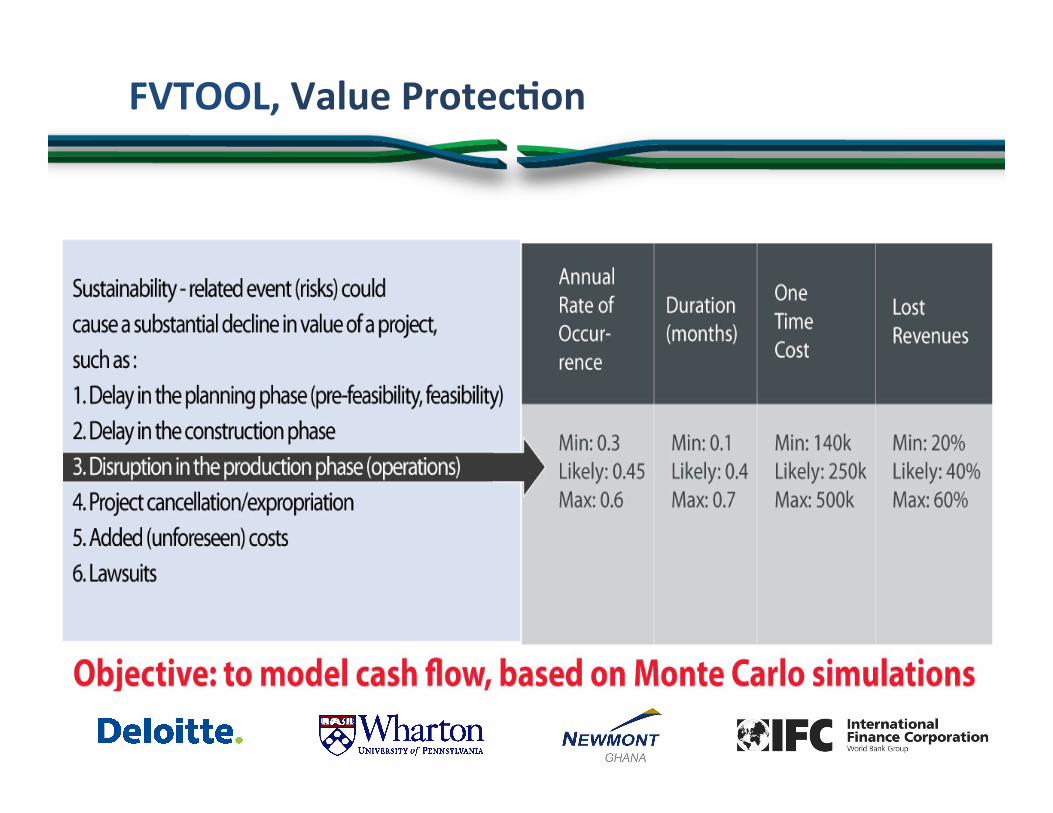
FVTOOL, Value ProtecAon
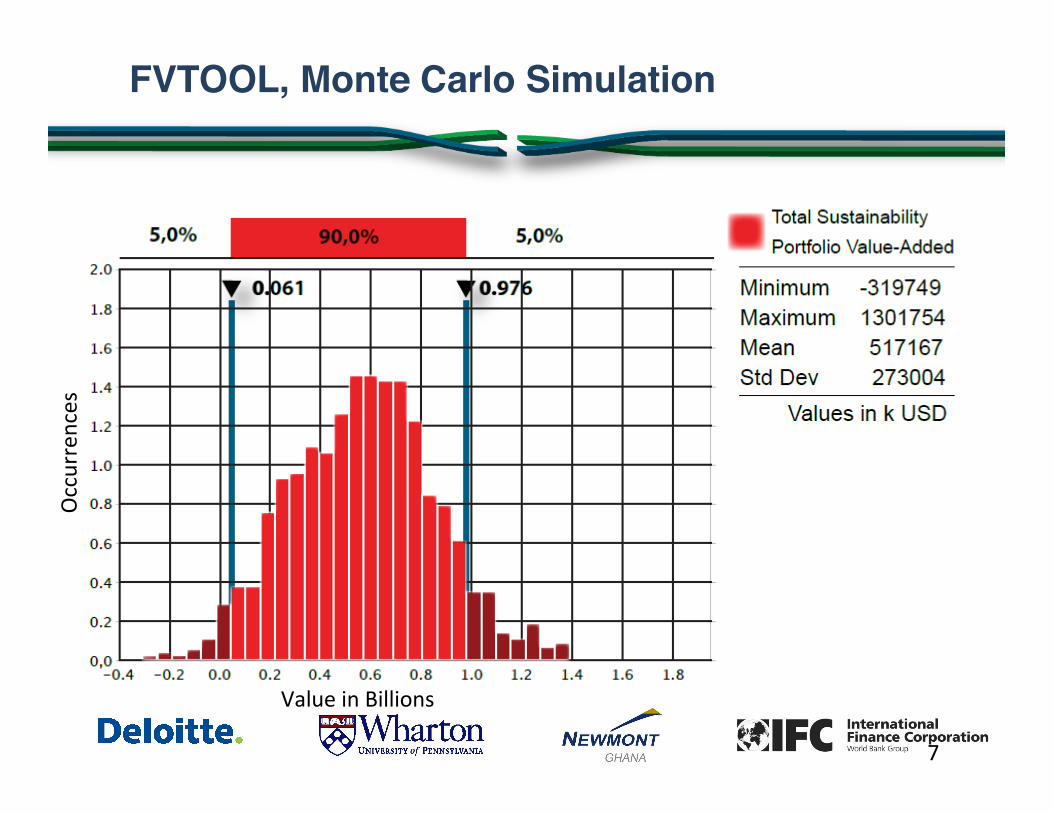
FVTOOL, Monte Carlo Simulation!
Value in Billions
Occurrences
7
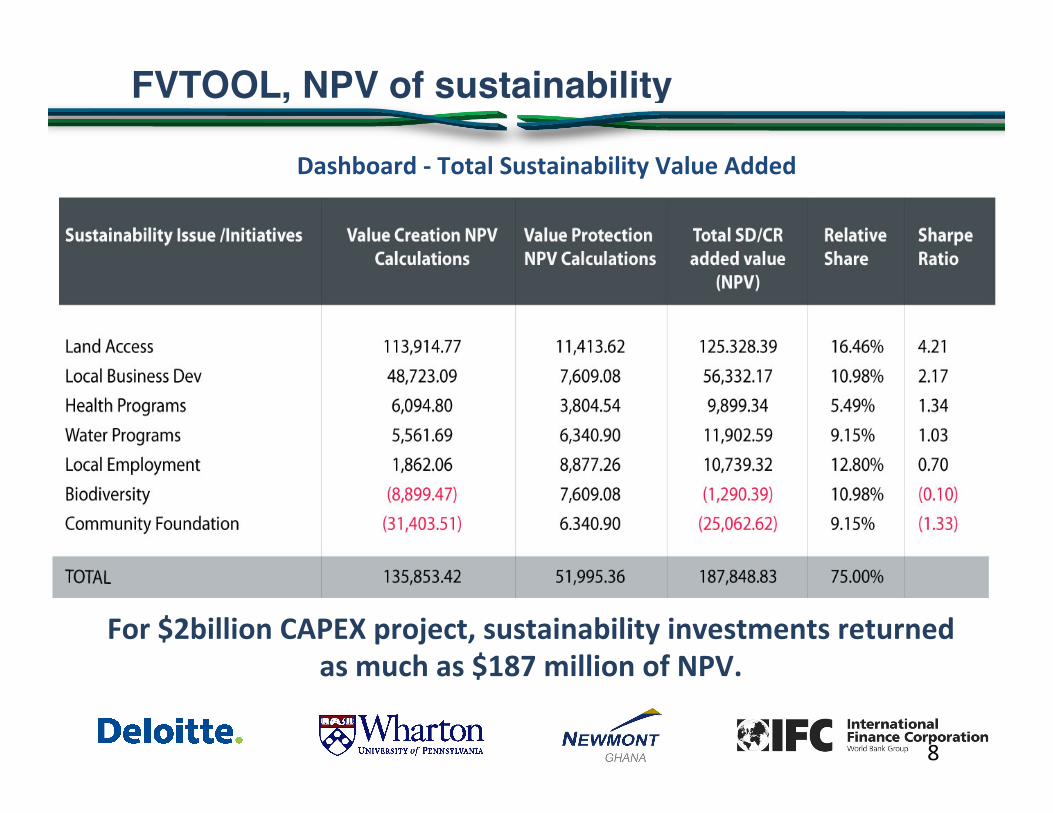
FVTOOL, NPV of sustainability!
Dashboard -‐ Total Sustainability Value Added
For $2billion CAPEX project, sustainability investments returned as much as $187 million of NPV.
8

Notable Quotes: Sustainability Team When we first heard of it, those of us on the social side were happy to get something that would help Finance understand us. We are more confident in cos+ng the programs that we do. This puts us in a much be@er posi+on with finance. In previous mee+ngs, other departments had figures and we had to talk to explain. Now we are puDng figures to our words just like other departments.
The change within the ESR team is marked. What are these risks that we are trying to mi+gate? Are their costs jus+fied in terms or risk mi+ga+on? Previously program owners were not connec+ng the dots to risk mi+ga+on or value crea+on. Now we challenge the numbers. Previously, we had no framework to evaluate. People are now trying to highlight the value of their ini+a+ves for the business not just for stakeholders.
Notable Quotes: Finance Team My biggest surprise was that it is possible for the ESR team to have a conversa+on in financial terms. Every conversa+on I had with them before, … they never could ar+culate their assump+ons and acknowledge costs and benefits. Now they can and do. They have their act together and can explain a business case … Previously, they were not able to see their business case. … Finance and [Environment and Social Responsibility] are now working together much be@er than before. Just those changes alone jus+fy the effort put into the pilot.
Ebenezer Kyere-‐Buabeng , Finance Newmont Ghana Gold
In the last business planning mee+ng, I saw a huge improvement in SR's presenta+on of budget and supported by data of the business benefits of SR programs. The mee+ng went very smoothly compared to previous mee+ngs.
Lester Ampong, Senior Business Planning Analyst, Newmont Ghana
Gold
Notable Quotes: Group Executive
Quan+fying the net present value of sustainability ini+a+ves at Newmont’s Ahafo mine in Ghana had finally allowed the company to get “Beyond NPV.”
Nick Cocs, Group Execu0ve, ESR
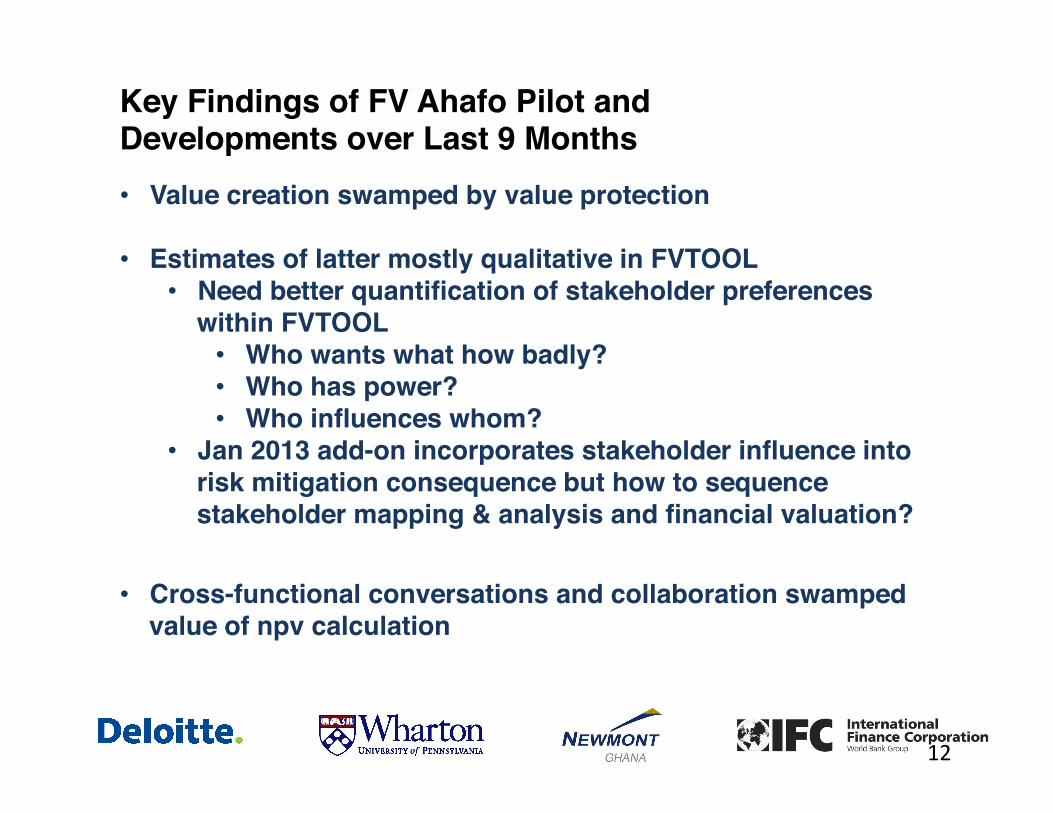
Key Findings of FV Ahafo Pilot and Developments over Last 9 Months!• Value creation swamped by value protection!
• Estimates of latter mostly qualitative in FVTOOL!• Need better quantification of stakeholder preferences
within FVTOOL!• Who wants what how badly?!• Who has power?!• Who influences whom?!
• Jan 2013 add-on incorporates stakeholder influence into risk mitigation consequence but how to sequence stakeholder mapping & analysis and financial valuation?!
• Cross-functional conversations and collaboration swamped value of npv calculation!
! 12
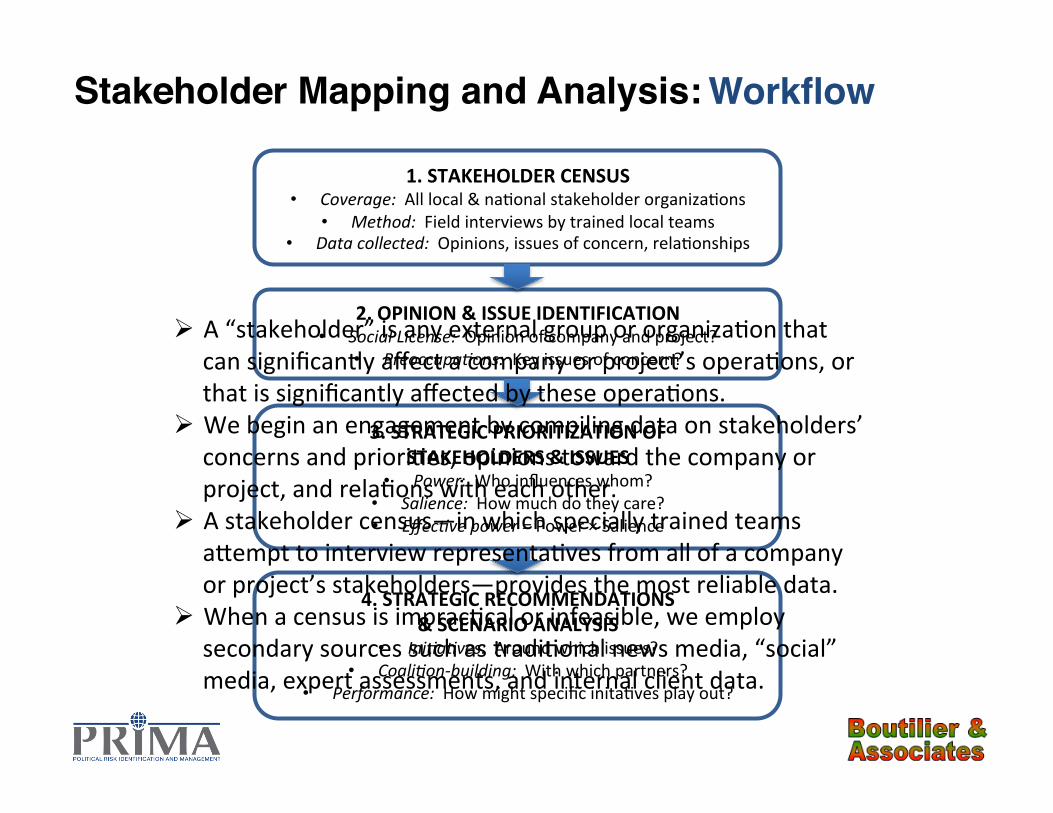
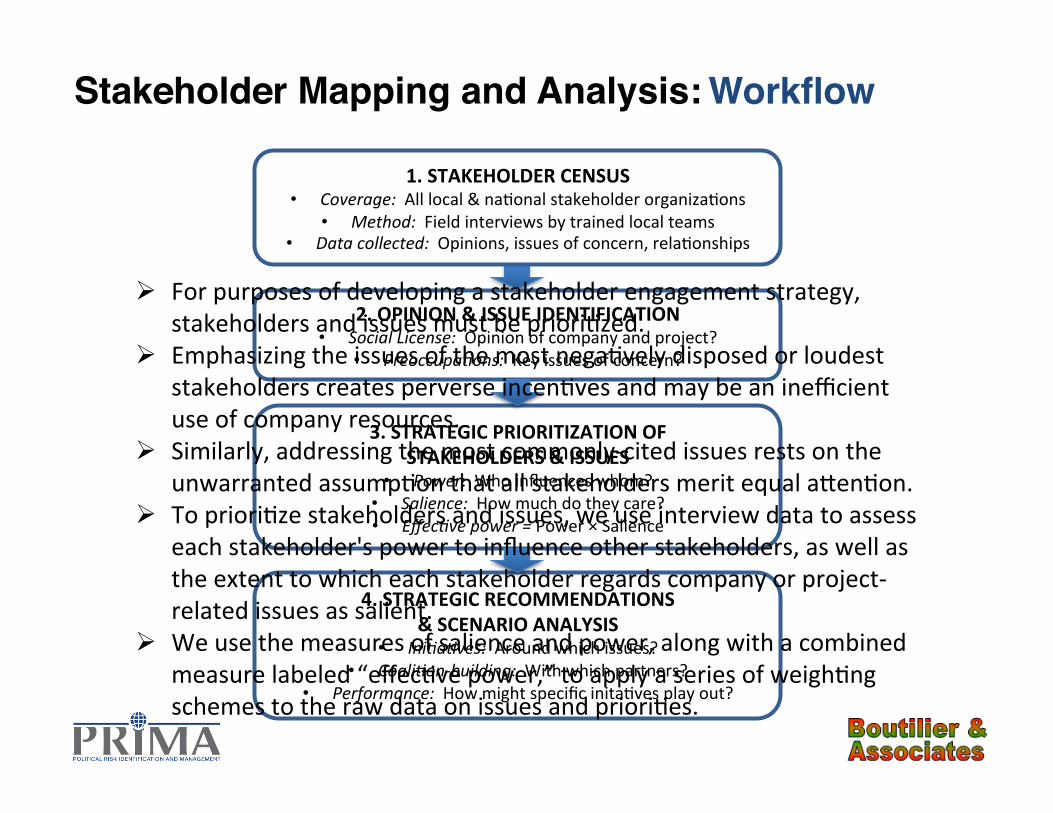
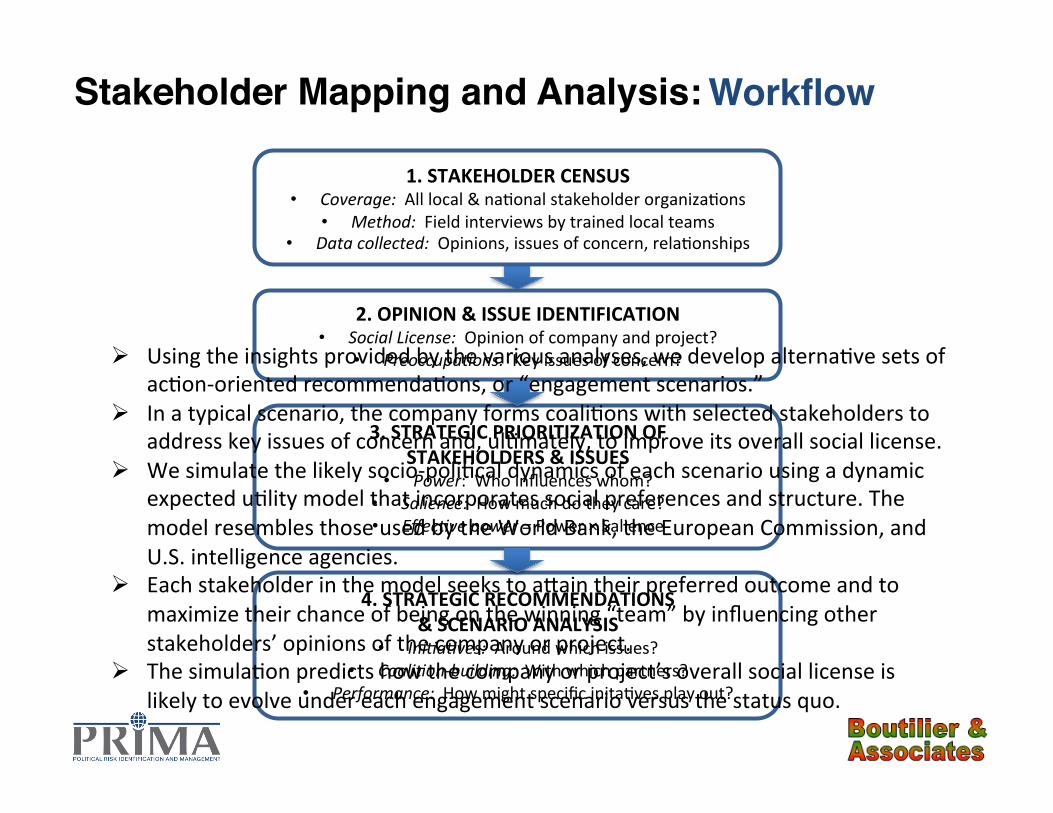
4. STRATEGIC RECOMMENDATIONS & SCENARIO ANALYSIS
• Ini+a+ves: Around which issues? • Coali+on-‐building: With which partners?
• Performance: How might specific inita0ves play out?
3. STRATEGIC PRIORITIZATION OF STAKEHOLDERS & ISSUES
• Power: Who influences whom? • Salience: How much do they care? • Effec+ve power = Power × Salience
2. OPINION & ISSUE IDENTIFICATION • Social License: Opinion of company and project?
• Preoccupa+ons: Key issues of concern?
1. STAKEHOLDER CENSUS • Coverage: All local & na0onal stakeholder organiza0ons
• Method: Field interviews by trained local teams • Data collected: Opinions, issues of concern, rela0onships
Ø A “stakeholder” is any external group or organiza0on that can significantly affect a company or project’s opera0ons, or that is significantly affected by these opera0ons.
Ø We begin an engagement by compiling data on stakeholders’ concerns and priori0es, opinions toward the company or project, and rela0ons with each other.
Ø A stakeholder census—in which specially trained teams acempt to interview representa0ves from all of a company or project’s stakeholders—provides the most reliable data.
Ø When a census is imprac0cal or infeasible, we employ secondary sources such as tradi0onal news media, “social” media, expert assessments, and internal client data.
Stakeholder Mapping and Analysis:!Workflow!

Social License:
* Adapted from Thomson & Bou+lier (2011)
Four Levels!
Ø Psychological iden2fica2on. Stakeholders feel a sense of “co-‐ownership” and advocate on behalf of company proposals.
Ø Approval. Stakeholders perceive company proposals as credible.
Ø Acceptance. Stakeholders evaluate company proposals on a case-‐by-‐case basis.
Ø Withheld/withdrawn. Stakeholders’ nega0ve percep0ons result in ac0ons that compromise access to finance, legal license, material, labor, markets, supply chain, etc.
Social license to operate (SLO): stakeholder percep+ons of the acceptability of a company & its local opera+ons at a point in +me.
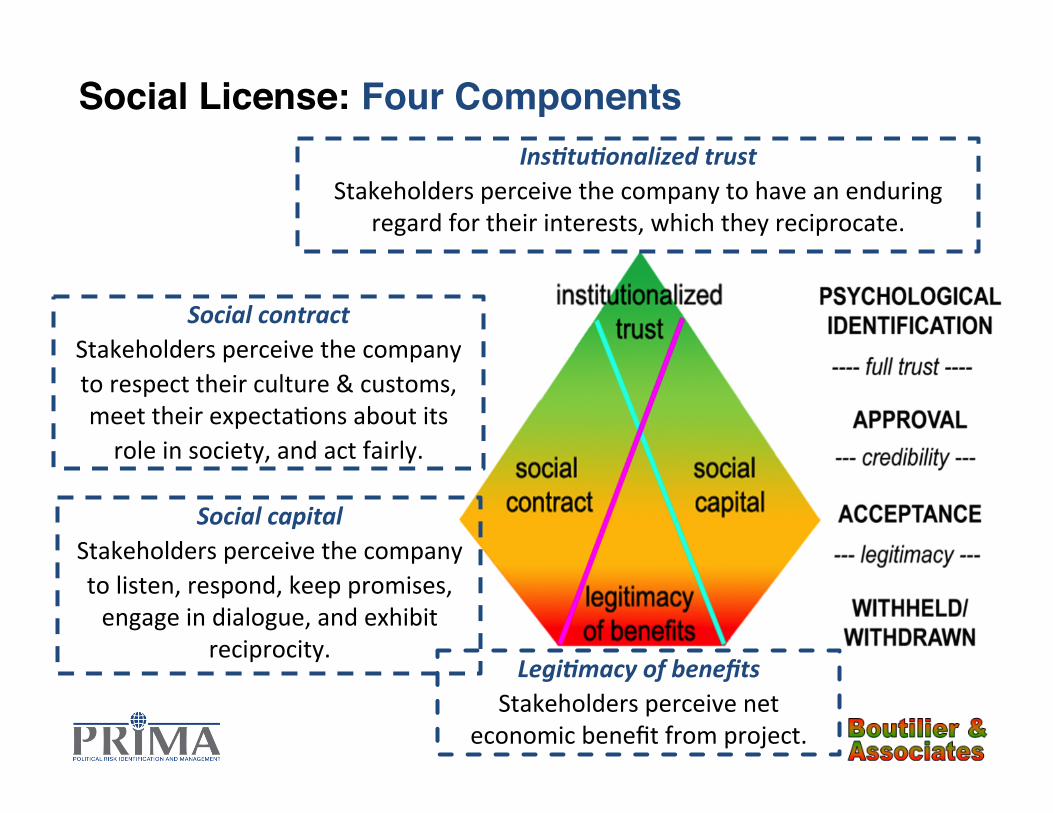
Social contract Stakeholders perceive the company to respect their culture & customs, meet their expecta0ons about its role in society, and act fairly.
Legi2macy of benefits Stakeholders perceive net
economic benefit from project.
Ins2tu2onalized trust Stakeholders perceive the company to have an enduring
regard for their interests, which they reciprocate.
Social capital Stakeholders perceive the company to listen, respond, keep promises, engage in dialogue, and exhibit
reciprocity.
Four Components!Social License:

Social contract Stakeholders perceive the company to respect their culture & customs, meet their expecta0ons about its role in society, and act fairly.
Ins2tu2onalized trust Stakeholders perceive the company to have an enduring
regard for their interests, which they reciprocate.
Social capital Stakeholders perceive the company to listen, respond, keep promises, engage in dialogue, and exhibit
reciprocity. Legi2macy of benefits
Stakeholders perceive net economic benefit from project.
Four Components!Social License:
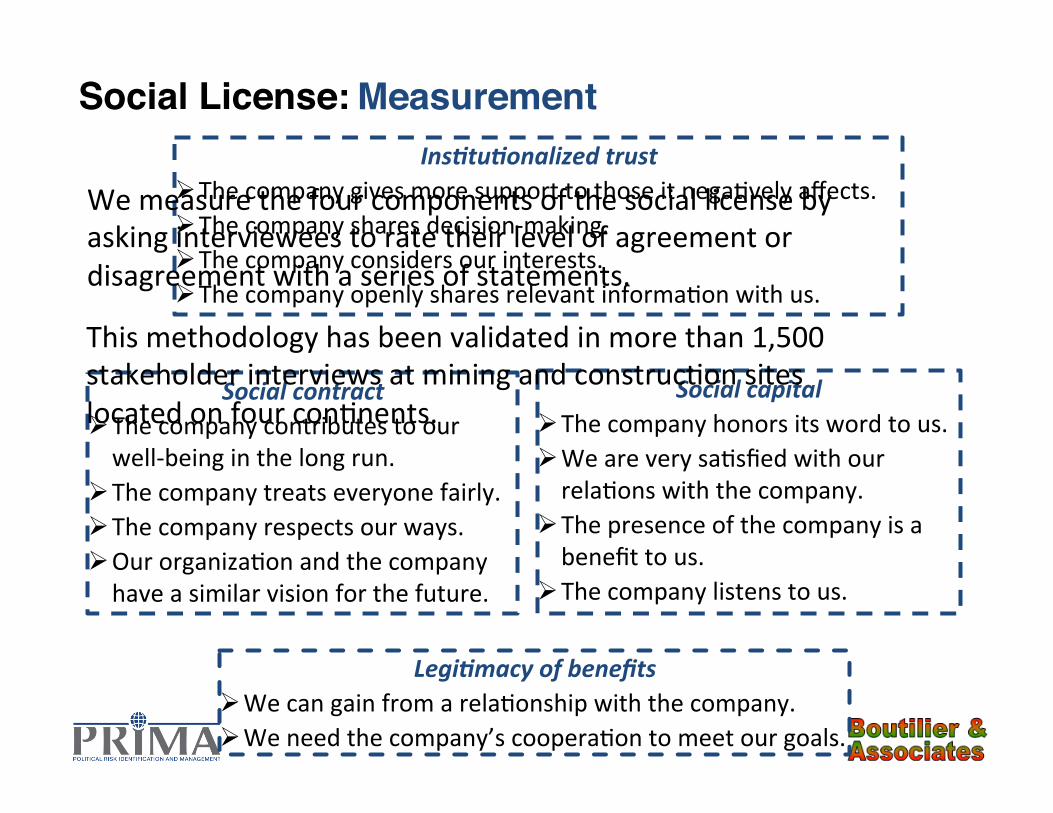
Social contract Ø The company contributes to our well-‐being in the long run.
Ø The company treats everyone fairly. Ø The company respects our ways. Ø Our organiza0on and the company have a similar vision for the future.
Social capital Ø The company honors its word to us. Ø We are very sa0sfied with our rela0ons with the company.
Ø The presence of the company is a benefit to us.
Ø The company listens to us.
Ins2tu2onalized trust Ø The company gives more support to those it nega0vely affects. Ø The company shares decision-‐making. Ø The company considers our interests. Ø The company openly shares relevant informa0on with us.
Legi2macy of benefits Ø We can gain from a rela0onship with the company. Ø We need the company’s coopera0on to meet our goals.
Measurement!
We measure the four components of the social license by asking interviewees to rate their level of agreement or disagreement with a series of statements.
Social License:
This methodology has been validated in more than 1,500 stakeholder interviews at mining and construc0on sites located on four con0nents.
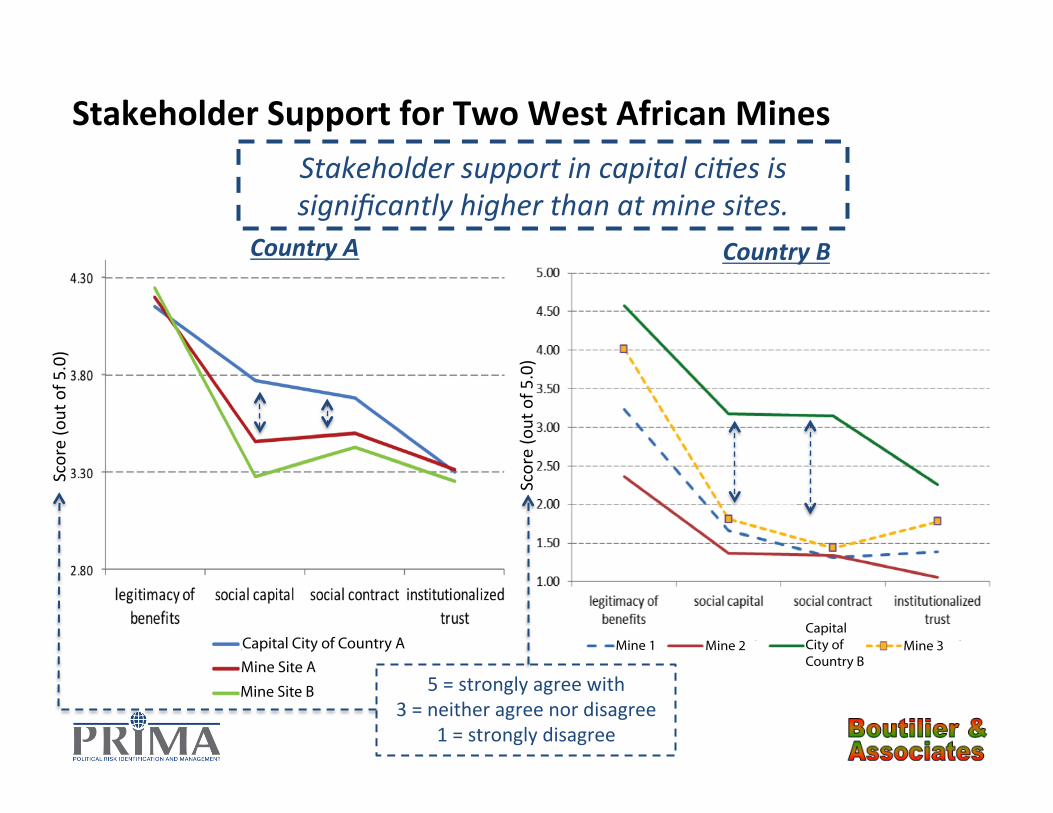
Capital City of Country A
Mine Site A
Mine Site B
Country A
CapitalCity ofCountry B
Mine 1 Mine 2 Mine 3
Score (out of 5
.0)
Stakeholder Support for Two West African Mines Stakeholder support in capital ci+es is significantly higher than at mine sites.
Score (out of 5
.0)
5 = strongly agree with 3 = neither agree nor disagree
1 = strongly disagree
Country B
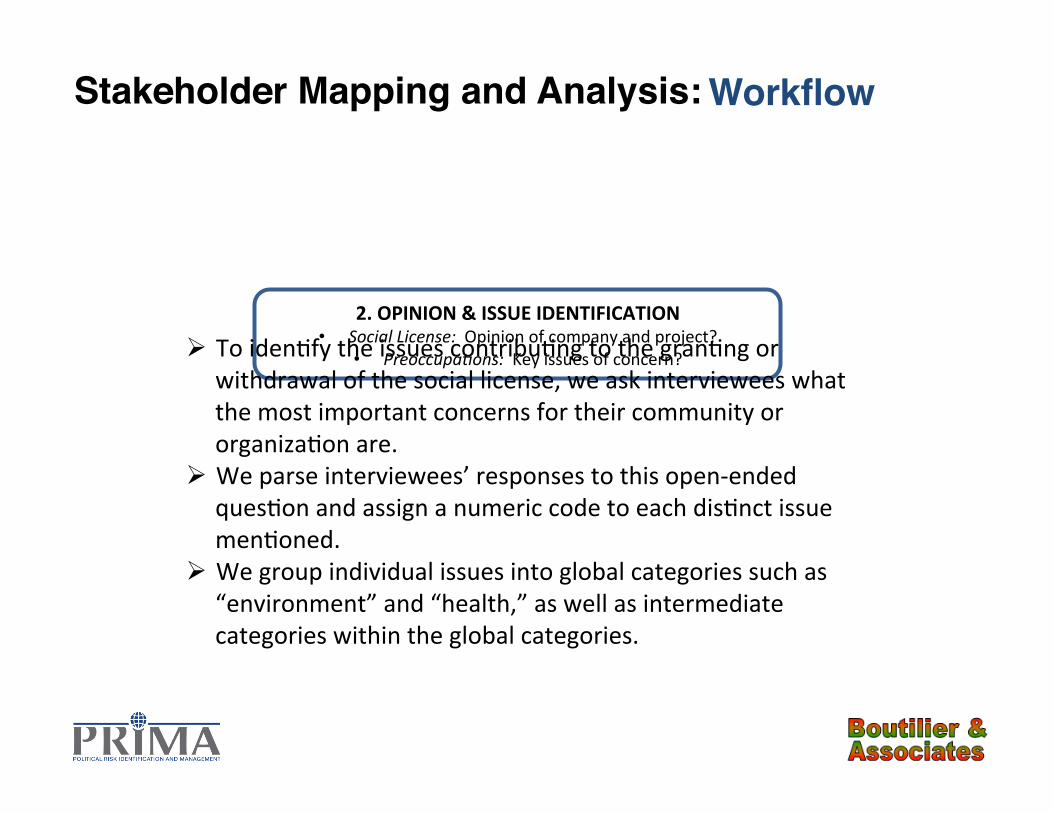
2. OPINION & ISSUE IDENTIFICATION • Social License: Opinion of company and project?
• Preoccupa+ons: Key issues of concern?
Stakeholder Mapping and Analysis:!Workflow!
Ø To iden0fy the issues contribu0ng to the gran0ng or withdrawal of the social license, we ask interviewees what the most important concerns for their community or organiza0on are.
Ø We parse interviewees’ responses to this open-‐ended ques0on and assign a numeric code to each dis0nct issue men0oned.
Ø We group individual issues into global categories such as “environment” and “health,” as well as intermediate categories within the global categories.
CMTY
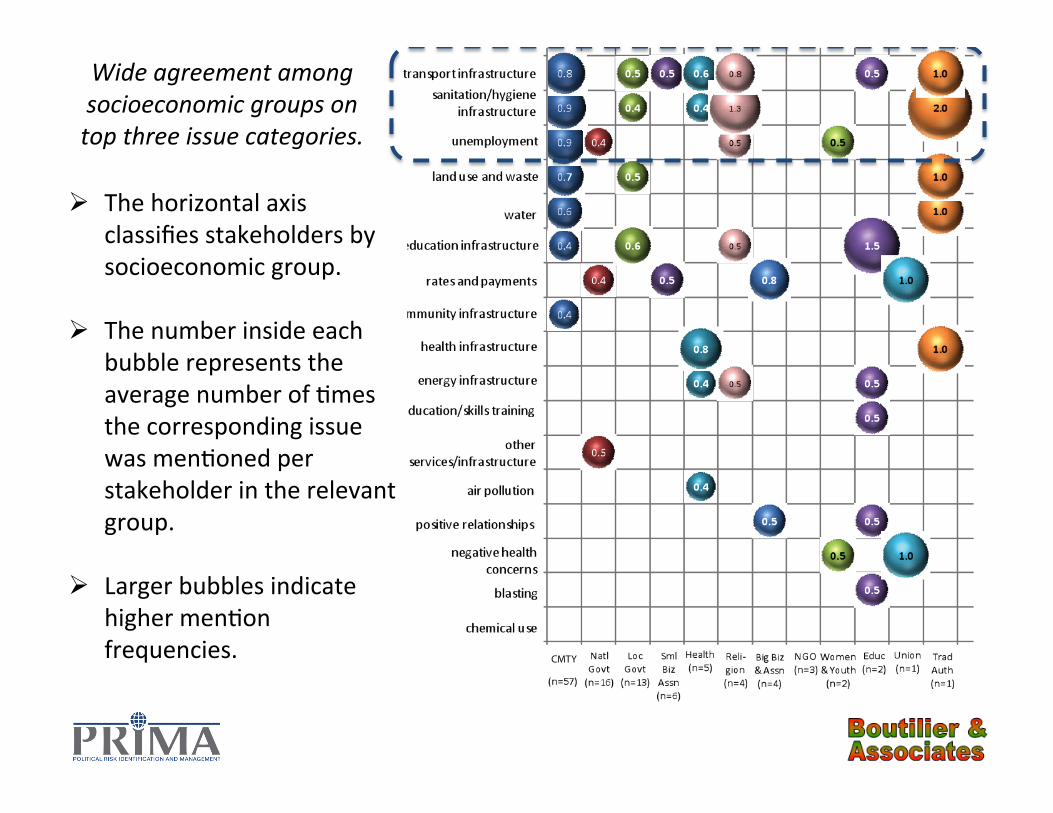
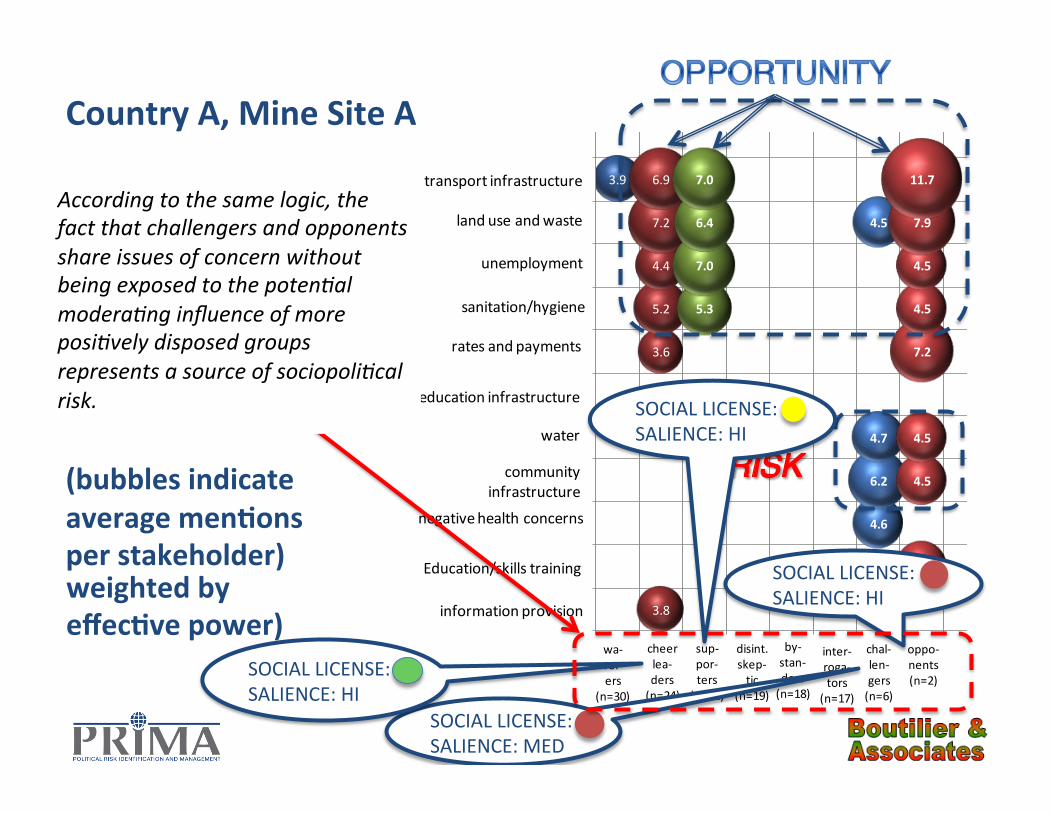
Country A Mine Site A Top stakeholder concerns by socioeconomic group (bubbles indicate average menAons per stakeholder)
Ø The ver0cal axis iden0fies global issue categories.
Ø The horizontal axis classifies stakeholders by socioeconomic group.
Ø The number inside each bubble represents the average number of 0mes the corresponding issue was men0oned per stakeholder in the relevant group.
Ø Larger bubbles indicate higher men0on frequencies.
Wide agreement among socioeconomic groups on top three issue categories.
4. STRATEGIC RECOMMENDATIONS & SCENARIO ANALYSIS
• Ini+a+ves: Around which issues? • Coali+on-‐building: With which partners?
• Performance: How might specific inita0ves play out?
3. STRATEGIC PRIORITIZATION OF STAKEHOLDERS & ISSUES
• Power: Who influences whom? • Salience: How much do they care? • Effec+ve power = Power × Salience
Stakeholder Mapping and Analysis:!Workflow!
2. OPINION & ISSUE IDENTIFICATION • Social License: Opinion of company and project?
• Preoccupa+ons: Key issues of concern?
Ø For purposes of developing a stakeholder engagement strategy, stakeholders and issues must be priori0zed.
Ø Emphasizing the issues of the most nega0vely disposed or loudest stakeholders creates perverse incen0ves and may be an inefficient use of company resources.
Ø Similarly, addressing the most commonly-‐cited issues rests on the unwarranted assump0on that all stakeholders merit equal acen0on.
Ø To priori0ze stakeholders and issues, we use interview data to assess each stakeholder's power to influence other stakeholders, as well as the extent to which each stakeholder regards company or project-‐related issues as salient.
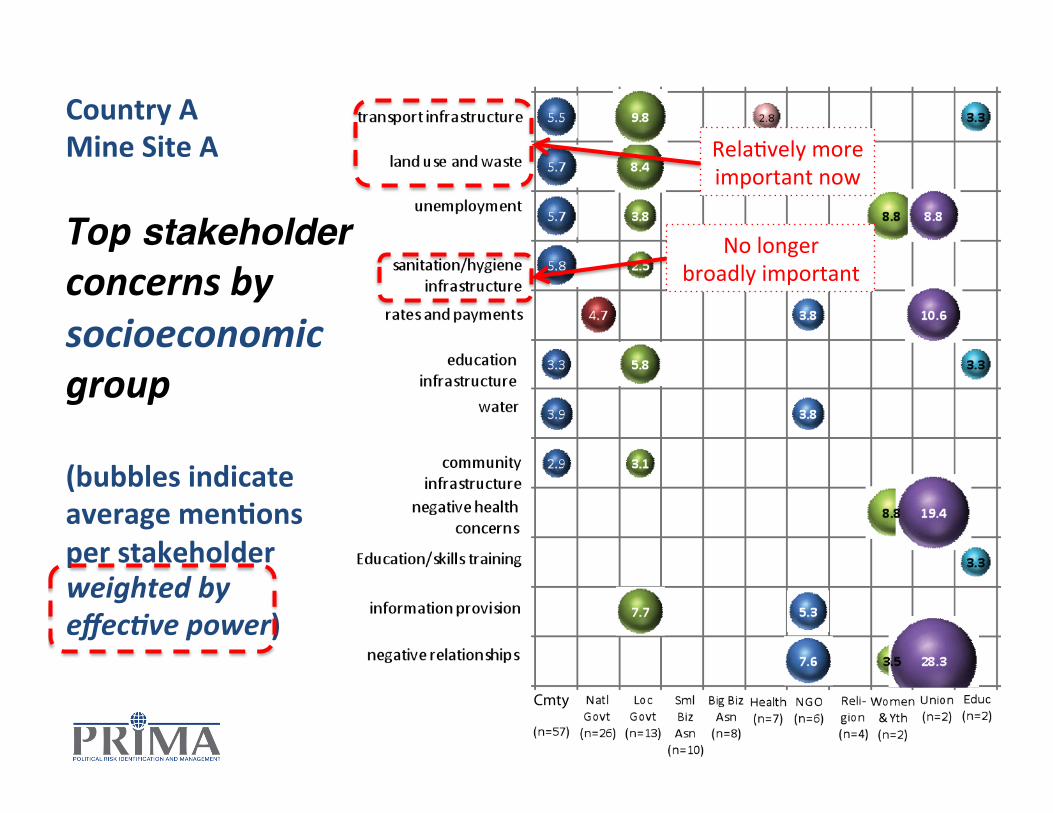
Ø We use the measures of salience and power, along with a combined measure labeled “effec0ve power,” to apply a series of weigh0ng schemes to the raw data on issues and priori0es.
1. STAKEHOLDER CENSUS • Coverage: All local & na0onal stakeholder organiza0ons
• Method: Field interviews by trained local teams • Data collected: Opinions, issues of concern, rela0onships
Cmty
Country A Mine Site A Top stakeholder concerns by socioeconomic group (bubbles indicate average menAons per stakeholder weighted by effec2ve power)
Rela0vely more important now
No longer broadly important
• Supporters must be given real responsibilities and authority to sway waverers. "
• Cheerleaders must be managed with care so as not to damage other relationships."
• Waverers are targets (for both sides)."• Bystanders are allies with low salience.
Keep them informed so that they feel consulted."
• Ignore disinterested skeptics.!• Strategize to defeat interrogators and
challengers, but in a way that allows them a face-saving way out. " ""
• Not much one can do about unpredictable opponents—watch them carefully."
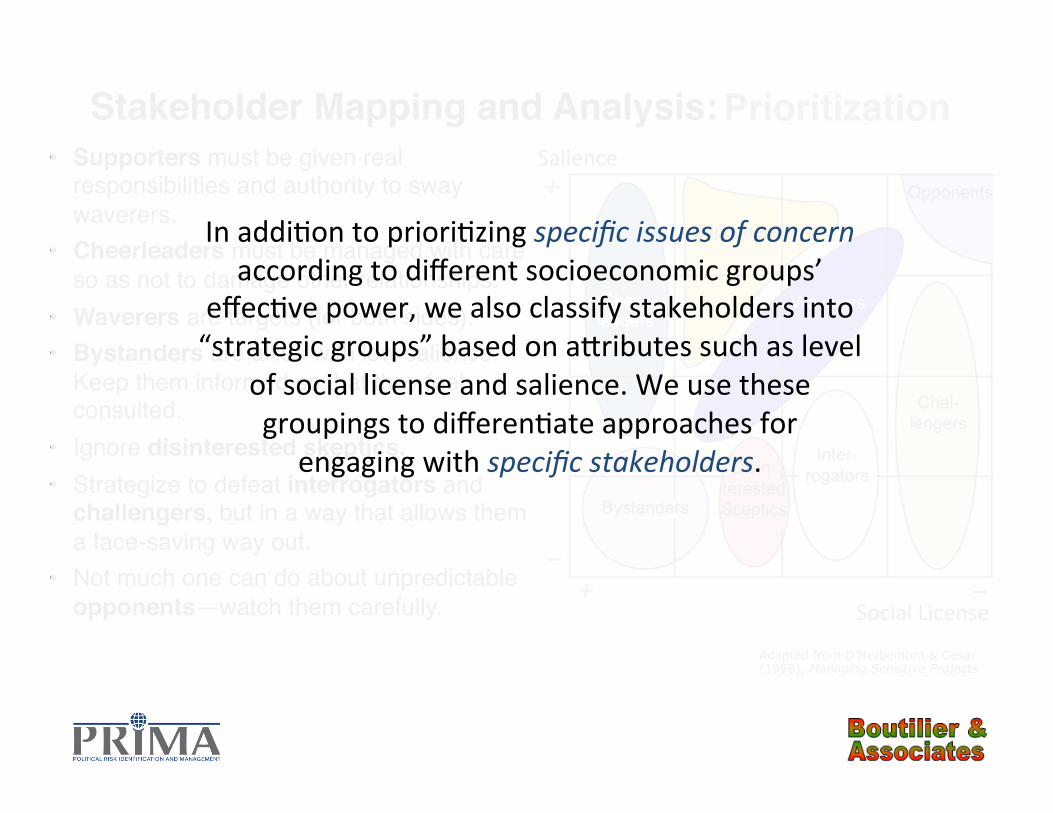
Adapted from D’Herbemont & César (1998), Managing Sensitive Projects
Stakeholder Mapping and Analysis:!Prioritization!
− − +
+
Social License
Salience
In addi0on to priori0zing specific issues of concern according to different socioeconomic groups’
effec0ve power, we also classify stakeholders into “strategic groups” based on acributes such as level
of social license and salience. We use these groupings to differen0ate approaches for
engaging with specific stakeholders.
strategic group
weighted by effecAve power)
3.9
3.8
3.6
5.2
4.4
7.2
6.9
5.3
7.0
6.4
7.0
4.6
6.2
4.7
4.5
4.5
4.5
4.5
7.2
4.5
4.5
7.9
11.7
0.5
1.5
2.5
3.5
4.5
5.5
6.5
7.5
8.5
9.5
10.5
11.5
12.5
13.5
14.5
15.5
16.5
17.5
0.5 1.5 2.5 3.5 4.5 5.5 6.5 7.5 8.5 9.5 10.5 11.5 12.5 13.5 14.5 15.5 16.5
sanitation/hygiene
rates and payments
education infrastructure
water
community infrastructure
negative health concerns
Education/skills training
information provision
#N/Awa-‐ver-‐ers
(n=30)
cheer lea-‐ders (n=24)
sup-‐por-‐ters
(n=22)
disint. skep-‐tic
(n=19)
by-‐stan-‐ders (n=18)
inter-‐roga-‐tors
(n=17)
chal-‐len-‐gers (n=6)
oppo-‐nents (n=2)
#N/A#N/A
#N/A
unemployment
0
0
0
0
0
0
transport infrastructure
land use and waste
#N/A#N/A#N/A#N/A
Country A, Mine Site A Top stakeholder concerns by (bubbles indicate average menAons per stakeholder)
SOCIAL LICENSE: SALIENCE: MED
SOCIAL LICENSE: SALIENCE: HI
SOCIAL LICENSE: SALIENCE: HI
SOCIAL LICENSE: SALIENCE: HI
The fact that “cheerleaders” and “supporters” share the same issues of concern as “opponents” represents an opportunity. Members of the first two groups, whose numbers are greater, could exert social pressure on opponents to adopt less nega+ve views.
According to the same logic, the fact that challengers and opponents share issues of concern without being exposed to the poten+al modera+ng influence of more posi+vely disposed groups represents a source of sociopoli+cal risk.
Nat’l Police
Nat’l Health ServiceSite A MuniAsy
Nat’l FireSrv
Site A_ChfNat’lDptUrbRds
Rdo Sta A
Rdo Sta B
Nat’l Health
Asy 3
CEO
Wms Grp
Enterprise A
Rdo Sta CRdo Sta D
InvestigationNat’lMilitary
Youth Grp
Education
Nw_Asy
Nwspr A
QnMCityHth
Town Asy
LandCom
T&C Plans
CvcEducEmplCom
Nat’l Minerals
Most InfluenAal Stakeholders, Mine Site A
The Na+onal Police and the Na+onal Health Service are the two most influen+al stakeholders in the
network, due to the large number of other stakeholders to which they are +ed as well as the “brokering” role that each plays for otherwise
unconnected groups.
In this case, the level of social license granted by the Na+onal Health Service is in the “approval” range. When combined with the agency’s substan+al influence in the network, its posi+ve orienta+on
suggests the poten+al for a partnering arrangement that could raise the company’s level of social license
among the others.
The interviews also provide informa0on about the “social capital” in the rela0onships among stakeholders. We convert this informa0on into network graphs. We also calculate various measures of social influence to gain insight into relevant influence dynamics, and ul0mately into engagement strategies that leverage
these dynamics.
RdoStaA
RdoStaB
Nat’lPolice
MediaSiteA
Nat’l FireSvc
Nat’lHealthSvc
Nat’l EPA RdoStaC
RdoStaD
RdoStaE
WmsGrp
NBSS IndustryChf_AYouthChair City A Asy
City B Asy
Site A MuniPlans
MiningCo ANatlDptUrbRds
TownAUnit
TownBUnit
Chf_B
City C Asy
City D Asy
XYZSvcs
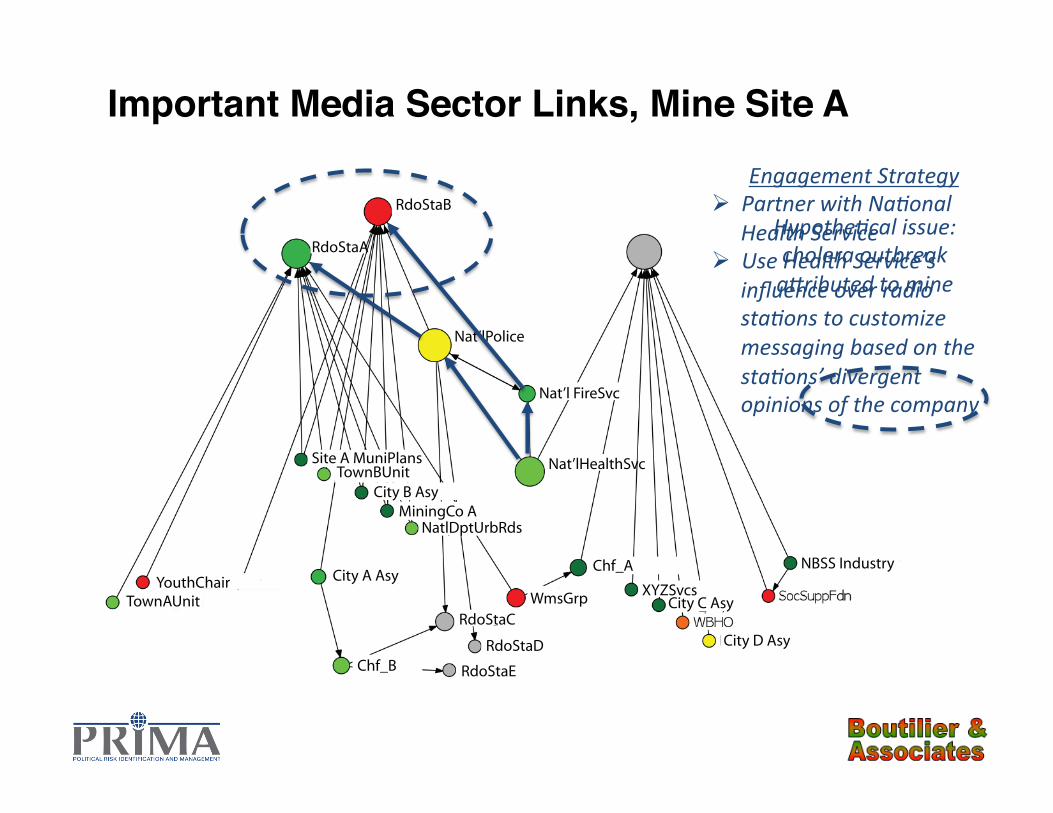
Important Media Sector Links, Mine Site A!
Hypothe+cal issue: cholera outbreak a@ributed to mine
Engagement Strategy Ø Partner with Na+onal
Health Service Ø Use Health Service’s
influence over radio sta+ons to customize messaging based on the sta+ons’ divergent opinions of the company
TownGAsyRdoStaA
NatlPoliceTownGHth
MktWmn
ChfAChfB
ChfC
ChfDChfE
ChfF
TownBAsyTownAAsy
TownCUnitTownCWmn
TownDAsy
TownEUnit
NatlSSNIT
ChfH
TownEAsy
NatlEnvSciTecTownAFarmers
TownFUnit
TownHYth
TownZAsy
TownDWmn
SiteAMWWivesTownXAsy
TownX_QnM
TownQ_Rgt
CoA_CEO
CoA_T&CPlans
CoAAsy
CoAStoolands
Transport infrastructure
Land use & waste
Sanita0on/hygiene infrastructure
Unemployment
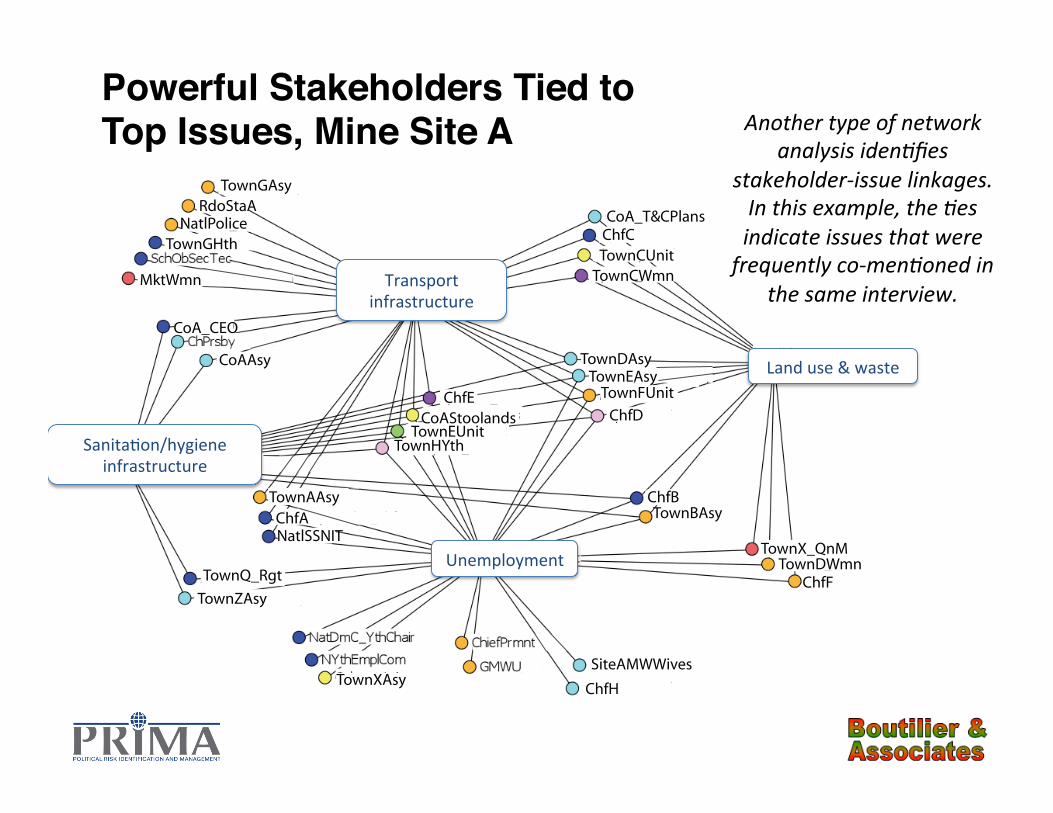
Powerful Stakeholders Tied toTop Issues, Mine Site A "
Another type of network analysis iden+fies
stakeholder-‐issue linkages. In this example, the +es indicate issues that were frequently co-‐men+oned in
the same interview.
4. STRATEGIC RECOMMENDATIONS & SCENARIO ANALYSIS
• Ini+a+ves: Around which issues? • Coali+on-‐building: With which partners?
• Performance: How might specific inita0ves play out?
3. STRATEGIC PRIORITIZATION OF STAKEHOLDERS & ISSUES
• Power: Who influences whom? • Salience: How much do they care? • Effec+ve power = Power × Salience
Stakeholder Mapping and Analysis:!Workflow!
2. OPINION & ISSUE IDENTIFICATION • Social License: Opinion of company and project?
• Preoccupa+ons: Key issues of concern?
1. STAKEHOLDER CENSUS • Coverage: All local & na0onal stakeholder organiza0ons
• Method: Field interviews by trained local teams • Data collected: Opinions, issues of concern, rela0onships
Ø Using the insights provided by the various analyses, we develop alterna0ve sets of ac0on-‐oriented recommenda0ons, or “engagement scenarios.”
Ø In a typical scenario, the company forms coali0ons with selected stakeholders to address key issues of concern and, ul0mately, to improve its overall social license.
Ø We simulate the likely socio-‐poli0cal dynamics of each scenario using a dynamic expected u0lity model that incorporates social preferences and structure. The model resembles those used by the World Bank, the European Commission, and U.S. intelligence agencies.
Ø Each stakeholder in the model seeks to acain their preferred outcome and to maximize their chance of being on the winning “team” by influencing other stakeholders’ opinions of the company or project.
Ø The simula0on predicts how the company or project’s overall social license is likely to evolve under each engagement scenario versus the status quo.
Strategic RecommendaAons & Scenario Analysis
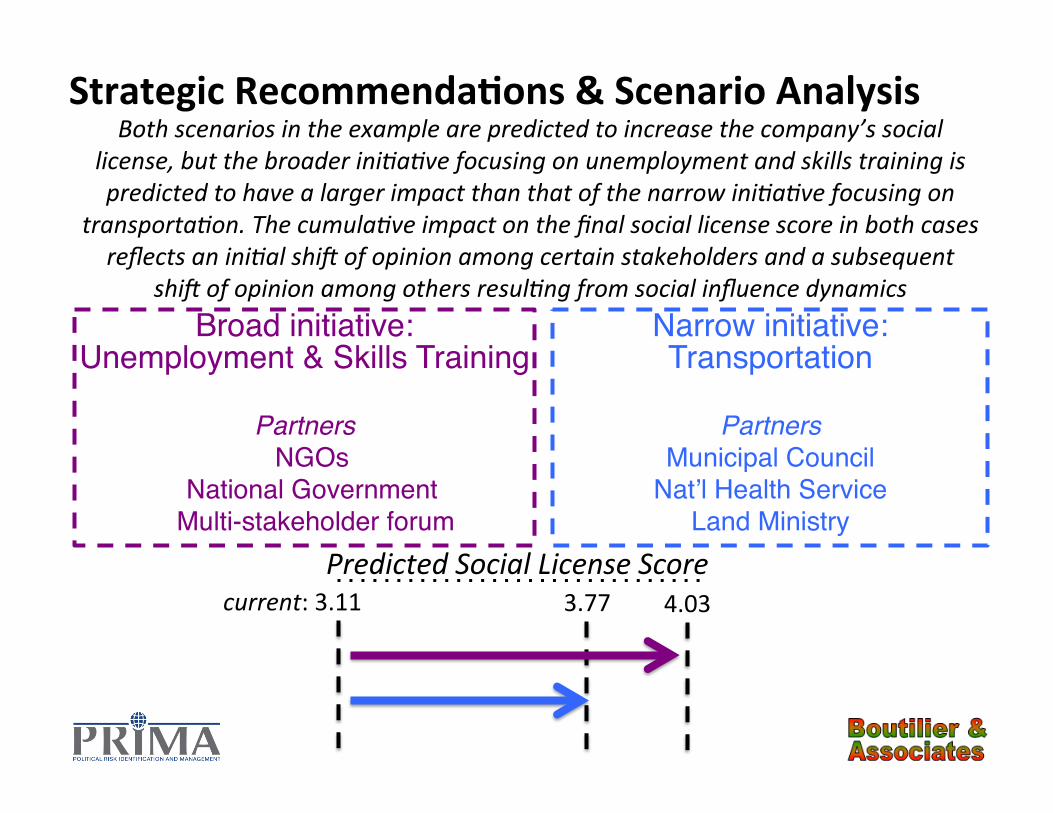
Narrow initiative: Transportation"
PartnersMunicipal Council
Nat’l Health Service Land Ministry"
Broad initiative:Unemployment & Skills Training"
Partners NGOs
National Government Multi-stakeholder forum"
current: 3.11 Predicted Social License Score
3.77 4.03
Both scenarios in the example are predicted to increase the company’s social license, but the broader ini+a+ve focusing on unemployment and skills training is predicted to have a larger impact than that of the narrow ini+a+ve focusing on
transporta+on. The cumula+ve impact on the final social license score in both cases reflects an ini+al shin of opinion among certain stakeholders and a subsequent
shin of opinion among others resul+ng from social influence dynamics
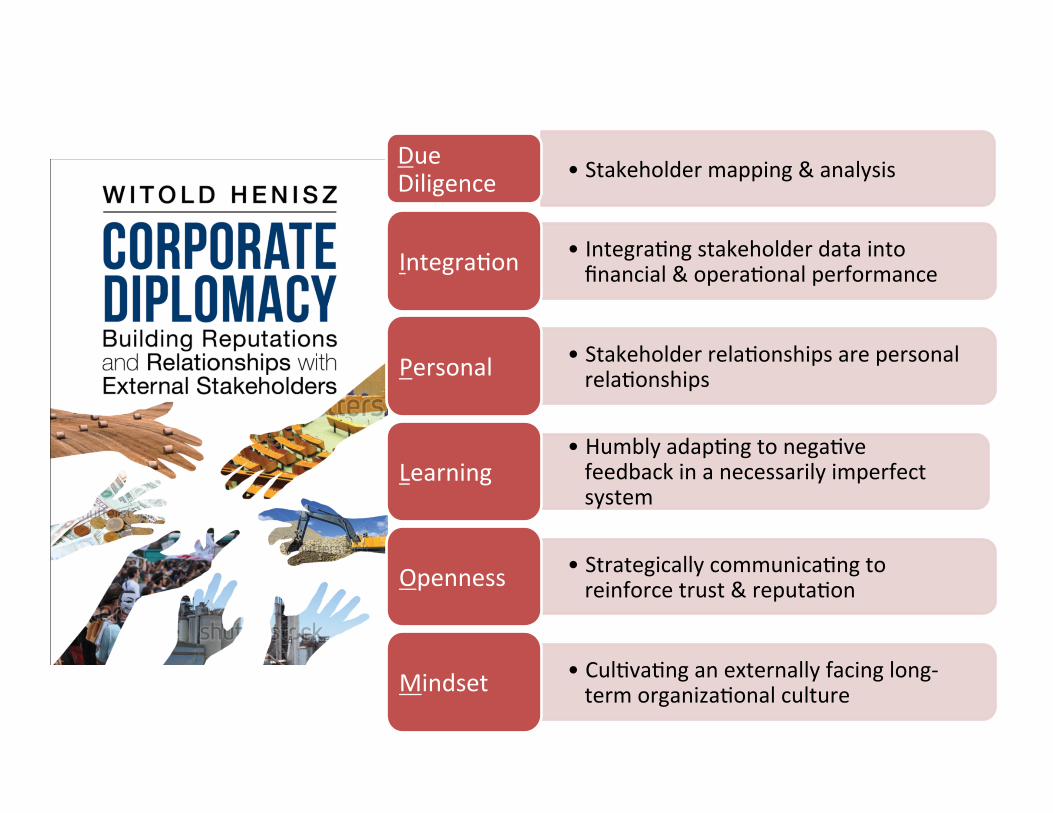
• Stakeholder mapping & analysis Due Diligence
• Integra0ng stakeholder data into financial & opera0onal performance Integra0on
• Stakeholder rela0onships are personal rela0onships Personal
• Humbly adap0ng to nega0ve feedback in a necessarily imperfect system
Learning
• Strategically communica0ng to reinforce trust & reputa0on Openness
• Cul0va0ng an externally facing long-‐term organiza0onal culture Mindset