Vital and Health Statistics; Series 13, No. 101 (9/89) · No, 101 States, 1965-86 the National...
67
Vitaland HealthStatistics Trends in Hospital Utilization: United Series 13: Data From No, 101 States, 1965-86 the National Health Survey This report presents statistics on the utilization of non-Federal short-stay hospitals based on data collected through the National Hospital Discharge Survey from 1965 through 1986. The survey is a national sample of records of discharged patients. Estimates are provided on demographic characteristics of patients discharged, selected conditions diagnosed and procedures performed, and by geographic region of the hospital. Measurements of hospital utilization include frequency, rate, percent, and average length of stay, US. DEPARTMENT OF HEALTH AND HUMAN SERVICES Public Health Service Centers for Disease Control National Center for Health Statistics Hyattsville, Maryland September 1989 DHHS Publication No, (PHS) 89–1762
Transcript of Vital and Health Statistics; Series 13, No. 101 (9/89) · No, 101 States, 1965-86 the National...

VitalandHealthStatisticsTrends in HospitalUtilization:United
Series 13:Data FromNo, 101
States, 1965-86
the National Health Survey
This report presents statistics on the utilization of non-Federal short-stayhospitals based on data collected through the National Hospital DischargeSurvey from 1965 through 1986. The survey is a national sample of records ofdischarged patients. Estimates are provided on demographic characteristicsof patients discharged, selected conditions diagnosed and proceduresperformed, and by geographic region of the hospital. Measurements ofhospital utilization include frequency, rate, percent, and average length ofstay,
US. DEPARTMENT OF HEALTH AND HUMAN SERVICES
Public Health Service
Centers for Disease Control
National Center for Health Statistics
Hyattsville, Maryland
September 1989DHHS Publication No, (PHS) 89–1762

Copyrfght information
All material appearing in this report is m the public domam and may be reproduced
or copted withoul permission; citation astosource, however, is appreciated.
Suggested citation
Pokras R, Kozak LJ, McCarthy E, Graves EJ. Trends m hospital utilization: Umted
Slates, 196%86. National Center for Health Stat@ics Vital Heallh Stat 13(101).1989.
Lbrary of Congress Catabging-in-PublicationData
Trends inhospital utthzatlon : United States, 1965-86.
p.cm.-(Seties 13, Data from the National Health Suwey; no. 101) (DHHSpublication ; no. (PHS) 8%1762)
By Robert Pokras and others.Bibliography: p.
ISBN 0-8406–0431-91. Hospital utilization—United States—Statistics, 1. Pokras, Robert.
II. National Center for Health Statistics (U. S.) II1.Series: Vital and health statistics.
Series 13, Data from thenatlonal health sutvey; no. 101. lV. Series: DHHSpubltcatlon ; (PHS) 89-1762.
[DNLM: l. Hospifals—utilization—UnltedStates-statistics. W2AN148vmno. 101]RA407.3.T74 1989
362.1 1‘0973021 -dc20DNLM!DLCfor Library of Congress 89-600117
CIP

National Center for Health Statistics
Manning Feinleib, M. D., Dr.P.H., Director
Robert A. Israel, Deputy Director
Jacob J. Feldman, Ph.D., Associate DirectorforAmdysisand Epidemwlogy
Gail F. Fisher, Ph.D., Associate Director for Planning andExtramural Programs
Peter L. Hurley, Associate Director for VW and HealthStatistics Systems
Stephen E. Nieberding, Associute Director for Management
Charleq J. Rothwell, Associate Director for Data Processingand Services
Monroe G. Sirken, Ph.D., Associate Director for Researchand Methodology
Division of Health Care Statistics
W. Edward Bacon, Divzkion Director
Tommy McLemore, Deputy Director
Mary Moien, Chiej Hospital Care Statistics Branch
Manoochehr K. Nozary, Chie$ Technical Services Branch
Cooperm’on of the U.S. Bureau of the @rsus
Under the legislation establialring the National Heafth Survey, the PublicHealth Serfice is authorized to us+ irrsofar as possible, the services or facilities ofother Feder,@ State, or private agencies.
In accord.mxe with specifications established by the National Center for HealthStatistics, the U.S. Bureau of the Census, under a contractual armrrgemeut, partici-pated in planning the survey and collecting the data.
Introduction . . . . . . . . . . . . . . . . . . . . . . . . . . . . . . . . . . . . . . . . . . . . . . . . . . . . . . . . . . . . . . . . . . . . . . . . . . . . . . . . . . . . . . . . . .
Highlights . . . . . . . . . . . . . . . . . . . . . . . . . . . . . . . . . . . . . . . . . . . . . . . . . . . . . . . . . . . . . . . . . . . . . . . . . . . . . . . . . . . . . . . . . . . .
Hospital utilization . . . . . . . . . . . . . . . . . . . . . . . . . . . . . . . . . . . . . . . . . . . . . . . . . . . . . . . . . . . . . . . . . . . . . . . . . . . . . . . . . . . .Overview . . . . . . . . . . . . . . . . . . . . . . . . . . . . . . . . . . . . . . . . . . . . . . . . . . . . . . . . . . . . . . . . . . . . . . . . . . . . . . . . . . . . . . . . . . .Utilization by age . . . . . . . . . . . . . . . . . . . . . . . . . . . . . . . . . . . . . . . . . . . . . . . . . . . . . . . . . . . . . . . . . . . . . . . . . . . . . . . . . . . .Utilization by sex and age...... . . . . . . . . . . . . . . . . . . . . . . . . . . . . . . . . . . . . . . . . . . . . . . . . . . . . . . . . . . . . . . . . . . . . . . .
Utilization by region and age.... . . . . . . . . . . . . . . . . . . . . . . . . . . . . . . . . . . . . . . . . . . . . . . . . . . . . . . . . . . . . . . . . . . . . . . . .Discharge rates . . . . . . . . . . . . . . . . . . . . . . . . . . . . . . . . . . . . . . . . . . . . . . . . . . . . . . . . . . . . . . . . . . . . . . . . . . . . . . . . . . . . .Average lengths ofstay . . . . . . . . . . . . . . . . . . . . . . . . . . . . . . . . . . . . . . . . . . . . . . . . . . . . . . . . . . . . . . . . . . . . . . . . . . . . . . .Rates ofdays ofcare . . . . . . . . . . . . . . . . . . . . . . . . . . . . . . . . . . . . . . . . . . . . . . . . . . . . . . . . . . . . . . . . . . . . . . . . . . . . . . . . .
Utilization by diagnosis . . . . . . . . . . . . . . . . . . . . . . . . . . . . . . . . . . . . . . . . . . . . . . . . . . . . . . . . . . . . . . . . . . . . . . . . . . . . . . . . .Under 15 years . . . . . . . . . . . . . . . . . . . . . . . . . . . . . . . . . . . . . . . . . . . . . . . . . . . . . . . . . . . . . . . . . . . . . . . . . . . . . . . . . . . . . .15A4years . . . . . . . . . . . . . . . . . . . . . . . . . . . . . . . . . . . . . . . . . . . . . . . . . . . . . . . . . . . . . . . . . . . . . . . . . . . . . . . . . . . . . . . . .45–64 years . . . . . . . . . . . . . . . . . . . . . . . . . . . . . . . . . . . . . . . . . . . . . . . . . . . . . . . . . . . . . . . . . . . . . . . . . . . . . . . . . . . . . . . . .65years andover . . . . . . . . . . . . . . . . . . . . . . . . . . . . . . . . . . . . . . . . . . . . . . . . . . . . . . . . . . . . . . . . . . . . . . . . . . . . . . . . . . . .
Utilizationby surgical procedure . . . . . . . . . . . . . . . . . . . . . . . . . . . . . . . . . . . . . . . . . . . . . . . . . . . . . . . . . . . . . . . . . . . . . . . . .Tonsillectomy . . . . . . . . . . . . . . . . . . . . . . . . . . . . . . . . . . . . . . . . . . . . . . . . . . . . . . . . . . . . . . . . . . . . . . . . . . . . . . . . . . . . . . .Cesarean section . . . . . . . . . . . . . . . . . . . . . . . . . . . . . . . . . . . . . . . . . . . . . . . . . . . . . . . . . . . . . . . . . . . . . . . . . . . . . . . . . . . .Hysterectomy . . . . . . . . . . . . . . . . . . . . . . . . . . . . . . . . . . . . . . . . . . . . . . . . . . . . . . . . . . . . . . . . . . . . . . . . . . . . . . . . . . . . ., .Hemorrhoidectomy . . . . . . . . . . . . . . . . . . . . . . . . . . . . . . . . . . . . . . . . . . . . . . . . . . . . . . . . . . . . . . . . . . . . . . . . . . . . . . . . . .Cholecystectomy . . . . . . . . . . . . . . . . . . . . . . . . . . . . . . . . . . . . . . . . . . . . . . . . . . . . . . . . . . . . . . . . . . . . . . . . . . . . . . . . . . . .Lens extraction . . . . . . . . . . . . . . . . . . . . . . . . . . . . . . . . . . . . . . . . . . . . . . . . . . . . . . . . . . . . . . . . . . . . . . . . . . . . . . . . . . . . . .Prostatectomy . . . . . . . . . . . . . . . . . . . . . . . . . . . . . . . . . . . . . . . . . . . . . . . . . . . . . . . . . . . . . . . . . . . . . . . . . . . . . . . . . . . . . . .Cardiac catheterization . . . . . . . . . . . . . . . . . . . . . . . . . . . . . . . . . . . . . . . . . . . . . . . . . . . . . . . . . . . . . . . . . . . . . . . . . . . . . . .Coronarybypass . . . . . . . . . . . . . . . . . . . . . . . . . . . . . . . . . . . . . . . . . . . . . . . . . . . . . . . . . . . . . . . . . . . . . . . . . . . . . . . . . . . . .
References . . . . . . . . . . . . . . . . . . . . . . . . . . . . . . . . . . . . . . . . . . . . . . . . . . . . . . . . . . . . . . . . . . . . . . . . . . . . . . . . . . . . . . . . . . .
List ofdetailed tables . . . . . . . . . . . . . . . . . . . . . . . . . . . . . . . . . . . . . . . . . . . . . . . . . . . . . . . . . . . . . . . . . . . . . . . . . . . . . . . . . .
Appendixes
I. Technical notes on methods . . . . . . . . . . . . . . . . . . . . . . . . . . . . . . . . . . . . . . . . . . . . . . . . . . . . . . . . . . . . . . . . . . . . . . . .
II. Definitions ofterms . . . . . . . . . . . . . . . . . . . . . . . . . . . . . . . . . . . . . . . . . . . . . . . . . . . . . . . . . . . . . . . . . . . . . . . . . . . . . . .
III. Publications from the National Hospital Discharge Survey . . . . . . . . . . . . . . . . . . . . . . . . . . . . . . . . . . . . . . . . . . . . . .
List of text figures
1. Number of discharges from short-stay hospitals: United States, 1965-862.
. . . . . . . . . . . . . . . . . . . . . . . . . . . . . . . . . .Rate of discharges from short-stay hospitals: United States, 1965-86 . . . . . . . . . . . . . . . . . . . . . . . . . . . . . . . . . . . . .
3. Average length ofstay ofpatients discharged from short-stayhospitals: United States, 1965-86 . . . . . . . . . . . . . .4. Median ageofpatients discharged from short-stay hospitals and median age ofpopulatiom United
States, 1965–86 . . . . . . . . . . . . . . . . . . . . . . . . . . . . . . . . . . . . . . . . . . . . . . . . . . . . . . . . . . . . . . . . . . . . . . . . . . . . . . . . . . .5. Number of days of care for patients discharged from short-stay hospitals United States, 1965–86 . . . . . . . . . . . . .6. Discharge rates, by region: United States, 1965-86 . . . . . . . . . . . . . . . . . . . . . . . . . . . . . . . . . . . . . . . . . . . . . . . . . . . .7. Dischargerates for patients under 15years ofage, byregion United States, 1965–86.. . . . . . . . . . . . . . . . . . . . . .8. Discharge rates for patients 1544 years of age, by region: United States, 1965-86 . . . . . . . . . . . . . . . . . . . . . . . . .
1
3
4456
88
1112
1616161718
20202121212122222323
24
25
43
51
53
445
5589
10
...Ill
9.10.11.12.13.14.15.16.17.
18.19.20.21.22.23.24.
25.26.
27.28.
29.30.
31.32.33.
Discharge rates forpatients 45-64 yeas ofage, byre~on:U nitedStates,l 965-86 . . . . . . . . . . . . . . . . . . . . . . . . . 11Discharge rates for patients 65 years of age and over, by region: United States, 1965-86 . . . . . . . . . . . . . . . . . . . . 12Average lengths ofstay, byregion: United States, 1965–86 . . . . . . . . . . . . . . . . . . . . . . . . . . . . . . . . . . . . . . . . . . . . . . 12Average lengths ofstay, byregion and age United States, 1965 and 1986 . . . . . . . . . . . . . . . . . . . . . . . . . . . . . . . . . 13Rates ofdaysof care, byregion: United States, 1965–86 . . . . . . . . . . . . . . . . . . . . . . . . . . . . . . . . . . . . . . . . . . . . . . . . 14Rates of days of care, by region and age: United States, 1965 and 1986 . . . . . . . . . . . . . . . . . . . . . . . . . . . . . . . . . . . 15Discharge rates forpatients under 15years ofagetith pneumonia: Unitd States, l965=6 . . . . . . . . . . . . . . . . . 16Discharge rates for patients under 15 years of age with fractures: United States, 1965–86 . . . . . . . . . . . . . . . . . . . 16Discharge rates for patients under 15 years of age with diseases of the ear and mastoid process: UnitedStates, 1965–86 . . . . . . . . . . . . . . . . . . . . . . . . . . . . . . . . . . . . . . . . . . . . . . . . . . . . . . . . . . . . . . . . . . . . . . . . . . . . . . . . . . . 17Discharge rates forpatients 1544yeas ofagewith appendicitis: United States, l965=6 . . . . . . . . . . . . . . . . . . . 17Discharge rates forpatients 1544yeas ofagewith mental disorder~United States, 1965-86 . . . . . . . . . . . . . . . 17Discharge rates for patients 15+4 years of age with intervertebral disc disorderx United States, 1965–86. . . . . . 17Discharge rates for patients 45-64 years of age with malignant neoplasmx United States, 1965–86. . . . . . . . . . . . 17Discharge rates for patients 45–64 years of age with acute myocardial infarction: United States, 1965–86 . . . . . . 18Discharge rates for patients 45–64 years of age with cholelithiasis: United States, 1965–86. . . . . . . . . . . . . . . . . . . 18Discharge rates for patients 45–64 years of age with ulcers of the stomach and small intestine: UnitedStates, 1965–86 . . . . . . . . . . . . . . . . . . . . . . . . . . . . . . . . . . . . . . . . . . . . . . . . . . . . . . . . . . . . . . . . . . . . . . . . . . . . . . . . . . . 18Discharge rates for patients 65 years of age and over with malignant neoplasms: United States, 1965–86. . . . . . . 18Discharge rates for patients 65 years of age and over with acute myocardial infarction: United States,1965–86 . . . . . . . . . . . . . . . . . . . . . . . . . . . . . . . . . . . . . . . . . . . . . . . . . . . . . . . . . . . . . . . . . . . . . . . . . . . . . . . . . . . . . . . . . 19Discharge rates for patients 65 years of age and over with ti-acture of neck of femu~ United States, 1965–86. . . 19Discharge rates for patients 65 years of age and over with a first-listed diagnosis of diabetes: UnitedStates, 1965–86 . . . . . . . . . . . . . . . . . . . . . . . . . . . . . . . . . . . . . . . . . . . . . . . . . . . . . . . . . . . . . . . . . . . . . . . . . . . . . . . . . . . 19Rates ofall-listed diabetes forpatients 65yeasof agemdover: United States, 1965-86 . . . . . . . . . . . . . . . . . . . . 19Rates of tonsillectomies with or without adenoidectomies for patients under 15 years of age: UnitedStates, 1965–86 . . . . . . . . . . . . . . . . . . . . . . . . . . . . . . . . . . . . . . . . . . . . . . . . . . . . . . . . . . . . . . . . . . . . . . . . . . . . . . . . . . . 20Rates of cesarean sections per 100 deliveries: United States, 1965-86 . . . . . . . . . . . . . . . . . . . . . . . . . . . . . . . . . . . . 21Rates of lens extractions by age: United States, 1965–86 . . . . . . . . . . . . . . . . . . . . . . . . . . . . . . . . . . . . . . . . . . . . . . . . 22Rates of cardiac catheterizations and coronary bypass procedures for patients 45 years of age and ove~United States, 1970-86 . . . . . . . . . . . . . . . . . . . . . . . . . . . . . . . . . . . . . . . . . . . . . . . . . . . . . . . . . . . . . . . . . . . . . . . . . . . . 23
Symbols
--- Data not available
. . . Category not applicable
Quantity zero
0.0 Quantity more than zero but less than 0.5
z Quantity more than zero but less than500 where numbers are rounded tothousands
* Figure does not meet standards ofreliability or precision (see Technicalnotes)

Trends in HospitalUtilization: UnitedStates, 1965-86by Robert Pokras, Lola Jean Kozak, EileenMcCarthy, and Edmund J. Graves, Divisionof Health Care Statistics
Introduction
The National Hospital Discharge Survey (NHDS) hasbeen conducted annually since 1965, and reports have beenpublished regularly that present hospital utilization statis-tics for individual years. Because more than 20 years ofdata are available, there has been an increased demand forNHDS data on trends in hospital use. Although the Na-tional Center for Health Statistics (NCHS) has published anumber of reports that include seketed trend estimatesusing NHDS data, the purpose of this report is to presentgeneral statistics on hospital utilization and patient charac-teristics tlom 1965 through 1986 and trends for selecteddiagnoses and procedures.
Data for the NHDS are collected annually from theface sheets of a sample of inpatient medical reeords from asample of short-stay non-Federal hospitals in the 50 Statesand the District of Columbia. A brief description of thesample design and survey methods ean be found in appen-dix I. A detailed report on the design of the NHDS hasbeen published (l). Familiarity with the definitions used inthe NHDS is important for interpreting the data and formaking comparisons with data on hospital utilization avail-able from other sources. Definitions of terms used in thisreport are presented in appendix II. Information on short-stay hospital utilization also is collected in another programof the National Center for Health Statistics, the NationalHealth Interview Survey (NHIS). Estimates from this sur-vey generally differ from those of the NHDS beeause ofdifferences in edection procedures, the population saru-pled, and definitions. Data from the NHIS are published inSeries 10 of the VUal and Health Statistics reports; datafrom the NHDS are published in Series 13. A list of NCHSpublications from the National Hospital Discharge Surveyis provided in appendix III.
In deciding which diagnoses and procedures to present,careful consideration was given to consistency of codesacross three versions of the International Classification ofDiseases (ICD) used from 1965 through 1986. The Inter-national Classification of Diseases, Adapted (ICD-7) (2),was used from 1965 through 1968. The NHDS was con-ducted in 1969, but because of budgetary restrictions, onlydemographic data were coded. From 1970 through 1978,the Eighth Revision International Classification of Dis-eases, Adapted (ICDA-8) (3), was used; and from 1979
through 1986, the International Classification of Diseases,9th Revision, Clinical Modification (ICD-9-CM) (4), wasused. In addition to consistency of coding, frequeney ofoccurrence and public interest were used as criteria forselecting diagnoses and procedures.
Many estimates in this report are presented graphicallyand again in a table (see list of detailed tables). Graphs arepresented for their visual advantage, and the correspondingtables provide more precision than can be obtained frominspection of the graphs.
Estimates of hospital utilization horn the NHDS havebeen affected by periodic updates of the sample. Theuniverse and sample of hospitals remained constant from1965 through 1971, but beginning in 1972, and every 2–3years after (see appendix I), the sample was updated toinclude hospitals that came into being after the previousupdate. This process often resulted in small “jumps” inestimates of hospital utilization, but it produced a morecurrent sample of hospitals (5).
Except where otherwise noted, rates presented in thisreport are based on the civilian resident population of theUnited States. Before 1981, rates in the published NHDSreports were calculated using estimates of the civiliannoninstitutionalized population. The change in base popu-lation was made to more accurately reflect the populationusing short-stay hospitals. Therefore, rates in this publica-tion may differ slightly from figures published before 1981.Regional rates for 1965–80 are based on the civilian nonin-stitutionalized population, because appropriate estimatesof the civilian resident population by region were notavailable for this period.
The estimates in this report on hospital utilization in1965-67 differ slightly from those published earlier inSeries 13 reports for these years. In some of the firstpublications from the National Center for Health Statisticson the NHDS, only well newborns were excluded from theanalysis, whereas in later publications all newborns wereexcluded from estimates of hospital utilization. This differ-ent exclusion criterion affeeted estimates for total hospitalutilization and utilization for persons under 15 years of age.
In addition, there is a discrepancy between estimatesfor 1970 in this report and estimates in the publication of1970 nonmedical statistics (6). lk 1969 and 1970, a shortfall
1

of funds limited the amount of information that could be Recoding and reprocessing of these records produced smallcoded from the more than 200,000 records sampled each discrepancies in estimates of hospital utilization for 1970.year in the NHDS; nonmedical data were coded for these The new file produced an estimate of total discharges thatyears with the funds that were available. Several years later, was 0.2 percent less than the estimate from the originalfunds were provided to code the medical data for 1970. file.

Highlights
●
●
●
●
●
●
The number of discharges rose steadily from the early1970’s until 1983 and then declined by 11.7 percentfrom 1983 to 1986.The number of discharges increased 19.2 percent from1965 through 1986, but the number adjusted for ageand sex decreased by 12.5 percent.The median age of all inpatients increased from 36.1years in 1965 to 46.7 years in 1986. Although theaverage length of hospitalization tends to increase withage, it dropped by about 2.5 days from the late 1960’sto the mid-1980’s.The total number of days of care rose from 224.5million in 1965 to 277.2 million in 1981 and declined to218.5 million in 1986. Age- and sex-adjusted number ofdays of care decreased by 30.2 percent from 1965through 1986.If use rates had remained unchanged from 1965through 1986, there would have been 308 million daysof inpatient care provided in 1986, rather than the218.5 million actually provided.From 1965 to 1983, the rise in hospital discharge ratesfor the elderly was larger than for any other age group.The rate increased 56.3 percent for patients 65–74years of age and 68.6 percent for patients 75 years ofage and over.After the implementation of the Medicare prospectivepayment system (PPS), hospital discharge rates de-creased for all age groups from 1983 through 198G24.4 percent for children, 15.3 percent for persons15-44 years of age, 16.9 percent for persons 45-64years of age, and 11 percent for the elderly.During the 1970’s, the discharge rate in the Midwestwas generally higher than the rates in the other threeregions, but by 1985-86, there were no statisticallysignificant differences in the rates for the four regions.In most years from 1965 to 1986, the average length ofstay was longest in the Northeast and shortest in theWest.
●
●
The Midwest and Northeast had relatively high rates ofdays of car% the West had the lowest.In 1965 the leading diagnostic category for inpatientadmission was deliveries and complications of preg-nancy, childbirth, and the puerperium. In 1986, it wasdiseases of the circulatory system.For children under 15 years of age, the discharge ratefor pneumonia decreased 40 percent, and the rate forfractures decreased by a fourth from 1965 to 1986.The discharge rate for mental disorders increased bymore than 80 percent for patients 15-44 years of agefrom 1965 to 1986.The discharge rate for acute myocardial infarctionincreased 36 percent from 1965 to 1986 for patients45-64 years of age and 57 percent for patients 65 yearsof age and over.The discharge rate for malignant neoplasms for pa-tients 45 years of age and over increased from 1965 to1983, but it decreased from 1983 to 1986.The discharge rate for fracture of the neck of the femurfor patients 65 years of age and over increased byalmost a third from from 1965 to 1986.The number of tonsillectomies with or without adenoi-dectomies for patients under 15 years of age in 1965was more than five times the number in 1986.The number and rate of cesarean sections increasedmore than 400 percent Iiom 1965 to 1986.The number and rate of lens extractions increasedfrom 1965 to 1983 but declined sharply as aninpatient procedure after 1983.The number of cardiac catheterizations increased from77,000 in 1970 to 775,000 in 1986.The number of coronary bypass procedures performedin 1986 was 20 times the number reported in 1970.
Hospital utilization
Overview
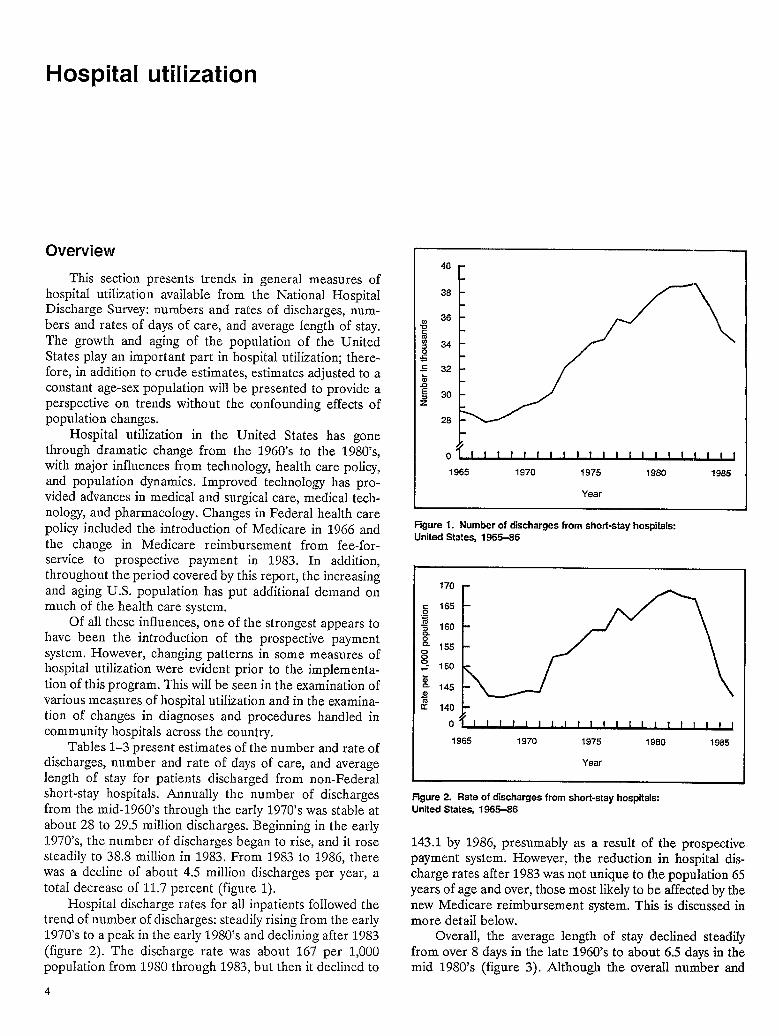
This section presents trends in general measures ofhospital utilization available from the National HospitalDischarge Survey: numbers and rates of discharges, num-bers and rates of days of care, and average length of stay.The growth and aging of the population of the UnitedStates play an important part in hospital utilization; there-fore, in addition to crude estimates, estimates adjusted to aconstant age-sex population will be presented to provide aperspective on trends without the confounding effects ofpopulation changes.
Hospital utilization in the United States has gonethrough dramatic change from the 1960’s to the 1980’s,with major influences from technology, health care policy,and population dynamics. Improved technology has pro-vided advances in medical and surgical care, medical tech-nology, and pharmacology. Changes in Federal health carepolicy included the introduction of Medicare in 1966 andthe change in Medicare reimbursement from fee-for-service to prospective payment in 1983. In addition,throLlghout the period covered by this report, the increasingand aging U.S. popLdation has put additional demand onmuch of the health care system.
Of all these influences, one of the strongest appears tohave been the introduction of the prospective paymentsystem. However, changing patterns in some measures ofhospital utilization were evident prior to the implementa-tion of this program. This will be seen in the examination ofvarious measures of hospital utilization and in the examina-tion of changes in diagnoses and procedLwes handled incommunity hospitals across the coLmtry.
Tables 1–3 present estimates of the nLlmber and rate ofdischarges, number and rate of days of care, and averagelength of stay for patients discharged from non-Federalshort-stay hospitals. AnnLlally the nLlmber of dischargesfrom the mid-1960’s through the early 1970’s was stable atabout 28 to 29.5 million discharges. Beginning in the early1970’s, the nL~mberof discharges began to rise, and it rosesteadily to 38.8 million in 1983. From 1983 to 1986, therewas a decline of aboLlt 4.5 million discharges per year, atotal decrease of 11.7 percent (figLue 1).
Hospital discharge rates for all inpatients followed thetrend of number of discharges: steadily rising from the early1970’s to a peak in the early 1980’s and declining after 1983(figL~re2). The discharge rate was about 167 per 1,000popLdation from 1980 through 1983, but then it declined to
4
0 ‘~1965 1970 1975 1980 1985
Year
F~ure 1. Number of discharges from short-stay hospitakUnited States,1966-66
0 ‘~uu1965 <970 1975 1960 1985
Year
Tgure 2. Rateof discharges from short-stay hospitals:Jnited States, 1965-S6
143.1 by 1986, presumably as a result of the prospectivepayment system. However, the reduction in hospital dis-charge rates aft er 1983 was not unique to the population 65years of age and over, those most likely to be affected by thenew Medicare reimbursement system. This is discussed inmore detail below.
Overall, the average length of stay declined steadilyfrom over 8 days in the late 1960’s to about 6.5 days in themid 1980’s (figure 3). Although the overall number and
8.5
8.3
8.1
7.9
7.7
7.5
7.3
7.1
6.9
6.7
6.5
0
1965 1970 1975 1980 1985
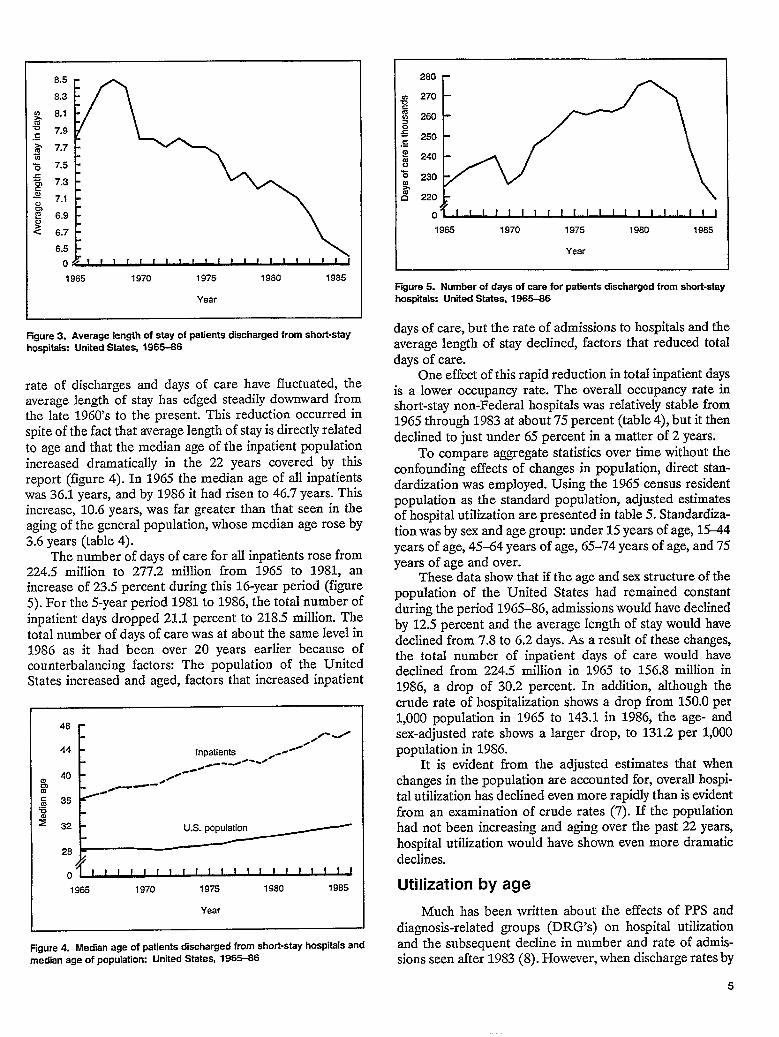
Figure 3. Average length of stay of patients discharged fromshott+tayhospitals: United States, 1966-66
rate of discharges and days of care have fluctuated, theaverage length of stay has edged steadily downward fromthe late 1960’s to the present. This reduction occurred inspite of the fact that average length of stay is directly relatedto age and that the median age of the inpatient populationincreased dramatically in the 22 years covered by thisreport (figure 4). In 1965 the median age of all inpatientswas 36.1 years, and by 1986 it had risen to 46.7 years. Thisincrease, 10.6 years, was far greater than that seen in theaging of the general population, whose median age rose by3.6 years (table 4).
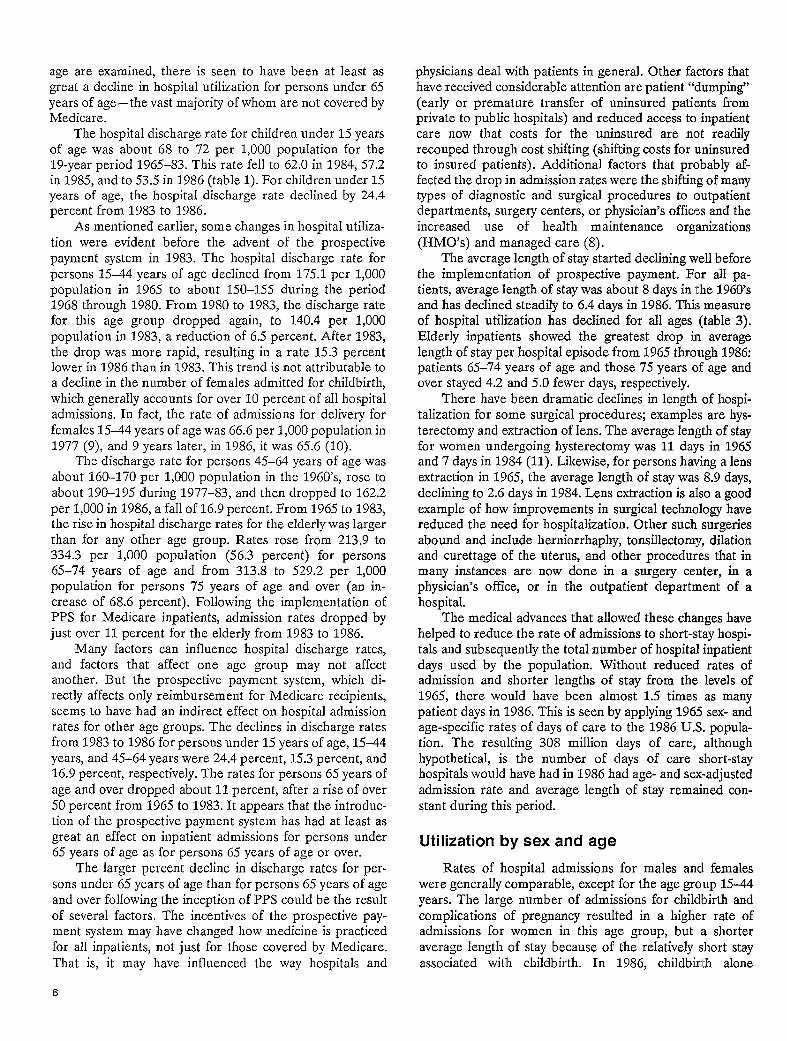
The number of days of care for all inpatients rose from224.5 million to 277.2 million from 1965 to 1981, anincrease of 23.5 percent during this 16-year period (figure5). For the 5-year period 1981 to 1986, the total number ofinpatient days dropped 21.1 percent to 218.5 million. Thetotal number of days of care was at about the same level in19S6 as it had been over 20 years earlier because ofcounterbalancing factors: The population of the UnitedStates increased and aged, factors that increased inpatient
46
44
26
o’f,1965 1970 1975 1980 1985
Year
Figure 4. Medisn age of patients discharged from shorbstay hospitals andmedian age of population: United States, 1965-66
280 1-
270
260
250
240
230
220 -
o’~1965 1970 1975 1980 1965
Year
Fmure 5. Number of daw of care for Datients discharmd from short-stavI&pitaIs: United Stste~ 1965-66 .
days of care, but the rate of admissions to hospitals and theaverage length of stay declined, factors that reduced totaldays of care.
One effect of this rapid reduction in total inpatient daysis a lower occupancy rate. The overall occupancy rate inshort-stay non-Federal hospitals was relatively stable from1965 through 1983 at about 75 percent (table 4), but it thendeclined to just under 65 percent in a matter of 2 years.
To compare aggregate statistics over time without theconfounding effects of changes in population, direct stan-dardization was employed. Using the 1965 census residentpopulation as the standard population, adjusted estimatesof hospital utilization are presented in table 5. Standardiza-tion was by sex and age group: under 15 years of age, 15-44years of age, 45–64 years of age, 65–74 years of age, and 75years of age and over.
These data show that if the age and sex structure of thepopulation of the United States had remained constantduring the period 1965–86, admissions would have declinedby 12.5 percent and the average length of stay would havedeclined from 7.8 to 6.2 days. As a result of these changes,the total number of inpatient days of care would havedeclined from 224.5 million in 1965 to 156.8 million in1986, a drop of 30.2 percent. In addition, although thecrude rate of hospitalization shows a drop from 150.0 per1,000 population in 1965 to 143.1 in 1986, the age- andsex-adjusted rate shows a larger drop, to 131.2 per 1,000population in 1986.
It is evident from the adjusted estimates that whenchanges in the population are accounted for, overall hospi-tal utilization has declined even more rapidly than is evidentfrom an examination of crude rates (7). If the populationhad not been increasing and aging over the past 22 years,hospital utilization would have shown even more dramaticdeclines.
Utilization by age
Much has been written about the effects of PPS anddiagnosis-related groups (DRG’s) on hospital utilizationand the subsequent decline in number and rate of admis-sions seen after 1983 (8). However, when discharge rates by
5
age are examined, there is seen to have been at least asgreat a decline in hospital utilization for persons under 65years of age–the vast majority of whom are not covered byMedicare.
The hospital discharge rate for children under 15 yearsof age was about 68 to 72 per 1,000 population for the19-year period 1965–83. This rate fell to 62.0 in 1984, 57.2in 1985, and to 53.5 in 1986 (table 1). For children under 15years of age, the hospital discharge rate declined by 24.4percent from 1983 to 1986.
As mentioned earlier, some changes in hospital utiliza-tion were evident before the advent of the prospectivepayment system in 1983. The hospital discharge rate forpersons 15-44 years of age declined from 175.1 per 1,000population in 1965 to about 150–155 during the period1968 through 1980. From 1980 to 1983, the discharge ratefor this age group dropped again, to 140.4 per 1,000population in 1983, a reduction of 6.5 percent. After 1983,the drop was more rapid, resulting in a rate 15.3 percentlower in 1986 than in 1983. This trend is not attributable toa decline in the number of females admitted for childbirth,which generally accounts for over 10 percent of all hospitaladmissions. In fact, the rate of admissions for delivery forfemales 15-44 years of age was 66.6 per 1,000 population in1977 (9), and 9 years later, in 1986, it was 65.6 (10).
The discharge rate for persons 45–64 years of age wasabout 160-170 per 1,000 population in the 1960’s, rose toabout 190–1 95 during 1977–83, and then dropped to 162.2per 1,000 in 1986, a fall of 16.9 percent. From 1965 to 1983,the rise in hospital discharge rates for the elderly was largerthan for any other age group. Rates rose from 213.9 to334.3 per 1,000 population (56.3 percent) for persons65-74 years of age and from 313.8 to 529.2 per 1,000population for persons 75 years of age and over (an in-crease of 68.6 percent). Following the implementation ofPPS for Medicare inpatients, admission rates dropped byjust over 11 percent for the elderly from 1983 to 1986.
Many factors can influence hospital discharge rates,and factors that affect one age group may not affectanother. But the prospective payment system, which di-rectly affects only reimbursement for Medicare recipients,seems to have had an indirect effect on hospital admissionrates for other age groups. The declines in discharge ratesfrom 1983 to 1986 for persons under 15 years of age, 15-44years, and 45–64 years were 24.4 percent, 15.3 percent, and16.9 percent, respectively. The rates for persons 65 years ofage and over dropped about 11 percent, after a rise of over50 percent from 1965 to 1983. It appears that the introduc-tion of the prospective payment system has had at least asgreat an effect on inpatient admissions for persons under65 years of age as for persons 65 years of age or over.
The larger percent decline in discharge rates for per-sons under 65 years of age than for persons 65 years of ageand over following the inception of PPS cou]d be the resultof several factors, The incentives of the prospective pay-ment system may have changed how medicine is practicedfor all inpatients, not just for those covered by Medicare.That is, it may have influenced the way hospitals and
physicians deal with patients in general. Other factors thathave received considerable attention are patient “dumping”(early or premature transfer of uninsured patients fromprivate to public hospitals) and reduced access to inpatientcare now that costs for the uninsured are not readilyrecouped through cost shifting (shifting costs for uninsuredto insured patients). Additional factors that probably af-fected the drop in admission rates were the shifting of manytypes of diagnostic and surgical procedures to outpatientdepartments, surgery centers, or physician’s offices and theincreased use of health maintenance organizations(HMO’s) and managed care (8).
The average length of stay started declining well beforethe implementation of prospective payment. For all pa-tients, average length of stay was about 8 days in lthe 1960’sand has declined steadily to 6.4 days in 1986. This measureof hospital utilization has declined for all ages (table 3).Elderly inpatients showed the greatest drop in averagelength of stay per hospital episode from 1965 through 1986:patients 65-74 years of age and those 75 years of age andover stayed 4.2 and 5.0 fewer days, respectively.
There have been dramatic declines in length of hospi-talization for some surgical procedures; examples are hys-terectomy and extraction of lens. The average ]ength of stayfor women undergoing hysterectomy was 11 days in 1965and 7 days in 1984 (11). Likewise, for persons having a lensextraction in 1965, the average length of stay was, 8,9 days,declining to 2.6 days in 1984. Lens extraction is aIso a goodexample of how improvements in surgical technology havereduced the need for hospitalization. Other such surgeriesabound and include herniorrhaphy, tonsillectomy, dilationand curettage of the uterus, and other procedures that inmany instances are now done in a surgery center, in aphysician’s office, or in the outpatient department of ahospital.
The medical advances that allowed these changes havehelped to reduce the rate of admissions to short-stay hospi-tals and subsequently the total number of hospital inpatientdays used by the population. Without reduced rates ofadmission and shorter lengths of stay from the levels of1965, there would have been almost 1.5 times as manypatient days in 1986. This is seen by applying 1965 sex- andage-specific rates of days of care to the 1986 U.S. popula-tion. The resulting 308 million days of care, althoughhypothetical, is the number of days of care short-stayhospitals would have had in 1986 had age- and sex-adjustedadmission rate and average length of stay remained con-stant during this period.
Utilization by sex and age
Rates of hospital admissions for males ancl femaleswere generally comparable, except for the age group 15-44years. The large number of admissions for childbirth andcomplications of pregnancy resulted in a higher rate ofadmissions for women in this age group, but a shorteraverage length of stay because of the relatively short stayassociated with childbirth. In 1986, childbirth alone
6

accounted for 40.1 percent of all admissions for women average lengths of stay for boys and girls under 15 years of15–44 years of age, and the average length of stay for these age were about the same. Men and women 45–64 years ofwomen was 3.2 days. In other age groups, differences in age had similar discharge rates and average lengths of stay.admission rates and average length of stay were not as For the elderly, discharge rates for women tended to runpronounced, although some differences were present. about 15 per 1,000 population lower than those for men,
The discharge rate for boys was consistently lower than but elderly women tended to stay in the hospital slightlythat for girls-by about 15 per 1,000 population. This is longer than their male counterparts.about a 20-percent lower discharge rate for boys. However,

Utilization by regionand age
Trends in hospital use in the four census geographicregions of the country are discussed in this section. TheStates that comprise each region are listed in appendix III.Tables 6–9 show the numbers of discharges, rates ofdischarges and days of care, and average lengths of stay byage for each region from 1965 to 1986.
It should be noted that, unlike rates in other sections ofthis report, the rates of discharges and days of care for1965–80 were based on the civilian noninstitutionalizedpopulation. Estimates of the civilian resident population byage and region were not available from the US. Bureau ofthe Census for these years. Beginning with 1981, data forthe civilian resident population were available and wereused to calculate rates.
This change primarily affected the rates for patients 65years of age and over. The rates for the elderly wereoverestimated somewhat when the institutionalized popula-tion (of which people in nursing homes were a substantialpart) was excluded from the population base (5). Anotherdifference is that the region referred to as the Midwest inthis report was known as North Central before 1985.
Discharge rates
The patterns of change in discharge rates were gener-ally similar for the four regions over the last two decades(figure 6). During the first years of the survey, dischargerates either did not change significantly (Midwest and
190
180
170
130
120
1./”-., .~- \.- ._-<
/ -\ /“H .x-------./. “\
/ .\.
/.\.
./.. \.. %...... ...... .......\
// ....,. >...., ....
/ .........- %./ ...
-../ ... \
/....-.....
O,\ ,.i
,/. .-. . . . . .
./ ...’ .- -= ---> $..p:----------~ ....,. .-,/’ ----Mf
\ ..-%. ..... .........” \-.\- ..>,..,” ,. -,.. \ .,
[v -–- Northeast
--- Midwest. .. . ... . . South
— West
#
o I I I I I I I I 1 I I 1 1 I I I I 1 1 I I 1
1965 1966 1967 1968 1969 1970 1971 1972 1973 1974 1975 1976 1977 1978 1979 1980 1981 1982 1983 1984 1985 1986
Year
Figure 6. Discharge rates, by region: United States, 196S-S6
8

Northeast) or decreased (South and West). In the 1970’s,the discharge rates rose in each region. From 1971 to 1977,the discharge rate increased 27 percent in the West and 17percent in the Midwest. In the Northeast, the discharge raterose 22 percent from 1969 to 1977; and in the South, therate increased 22 percent from 1969 to 1979.
In the 1980’s, the discharge rate for each region hasbeen declining. A decrease of 14 percent was reported bothfor tie West (from 1977 to 1986) and the Northeast (from1980 to 1986). The discharge rate fell 20 percent in theMidwest from 1981 to 1986 and 18 percent in the Southfrom 1983 to 1986. By 1986, each region had returned to adischarge rate not significantly different from the rate it hadin 1965.
During the 1970’s, the discharge rate in the Midwestwas generally higher than the rates in the other threeregions, and the Midwest rate remtined significantly higherthan the rate in the West through 1984. The discharge ratein the South was also significantly higher than the rate inthe West during the majori~ of the years from 1970 to1984. Rate differences between the West and the Northeastand the South and the Northeast were generally not signif-icant. As discharge rates declined during the 1980’s, re-
gional differences diminished, so that, in 1985 and 1986, nosignificant differences remained among the rates for thefour regions (12).
Unlike discharge rates for all patients, rates for chil-dren under 15 years of age were generally stable during the1960’s and 1970’s (figure 7). The only significant increasewas a 28 percent rise in the discharge rate for children inthe South from 1978 to 1983. In recent years, dischargerates for children have decreased dramatically. From 1977to 1986, rates for children fell 38 percent in the Midwestand 36 percent in the West. Although they did not begin todecline until 1983, discharge rates for children fell 32percent in the Northeast and 24 percent in the South by1986. The 1986 discharge rates for children were signifi-cantly lower than 1965 rates in every region but the South.
In 1965, discharge rates for children were higher in theMidwest and Northeast than in the West and South. By1977, the rate for the Midwest was significantly higher thanthe rate for any other region, but this soon changed as therate for the Midwest declined and the rate for the Southincreased. In 1986, the discharge rate for children in theSouth was higher than rates in the Northeast and West, butnot significantly different from the rate in the Midwest.
90 r
80
70
60
50
40 -
)--- Nor!heast—.- Midwest
30 ‘“”””””South— West
<
0 I I t I 1 t I 4
1965 1966 i 971 1974 1977 1980 1983 1986
Year
Figure 7. Oischarge rates for patients under 15 yeara of age, by region: United Ststeq 196S-66
9

The discharge rates for patients 15-44 years of agedecreased significantly in each of the four regions from1965 to 1986, and the regional rates for this age groupbecame much more alike in recent years (figure 8). Thedischarge rate declined 36 percent in the South, 33 percentin the Midwest and West, and 26 percent in the Northeastfrom 1965 to 1986.
The declines took place primarily in two periods: 1965to 1971–72 and 1977 to 1986. During the first of theseperiods, birth rates were declining, but changes in birthrates cannot explain the decreases in the second period(13). Patients in the Northeast Region who were 1544years of age did not demonstrate the decrease in dischargerates during the first period that was seen in the other threeregions. The second period of decline in discharge rates inthe South did not begin until 1979.
In 1965 the discharge rate in the South for patients15–44 years of age was higher than rates in the Northeastand West, but not significantly different from the rate in theMidwest. By 1986, the regional rates did not differsignificantly.
The general pattern in discharge rates for patients45–64 years of age in each region was a sizable increase in
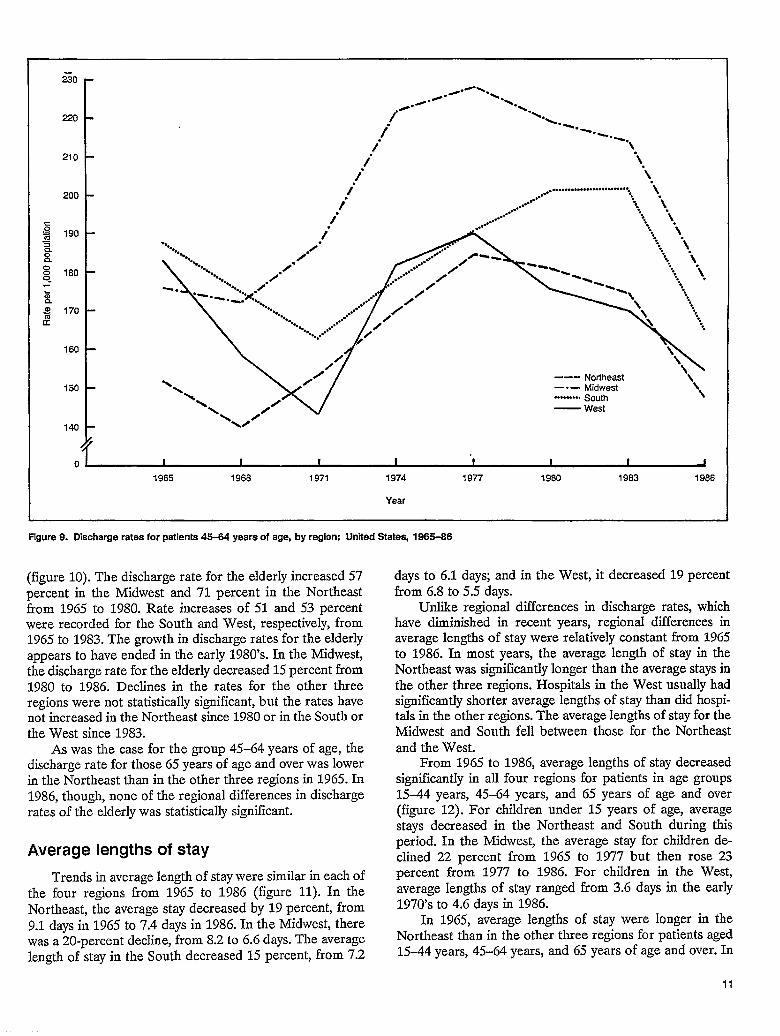
discharge rates in the 1970’s followed by a substa.ntizddecrease in rates during the 1980’s (figure 9). In theMidwest, the discharge rates for patients 45-64 years of ageincreased by a third from 1967 to 1975, then decreased 22percent from 1975 to 1986. The discharge rate for theNortheast grew 35 percent from 1967 to 1977 and dropped20 percent from 1977 to 1986.
In the South and West, discharge rates for patients45–64 years of age decreased from 1965 to 1971. Ratesthen increased 28 percent from 1971 to 1979 in the Southand 33 percent from 1971 to 1977 in the West, anddecreased again during the remainder of the period. In theWest, the 1986 discharge rate for patients 45–64 years ofage was 15 percent lower than the 1965 rate, but the 1986discharge rates for the other three regions were not signif-icantly different from rates in 1965.
In 1965 the discharge rate for patients 45–64 years ofage was lower in the Northeast than in the other threeregions, and in 1977 the rate in the Midwest was higher thanrates in the other regions. In 1986, however, the rates in thefour regions did not differ significantly.
Discharge rates for patients 65 years of age and overrose steadily in each region from 1965 until the early 1980’s
200
190
180
170
160
150
140
130
120
110
4
-—- Northeast-- — Midwesl
\
..--””-””South— West
\.
\.\.
\,
.\\
‘\\ “.,
ol 1 1 I I 1 t ) 41965 1968 1971 1974 1977 1960 1983 19%(
Year
Figure 8. Dmharge rates for patients 15-44 yeers of age, by rmion: United States. 1966-86
10
#-..-/“ N
/“ “N.,/” N.
-+%.\/-1 “b.
---
/“ “\./” “\.
/ \./ .... . .......... ..........
f-i
/.,.““..
-.
--- Northeast\\ \\
—-— Midwest\\
/ .-m-o- South \
\ 0 — West\N
\/
o I 1 I I I I I I1965 196S 1971 1974 1977 19S0 1963 1986
Year
Figure 9. Discharge rates for patients 4S-434 years of ege, by regiom United Statesj 196S-66
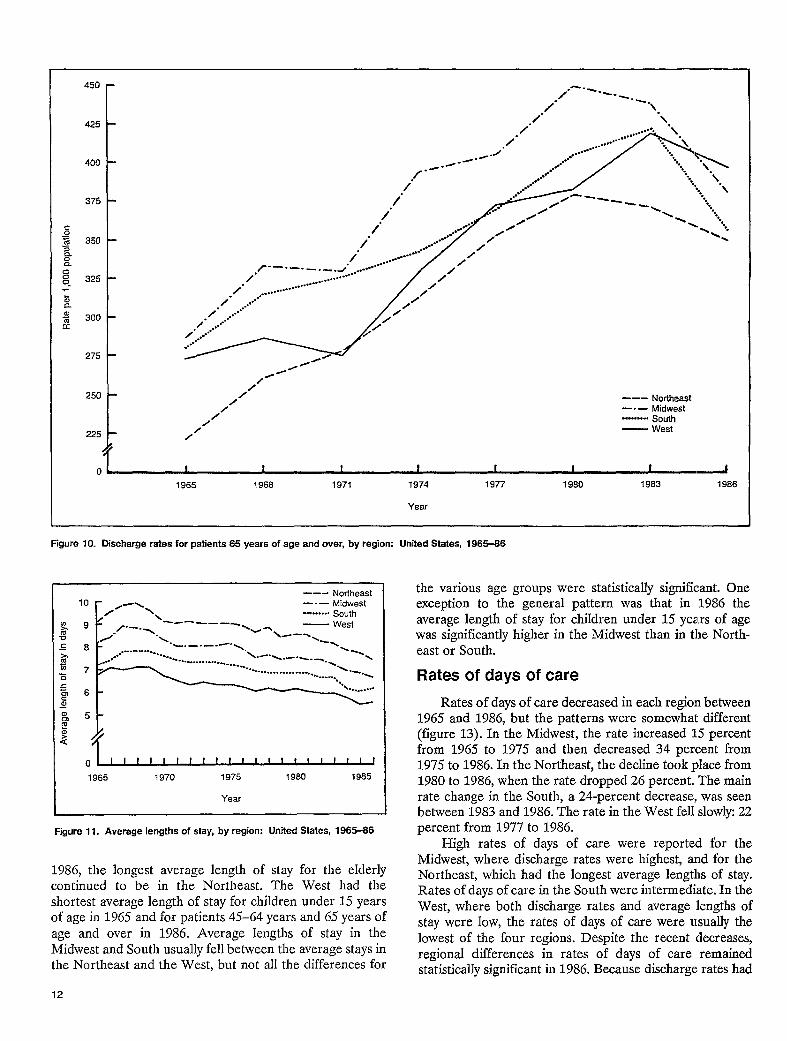
days to 6.1 days; and in the West, it decreased 19 percent(figure 10). The discharge rate for the elderly increased 57percent in the Midwest and 71 percent in the Northeastfrom 1965 to 1980. Rate increases of 51 and 53 percentwere recorded for the South and West, respectively, from1965 to 1983. The growth in discharge rates for the elderlyappears to have ended in the early 1980’s. In the Midwest,the discharge rate for the elderly decreased 15 percent from1980 to 1986. Declines in the rates for the other threeregions were not statistically significant, but the rates havenot increased in the Northeast since 1980 or in the South orthe West since 1983.
As was the case for the group 45–64 years of age, thedischarge rate for those 65 years of age and over was lowerin the Northeast than in the other three regions in 1965. In1986, though, none of the regional differences in dischargerates of the elderly was statistically significant.
Average lengths of stay
Trends in average length of stay were similar in each ofthe four regions from 1965 to 1986 (figure 11). In theNortheast, the average stay decreased by 19 percent, from9.1 days in 1965 to 7.4 days in 1986. In the Midwest, therewas a 20-percent decline, from 8.2 to 6.6 days. The averagelength of stay in the South decreased 15 percent, from 7.2
from 6.8 to 5.5 days..
Unlike re~onal differences in discharge rates, whichhave diminished in recent years, regional differences inaverage lengths of stay were relatively constant from 1965to 1986. In most years, the average length of stay in theNortheast was significantly longer than the average stays inthe other three regions. Hospitals in the West usually hadsignificantly shorter average lengths of stay than did hospi-tals in the other regions. The average lengths of stay for theMidwest and South fell between those for the Northeastand the West.
From 1965 to 1986, average lengths of stay decreasedsignificantly in all four regions for patients in age groups15-44 years, 45–64 years, and 65 years of age and over(figure 12). For children under 15 years of age, averagestays decreased in the Northeast and South during thisperiod. In the Midwest, the average stay for children de-clined 22 percent from 1965 to 1977 but then rose 23percent from 1977 to 1986. For children in the West,average lengths of stay ranged from 3.6 days in the early1970’s to 4.6 days in 1986.
In 1965, average lengths of stay were longer in theNortheast than in the other three regions for patients aged15–44 years, 45–64 years, and 65 years of age and over. In
11
450,/”- -------
/-.
\
425/“ “L
/“/“
/“400
./-./--
./”-
./
375 /
/“
/“ ...350 /“
.....”...
/“.....
. ....r - -. —- --- .J; ..... ..”.”....
325 / ... ....-”””/.
. . ... .... ....
/“ .-..”.””/. ........300
/. ......./. .........-.
275,4
///
250/
// --- Northeast
//
—.- Midwest
/ . ... . ...- South
225 / — West0’
0
1965 1968 1971 1974 1977 1980 1983 1986
Year
Figure 10. Discharge rates for patients 65 years of age and over, by region: United States, 196%66
10
c 8“;F175
--- NortheastT .-L —-— Midwest
/ \\ . .. .. . ..OSouth
-.--——-/\ .- . — West-v -
./- “\ N--.,‘>
‘“”--- .“%......----
o~1965 1970 1975 1980 1985
Year
Figure 11, Average lengths of stay, by region: United States, 1965-66
1986, the longest average length of stay for the elderlycontinued to be in the Northeast. The West had theshortest average length of stay for children under 15 yearsof age in 1965 and for patients 45–64 years and 65 years ofage and over in 1986. Average lengths of stay in theMidwest and South usually fell between the average stays inthe Northeast and the West, but not all the differences for
12
the various age groups were statistically significant. Oneexception to the general pattern was that in 1986 theaver;ge length of ;tay for ;hildren under 15 yearnsof agewas significantly higher in the Midwest than in the North-east or South.
Rates of days of care
Rates of days of care decreased in each region between1965 and 1986, but the patterns were somewhat different(figure 13). In the Midwest, the rate increased 15 percentfrom 1965 to 1975 and then decreased 34 percent from1975 to 1986. In the Northeast, the decline took place from1980 to 1986, when the rate dropped 26 percent. The mainrate change in the South, a 24-percent decrease, was seenbetween 1983 and 1986. The rate in the West fell slowly 22percent from 1977 to 1986.
High rates of days of care were reported for theMidwest, where discharge rates were highest, and for theNortheast, which had the longest average lengths of stay.Rates of days of care in the South were intermediate. In theWest, where both discharge rates and average lengths ofstay were low, the rates of days of care were usually thelowest of the four regions. Despite the recent decreases,regional differences in rates of days of care remainedstatistically significant in 1986. Because discharge rates had
Under 15 years
5.5 Northeast ❑5.5 .3
Midwest5.3 Ii?z
4. ❑south E!wi.’<+:,7
15-44 years WestIEiiiil
6.7 5.3
6 5.2
4.7
.2
1965 4S-64 years 1986
11.6 7.5
1 6.9
6.7
65 years and over
15.6
15 12 9 6 3 0 3 6 9 12 15
Average length of stay in days
Figure 12. Average Iengtfrs of stay, by region and agcv United Stat= 1965 and 1986
become similar across the regions by 1986, these differ-ences were due primariIy to variations in average lengths ofstay.
From 1965 to 1986, each of the four regions reportedsignificant decreases in rates of days of care for patientsunder 15 years, 15J14 years, and 45–64 years of age (figure14). Rates for these age groups decreased 32-57 percent.The only significant change in rates of days of care forpatients 65 years of age and over was an 18-percent declinein the Midwest rate from 1965 to 1986.
The lowest rates of days of care for the individual age
groups were seen mostly in the West. Differences in ratesamong the other three regions were not statistically signifi-cant for children under 15 years in 1965 or for patients15-44 and 45–64 years of age in either 1965 or 1986.Children under 15 years of age had higher rates of days ofcare in the Midwest and South than in the Northeast andWest in 1986. For the elderly, the highest rate of days ofcare was in the Midwest in 1965. However, in 1986, the ratein the Midwest was not significantly different from that forthe Northeast, which was higher than those in the Southand West.
13

1,600
i ,500
1,400
1,300
1,000
900
800
--- Northeast--- Midwest
./”\, .—* south/ x. _. West
\.. .. ..... --... __*/-+% ‘-i:,.....
*..” -- . . . . ... *O‘“”%. . .....”
+.....-..-%.-.. ....%... . ....
\\ ...’”””-.“--”-.....-””\4/--.””’ \.‘+\
....”” “i% ~ ~●., ‘\,, ‘\.% \\
.1
“. “\.’\%%+ \%%
‘$Q.-
t%
““\
I I I I I I I I I I I I I I I I I I I I J
1965 1966 1967 1968 1969 1970 1971 1972 1973 1974 1975 1976 1977 1978 1979 1980 1981 1982 1983 1984 1985 1986
Year
Figure 13. Rates of days of care by region: United Stalea 196S-86

3,930
1,035
1,093
1,076
Under 15 years
455 l--h 194 Northeast n
465 297
3S9 275
287 178
15-44Eyears
I I I
89 474
606
642
571
I45-64 yeara
1,767 111
1,823 1,233
1,64 ,110
1,
~
MidwestEz
Q..:....-
South ##jjj............
WestEE!l!/
1986
65 years”and over<
3,s90
2
) 1 I I 1 I I I [ I I
4,000 3,200 2,400 1,600 800 0 800 1,600 2,400 3,200 4,000
Days of care per 1,000 population
Figure 14. Rates of days of c-are, by region and agex United State& 1965 snd 19B6

Utilization by diagnosis
In 1965, the International Classification of Diseasescategory representing the most discharges was deliveriesand complications of pregnancy, childbirth, and thepuerperium. Other leading categories were diseases of thedigestive system, diseases of the respiratory system, andinjuries and adverse effects of chemical and other externalcauses. Together these four categories accounted for 54percent of the discharges in 1965.
In 1986, the leading category was diseases of thecirculatory system, which ranked only sixth in 1965.Complications of pregnancy, childbirth, and thepuerperium including deliveries (ICD-9-CM code V27),diseases of the digestive system, and injury and poisoningwere also major categories in 1986. These four categoriesmade up 50 percent of the discharges in 1986. Even thoughindividual codes in many of the categories underwent somechanges with each revision of the ICD, the categoriesthemselves have remained generally comparable.
In this section trends of discharge rates for selecteddiagnoses are discussed. Diagnostic data are presented forfour age groups—under 15 years, 1544 years, 45–64 years,and 65 years and over. The diagnoses presented werechosen based on their importance to a particular age groupand because the diagnostic codes over three revisions of theInternational Classification of Diseases were comparable.Except where noted otherwise, the trends are based on thefirst-listed or principal diagnosis.
Under 15 years
Trends in hospital discharge rates for pneumonia, frac-tures, and diseases of the ear and mastoid process forpatients under 15years of age are shown in table 10. ForchiIdren with pneumonia, the discharge rate decreased 40percent, from 63.3 per 10,000 population in 1965 to 37.4 in1986 (figure 15). Discharge rates were relatively high in1968, 1972, 1979, and 1982, which closely corresponded toepidemic years for influenza (14). Children under 5 years ofage had higher discharge rates for pneumonia than didchildren 5-14 years of age (15).
The discharge rate for fractures decreased by a fourth,from 33.9 per 10,000 population in 1965 to 25.7 in 1986(figure 16), Older children had higher discharge rates forfractures than did younger children, in contrast to pneumo-nia, for which younger children had higher rates (16).
The discharge rates for patients under 15 years with adiagnosis of diseases of the ear and mastoid process tripled
16
1965 1970 1975 1980 1985
Year
Fgure 15. Oiacharge rates for patients under 15 years of age with
pneumonia: United State% 196546
-=--+-x1 I I 1 1 I 1 1 ! I I I I 1 I I I I I I I
I 12 1965 1970 1975 1980 1985
I YearL
Fgure 16. Discharge rates for patients under 15 years of age withfracture= Unlfed States, 1965-W
from 1965 to 1980, then decreased by over 50 percent from1980 to 1986 (figure 17). The significant decrease in thedischarge rates for this condition was most likely due totreatment of the condition on an outpatient basis in recentyears. For example, there has been a significant decrease ininpatient myringotomies, which are now being performed inambulatory settings. This is a treatment for otit.is media,which was the diagnosis for about 90 percent of the dis-charges for diseases of the ear and mastoid process. Thedischarge rate for otitis media, like the rate for pneumonia,was higher for younger children.
15-44 years
Discharge rates for patients 15–44 years of age areshown in table 11 for appendicitis, mental disorders, and

f! o~1965 1970 1975 1980 1985
I Year IFgure 17. Oischarge rates for patients under 15 years of age withdiseases of the ear and mastoid process: United States, 1965-S6
intervertebrzd disc disorders. The discharge rate for pa-tients with appendicitis decreased 45 percent, from 24.2 per10,000 population in 1965 to 13.5 in 19S6 (figure 18).Patients aged 15-44 years made up from 50 percent to 60percent of all appendicitis discharges during this period.
For mental disorders, the discharge rate increased bymore than 80 percent during this period, from 50.5 per10,000 population in 1965 to 98.1 in 1986 (figure 19).Hospitalizations for alcoholism made up a significant partof the discharges in the mental disorders category duringthis period.
The discharge rate for patients aged 15-44 years withintervertebral disc disorders increased by over 50 percent,
5& Z53~ 20000. 750
10~ J50 o’ I I I I 1 I 1 I I I I 1 I I I I 1 I I I [1% 1965 1970 1975 1980 1985
Year
gure 18. Oischarge rates for patients 16-44 years of age withaPPenckifk: United Stalesj 1986-86
1005.=m 903~ao
g 700-
g60
0 50
20
1965 1970 1975 1980 1985
Year
F@rre 19. Oischarge rates for patients Ii%kl years of age with mentaldisorders: United States, 1966-86
from 15.8 per 10,000 population in 1965 to 24.1 in 1986(figure 20). The rate of surgical treatment for the disorderalso increased during this time period. Patients in this agegroup accounted for about one-half of all discharges forintervertebral disc disorders.
45-64 years
Numbers and rates of discharges for malignant neo-plasms, acute myocardial infarction, cholelithiasis, and ul-cers of the stomach and small intestine are shown in table12 for patients 45–64 years of age.
During the 19-year period from 1965 to 1983, thedischarge rate for malignant neoplasms increased 55 per-cent, from 104.6 per 10,000 population in 1965 to 165.8 per10,000 population in 1983 for patients 45–64 years ofage (figure 21). During the next 3 years the rate decreased14 percent, from 165.8 per 10,000 population in 1983 to140.2 in 1986.
The discharge rate for malignant neoplasm of thetracheaj bronchus, and lung increased 200 percent horn1965 to 1983, then decreased 21 percent by 1986. Malign-ant neoplasm of the breast had a 75-percent increase indischarge rates from 1965 to 1983 but an 18-percent de-crease from 1983 to 1986. There was no significant changein the discharge rates for malignant neoplasm of the largeintestine and rectum during the 22-year period. Patients45–64 years of age accounted for 33 to 40 percent of alldischarges with a diagnosis of malignant neoplasms in theperiod.
!;~~1965 1970 1975 1980 1985
r%
Year
Fgure 20. Oischarge rates for patients 15+4 years of ege withintervertebral disc disorders: United Ststesj 1985-86
c 180.g r
g 160
23a 1000
Zo1965 1970 1975 1980 1985
Year
F~ure 21. Discharge rates for pe!ients 46-64 years of age withmalignant neoplasms: United States, 1965-86
17

Figure 22 shows the trend in discharge rates for acutemyocardial infarction for patients 45–64 years of age. Thedischarge rate for acute myocardial infarction increased 36percent, from 42.9 per 10,000 population in 1965 to 58,4 in1986.
In 1982, the National Center for Health Statistics madea decision to reorder circulatory diagnoses that include anacute myocardial infarction. It had been noted that acutemyocardial infarction sometimes was not the lead entry in agroup of circulato~ diagnoses when it shouId have been.The new procedure is that an acute myocardial infarctionshould be reordered to the first position whenever it isencountered with other circulato~ diagnoses and is not thefirst entry. This reordering began with 1982 NHDS data,but in this report, the same reordering was carried out on1965 through 1981 data as well.
The discharge rate for cholelithiasis for patients 45–64years of age was essentially unchanged from 1965 through1986 (figure 23). It was 36.6 per 10,000 population in 1965and 33.4 per 10,000 population in 1986. This age groupaccounted for at least a third of all discharges forcholelithiasis.
In contrast, the discharge rate for ulcers of the stomachand small intestine, another relatively common diagnosisfor patients in this age group, decreased 64 percent, from49.5 per 10,000 population in 1965 to 17.8 per 10,000population in 1986 (figure 24). This reduction was due in
1965 1970 197.5 1980 1985
Year
Fgure 22. Discharge rates for patients 46-64 years of age with acutemyocard~l infarction: United States, 196&66
I
45
1-
:~
3: ~
1965 1970 1975 1980 1985
Year
Figure 23. Dkcharge rates for patients 46-64 years of age withcholelithiasis: United State% 1965-S6
18
part to new drug therapy, such as the use of cimetidine. Theneed for hospitalization was minimized for some patientstreated with the new drugs.
65 years and over
Discharge rates for patients 65 years of age and overare presented in table 13 for four diagnoses: malignantneoplasms, acute myocardial infarction, fracture of neck ofthe femur, and diabetes. As was the case for patients 45-64years of age, the discharge rate for malignant neoplasms forpatients 65 years of age and over increased from 1965 to1983. The rate in 1965 was 227.7 per 10,000 population,and by 1983 it had risen 78 percent to 386.7 per 10,000population (figure 25). The discharge rate for the elderlyfor malignant neoplasms decreased 13 percent from 1983to 1986, which was similar to the decrease in the rate forthis diagnosis for patients 45-64 years of age during thesame period.
The discharge rate for patients 65 years of age and overfor acute myocardial infarction increased 57 percent, from98.5 per 10,000 population in 1965 to 155.0 per 10,000population in 1986 (figure 26). The reordering procedurefor acute myocardial infarction described earlier was alsodone for patients 65 years of age and over. Patients 65 yearsof age and over had rates for acute myocardial infarctionthat were more than twice those for patients 45–64 yearsof age.
I
--’---L
I 1965 1970 1975 1980 1985
I
L Year
-1
Fgure 24. Discharge rates for patiente 46-64 years of age with ulcers ofthe stomach and small intestine: United States 1965-S6
1 1965 1970 1975 1980 1985I
Year
Figure 25. Discharge rates for patients 65 years of age and over withmaliinant neoplasms: United States, 1966-66

160 r
150
140
130
120
110
100LM
‘/,,,,,,,,,,,,,,,,,,,,,o
1965 1970 1975 1980 1985
Year
Ffgure 26. Discharge rates for patients 65 yeara of age and over withacute myocardlsl lnferotion: UnitedStete~ 1965-86
Discharge rates for fracture of the neck of the femur,another common reason for hospitalization of the elderly,increased by almost a third, from 57.4 per 10,000 popula-tion in 1965 to 74.8 in 1986 (figure 27). Patients 85 years ofage and over (the oldest old) accounted for 35 percent ofthe discharges with this condition in this age group. Patients65 years and over made up nearly 90 percent of all dis-charges with fracture of the neck of the femur.
The discharge rate for patients 65 years of age and overw“th a first-listed or principal diagnosis of diabetes in-creased horn 74,8 per 10,000 population in 1965 to 93.2 per10,000 population in 1983, followed by a sharp decrease to61.5 per 10,000 population in 1986 (figure 28). The rate fordiabetes as an all-listed diagnosis, however, increased bymore than 125 percent, from 235.9 per 10,000 populationin 1965 to 530.6 per 10,000 population in 1986 (figure 29).All-listed diabetes includes all discharges with diabeteslisted on the medical record, whether mentioned as aprincipal or a seconda~ diagnosis. The rate of all-listeddiabetes did not decrease from 1983 to 1986; thus theremay have been a change in reporting practices after theintroduction of the prospective payment system, resuIting indiabetes being more frequently listed as a secondarydiagnosis.
80 r
75
70
65
60
55 lw’~
1965 1970 1975 i 980 1985
Yesr
F~ure 27. Discharge rates for patients 65 years of age and over with
fracture of neck of femuE United State& 1965-86
I
r
b.60
},,, ,,,,,,,,1,, ,,, LIn
L!zo i I (1965 ~970 1975 1980 1965
Year
Fgwe 28. Oischarge rates for patients 65 yeara of age and over with afirst-listad disgnosis of diabetex United States, 1965-S6
~:~~
~ 200~
&o
1965 1970 1975 1980 1865
Year
Fgure 29. Rates of all-listed dmbetes for patients 65 years of age and
oven United States. 1965-86
19
Utilization by surgicalprocedure
A comparison of the number of patients with andwithout surgery during the period 1965–86 is presented intable 14; data for nine common surgeries are provided intables 15–23. These procedures are tonsillectomy, cesareansection, hysterectomy, hemorrhoidectomy, cholecystect-omy, lens extraction, prost atectomy, cardiac cathet eriza-tion, and coronary bypass. They were chosen for their highfrequency, the consistency of their definition across ver-sions of the International Classification of Diseases, and theimportance of the procedures to the age groups presented.The trend data for the nine specific surgical procedureswere based on the number of each reported as principal orsecondary procedures. The first seven procedures werestudied for the years 1965–86, and the two heart proce-dures were studied for the years 1970-86. Previous to 1970,cardiac catheterizations and coronary bypass procedureswere not frequently reported.
Patients who had surgery during their hospitalizationmade up 38-42 percent of all discharges during the period1965–78 and 45-46 percent from 1979 to 1986. Theincrease in percent of discharges with surgery from 1978 to1979 was due largely to the changes in coding and reportingpractices instituted in 1979. The ICD-9-CM was used tocode procedures beginning in 1979, and it was organizeddifferently than earlier versions of the classification system,resulting in a broader definition of surgical procedures. Inaddition, procedures that had not been coded previously,such as certain procedures assisting delivery, were includedin the data beginning in 1979 (17,18).
The total number of surgical procedures and the aver-age number per patient with surgery increased during theperiod 1965–86 (table 14). The increase after 1978 was duein part to the changes in coding and reporting practicesdiscussed above and to an increase in the maximum num-ber of surgeries that could be coded for each patient fromthree to four in 1979.
The increase in the average number of surgical proce-dures per patient with surgery may also be related to thegrowth in ambulatory surgery programs, which handle theless complex procedures.
The average length of stay decreased 17.3 percent forpatients with surgery and 19.5 percent for patients withoutsurgery from 1965 through 1986. The decrease for patientswith surgery was partially due to advances in surgicaltechniques during the last two decades, For example, theaverage length of stay for lens extraction decreased 70.8
20
percent from 1965 through 1984 (19). Technological ad-vances have also allowed many surgeries to be dcme on anambulato~ basis.
Tonsillectomy y
The number of tonsillectomies with and without ade-noidectomies has declined significantly since 1965 (table15). An estimated 1,215,000 tonsillectomies were done in1965, which was more than four times the number(281,000) done in 1986. Almost all tonsillectomies wereperformed on patients under 45 years of age, and 60-80percent were on children under 15 years of age. Thenumber of tonsillectomies for children under 15 years ofage in 1965 was more than five times the number in 1986(981,000 compared with 176,000). For patients 15-44 yearsof age, the number in 1965 was more than twice thenumber in 1986 (218,000 compared with 100,000).
Similar patterns were noted for tonsillectomy rates.The 1965 tonsillectomy rate per 10,000 population wasmore than five times the rate in 1986 (63.4 compared with11.7). The 1965 rate per 10,000 population for childrenunder 15 years of age was nearly five times the rate in 1986(165.6 compared with 33.9), and the 1965 rate for thegroup 15-44 years of age was more than three times the1986 rate (29.0 compared with 8.9). Figure 30 illustrates thedecline over time in the rate of tonsillectomies with andwithout adenoidectomies for patients under 15 years of age.
175 1-
150
125
100
75
50r~
25
0
1965 1970 1975 1980 1965
I Yesr
Figure 30, Rates of tonsillectomies with or without adenoidectomies forpatients under 15 years of age United States, 1965-86

24
20
16
12
8
4 L“-’
o~1965 1970 1975 1980 1985
Year
Figure 31. Rates of ceaarean sections per 100 deliveries:United States, 1966-86
Cesarean section
Cesarean section rates for all women and for selectedage groups are presented in table 16. The rate of cesareansections per 100 deliveries for all women grew from 4.5 in1965 to 24.1 in 1986, an increase of more than 400 percent.This increase is shown graphically in figure 31.
The cesarean section rate generally increased with age.In 1965, it ranged from 3.1 per 100 deliveries for womenunder 20 years of age to 7.9 per 100 deliveries for women35 years of age and over. In 1986, the range was from 18.3for women under 20 years of age to 32.6 for women 35years of age and over.
However, the growth in cesarean section rates wasgreater for the younger age groups. Rates per 100 deliver-ies increased approximately 500 percent from 1965 to 1986for the three age groups under 30 years of age, comparedwith increases of approximately 300 percent for the two agegrOLl@ 30 years of age and over. Detailed studies of theincrease in cesarean section rates have been published(20-22).
Hysterectomy
Data on hysterectomy are presented in table 17.Thetotal number of hysterectomies increased from 424,000 in1965 to 725,000 in 1975. From 1976 to 1986 the number ofhysterectomies was generally lower, but it varied widelyfrom year to year. The rate of hysterectomies per 10,000female population ranged fi-om 43.0 in 1965 to 65.6 in 1975.In 1986, the rate was 52.1 per 10,000 female population.
Approximately two-thirds of hysterectomies were per-formed on women 30-49 years of age, one-fourth onwomen 50 years of age and over, and fewer than 10 percenton women 15-29 years of age. Trends in the numbers andrates of hysterectomies were generally similar for each ofthe three age groups. Women 30-49 years of age, forexample, had their lowest number (287,000) and rate(119.8 per 10,000 female population) of hysterectomies in1965. In the mid-1970’s, women in this age group hadapproximately 450,000 hysterectomies a year, a rate of
about 180 per 10,000 female population. In 1986, they had433,000 hysterectomies, or 130.3 per 10,000 female popu-lation. Further information about trends in hysterectomieshas been published (11).
Hemorrhoidectomy
As can be seen in table 18, hemorrhoidectomy hasdeclined as an inpatient procedure over the last two de-cades. The total number of hemorrhoidectornies decreased60 percent, from 285,000 in 1965 to 114,000 in 1986.Ahnost no hemorrhoidectomies were performed on chil-dren under 15 years of age. Patients 15-44 years of ageaccounted for about half of the hemorrhoidectornies donein hospitals. They had 138,000 hemorrhoidectornies in 1965but only 54,000 in 1986, a drop of 61 percent. Between 35and 40 percent of hemorrhoidectomies were on patients45-64 years of age. They had 121,000 hernorrhoidectomiesin 1965 but only 40,000 in 1986, a 67 percent decrease. Forpatients 65 years of age and over, there was little change inthe number of hemorrhoidectomies, from 25,000 in 1965 to19,000 in 1986.
The rate of hemorrhoidectornies per 10,000 populationdeclined 68 percent from 1965 to 1986. For patients 15-44years, the rate declined 74 percent, from 18.4 in 1965 to 4.8in 1986. The rate for patients 45-64 years of age dropped71 percent, from 31.2 in 1965 to 9.0 in 1986; and the ratefor patients 65 years of age and over declined 51 percent,from 13.4 in 1967 to 6.5 in 1986.
Cholecystectomy
The number of cholecystectomies increased 41 percent,from 355,000 in 1965 to 502,000 in 1986 (table 19). Veryfew cholecystectomies were done on children under 15years of age. For patients 1544 years of age, the rise in thenumber of cholecystectornies occurred from 1968 to 1982.They had 117,000 cholecystectomies in 1968 and 186,000 in1982, an increase of 59 percent. The number of cholecys-tectomies for patients 45–64 years of age was about thesame in 1965 (151,000) as in 1986 (157,000). In contrast,the number of cholecystectomies for patients 65 years ofage and over grew from 74,000 in 1965 to 166,000 in 1986,an increase of 124 percent.
The increase in the number of cholecystectomies wasdue mainly to the growth of the population. The rate for allages did not change significantly from 1965 to 1986. Ratesfor patients 15-44 and 45–64 years of age also were muchthe same in 1965 and 1986. However, there was an increasein the rate of cholecystectomies for patients 65 years of ageand over. From 39.9 per 10,000 population in 1965, thechokcystectomy rate for patients 65 years of age and overrose to 57.0 per 10,000 in 1986, an increase of 43 percent.
In 1965, about half as many cholecystectomies wereperformed on patients 65 years of age and over as onpatients 45-64 years of age (74,000 compared with151,000). By the year 1986, the number of cholecystecto-mies performed on patients 65 years of age and over wasslightly greater than the number performed on patients
21

45-64 years of age. Rates of cholecystectomies per 10,000population were similar for patients 45–64 years and those65 years of age and over in 1965, but by 1986 the rate forpatients 65 years of age and over was 60 percent higher.
Lens extraction
The number and rate of lens extractions increasedfrom 1965 through 1983 and declined sharply thereafter(table 20). The number of lens extractions in 1983(630,000) was more than four times the number in 1965(142,000), and the 1983 rate (27.1 per 10,000 population)was more than three times the rate in 1965 (7.4 per 10,000population). From 1983 to 1986, both the number and therate of lens extractions decreased by 81 percent. As aresult, the 1986 rate was 31 percent lower than the rate in1965 (5.1 compared with 7.4 per 10,000 population), al-though the numbers of lens extractions were not signifi-cantly different between 1965 and 1986.
More than 90 percent of lens extractions were per-formed on patients 45 years of age and over. From 1965 to1982, the rate of lens extractions per 10,000 populationmore than doubled for patients 45–64 years of age andtripled for patients 65–74 years of age. The 1983 rate forpatients 75 years of age and over was more than four timesthe 1965 rate. These increases were followed by declines of
age group by 1986 (figure 32). The sharp drop in thenumber and rate of lens extractions done on hospitalinpatients was due to advances in technology that enabledthe procedure to be done on an outpatient basis and tochanges in the payment system for Medicare patients.
The numbers of lens extractions performed in 1965were fairly similar among the three age groups, but in 1983the number performed on patients 75 yeas of age and overwas 86 percent higher than the number performed cmpatients 65–74 years of age and 186 percent higher than thenumber performed on patients 45-64 years of age.
Prostatectomy
The number and rate of prostatectomies have in-creased in the past two decades (table 21). The numberrose from 191,000 in 1965 to 367,000 in 1986, a 92 percentincrease. The rate of prostatectomies increased 54 percent,from 20.6 per 10,000 male population in 1965 to 31.7 per10,000 male population in 1986.
Almost all prostatectomies were performed on patients45 years of age and over. For patients 45-64 years of age,there was an increase in prostatectomies from 1967 to1982. The number of prostatectomies for this age groupdoubled (47,000 to 96,000) from 1967 to 1982, and the rateper 10,000 male population rose from 24.4 to 45.5, an
80 percent or more in the rates of lens extractions for each increase of 86 percent.
280 -
245
-. —. 65-74 years— 75 years and over
210
: 175.=
3
Eg0 1400-
kw~ 105
70/
/“ \,/0
./” \ \35
,\
‘%.--------- ----- \
i 1----------- .-----a ------- ------ --
----- ------ -----
0 I I I 1 I I I I I 1 1 I I I 1 I I
1965 1966 1967 1968 1969 1970 1971 1972 1973 1974 1975 1976 19i7 1978 1979 1980 1981 1982 1983 1984 1985 1966
Fgure 32. Hates of kens extractions by age United States 196-5-66
22

The number of prostatectomies for patients 65-74years of age increased 123 percent, from 69,000 in 1965 to154,000 in 1983. The rate of prostatectomies increased 67percent during this time period, from 129.5 to 216.4 per10,000 men 65–74 years of age.
For patients 75 years of age and over, the number ofprostatectomies increased 121 percent, from 61,000 in 1967to 135,000 in 1986. The rate of prostatectomies per 10,000male population for this age group grew from 218.4 in 1967to 331.2 in 1985, an increase of 52 percent.
Cardiac catheterization
The numbers and rates of cardiac catheterizations areshown in table 22. Use of this procedure has increaseddramatically in recent years. The number of cardiac cathe-terizations increased tenfold, from 77,000 in 1970 to775,000 in 1986. The 1986 rate of cardiac catheterizationsper 10,000 population was 8.5 times the rate in 1970 (32.4,compared with 3.8). The number and rate of the proce-dures increased for each of the four age groups shown intable 22, but the increases were greater for the older agegroups.
For children under 15 years of age, the number ofcardiac catheterizations rose from 18,000 in 1970 to 32,000in 1986, an increase of 78 percent. Their rate of cardiaccatheterizations per 10,000 population doubled from 1970(3.1) to 1986 (6.2). Patients 15-44 years of age had nearlyfour times the number of cardiac catheterizations in 1986(82,000) than they had had in 1970 (21,000), and theircardiac catheterization rate nearly tripled from 1970 (2.6per 10,000 population) to 1986 (7.3 per 10,000 population).
The number of cardiac catheterizations for patients45–64 years of age increased twelvefold, from 30,000 in1970 to 386,000 in 1986. For patients 65 years of age andover, the number of cardiac catheterizations in 1986(275,000) was 34 times the number in 1970 (8,000). Therates of cardiac catheterization per 10,000 population fol-lowed the same pattern horn 1970 to 1986, increasing from7.3 to 85.8 for patients 45-64 years of age and from 3.8 to94.1 for patients 65 years of age and over. The increase inthe rate of cardiac catheterizations for patients 45 years ofage and over is shown in figure 33.
Coronary bypass
As can be seen in table 23, the growth in the use ofcoronary bypass procedures, like the increase in cardiaccatheterizations, has been explosive. The number of coro-
190
1
— Cartiaccatheterization
80 -—.— Coronaty bypaas/
1970 1975 1980 1965
Year
‘gure 33. Ratea of cardiac catheterizations and mronary bypassprocedures for petlents 45 yeara of age and ovecJnited States, 1970-66
nary bypass procedures performed in 1986 (284,000) was20 times the number (14,000) reported for 1970. Theincrease in the rate of the procedure was almost as large,from 0.7 per 10,000 population in 1970 to 11.9 per 10,000population in 1986.
Part of the increase in the last few years has beenbecause more than one bypass has been reported for manyindividual patients. Bypass procedures using saphenousvein and mammary artery grafts, which are coded sepa-rately, are being done in one operation. In 1986, the284,000 bypass procedures represented 228,000 dischargedpatients.
Approximately 90 percent of coronary bypass proce-dures were done on patients 45 years of age and overduring the 1970-86 period. The trend in the rates for thisgroup is shown in figure 33. Patients 45-64 years of age had79 percent of all coronary bypass procedures in 1970 butonly 50 percent in 1986. This was in spite of the twelvefoldto thirteenfoId increases in the number and rate of coro-nary bypass procedures for this age group from 1970 to1986.
Data on coronary bypass procedures for patients 65years of age and over are presented only for 1974 and afterbecause the estimates for earlier years were too small to bereliable. In 1974 patients 65 years of age and over ac-counted for only 15 percent of coronaq bypass procedures,but by 1986,44 percent of the procedures were being doneon the elderly. The number of coronary bypass proceduresincreased from 8,000 in 1974 to 125,000 in 1986 forpatients 65 years of age and over, and the rates increasedfrom 3.5 to 42.9 per 10,000 population during this period.
23
References
1. Simmons WR. Development of the design of the NCHSHospital Discharge Survey. National Center for Health Statis-tics. Vital Health Stat 2(39). 1970.
2. National Center for Health Statistics. International Classifica-tion of Diseases, adapted for indexing hospital records bydiseases and operations. Washington: Public Health Service.1962.
3. National Center for Health Statistics. Eighth RevisionInternational Classification of Diseases, adapted for use in theUnited States. Washington: Public Health Service. 1967.
4. Public Health Service and Health Care Financing Administra-tion. International Classification of Diseases, 9th Revision,clinical modification. Washington: Public Health Service.1980.
5. Pokras R, Kozak LT. Adjustment of hospital utilization rates,United States, 1965-80. National Center for Health Statistics.Vital Health Stat 13(81). 1984.
6. Gordon EW. Utilization of short-stay hospitals, summary ofnonmedical statistics, United States, 1970. National Centerfor Health Statistics. Vital Health Stat 13(14). 1973.
7. National Center for Health Statistics. 1986 summary Na-tional Hospital Discharge Survey. Advance data from vitaland health statistics; no 145. Hyattsville, Maryland: PublicHealth Semite. 1987.
8. Guterman S, Eggers PW, Riley G, et al. The first 3 years ofMedicare prospective payment: an overview. Health CareFinanc Rev 9(3):67–77. 1988.
9. Haupt BJ. Utilization of short-stay hospitals, annual summaqof the United States, 1977. National Center for Health Statis-tics. Vital Health Stat 13(41). 1979,
10. Graves EJ. Utilization of short-stay hospitals, United States,1986, annual summa~. National Center for Health Statistics.Vital Health Stat 13(96). 1988.
11. Pokras R, Hufnagel VG. Hysterectomies in the United States,1965–84. National Center for Health Statistics. Vital HealthStat 13(92). 1987.
12. Kozak LJ, Are regional differences in hospital usedisappearing? Paper presented at the 115th Annual Meetingof the American Public Health Association, New Orleans.1987.
13. National Center for Health Statistics. Annual summary ofbirths, marriages, divorces, and deaths: United States, 1986.Monthly vital statistics report; vol 35, no 13. Hyattsville,Maryland: Public Health Service. 1987.
14. Baker WH. Excess pneumonia and influenza associated hos-pitalization during influenza epidemics in the United States,1970-1978. Am J Public Health 76(7):761-65. 1986.
15. Kozak LJ, McCarthy E. Hospital use by children in the UnitedStates and Canada. National Center for Health Statistics.Vital Health Stat 5(1), 1984.
16. McCarthy E, Kozak LJ. Hospital use by children, UnitedStates, 1983. Advance data from vital and health statistic no109. Hyattsville, Maryland: National Center for Health Statis-tics. 1985.
17. Pokras R. Surgical operations in short-stay hospitals: UnitedStates, 1978. National Center for Health Statistics. VitalHealth Stat 13(61). 1982.
18. Pokras R. Surgical and nonsurgical procedures in short-stayhospitals: United States, 1979. National Center for HealthStatistics. Vital Health Stat 13(70). 1983.
19. McCarthy E, Pokras R, Moien M. National trends in lensextractions 1965-84. J Am Optom Assoc 59(1):31-35. 1988.
20. Placek PJ, Taffel SM. Trends in cesarean section rates for theUnited States, 1970-78. Public Health Rep 95(6):540-48.1980.
21. Taffel SM, Placek PJ, Liss TL. Trends in the United Statescesarean section rate and reasons for the 1980-85 rise. Am JPublic Health 77(8):955-59. 1987.
22. Placek PJ, Taffel SM, Moien M. 1986 C-Section R@ VBACinch upward. Am J Public Health 78(5):562-63. 1988.
23. National Center for Health Statistics. Development and main-tenance of a national inventory of hospitals and institutions.National Center for Health Statistics. Vital Health Stat 1(3),1965.
24. National Committee on Vital and Health Statistics. TechnicalConsultant Panel. UHDDS Classes of Procedures, ICD-9-CM. Ann Arbor, Michigam Commission of Professional andHospital Activities. 1978.
25. National Center for Health Statistics. Uniform Hospital Dis-charge Data Set, Minimum Data Set, Report of the NationalCommittee on Vital and Health Statistics. Hyattsville, Mary-land: Public Health Service. 1980.
26. Sirken MG. Utilization of short-stay hospitals, summary ofnonmedical statistics, United States, 1965. National Centerfor Health Statistics. Vital Health Stat 13(2). 1967.
27. Witkin MJ. Utilization of short-stay hospitals by characteri-stics of discharged patients, United States, 1965. NationalCenter for Health Statistics. Vital Health Stat 13(3). 1967.
28. Institute of Medicine. Report of a study, reliability of hospitaldischarge abstracts. Washington: National Academy of Sci-ences. 1977.
29. Institute of Medicine. Reliability of Medicare hospital dis-charge records. Washington: National Academy of Sciences.1977.
30. Institute of Medicine. Report of a study, reliability of NationalHospital Discharge Survey data. Washington: National Acad-emy of Sciences. 1980.
31. Gray EA, Meads S. Surgical operations in short-stay hospitalsfor discharged patients United States, 1965. National Centerfor Health Statistics. Vital Health Stat 13(7). 1971.
24
List of detailed tables
1.
2.
3.
4.
5.
6.
7.
8.
9.
10.
11.
Number and rate of patients discharged from short-stayhospitals, by age and sex United States, 1965-86 . . . .
Number and rate of days of care for patients dischargedfrom short-stay hospitals, by age and sw United States,1965–86 . . . . . . . . . . . . . . . . . . . . . . . . . . . . . . . . . . . .
Average length of stay of patients discharged fromshort-stay hospitals, by age and sex United States,1965-86 . . . . . . . . . . . . . . . . . . . . . . . . . . . . . . . . . . . .
Median age of patients discharged from short-stay hos-pitals, median age of the U.S. population, and percentoccupancy of short-stay hospitals: United States,1965-86 . . . . . . . . . . . . . . . . . . . . . . . . . . . . . . . . . . . .
Adjusted number and rate of discharges, adjusted num-ber and rate of days of care, and adjusted averagelength of stay for patients discharged from short-stayhospitals: United States, 1965-86 . . . . . . . . . . . . . . . . .
Number and rate of discharges, rate of days of care, andaverage length of stay for patients discharged fromshort-stay hospitals, by age Northeast Region,1965-86 . . . . . . . . . . . . . . . . . . . . . . . . . . . . . . . . . . . .
Number and rate of discharges, rate of days of care, andaverage length of stay for patients discharged fromshort-stay hospitals, by age Midwest Region,1965-86 . . . . . . . . . . . . . . . . . . . . . . . . . . . . . . . . . . . .
Number and rate of discharges, rate of days of care, andaverage length of stay for patients discharged fromshort-stay hospitals, by age South Region,1965-86 . . . . . . . . . . . . . . . . . . . . . . . . . . . . . . . . . . . .
Number and rate of discharges, rate of days of care, andaverage length of stay for patients discharged fromshort-stay hospitals, by age West Region,1965-86 . . . . . . . . . . . . . . . . . . . . . . . . . . . . . . . . . . . .
Number and rate of discharges for patients under 15years of age discharged from short-stay hospitals, byselected first-listed diagnosis United States,1965-86 . . . . . . . . . . . . . . . . . . . . . . . . . . . . . . . . . . . .
Numberand rate ofdischarges forpatients 15-44yeamof age discharged from short-stay hospitals, by selectedfirst-listed diagnosis United States, 1965-86 . . . . . . . .
26
27
28
28
29
30
31
32
33
34
34
12.
13.
14.
15.
16.
17
Number and rate of discharges for patients 45-64 yearnof age discharged from short-stay hospitals, by selectedfirst-listed diagnosis: United States, 1965-86 . . . . . . . .
Number and rate of discharges for patients 65 years ofage and over discharged from short-stay hospitals, byselected first-listed and all-listed diagnoses UnitedStates, 1965-86 . . . . . . . . . . . . . . . . . . . . . . . . . . . . . .
Number of patients discharged from short-stay hospi-tals with and without surgery, total number of surgeries,average number of surgeries for patients with surgery,and average length of stay for patients with and withoutsurgeqc United States, 1965-86.. . . . . . . . . . . . . . . . .
Number and rate of tonsillectomies with or withoutadenoidectomies for patients discharged from short-stay hospitals, byage United States, 1965-86 ...,...
Cesarean section rates for patients discharged fromshort-stay hospitals, by age: United States, 1965-86 ...
Number and rate of hysterectomies for female patientsdischarged from she;-stay hospitals, by age: ‘UnitedStates, 1965-86 . . . . . . . . . . . . . . . . . . . . . . . . . . . . . .
18. Number and rate of hemorrhoidectomies for patientsdischarged from short-stay hospitals, by age: UnitedStates, 1965-86 . . . . . . . . . . . . . . . . . . . . . . . . . . . . . .
19. Number and rate of cholecystectomies for patientsdischarged from short-stay hospitals, by age UnitedStates, 1965-86 . . . . . . . . . . . . . . . . . . . . . . . . . . . . . .
20. Number and rate of lens extractions for patients dis-charged from short-stay hospitals, by age UnitedStates, 1965-86.. . . . . . . . . . . . . . . . . . . . . . . . . . . . .
21. Number and rate of prostatectomies for male patientsdischarged from short-stay hospitals, by age UnitedStates, 1965-86 . . . . . . . . . . . . . . . . . . . . . . . . . . . . . .
22. Number and rate of cardiac catheterizations for pa-tients discharged from short-stay hospitals, by ageUnited States, 1970-86 . . . . . . . . . . . . . . . . . . . . . . . . .
23. Number and rate of coronaq bypass procedures forpatients discharged from short-stay hospitals, by ageUnited States, 1970-86 . . . . . . . . . . . . . . . . . . . . . . . . .
35
36
37
37
38
38
39
39
40
40
41
41
25

% Table 1. Number and rate of patients discharged from short-stay hospitals, by age and sex United States, 1965-66
[Dscherges from non-Federal hospitals. Excludes newborn lnf~k]
Both sexes Male Female
A// Under 15 K-44 45-64 65=74 75 years At) Under 15 15+4 4$64 65-74 75 years All Under 15 lE-.?Y 45%4 65-74 75 yearsYfflr ages years years years years and over ages yews yeas years years and over ages years years yeats yeare smd over
Number In thousands
1865 . . . .1966 . . . .1987 . . . .1968 . . . .1969 . . . .1970 . . . .1971 . . . .1972 . . . .1973 . . . .1974 . . . .1975 . . . .1976 . . . .1977 . . . .1978 . . . .1979 . . . .1880 . . . .1981 . . . .1982 . . . .1883 . . . .1884 . . . .1885 . . . .1986 . . . .
1865 . . . .1866 . . . .1987 . . . .1986 . . . .1969 . . . .1970 . . . .1971 . . . .1972 . . . .1973 . . . .1974 . . . .1975 . . . .1976 . . . .1977 . . . .1978 . . . .1979 . . . .1960 . . . .1981 . . . .1982 . . . .1983 . . . .1984 . . . .1985 . . . .1986 . . . .
28,74128,42527,88228,07028,53428,12528,45931,82732,12433,01934,04334,37335,80235,61736,74737,832385433%58433,78437,18235,05734,255
150.0147.0142.8142.4143.3144.3143.8152.4153.31!56.0158.2158.21W.6161.6164.8167.7169.3167.9187.015a.5147.9143.1
4,2784,2254,0173,8883,9803,8724,0294,1743,9333,9123,8253,7453,7753,4883,6413,6723,7333,6543,6543,2082,9722,782
72.271.388.066.068.368.869.873.270.070.970.470.271.867.170.871.672.971.270.862.057,253.5
13,14912,70212,28312,03612,22112,66412,60513,33113,48213,85514,17114,27215,18015,03715,48815,63815,72515,55415,26914,53313,86613,458
175.1167.2159.4153.7153.0154.6149.8153.9152.0152.4152.4148.8155.7150.7151.8150.2148.7i45.o140.4132.2125.1118.9
6,7126,5896,3826,5176,8396,8826,8407,4887,7728,0678,3828,4448,8048,3848,5328,6608,6778,6888,5598,1957,6107,300
172.9167.1159.2160.0160.5159,6161.3174.8160.0165.5191.81921195.1168.5192.4194.6195.3195.5192.2183.3169.5162.2
2,6422,6762,8162,8603,0803,1633,2003,5813,7283,6414,0584,1394,3534,4674,6134,8435,2445,2325,4695,3525,0125,141
213.9223.3233.1243.1250.4253.2252.3277.1281.4282.92?)1.6280.7m7.4297.9300.8315.9330.0324.3334.3319.6284.9296.7
2,0802,2312,3942,5692,6142,7342,7853,0533,2093,3443,5973,7733,9904,2414,4734,9215,1645,4665,8335,8745,4975,574
313.8329.8342.5357.5354.3359.1353.5377.0367.7394.0409.7417.3431.2446.1456.7469,1498.5511.4529.2520.1476.5470.5
11,15811,20310,95711,23211,41911,43011,66412,60812,84313,13113,51913,75214,38514,36714,70515,14515,37815,47015,57314,90014,16113,949
120.0119.8116.4118.4119.2117.5118.0125.8126.8128.4130.9131.9136.6135.0136.6139.1139.9139.4138.8131.6123.6120.5
2,4142,3802,2592,2452,2232,1732,2532,3572,2322,1912,1432,1032,+371,9462,0532,0632,1012,0882,0841,8311,6981,603
3,4783,4793,3333,3693,4553,4863,4733,7633,8764,0164,1074,2484,5534,5654,6804,6874,6724,6154,5244,3054,1534)100
3,1433,0883,0Q73,1193,1413,1043,2383,4903,6393,7303,8703,9184,0423,9614,0174,1274,0964,1434,1593,9643,7763,569
Rate par 1,200 population
1,2051,2701,3361,3981,4801,5121,5251,7311,7961,8361,9401,s912,0652,1622,2002,3582,5102,4752,5682,5262,3892,475
80.1 86.5 167.879.2 95.8 162875.1 90.8 156.375.1 80.4 159.974.9 80.8 156.973.6 88.7 155.176.6 85.5 160,181.0 88.5 171.077.9 88.8 176.977.6 80.6 180.277.2 90.4 185.977.2 91.1 187.379.6 95.3 192.773.3 83.3 189.278.1 93.4 190.678.7 91.5 195.460.2 89.8 194.179.9 87.4 196.379.0 84.3 196.669.2 79.6 165.963.8 75.4 176.260.2 73.4 166.1
228.4238.1249.6260.5276.1278.9275.4307.6312.1311.7321.4322.4325.5332.83241.9347.4364.1353.4361.4345.2319.9323.7
918976
1,0231,1011,1101,1551,1751,2881,3001,3561,4591,4821,5861,7131,7551,9101,9972,1392,2382,2742,1452,202
340.8355.5364.4385.5362.9391.3388.8412.8416.7430.5452.0452.7474.6501.2500.7534.0544.6566.8575.8571.2528.1527.0
17,58317,22216,93516,63817,11517,69517,79519,01819,28119,8LM20,52420,82121,51721,25022,04222,68723,16523,12423,21122,26220,88620,306
178.2172.4167.5164.7165.6169.1167.8177.3178.0181.8185.7184.8180.8166.4191.1194.5196.7194.5193,2183.6170.7164.3
1,8641,8351,7581,7431,7571,6981,7761,8171,7011,7211,6821,6421,6381,5421,5a81,6091,6321,5561,570*,3771,2741,179
64.063.160.660.561.559.862.785.061.883.763.262863.660.763.164.265.282.062.354.550.246.5
9,6719,2238,9508,6678,7669,1789,1329,56a9,6069,837
10,06410,02410,62710,47210,80810,84911,05310,93810,74510,2289,8139,358
247.8232.4221.8211.1209.7215.2209.7214.8210.9211.3211.8206.1213.7206.1206.2206.9205.8201.0184.8~63.1173.4163.2
3,5693,5023,3763,3983,4983,5883,8023,8984,1334,3374,5224,5284,5624,4034,5154,5334,5794,5454,4004,2313,8343,731
177.6171.2161.9160.0162.1163.8162.3178.2182.7180.4197.2196.4197.3189,7194.0194,3196.4194.8188.3161.0163.4158.7
1,3371,4081,4811,5621,5801,6511,6751,8501,832
2,1182,1482,2t?62,3052,4132,5852,7342,7572,9012,8262,6232,656
203.7211.5220!0228.3220.3224.8234.4253.6257.9260.9268.8286.4275.9271.2277.7281.7303.8301.9313.4299.7275.3275.4
1,1431,2551,3701,4681,5041,5791,6101,7851,809I,aaa2,1382,2812,4022,5282,7183,0113,1673,3273,5953,6003,3523,372
285.1312.3327.8339.0335.8338.8331.5355.2368.1372.5385.2397.0406.6415.2432.1464.4473.2481.2503.9492.3446.5439.7

Table 2. Number and rate of days of care for patientsdischarged from short-stay hosp~ls, by age and sex: United States, 1965-66
[Discharges from non-Federal hospitals. Wcludee newborn infants]
Eoth SSXSS Male Female
All Under 15 15-44 45-64 65-74 75yeare All UnUer 15 IH4 45-64 65-74 75yaaLs AI Under 15 15-44 45-64 65-74Yasr
75yearsages Y&irs yssls years ~ and over ages J@els yeas Yeats years and over agss w w w w~ end over
Number in thousands
1965 . . .1966 . . .1967 . . .1988 . . .1969 . . .1970 . . .1971 . . .1972 . . .1973 . . .1974 ...1975. . .1976 . . .1977 . . .1978 . . .1979 . . .1960 . . .leal . . .1!362 . .1983 . . .1934 . . .1985 . . .1!W3 . . .
le85 . . .1936 . .1967 . . .1968 . . .1969 . . .1970 . . .1971 . . .1972 . . .1973 . . .1974 . . .1975 . . .1976 . . .1977 . . .1978 . . .1979 . . .1980 . . .1961 . . .1962 . . .1963 . . .1984 . . .1965 . . .1986 . . .
224,541229,6e7234,351237,201239,057226,443231,017245,060249,389255,887262,388260,272262,407261,986264,174274,510277,230272,628266,336244,652226,216216,496
1,171.91,1W61,200.21,203.41,200.41,121.61,127.61,160.91,189.61,208.21,227.31,205.61,203.11,188.2I,W4.61,217.01,217.71,166.01,155.21,043.5
954.49128
21,01520,26019,90320,02119,9!3018,189i6,76f16,64217,68117,6e417,55416,61615,88615,45315,76516,19117,27016,76116,68214,36813,55412,716
354.7341.9337.0341.2343.1313.9325.3326.6318.4324.1322,9311.3301.6297.4306<4315.8337.1326.4323.4277.7260.8244.7
77,48176,95776,08673,74772,71371,60572,32775,77476,72579,58660,66776,56780,72379,94780,91381,95281,37979,56276,97171,17267,39665,174
1,031.91,012.8
987.3941.6910.6874.0859.5875.0L?A34.7875.6867.9824.9827.9801.3793.0787.0769.6742.0707.5647.3303.6575.7
65,98066,99764,77465,02486,50862,41964,31069,36570,64572,98175,39374,27273,20071,15669,75571 ,fM969,49268,26365,02956,87763,54049,663
1,699.71,699.31,615.71,596.01,606.31,486.91,516.11,619.41,640.31,678.51,723.01,fM9.31,659.51,608.31,572.81,597.51,564.01,536.71,460.61,316.81,192.81,101.4
31,12733,60037,40139,21740,61837,87236,51641,62842,34843,21044,96345,35445,75846,50746,70749,25351,79250,03350,22345,39941,GW40,952
2,618.82,602.33,095.33,220.33,302.03,031.53,036.83,237.03,197.03,183.13,230.83,185.63,126.03,101.53,045.23,147.63,252.23,1CQ.93,069.52,710.92,417.82,363.6
28,93532,08336,2073e,19339,22936,35937,C-6439,43141,69042,01443,79145,44346,88046,30351,03456,10557,2S)057,36759,43354,833Ww3650,089
4,407.54,743.25,180.65,454.15,317.04,775.94,707.34,889.25,024.84,S350.44,966.25,026.35,083.85, f 43.95,210.25,576.55,529.95,423.65,39224,855.54,289.44,228.0
93,63197,06596,426
101,205103,45795,52e97,886
104,203105,999109,036111,414111,093112,081111,975112,505116,266117,769115,941114,627104,56797,26994,592
1,007.41,038.01,045.41,066.81,080.0
962.4
1,%%:1,046.91,066.41,078.81,W5.31,064.21,052.01,045.11,067.71,071.71,044.81,023.7
923.9848.7816.9
11,64511,76611,47911,62711,43510,34710,56410,77610,01410,2009,9549,2309,1688,6759,0088,9509,6119,6359,4206,0147,6477,274
24,27124,81724,42524,67824,63723,65323,90625,30126,35927,61528,05627,75028,71928,97729,71329,7482e,63529805027,63925,87625,26625,160
31,32831,84830,76231,11431,98729,34930,64732,60333,76934,49534,93734,64734,76833,60032,46233,56932,21632,11831,54228,24126,13523,752
Rate per 1,000 ~pulatbn
3929 673.1 1,673.0390.6 663.6 1,868.6381.8 665.8 1,598.7339.1 6624 1,594.82J3!i3 847.5 1,617.93S3.4 6021 1,466.4359.6 586.8 1,515.2370.6 601.6 1,606.8349.7 610.4 1,8428362.2 622.7 1,686.6358.8 617,4 1,677.8338.7 595.0 1,656.2342,0 601.0 1,657.1326,9 592.0 1,597.3342.6 592.8 1,541.2341.5 S31 .0 1,590.33M.9 570.3 1,526.0386.9 549.9 1,521.5357.0 519.0 1,491.0202.7 478.4 1,324.1287.5 456.9 1,219.8273.3 450.7 1,105.2
14,75415,7!3317,22318,17119,36517,62417,2C019,69419,75120,36421,20521,63921,3722W8421,80722,87224,65123,18623,28221,26619,24319,546
2,772.82,959.73,218.73,326.33,568.63,227.23,232.63,535,53,432.03,460.83,512.53,504.33,366.33,366.83,280.23,370.03,576.23,310.43,276.82,908.32,577.12,556.7
11,43513,02414,53715,61516,03314,55614,65115,42716,08816,34417,26017,82718,03418,63919,49521,10921,62621,95222,74421,16818,97618,640
4,246.24,742.95,177.05,467.45,530.54,930.94,914.35,021.65,180.75,188.65,347.05,408.75,369.75,511.75,562.15,901.35,897.55,616.65,851.35,321.64,671.64,509.3
130,eo7132,832135,925135,997135,599130,915133,130140,857143,390146,649150,974149,179150,326149,393151,669156,242159,441156,685153,511140,065128,947123,204
1,326.81,32?3.51,344.31,330,21,312.11,250.91,255.31,313.21,323.41,340.81,366.21,336.51,332.81,315.41,315.11,356.41,354.11,317.91,276.01,155.21,053.31,0026
9,1708,4748,4246,3948,6557,8428,1977,8647,8677,6947,6007,3266,6786,7786,7577,2417,6597,1267,2626,3525,9075,444
315.12el.2
E299.3276.0289.6281.2285.9284.6285.6282.7259.5266.7266.5288.9305.9264.0288.1251.5232.9214.6
53,21052,14051,641
46;07647,95246,42150,47350,36651.973
50;63752,00450,97051,20052,20451,69450,53249,13245,2e442,12839,W4
1,363.41,314.11,279.51,194.91,150.11,124.61,111.71,133.01,105.91,116.61,107.31,045.31,045.91,003.0
986.4986.4962.7928.4890.8610.8744.3697.7
34,65435,34934,01233,91034,61933,07033,1xi336,66237,05836,46640,45339,62536,43237,55837,27337,42037,27636,16533,46730,63627,40525,811
1,724.61.727.8
16,37317,81020,17821,04621,25320,24820,61621,93422,59722,82623,75823,71524,38624,62324,S0026,36127,14826,64726,94124,13121,84721,408
2,494.02,676.2
1;631 .4 2;997.31,597.1 3,069.51,699.5 3,077.91,609.4 2,879.41,517.0 2,885.01,630.9 3,m.7I,wl.1 3,016.61,689.4 2,970.21,763.9 3,015.01,719.3 2,941.61,661.7 2,940.61,816.3 2,897.21,601.4 2,665.41,604.1 2,977.21,598.5 3,016.41,550.4 2,940.21,433.1 2,910.31,310.2 2,559.21,168.1 2,292.91,097.6 2,211.1
17,50019,05921,67023,57823,19621,60322,23324,00425,50425,67026,63127,61628,82630,06431,53934,99835,66436,01536,66933,65231,66031,249
4,519.64,743.55,163.05,445.35,176.84,677.64,578.54,776.04,931.24,609.84,779.54,807.04,879.!4,937.45,014.15,397.35,328,65,209.05,142.14,601.74,236,04,074.7
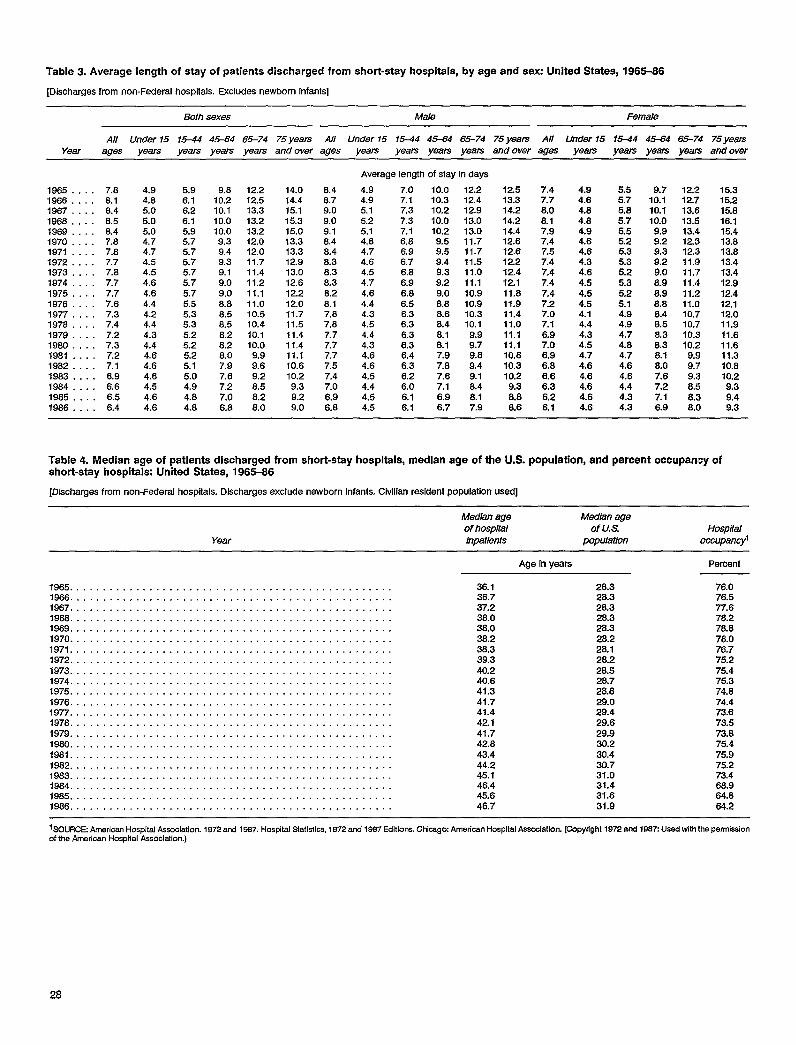
Table 3. Average length of stay of patients discharged from shorktay hospitals, by age and sex: United States, 1965-86
[Discharges from non-Federal hospitals. Excludes newborn Infants]
Both sexes Male Female
All Under 15 15-44 45-64 65-74 75 years All Under 15 15-44 45-64 65-74 75 years Ail Under 15 1S44 45-64 6S74 75 yearsYear ages years years years years and over ages years years years years and over ages years years years years and over
Average length of stay in days
1965 . . . . 7.81966 . . . . 8.11967 . . . 6.41968 . . . . 6.51969 . . . 8.41970 . . . . 7.61971 . . . . 7.81972 . . . . 7.71973 . . . . 7.81974 . . . 7.71975 . . . 7.71976 . . . . 7.61977 . . 7.31978 . . . 7.41979 . . . 7.21960 . . . . 7.31961 . . . . 7.21962 . . . . 7.11963 . . . . 6.91984 . . . . 6.61985 . . . . 6.51986 . . . . 6.4
4.9 5.94.6 6.15.0 6.25.0 6.15.0 5.94.7 5.74.7 5.74.5 5.74.5 5.74.6 5.74.6 5.74.4 5.54.2 5.34.4 5.34.3 5.24.4 5.24.6 5.24.6 5.14.6 5.04.5 4.94.6 4.84.6 4.8
9.8 12.210.2 12.510.1 i 3.310.0 13.210.0 13.29,3 12.09,4 12.09.3 11.79.1 11.49.0 11,29.0 11.16.8 11.06.5 i 0.58.5 i 0.46.2 10.18.2 10.06.0 9.97.9 9.67.6 9.27.2 8.57.0 8.26.8 8,0
14.014.415.115.315.013.313.312.913.012.612.212.011.711.511.411.411.110.610.2
9.39.29.0
6.46.79.09.09.18.48.46.38.36.36.28.17.87.67.77.77.77.57.47.06.96.8
4.9 7.04.9 7.~5.1 7.35.2 7.35.1 7.14.8 6.84.7 6.94.6 6,74.5 6.84.7 6.94.6 6.84.4 6.54.3 6.34,5 6.34.4 6.34.3 6.34.6 6.44.6 6.34.5 6,24.4 6.04.5 6.14.5 6.1
10.0 12.210.3 12.410.2 12.910.0 13.010.2 13.09.5 11.79.5 11.79.4 11.59.3 11.09.2 11.19.0 10.96.8 10.98.8 10.36.4 10.18.1 9.96.1 9.77.9 9.67.8 9.47.6 9.17.1 8.46.9 8.16.7 7.9
12.513.314.214.214.412.612.612.212.412.111.811.911,411,011,111.110.810.310.2
9.36.86.6
7.4 4.9 5.57.7 4.6 5.76.0 4.8 5.88.1 4.8 5.77.9 4.9 5.57.4 4.6 5.27.5 4.6 5.37.4 4.3 5.37.4 4.6 5.27.4 4.5 5.37.4 4.5 5.27.2 4.5 5.17.0 4.1 4.97.7 4.4 4.96.9 4.3 4.77.0 4.5 4.86.9 4.7 4.76.8 4.6 4.66.6 4.6 4.66.3 4.6 4.46,2 4.6 4.36.1 4.6 4.3
9.7 12.310.1 12.710.1 13.610.0 13.59.9 13.49.2 12.39.3 12.39.2 11.!39.0 11.:78.9 11.46.9 11.28.8 11.08.4 10.78.5 10.78.3 10.38.3 10.28.1 9.!38.0 9.:77.6 9.37.2 6.57.1 8.36.9 8.0
15.315.215.816.115.413.813.813.413.412.912.412.112.011.911.611.611.310.810.29.39.49.3
Table 4. Median age of patients discharged from short-stay hospitals, median age of the U.S. population, and percent ocouparwcy ofshort-stay hospitals: United States, 1965-66
[Discharges from non-Federal hosp~als. Discharges exclude newborn infants, CMlian resident population used]
Median age Median ageof hospital of Us. HosfXktl
Year inpatients population occupancyl
Age In years
36.1 28.336.7 26.337.2 28.338.0 28.338.0 26.338.2 28.238.3 28.139.3 26.240.2 28.540.6 28.741.3 28.841.7 29.041.4 29.4421 29.64~.7 29.942.6 30.243.4 30.444.2 30.745.1 31.046.4 31.445.6 31.646.7 31.9
76.076.577.678.276.878.076.775.275.475.374.874.473.673.573.875.475.975.273.468.964.864.2
1SOI_IRC&~er,cm HO@al ~=lation, 1972~~ 19s7, Ho@tal ~atl~il~, f g72 and I ge7 Edltlons. chl~go American Hospital A.sscdation. (Copydght 1972 and 19aZ Used with the permission
of the American Hospital Association.)
28
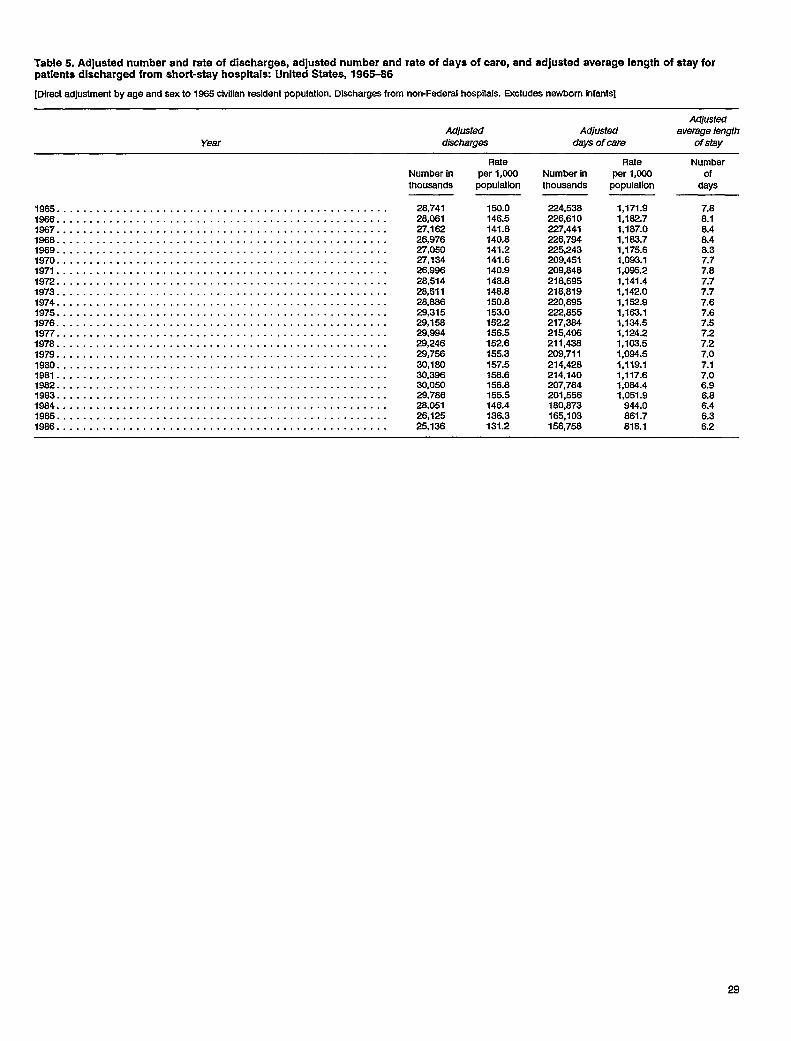
Table 5. Adjusted number and rate of discharges, adjusted number and rate of days of care, and adjusted average length of stay forpatients dkcharged from short-stay hospitals: United States, 1965-66
[Direcl adjustment by age and sax to 1965 civilian resident population. Discharges from non-Federal hospitals. Excludes newborn Infantsl
AdjustedAd]usted Adjust&i average length
Year discharges days of care of stay
1985 . . . . . . . . . . . . . . . . . . . . . . . . . . . . . . . . . . . . . . . . . . . . . . . . . .1966 . . . . . . . . . . . . . . . . . . . . . . . . . . . . . . . . . . . . . . . . . . . . . . . . . .1067 . . . . . . . . . . . . . . . . . . . . . . . . . . . . . . . . . . . . . . . . . . . . . . . . . .1966 . . . . . . . . . . . . . . . . . . . . . . . . . . . . . . . . . . . . . . . . . . . . . . . . . .1969 . . . . . . . . . . . . . . . . . . . . . . . . . . . . . . . . . . . . . . . . . . . . . . . . . .1970. . . . . . . . . . . . . . . . . . . . . . . . . . . . . . . . . . . . . . . . . . . . . . . . . .1971 . . . . . . . . . . . . . . . . . . . . . . . . . . . . . . . . . . . . . . . . . . . . . . . . . .1972 . . . . . . . . . . . . . . . . . . . . . . . . . . . . . . . . . . . . . . . . . . . . . . . . . .1973 . . . . . . . . . . . . . . . . . . . . . . . . . . . . . . . . . . . . . . . . . . . . . . . . . .1974 . . . . . . . . . . . . . . . . . . . . . . . . . . . . . . . . . . . . . . . . . . . . . . . . . .1975 . . . . . . . . . . . . . . . . . . . . . . . . . . . . . . . . . . . . . . . . . . . . . . . . . .1976 . . . . . . . . . . . . . . . . . . . . . . . . . . . . . . . . . . . . . . . . . . . . . . . . . .1977 . . . . . . . . . . . . . . . . . . . . . . . . . . . . . . . . . . . . . . . . . . . . . . . . . .1978 . . . . . . . . . . . . . . . . . . . . . . . . . . . . . . . . . . . . . . . . . . . . . . . . . .1979 . . . . . . . . . . . . . . . . . . . . . . . . . . . . . . . . . . . . . . . . . . . . . . . . . .1980 . . . . . . . . . . . . . . . . . . . . . . . . . . . . . . . . . . . . . . . . . . . . . . . . . .1661 . . . . . . . . . . . . . . . . . . . . . . . . . . . . . . . . . . . . . . . . . . . . . . . . . .1962 . . . . . . . . . . . . . . . . . . . . . . . . . . . . . . . . . . . . . . . . . . . . . . . . . .1983 . . . . . . . . . . . . . . . . . . . . . . . . . . . . . . . . . . . . . . . . . . . . . . . . . .1984 . . . . . . . . . . . . . . . . . . . . . . . . . . . . . . . . . . . . . . . . . . . . . . . . . .1985 . . . . . . . . . . . . . . . . . . . . . . . . . . . . . . . . . . . . . . . . . . . . . . . . . .1986 . . . . . . . . . . . . . . . . . . . . . . . . . . . . . . . . . . . . . . . . . . . . . . . . . .
Number inthou$zmds
28,74128,06127,16226,97627,05027,13426,99628,51428,51128,88629,31529,15829,99429,24629,75630,18030,39630,05029,78628,05126,12525,136
Rateper 1,000population
150.0146.5141.8140.8141.2141.6140.9148.8146.8150.6153.01522156.5152.6155.3157.5158.6156.8155.5146.4136.3131.2
Number inthousands
224,538226,610227,441226,794225,243209,451209,646218,695218,819220,895222,855217,384215,408211,436209,711214,428214,140207,764201,556180,873165,103156,756
Rateoar 1.000
1,171.91,182.71,187.01,163.71,175.61,093.11,095.21,141.41,142.01,152.91,183.11,134.51,124.21,103.51,094.51,119.11,117.61,064.41,051.9
944.0861.7818.1
Numberof
days
7.88.18.48.48.37.77.87.77.77.67.67.5
z7.07.17.06.96.86.46.36.2
29

Table 6. Number and rate of discharge, rate of days of care, and average length of stay for patients discharged from short-stayhospitals, by age: Northeast Region, 1965-66
[Discharges from non-Federai hospitals. Excludes newborn infants]
Age ofpatlerd
,41 Under 15 15-44 45-64 65 years All Under 15 15-44 45-64 65 years
Year ages years years years and over ages years years years and over
1965 . . . . . . . . . . .1966 . . . . . . . . . . .1967 . . . . . . . . . . .1968 . . . . . . . . . . .1969 . . . . . . . . . . .1970 . . . . . . . . . . .1971 . . . . . . . . . . .1972 . . . . . . . . . . .1973 . . . . . . . . . . .1974 . . . . . . . . . . .1976 . . . . . . . . . . .1976 . . . . . . . . . . .1977 . . . . . . . . . . .1978 . . . . . . . . . . .1979 . . . . . . . . . . .1960 . . . . . . . . . . .1981 . . . . . . . . . . .1982 . . . . . . . . . . .1983 . . . . . . . . . . .1984 . . . . . . . . . . .1985 . . . . . . . . . . .1986 . . . . . . . . . . .
1965, . . . . . . . . . .1986 . . . . . . . . . . .1967 . . . . . . . . . . .1968 . . . . . . . . . . .1969 . . . . . . . . . . .1970 . . . . . . . . . . .1971 . . . . . . . . . . .1972 . . . . . . . . . . .1973 . . . . . . . . . . .1974 . . . . . . . . . . .1975 . . . . . . . . . . .1976 . . . . . . . . . . .1977 . . . . . . . . . . .1978 . . . . . . . . . . .1979 . . . . . . . . . . .1960 . . . . . . . . . . .1981 . . . . . . . . . . .1982 . . . . . . . . . . .1983 . . . . . . . . . . .1984 . . . . . . . . . . .1985 . . . . . . . . . . .1986 . . . . . . . . . . .
Number of discharges In thousands Discharge rate par 1,000 populaflon
6,5696,4496,2216,2796,3116,6376,9127,1207,2067,2167,3517,6177,6117,6647,7867,8667,6227,6477,7937,4087,1866,955
1,270.01,308.91,293.31,310.51,275.61,252.01,275.81,319.91,329.11,333.01,353.61,366.61,389.61,394.11,36251,367.31,347.11,306.11,277.71,169.31,115.81,028.7
1,130 2,829 1,5481,062 2,688 1,5121,017 2,564 1,452
662 2,669 1,504847 2,658 1,523842 2,660 1,596851 3,006 1,655671 2,935 1,806637 2,961 1,828625 2,928 1,851773 2,970 1,923782 3,012 1,951739 3,182 1,962660 3,079 1,926725 3,122 1,920700 3,107 1,865690 3,084 1,846672 3,060 1,832682 2,955 1,763573 2,739 1,711529 2,673 1,614458 2,657 1,500
Rate of days of care per 1,000 population
455.1 1,035.2 1,766.7446.0 1,022.6 1,761.9465.5 962.3 1,651.5357.2 1,0026 1,640.5348.2 949.5 1,612.3344.7 9225 1,620.2336.7 934.5 1,681.3333.3 917.6 1,791.8339.3 915.2 1,786.6355.3 891.5 1,776.2320.4 872.5 1,667.9335.6 853.3 1,648.q300.2 6724 1,818.5311.9 615.6 1,822.3329.5 608.3 1,707.5309.3 801.7 1,704.6329.3 774.6 1,602.1312.5 746.6 1,575.3309.0 694.0 1,503.4259.2 629.5 1,362.2243.5 603.4 1,295.0194.1 606.2 1,110.5
1,0321,1551,1751,2421,2831,3201,3901,5071,5821,6121,6851,7731,9061,9792,0162,1762,2012,2832,3732,3852,3532,341
3,430.13,665.04,091.14,447.54,326.74,162.54,204.34,432.84,441.34,457.04,517.64,616.04,794.04,928.14,780.14,976.74,660.04,467.74,500.64,152.63,944.13,569.5
140.3137.3131.8132.1132.2137.2141.6145.3147.3148.1150.8154.1161.0156.6161.4162.3158.9159.0157.7149.3144.1139.4
9.19.59.89.99.69.19.09.19.09.09.08.98.66.88.46.5&58.28.17.87.77.4
82.6 154.9 151.979.2 148.4 144,074.6 141.0 136,663.6 144.6 139.763.1 143.2 140.263.3 149.1 147.664.4 152.5 153.367.3 146.2 164.866.6 145.7 166.867.9 142.7 i 68.985.4 142.8 176.768.3 142.7 179.666.7 148,6 184.263.4 143.6 160.969.6 144.0 162.267.8 141.6 180.867.9 137.5 177.267.0 134.9 177.268.8 129.3 174.258.2 118.8 167.753.8 115.6 157.846.9 114.0 147.6
Average length of stay In days
5.5 6.7 11.65.6 6.9 12.26.2 6.8 12.15.6 6.9 11.75.5 6.6 11.55.4 6.2 11.05.2 6.1 11.05.0 6.3 10.95.1 6.3 10.75.2 6.2 10.54.9 6.1 10.64.9 6.0 10.34.5 5.8 9.94.9 5.7 10.14.7 5.6 9.44.6 5.7 9.44.6 5.6 9.04.7 5.5 8.94.5 5.4 6.64.5 6. i4.5 u 8.24.1 5.3 7.5
220.3246.1247.0259.1263.6265.9276.3299.3310.9312.7320.6330.8352.0359.5360.7377.7355.3363.0370.6366.0357.9349.5
15.615.616.817.216.415.715.214.614.314.314.114.013.613.713.313.213.112.312.111.311.010.3
NOTE Discharges whose age was d stated were Included only h the “all ages” categoiy for 1965-68. Imputations were made for mlsslrg age data for 19ES-S6, 1965-SO rake were based on theclvlllannoninstitutionalized population, as estimated before the 1980 census. 1961 -?3 rates were based ontheclvllian resident population, asestlmated after the 19ao census.
30

Table 7. Number and rate of discharges, rate of days of care, and average length of stay for patients discharged from short-stayhospitals, by age: Midwest Region, 1965-66
[Discharges from non-Federal hosp~als. Excludes newborn infants]
Aae of mtfsnt
All Under 15 15-44 45-64 65 yasre AII Under 15 15+4 45-64 65 yearsYear ages yeans years years end over ages years years years and over
Number of discharges In thousands Discharge rate per 1,000 population
1965 . . . . . . . . . . .1966 . . . . . . . . . . .1967 . . . . . . . . . . .1966 . . . . . . . . . . .1962 . . . . . . . . . . .1970 . . . . . . . . . . .1971 . . . . . . . . . . .1972 . . . . . . . . . . .1973 . . . . . . . . . . .1974 . . . . . . . . . . .1975 . . . . . . . . . . .1976 . . . . . . . . . . .1977 . . . . . . . . . . .1978, . . . . . . . . . .1979 . . . . . . . . . . .1980 . . . . . . . . . . .1981 . . . . . . . . . . .1962 . . . . . . . . . . .1983 . . . . . . . . . . .1964 . . . . . . . . . . .1986 . . . . . . . . . . .1986 . . . . . . . . . . .
8,5536,6546,7108,6788,9439,2029,1719,4349,975
10,41710,67710,66310,83510,66210,64710,87611,13210,93610,4929,6999,1118,931
1,424 3,731 1,9191,457 3,719 i ,93a1,440 3,654 1,9101,327 3,831 1,9511,352 3,758 2,0191,346 3,943 2,0581,385 3,638 2,1331,375 3,674 2,2371,316 4,110 2,4381,285 4,352 2,5421,300 4,409 2,6271,227 4,432 2,6121,251 4,587 2,5941,171 4,461 2,5331,148 4,508 2,4001,105 4,465 2,4881,112 4,512 2,5531,068 4,356 2,506
987 4,042 2,366839 3,734 2,233754 3,538 1,996720 3,434 1,967
Rate of davs of care Der 1,000 Modulation
1,4451,5321,6871,7671,8141,8551,8151,9482,1102,2362,34a2,3922,4242,5172,5942,6202,9553,0063,0973,0932,8232,810
180.4160.4180.2158.5162.0164.6182.9188.3175.7183.7187.9187.5169.9166.2165.1167.4188.5168.1~78.4187.9154.3150.9
84.0 183.1 175.885.7 179.7 174.985.1 174.3 170.679.2 170.3 172.081.5 172.9 175.982.1 174.5 180.485.1 168.3 168.588.1 183.6 194.484.8 166.5 211.785.2 178.0 221.688.4 177.3 229.485.9 175.3 226.889.7 V7.5 227.885.5 170.2 222.785.5 189.5 211.881.5 188.5 218.6827 188.2 225.980.0 159.7 224.274.5 ~47.6 213.683.6 135.7 202257.2 128.6 160.755.7 123.5 176.0
Averaae length of stav in davs
285.2293.6319.6332.2337.0339.1328.4349.4374.4392.3403.7
404.2413.9420.9448.3432.1430.8437.1426.3386.9
1965 . . . . . . . . . . .1966 . . . . . . . . . . .1967 . . . . . . . . . . .1966 . . . . . . . . . . .1969 . . . . . . . . . . .1970 . . . . . . . . . . .1971 . . . . . . . . . . .1972 . . . . . . . . . . .1973 . . . . . . . . . . .1974 . . . . . . . . . . .1975 . . . . . . . . . . .1976 . . . . . . . . . . .1977 . . . . . . . . . . .1978 . . . . . . . . . . .1979 . . . . . . . . . . .1980 . . . . . . . . . . .1961 . . . . . . . . . . .1982 . . . . . . . . . . . .1983 . . . . . . . . . . .1984 . . . . . . . . . . .1985 . . . . . . . . . . .1986 . . . . . . . . . . .
1,317.71,355.51,421.11,389.81,405.21,360.51,304.41,329.11,406.91,472.01,517.91,476.11,429.21,411.31,361.01,412.51,400.21,360.31,281.31,151.71,041.81,002.0
465.0472.5473.1410.3411.9403.9393.2395.4363.5367.0416.2396.1386.2380.6377.0369.8373.1375.5355.0312.9298.1297.0
1,093.31,113.21,125.31,090.11,055.61,061.3
993.7960.2
1,006.81,063.41,089.61,032.11,012.2
982.4952.9937.3919.5898.6816.1734.7690.18421
1,823.41,673.71,632.81,769.91,833.71,78231,789.91,864.41,99252,073.02,158.12,103.12,022.71,957.51,781.21,870.11,883.11,840.91,680.31,503.11,301.51,233.3
3,930.44,078.24,726.54,863.14,964.94,590.54,276.34,379.34,653.74,796.34,684.14,780.84,517.54,559.94,494.34,859.14,562.64,445,04,220.03,734.53,319.03,241.5
6.28.48.96.66.78.38.08.08.08.08.17.97.57.67.47.57.47.47.26.96.86.6
5.55.55.65.25.14.94.64.64.54.54.74.64.34.54.44.54.54.74.84.95.25.3
6.0 10.46.2 10.76.5 10.76.4 10.36.1 10.46.1 9.96.0 9.66.0 9.66.0 9.46.1 9.46.1 9.45,9 9.25.7 6.95.8 8.85.6 8.45.6 8.65.5 8.25.6 8.25.5 7.85.4 7.45.4 7.25.2 6.9
13.613.914.814.614.713.513.012.512.412.212.111.811.211.010.710.810.610.39.78.76.68.5
NOTE Olschargeswhoseage was n-dstatedwere IncludedonlyInthe “all ages”categoryfor 1S6.5-08. ImWtatlon.?were madefar missingage datafor 1SS-SS. 1ES-SO rateswere basal onthecivlllarrnoninstitutionallzed rxpulatlon,as estimatedbefore ttw 1980 census. 1981-S6 rates were based on the civilian resident population, = estknaled after tlw 1SS0 census. The MidwestRegionwas kmwn asthe North Central Region before 19S5.
31
(
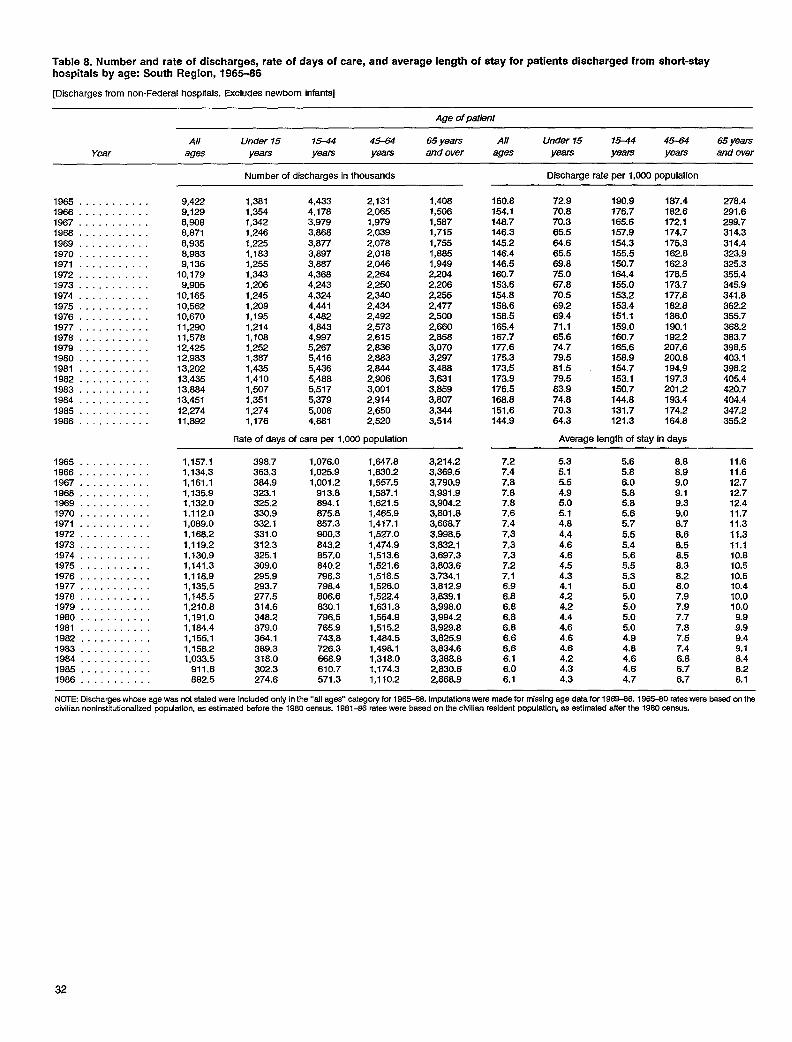
Table 8. Number and rate of discharges, rate of days of care, and average length of stay for patients discharged from short-stayhospitals by age: South Region, 1965-86
[Discharges from non-Federal hospttals. Excludes newborn Infants]
Age of patlenf
All Under 15 1=4 45X54 65 years All Under 15 15-f4 45-64 65 yearsYear ages years years years and over agea years yearn years and over
1965 . . . . . . . . . . .1966 . . . . . . . . . . .1967 . . . . . . . . . . .1968 . . . . . . . . . . .1969, . . . . . . . . . .1970 . . . . . . . . . . .1971 . . . . . . . . . . .1972 . . . . . . . . . . .1973 . . . . . . . . . . .1974 . . ...,.....1975 . . . . . . . . . . .1976 . . . . . . . . . . .1977, . . . . . . . . . .1978 . . . . . . . . . . .1979 . . . . . . . . . . .1980 . . . . . . . . . . .1981 . . . . . . . . . . .1962 . . . . . . . . . . .1983 . . . . . . . . . . .1964 . . . . . . . . . . .1985 . . . . . . . . . . .1986, . . . . . . . . . .
1965 . . . . . . . . . . .1966 . . . . . . . . . . .1967 . . . . . . . . . . .1968, . . . . . . . . . .1969 . . . . . . . . . . .1970 . . . . . . . . . . .1971 . . . . . . . . . . .1972 . . . . . . . . . . .1973 . . . . . . . . . . .1974 . . . . . . . . . . .1975 . . . . . . . . . . .1976 . . . . . . . . . . .1977 . . . . . . . . . . .1978 . . . . . . . . . . .1979 . . . . . . . . . . .1960 . . . . . . . . . . .1981 . . . . . . . . . . .1982 . . . . . . . . . . .1983 . . . . . . . . . . .1984 . . . . . . . . . . .1985 . . . . . . . . . . .1986 . . . . . . . . . . .
9,4229,1298,9066,8718,9358,9839,136
10,1799,905
10,16510,56210,67011,29011+S7812,42512,98313,20213,43513,884
13,45112,27411,892
1,157.11,134,31,161.11,135.91,132.01,112.01,089.01,168.21,119.21,130.91,141.31,118.91,135.51,145.51,210.81,191,01,184.41,155.11,158.21,033.5
911.6882.5
Number of discharges in thousands
1,381 4,433 2,1317,354 4,178 2,0651,342 3,979 1,9791,246 3,868 2,0391,225 3,877 2,0781,183 3,897 2,0181,255 3,887 2,0461,343 4,368 2,2641,206 4,243 2,2501,245 4,324 2,3401,209 4,441 2,4341,195 4,482 2,4921,214 4,643 2,5731,108 4,997 2,6151,252 5,267 2,6361,387 5,416 2,8831,435 5,436 2,8441,410 5,488 2,9061,507 5,517 3,0011,351 5,379 2,9141,274 5,006 2,6501,176 4,681 2,520
Rate of days of care per 1,000 population
398.7 1,076.0 1,847.8363.3 1,025.9 1,830.2384.9 1,001.2 1,557.5323.1 913.8 1,587.1325.2 894,1 1,621.5330.9 875.8 1,465.9332.1 857,3 1,417.1331.0 900.3 1,527.0312.3 843,2 1,474.9325.1 857,0 1,513.6309.0 840.2 1,521.6295.9 796.3 1,518.5283.7 798,4 1,526.0277.5 806.6 1,522.4314.6 630,1 1,631.3348.2 796,5 1,554.9379.0 765,9 1,515.2384.1 743.8 1,464.5389.3 726.3 1,498.1318.0 668.9 1,318.0302.3 610.7 1,174.3274.6 571.3 1,110.2
1,4081,5061,5871,7151,7551,8851,9492,2042,2062,2552,4772,5002,6602,8583,0703,2973,4883,6313,8593,8073,3443,514
3,214.23,369.53,790.93,991.93,904.23,801.83,668.73,986.63,632.13,887.33,803.63,734.13,812.93,839.13,998.03,994.23,929.83,825.93,834.63,388.82,830.62,868.9
Discharge rafe per 1,000 population
160.8 72.9 190.9 167.4 278.4154.1 70.8 176.7 182.6 291.6148.7 70.3 165.6 172.1 299.7146.3 65.5 157.9 174.7 314.3145.2 64.6 154.3 175.3 314.4746.4 65.5 155.5 162.8 323.9146.5 69.8 150.7 182.3 325.3160.7 75.0 164.4 178.5 355.4153.6 87.8 155.0 173.7 345.9154.8 70.5 153.2 177.8 341.8158.6 69.2 153.4 182.8 362.2156.5 69.4 151.1 186.0 355.7165,4 71.1 159.0 190.1 368.2167.7 65.6 180.7 192.2 383.7177,6 74.7 165.6 207.6 398.5175,3 79.5 158.9 200.8 403.1173,5 8~.5 154.7 194.9 398.2173.9 79.5 153.1 197.3 405.4176.5 83.9 150.7 201.2 420.7168.8 74.8 144.8 193.4 404.4151.6 70.3 131.7 174.2 347.2144.9 64.3 121.3 164.8 355.2
Average length of stay In days
7.2 5.3 5.6 8.6 11.67.4 5.1 5.8 8.9 11.67.8 5.5 6.0 9.0 12.77.8 4.9 5.8 9.1 12.77.8 5.0 6.8 9.3 12.47.6 5. t 5.6 9.0 11.77.4 4.8 5.7 8.7 11.37.3 4.4 5.5 6.6 11.37.3 4.6 5.4 8.5 11.17.3 4.6 5.6 8.5 10.87.2 4.5 5.5 8.3 10.57.1 4.3 5.3 8.2 10.56.9 4.1 5.0 8.0 10.46.8 4.2 5.0 7.9 10.06.8 4.2 5.0 7.9 10.06.8 4.4 5.0 7.7 9.96.8 4,6 5.0 7.8 9.96.6 4.6 4.9 7.5 9.46.6 4.6 4.8 7.4 9.16.1 4.2 4.6 6.8 8.46.0 4.3 4.6 6.7 8.26.1 4.3 4.7 6.7 8.1
NOTE Dischargeswhose age wes ret stated were Includedonlyh the “allages”categoryfor 1965-8S. Imputations were madefor mlsslcg age data for 19SS-6e. 1S65-S0 rates were besed on thecivilian nonlnstitutlonetlzed population, as estimated before the 19e0 census. 19e14rates were b-don tkclvlllm resident population, *@lmatedafiertk 1980 c9nsus.
32

Table 9. Number and rate of discharges, rate of days of care, and average length of stay for patients discharged from shoti-stsyhospitais, by age: West Region, 1965-66
[Discharges from non-Federal hospifefs. Excludes newborn Infants]
Age ofptlent
All Under 15 15-44 45-64 65 years All Under 15 1544 45-64 65 yearsYear ages years years yeets and over ages years yeals m and over
Number of dlscheraes In thousands
1965 . . . . . . . . . . .1966 . . . . . . . . . . .1967 . . . . . . . . . . .1966 . . . . . . . . . . .1969 . . . . . . . . . . .1970 . . . . . . . . . . .1971 . . . . . . . . . . .1972 . . . . . . . . . . .1973 . . . . . . . . . . .1974 . . . . . . . . . . .1975 . . . . . . . . . . .1976 . . . . . . . . . . .1977 . . . . . . . . . . .1978 . . . . . . . . . . .1979 . . . . . . . . . . .1980 . . . . . . . . . . .1981 . . . . . . . . . . .1982 . . . . . . . . . . .1983 . . . . . . . . . . .1984 . . . . . . . . . . .1965 . . . . . . . . . . .1966 . . . . . . . . . . .
4,5774,5724,5774,2414,3454,3634,2414,8945,0365,2205,4545,5225,9865,6835,8696,1036,3886,3736,6146,4056,5026,478
1965 . . . . . . . . . . .1966 . . . . . . . . . . .1867 . . . . . . . . . . .1968 . . . . . . . . . . .1969 . . . . . . . . . . .1970 . . . . . . . . . . .1971 . . . . . . . . . . .1972 . . . . . . . . . . .1973 . . . . . . . . . . .1974 . . . . . . . . . . .1975 . . . . . . . . . . .1976 . . . . . . . . . . .1977 . . . . . . . . . . .1978 . . . . . . . . . . .1979 . . . . . . . . . . .1980 . . . . . . . . . . .1981 . . . . . . . . . . .1982 . . . . . . . . . . .1983 . . . . . . . . . . .?984 . . . . . . . . . . .1985 . . . . . . . . . . .1986 . . . . . . . . . . .
894.51,024.9
994.6924.1939.3860.4790.9861.3903.0808.6924.8912.8936.8882.7883.0873.0884.3849.8853.5787.6748.4735.1
656676552556548538565573557544539571528516460496504478446415429
2,0942,1082,0821,6691,e291,9531,8732,1542,1662,2512,3512,3472,5632,5002,5932,6472,6942,6502,7542,6812,7492,665
1,oe21,0611,0451,0241,0191.037
“9961,1801,2561,333i ,4071,3891,4551,3091,3761,4031,4341,4441,4081,3361,3501,313
Rate of days of cafe per 1,000 population
716718766795841823833975
1,0391,0801,1521,2471,3521,3541,4041,5721,7641,7741,9741,9411,9682,051
287.2277.8283.1210.9228.8203.0197.4214.1217.9208.2236.3211.4228.0235.1210.5194.0223.3210.8183.8163.0161.8178.4
892.4683.7647.0738.3726.9678.1606.4675.5655.3660.7672.1636.1671.0639.1616.5589.3576.5535.2554.5521.5488.6474.4
1,530.61,531.21,395.01,356.31,311.81,206.41,102.71,259.81,275.31,348.71,352.91,297.71,295.51,125.61,166.31,199.51,186.31,166.61,073.91,014.6
959.0920.9
2,970.33,350.23,049.33,388.83,613.23,127.82,905.63,116.93,344.43,186.83,130.53,299.03,292.63,169.23,219.83,268.83,271.83,176.53,338.02,926.52,847.62,824.1
Discharge rate per 1,000 population
147.3145.2142.9130.9131.8128.5122.613e.3141.4143.7147.6146.6155.7145.4146.5143.8146.4143.3145.6138.7137.6134.4
6.67.17.07.17.16.76.56.36.46.36.36.26.06.16.06.16.05.95.95.75.45.5
65.5 170.1 162.765.1 167.6 175.366.5 162.2 165.354.4 143.6 156.654.8 144.1 154.355.4 137.4 151.054.3 127.6 142.759.7 142.4 166.359.3 139.4 174.156.1 140.0 181.357.2 142.0 186.557.2 137.3 183.360.8 146.9 189.656.4 137.4 168.054.4 137.4 173.248.8 129.3 175.149.5 128.1 176.749.3 123.5 176.345.7 125.5 169.641.9 120.4 159.338.4 119.5 160.538.9 114.3 154.5
Average length of stay in days
4.4 5.2 8.44.3 5.3 8.74.3 5.2 8.43.9 5.1 8.64.2 5.0 8.53.7 4.9 8.03.6 4.7 7.73.6 4.7 7.63.7 4.7 7.33.6 4.7 7.44.1 4.7 7.23.7 4.6 7.13.7 4.6 6.84.2 4.7 6.73.9 4.5 6.74.0 4.6 6.84.5 4.5 6.74.3 4.3 6.64.0 4.4 6.34.4 4.3 6.44.2 4.1 6.04.6 4.2 5.8
272.8271.0282.7285.7286,2277.5274.9313.1325.6326.0337.0353.4371.1359.2359.3361.6395.6386.1417.7397.2395.4395.5
10.912.412.111.912.211.310.610.010.39.79.39.38.98.89.08.68.38.28.07.47.27.1
NOIE Dlschsrges whose age wss K4 statedwere included only In the ““allages” category for lSaE-SS. lm~atlons wsrs msde for missing age dsta for 1S6S-S8. 19S5-W rsies were bsssd on thscivllim nonlmtlttilondlmd pwldion, -dimatd before the19 SO-s. 19Sl+mtes mreb=don tbclvillm r=i&WpWltiIm, =-timM*eriklW=~s.
33

Table 10. Number and rate of discharges for patients under 15 years of age discharged from short-stay hospitals, by selected first-listeddiagnosis: United States, 1965-66
[Discharges from non-Federel hospitals. Excludes newborn infants. Medics! data for 1969 were not coded]
Dkeeses of i!7iseaees ofthe e.w and the ear and
Year Pneumonia Fractures mastokl process Pneumonia Fractures mastoid process
Number in thousands Rate per 10,000 population
375312269268-..249243289261239240234227246255227229270242207206194
201195196164.-.192167195189199162199174166155152155153147146132134
82959192
---95
12013214914916218119917620022119517718615211894
83.352.743.949.1-..
43.042150.746.543.344.143.843.247.349.644.344.752.547.039.939.737.4
33.932.933.231.4---33.132.434.233.736.033.537.333.132030.129.630.229.726.526.325.325.7
13.816.015.415.7..-
16.420.823.126.527.029.633.937.633.938.943.136.134.436.029.422.718.0
NOTE 8ee appmdlx 11,table W for code rwmbere.
Table 11. Number and rate of discharges for patients 15-44 years of age discharged from short-stay hospitals, by selected first-listeddiagnosis: United States, 1966-66
[Discharges from non-Federal hospitals. Medical data for 1969 were not coded]
Mental Interveflebral Mental IntervertebralYear Appendicitis disordets disc dl.sorders Appendicitis dlsordera drkc disorders
Number in thousands Rate per 10,000 population
1965 . . . . . . . . . . . . . . . . . . . . . . . . . . . .1966 . . . . . . . . . . . . . . . . . . . . . . . . . . . .1967 . . . . . . . . . . . . . . . . . . . . . . . . . . .1966 . . . . . . . . . . . . . . . . . . . . . . . . . . . .1969 . . . . . . . . . . . . . . . . . . . . . . . . . . . .1970 . . . . . . . . . . . . . . . . . . . . . . . . . . . .1971 . . . . . . . . . . . . . . . . . . . . . . . . . . . .1972 . . . . . . . . . . . . . . . . . . . . . . . . . . . .1973 . . . . . . . . . . . . . . . . . . . . . . . . . . . .~974 . . . . . . . . . . . . . . ..<...... . . . . .1975 . . . . . . . . . . . . . . . . . . . . . . . . . . . .1976 . . . . . . . . . . . . . . . . . . . . . . . . . . .1977 . . . . . . . . . . . . . ...<... . . . . . . . .1978 . . . . . . . . . . . . . . . . . . . . . . . . . . . .1979 . . . . . . . . . . . . . . . . . . . . . . . . . . . .1980 . . . . . . . . . . . . . . . . . . . . . . . . . . . .1981 . . . . . . . . . . . . . . . . . . . . . . . . . . . .1982 . . . . . . . . . . . . . . . . . . . . . . . . . . . .1983 . . . . . . . . . . . . . . . . . . . . . . . . . . . .1984 . . . . . . . . . . . . . . . . . . . . . . . . . . . .1965 . . . . . . . . . . . . . . . . . . . . . . . . . . . .1986 . . . . . . . . . . . . . . . . . . . . . . . . . . . .
182182171176---166150168172163162166191164168154169151146158148153
379425415432-..554590645669758813807907971963954966972950966
1,0141,111
119124123127---134143166168192180198204162192198197225254271285273
24.224.022.222.5---20.317.619.419.417.917.417.419.616.416.514.816.014.113.614.413.313.5
50.555.953.955.2---67.670.174.575.463.267.464.793.097.396.391.693.490.787.367.890.698.1
15.816.316.016.2---16.417.019.218.921.119.420.820.918.218.619.018.620.923.424.623.724.1
NOTE:Seeappendix ll,tableVlllformde rwrrbers.
34
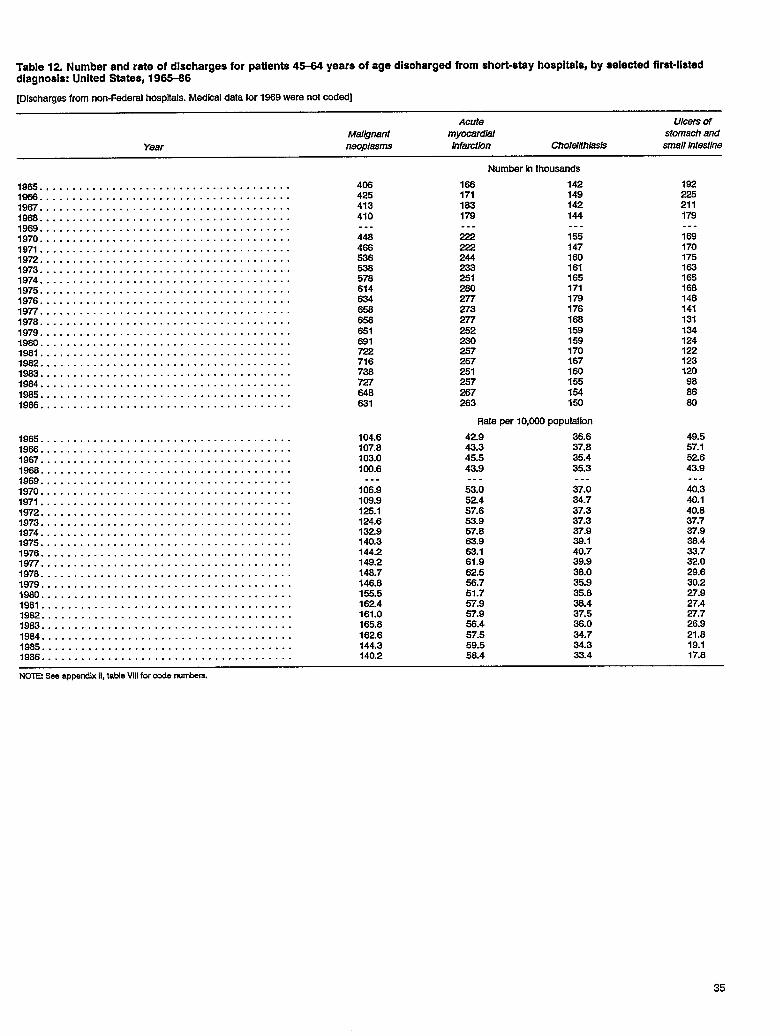
Table 12. Number and rate of discharges for patients 45-64 years of age discharged from short-stay hospitais, by selected first-iisteddiagnoais: United States, 1965-66
[Discharges from non-Federel hospitals. Medfoal data for 1969 were not coded]
Aoute ulcers ofrdall.gnant myocardal stomach end
Year neopleems Infatctkm CholWfhiasB small Intestine
Number in thousands
1965 . . . . . . . . . . . . . . . . . . . . . . . . . . . . . . . . . . . . . . 406 166 142 1921966 . . . . . . . . . . . . . . . . . . . . . . . . . . . . . . . . . . . . . . 425 171 142 2251967 . . . . . . . . . . . . . . . . . . . . . . . . . . . . . . . . . . . . . . 413 183 142 2111966 . . . . . . . . . . . . . . . . . . . . . . . . . . . . . . . . . . . . . . 410 179 144 1791969 . . . . . . . . . . . . . . . . . . . . . . . . . . . . . . . . . . . . . . . . . --- ---
1970 . . . . . . . . . . . . . . . . . . . . . . . . . . . . . . . . . . . . . .. . .
448 222 155 1691971 . . . . . . . . . . . . . . . . . . . . . . . . . . . . . . . . . . . . . . 466 222 147 1701972 . . . . . . . . . . . . . . . . . . . . . . . . . . . . . . . . . . . . . . 536 244 160 1751973 . . . . . . . . . . . . . . . . . . . . . . . . . . . . . . . . . . . . . . 538 233 161 1631974 . . . . . . . . . . . . . . . . . . . . . . . . . . . . . . . . . . . . . . 578 251 165 1651975 . . . . . . . . . . . . . . . . . . . . . . . . . . . . . . . . . . . . . . 614 260 171 1681976 . . . . . . . . . . . . . . . . . . . . . . . . . . . . . . . . . . . . . . 277 ~79 146Len . . . . . . . . . . . . . . . . . . . . . . . . . . . . . . . . . . . . . . 65a 273 176 1411976 . . . . . . . . . . . . . . . . . . . . . . . . . . . . . . . . . . . . . . 65a 2n 16a 1311979 . . . . . . . . . . . . . . . . . . . . . . . . . . . . . . . . . . . . . . 651 252 159 1341980 . . . . . . . . . . . . . . . . . . . . . . . . . . . . . . . . . . . . . . 681 159 1241981 . . . . . . . . . . . . . . . . . . . . . . . . . . . . . . . . . . . . . . 722 257 170 1221962 . . . . . . . . . . . . . . . . . . . . . . . . . . . . . . . . . . . . . . 716 257 167 1231963 . . . . . . . . . . . . . . . . . . . . . . . . . . . . . . . . . . . . . . 738 253 160 1201964 . . . . . . . . . . . . . . . . . . . . . . . . . . . . . . . . . . . . . . 727 257 155 961985 . . . . . . . . . . . . . . . . . . . . . . . . . . . . . . . . . . . . . . 648 267 154 861966 . . . . . . . . . . . . . . . . . . . . . . . . . . . . . . . . . . . . . . 631 263 154) 60
Rate per 10,000 population
1965 . . . . . . . . . . . . . . . . . . . . . . . . . . . . . . . . . . . . . . 104.6 429 36.6 49.51966 . . . . . . . . . . . . . . . . . . . . . . . . . . . . . . . . . . . . . . 107.8 43.3 37.8 57.11967 . . . . . . . . . . . . . ...<... . . . . . . . . . . . . . . . . . . 103.0 45.5 35.4 526
1CX).6 43.9 35.3 43.9;%::::::::::::::::::::: ::::::::::::::::: .-. --- ---1970 . . . . . . . . . . . . . . . . . . . . . . . . . . . . . . . . . . . . . .
. . .106.9 53.0 37.0 40.3
1971 . . . . . . . . . . . . . . . . . . . . . . . . . . . . . . . . . . . . . . 102.9 52.4 34.7 40.11972 . . . . . . . . . . . . . . . . . . . . . . . . . . . . . . . . . . . . . . 125.1 57.6 37.3 40.61973 . . . . . . . . . . . . . . . . . . . . . . . . . . . . . . . . . . . . . . 124.6 53.9 37.3 37.71974 . . . . . . . . . . ...<..... . . . . . . . . . . . . . . . . . . . 132.9 57.8 37.9 37.91975 . . . . . . . . . . . . . . . . . . . . . . . . . . . . . . . . . . . . . . 140.3 63.9 391 38.41976 . . . . . . . . . . . . . . . . . . . . . . . . . . . . . . . . . . . . . . 144.2 63.1 40.7 33.7Len . . . . . . . . . . . . . . . . . . . . . . . . . . . . . . . . . . . . . . 149.2 61.9 39.9 32.01976 . . . . . . . . . . . . . . . . . . . . . . . . . . . . . . . . . . . . . . 148.7 62.5 36.0 29.61979 . . . . . . . . . . . . . . . . . . . . . . . . . . . . . . . . . . . . . . 146.6 56.7 35.9 30,21980 . . . . . . . . . . . . . . . . . . . . . . . . . . . . . . . . . . . . . . 155.5 51.7 35.6 27.91961 . . . . . . . . . . . . . . . . . . . . . . . . . . . . . . . . . . . . . . 162.4 57.9 38.4 27.419s2 . . . . . . . . . . . . . . . . . . . . . . . . . . . . . . . . . . . . . . 161.0 57.9 37.5 27.71983 . . . . . . . . . . . . . . . . . . . . . . . . . . . . . . . . . . . . . . 165.8 5&4 36.0 26.91984 . . . . . . . . . . . . . . . . . . . . . . . . . . . . . . . . . . . . . . 162.6 57.5 34.7 21.81985 . . . . . . . . . . . . . . . . . . . . . . . . . . . . . . . . . . . . . . 144.3 59.5 34.3 19.11986 . . . . . . . . . . . . . . . . . . . . . . . . . . . . . . . . . . . . . . 140.2 58.4 33.4 17.8
NOTE See apperdlx 11,table Vlll for cade m.mbws.
35
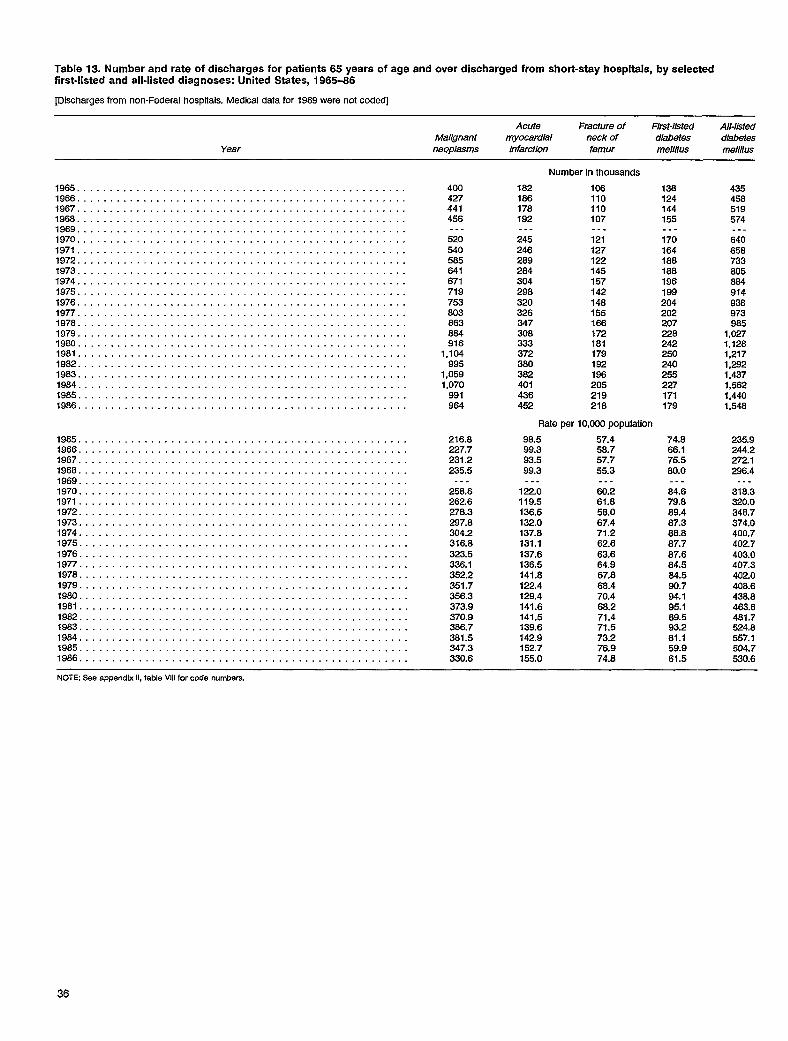
Table 13. Number and rate of discharges for patients 65 years of age and over discharged from short-stay hospitals, by selectedfirst-listed and all-listed diagnoses: United States, 1965-66
[Discharges from non-Federal hospitals. Medical data for 1969 were not coded]
Acute Fracture of First-listed A1l-ltstedMalignant myocardisl neck of d!abetes diabetes
Year neoplasms Inferctlon femur mellitus tneltitus
400427441456---520540565641671719753803663864916
1,104995
1,0591,070
991964
216.6227.7231.2235.5
..-
256.6262.6276.3297.6304.2316.6323.5336.1352.2351.7356.3373.9370.9366.7381.5347.3330.6
Number in thousands
162 106166 110176 110192 107. . . ---
245 121246 127269 122264 145304 157298 142320 146326 155347 166308 172333 181372 179360 192362 196401 205436 219452 216
Rate per 10,000 population
96.5 57.499.3 56.793.5 57.799.3 55.3-.. . . .
122.0 60.2119.5 61.8136.5 56.0132.0 67.4137.6 71.2131.1 62.6137.6 63.6136.5 64.9141.8 67.8122.4 6a.4129.4 70.4141.6 68.2141.5 71.4139.6 71.5142.9 73.2152.7 76.9155.0 74.8
138124144155..-
170164186186196199204202207226242250240255227171179
74.666.175.580.0---84.679.689.487.366.887.787.684.564.5eo.794.195.182.593.281.159.961.5
435458519574. . .
640658733805884914938973985
1,0271,1281,2171,2921,4371,5621,4401,548
235.9244.2272.1296.4
..-316.3320.0348.7374.0400.7402.7403.0407.3402.0408.6438.6463.6481.7524.6557.1504.7530.6
NOTE See appendix 11,table W for code numbers.
36

Table 14. Number of patients discharged from short-stay hospitals with and without surgery, total number of surgeries, average numberof surgeries for patients with surgery, and average length of stay for patients with and without surgery: United States, 1965-66
[Discharges from non-Federal hospitals. Excludes newborn Infants. Surgical data for 1969 were not coded]
SurgerfaeAll Patlen:s Pat/ants All perpatlefrt Patfents Patknk
Year patients without surgety wtth surgety surgeries wfitf surgety without surgery with surgety
Number In thousandsAveragenumber
1965 . . . . . . . . . . . . . .1966. . . . . . . . . . . . . .1267 . . . . . . . . . . . . . .1968 . . . . . . . . . . . . . .1969 . . . . . . . . . . . . . .1970 . . . . . . . . . . . . . .1971 . . . . . . . . . . . . . .1972 . . . . . . . . . . . . . .1973 . . . . . . . . . . . . . .1974 . . . . . . . . . . . . . .1975 . . . . . . . . . . . . . .1976 . . . . . . . . . . . . . .7977. . . . . . . . . . . . . .1978 . . . . . . . . . . . . . .1979 . . . . . . . . . . . . . .1980 . . . . . . . . . . . . . .1981 . . . . . . . . . . . . . .1982 . . . . . . . . . . . . . .1983 . . . . . . . . . . . . . .1984 . . . . . . . . . . . . . .1985 . . . . . . . . . . . . . .1986 . . . . . . . . . . . . . .
28,79228,47727,96428,070
.-.
29,12729,45931,62732,12533,01834,04334,37235,90235,61636,74737,83239,54438,59338,76337,16235,05634,256
17,79517,49717,02117,162
. . .
17,57317,82418,96418,85919,20119,65420,12720,68820,93220,15220,81621,10321,16021,29420,32416,95918,459
10,99610,98010,94210,90s
. . .
11,55311,63512,64313,26613,81714,18914,24515,01414,68416,59517,00517,44117,43317,48816,83818,09715,797
15,00814,97414,76814,708
. . .
15,61315,77417,33318,42619,26620,04020,08621,15920,75423,85624,49425,62425,82426,22025,59024,79925,041
1.361.361.351.34-..
1.351.361.371.391.397.411.411.411.411.441.441.471.481.501.521.541.59
Average lengthofstaylndays
7.5 8.27.8 8.58.2 8.78.3 8.7.-. .-.
7.6 8.07.7 8.07.6 7.97.6 7.97.6 7.97.9 7.97.5 7.97.2 7.57.1 7.77.3 7.17.4 7.17.3 7.17.1 7.16.9 6.96.5 6.76.3 6.76.2 6.6
Table 15. Number and rate of tonsillectomies with or without adenoidectomies for patients discharged from short-stay hospitals, by age:United States, 1966-66
[Discharges from non-Federal hospitals. Excludes newborn Infants. Surgical data for 1969 were not coded]
Aaeofmk?nt
All Under 15 15-44 All Under 15 15-44Year agesi years years agesi years years
Number in thousands Rate per 10,000 population
1965 . . . . . . . . . . . . . . . . . . . . . . . . . . . . . . . . . . . . . . . . . . . . .1966 . . . . . . . . . . . . . . . . . . . . . . . . . . . . . . . . . . . . . . . . . . . . .1987 . . . . . . . . . . . . . . . . . . . . . . . . . . . . . . . . . . . . . . . . . . . . .1968 . . . . . . . . . . . . . . . . . . . . . . . . . . . . . . . . . . . . . . . . . . . . .1969 . . . . . . . . . . . . . . . . . . . . . . . . . . . . . . . . . . . . . . . . . . . . .1970 . . . . . . . . . . . . . . . . . . . . . . . . . . . . . . . . . . . . . . . . . . . . .1971 . . . . . . . . . . . . . . . . . . . . . . . . . . . . . . . . . . . . . . . . . . . . .1972 . . . . . . . . . . . . . . . . . . . . . . . . . . . . . . . . . . . . . . . . . . . . .1973 . . . . . . . . . . . . . . . . . . . . . . . . . . . . . . . . . . . . . . . . . . . . .1974 . . . . . . . . . . . . . . . . . . . . . . . . . . . . . . . . . . . . . . . . . . . . .1975 . . . . . . . . . . . . . . . . . . . . . . . . . . . . . . . . . . . . . . . . . . . . .1976 . . . . . . . . . . . . . . . . . . . . . . . . . . . . . . . . . . . . . . . . . . . . .1977 . . . . . . . . . . . . . . . . . . . . . . . . . . . . . . . . . . . . . . . . . . . . .1976 . . . . . . . . . . . . . . . . . . . . . . . . . . . . . . . . . . . . . . . . . . . . .1979 . . . . . . . . . . . . . . . . . . . . . . . . . . . . . . . . . . . . . . . . . . . . .1980 . . . . . . . . . . . . . . . . . . . . . . . . . . . . . . . . . . . . . . . . . . . . .1981 . . . . . . . . . . . . . . . . . . . . . . . . . . . . . . . . . . . . . . . . . . . . .1982 . . . . . . . . . . . . . . . . . . . . . . . . . . . . . . . . . . . . . . . . . . . . .1983 . . . . . . . . . . . . . . . . . . . . . . . . . . . . . . . . . . . . . . . . . . . . .1984 . . . . . . . . . . . . . . . . . . . . . . . . . . . . . . . . . . . . . . . . . . . . .1985 . . . . . . . . . . . . . . . . . . . . . . . . . . . . . . . . . . . . . . . . . . . . .1986 . . . . . . . . . . . . . . . . . . . . . . . . . . . . . . . . . . . . . . . . . . . . .
1,2151,1711,0671,056
. . .
958e67917884808685629617548500464457439424348317281
eal954853835-..
7267366796475834704344~4360313294289269279224197176
218204204213---
224224232232220209191199182181162102163140118114lm
63.460.554.653.6-..
47.447.244.242.238.232.129.128.324.822.420.620.119.118.314.813.411.7
165.5161.0144.4142.3
---
124.7127.4119.0115.2105.6
88.581.478.769.260.857.456.452.354.143.437.833.9
29.026.926.527.2
---
28.025.626.926.224.822.520.120.418.217.715.515.315.212.810.710.28.9
1Iffihdes data forage grcups cotd_CWnin~le.
NOTE See appendix11,table Vlllfor code numbers.
37
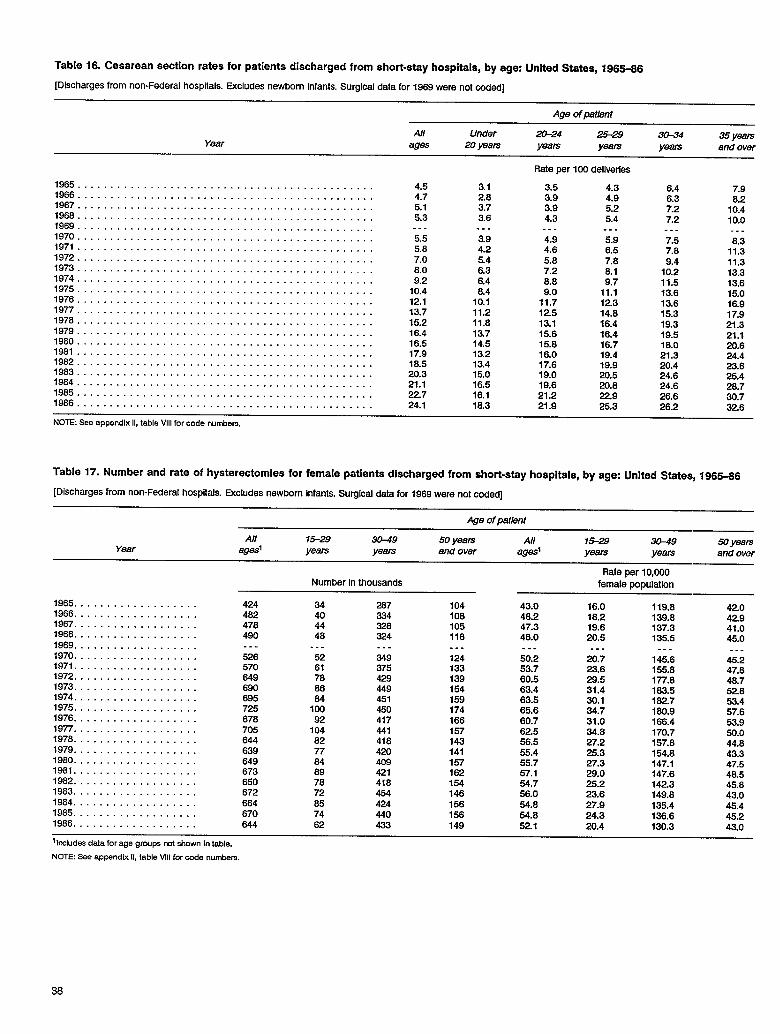
Table 16. Cesarean section rates for patienta discharged from short-stay hospitals, by age: United States, 1965-66
[Dischargesfrom non-Federalhospnals.Excludesnewborninfants.Surgicaldata for 1969 were not coded]
Age ofpat/errt
All Under 3%74Year
20-24 2s-22 35 yearsages 20 pars years years years and over
Rate per 100 deliveries
1965 . . . . . . . . . . . . . . . . . . . . . . . . . . . . . . . . . . . . . . . . . . . . . 4.5 3.11966 . . . . . . . . . . . . . . . . . . . . . . . . . . . . . . . . . . . . . . . . . . . . .
3.5 4.34.7
6.428
7.9
1967 . . . . . . . . . . . . . . . . . . . . . . . . . . . . . . . . . . . . . . . . . . . . .3.9 4.9
5.16.3
3.76.2
3.91966 . . . . . . . . . . . . . . . . . . . . . . . . . . . . . . . . . . . . . . . . . . . . .
5.25.3
7.23.6
10.4
1969 . . . . . . . . . . . . . . . . . . . . . . . . . . . . . . . . . . . . . . . . . . . . . ---4.3 5.4 7.2 10.0
1970 . . . . . . . . . . . . . . . . . . . . . . . . . . . . . . . . . . . . . . . . . . . . .-.. --- . . . -.. -..
5.5 3.91971 . . . . . . . . . . . . . . . . . . . . . . . . . . . . . . . . . . . . . . . . . . . . .
4.9 5.95.8
7.54.2
8.34.6
1972 . . . . . . . . . . . . . . . . . . . . . . . . . . . . . . . . . . . . . . . . . .6.5 7.6
7.0 5.411.3
5.81973 . . . . . . . . . . . . . . . . . . . . . . . . . . . . . . . . . . . . . . . . . . . . .
7.86.0
9.46.3
11.37.2
1974 . . . . . . . . . . . . . . . . . . . . . . . . . . . . . . . . . . . . . . . . . . . . .8.1 10.2
9.2 6.413.3
1975 . . . . . . . . . . . . . . . . . . . . . . . . . . . . . . . . . . . . . . . . . . . . .8.8 9.7
10.411.5
&413,6
1976 . . . . . . . . . . . . . . . . . . . . . . . . . . . . . . . . . . . . . . . . . . . . .9.0 11.1
12.113.6
10.115.0
1977 . .. ... . . .. . . . . .. . . .. . .. . . .. . .. . . . . . .. . .. . . .. .11.7 12.3
13.713.6
11.216.9
1976 . .. . .. . . . . . . . . .. . . .. . .. . . .. . .. . . . . . .. . .. . . .. .12.5 14.8
15.215.3
11.617.9
13.11979 . .. . .. . . . . . . . . .. . . .. . .. . . .. . .. . . . . . .. . .. . . .. .
16.4 19.316.4 13.7
21.3
1960 . .. . .. . . .. . .. . .. . . .. . .. . . ... .. . . . . . .. . .. . . .. .15.6 16.4
16.519.5
14.521.1
1961 . .. . .. . . . . . .. . .. . . .. . .. . . .. . .. . . . . . .. .. . . . .. .15.6 16.7
17.918.0
13.220.6
1962 . .. . .. . . .. . . . . .. . . .. . .. . . .. . .. . .. . . .. . .. . . .. .16.0 19.4
18.521.3
13.424.4
1963 . .. . .. . . .. . .. . .. . . .. . .. . . .. . .. . .. . . .. . ... .. . .17.6 19.9
20.320.4
15.023.6
1984 . .. .. . . . . . . .. . .. . . .. . .. . . .. . . . . .. . . .. . .. . . . . .19.0 20.5
21.124.6
16.525.4
19.61985 . .. . .. . . . . . .. . ... . .. . .. . . .. . . . . .. . . .. . .. . . . . .
20.822.7
24.616.1
28.721.2
1966 . ... .. . . . . . .. . .. . . .. . .. . . .. . . . . .. . . .. . .. . . .. .229
24.126.6
18.330.7
21.9 25.3 26.2 32.6
NOTE See appendix 11,table Vlllfor code numbers.
Table 17. Number and rate of hysterectomies for female patients discharged from short-stsy hospitals, by age: United Ststes, 1965-66
[Dischargesfrom non-Federalhospitals.Excludesnewborninfants.Surgicaldata for 1969 were not coded]
Ageofpatierrt
All 15-29 3&49 50 yeatsYear
AII 15-29 3549aged years
ayearsyears and over aged years years and over
Raleperl0,000Number In thousands female population
1965. . . . . . . . . . . . . . . . . . . 424 34 287 104 43.01966.. . ... . .. . . . . .. . . .. 462 40
16.0334
119.6106
42.046.2
1967.. . .. . . .. . . . . .. . . .. 478 4418,2
326139.8
10542.9
47.3 19.6 137.31966.. . .. . . .. . . . . .. . . .. 490 48 324 116
41.046.0
1969, . . .. . . . . . . . . .. . . ..20.5 135.5 45.0
..- --- ... ...1970.. . .. . . . . . .. . .. . . ..
... ...526
-..52
---349 124 50.2 20.7
1971.. . .. . . . . . .. . .. . . .. 570 61 375145.6
13345.2
53.71972.. . .. . . . . . .. . .. . . .. 849 78
23.6429
155.6139
47.860.5
1973.. . .. . . . . . .. . .. . . .. 690 8629.5
449177.8
15448.7
63.41974.. . .. . . . . . .. . .. . . .. 695 84
31.4 163.5451 159
52.863.5
1975.. . .. . . . . . .. . .. . . .. 725 10030,1
450182.7
17453.4
65.61976.. . . . . . .. . .. . .. . . .. 678 92
34.7417
160.9166
57.660.7
1977.. . . . . . .. . .. . .. . . .. 705 10431.0 166.4
441 15753.9
62.51976.. . . . . . .. . .. . .. . . .. 644 62
34.6 170.7418 143
50.056.5
1979.. . . . . . .. . .. . .. . . .. 639 7727.2 157.6
420 14144.8
55.41960. . . .. . . .. . .. . .. . . .. 649 64
25.3 154.8409 157
43.355.7
1961. . . .. . . .. . .. . .. . . .. 673 6927.3 147.1
421 16247.5
57.11962. . . .. . . .. . .. . .. . . .. 650 76
29.0 147.6418 154
48.554.7
1963.. . .. . . .. . .. . .. . . .. 672 7225.2 142.3
454 14645.8
56.01964. . . .. . .. . . .. . . . . . . . 884
23.665 424
149.8156
43.064.8
1985.. . .. . . .. . .. . . . . . . . 670 7427.9 135.4
440 15645.4
64.81986.. . .. . . .. . .. . . . . . .. 644 82
24.3 136.6433 149
45.252.1 20.4 130.3 43.0
1Inchdes data for age groups mt shown in table.
NOTE See appendix II, table WI for code numbers.
38
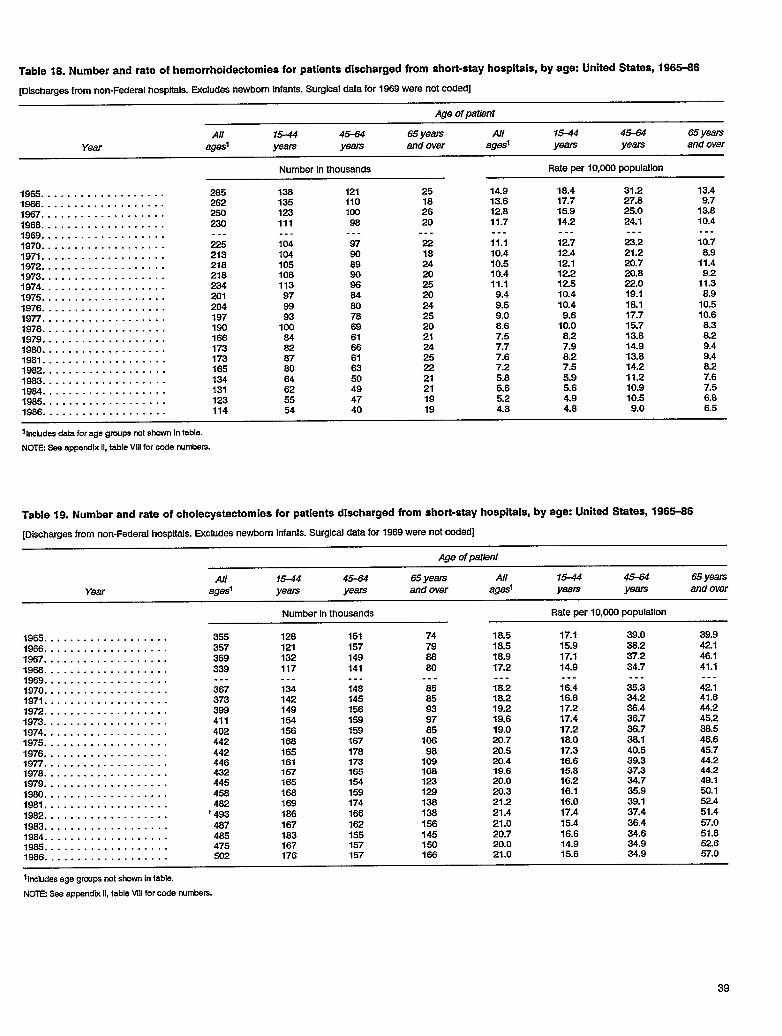
Table 18. Number and rate of hemorrhoidectomies for patients discharged from short-stay hospitals, by agex United States, 1965-66
[Discharges from non-Federal hospitals. Excludes newborn infants. Surgical data for 1089 were not coded]
Age ofpakmt
All 15-44 4S64 65 years AII 15-44 45-64 65 yearsYear aged years years and over agesl yams years and over
Number in thousands Rate per 10,000 population
1965 . . . . . . . . . . . . . . . . . . . 285 138 121 25 14.9 18.4 31.2 13.41966 . . . . . . . . . . . . . . . . . . . 262 135 110 18 13.6 17.7 27.6 9.71967 . . . . . . . . . . . . . . . . . . . 250 123 100 26 12.8 15.9 25.0 13.81968 . . . . . . . . . . . . . . . . . . . 230 111 98 20 11.7 14.2 24.1 10.41969 . . . . . . . . . . . . . . . . . . . . . . ..- -.. .-. --- .-. --- ---1970 . . . . . . . . . . . . . . . . . . . 225 104 97 22 11.1 12.7 23.2 10.71971 . . . . . . . . . . . . . . . . . . . 213 104 90 18 10.4 12.4 21.2 8.91972 . . . . . . . . . . . . . . . . . . . 218 105 89 24 10.5 121 20.7 11.41973 . . . . . . . . . . . . . . . . . . . 218 108 80 20 10.4 122 2U.8 9.21974 . . . . . . . . . . . . . . . . . . . 234 113 96 25 11.1 12.5 22.0 11.31975 . . . . . . . . . . . . . . . . . . . 201 97 84 20 9.4 10.4 19.1 8.91976 . . . . . . . . . . . . . . . . . . . 204 99 80 24 9.5 10.4 18.1 10.51977 . . . . . . . . . . . . . . . . . . . 197 93 78 25 9.0 9.6 17.7 10.61976 . . . . . . . . . . . . . . . . . . . 190 100 69 20 8.6 10.0 15.7 8.31979 . . . . . . . . . . . . . . . . . . . 166 84 61 21 7.5 8.2 13.8 8.219s0 . . . . . . . . . . . . . . . . . . . 173 82 68 24 7.7 7.9 14.9 9.41981 . . . . . . . . . . . . . . . . . . . 173 87 61 25 7.6 8.2 13.8 9.41962 . . . . . . . . . . . . . . . . . . . 165 80 63 22 7.2 7.5 14.2 8.21963 . . . . . . . . . . . . . . . . . . . 134 64 50 21 5.8 5.9 11.2 7.61984 . . . . . . . . . . . . . . . . . . . 131 62 49 21 5.6 5.6 10.9 7.51985 . . . . . . . . . . . . . . . . . . . 123 55 47 19 5.2 4.9 10.5 6.81966 . . . . . . . . . . . . . . . . . . . 114 54 40 19 4.8 4.8 9.0 6.5
Ilmkrdes data forage groups mt shown in table.
NOTE Sse appendix11,tsble Vlll for tie wnbers.
Table 19. Number and rate ofcholecystectomies for patienta discharged from shoti-stay hospitals, byage: United States, 196S-36
[Discharges from non-Federal hospltsls. Excludes newborn Infants. Surgical data for 1969 were not coded]
Age ofpatienf
All 15-44 45-64 65 yeat3 .4 15-44 45-64 65 yearsYear agesl yeas years and over aged yeats years and over
Number in thousands Rate per 10,000 population
1965 . . . . . . . . . . . . . . . . . . . 355 128 151 74 18.5 17.1 39.0 39.91966 . . . . . . . . . . . . . . . . . . . 357 121 157 79 18.5 15.9 38.2 42.11967 . . . . . . . . . . . . . . . . . . . 369 132 149 88 18.9 17.1 37.2 46.11968 . . . . . . . . . . . . . . . . . . . 339 117 141 so 17.2 14.9 34.7 41.11980 . . . . . . . . . . . . . . . . . . . .-. . . . .-. . . . --- --- ---1970 . . . . . . . . . . . . . . . . . . .
---367 134 148 85 18.2 16.4 35.3 42.1
1971 . . . . . . . . . . . . . . . . . . . 373 142 145 85 18.2 16.8 342 41.61972 . . . . . . . . . . . . . . . . . . . 399 149 158 93 19.2 17.2 38.4 44.21973 . . . . . . . . . . . . . . . . . . . 411 154 159 97 19.8 17.4 36.7 45.21974 . . . . . . . . . . . . . . . . . . . 402 156 159 85 19.0 17.2 36.7 38.51975 . . . . . . . . . . . . . . . . . . . 442 168 167 106 20.7 18.0 3s.1 46.61976 . . . . . . . . . . . . . . . . . . . 442 165 176 96 20.5 17.3 40.5 45.71977 . . . . . . . . . . . . . . . . . . . 446 161 173 109 20.4 16.6 39.3 44.21976 . . . . . . . . . . . . . . . . . . . 432 157 165 106 19.6 15.8 37.3 44.21979 . . . . . . . . . . . . . . . . . . . 445 165 154 123 20.0 16.2 34.7 49.11980 . . . . . . . . . . . . . . . . . . . 45a 168 158 129 20.3 16.1 35.9 50.11981 . . . . . . . . . . . . . . . . . . . 462 169 174 136 21.2 16.0 39.1 52.41982 . . . . . . . . . . . . . . . . . . . ‘ 493 186 166 13a 21.4 17.4 37.4 51.41983 . . . . . . . . . . . . . . . . . . . 487 167 162 156 21.0 15.4 36.4 57.01964 . . . . . . . . . . . . . . . . . . . 485 183 155 145 20.7 16.6 34.6 51.819s5 . . . . . . . . . . . . . . . . . . . 475 167 157 150 20.0 14.9 34.9 52.61986 . . . . . . . . . . . . . . . . . . . 502 176 157 166 21.0 15.6 34.9 57.0
llmUdes age grcups not shown in table.
NOTE See appendix 11,table Vlll for code cwnbers.
39

Table 20. Number and rate of lens etiractions for patients discharged from short-stay hospitals, by age: United State% 1966+6
[Discharges for non-Federal hospitais. Excludes newborn infants. Surgical data for 1969 were not coded]
Age of patkmt
All 45-64 65-74 75 years All 45-64 65-74 75 yearsYear agesi years years and over agesl years years and over
Number [n thousands
1965 . . . . . . . . . . . . . . . . . . .1966 . . . . . . . . . . . . . . . . . . .1967 . . . . . . . . . . . . . . . . . . .1966 . . . . . . . . . . . . . . . . . . .1969 . . . . . . . . . . . . . . . . . . .1970 . . . . . . . . . . . . . . . . . . .1971 . . . . . . . . . . . . . . . . . . .1972 . . . . . . . . . . . . . . . . . .1973. . . . . . . . . . . . . . . . . . .1974 . . . . . . . . . . . . . . . . . . .1975 . . . . . . . . . . . . . . . . . . .1976 . . . . . . . . . . . . . . . . . . .1977 . . . . . . . . . . . . . . . . . . .1978 . . . . . . . . . . . . . . . . . . .1979 . . . . . . . . . . . . . . . . . . .1980 . . . . . . . . . . . . . . . . . . .1961 . . . . . . . . . . . . . . . . . . .1982 . . . . . . . . . . . . . . . . . . .1983 . . . . . . . . . . . . . . . . . .1984 . . . . . . . . . . . . . . . . . . .1985 . . . . . . . . . . . . . . . . . . .1986. . . . . . . . . . . . . . . . . . .
142175214213. . .
230243260279306333322350357416467540699630506211122
42515754
..-58846678828482867987
108105114106814223
47637976
..-
8385909698
1201201111271441531941991971656137
4451ee73
---
79869292
112118124139139161182221259303244
9650
Rate per 10,000 population
7.4 10.9 39.7 &’.59.1 13.0 52.4 75.1
10.9 14.3 65.4 98.310.8 13.2 64.4 101.3..- --- --- ---11.4 13.8 66.2 103.711.9 15.0 88.9 109.812.5 15.5 69.9 114.113.3 18.2 72.7 111.614.4 78.9 71.9 132.515.6 19.1 88.3 133.914.9 18.6 74.9 136.716.1 19.6 75.7 150.316.2 17.9 84.4 145.818.7 19.6 93.9 164.920.7 24.3 97.9 161.023.7 23.6 122.0 213.826.1 25.7 123.5 242.127.1 23.8 120.6 275.221.6 18.0 98.5 216.1
8.9 9.3 36.1 83.15.1 5.2 21.4 42.2
i Includesdata forage groupsmt shownIntable.
NOTESeeappendlx ll,tableVlllforcode rwnbers.
Table 21. Number and rate of prostatectomiea for male patients discharged from short-stay hospitals, by age: United States, 1965-66
[Discharges from non-federal hospitals. Exciudes newborn infants. Surgical data for 1969 were not coded]
Ageofpalierrt
All 45-64 65-74 75 years Atl 45-64 66-74 75 yearsYear agesi years years and over ages years Jlmrs and over
Number In thousands Rate per 10,000 male population
1965 . . . . . . . . . . . . . . . . . . .1966 . . . . . . . . . . . . . . . . . . .1967 . . . . . . . . . . . . . . . . . . .1968 . . . . . . . . . . . . . . . . . . .1969 . . . . . . . . . . . . . . . . . . .1970, . . . . . . . . . . . . . . . . . .1971 . . . . . . . . . . . . . . . . . . .1972 . . . . . . . . . . . . . . . . . . .1973 . . . . . . . . . . . . . . . . . . .1974 . . . . . . . . . . . . . . . . . . .1975 . . . . . . . . . . . . . . . . . . .1976 . . . . . . . . . . . . . . . . . . .1977 . . . . . . . . . . . . . . . . . . .1978 . . . . . . . . . . . . . . . . . . .1979. . . . . . . . . . . . . . . . . . .1980 . . . . . . . . . . . . . . . . . . .1981 . . . . . . . . . . . . . . . . . .1982 . . . . . . . . . . . . . . . . . . .1983. . . . . . . . . . . . . . . . . . .1984 . . . . . . . . . . . . . . . . . . .1985 . . . . . . . . . . . . . . . . . . .1986 . . . . . . . . . . . . . . . . . . .
191212194212---
223207231249253288269299297263335348358357361367367
56554753..-5956677170777482687183839681838177
69848488
.-.919193
101101107105119127122139144143154151150i 52
62696168
---68887074798087979996
112119119120124134135
20.622.620.622.3---
23.021.023.024.624.625.725.828.427.927.230.631.732.331.831.932.031.7
30.029.224.427.3. . .
29.627.632.734.434.136.935.539.132.633.639.239.345.538.538.937.935.9
129.5157.3156.9164.0. . .
166.7146.8164.4175.5170.7178.0170.1187.2195.2182.9205.1208.3204.0216.4206.9200.7198.7
231.9253.1218.4237.6
..-231.1220.5227.8238.3249.6247.7264.2289.4290.2274.6312.8324.5314.3308.2310.3331.2324.2
1Inctidasdata for age grwps mt shownintable.
NOTE See appendix11,table Vlllfor code numbers
40
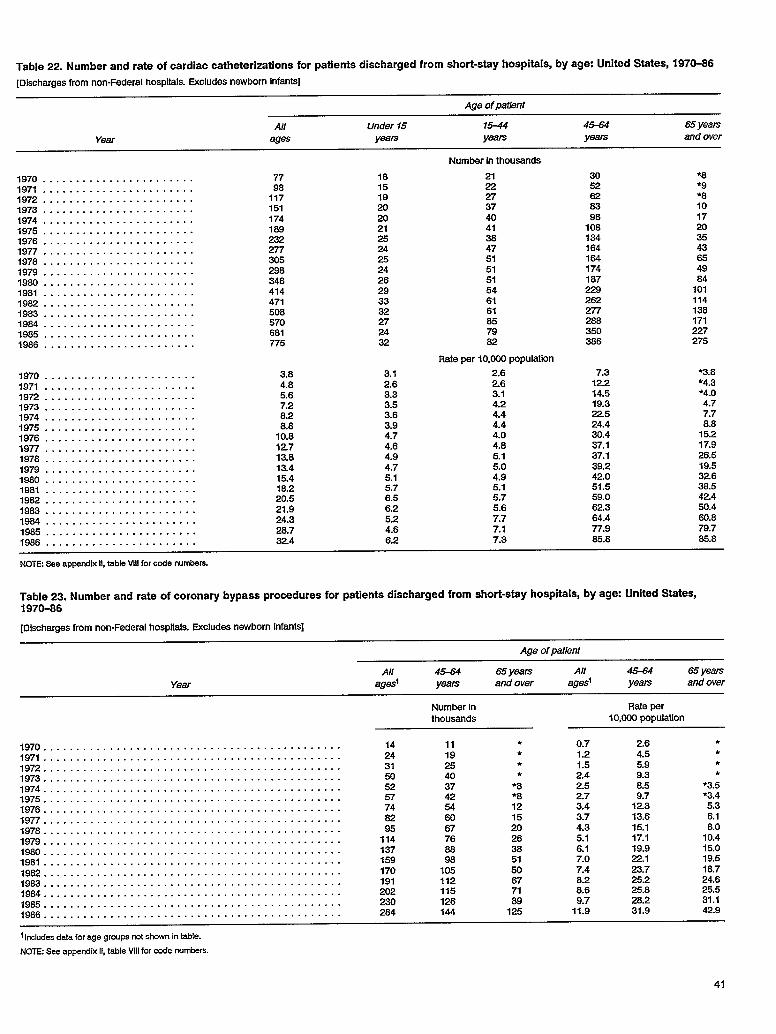
Table 22. Number and rate of cardiac catheterizations for patients discharged from shoti-stsy hospitals, by ag= United States, 1970-66
[Oisohargesfrom non-Federal hospitals. Excludes newborn infants]
Age of patient
All Under 15 15-44 454S4 65 years
Year ages years Vears wars and over
1970 . . . . . . . . . . . . . . . . . . . . . . .1971 . . . . . . . . . . . . . . . . . . . . . . .1972 . . . . . . . . . . . . . . . . . . . . . . .1973 . . . . . . . . . . . . . . . . . . . . . . .1974 . . . . . . . . . . . . . . . . . . . . . . .1975 . . . . . . . . . . . . . . . . . . . . . . .1976 . . . . . . . . . . . . . . . . . . . . . . .1977 . . . . . . . . . . . . . . . . . . . . . . .1978 . . . . . . . . . . . . . . . . . . . . . . .1979 . . . . . . . . . . . . . . . . . . . . . . .1980 . . . . . . . . . . . . . . . . . . . . . . .1981 . . . . . . . . . . . . . . . . . . . . . . .1982 . . . . . . . . . . . . . . . . . . . . . . .le63 . . . . . . . . . . . . . . . . . . . . . . .1984 . . . . . . . . . . . . . . . . . . . . . . .1985 . . . . . . . . . . . . . . . . . . . . . . .1986 . . . . . . . . . . . . . . . . . . . . . . .
1970 . . . . . . . . . . . . . . . . . . . . . . .1971 . . . . . . . . . . . . . . . . . . . . . . .1972 . . . . . . . . . . . . . . . . . . . . . . .1973 . . . . . . . . . . . . . . . . . . . . . . .1974 . . . . . . . . . . . . . . . . . . . . . . .1975 . . . . . . . . . . . . . . . . . . . . . . .1976 . . . . . . . . . . . . . . . . . . . . . . .1977 . . . . . . . . . . . . . . . . . . . . . . .1978 . . . . . . . . . . . . . . . . . . . . . . .1979 . . . . . . . . . . . . . . . . . . . . . . .1980 . . . . . . . . . . . . . . . . . . . . . . .1981 . . . . . . . . . . . . . . . . . . . . . . .1982 . . . . . . . . . . . . . . . . . . . . . . .1963 . . . . . . . . . . . . . . . . . . . . . . .1984 . . . . . . . . . . . . . . . . . . . . . . .1985 . . . . . . . . . . . . . . . . . . . . . . .1988 . . . . . . . . . . . . . . . . . . . . . . .
7798
117151174189232277305298348414471508570681775
3.84.85.67.28.28.8
10.812.713.813.415.418.220.521.924.328.732.4
1815192020212524252426293332272432
3.12.63.33.53.83.94.74.64.94.75.15.76.56.25.24.66.2
Number in thousands
2122273740413847615151546161857962
Rafeper l0,000populatlWr
2.62.63.14.24.44.44.04.85.15.04.95.15.75.67.77.17.3
3JJ
52626398
108134164164174187229262277288350386
7.312.214.519.322.524.430.437.137.139.242.051.559<062.364.477.965.8
*8*9*81017203543654964
101114138171227275
*3.8*4.3*4.O4.77.78.8
15.217.926.519.532.638.542.450.460.879.765.8
NOTE See appendix 11,table WI for cade rumbers.
Tabie23. Number and rate ofcoronary bypass procedures for patients discharged from short-stsy hospitals, byage: United States,1970-66
[Discharges from non-Federal hospitals. Excludes newborn infants]
AgeofpatLent
All 45-64 65 years All 45-64 65 yearsYear aged years and over agesl years and over
Number In Ra!e perthousands 10,000 papulatlon
1970 . . . . . . . . . . . . . . . . . . . . . . . . . . . . . . . . . . . . . . . . . . . . . 14 11 * 0.7 2.6 *
1971 . . . . . . . . . . . . . . . . . . . . . . . . . . . . . . . . . . . . . . . . . . . . . 24 19 * 1.2 4.5 *
1972 . . . . . . . . . . . . . . . . . . . . . . . . . . . . . . . . . . . . . . . . . . . . . 31 25 * 1.5 5.9 *
1973 . . . . . . . . . . . . . . . . . . . . . . . . . . . . . . . . . . . . . . . . . ---- 50 40 * 2.4 9.3 *
1974 . . . . . . . . . . . . . . . . . . . . . . . . . . . . . . . . . . . . . . . . . . . . . 52 37 *8 2.5 8.5 *3.51975 . . . . . . . . . . . . . . . . . . . . . . . . . . . . . . . . . . . . . . . . . ---- 57 42 ●8 2.7 9.7 ●3.41976 . . . . . . . . . . . . . . . . . . . . . . . . . . . . . . . . . . . . . . . . . . . . . 74 54 12 3.4 12.3 5.31977 . . . . . . . . . . . . . . . . . . . . . . . . . . . . . . . . . . . . . . . . . . . -. 82 60 15 3.7 13.6 6.11978 . . . . . . . . . . . . . . . . . . . . . . . . . . . . . . . . . . . . . . . . . . . -. 95 67 20 4.3 15.1 8.01979 . . . . . . . . . . . . . . . . . . . . . . . . . . . . . . . . . . . . . . . . . . . .- 114 76 26 5.1 17.1 10.41980 . . . . . . . . . . . . . . . . . . . . . . . . . . . . . . . . . . . . . . . . . . . . . 137 66 38 6.1 19.9 15.01981 . . . . . . . . . . . . . . . . . . . . . . . . . . . . . . . . . . . . . . . . . . . -. 159 98 51 7.0 z. 1 19.51982 . . . . . . . . . . . . . . . . . . . . . . . . . . . . . . . . . . . . . . . . . . . . . 170 105 50 7.4 23.7 18.71963 . . . . . . . . . . . . . . . . . . . . . . . . . . . . . . . . . . . . . . . . . . . . . 191 112 67 8.2 25.2 24.61984 . . . . . . . . . . . . . . . . . . . . . . . . . . . . . . . . . . . . . . . . . . . . . 202 115 71 8.6 25.8 25.51965 . . . . . . . . . . . . . . . . . . . . . . . . . . . . . . . . . . . . . . . . . . . . . 230 126 89 9.7 28.2 31.11986 . . . . . . . . . . . . . . . . . . . . . . . . . . . . . . . . . . . . . . . . . . . . . 284 144 125 11.9 31.9 42.9
1lnclu,je~data for age grCUpS ~t skwn In table.
NOTE See appendix 11,table Vlll for code rwmb-ers.
41
Appendixes
Contents
I. Technical notes on methods. . . . . . . . . . . . . . . . . . . . . . . . . . . . . . . . . . . . . . . . . . . . . . . . . . . . . . . . . . . . . . . . . . . . . . . .Introduction . . . . . . . . . . . . . . . . . . . . . . . . . . . . . . . . . . . . . . . . . . . . . . . . . . . . . . . . . . . . . . . . . . . . . . . . . . . . . . . . . . .Statistical design of the National Hospital Discharge Survey . . . . . . . . . . . . . . . . . . . . . . . . . . . . . . . . . . . . . . . . . .Data collection and processing . . . . . . . . . . . . . . . . . . . . . . . . . . . . . . . . . . . . . . . . . . . . . . . . . . . . . . . . . . . . . . . . . . .Presentation of estimates. . . . . . . . . . . . . . . . . . . . . . . . . . . . . . . . . . . . . . . . . . . . . . . . . . . . . . . . . . . . . . . . . . . . . . . .Reliability of estimates. . . . . . . . . . . . . . . . . . . . . . . . . . . . . . . . . . . . . . . . . . . . . . . . . . . . . . . . . . . . . . . . . . . . . . . . . .Tests of significance . . . . . . . . . . . . . . . . . . . . . . . . . . . . . . . . . . . . . . . . . . . . . . . . . . . . . . . . . . . . . . . . . . . . . . . . . . . .
II. Definitions of terms . . . . . . . . . . . . . . . . . . . . . . . . . . . . . . . . . . . . . . . . . . . . . . . . . . . . . . . . . . . . . . . . . . . . . . . . . . . . . . .Hospital and use terms . . . . . . . . . . . . . . . . . . . . . . . . . . . . . . . . . . . . . . . . . . . . . . . . . . . . . . . . . . . . . . . . . . . . . . . . . .Diagnoses. . . . . . . . . . . . . . . . . . . . . . . . . . . . . . . . . . . . . . . . . . . . . . . . . . . . . . . . . . . . . . . . . . . . . . . . . . . . . . . . . . . . .Surgical procedures . . . . . . . . . . . . . . . . . . . . . . . . . . . . . . . . . . . . . . . . . . . . . . . . . . . . . . . . . . . . . . . . . . . . . . . . . . . . .Demographic terms . . . . . . . . . . . . . . . . . . . . . . . . . . . . . . . . . . . . . . . . . . . . . . . . . . . . . . . . . . . . . . . . . . . . . . . . . . . . .
III. Publications from the National Hospitrd Discharge Survey . . . . . . . . . . . . . . . . . . . . . . . . . . . . . . . . . . . . . . . . . . . . . .
List of appendix figures
I. Medical abstract for the National Hospital Discharge Survey, 1976H.
. . . . . . . . . . . . . . . . . . . . . . . . . . . . . . . . . . . . . . .Medical abstract for the National Hospital Discharge Survey, 1986 . . . . . . . . . . . . . . . . . . . . . . . . . . . . . . . . . . . . . . .
List of appendix tables
L Number of hospitals in the National Hospital Discharge Survey (NHDS) universe, number of hospitals added tothe NHDS sample, and year of addition, by year of National Master Facility Invento~ (NMFI) used: UnitedStates, 1963-86 . . . . . . . . . . . . . . . . . . . . . . . . . . . . . . . . . . . . . . . . . . . . . . . . . . . . . . . . . . . . . . . . . . . . . . . . . . . . . . . . . . .
11. Number of hospitals in the National Hospital Discharge Survey (NHDS) sample, number of sampled hospitals inscope for NHDS, number of hospitals participating in the NHDS, and number of abstracts of medical recordscollected: United States, 1965–86 . . . . . . . . . . . . . . . . . . . . . . . . . . . . . . . . . . . . . . . . . . . . . . . . . . . . . . . . . . . . . . . . . . .
III. Approximate relative standard errors of estimated numbers of patients discharged or first-listed diagnoses arid ofall-listed diagnoses: 1965–86. . . . . . . . . . . . . . . . . . . . . . . . . . . . . . . . . . . . . . . . . . . . . . . . . . . . . . . . . . . . . . . . . . . . . . . .
IV. Approximate relative standard errors of estimated numbers of patients discharged, by geographic region1965-86 . . . . . . . . . . . . . . . . . . . . . . . . . . . . . . . . . . . . . . . . . . . . . . . . . . . . . . . . . . . . . . . . . . . . . . . . . . . . . . . . . . . . . . . . .
V. Approximate relative standard errors of estimated numbers of days of care: 1965–86 . . . . . . . . . . . . . . . . . . . . . . .VI. Approximate relative standard errors of estimated numbers of days of care, by geographic region: 1965–86 . . . .VII. Approximate relative standard errors of estimated numbers of surgical procedures: 1965-86 . . . . . . . . . . . . . . . . .VIII. Codes for diagnostic and surgical categories from the 7th, 8th, and 9th revisions of the International Classification
of Diseases . . . . . . . . . . . . . . . . . . . . . . . . . . . . . . . . . . . . . . . . . . . . . . . . . . . . . . . . . . . . . . . . . . . . . . . . . . . . . . . . . . . . . .
43434344474750
5151515152
53
4546
43
44
48
48494950
52
42
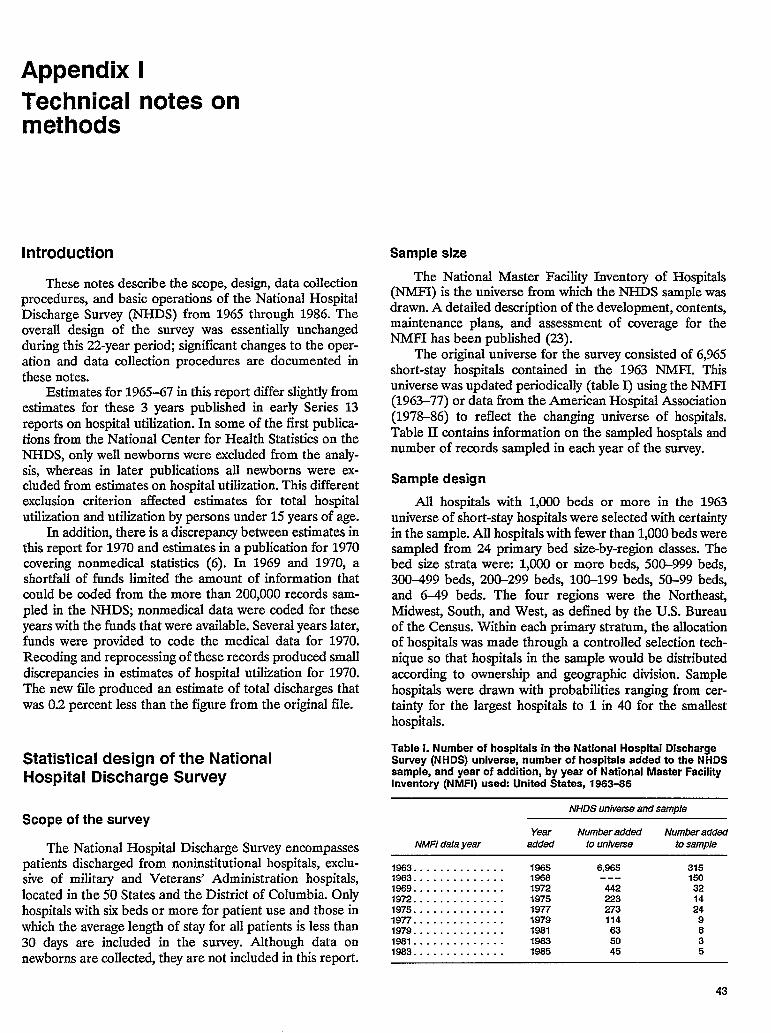
Appendix ITechnical notes onmethods
Introduction
These notes describe the scope, design, data collectionprocedures, and basic operations of the National HospitalDischarge Survey (NHDS) from 1965 through 1986. Theoverall design of the survey was essentially unchangedduring this 22-year period; significant changes to the oper-ation and data collection procedures are documented inthese notes.
Estimates for 1965-67 in this report differ slightly fromestimates for these 3 years published in early Series 13reports on hospital utilization. In some of the first publica-tions from the National Center for Health Statistics on theNHDS, only well newborns were excluded from the analy-sis, whereas in later publications all newborns were ex-cluded from estimates on hospital utilization. This differentexclusion criterion affected estimates for total hospitalutilization and utilization by persons under 15 years of age.
In addition, there is a discrepancy between estimates inthis report for 1970 and estimates in a publication for 1970covering nonmedical statistics (6). In 1969 and 1970, ashortfall of funds limited the amount of information thatcould be coded from the more than 200,000 records sam-pled in the NHDS; nonmedical data were coded for theseyears with the funds that were available. Several years later,funds were provided to code the medical data for 1970.Recoding and reprocessing of these records produced smalldiscrepancies in estimates of hospital utilization for 1970.The new file produced an estimate of total discharges thatwas 0.2 percent less than the figure from the original file.
Statistical design of the NationalHospital Discharge Survey
Scope of the survey
The National Hospital Discharge Survey encompassespatients discharged from noninstitutional hospitals, exclu-sive of military and Veterans’ Administration hospitals,located in the 50 States and the District of Columbia. Onlyhospitals with six beds or more for patient use and those inwhich the average length of stay for all patients is less than30 days are included in the survey. Although data onnewborns are collected, they are not included in this report.
Sample size
The National Master Facility Inventory of Hospitals(NMFI) is the universe from which the NHDS sample wasdrawn. A detailed description of the development, contents,maintenance plans, and assessment of coverage for theNMFI has been published (23).
The original universe for the survey consisted of 6,965short-stay hospitals contained in the 1963 NMFL Thisuniverse was updated periodically (table I) using the NMFI(1963-77) or data ti-om the American Hospital Association(1978-86) to reflect the changing universe of hospitals.Table II contains information on the sampled hosptals andnumber of records sampled in each year of the survey.
Sample design
All hospitals with 1,000 beds or more in the 1963universe of short-stay hospitals were selected with certaintyin the sample. All hospitals with fewer than 1,000 beds weresampled from 24 primary bed size-by-region classes. Thebed size strata were 1,000 or more beds, 500-999 be&,300J199 beds, 200-299 beds, 100-199 beds, 50-99 beds,and 6-49 beds. The four regions were the Northeas~Midwest, South, and West, as defined by the U.S. Bureauof the Census. Within each primary stratum, the allocationof hospitak was made through a controlled selection tech-nique so that hospitals in the sample would be distributedaccording to ownership and geographic division. Samplehospitals were drawn with probabilities ranging from cer-tainty for the largest hospitals to 1 in 40 for the smallesthospitals.
Table L Number of hospitals in the National Hospital DischargeSurvey (NHDS) universe, number of hospitals added to the NHDSsample, and year of addition, by year of National Master FacilityInventory (NMFI) used: United States, 1963-66
NHDS universe and sample
Year Number added Number addedNMFI data year added io urdwerse to sample
le83 . . . . . . . . . . . . . .lee3 . . . . . . . . . . . . . .1969 . . . . . . . . . . . . . .1972 . . . . . . . . . . . . . .1975 . . . . . . . . . . . . . .1977 . . . . . . . . . . . . . .1979 . . . . . . . . . . . . . .1981 . . . . . . . . . . . . . .1983 . . . . . . . . . . . . . .
lee519681972197519771979198119631985
6,$)85---
442223273114
635045
315150
321424
9635
43
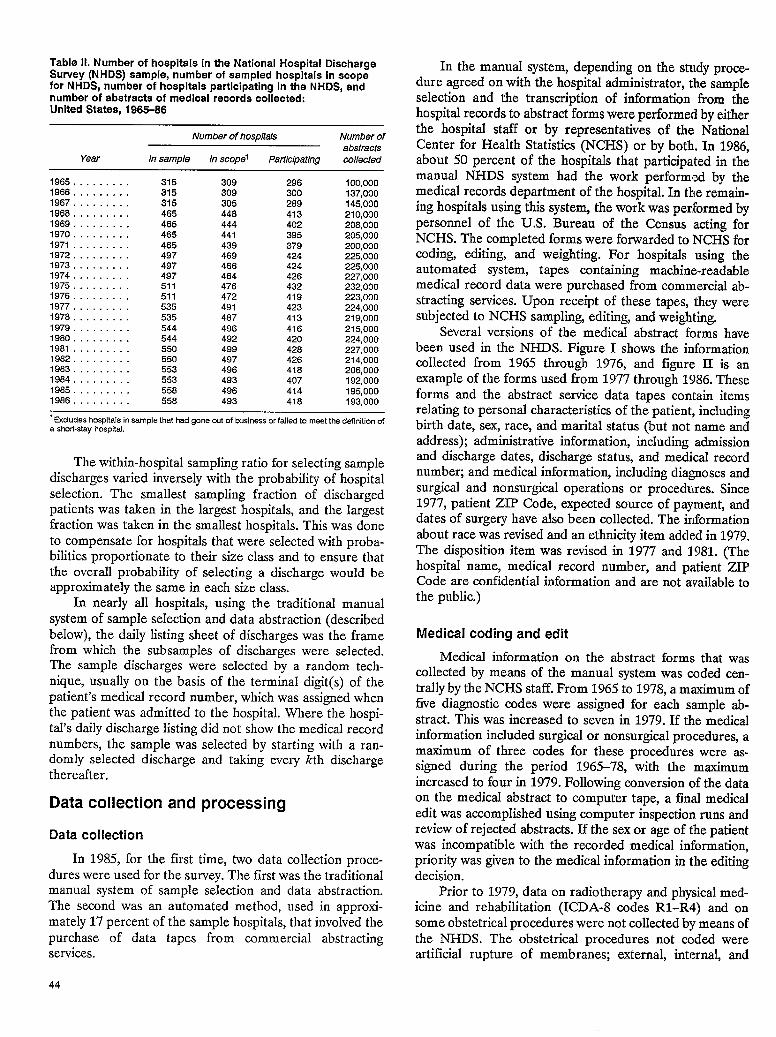
Table Il. Number of hospitals in the National Hospital DischargeSurvey (NHDS) sample, number of sampled hospitals in scopefor NHDS, number of hospitals participating in the NHDS, andnumber of abstracts of medical records coiiected:United States, 1965-88
Numberof hospitals Numberofabstracts
Year In sample In scopel Pwi/cipat/ng collected
1965, . . . . . . . . 315 309 296 100,0001966 . . . . . . . . . 315 309 300 137,0001967 . . . . . . . . . 315 305 269 145,0001966 .,....... 465 448 413 210,0001969, . . . . . . . . 465 444 402 208,0001970. . . . . . . . . 465 441 395 205,0001971 . . . . . . . . . 465 439 379 200,0001972, . . . . . . . . 497 469 424 225,0001973 . . . . . . . . . 497 466 424 225,0001974 . . . . . . . . . 497 464 426 227,0001975 . . . . . . . . . 511 476 432 232,0001976 . . . . . . . . . 511 472 419 223,0001977 . . . . . . . . . 535 491 423 224,0001978 . . . . . . . . . 535 467 413 219,0001979 . . . . . . . . . 544 496 416 215,0001980, . . . . . . . . 544 492 420 224,0001981 . . . . . . . . . 550 499 428 227,0001982 . . . . . . . . . 550 497 426 214,0001983 . . . . . . . . . 553 496 418 206,0001964 . . . . . . . . . 553 493 407 192,0001965 . . . . . . . . . 558 496 414 195,0001986 . . . . . . . . . 558 493 418 193,000
1Excludes hospitals In sample that had gone wt of tuslness or failed to meet the definition ofashott-stay hospital.
The within-hospital sampling ratio for selecting sampledischarges varied inversely withthe probability ofhospitalselection. The smallest sampling fraction of dischargedpatients was taken in the largest hospitals, and the largestfraction was taken in the smallest hospitals. This was doneto compensate for hospitals that were selected with proba-bilities proportionate totheir size class and to ensure thatthe overall probability of selecting a discharge would beapproximately the same in each size class.
In nearly all hospitals, using the traditional manualsystem ofsarnple selection and data abstraction (describedbelow), the daily listing sheet of discharges was the framefrom which the subsarnples of discharges were selected.The sample discharges were selected by a random tech-nique, usually on the basis of the terminal digit(s) of thepatient’s medical record number, which was assigned whenthe patient was admitted to the hospital. Where the hospi-tal’s daily discharge listing did not show the medical recordnumbers, the sample was selected by starting with a ran-domly selected discharge and taking every kth dischargethereafter.
Data collection and processing
Data collection
In 1985, for the first time, two data collection proce-dures were used for the survey. The first was the traditionalmanual system of sample selection and data abstraction.The second was an automated method, used in approxi-mately 17 percent of the sample hospitals, that involved thepurchase of data tapes from commercial abstractingservices.
In the manual system, depending on the study proce-dure agreed on with the hospital administrator, the sampleselection and the transcription of information from thehospital records to abstract forms were performed by eitherthe hospital staff or by representatives of the NationalCenter for Health Statistics (NCHS) or by both. In 1986,about 50 percent of the hospitals that participated in themanual NHDS system had the work performed by themedical records department of the hospital. In the remain-ing hospitals using this system, the work was performed bypersonnel of the U.S. Bureau of the Census acting forNCHS. The completed forms were forwarded to NCHS forcoding, editing, and weighting. For hospitals using theautomated system, tapes containing machine-readablemedical record data were purchased from commercial ab-stracting services. Upon receipt of these tapes, they weresubjected to NCHS sampling, editing, and weighting.
Several versions of the medical abstract forms havebeen used in the NHDS. Figure I shows the informationcollected from 1965 through 1976, and figure 11 is anexample of the forms used from 1977 through 1986. Theseforms and the abstract service data tapes contain itemsrelating to personal characteristics of the patient, includingbirth date, sex, race, and marital status (but not name andaddress); administrative information, including admissionand discharge dates, discharge status, and medical recordnumber; and medicaJ information, including diagnoses andsurgical and nonsurgical operations or procedures. Since1977, patient ZIP Code, expected source of payment, anddates of surgery have also been collected. The informationabout race was revised and an ethnicity item added in 1979.The disposition item was revised in 1977 and 1981. (Thehospital name, medical record number, and patient ZIPCode are confidential information and are not available tothe public.)
Medical coding and edit
Medical information on the abstract forms that wascollected by means of the manual system was coded cen-trally by the NCHS staff. From 1965 to 1978, a maximum offive diagnostic codes were assigned for each sample ab-stract. This was increased to seven in 1979. If the medicalinformation included surgical or nonsurgical procedures, amaximum of three codes for these procedures were as-signed during the period 1965–78, with the maximumincreased to four in 1979. Following conversion of the dataon the medical abstract to computer tape, a final medicaledit was accomplished using computer inspection runs andreview of rejected abstracts. If the sex or age of the patientwas incompatible with the recorded medical information,priority was given to the medical information in the editingdecision.
Prior to 1979, data on radiotherapy and physical med-icine and rehabilitation (ICDA-8 codes R1-R4) and onsome obstetrical procedures were not collected by means ofthe NHDS. The obstetrical procedures not coded wereartificial rupture of membranes; external, internal, and
44

FoRM HDS-1FOR$.II!33LY HSM-8~- 1
Form Approved
(1.14-75)O.M.B. No. 6S-R0620
CONFIDENTIAL = All infonma~ion which would permit identification Of an individual or of an establishment: will be held confidential, will be usedonly by persons ●naaged in and for rhe purposes of the SWVCY and will m be disclosed or released to other p-a-s or used for anY other purpose.
DEPARTMENT OF HEALTH, EDUCATION, AND WELFAREPublic Heolth Service
Health Resourc*s Administration
National Center for Health Statistics
MEDICAL ABSTRACT - HOSPITAL DISCHARGE SURVEY
L Patient Identification
1. Hospital number . . . . . . . . . . . . . 4. Date of admission
2. HDS number . . . . . . . . . . . . . . . . . .Month Day Year
5. Date of discharge
3. Medical record number . . . . . Month Day Year
Il. Patient Characteristics
1. Date of birth: _ 2. Age (complete ONLYMonth Day
{
1 a yearsYear if date of birth not given):
Units20 mcnths
3 c1 days
& Sex: 1 ❑ Male 2 ❑ Female
4. Race or COIOC 1 ~ White 2 ❑ Negro 3 ❑ other nonwhite 4 n “NOnwhite”8 5 ❑ Not stated
5. Marital status: 1 Cl Married 2 •l Single 3 ❑ Widowed 4 n Divorced 5 ❑ Separated 6 ❑ Not stated
6. Discharge status: 1 n Alive 2 fl Dead
II 1. Diagnoses and Operations
1. Final diagnoses
a. Principal diagnosis:
b. Other diagnoses:
2.
D SS0 reverse side
Operations:
o see reverse side
Completed by Date
FOR NCHS USE ONLY
Diagnoses —,
Operations ,—.
Figure 1. Medical abstract for the National Hospital Discharge Survey, 1976
45

CONFIDENTIAL - All information which would permit identification of en Indivlduel or of an establishment wili be held confidential, will be used onlyby persons engaged in and for the purposes of the survey, and will not be disclosed or released to other persons or used for eny other purpose.
oRM HDS-1 DEPARTMENT OF HEALTH AND HUMAN SERVICES11-18-86) U.S. PWLICHEALTH SERVICE
NATIONAL CENrER FOR HEALTH STATKTICS
MEDICAL ABSTRACT – NATIONAL HOSPITAL DISCHARGE SURVEY
k. PATIENT IDENTIFICATION Month Day Year
1. Hoapitai number . . . . . . . . . . . . . . . 4. Date ofadmlsslon . . .m-m- m2. HDSnumber . . . . . . . . . . . . . . . . . . S. Date of diecharge . . .m-m-m3. Medical racord number 6. Residence ZIPcode . .
3. PATIENT CHARACTERISTICS Unita 1 ❑ Yeara
Month Day Year 8. Age(Complete onlyifdeteof
m-m- EEU3 birth notoivm) . . . . . . . . . . . . . . . m{ 2 ❑ Months
7. Dateof birth 3 n Daya
9. Sex(Mark[X)onel I lnMale 2 ❑ Female 3 ~ Not stated,
10. Race I I ❑ WhiteI
3 ❑ Americen indian/Eskimo/Aleut 6 ❑ Other (Specify)
I 2 ❑ Black 4 ❑ Asian/Pacific Islander Ba Not statedI
11. Ethnicity (Mark (X} one) 1 1 ❑ Hiepanic origin 2 ❑ Non-Hispanic 3 D Not stated
! 1 ❑ Married12. Marital status (Mwk (X) one) ~ 3 ❑ Widowed
I 2 ❑ Single 4 ❑ Divorcad
13. Expected source(s) of payment
Qovernmerrtsources
Privatesources
one only)
1. Workmen’s compeneatlon . . . . . . . . . . . •1
2. Medicare . . . . . . . . . . . . . . . . . . . . . . .
3. Medicaid . . . . . . . . . . . . . . . . . . . . . . . ;
4. Title V . . . . . . . . . . . . . . . . . . . . . .
5. Other government payments . . . . . . . }❑
6. Blue Croas . . . . . . . . . . . . . . . . . . . . . . . ❑7. Other private or commercial insurance . . . •1
{
8. Self pay . . . . . . . . . . . . . . . . . . . . . . . . ❑Other sources 9. Nocherge . . . . . . . . . . . . . . . . . . . . . . . ❑
10. Dther (Specify) •1
❑ No aouroeof paymantIndicated
Other additionalsources
(Mark accordingly)
c1
❑c1
c1
❑c1El❑
❑
C. FINAL DIAGNOSES
s ❑ Separated
6 ❑ Not stated-
4. Status/Disposition of patient(Mark 1X) appropriate box(esl)
Statua Disposition
lD Alive + ●.-D Routine dischargedischarged home
b. ❑ Left agalnat medical advica
c. •1 oisc~cii;;ree~;::$al
d. a Discharged. transferred toiong-term care institution
● . ❑ Other disposition/not ststed
2 ❑ Died
3 ❑ Statua not atatad
Optional - lCWLCM NOS
! + I
Other/addtiional: 4
d
d
H See reversa side for additional diegnoses
D. SURGICAL AND Diagnostic PROCEDURES Date
Month Day Year
Principal: 1. 8*
Other/ ~additional: -
8
3. 8 4
4. 8
❑ NONE ❑ Sea reverse side for additional procedures
Completed by Date
... ..—
Figure Ii. Medicai abstract for the National Hospital Discharge Survey, 1986

combined version; outlet and low forceps delivery with andwithout episiotomy; and episiotomy (ICDA-8 codes75.0-75.6 and 75.9). In addition, data for diagnostic endo-scopy, radiography, and other nonsurgical procedures(ICDA-8 codes A4-A9 and R9), although coded, were notpublished. Starting with 1979 data, however, the procedurecoding has followed the guidelines of the Uniform HospitalDischarge Data Set (UHDDS) (24, 25). The UHDDS is aminimum data set of items uniformly defined and ab-stracted from hospikd medical records. These items wereselected on the basis of their continuous usefulness toorganizations and agencies requiring hospital information.
Presentation of estimates
Patient characteristics not stated
The age and sex of the patient were not stated on thehospital records (the face sheet of the patient’s medicalrecord) for about 0.5 percent of the discharges. Imputa-tions of these missing items were made by assigning thepatient an age or sex consistent with the age or sex of otherpatients with the same diagnostic code.
If a date of admission or discharge was not given andcould not be obtained from the monthly sample listingsheet transmitted by the sample hospital, a length of staywas imputed by assigning the patient a length of staycharacteristic of the stay of other patients of the same age.
Rounded numbers
Estimates have been rounded for tabular presentation.Therefore, detailed figures do not always add to totals.Rates and percents were calculated on the basis of un-rounded figures and will not necessarily agree with compu-tations made from the rounded data.
Population estimates
Rates were calculated using published and unpublishedestimates of the U.S. population on July 1 of the data yearthat were provided by the U.S. Bureau of the Census. Theestimates by age and sex are consistent with estimates ofthe civilian population published in Current PopulationReports, Series P-25. Estimates for the civilian noninstitu-tionalized population were used in computing rates bygeographic region for 1965-80 because estimates of thecivilian population by age and region were not available forthese years from the Census Bureau. Estimates for thecivilian population were available and were used to calcu-late regional rates for 1981-86.
Civilian noninstitutionalized population estimates wereused in previous publications in computing rates from1965-80. However, it was determined that the civilianpopulation was more appropriate because persons in insti-tutions, for example nursing home patients, are hospitalizedwhen necessary. A comparison of NHDS rates based on thecivilian population with those for the civilian noninstitution-alized population is available in another publication (5).
Reliability of estimates
Estimation
Statistics produced by the NHDS are derived by acomplex estimating procedure. The basic unit of estimationis the sample inpatient discharge. The estimating procedureused to produce essentially unbiased national estimates inthe NHDS has three principal components: inflation byreciprocals of the probabilities of sample selection, adjust-ment for nonresponse, and ratio adjustment to fried totals.These components of estimation are described in appendixI of two earlier publications (26, 27).
Measurement errors
As in any survey, results are subject to nonsampling ormeasurement errors, which include errors that were due tohospital nonresponse, missing abstracts, information in-completely or inaccurately recorded on abstract forms, andprocessing errors. Some of these errors are discussed aboveunder “Patient characteristics not stated.”
The Institute of Medicine (IOM) conducted threestudies on the reliability of hospital abstract data collectio~one study was on the NHDS. The IOM NHDS study wasperformed by using data coded according to the ICDA-8;however, some of the findings are relevant to these dataeven though they were coded using three versions of theInternational Classification of Diseases. Of special interestto this report is the finding that, in a number of cases, thefirst-listed diagnosis in the NHDS was not the principaldiagnosis as determined by IOM after a study of the entiremedical record. For example, when diagnoses at the ICDA-8 chapter level were examined, the principal diagnosis fromIOM matched the first-listed diagnosis from the NHDS inapproximately 86 percent of the cases. Detailed accounts ofthis and other IOM findings have been published (28-30).
Sampling errors
The standard error is primarily a measure of thevariability that occurs by chance because only a sample,rather than an entire universe, is surveyed. The relativestandard error of an estimate is obtained by dividing thestandard error by the estimate itself and is expressed as apercent of the estimate. Although the standard error of onestatistic generally is different from that of another, evenwhen the two come from the same survey, standard errorsthat are applicable to a wide variety of NHDS statistics havebeen prepared using a number of approximations.
Approximate relative standard errors of estimatednumbers of discharges or first-listed diagnoses and all-listeddiagnoses are shown in table III for patient characteristics(for example, age and sex) and in table IV for hospitalregion. Approximate relative standard errors of estimatednumbers of days of care are shown in table V for patientcharacteristics and in table VI for hospital region. TableVII shows approximate relative standard errors of esti-mated numbers of surgical procedures. Approximate rela-tive standard errors were not available for all years from
47

Table 111.Approximate relative standard errors of estimated numbers of patients discharged or first-listed diagnoaea and of all-listeddiagnoses: 1966-86
Sze ofestimate 1965 1966 1967 1966 law 1970 1971 1972 1973 1974 1975
5,00010,00050,000
100,000300,000500,000
1,000,0003,000,000
5,000,000
10,000,00015,000,00030,000,00040,000,000
.-.
---9,05.34.43.3
2.4
2.2
2.0
2.01.9---
-..---..-
12.27.66.04.6
3.3
3.1
2,8
2.72.6---
-------..
12.27.66.04.6
3.3
3.1
2.8
2.72.6
---
---------
12.07.05.54.1
2.7
2.4
2.0
1.91.81.6
50.0
28.511.0
8.05.34.53.8
3.2
3.1
3.0
3.02.9---
50.0
28.511.0
8.05.34.53.8
3.2
3.1
3.0
3.02.9-..
50.0
30.011.0
8.05.34.63.73.23,13.03.02.9
-..
50.030.011.0
8.05.34.63.73.23.13.03.02.9. . .
50.030.011.0
8.05.34.63.73.23.13.03.02.9.-.
---22.81“1.0
8.66.35.9
5.4
5.0
5.0
5.05.05.05.0
-..22.811.0
8.66.35.95.4
5.0
5,0
5.05.05.0
5.0
sizeofestimate 1976 1977 1978 1979 1960 1981 1962 1983 1964 1985 1986
5,00010,00050,000
100,000300,000500,000
1,000,0003,000,0005,000,000
10,000,00015,000,00030,000,00040,000,000
17.0
15.0
11.09.88.07.46.25.04.84.24.03.3
---
20.717.311.4
9.57.46.55.54.54.03.63.32.9---
20.516.310.2
8.56.65.95.14.23.93.53.33.02.9
17.314.3
9.78.46.86.25.64.84.44.13.93.73.6
18.014.910.1
8.87.16.55.85.04.74.34.23.83.7
13.611.9
9.18.27.16.76.35.65.45.15.04.74.7
15.112.6
8.87.76.45.95.34.64.34.03.93.63.5
16.012.8
8.16.85.34.84.23.53.22.92.82.52.5
13.210.5
8.75.64.43.93.42.82.62.42.32.12.0
13.210.6
6.75.74.44.03.52.92,72.42.32.12.1
12.810.2
8.55.54.33.83.42.82.62.32.22.02.0
Table IV. Approximate relative standard errors of estimated numbers of patients discharged, by geographic region: 1966-66
Size ofestimate 1965 1966 1967 19a 1968 1970 1971 1972 1973 19;74 1975
5,00010,00050,000
100,000300,000500,000
1,000,0003,000,0005,000,000
10,000,00015,000,00030,000,00040,000,000
---------
10.06.75.64.73.93.73.6
;:---
------.-.
12.66.06.65.24.23.93.83.73.6-..
------.-.
12.68.06,65.24.23.83.83.73.7-..
---------
27.411.4
9.47.86.46.05.85.75.55.4
---47.017.011.8
7.06.05,0
::3,83,73<5-..
. . .47.017.011.8
7.06.05.04.13.93.83.73.5-..
. . .-..
28.518.010.4
8.67.0
%4.94.74.6-..
..-
. . .28.518.010.4
8.67.05.25.04.94.74.6..-
. . .---
28.518.010.4
8,67.05.25.04.94.74.6. . .
-... . .
17.513,0
8,77.46.25.75.65.55.45.45,4
.-.
..-17.513.0
8.77.46.2
z5.55.45.45.4
S/zeofestimate 1976 1977 1978 1979 1980 1981 1962 1983 1984 1986 1988
5,000 17.0 20.7 20.5 25.3 18.0 24.3 22.2 27.1 23.6 22.410,000 15.0
24.717.3 16.3 21.2 14.9 20.4 18.8 22.1 19.3 18.3
50,000 11.020,2
11.4 10.2 14.7 10.1 14.2100,000
13<4 14.6 12.79.8
12.0 13.49.5 8.5 12.8 8.8 12.4 ~1.6 12.4 10.8 10.3 11.5
300,000 8.0 7.4 8.6 10.5 7.1500,000
10.2 9.8 9.9 8.6 6.27.4 6.5
9.25.9 9.7 6.5 9.4 9.1 9.0 7.9 7.5 8.4
1,000,000 6.2 5.5 5.1 8.7 5.8 8.5 8.3 8.0 7.0 6.6 7.43,000,000 5.0 4.5 4.2 7.5 5.0 7.3 7.3 6.8 5.9 5.6 8.35,000,000 4.8 4.0 3.9 7.1 4.7 6.9 6.9 6.3
10,000,0005.5 5.2 5.9
4.2 3.6 3.5 6.6 4.3 6.4 6.4 5,715,000,000
5!0 4.8 5.44.0 3.3 3.3 6.3 4.2 6.2 6.2 5.5 4.8
30,000,0004.6 5.2
3.3 2.9 3.0 5.9 3.8 5.7 5.6 5.1 4.4 4.2 4.840,000,000 --- --- 2.9 5.7 3.7 5,6 5.7 4.9 4.3 4.1 4.6
48
——.——

Table V. Approximate relative standard errors of estimated numbers of days of care: 1965-66
Sizeofestimate 1965 1966 1967 1966 1969 1970 1971 1972 1973 1974 1975
10,00030,00050,000100,000300,00050$3,000
1,000,0003,000,0005,000,00010,000,00050,000,000Ioo,cao,ooo250,000,000
. . . --- ..- . . .. . ...-. . .-....-..-..-. . .---. . .---. . .
--- -.. . . . --- --- ----.. -.. --- . . . .-. --- --- -.. ..-. . . . . . --- . . . --- ..- --- --- -..-.. -.. --- .-.
25.018.012.07.05.24.02.51.91.7
.-.25.018.012.07.05.24.02.51.91.7
---25.018.012.07.05.2
21.91.7
---25.018.012.07.05.24.02.51.91.7
---24.018.613.28.57.25.93.93.53.2
---24.018.613.28.57.25.93.93.53.2
25.018.012.07.05.24.02.51.91.7
----..14.18.26.44.72.52.01.7
..- . . .---14.08.26.44.72.21.81.7
-..14.08.06.44.62.11.81.7
Size ofestlmale 1976 1977 1978 1979 1960 1961 1962 1963 1964 1965 1966
10,00030,00050,000100,000300,000500,000
1,000,0003,000,0005,000,00010,000,00050,000,000100,000,000250,000,000
28.322820.417.814.012.711.08.88.06.94.83.93.3
25,420.218.315.812.811.810.28.07.26.34.43.93.5
2e.222.219.616.613.011.610.08.07.36.44.94.43.8
27.120.618.215.512110.89.47.56.96.04.84.23.7
24.718.916.814.311.210.18.87.16.55.74.44.03.5
24.018.216.013.610.59.48.16.55.95.13.93.53.0
24.818.816.614.110.99.88.46.86.15.44.13.73.2
20.3 23.615.7 17.214.0 14.912.0 12.39.5 9.28.6 8.07.5 6.76.2 5.15.7 4.55.1 3.84.0 2.73.6 2.33.2 1.9
16.913.011.69.97.87.16.25.04.64.13.22.92.6
16.412.511.19.47.46.65.74.84.23.72.82.62.3
Table VI. Approximate relative standard errors of estimated numbers of days of care, by geographic region: 1965-66
Size ofestimate 1965 1966 1967 1966 1969 1970 1971 1972 1973 1974 1975
10,00030,00050,000100,000300,000500,000
l,OCQOOO3,000,0005,000,000Io,ooo,ooa50,000,000Ioo,ooo,ooa250,000,000
-.. .-. --- ----....-. . ..-.-..---. . .. . .. . .. . .
. . . --- . . . .-. .-. --- -..--- --- --- --- . . . -.. . . . --- --- . . .--- --- --- . . . --- .-. .-. . . . -..
. . .27.021.015.010.0
%4.84.34.0
.-.
.-.27.021.015.010.08.47.04.84.34.0
---. . .. . .13.88.46.85.33.73.53.3
..- -.. . . .2a.521.213.88.06.45.03.53.23.0
---2a.521.213.88.06.45.03.53.23.0
---41.028.019.011.09.07.04.84.44.2
. . .41.028.019.011.09.07.04.84.44.2
-..41.028.019.011.09.07.04.84.44.2
---. . .14.48,77.05.33.53.33.2
.-.---14.48.76.95.33.53.3 . . .3.2 ..-
Size ofestimate 1976 1977 1978 1979 1960 1961 1982 1963 1964 IW5 1966
10,00030,00050,000100,000300,0CKI500,000
1,000,0003,0+30,0005,000,000
10.000.000
28.322.820.4~7.814.012.711.08.88.08.94.83.93.3
25.420.218.315.812811.810.28.07.26,34.43.93.5
29.222219.616.613.011.610.08.07.36.44.94.43.8
27.120.618.215.512.110.89.47.5
::4.64.23.7
24.718.916.814.311.210.18.87.16.55.74.44.03.5
24.018.216.013.6
24.818.816.614.110.99.88.46.8
::4.13.73.2
38.428.925.421.416.514.712610.09.07.95.95.24.5
37.32a.o26.022.417.916.214.311.810.99.77.77.18.3
35.426.423.219.414.913.211.28.87.96.95.14.53.9
36.026.723.319.514.713.011.08.67.86.64.84.23.6
10.59.48.16.55.95.13.93.53.0
50;000;000100,000,000250,000,000
49
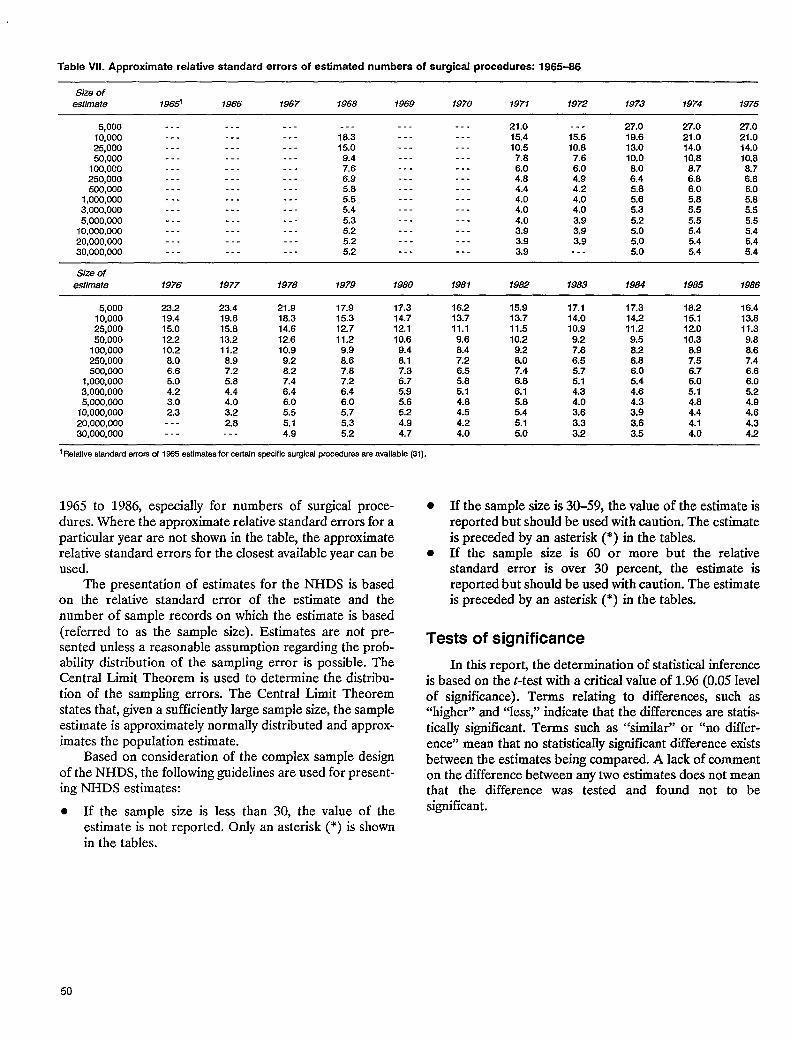
Table WI. Approximate relative standard errors of estimated numbers of surgical procedures: 1965-66
Size ofestimate 19651 1966 1967 1968 1969 1970 1971 1972 1973 1974 1975
5,00010,00025,00050,000100,000250,000500,000
1,000,0003,000,0005,000,00010,000,00020,000,00030,000,000
. . .
. . .------..-------------------------
---------.-.---------. . .---------..----
-..------..----..----------------------
---18.315.09.47.66.95.85.55.45.35.25.25.2
-------------....--... . .---.-.---------
---------------..----..-----------..---
21.015,410.57.86.04.64.44.04.04.03.93.93.9
---15.510.87.66.04.94.24.04.03.93,93.9...
27.019.613.010.08.06.45.85.65.35.25,05.05.0
27.021.014.010.68.76.86.05,85.55.55.45.45.4
27.021.014.010.88.76.86.05.85.55.55.45.45.4
Size ofestimate 1976 1977 1978 1979 1860 1981 1962 1963 1984 1985 1986
5,00010,00025,00050,000100,000250,000500,000
1,000,0003,000,0005,000,00010,000,00020,000,000
23.219.415.012.210.28.06.65.04.23.02.3------
23.419.615.613.211.28.97.25.84.44.03.22.6---
21.918.314.612.610.99.28.27.46.46.05.55.14.9
17.915.3i2.711.29,98.67.87.26.46.05.75.35.2
17.314.712.110.69.48.17.36.75.95.65.24.94.7
16.213.711.19.68.47.26.55.85.14.84.54.24.0
15.913.711.510.29.28.07.46.86.15.85.45.15.0
17.114.010.99.27.86.55.75.14.34.03.63.33.2
17.314.211.29.58.26.66.05.44.64.33.93.63.5
18.215.112.010.38.97.56.76.05.14.84.44.14.0
16.413.811.39.88.67.46.66.05.24.94.64.34.2
i Relative standard errors of 19S5 estimates for certain specific surgkd procedures are available (31).
1965 to 1986, especially for numbers of surgical proce-dures. Where the approximate relative standard errors for aparticular year are not shown in the table, the approximaterelative standard errors for the closest available year can beused.
The presentation of estimates for the NHDS is basedon the relative standard error of the estimate and thenumber of sample records on which the estimate is based(referred to as the sample size). Estimates are not pre-sented unless a reasonable assumption regarding the prob-ability distribution of the sampling error is possible. TheCentral Limit Theorem is used to determine the distribu-tion of the sampling errors. The Central Limit Theoremstates that, given a sufficiently large sample size, the sampleestimate is approximately normally distributed and approx-imates the population estimate.
Based on consideration of the complex sample designof the NHDS, the following guidelines are used for present-ing NHDS estimates:
. If the sample size is less than 30, the value of theestimate is not reported. Only an asterisk (*) is shownin the tables.
. If the sample size is 30–59, the value of the estimate isreported but should be used with caution. The estimateis preceded by an asterisk (*) in the tables.
. If the sample size is 60 or more but the relativestandard error is over 30 percent, the estimate isreported but should be used with caution. The estimateis preceded by an asterisk (*) in the tables.
Tests of significance
In this report, the determination of statistical inferenceis based on the f-test with a critical value of 1.96 (0.05 levelof significance). Terms relating to differences, such as“higher” and “less, “ indicate that the differences are statis-tically significant. Terms such as “similar” or “no differ-ence” mean that no statistically significant difference existsbetween the estimates being compared. A lack of commenton the difference between any two estimates does not meanthat the difference was tested and found not to besignificant.
50

Appendix IIDefinitions of terms
Hospital and use terms
Hos@ta&—Short-stay special and general hospitalshave six or more beds for inpatient use and an averagelength of stay of less than 30 days. Federal hospitals andhospital units of institutions are not included.
Padent-A person who is formally admitted to theinpatient service of a short-stay hospital for observation,care, diagnosis, or treatment is considered a patient. In thisreport, the number of patients refers to the number ofdischarges during the year, including any multiple dis-charges of the same individual from one short-stay hospitalor more. Infants admitted on the day of birth, directly or bytransfer from another medical facility, with or withoutmention of a disease, disorder, or immaturity, are included.AU newborn infants, defined as those admitted by birth tothe hospital, are excluded from the tables in this report.The terms “patient” and “inpatient” are usedsynonymously.
Disch~e-Discharge is the formal release of a patientby a hospital; that is, the termination of a period ofhospitalization by death or by disposition to place of resi-dence, nursing home, or another hospital. The terms “dis-charges” and “patients discharged” are used synonymously.
Disckuge rate—The ratio of the number of hospitaldischarges during a year to the number of persons in thecivilian population on July 1 of that year determines thedischarge rate. Regional rates for 1965-80 are based on thecivilian noninstitutionalized population.
Days of care—The total number of patient days accu-mulated at the time of discharge by patients dischargedfrom short-stay hospitals during a year constitutes days ofcare. A stay of less than 1 day (patient admission anddischarge on the same day) is counted as 1 day in thesummation of total days of care. For patients admitted anddischarged on different days, the number of days of care iscomputed by counting all days from (and including) thedate of admission to (but not including) the date ofdischarge.
Rate of days of imre-The rate of days of care is theratio of the number of patient days accumulated at the timeof discharge by patients discharged from short-stay hospi-tals during a year to the number of persons in the civilianpopulation on July 1 of that year. Regional rates for1965–80 are based on the civilian noninstitutionalizedpopulation.
Average length of stay-The average length of stay is thetotal number of patient days accumulated at the time ofdischarge by patients discharged during the year divided bythe number of patients discharged.
Diagnoses
Dischcnge diagnoses-These are the one or more dis-eases or injuries (or some factor that influences healthstatus and contact with health services that is not itself acurrent illness or injury) listed by the attending physician onthe medical record of a patient. In the NHDS, all discharge(or final) diagnoses listed on the face sheet (summarysheet) of the medical record for patients discharged fromthe inpatient service of short-stay hospitals are transcribedin the order listed. Diagnoses were coded according toICD-7 for 1965-68, according to ICDA-8 for 1970-78, andaccording ICD-9-CM for 1980-86. Specific codes for diag-nostic categories used in this report are shown in table VIII.
Principal diagnosis-The condition established afterstudy to be chiefly responsible for occasioning the admis-sion of the patient to the hospital for care is the principaldiagnosis.
First-listed diagnosis-The diagnosis identified as theprincipal diagnosis or listed first on the face sheet of themedical record is the first-listed diagnosis. The number offirst-listed diagnoses is equivalent to the number ofdischarges.
A1l-hkted diagnoses-AU occurrences of a diagnosis, onthe face sheet of the medical record, regardless of order,constitute the all-listed diagnoses. A maximum of fivediagnoses listed on the face sheet of the medical recordwere abstracted for each discharged patient for 1965-78,and a maximum of seven were abstracted for each patientfor 1979-86.
Surgical procedures
Dischages with su~ery-The estimated number of pa-tients discharged from non-Federal short-stay hospitalsduring the year who underwent at least one surgical proce-dure during their hospitalization are termed “dischargeswith surgery.”
Su@cal procedure —A surgical procedure is one ormore surgical operations listed by the physician on the facesheet of an inpatient medical record. In the NHDS, all
51
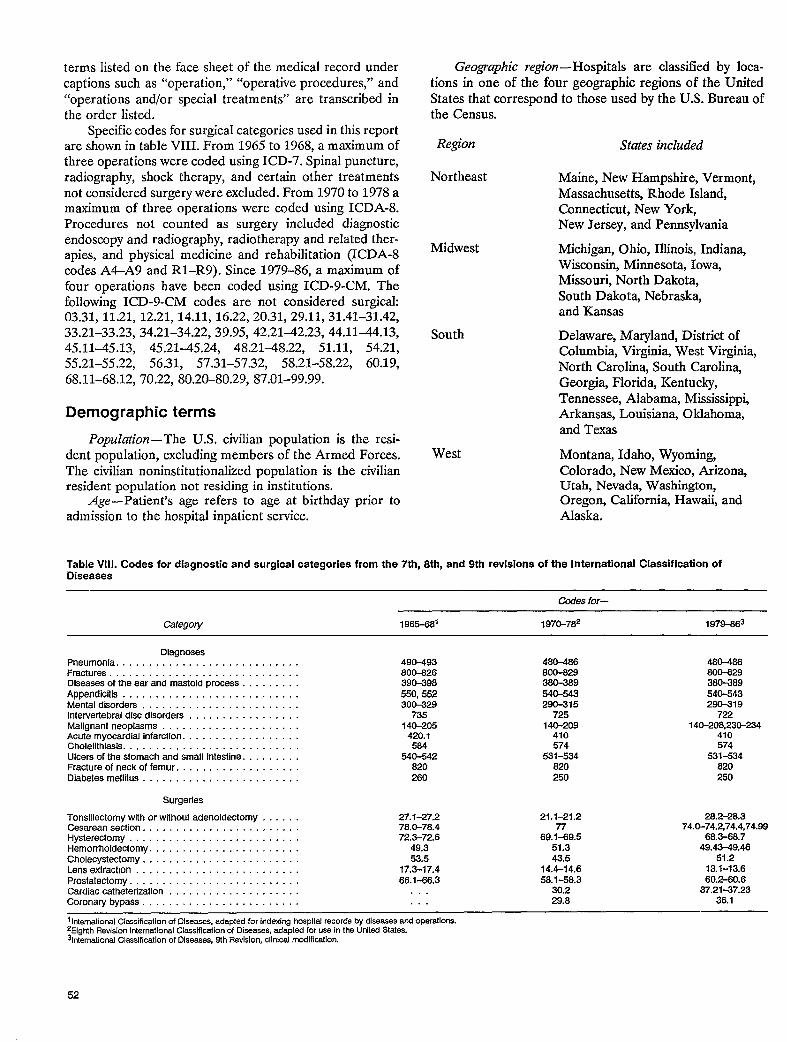
terms listed on the face sheet of the medical record undercaptions such as “operation,” “operative procedures,” and“operations and/or special treatments” are transcribed inthe order listed.
Specific codes for surgical categories used in this reportare shown in table VIII. From 1965 to 1968, a maximum ofthree operations were coded using ICD-7. Spinal puncture,radiography, shock therapy, and certain other treatmentsnot considered surgery were excluded. From 1970 to 1978amaximum of three operations were coded using ICDA-8.Procedures not counted as surgeq included diagnosticendoscopy and radiography, radiotherapy and related ther-apies, and physical medicine and rehabilitation (ICDA-8codes A4-A9 and R1–R9). Since 1979–86, a maximum offour operations have been coded using ICD-9-CM. Thefollowing ICD-9-CM codes are not considered surgical:03.31, 11.21, 12.21, 14.11, 16.22,20.31, 29.11, 31.41–31.42,33.21–33.23, 34.21-34.22,39.95, 42.21-42.23, 44.11-44.13,45.1145.13, 45.21-45.24, 48.2148.22, 51.11, 54.21,55.21-55.22, 56.31, 57.31-57.32, 58.21-58.22, 60.19,68.11-68.12,70 .22,80.20-80.29, 87.01-99.99.
Demographic terms
Pqxddbn —The U.S. civilian population is the resi-dent population, excluding members of the Armed Forces.The civilian noninstitutionalized population is the civilianresident population not residing in institutions.
Age—Patient’s age refers to age at birthday prior toadmission to the hospital inpatient service.
Geographic region —Hospitals are classified by loca-tions in one of the four geographic regions of the UnitedStates that correspond to those used by the U.S. Bureau ofthe Census.
Re@”on States included
Northeast Maine, New Hampshire, Vermont,Massachusetts, Rhode Island,Connecticut, New York,New Jersey, and Pennsylvania
Midwest Michigan, Ohio, Illinois,, Indiana,Wisconsin, Minnesota, Iowa,Missouri, North Dakota,South Dakota, Nebraska,and Kansas
South Delaware, Maryland, District ofColumbia, Virginia, West Virginia,North Carolina, South Carolina,Georgia, Florida, Kentuc&,Tennessee, Alabama, Mississippi,Arkansas, Louisiana, Oklahoma,and Texas
West Montana, Idaho, Wyoming,Colorado, New Mexico, Arizona,Utah, Nevada, Washington,Oregon, California, Hawaii, andAlaska.
Table Vlll. Codes for diagnostic and surgical categories from the 7th, 8th, and 9th revisions of the International Classification ofDiseases
Cedes for-
Category 196S-681 1970-782 1979-663
DiagnosesPneumonia . . . . . . . . . . . . . . . . . . . . . . . . . . . .Fractures . . . . . . . . . . . . . . . . . . . . . . . . . . . . .Diseases of the ear and mastoid process . . . . . . . .Appendicitis . . . . . . . . . . . . . . . . . . . . . . . . . . .Menteldisordere . . . . . . . . . . . . . . . . . . . . . . . .Intervertebral disc disorders . . . . . . . . . . . . . . .Malignant neoplaems . . . . . . . . . . . . . . . . . . . . .Acute myocarcfial infarction. . . . . . . . . . . . . . .Cholelithiasis . . . . . . . . . . . . . . . . . . . . . . . . .Ulcers of the stomach and smali intestine. . . . . . . .Fracture ofneckoffemur . . . . . . . . . . . . . . . . . . .Dtabetes mellitus . . . . . . . . . . . . . . . . . . . . . . . .
490-493800-6263eo-398550,5523oo-82e
735140-205
420.1564
540-542820260
480-46660&629380-369540-543290-315
725140-209
4io574
531-s34820250
480-466800-62938C-389540-543290-319
722140-208,23&234
410574
531-534820250
Surgeries
Tonsillectomy with or without adenoldectomy , . . 27.1-27.2 21.1-21.2 28.2–28.3Cesarean section . . . . . . . . . . . . . . . . . . . . . . . . 78.0-78.4 77 74.0-74.2,74.4,74.9eHysterectomy . . . . . . . . . . . . . . . . . . . . . . . . . . 72.3-72.6 69.1-69.5 66.3-66.7Hemorrhoidectomy, . . . . . . . . . . . . . . . . . . . . . . 49.3 51.3 49.43-49.46Cholecystectomy . . . . . . . . . . . . . . . . . . . . . . 53.5 43.5 51.2Lensextraction . . . . . . . . . . . . . . . . . . . . . . . . . 17.3-17.4 14.4-14.6 13.1-13.6Prostatectomy . . . . . . . . . . . . . . . . . . . . . . . . . . 66.1-66.3 58.1-58.3 60.2-60.6Cardiac catheterization . . . . . . . . . . . . . . . . . . . . . . . 30.2 37.21-87.23Coronary bypass . . . . . . . . . . . . . . . . . . . . . . . . . . . 29.8 36.1
1international Classification of Diseases, adapted for indexing hospital records by diseases and operations.‘Eighth Revision International Classification of Diseases, adapted for use in the United States.%ternatiome,l Ciassificatlon of Diseases, eth Revision, cilnlcal modification.
52
Appendix Ill
Publications from theNational HospitalDischarge Survey
Year(s) of data Title Series
1964
1965
1966
1967
1966-67
1966-67
1965-67
1968
Patients discharged from short-stay hospitals, United States,October–December, 1964
Participation of hospitals in the pilot study of the Hospital DischargeSurvey
Utilization of short-stay hospitals, summary of nonmedicaJ statistics,United States, 1965
Utilization of short-stay hospitals by characteristics of dischargedpatients, United States, 1965
Patients discharged from short-stay hospitals, by size and type ofownership, United States, 1965
Regional utilization of short-stay hospitals, United States, 1965
Inpatient utilization of short-stay hospitals by diagnosis, United States,1965
Surgical operations in short-stay hospitals for discharged patients,United States, 1965
Development of the design of the NCHS Hospital Discharge Survey
Utilization of short-stay hospitals, summary of nonmedical statistics,United States, 1966
Utilization of short-stay hospitals, summary of nonmedical statistics,United States, 1967
Utilization of short-stay hospitals, summary of nonmedical statistics,United States, 1966 and 1967
Utilization of short-stay hospitals by diagnosis, United States, 1966and 1967
Utilization of short-stay hospitals by patients 65 years of age and over,United States, 1965-67
Surgical operations in short-stay hospitals, United States, 1968
Inpatient utilization of short-stay hospitals by diagnosis, United States,1968
Average length of stay in short-stay hospitak Demographic factors,United States, 1968
Vital and Health StatisticsSeries 13, No. 1
Vital and Health StatisticsSeries 2, No. 19
Vital and Health StatisticsSeries 13, No. 2
Vital and Health StatisticsSeries 13, No. 3
Vital and Health StatisticsSeries 13, No. 4
Vital and Health StatisticsSeries 13, No. 5
Vital and Health StatisticsSeries 13, No. 6
Vital and Health StatisticsSeries 13, No. 7
Vital and Health StatisticsSeries 2, No. 39
Vital and Health StatisticsSeries 13, No. 8
Vital and Health StatisticsSeries 13, No. 9
Monthly Vital Statistics ReportVol. 20, No. 2, Supplement
Monthly Vital Statistics ReportVol. 20, No. 4 Supplement(3)
Monthly Vital Statistics ReportVOI. 20, No. 7 Supplement
Vital and Health StatisticsSeries 13, No. 11
Vital and Health StatisticsSeries 13, No. 12
Vital and HeaIth StatisticsSeries 13, No. 13
53
Year(s) of data Title Series
1968—Con.
1966-68
1969
1970
1968-70
1971
1972
1973
Surge~ in short-stay hospitals, United States, 1968
Inpatient utilization of short-stay hospitals in each geographic division,United States, 1966–1968
Utilization of short-stay hospitals, summary of nonmedical statistics,United States, 1969
Utilization of short-stay hospitals, summary of nonmedical statistics,United States, 1970
Utilization of short-stay hospitals, summary of nonmedical statistics,United States, 1970
Patient charges in short-stay hospitals, United States, 1968-1970
Inpatient utilization of short-stay hospitals by diagnosis, United States,1971
Utilization of short-stay hospitals, summary of nonmedical statistics,United States, 1971
Surgical operations in short-stay hospitals, United States, 1971
Utilization of short-stay hospitals, summary of nonmedical statistics,United States, 1971
Utilization of short-stay hospitals, by diagnosis, United States, 1971
Utilization of short-stay hospitals, summary of nonmedical statistics,United States, 1972
Inpatient utilization of short-stay hospitals by diagnosis, United States,1972
Utilization of short-stay hospitals, summary of nonmedical statistics,United States, 1972
Utilization of short-stay hospitals, by diagnosis, United States, 1972
Surgery in short-stay hospitals, United States, 1972
Utilization of short-stay hospitals, summary of nonmedical statistics,United States, 1973
Surgical operations in short-stay hospitals, United States, 1973
Inpatient utilization of short-stay hospitals by diagnosis, United States,1973
Quality control in the Hospital Discharge Survey
Surgery in short-stay hospitals, United States, 1973
Utilization of short-stay hospitals, by diagnosis, United States, 1973
Monthly Vital Statistics ReportVol. 21, No. 3 Supplement (2)
Vital and Health StatisticsSeries 13, No. 10
Monthly Vital Statistics ReportVol. 20, No. 6, Supplement
Vital and Health StatisticsSeries 13, No. 14
Monthly VitaI Statistics ReportVol. 21, No. 9 Supplement
Vital and Health StatisticsSeries 13, No. 15
Vital and Health StatisticsSeries 13, No. 16
Vital and Health StatisticsSeries 13, No. 17
Vital and Health StatisticsSeries 13, No. 18
Monthly Vital Statistics ReportVol. 22, No. 4 Supplement
Monthly Vital Statistics ReportVol. 22, No. 6 Supplement
Vital and Health StatisticsSeries 13, No. 19
Vital and Health StatisticsSeries 13, No. 20
Monthly Vital Statistics ReportVol. 23, No. 3 Supplement (2)
Monthly Vital Statistics ReportVol. 23, No. 4 Supplement
Monthly Vital Statistics ReportVol. 23, No. 7 Supplement (3)
Vital and Health StatisticsSeries 13, No. 23
Vital and Health StatisticsSeries 13, No. 24
Vital and Health StatisticsSeries 13, No. 25
Vital and Health StatisticsSeries 2, No. 68
Monthly Vital Statistics ReportVol. 24, No. 3 Supplement
Monthly Vital Statistics ReportVol. 24, No. 3 Supplement (2)
54
Year(s) of data Title Series
1973—Con.
1974
1975
1976
1977
1978
1974-78
1979
Utilization of short-stay hospitals, summary of nonmedical statistics,United States, 1973
Utilization of short-stay hospitals, annual summary for the UnitedStates, 1974
Inpatient utilization of short-stay hospitals by diagnosis, UnitedStates, 1974
Utilization of short-stay hospitals, annual summary for the UnitedStates, 1975
Surgical operations in short-stay hospitals, United States, 1975
Inpatient utilization of short-stay hospitals by diagnosis, United States,1975
Utilization of short-stay hospitals, annual summary for the UnitedStates, 1976
Utilization of short-stay hospitals by persons discharged withalcohol-related diagnoses, United States, 1976
Utilization of short-stay hospitals, annual summary of the UnitedStates, 1977
Detailed diagnoses and surgical procedures for patients dischargedfrom short-stay hospitals, United States, 1977
Average length of stay in short-stay hospitals: Demographic,diagnostic, and surgical statistics, United States, 1977
Utilization of short-stay hospitals by persons with heart disease andmalignant neoplasms: National Hospital Dischrmge Survey, UnitedStates, 1977
Expected principal source of payment for hospital discharges, UnitedStates, 1977
Utilization of short-stay hospitals, annual summary for the UnitedStates, 1978
Detailed diagnoses and surgical procedures for patients dischargedfrom short-stay hospitals, United States, 1978
Inpatient utilization of short-stay hospitals by diagnosis, United States,1978
Use of health services by women 65 years of age and over, UnitedStates
Surgical operations in short-stay hospitals, United States, 1978
Hospital use by children in the United States and Canada
Utilization of short-stay hospitals in the treatment of mental disorders,1974-1978
Utilization of short-stay hospitals, annual summzuy for the UnitedStates, 1979
Detailed diagnoses and surgical procedures for patients dischargedfrom short-stay hospitals, United States, 1979
Monthly Vital Statistics ReportVol. 24, No. 5 Supplement (2)
Vital and Health StatisticsSeries 13, No. 26
Vital and Health StatisticsSeries 13, No. 30
Vital and Health StatisticsSeries 13, No. 31
Vital and Health StatisticsSeries 13, No. 34
Vital and Health StatisticsSeries 13, No. 35
Vital and Health StatisticsSeries 13, No. 37
Vital and Health StatisticsSeries 13, No. 47
Vital and Health StatisticsSeries 13, No. 41
None
Vital and Health StatisticsSeries 13, No. 50
Vital and Health StatisticsSeries 13, No. 52
Advance Data From Vital andHealth Statistics, No. 62
Vital and Health StatisticsSeries 13, No. 46
None
Vital and Health StatisticsSeries 13, No. 55
Vital and Health StatisticsSeries 13, No. 59
Vital and Health StatisticsSeries 13, No 61
Vital and Health StatisticsSeries 5, No. 1
Advance Data From Vital andHealth Statistics, No. 70
Vital and Health StatisticsSeries 13, No. 60
None
55

Year(s) of data Title Series
1979—Con.
1980
1965–80
1981
1965–81
1982
1979-82
1983
Inpatient utilization of short-stay hospitals by diagnosis, United States,1979
Surgical and nonsurgical procedures in short-stay hospitals, UnitedStates, 1979
Expected principal source of payment for hospital discharges, UnitedStates, 1979
Utilization of short-stay hospitals, annual summary for the UnitedStates, 1980
Inpatient utilization of short-stay hospitals by diagnosis, United States,1980
Hospital use in Poland and the United States
Deliveries in short-stay hospitals, United States, 1980
Utilization of short-stay hospitals by adolescents, United States, 1980
Adjustment of hospital utilization rates, United States, 1965-80
Utilization of short-stay hospitals, United States, 1981, annualsummary
Hospital use in France and the United States
Diagnosis-related groups using data from the National HospitalDischarge Survey, United States, 1981
Discharge status of inpatients discharged from short-stay hospitals,United States, 1965-81
1982 summary: National Hospital Discharge Survey
Utilization of short-stay hospitals, United States, 1982, annualsummary
Diagnosis-related groups using data from the National HospitaJDischarge Survey, United States, 1982
CAT scan use in short-stay non-Federal hospitals, United States,1979-82
1983 summary: National Hospital Discharge Survey
Detailed diagnoses and surgical procedures for patients dischargedfrom short-stay hospitals, United States, 1983
Utilization of short-stay hospitals, United States, 1983, annualsummary
Surgical and nonsurgical procedures in short-stay hospitals, UnitedStates, 1983
Hospital use by children, United States, 1983
Vital and Health StatisticsSeries 13, No. 69
Vital and Health StatisticsSeries 13, No. 70
Advance Data From Vital andHealth Statistics, Ncl. 75
Vital and Health StatisticsSeries 13, No. 64
Vital and Health StatisticsSeries 13, No. 74
Vital and Health StatisticsSeries 5, No. 2
Advance Data From Vital andHealth Statistics, Not. 83
Advance Data From, Vital andHealth Statistics, Not. 93
Vital and Health StatisticsSeries 13, No. 81
Vital and Health StatisticsSeries 13, No. 72
Vital and Health StatisticsSeries 5, No. 4
Advance Data From Vital andHealth Statistics, No. 98
Advance Data From Vital andHealth Statistics, No. 94
Advance Data From Vital andHealth Statistics, No. 95
Vital and Health StatisticsSeries 13, No. 78
Advance Data From Vital andHealth Statistics, No. 105
Advance Data From Vital andHealth Statistics, No. 100
Advance Data From Vital andHealth Statistics, No. 101
Vital and Health StatisticsSeries 13, No. 82
Vital and Health StatisticsSeries 13, No. 83
Vital and Health StatisticsSeries 13, No. 88
Advance Data From Vital andHealth Statistics, No. 109
56
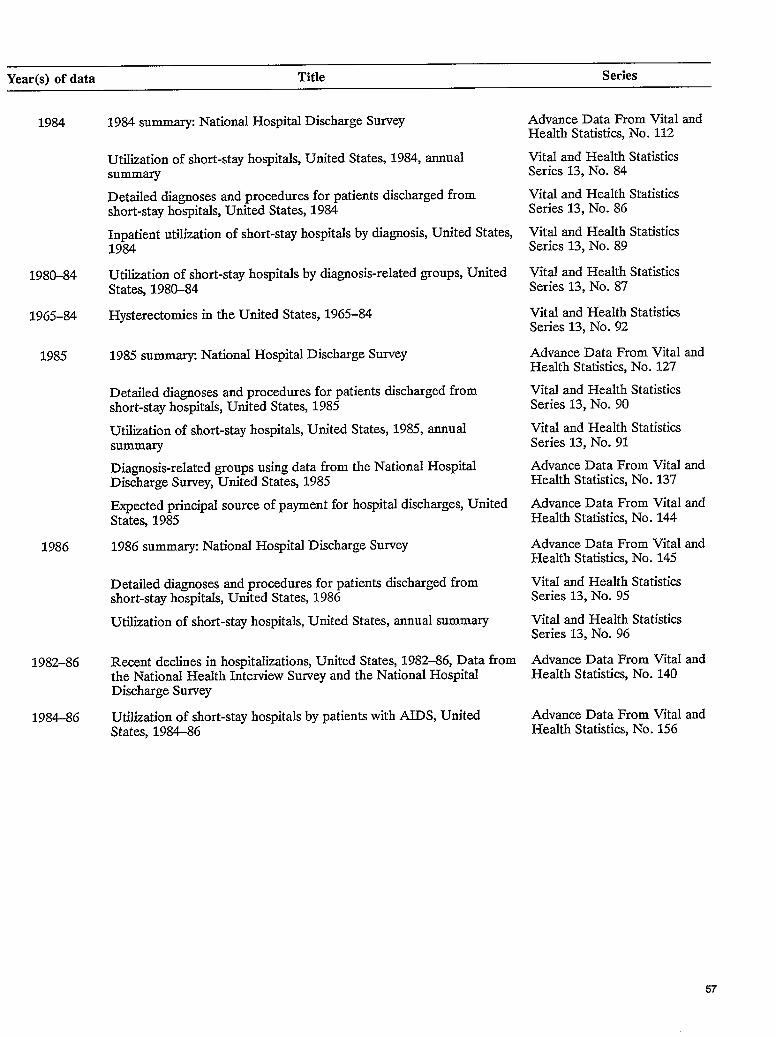
Year(s) of data Title Series
1984 1984 summary: National Hospital Discharge Survey
Utilization of short-stay hospitals, United States, 1984, annualsummary
Detailed diagnoses and procedures for patients discharged fromshort-stay hospitals, United States, 1984
Inpatient utilization of short-stay hospitals by diagnosis, United States,1984
1980-84 Utilization of short-stay hospitals by diagnosis-related groups, UnitedStates, 1980-84
1965-84 Hysterectomies in the United States, 1965-84
1985 1985 summary National HospitaJ Discharge Survey
Detailed diagnoses and procedures for patients discharged fromshort-stay hospitals, United States, 1985
Utilization of short-stay hospitals, United States, 1985, annualsumma~
Diagnosis-related groups using data from the National HospitalDischarge Survey, United States, 1985
Expected principal source of payment for hospital discharges, UnitedStates, 1985
1986 1986 summary National Hospital Discharge Survey
Detailed diagnoses and procedures for patients discharged fromshort-stay hospitals, United States, 1986
Utilization of short-stay hospitals, United States, annual summary
1982-86 Recent declines in hospitalizations, United States, 1982-86, Data fromthe National Health Interview Survey and the National HospitalDischarge Survey
1984-86 Utilization of short-stay hospitals by patients with AIDS, UnitedStates, 1984-86
Advance Data From Vital andHealth Statistics, No. 112
Vital and Health StatisticsSeries 13, No. 84
Vital and Health StatisticsSeries 13, No. 86
Vital and Health StatisticsSeries 13, No. 89
Vital and Health StatisticsSeries 13, No. 87
Vital and Health StatisticsSeries 13, No. !32
Advance Data From Vital andHealth Statistics, No. 127
Vital and Health StatisticsSeries 13, No. 90
Vital and Health StatisticsSeries 13, No. 91
Advance Data From Vital andHealth Statistics, No. 137
Advance Data From Vital andHealth Statistics, No. 144
Advance Data From Vital andHealth Statistics, No. 145
Vital and Health StatisticsSeries 13, No. 95
Vital and Health StatisticsSeries 13, No. 96
Advance Data From Vital andHeaIth Statistics, No. 140
Advance Data From Vital andHealth Statistics, No. 156
57

Theannualnationalreporton health...
Health,United States,1988
The National Center for Health Statistics The 1988 edition contains U.S. maps thathas released for sale the 1988 annual report rank States on selected causes of death andto Congress on the Nation’s health. Utilized statistical tables that cover AIDS, smoking,by analysts, educators, and researchers, this hospital use, trends in lifecomprehensive volume presents easy-to-read expectancy and mortality, andand up-to-date facts and statistics in one many other facets of America’sconvenient volume. health. Order your copy today. —
,—— ——— ——. ——— ——— — ————_——————— ————————— ——— ——— —.. ——— —-
~lkation Order FormOrder processing code: * 6383
❑ YES, pIeasesend me copies of Health, United States, 1988
GPO Stock Number-0174J22~ ltM6-6 Price $16.00
The total cost of my order is $ Foreign orders please add an additional %yo
Mail to Superintendent of DocumentsGovernment Printing OfficeWashington, D.C. 20402-9325
Prices include regular domestic postage and handling and are good through December 19S9. After that date, pleaae call Order and Informatiorl Desk at
(202) 783-3238 to verif y prices,
Please llme or Print Please choose method of payment. .•1
(Company or personal name) ❑
(Additional address/attention line)•1
(Street Address)
Check payable to the Superintendent of Documents
GPO Deposit Account UEEEE1-cl
VISA, MasterCard or Choice Account
(City, State, ZIP Code) (Signature) April 1989
(—(Daytime ~hone including area code) (Credit card expiration date)
~~677~ you for your order.f
Attention Health Investigators!Need assistance in following all your study subjects, or perhaps justyour lost contacts? Become a National Death Index user to enchanceyour followup efforts.
Purpose How the NDl Operates
The National Death Index (NDI.) is a computerized ●
central file of death record information. It is compiledfrom magnetic tapes submitted to the National Center ●
for Health Statistics [NCHS) by the State vitalstatistics offices. These tapes contain a standard set ●
of identifying information for each decendent,beginning with deaths occurring in 1979. ●
Investigators conducting prospective studies can usethe NDI to determine whether persons in their studiesmay have died, and if so, be provided with the namesof the States in which those deaths occurred, thedates of death, and the corresponding death ●
certificate numbers. The NDi user can then arrangewith the appropriate State offices to obtain copies ●
of death certificates or specific statistical informationsuch as cause of death. ●
11National Center forHealth Statistics
The NDI may only be used for statisticalpurposes in medical and health research.The investigator first must submit an NIXapplication form to NCHS.Applications are reviewed quarterly by a groupof advisors to the NDI program.Upon notification of approval, the investigatorsubmits the names of study subjects and relatedinformation on magnetic tap% jl’oppy disk, orNDI coding sheets (as specified in the NDIUsers’s Manual).Payment for ND] services is also made at thistime.The NDlflle search is performed and the resuhmailed within three weeks.The investigator assesses the quality of theresulting NZX matches and purchases copies ofrelevant death certificates from the appropriateState vital statistics offices,
NationalDeath Index mm
Please send me a Free information packet on the National Death Index program.
(Please print)
Name:
Telephone: ( )
Please return compieted order form to: Mr. Robert BikJradNDI, Division of Vital StatisticsNational Center for Health Statistics3700 East-West Highway, Room 1-44Hyattsuille, Maryland 20782.

Take advantage of the Documents produces awealth of knowledge catalog that tells youavailable from your about new and popularGovernment. The books sold by theSuperintendent of Government.
Hundreds of books on a free copy of thisagriculture, business, catalog, write—children, energy, health, Free Cataloghistory, space, and
?.0. Box 37000much, much more. For Washington, DC 20013-7000
i
I

Vital and Health Statisticsseries descriptions
SERIES 1.
SERIES 2.
SERIES 3.
SERIES 4.
SERIES 5.
SERIES 6.
SERIES 10.
SERIES 11.
SERIES 12.
SERIES 13.
SERIES 14.
Programs and Collection Procedures—Reports descnblng
the general programs of the Netional Center for Health
Statistics and its offices and divisions and the data col-
lection methods used. They also Include deflnltlons and
other material necessary for understanding the data.
Data Evaluation and Methods Research—Studies of new
statistical methodology Includlng experimental tests of
new survey methods, studies of vital statistics collection
methods, new analytical techniques, objectwe evaluations
of reliability of collected data, and contributions to
statistical theory. Studies also include comparison of
U.S. methodology with those of other countries.
Analytical and Epidemiological Studies—Reports pre-
senting analytical or interpretive studies based on vital
and health statcstms, carrying the analysis further than
the expositoy types of reports in the other series.
Documents and Committee Reports-Final reports of
major committees concerned with wtal and health sta-
tistics and documents such as recommended model vital
registration laws and revised bmh and death certificates.
Comparative International Vital and Health Statistics
Reports-Analytical and descriptwe reports comparvng
U.S. vital and health statistics with those of other countnes.
Cognition and Suwey Measurement—Reports from the
National Laboratory for Collaborative Research m Cogni-
tion and Survey Measurement using methods of cognttive
science to design, evaluate, and test survey Instruments.
Data From the National Health Interview Survey-Statis-
tics on Illness, accidental injuries, disability, use of hos-
pital, medical, dental, and other services, and other
health-related topics, all based on data collected In the
continuing national household interwew survey,
Data From the National Health Examination Survey and
the National Health and Nutrition Examination Survey—
Data from direct examlnatton, testing, and measurement
of national samples of the ciwllan nonmstnutional!zed
population provide the basis for (1) estimates of the
medically defined prevalence of speclf!c diseases In the
United States and the dwtnbutions of the population
with respect to physical, physlologlcal, and psycho-
logical characteristics and (2) analysls of relatlonshtps
among the various measurements without reference to
an expllclt finite universe of persons.
Data From the Institutionalized Population Survey s- Dls-
contmued in 1975, Repons from these surveys are in-
cluded in Series 13.
Data on Health Resources Utilization—Statlstlcs on the
utilization of health manpower and facllmes prov!dlng
long-term care, ambulatoV care, hospital care, and family
planning services.
Data on Health Resources: Manpower and Facilitiea—
Statwtlcs on the numbers, geographic dlstnbutton, and
characteristics of health resources Includtng physlclans,
denttsts, nurses, other health occupations, hosp!tals,
nursing homes, and outpatient facllltles.
SERIES 15.
SERIES 16.
SERIES 20
SERIES 21,
SERIES 22.
SERIES 23.
SERIES 24.
Data From Special Surveys-Statistics on health and
health-related topics collected in special surveys that
are not a part of the contmulng data systems of the
Nat!onal Center for Health Statistics.
Compilations of Advance Data From Vital and Health
Statistics—These reports provide early release of data
from the Nat[onal Center for Health Statistics’ health and
demographic surveys. Many of these releases are followed
by detatled reports In the V[tal and Health Statwtics
Series.
Data on Mortality-Various statistics on mortallty other
than as trrcluded In regular annual or monthly reports.
Special analyses by cause of death, age, and other demo-graphic variables; geographic and time series analyses;
and statistics on characteristics of deaths not available
from the vital records based on sample surveys of those
records.
Data on Natality, Marriage, and Divorce—Various sta-
t!stlcs on natalny, marriage, and divorce other than as
included In regular annual or monthly reports. Special
analyses by demographic variables; geographic and time
series analyses; studies of fertil[ty; and statistics on
characteristics of births not available from the vitalrecords based on sample surveys of those records.
Data From the National Mortality and Natality Surveys—
Discontinued in 1975. Repons from these sample surveys
based on vital records are included in Series 20 and 21,
respectively.
Data From the National Survey of Family Growth—
Statistics on fertdity, family formation and dissolution,
family planning, and related maternal and infant health
topics derived from a periodic survey of a nationwide
probability sample of women 15-44 years of age.
Compilations of Data on Natality, Mortality, Marriage,
Divorce, and Induced Terminations of Pregnancy—Ad-
vance reports of births, deaths, marriages, and divorces
are based on final data from the National Vital Statistics
System and are publlshed annually as supplements to the
Monthly Vital Statistics Report (MVSR). These reports are
followed by the publication of detailed data in Wal Statis-
tics cf the Umted States annual volumes. Other reports
!nclud!ng Induced termlnat!ons of pregnancy tssued period-
ically as supplements to the MVSR provide selected fmd-
tngs based on data from the National Vital Statistics
System and may be followed by detailed reports in Vital
snd Health Statistics Series.
For answers to questions about this report or for a Iwt of titles of
reports published in these series, contsct:
Sc!ent]flc and Technical Information Branch
Nat!onal Center for Health Statstics
Centers for Dwease Control
Publ!c Health Service
Hyattswlle, Md. 20782
301-436-8500
U.S. DEPARTMENT OF HEALTH ANDHUMAN SERVICES
Public Health ServiceCenters for Disease Control
National Center for Health Stat@cs
3700 East-West HighwayHyattswlle, Maryland 20782
OFFICIAL BUSINESSPENALTY FOR PRIVATE USE, $300
I BULK RATEPOSTAGE & FEES PAID
PHS/NCHS II PERMIT NO. G-281 I
DHHS Publication No. (PHS) 89--1762, Series 13, No. 101