Visualizing the “Heartbeat” of a City with Tweets Abstract
11
Visualizing the “Heartbeat” of a City with Tweets Urbano Fran¸ ca 1 , Hiroki Sayama 1,2 , Colin McSwiggen 1 , Roozbeh Daneshvar 1 and Yaneer Bar-Yam 1 1 New England Complex Systems Institute 238 Main St. Suite 319 Cambridge MA 02142, USA 2 Binghamton University, State University of New York P.O. Box 6000, Binghamton, NY 13902-6000, USA (Dated: In final form May 21, 2014, Released Nov. 4, 2014) Abstract Describing the dynamics of a city is a crucial step to both understanding the human activity in urban environments and to planning and designing cities accordingly. Here we describe the collective dynamics of New York City and surrounding areas as seen through the lens of Twitter usage. In particular, we observe and quantify the patterns that emerge naturally from the hourly activities in different areas of New York City, and discuss how they can be used to understand the urban areas. Using a dataset that includes more than 6 million geolocated Twitter messages we construct a movie of the geographic density of tweets. We observe the diurnal “heartbeat” of the NYC area. The largest scale dynamics are the waking and sleeping cycle and commuting from residential communities to office areas in Manhattan. Hourly dynamics reflect the interplay of commuting, work and leisure, including whether people are preoccupied with other activities or actively using Twitter. Differences between weekday and weekend dynamics point to changes in when people wake and sleep, and engage in social activities. We show that by measuring the average distances to the heart of the city one can quantify the weekly differences and the shift in behavior during weekends. We also identify locations and times of high Twitter activity that occur because of specific activities. These include early morning high levels of traffic as people arrive and wait at air transportation hubs, and on Sunday at the Meadowlands Sports Complex and Statue of Liberty. We analyze the role of particular individuals where they have large impacts on overall Twitter activity. Our analysis points to the opportunity to develop insight into both geographic social dynamics and attention through social media analysis. 1
-
Upload
truonghanh -
Category
Documents
-
view
222 -
download
0
Transcript of Visualizing the “Heartbeat” of a City with Tweets Abstract
Visualizing the “Heartbeat” of a City with Tweets
Urbano Franca1, Hiroki Sayama1,2, Colin McSwiggen1,
Roozbeh Daneshvar1 and Yaneer Bar-Yam1
1 New England Complex Systems Institute
238 Main St. Suite 319 Cambridge MA 02142, USA
2 Binghamton University, State University of New York
P.O. Box 6000, Binghamton, NY 13902-6000, USA
(Dated: In final form May 21, 2014, Released Nov. 4, 2014)
Abstract
Describing the dynamics of a city is a crucial step to both understanding the human activity
in urban environments and to planning and designing cities accordingly. Here we describe the
collective dynamics of New York City and surrounding areas as seen through the lens of Twitter
usage. In particular, we observe and quantify the patterns that emerge naturally from the hourly
activities in different areas of New York City, and discuss how they can be used to understand
the urban areas. Using a dataset that includes more than 6 million geolocated Twitter messages
we construct a movie of the geographic density of tweets. We observe the diurnal “heartbeat”
of the NYC area. The largest scale dynamics are the waking and sleeping cycle and commuting
from residential communities to office areas in Manhattan. Hourly dynamics reflect the interplay
of commuting, work and leisure, including whether people are preoccupied with other activities
or actively using Twitter. Differences between weekday and weekend dynamics point to changes
in when people wake and sleep, and engage in social activities. We show that by measuring the
average distances to the heart of the city one can quantify the weekly differences and the shift in
behavior during weekends. We also identify locations and times of high Twitter activity that occur
because of specific activities. These include early morning high levels of traffic as people arrive and
wait at air transportation hubs, and on Sunday at the Meadowlands Sports Complex and Statue
of Liberty. We analyze the role of particular individuals where they have large impacts on overall
Twitter activity. Our analysis points to the opportunity to develop insight into both geographic
social dynamics and attention through social media analysis.
1
I. INTRODUCTION
Identifying the universal principles and patterns that shape cities and urban human
activities is crucial for both fundamental and practical reasons, as it not only sheds light on
social organizations, but is also crucial for planning and designing safer and more sustainable
cities. Complex systems approaches [1] provide us with tools and new ways of thinking about
urban areas and the ways they may correspond to living organisms [2]. The activities of
people in urban areas are responsible for the emergence of patterns on large scales that
define the dynamics of cities.
Until recently, one of the main obstacles to quantify such ideas was the lack of large
scale data on flows of people and their activities. However, in the last decade there has
been a surge of new technologies that make it possible to obtain real-time data about
populations, and these new “social microscopes” have changed in fundamental ways the
study of social systems [3]. Recent examples include characterizing [4, 5] and predicting
[6, 7] individual human mobility patterns using mobile phone and social media data. Toward
that end, Twitter has been a valuable tool to track and to identify patterns of mobility and
activity, especially using geolocated tweets. Geolocated tweets typically use the Global
Positioning System (GPS) tracking capability installed on mobile devices when enabled by
the user to give his or her precise location (latitude and longitude). Geolocated tweets have
recently been used to study global mobility patterns [10] and spatial patterns and dynamics
of sentiment [11, 12].
Here we describe the collective dynamics of the greater metropolitan area of New York
City (NYC) as reflected in the geographic dynamics of Twitter usage. We observe and
quantify the patterns that emerge naturally from the hourly activities at different subareas,
and discuss how they can be used to understand the social dynamics of urban areas. Twitter
data can be understood not just by considering where people are but also by the extent to
which they are preoccupied or have time and attention to devote to Twitter posting. We
collected more than 6 million geolocated messages from Twitter’s streaming Application
Programming Interface (API) [13] from which more than 90% of geolocated tweets can be
downloaded as they occur [8, 9]. From this data we observe wake/sleep cycles and the daily
social “heartbeat” of the NYC area, reflecting the commuting dynamics from home to work
in the diurnal cycle. We identify differences in weekday and weekend dynamics, and find
2
specific locations where activity occurs at certain hours, including the early morning at air
transit hubs. We also find anomalous events associated with specific individuals whose high
engagement with Twitter at specific times can dominate their local region. We discuss how
this dataset reflects the collective patterns of human activity and attention in both space
and time.
II. THE DYNAMICS OF TWITTER USAGE
We collected tweets between the latitudes [40.2oN, 41.2oN ] and longitudes
[74.8oW, 72.8oW ] from August 19, 2013 to December 31, 2013. Fig. 1 shows the ge-
ographical Twitter coverage. We aggregated the data of the corresponding days of the
week, and in hourly units of time, resulting in 7× 24 = 168 time slices describing each hour
of a “typical week.” We divided the geographic area into 90, 000 cells (300× 300). For each
hour of the week we obtained the difference in that cell from the average number of tweets
over the week as
dihour = tanh
[α(ni
hour − ni)]
(1)
where nihour is the number of tweets in the cell i at a given hour, ni the average number
of tweets in a given cell averaged over all days and hours, and α a constant that controls
the slope of the hyperbolic tangent (α = 0.04 in all figures). Note that the tanh function
bounds dihour to the range [−1, +1]. The values of di
hour were then used to generate a heat
map of Twitter activity in the NYC area for a particular hour (see Fig. 2). We also
constructed two and three-dimensional movies of those patterns that can be accessed at
http://www.necsi.edu.
The dynamics of Twitter can be understood first by recognition of the dominant diurnal
wake-sleep cycle and geographic commuting to work in Manhattan from surrounding bed-
room communities for the conventional workday hours approximately 9:00AM - 5:00PM.
Earlier in the morning people tweet from their homes, and therefore Manhattan has much
fewer tweets than average. Tweets are concentrated in Manhattan in the morning work
hours and peak there at mid-day (around 13h), and become much more widely dispersed
after work hours. The bedroom community activity is high in the evening, clearly visible at
10:00PM, and decreases as people go to sleep.
In addition to these largest scale daily patterns, patterns emerge when comparing week-
3

FIG. 1: NYC geographical region with the locations of 6 million tweets shown. The sharp land-seaboundary is apparent as is the boundary of land area with high population density.
days (i.e., Monday to Friday) to weekends. In Fig. 3 we compare the late-night and late-
afternoon Twitter activity between Sunday and a workday at 2:00AM and 5:00PM. While
the workday activity is suppressed almost everywhere at 2:00AM, the nightlife activity at
2:00AM Sunday morning (late Saturday night) has a unique pattern, with high activity in
wide swaths of the city and suburbs. High levels of activity span a band extending from
Lower Manhattan across to Brooklyn and Hoboken, New Jersey. Other high spots of night
activity include the Bronx, and Union City and more specific spots in surrounding commu-
nities. Sunday afternoons also present an unusual pattern of widely dispersed but localized
spots of activity likely corresponding to tweets in residential community areas of activity.
Moreover, a peak of activity is observed in Central Park most of the day Sunday that is not
observed on other days of the week.
We also find other interesting activities at particular locations and times, as can be seen
in Fig. 4. The top row shows the high activity at 6:00PM on Friday at the three main
Airports of the area: John F. Kennedy (JFK) airport (A) [17], Newark Airport (B) [18] and
4
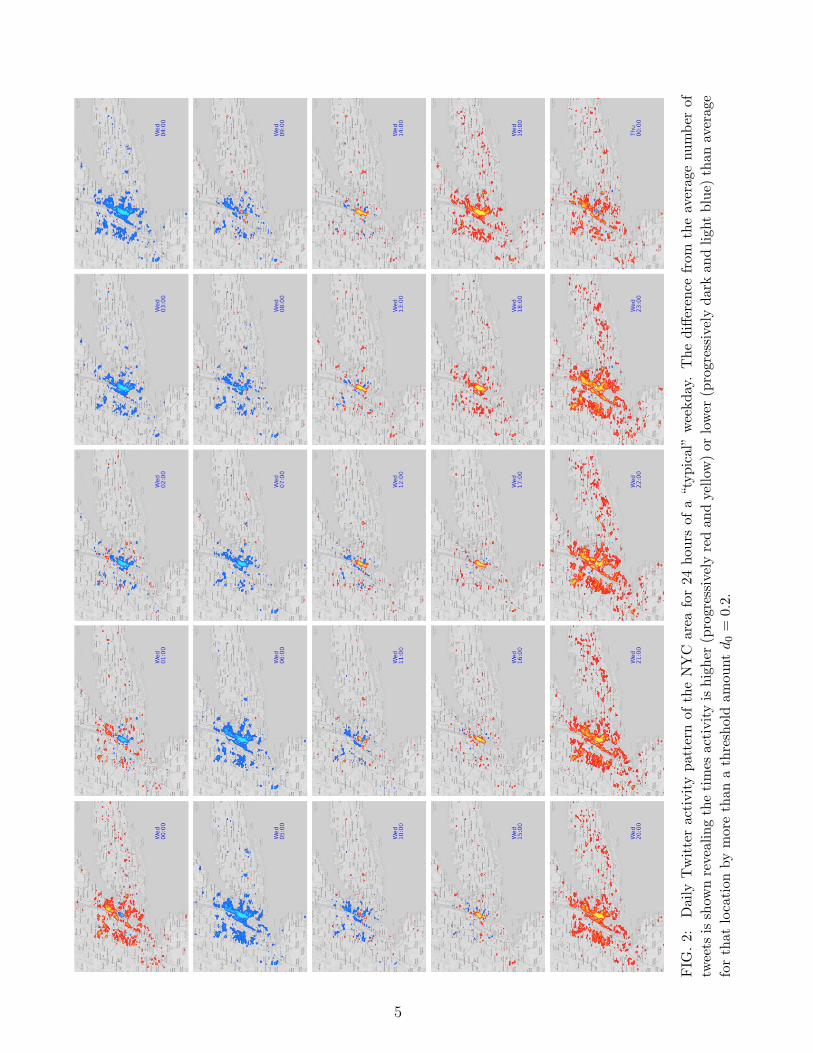
FIG
.2:
Dai
lyT
wit
ter
acti
vity
patt
ern
ofth
eN
YC
area
for
24ho
urs
ofa
“typ
ical
”w
eekd
ay.
The
diffe
renc
efr
omth
eav
erag
enu
mbe
rof
twee
tsis
show
nre
veal
ing
the
tim
esac
tivi
tyis
high
er(p
rogr
essi
vely
red
and
yello
w)
orlo
wer
(pro
gres
sive
lyda
rkan
dlig
htbl
ue)
than
aver
age
for
that
loca
tion
bym
ore
than
ath
resh
old
amou
ntd
0=
0.2.
5
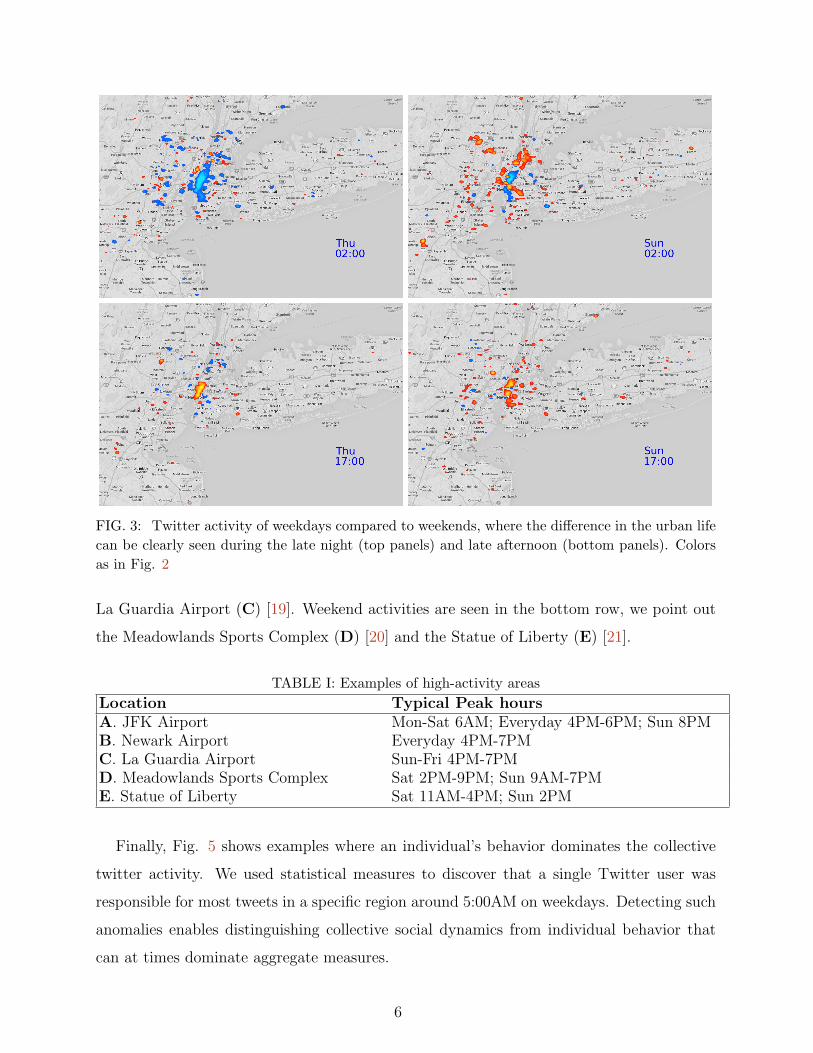
FIG. 3: Twitter activity of weekdays compared to weekends, where the difference in the urban lifecan be clearly seen during the late night (top panels) and late afternoon (bottom panels). Colorsas in Fig. 2
La Guardia Airport (C) [19]. Weekend activities are seen in the bottom row, we point out
the Meadowlands Sports Complex (D) [20] and the Statue of Liberty (E) [21].
TABLE I: Examples of high-activity areasLocation Typical Peak hoursA. JFK Airport Mon-Sat 6AM; Everyday 4PM-6PM; Sun 8PMB. Newark Airport Everyday 4PM-7PMC. La Guardia Airport Sun-Fri 4PM-7PMD. Meadowlands Sports Complex Sat 2PM-9PM; Sun 9AM-7PME. Statue of Liberty Sat 11AM-4PM; Sun 2PM
Finally, Fig. 5 shows examples where an individual’s behavior dominates the collective
twitter activity. We used statistical measures to discover that a single Twitter user was
responsible for most tweets in a specific region around 5:00AM on weekdays. Detecting such
anomalies enables distinguishing collective social dynamics from individual behavior that
can at times dominate aggregate measures.
6
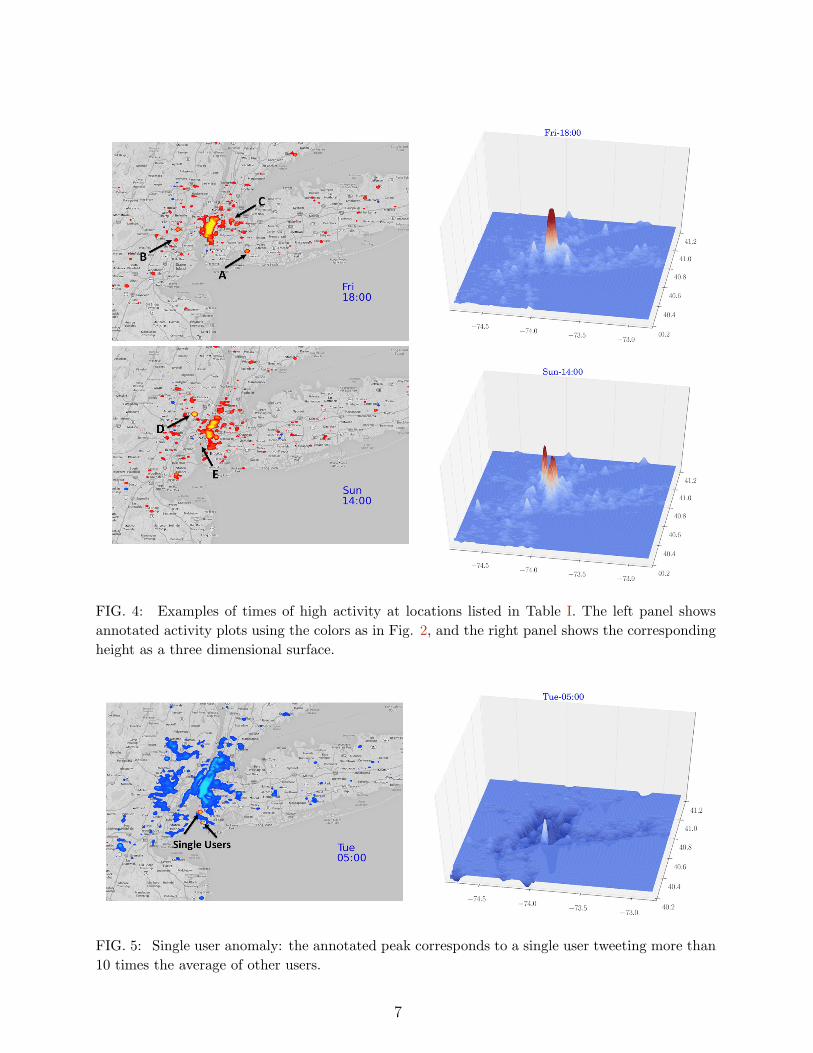
FIG. 4: Examples of times of high activity at locations listed in Table I. The left panel showsannotated activity plots using the colors as in Fig. 2, and the right panel shows the correspondingheight as a three dimensional surface.
FIG. 5: Single user anomaly: the annotated peak corresponds to a single user tweeting more than10 times the average of other users.
7
To identify a single measure that can capture key aspects of the collective behavior of the
city we considered the average distance of the tweets from a location in Manhattan (Central
Park, 40o46′43.35′′N , −73o58′5.27′′W ) over time. The distance was calculated using the
Haversine formula [16],
d = 2r⊕ arcsin
√√√√sin2
(φ2 − φ1
2
)+ cos(φ1) cos(φ2) sin2
(λ2 − λ1
2
) , (2)
where r⊕ = 6367 km is the average radius of the Earth, φi and λi, (i = 1, 2) are the latitude
and longitude of the point i. The results are shown in Fig. 6.
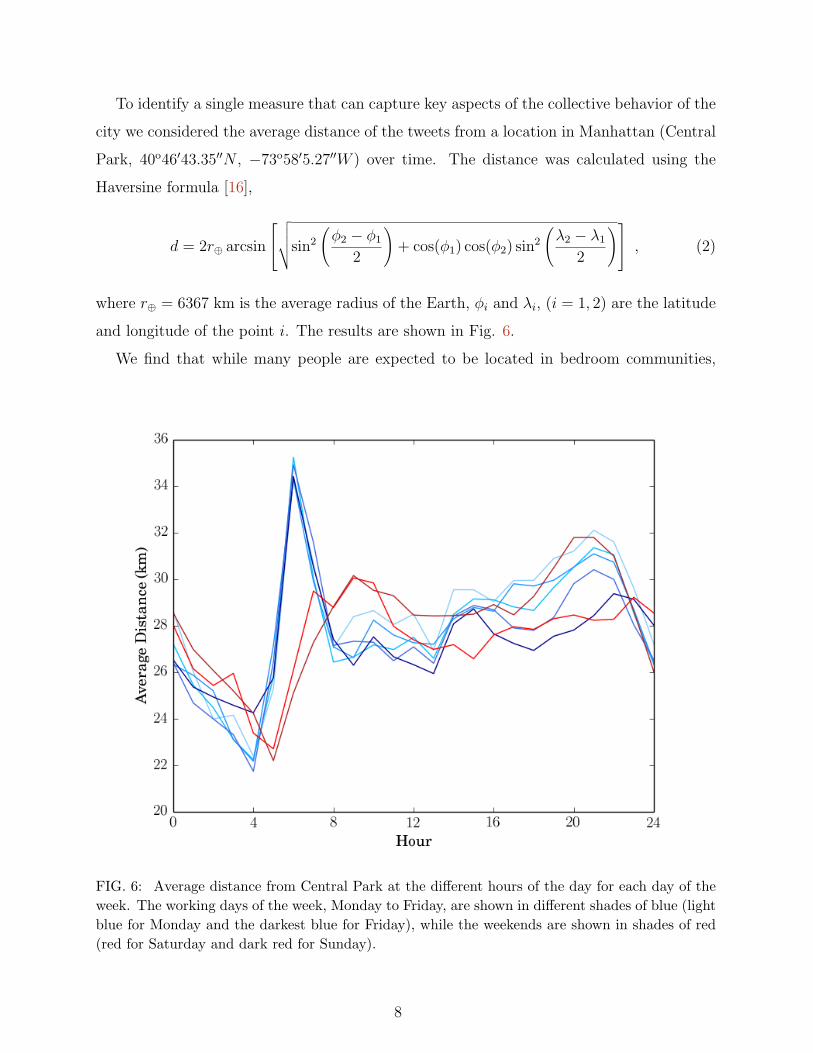
We find that while many people are expected to be located in bedroom communities,
FIG. 6: Average distance from Central Park at the different hours of the day for each day of theweek. The working days of the week, Monday to Friday, are shown in different shades of blue (lightblue for Monday and the darkest blue for Friday), while the weekends are shown in shades of red(red for Saturday and dark red for Sunday).
8
the average distance to Manhattan falls overnight, reflecting the fact that downtown activ-
ity continues through the night so that most Twitter activity at late hours/early morning
(12:00AM to 5:00AM) happens in areas in or close to Manhattan. During weekdays a sharp
peak at 6:00AM corresponds to people tweeting in suburban areas before commuting. After
8:00AM the distance grows gradually during the day and through the evening, until it falls
again overnight. A change in this pattern is observed during weekends. There is a horizontal
shift in the curves for Saturday and Sunday of about 3 hours, reflecting people’s tendency
to tweet later into the night and wake up later the next morning. The pre-commuting peak
is entirely missing.
III. CONCLUSIONS
In this paper we characterized, for the first time, the patterns of weekly activity of the
NYC area using more than 6 million geolocated tweets posted between Aug 19, 2013 and
Dec 31, 2013. We related the collective geographical and temporal patterns of Twitter usage
to activities of the urban life and the daily “heartbeat” of a city. The largest scale daily
dynamics are the waking and sleeping cycle and commuting from the suburbs to office areas
in Manhattan, while the hourly dynamics reflects the interplay between commuting, work
and leisure.
We showed not only that Twitter can provide insight into understanding human social
activity patterns, but also that our analysis is capable of identifying interesting locations of
activity by focusing on departures from global behaviors. We observed a peak of Twitter
usage in the suburbs of NYC before people begin their workday, and during evening hours,
while the main activity during the workday and late at night is in Manhattan.
In addition to the daily differences, we also characterized the weekly patterns, especially
differences between the weekend and weekdays. Daytime recreational activities concentrate
at identifiable locations spread widely across residential areas of the city. We determined
more specific times and locations of high activity at air transportation hubs, tourist attrac-
tions and sports arenas. We analyze the role of particular individuals where they have large
impacts on overall Twitter activity, and find effects which may be considered outliers in
discussion of social activity, but are an important aspect of human activity in the city.
We explored the use of the average distance from downtown to understand the dynamics
9
of Twitter usage, and while weekdays are similar in the geography of Twitter usage, the sleep
waking cycle is shifted later by about 3 hours during the weekends, and a pre-commuting
Twitter activity peak is absent. Taken together, those results demonstrate the potential
of using social media analysis to develop insight into both geographic social dynamics and
activities, and opens the possibility to understand and compare the life of cities on various
scales.
[1] Y. Bar-Yam, Dynamics of Complex Systems, Westview Press (1997).
[2] M. Batty, Building a Science of Cities, CASA Working Paper 170 (2011). http://www.
bartlett.ucl.ac.uk/casa/pdf/paper170.pdf
[3] D. Lazer et al., Computational Social Science, Science 323, 721 (2009).
[4] M. C. Gonzalez, C. A. Hidalgo, A.-L. Barabasi, Understanding individual human mobility
patterns, Nature 453, 779 (2008).
[5] A. Pentland, Reality mining of mobile communications: Toward a New Deal on data. In The
Global Information Technology Report 20082009, eds. S. Dutta, I. Mia I (World Economic
Forum, Geneva) p. 75 (2009). http://hd.media.mit.edu/wef globalit.pdf
[6] C. Song, Z. Qu, N. Blumm, A.-L. Barabasi, Limits of Predictability in Human Mobility,
Science 327, 1018 (2010 ).
[7] A. Sadilek, J. Krumm, Far out: Predicting long-term human mobility, in: Twenty-Sixth AAAI
Conference on Artificial Intelligence (2012), http://research.microsoft.com/en-us/um/
people/jckrumm/publications%202012/sadilek-krumm far-out aaai-2012.pdf
[8] F. Morstatter, J. Pfeffer, H. Liu, When is it Biased? Assessing the Representativeness of
Twitter’s Streaming API, arXiv:1401.7909 [cs.SI] (2014).
[9] F. Morstatter, J. Pfeffer, H. Liu, K. M. Carley, Is the Sample Good Enough? Comparing Data
from Twitter’s Streaming API with Twitter’s Firehose, 7th International AAAI Conference
on Weblogs and Social Media (ICWSM) 2013, arXiv:1306.5204 [cs.SI] (2013).
[10] B. Hawelka, I. Sitko, E. Beinat, S. Sobolevsky, P. Kazakopoulos, C. Ratti, Geo-located Twitter
as the proxy for global mobility patterns, arXiv:1311.0680 [cs.SI] (2013).
[11] K. Z. Bertrand, M. Bialik, K. Virdee, A. Gros, Y. Bar-Yam, Sentiment in New York City: A
High Resolution Spatial and Temporal View, arXiv:1308.5010 [physics.soc-ph] (2013).
10
[12] M. R. Frank, L. Mitchell, P. S. Dodds, C. M. Danforth, Happiness and the Patterns of Life:
A Study of Geolocated Tweets, Sci. Rep. 3, 2625 (2013).
[13] The Twitter REST API v1 (https://dev.twitter.com/docs/api/1).
[14] J. Li, C. Cardie, Early Stage Influenza Detection from Twitter, arXiv:1309.7340 [cs.SI] (2013).
[15] T. Sakaki, M. Okazaki, Y. Matsuo, Earthquake shakes Twitter users: real-time event detection
by social sensors, ACM Proceedings of the 19th international conference on World wide web,
851-860 (2010).
[16] T. H. Meyer, Introduction to Geometrical and Physical Geodesy: Foundations of Geomatics,
ESRI Press (2010).
[17] http://www.panynj.gov/airports/jfk.html
[18] http://www.panynj.gov/airports/newark-liberty.html
[19] http://www.panynj.gov/airports/laguardia.html
[20] http://en.wikipedia.org/wiki/Meadowlands Sports Complex
[21] http://www.nps.gov/stli/index.htm
11