Visualizing Proteins in Electron Micrographs at Nanometer Resolution
24
283 METHODS IN CELL BIOLOGY, VOL 111 Copyright 2012, Elsevier Inc. All rights reserved. 0091-679X http://dx.doi.org/10.1016/B978-0-12-416026-2.00015-7 CHAPTER 15 Visualizing Proteins in Electron Micrographs at Nanometer Resolution Shigeki Watanabe and Erik M. Jorgensen Howard Hughes Medical Institute and Department of Biology, University of Utah, Salt Lake City, UT 84112-0840 Abstract I. Introduction II. Rationale III. Methods A. High-Pressure Freezing B. Freeze-Substitution C. Plastic Embedding D. Sectioning E. Fluorescence Imaging F. SEM Imaging G. Image Alignment IV. Instrumentations and Materials A. High-Pressure Freezing B. Freeze-Substitution C. Plastic Embedding D. Coverslip Cleaning E. Sectioning F. PALM Imaging G. Staining H. SEM Imaging I. Image alignment V. Discussion A. Fixation B. Plastic C. Super-Resolution Fluorescence Imaging D. Electron Microscopy Imaging E. Alignment F. Quantification
Transcript of Visualizing Proteins in Electron Micrographs at Nanometer Resolution
283METHODS IN CELL BIOLOGY, VOL 111Copyright 2012, Elsevier Inc. All rights reserved.
0091-679Xhttp://dx.doi.org/10.1016/B978-0-12-416026-2.00015-7
CHAPTER 15
Visualizing Proteins in Electron Micrographs at Nanometer Resolution
Shigeki Watanabe and Erik M. JorgensenHoward Hughes Medical Institute and Department of Biology, University of Utah, Salt Lake City, UT 84112-0840
Abstract I. Introduction II. Rationale III. Methods
A. High-Pressure Freezing B. Freeze-Substitution C. Plastic Embedding D. Sectioning E. Fluorescence Imaging F. SEM Imaging G. Image Alignment
IV. Instrumentations and Materials A. High-Pressure Freezing B. Freeze-Substitution C. Plastic Embedding D. Coverslip Cleaning E. Sectioning F. PALM Imaging G. Staining H. SEM Imaging I. Image alignment
V. Discussion A. Fixation B. Plastic C. Super-Resolution Fluorescence Imaging D. Electron Microscopy Imaging E. Alignment F. Quantification

284 Shigeki Watanabe et al.
Abstract
To understand protein function, we need a detailed description of the molecular topography of the cell. The subcellular localization of proteins can be revealed using genetically encoded fluorescent proteins or immunofluorescence. However, the pre-cise localization of proteins cannot be resolved due to the diffraction limit of light. Recently, the diffraction barrier has been overcome by employing several microscopy techniques. Using super-resolution fluorescence microscopy, one can pinpoint the loca-tion of proteins at a resolution of 20 nm or even less. However, the cellular context is often absent in these images. Recently, we developed a method for visualizing the sub-cellular structures in super-resolution images. Here we describe the method with two technical improvements. First, we optimize the method to preserve more fluorescence without compromising the morphology. Second, we implement ground-state depletion and single-molecule return (GSDIM) imaging, which does not rely on photoactivatable fluorescent proteins. These improvements extend the utility of nano-resolution fluores-cence electron microscopy (nano-fEM).
I. Introduction
First described by Robert Hooke in 1665 (Hooke, 1665), a cell is the fundamental unit of life. Since then, light-based microscopes have been used extensively to identify structures such as the nucleus, mitochondria, and Golgi apparatus within a cell. Further technological improvements, such as dark field, phase contrast, differential interfer-ence contrast (DIC), and fluorescence imaging (Murphy, 2001), have expanded our ability to probe the structure of a cell. However, due to the diffraction limit of light, structures cannot be pinpointed in a cell (McCutchen, 1967). Thus, although Golgi staining was used to reveal the basic anatomy of neurons (Cajal, 1894, 1899, 1903), neither the synaptic connections between neurons nor subcellular structures, such as synaptic vesicles, have yet been directly observed by light microscopy.
To overcome the resolution limit of light microscopy, electron microscopy was developed in 1931 (Knoll & Ruska, 1932). With the shorter wavelength of electrons, resolution was improved to less than 1 nm, allowing for a complete depiction of sub-cellular structures. However, proteins important for cellular functions cannot be eas-ily identified in electron micrographs. An immunocytochemical approach on plastic sections has been the best method available to identify the location of a protein at the ultrastructural level. However, this approach is difficult. The proteins lose antigenic-ity or are inaccessible due the fixation and plastic embedding. Thus, although electron microscopy has tremendous resolution advantages over light microscopy, its use has been limited in biology.
VI. PerspectiveAcknowledgmentsReferences

28515. Visualizing Proteins in Electron Micrographs at Nanometer Resolution
Despite the resolution limit imposed by the diffraction of light, fluorescence micros-copy has become the most popular imaging technique in cell biology since the turn of the twenty-first century. There are two types of fundamental innovations that continue to extend the utility of fluorescence microscopy in cell biology: first, the discovery and synthesis of new fluorescent probes and second, developments in microscopy tech-niques. The most important innovation was the discovery and adaptation of genetically encoded fluorophores, the first of which was green fluorescent protein (GFP) (Chalfie, Tu, Euskirchen, Ward, & Prasher, 1994; Shimomura, 2009). Subsequently, fluorophores with many different excitation and emission spectra have been developed (Tsien, 1998; Zhang, Campbell, Ting, & Tsien, 2002). Using different sets of fluorescent probes, the spatial relationships of multiple proteins in a cell have been studied. Furthermore, microscopy techniques that allow three-dimensional visualization of proteins have been developed. The first step in three-dimensional fluorescence imaging was the inven-tion of confocal microscopy. In confocal microscopy, specimens are scanned in x–y dimensions while out-of-focus fluorescence is blocked by an aperture. Only in-focus fluorescence is detected for the reconstruction of an image. However, these techniques are light based and hence the resolution is still limited to ~200 nm. Recently, ground-breaking improvements in microscopy techniques have extended resolution beyond the diffraction limit of light.
Super-resolution fluorescence microscopy overcomes the diffraction barrier by isolating fluorescence from each molecule spatially and temporally (Hell, 2007). For example, stimulated emission depletion (STED) microscopy allows the emission of fluorescence from an area smaller than the diffraction limit (Hell & Wichmann, 1994). STED is similar to confocal microscopy in that all fluorescent proteins in a diffraction-limited spot are excited by a scanning laser. However, a doughnut-shaped de-excitation beam that immediately follows the excitation beam brings the excited molecules back to the ground state without allowing the emission of fluorescence. Thus, fluorescence is only collected from the center of the doughnut, which is smaller than the diffrac-tion limit. This subdiffraction spot is scanned across a specimen to generate an image. A resolution of ~30 nm can be achieved using this technique (Harke et al., 2008).
Another super-resolution fluorescence technique is photoactivated localization microscopy, PALM (Betzig et al., 2006), and its related techniques: fluorescence photo-activation localization microscopy, fPALM (Hess, Girirajan, & Mason, 2006); ground-state depletion with single-molecule return, GSDIM (Fölling et al., 2008); stochastic optical reconstruction microscopy, STORM (Rust, Bates, & Zhuang, 2006); and direct stochastic optical reconstruction microscopy, dSTORM (Heilemann et al., 2008). In these techniques, each molecule is present one at a time by changing the fluorescence state of individual fluorophores. For example, in PALM and STORM, fluorophores can be photoactivated from a nonresponsive state to a responsive state one at a time (Fig. 7(A); Gurskaya et al., 2006; Patterson & Lippincott-Schwartz, 2002; Wiedenmann et al., 2004). Alternatively in GSDIM, fluorophores can be driven into a dark state, from which they return to the ground state in a stochastic manner (Fig. 8(A); Fölling et al., 2008; Heilemann et al., 2008). By taking advantage of such responses, each molecule is isolated stochastically in space and time. By acquiring multiple images and calculating

286 Shigeki Watanabe et al.
the centroid of each fluorescent spot, all the molecules in the field are mapped to produce the final image. Using these techniques, resolution can be improved to ~20 nm (Betzig et al., 2006; Hess et al., 2006; Rust et al., 2006; Shtengel et al., 2009).
Irrespective of the technique used, all super-resolution fluorescence imaging has the disadvantage that cellular context is missing from the images. To overcome this problem, attempts have been made to combine fluorescence microscopy with electron microscopy.
Methods for correlating protein localization in light and electron micrographs can be separated into three approaches: preembedding fluorescence microscopy, preem-bedding diaminobenzidine (DAB) imaging, and postembedding fluorescence electron microscopy (fEM). Preembedding fluorescence microscopy is the simplest: the whole cell is imaged using normal fluorescence techniques first to localize the protein and the specimen is then processed for electron microscopy (Müller‐Reichert, Srayko, Hyman, O’Toole, & McDonald, 2007; Oberti, Kirschmann, & Hahnloser, 2010; Polishchuk et al., 2000; Verkade, 2008). This approach makes fluorescence imaging simple; how-ever, precisely locating the same region of interest in the electron microscope is difficult and it does not localize proteins with high-definition. The DAB precipitation method uses photooxidation (Grabenbauer et al., 2005; Shu et al., 2011; Sosinsky, Giepmans, Deerinck, Gaietta, & Ellisman, 2007) or enzymatic oxidation (Schikorski, 2010) of DAB, which forms precipitation that can be observed via both light and electron microscopy. This method can be useful when the proteins of interest are not abundant in the cell. However, the electron-dense precipitation of DAB molecules may obscure the fine details of electron micrographs, especially when the proteins are abundant. Moreover, this technique is only compatible with conventional chemical fixation, and thus fixation artifacts caused by dehydration (McDonald, 2007) are inevitable. Cor-relative fEM preserves fluorescence in plastic sections and images fluorescence and electron-dense structures from the same sections (Kukulski et al., 2011; Micheva & Smith, 2007; Nixon et al., 2009; Schwarz & Humbel, 2007; Sims & Hardin, 2007;). Fluorescence signals can be overlaid on electron micrographs using this approach, but the disparity between diffraction-limited fluorescence imaging and ultrastructure means that the proteins cannot be precisely localized, and the preservation of fluorescence and morphology is often compromised. Recently, we have developed a method, called nano-fEM, that preserves 60–70% fluorescence while retaining good ultrastructure (Watanabe et al., 2011). By applying super-resolution imaging techniques, proteins can be localized to subcellular structures with ~20 nm resolution. Here we will describe our improved methods for protein localization in electron micrographs and discuss the current issues and future directions of this approach.
II. Rationale
To fully characterize the functions of a protein, the location of the protein relative to the subcellular structures must be revealed. A fluorescence-tagging approach is

28715. Visualizing Proteins in Electron Micrographs at Nanometer Resolution
a very robust method to localize proteins at a subcellular level. If super-resolution fluorescence imaging is applied, the resolution of fluorescence images can be com-parable to that of electron micrographs (Hell, 2007). However, the lack of cellular context in fluorescence images limits the ability to localize proteins to subcellular structures. On the other hand, immuno-electron microscopy has high resolution, but it is limited by the poor quality of fixation and availability of antibodies (Morphew, 2007; Rostaing, Weimer, Jorgensen, Triller, & Bessereau, 2004; Roth, Bendayan, Carlemalm, Villiger, & Garavito, 1981). A combination of these two techniques can merge the robustness of fluorescence imaging with the ultrastructures depicted by electron microscopy and potentially reveal protein localization at its maximum reso-lution. Therefore, we sought fixation conditions that preserve both fluorescence and morphology in the plastic sections.
We recently published a paper describing methods for correlating STED or PALM images with electron micrographs (Watanabe et al., 2011). With 60–70% preserva-tion of fluorescence after fixation and plastic embedding, signals appeared very bright using STED microscopy. This result was partly due to the brightness and the superior quantum efficiency of Citrine (Heikal, Hess, Baird, Tsien, & Webb, 2000) used for STED. However, the resolution of STED was ~50–70 nm (Watanabe et al., 2011). On the other hand, the average localization precision of PALM images, that is, a standard error of mean of a localization, was ~12 nm (Watanabe et al., 2011). However, pho-toconvertible fluorescent proteins appeared more sensitive to the sample preparation. Moreover, PALM imaging is often restricted to a single color. Therefore, we sought to improve fEM technique in two ways. First, we have been refining the protocol to preserve more photoconvertible fluorescent proteins without compromising the mor-phology. In this chapter, we will present a new protocol that preserves ~90% of fluores-cence with the same quality of ultrastructure. Second, since Citrine is very bright and has shown to be compatible for GSDIM (Lalkens, Testa, Willig, & Hell, 2011), we also tested GSDIM imaging using Citrine. Fluorescent proteins compatible for multicolor PALM imaging are rare; thus, if this approach is successful, GSDIM imaging will allow the use of specimens that have already been tagged with fluorescent proteins for confocal microscopy.
III. Methods
To perform postembedding fluorescence imaging, fluorescent proteins must be func-tional in plastic sections. The retention of fluorescence through the fixation and plas-tic embedding processes is extremely difficult because of the oxidizing, acidic, and dehydrated conditions required for sample preparation. Fluorescent proteins require a hydrated environment with alkaline pH for their best performance (Tsien, 1998). Thus, we optimized the protocol to balance the preservation of morphology and fluorescence. Protein localization using correlative nano-fEM consists of the following seven steps: high-pressure freezing, freeze-substitution, plastic embedding, sectioning, super-resolution imaging, electron microscopy imaging, and image alignment (Fig. 1).

288 Shigeki Watanabe et al.
A. High-Pressure Freezing
High-pressure freezing is the first step required for preserving both fluorescence and morphology. The high-pressure freezing and freeze-substitution techniques allow near-instantaneous immobilization of specimens, prevent fixation and dehydration of arti-facts such as protein aggregations (Payne, 1973), and also prevent membrane shrinkage (McDonald, 2007) often observed using the conventional method. The preparation can be carried out in the way recommended for the specimens of choice (McDonald et al., 2010; Müller-Reichert, 2010). For Caenorhabditis elegans, transgenic animals express-ing photoconvertible fluorescent proteins are raised in an opaque box to minimize their exposure to ultraviolet light. Raising them in darkness prevents spontaneous photocon-version of fluorescent proteins. Once animals are raised to the desired developmental stage, typically to adulthood, they are subjected to freezing. For Baltec HPM 10, two types of specimen carriers are used: type A and type B. Type A has two chambers. One is
A Generating transgenics(TOM-20::flur)
B Mounting specimens for freezing (bacteria as cryoprotectants)
C High-pressure freezing D Transfer specimens into freeze-substitution media with fixatives under liquid Nitrogen
E Freeze-substitution and fixation in AFS
F Plastic embedding
G Trimming to ROI
H SectioningI Super-resolution fluorescence imaging
J SEM imaging after post-staining with uranyl acetate and carbon-coating
K Image alignment
Experimental procedures for nano-fEM
Fig. 1 Schematic diagram showing the procedure for nano-fEM. Transgenic animals (A) are subject to high-pressure freezing (B, C). The cellular water is substituted with acetone, while tissues are fixed with 0.1% potassium permanganate and 0.001% osmium tetroxide (D, E). The specimens are embedded into GMA plastic (F). The plastic block is trimmed to the region of interest (G), and thin slices (~80 nm thick) of tissues are cut using a diamond knife (H). Sections are imaged first with super-resolution fluorescence microscopy (I) and second with SEM (J). The correlative image is then aligned based on the fiducial markers (K).

28915. Visualizing Proteins in Electron Micrographs at Nanometer Resolution
100 µm deep and the other is 200 µm deep. Type B has a 300 µm-deep well on one side and a flat surface on the other side. Hexadecane should be applied to the 100 µm-deep well of type A and the flat side of type B. Hexadecane should be removed from the wells by blotting the carriers against a piece of filter paper. Since the diameter of an adult C. elegans is about ~70 µm, we mount animals into the 100 µm-deep side of a type A speci-men carrier. We add animals and bacteria to the specimen carrier by scooping animals from the lawn of bacteria (Escherichia coli) with a paintbrush. The bacteria serve as cryoprotectants. This configuration allows us to separate the animals easily from the bac-teria during the plastic embedding step. Alternatively, 20% BSA in M9 solution can be used (McDonald, Morphew, Verkade, & Müller-Reichert, 2007). However, it is harder to dissociate the animals from the BSA solution. The chamber should be slightly overfilled to avoid trapping air bubbles in the chamber when it is capped with the flat side of the type B specimen carrier. We then freeze the specimens as instructed by the manufacturer.
B. Freeze-Substitution
Following high-pressure freezing, the vitrified water is replaced with organic sol-vents such as acetone so that the water does not recrystallize when the specimens are brought back to higher temperatures for plastic embedding. In addition, fixation of tissues is carried out simultaneously to stabilize the subcellular structures and enhance the contrast of tissues.
Prior to the freeze-substitution, cryovials containing 0.1% potassium permanganate and 0.001% osmium tetroxide in 95% acetone (a mix of anhydrous acetone with milliQ water) are frozen in liquid nitrogen. The use of acetone as a freeze-substitution medium is critical for preserving ultrastructure because acetone cross-links with membrane (Weibull & Christiansson, 1986; Fig. 2). The automated freeze-substitution (AFS) unit should also be prepared as instructed by the manufacturer. The program should be set as summarized in Table I. The duration at –90°C can be shortened or lengthened to accommodate one’s schedule.
500 nm5005005005500 nmnmnm
A BEthanol substituted Acetone substituted
Fig. 2 Preservation of morphology by different freeze-substitution media. Transgenic animals expressing TOM-20–tdEos were freeze-substituted in ethanol (A) or acetone (B). The ventral nerve cord in an adult C. elegans is shown in each case. Note that ethanol washed out the tissues. 0.1% potassium permanganate and 0.001% osmium tetroxide was used as the fixative in both cases. The membrane contrast was enhanced by both en bloc staining and section staining using uranyl acetate.
290 Shigeki Watanabe et al.
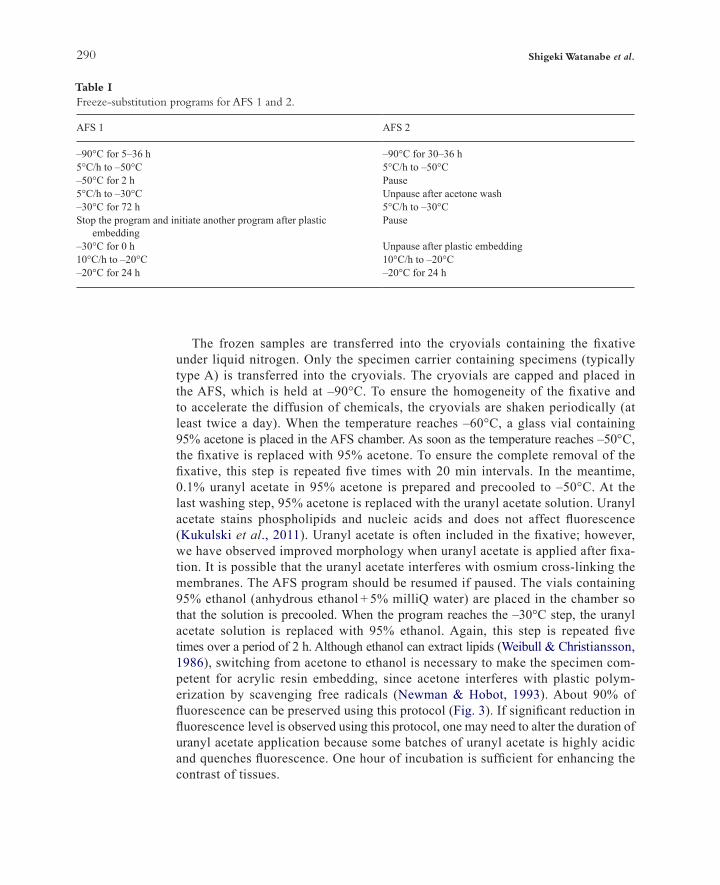
The frozen samples are transferred into the cryovials containing the fixative under liquid nitrogen. Only the specimen carrier containing specimens (typically type A) is transferred into the cryovials. The cryovials are capped and placed in the AFS, which is held at –90°C. To ensure the homogeneity of the fixative and to accelerate the diffusion of chemicals, the cryovials are shaken periodically (at least twice a day). When the temperature reaches –60°C, a glass vial containing 95% acetone is placed in the AFS chamber. As soon as the temperature reaches –50°C, the fixative is replaced with 95% acetone. To ensure the complete removal of the fixative, this step is repeated five times with 20 min intervals. In the meantime, 0.1% uranyl acetate in 95% acetone is prepared and precooled to –50°C. At the last washing step, 95% acetone is replaced with the uranyl acetate solution. Uranyl acetate stains phospholipids and nucleic acids and does not affect fluorescence (Kukulski et al., 2011). Uranyl acetate is often included in the fixative; however, we have observed improved morphology when uranyl acetate is applied after fixa-tion. It is possible that the uranyl acetate interferes with osmium cross-linking the membranes. The AFS program should be resumed if paused. The vials containing 95% ethanol (anhydrous ethanol + 5% milliQ water) are placed in the chamber so that the solution is precooled. When the program reaches the –30°C step, the uranyl acetate solution is replaced with 95% ethanol. Again, this step is repeated five times over a period of 2 h. Although ethanol can extract lipids (Weibull & Christiansson, 1986), switching from acetone to ethanol is necessary to make the specimen com-petent for acrylic resin embedding, since acetone interferes with plastic polym-erization by scavenging free radicals (Newman & Hobot, 1993). About 90% of fluorescence can be preserved using this protocol (Fig. 3). If significant reduction in fluorescence level is observed using this protocol, one may need to alter the duration of uranyl acetate application because some batches of uranyl acetate is highly acidic and quenches fluorescence. One hour of incubation is sufficient for enhancing the contrast of tissues.
Table IFreeze-substitution programs for AFS 1 and 2.
AFS 1 AFS 2
–90°C for 5–36 h –90°C for 30–36 h5°C/h to –50°C 5°C/h to –50°C–50°C for 2 h Pause5°C/h to –30°C Unpause after acetone wash–30°C for 72 h 5°C/h to –30°CStop the program and initiate another program after plastic
embeddingPause
–30°C for 0 h Unpause after plastic embedding10°C/h to –20°C 10°C/h to –20°C–20°C for 24 h –20°C for 24 h

29115. Visualizing Proteins in Electron Micrographs at Nanometer Resolution
C. Plastic Embedding
After freeze-substitution, specimens are infiltrated with glycol methacrylate (GMA). The infiltration is carried out in a stepwise fashion (30%, 70%, and 100%) at –30°C. The stock solution of GMA can be prepared by mixing 22.7 ml of GMA, 10 ml of butyl methacrylate, 1 ml of milliQ water, and 200 mg of benzoyl peroxide in a 50 ml conical tube. Dissolving benzoyl peroxide may require a few minutes, and thus it is best to leave the tube on the nutator in a cold room. Once the benzoyl peroxide is fully dissolved, the stock solution is transferred into 20 ml scintillation vials and stored at –20°C until use. To prepare the infiltration media, we mix the GMA stock solution media with 95% ethanol. The infiltration media is then placed in the AFS chamber. This step should be carried out concurrently with the ethanol-washing step of freeze-substitution so that the medium is cooled down to –30°C before use. Each step of the infiltration process can be spaced to accommodate one’s schedule. Specimens are typically incubated with the 30% solution for 2–4 h, the 70% solution for 3–5 h, and the 100% solution overnight.
The next day, the specimens are transferred into the cap from a polypropylene BEEM capsule. An Aclar disk, prepared by a 3/8× punch, should be placed at the bottom of the cap. The disk makes the surface of the plastic smooth which makes trim-ming of the block easier. An Aclar disk must be placed on the top surface of the resin
TOM-20-tdEos
50 µm
TOM-20-tdEosNo fixatives With fixatives
0
200
100
Fluo
resc
ence
inte
nsity
(arb
itary
uni
t)
Control (no fixatives, embedded in GMA)
Fixed (0.1% KMnO4 + 0.001% OsO4, en bloc UA staining, embedded in GMA)
BA
C Quantification of fluorescence intensity from animals treated with or without fixatives
Fig. 3 Preservation of fluorescence after fixation and plastic infiltration. (A) Fluorescent mitochondria in an unfixed adult worm. Transgenic animals expressing the mitochondrial marker TOM-20–tdEos were freeze-substituted with 95% acetone in the absence of fixatives. Mitochondria in the muscles of an adult worm are visible. 100% of fluorescence is preserved when compared to unfixed animals (not shown). (B) Fluorescent mitochondria in a fixed adult worm. Transgenic animals expressing TOM-20–tdEos were freeze-substituted with 95% acetone in the presence of fixatives (0.1% KMnO4 + 0.001% OsO4) and en bloc stained with uranyl acetate. (C) Fluorescence intensity of TOM-20–tdEos was measured from the control and the fixed animals and quantified. A 10% reduction in the fluorescence level was observed when animals were treated with fixatives and staining solution. (See color plate.)

292 Shigeki Watanabe et al.
as well if you are using LR White, since oxygen will prevent the polymerization of the acrylic resin. Specimens are placed on the top of the Aclar disk, and thus the Aclar disk blocks oxygen at the base of the cap. The media is exchanged twice more, with a 2 h interval. Animals are separated from the bacteria so that individual nematodes are exposed to plastic without being surrounded by bacteria or other animals. Acrylic resin does not cross-link with tissues; thus, when sectioned, specimens can dissociate from the surrounding plastic, resulting in distortion of the plastic and discontinuity of the rib-bon of sections (Fig. 4(A)). If individual animals that are completely surrounded by the plastic are sectioned one at a time, the distortion of the plastic will be minimal, improv-ing the sectioning result (Fig. 4(B)). Therefore, the removal of the cryoprotectants is critical. At the final step, a catalyst, n,n-dimethy-p-toluidine, is added to the GMA stock solution at a concentration of 1.5 µl catalyst per 1 ml GMA stock. The reaction is highly exothermic and can be complete within 30 min of the addition of the catalyst at room temperature, so the catalyst should be added while the GMA stock solution is held in the AFS chamber. The specimens should be left in the chamber overnight to ensure completion of the process. Specimens are stored in nitrogen-gas-filled vacuum bags (Ziploc) at –20°C to reduce oxidation of the fluorescent protein.
D. Sectioning
Once the plastic has polymerized, the specimens can be manipulated at room tem-perature. A room with bright sunlight or even bright room light should be avoided at all times. To find a region of interest before sectioning, the specimens can be exposed briefly (~1 s) to blue light. Once the area of interest has been located under the stereo-microscope, a knife mark is left near this area, and the block is trimmed to the knife mark using a razor blade. Sectioning of GMA plastic can be challenging because of the hydrophilic nature of the plastic. If further trimming of the block with a glass knife is necessary, water in the boat should be underfilled. If water gets on the block face, the section submerges rather than floats on the surface and cannot be retrieved.
Ultrathin sectioning can be carried out in a manner similar to that used for epoxy resins. However, sectioning quality of GMA is inconsistent. Cutting even the same block on a different day may result in poor appearance of morphology (Fig. 4(C and D)). Occasionally, folding of a tissue due to sectioning can also be observed (Fig. 4(E)). In addition, structures such as lipid droplet in gut can also dissociate while sectioning (Fig. 4(F)). Sectioning thickness and cutting speed can be adjusted to minimize the sec-tioning artifacts––we often cut 80 nm thick sections with the cutting speed of 1.6 mm/s.
If sections are imaged on a TIRF microscope, the sections must be mounted directly on a coverglass; otherwise, sections can be mounted on a transmission electron micros-copy (TEM) grid. For PALM imaging, autofluorescence from dust particles can also be detected because of the high sensitivity of the EMCCD camera. Therefore, cover-glasses should be cleaned using piranha solution. The piranha solution can be prepared by mixing three parts of sulfuric acid and one part hydrogen peroxide. The coverglasses are left in the piranha solution for 1 h, washed thoroughly with milliQ water six times, sonicated for half an hour, and washed again with milliQ water six times. This treatment

29315. Visualizing Proteins in Electron Micrographs at Nanometer Resolution
Fig. 4 Problems associated with GMA sectioning. (A, B) Low magnification electron micrographs, showing the dissociation of worms from the surrounding media. The section is more distorted in a specimen that is surrounded by the cryoprotecting bacteria (B) than when the specimen is surrounded by plastic (A). The bacterial cryoprotectant in the gallette should be dissected away from the fixed sample before plastic embedding. (C, D) Electron micrographs of neurons from the same specimen, sectioned on different dates. The preservation of tissues is superb on one day (C), but such morphology is obscured by the inconsistent sectioning quality (D). (E) Elec-tron micrograph of nerve ring, showing folding of sections due to the incomplete polymerization of plastic (black arrows). (F) Electron micrograph of intestine, showing dropouts of tissues (black circles).

294 Shigeki Watanabe et al.
leaves the surface of the coverglasses hydrophilic, which is not ideal for picking up sections. The addition of a few drop of hexamethyldisilazane (HMDS) in a sealed jar containing the coverglasses creates the hydrophobic surface.
There are two ways to mount sections on a coverglass (Fig. 5). First, sections can be picked up using a perfect loop (Electron Microscopy Scieneces) or something similar and placed on a coverglass (Fig. 5(A)). A problem with this approach is that sections may dis-sociate from the ribbon in the process. The loop should be cleaned using ethanol prior to use so that dust particles are not transferred with the sections. The use of a Kimwipe or filter paper to remove water from the loop also leaves dust on the sections, so the drop of water containing sections should be blown off to a coverglass from the loop. Once the water evaporates, sections will adhere to the surface of the coverglass. The second method is to use a diamond knife with a large boat so that a coverglass can be submerged in the water to pick up sections, just as they are on a TEM grid (Fig. 5(B)). Mounting sections in the middle of the coverglass is technically more challenging because sections become invisible in the concave water surface created from submerging the coverglass in water. A longer ribbon can be mounted on a coverglass using this method, whereas the dimension of the ribbon is restricted by the size of the loop in the former case. Ideally, sectioning should be carried out in a darkened room. Once sections from the region of interest are collected, the coverglass should be covered with aluminum foil and stored at –20°C until further processing.
E. Fluorescence Imaging
Prior to fluorescence imaging, a solution containing gold nanoparticles should be applied to the sections for 1 min. The sections are then soaked in milliQ water for 2 min. The 100 nm gold nanoparticles emit red fluorescence when excited by green light due to surface plasmon resonance (Link & El-Sayed, 1999) and reflect electrons when imaged
A Picking up sections using a loop B Picking up sections directly onto a coverslip
Fig. 5 Schematic diagrams showing two methods for mounting sections onto a coverslip. Sections can be picked up using a loop (A) or by simply immersing a coverslip in the boat of a diamond knife (B). A longer ribbon of sections can be mounted by immersing a coverslip. (See color plate.)

29515. Visualizing Proteins in Electron Micrographs at Nanometer Resolution
under an electron microscope. Therefore, they can mark both fluorescence images and electron micrographs and serve as alignment markers for the image correlation. The solution containing gold nanoparticles with a concentration at 1.2 × 10¹⁰ particles/ml is applied to the specimen for ~30 s to 1 min and then removed by blowing the solu-tion off to the side of the coverslip and blotting it using a Kimwipe or filter paper. Next, a drop of water is applied to the sections. The water restores the function of fluorescent proteins. After fixation and plastic embedding, some of the fluorescent proteins are preserved in a nonfluorescent state (Watanabe et al., 2011). We found that the addition of water prior to imaging increases the fluorescence intensity 30-fold (Watanabe et al., 2011). However, autofluorescence in GMA resin also increases after hydration. This increase is detected by an EM-CCD camera, with which the PALM scope is equipped. Therefore, PALM imaging cannot be carried out while immersing the samples in water. Water is only applied to specimens for 2 min and is removed just prior to imaging. The use of a Kimwipe or filter paper to draw the solution off directly from the specimen would introduce dust particles into the sections and induce autofluorescence, so the solution must be blown to the edge of the coverslip and then absorbed onto a Kimwipe or filter paper.
For PALM imaging, the microscope should be set up as recommended by the manu-facturer. The frame rate should be set at 20 Hz or less. Bright field illumination should be used to locate specimens. A low-intensity 488 nm laser can be employed to localize proteins in the region of interest if necessary but should be avoided if possible. Once the region of interest is set, 561 nm laser light at the highest intensity should be applied for ~2 min to the specimen to bleach the autofluorescence. To collect images, the acti-vation laser and readout laser should be set at their lowest and maximum intensities, respectively. We usually collect ~ 6000 frames per section; this is sufficient to sample the distribution of fluorophores. However, if every molecule in the region must be localized, the frame number should be increased accordingly. If the activated molecules in a given space are sparse, the activation energy can be gradually increased. It is impor-tant to note that the computer calculates the centroid of each fluorescent spot; thus, if two molecules emit fluorescence in a given diffraction-limited spot at the same time, only one dot would be placed in the middle of these two molecules, resulting in a false nega-tive. PALM images should be acquired from each section on the coverslip. The sections become dehydrated during a long imaging session, so they are rehydrated with a drop of milliQ water approximately every half-hour. Again, the milliQ water should be blown to the side before absorbing it onto a Kimwipe or filter paper to avoid contamination.
For GSDIM imaging, fluorescent proteins must be driven into the dark state in the absence of oxygen (Fölling et al., 2008). Plastic seems to serve as a diffusion barrier for oxygen; thus, a solution containing oxygen scavengers or a chamber filled with nitrogen gas may not be necessary. Following the gold particle application and hydra-tion described in the previous section, 488 nm laser at 5 mW/mm2 intensity is applied to induce the state shift of fluorescent proteins from the ground to the dark state (Fig. 8(B and C)). About 5000 images are collected at a frame rate of 20/s while applying a continuous 488 nm laser at 1 mW/mm2.
After their acquisition, images should be processed for PALM (Fig. 7(B and C) or GSDIM (Fig. 8(D and E). Since some background fluorescence is inevitable when
296 Shigeki Watanabe et al.
imaging plastic sections, it should be filtered out in the final fluorescence image. For background subtraction, we impose two thresholds: fluorescence lifetime and bright-ness. The emission from tdEos molecules typically lasts for ~500 ms or less before they become bleached when 5 mW/mm2 laser is applied. A threshold of 500 ms is set so that any molecules that fluoresce for longer than 500 ms do not appear in the final image. Additionally, low-intensity background autofluorescence can be subtracted by visual-izing the molecules with high-localization precision. Localization precision depends on the number of photons collected at each spot. Fluorescence from tdEos or Citrine molecules often appears brighter than background fluorescence; hence, by imposing a threshold for localization precision, low-intensity noise can be filtered.
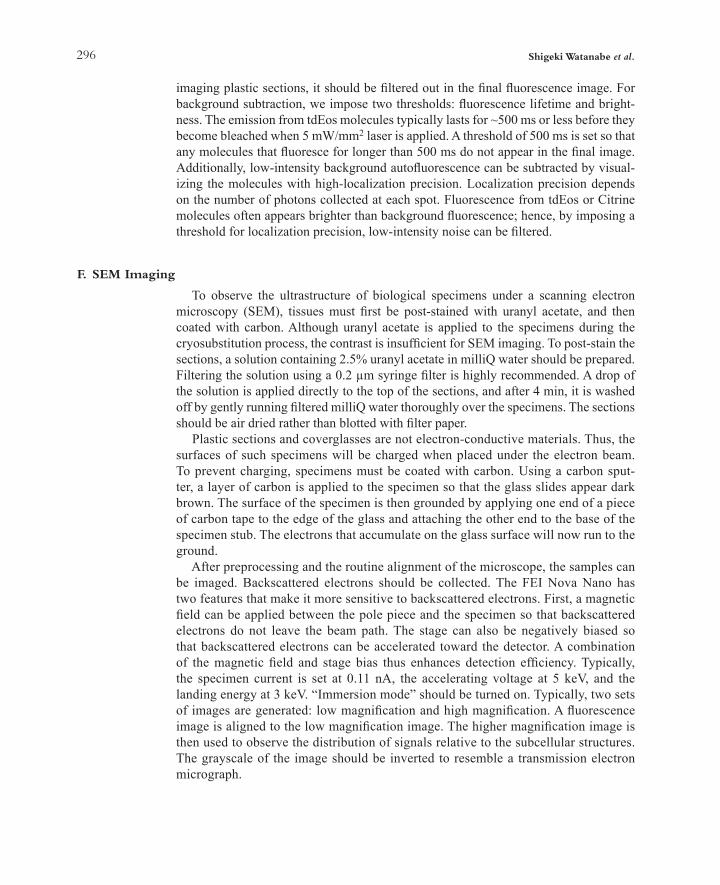
F. SEM Imaging
To observe the ultrastructure of biological specimens under a scanning electron microscopy (SEM), tissues must first be post-stained with uranyl acetate, and then coated with carbon. Although uranyl acetate is applied to the specimens during the cryosubstitution process, the contrast is insufficient for SEM imaging. To post-stain the sections, a solution containing 2.5% uranyl acetate in milliQ water should be prepared. Filtering the solution using a 0.2 µm syringe filter is highly recommended. A drop of the solution is applied directly to the top of the sections, and after 4 min, it is washed off by gently running filtered milliQ water thoroughly over the specimens. The sections should be air dried rather than blotted with filter paper.
Plastic sections and coverglasses are not electron-conductive materials. Thus, the surfaces of such specimens will be charged when placed under the electron beam. To prevent charging, specimens must be coated with carbon. Using a carbon sput-ter, a layer of carbon is applied to the specimen so that the glass slides appear dark brown. The surface of the specimen is then grounded by applying one end of a piece of carbon tape to the edge of the glass and attaching the other end to the base of the specimen stub. The electrons that accumulate on the glass surface will now run to the ground.
After preprocessing and the routine alignment of the microscope, the samples can be imaged. Backscattered electrons should be collected. The FEI Nova Nano has two features that make it more sensitive to backscattered electrons. First, a magnetic field can be applied between the pole piece and the specimen so that backscattered electrons do not leave the beam path. The stage can also be negatively biased so that backscattered electrons can be accelerated toward the detector. A combination of the magnetic field and stage bias thus enhances detection efficiency. Typically, the specimen current is set at 0.11 nA, the accelerating voltage at 5 keV, and the landing energy at 3 keV. “Immersion mode” should be turned on. Typically, two sets of images are generated: low magnification and high magnification. A fluorescence image is aligned to the low magnification image. The higher magnification image is then used to observe the distribution of signals relative to the subcellular structures. The grayscale of the image should be inverted to resemble a transmission electron micrograph.
29715. Visualizing Proteins in Electron Micrographs at Nanometer Resolution
G. Image Alignment
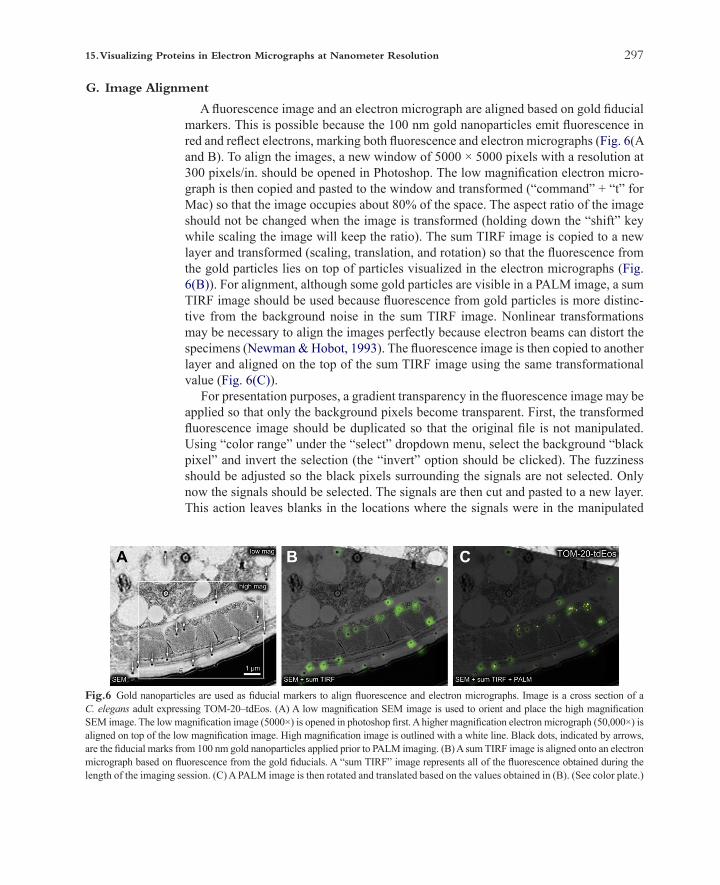
A fluorescence image and an electron micrograph are aligned based on gold fiducial markers. This is possible because the 100 nm gold nanoparticles emit fluorescence in red and reflect electrons, marking both fluorescence and electron micrographs (Fig. 6(A and B). To align the images, a new window of 5000 × 5000 pixels with a resolution at 300 pixels/in. should be opened in Photoshop. The low magnification electron micro-graph is then copied and pasted to the window and transformed (“command” + “t” for Mac) so that the image occupies about 80% of the space. The aspect ratio of the image should not be changed when the image is transformed (holding down the “shift” key while scaling the image will keep the ratio). The sum TIRF image is copied to a new layer and transformed (scaling, translation, and rotation) so that the fluorescence from the gold particles lies on top of particles visualized in the electron micrographs (Fig. 6(B)). For alignment, although some gold particles are visible in a PALM image, a sum TIRF image should be used because fluorescence from gold particles is more distinc-tive from the background noise in the sum TIRF image. Nonlinear transformations may be necessary to align the images perfectly because electron beams can distort the specimens (Newman & Hobot, 1993). The fluorescence image is then copied to another layer and aligned on the top of the sum TIRF image using the same transformational value (Fig. 6(C)).
For presentation purposes, a gradient transparency in the fluorescence image may be applied so that only the background pixels become transparent. First, the transformed fluorescence image should be duplicated so that the original file is not manipulated. Using “color range” under the “select” dropdown menu, select the background “black pixel” and invert the selection (the “invert” option should be clicked). The fuzziness should be adjusted so the black pixels surrounding the signals are not selected. Only now the signals should be selected. The signals are then cut and pasted to a new layer. This action leaves blanks in the locations where the signals were in the manipulated
Fig.6 Gold nanoparticles are used as fiducial markers to align fluorescence and electron micrographs. Image is a cross section of a C. elegans adult expressing TOM-20–tdEos. (A) A low magnification SEM image is used to orient and place the high magnification SEM image. The low magnification image (5000×) is opened in photoshop first. A higher magnification electron micrograph (50,000×) is aligned on top of the low magnification image. High magnification image is outlined with a white line. Black dots, indicated by arrows, are the fiducial marks from 100 nm gold nanoparticles applied prior to PALM imaging. (B) A sum TIRF image is aligned onto an electron micrograph based on fluorescence from the gold fiducials. A “sum TIRF” image represents all of the fluorescence obtained during the length of the imaging session. (C) A PALM image is then rotated and translated based on the values obtained in (B). (See color plate.)

298 Shigeki Watanabe et al.
layer—this layer thus contains only the background pixels. The transparency should be set to 10% in the background layer. Now the signals are distinctive from the back-ground, and can be overlaid on the electron micrograph. The representative images for correlative microscopy using PALM (Fig. 7(B–E)) or GSDIM (Fig. 8(D–G)) from the transgenic animals expressing TOM-20::tdEos or TOM-20::Citrine, respectively, showed similar distribution of proteins on the outer membrane of mitochondria.
IV. Instrumentations and Materials
A. High-Pressure Freezing
1. High-pressure freezer (HPM010, Baltec) 2. Specimen carriers type A (#241-200, TechnoTrade) 3. Specimen carriers type B (#242-200, TechnoTrade) 4. Hexadecene (#H2131-100 ML, Sigma-Aldrich) 5. Albumin from bovine serum (A2153-10G, Sigma-Aldrich) 6. Worm buffer M9 (22 mM KH2PO4, 19 mM NH4Cl, 48 mM Na2HPO4, and 9 mM
NaCl) 7. Forceps (insulated; #16LZ01873KN, Leica Microsystem)
Fig. 7 Nano-fEM using photoactivation localization microscopy (PALM). (A) Schematic diagram showing the concept of PALM. Molecules are activated stochastically, imaged, and photobleached. The centroid of each fluorescence spot is then calculated and recon-structed in a final image. (B) Sum TIRF image of TOM-20–tdEos acquired from a thin section (80 nm) of a GMA-embedded sample. White arrow indicates fluorescence emitted from gold particles. (C) Corresponding PALM image of TOM-20–tdEos. (D) Electron micrograph of a body muscle acquired from the same section. (E) Nano-fEM of TOM-20–tdEos. The fluorescent signals are localized to the outer membrane of the mitochondria. (See color plate.)

29915. Visualizing Proteins in Electron Micrographs at Nanometer Resolution
8. Paintbrush #00 (7/16 inch) 9. Whatman filter paper (#09-810D, Fisher) 10. Isopropanol (#19030-4L, Sigma-Aldrich) 11. Liquid nitrogen
B. Freeze-Substitution
1. Automated freeze-substitution unit (AFS 2, Leica microsystem) 2. Cyrovials (#D9912, Nalgene) 3. 50 ml screw cap conical tubes (#62.547.004, Starstedt) 4. 15 ml screw cap conical tubes (#62.554.002 PP, Starstedt) 5. Acetone (RT10016, EMS) 6. Ethanol (#459844-1L, Sigma-Aldrich) 7. Osmium tetroxide (crystals, 1/10g; RT19134, EMS) 8. Potassium permanganate (RT20200, EMS) 9. Uranyl acetate (#21447-252, Polysciences) 10. Disposable transfer pipette (#14670-201, VWR) 11. Disposable pasteur pipette (Borosilicate glass; #13-678-20A, Fisher) 12. Pipetman and tips (P1000, P200, and P20)
Fig. 8 Nano-fEM using ground-state depletion (GSDIM). (A) Schematic diagram showing the concept of GSDIM. Fluorescent pro-teins, Citrine, are excited and driven into a dark state with intense laser in the presence of an oxygen scavenger. Fluorophores return to the ground state stochastically and are imaged. The centroid of each fluorescent spot is calculated and localized in a similar manner as PALM to reconstruct a final image. (B) TIRF image of TOM-20–Citrine acquired from a thin section (80 nm). Fluorescence signals are diffraction limited because all molecules fluoresce at the same time. (C) TIRF image of the same region imaged in (B). All the molecules are driven into a dark state (the triplet state) by intense 488 nm laser, and thus no signals are observed. (D) Sum TIRF image recon-structed from all the fluorescence spots detected by the camera. Background fluorescence is typically higher using GSDIM because sections cannot be prebleached using the readout laser. (E) Corresponding GSDIM image of TOM-20–Citrine. (F) Electron micrograph of a body wall muscle acquired from the same section. (G) Correlative GSDIM and electron microscopy of TOM-20–Citrine. The fluorescent signals are localized to the outer membrane of the mitochondria. (See color plate.)

300 Shigeki Watanabe et al.
C. Plastic Embedding
1. GMA kit (low acid and TEM grade; #02630-AA, SPI) 2. N,N-Dimethyl-p-toluidine (#D9912, Sigma-Aldrich) 3. Scintillation vials (20 ml; #72632, EMS) 4. Aclar film (#50425-10, EMS) 5. BEEM capsule (polypropylene; #TC, EBSciences) 6. 3/8” disk punches (#54741, Ted Pella) 7. 25 ml serological pipette (#13-678-11, Fisher) 8. 10 ml serological pipette (#13-678-11 E, Fisher) 9. Petri dish (35 × 10 mm; #351008, Fisher)
D. Coverslip Cleaning
1. Coverslip (#1.5, round; #40300, Warner Instruments) 2. Sulfuric acid (#320501-2.5L, Sigma-Aldrich) 3. Hydrogen peroxide (#216763-500ML, Sigma-Aldrich) 4. Coverslips rack (Teflon; C-14784, Invitrogen) 5. Sonicator
E. Sectioning
1. Ultramicrotome (UC6, Leica microsystem) 2. Diamond knife (Ultra jumbo, 45°, 4.0 mm; DiATOME) 3. Glass strips (#8030, Ted Pella) 4. Glass knife boats (#123-3, Ted Pella) 5. Nail polish (clear) 6. Perfect loop (#70944, EMS) 7. Hair tool for manipulation of plastic sections 8. Razor blade (Double edge; #72000, EMS) 9. High profile microtome blades (#818, Leica microsystem)
F. PALM Imaging
1. Zeiss PAL-M (ELYRA P.1, Zeiss) 2. Gold nanoparticles (call for 2× concentrated solution; #790122-010, micro-
spheres-nanospheres.com) 3. Canned air 4. Attofluor cell chamber for microscopy (#A7816, Invitrogen)
G. Staining
1. Uranyl acetate (#21447-252, Polysciences) 2. Syringe (10 ml) 3. Syringe filter (0.22 µm; SLGP033RB, Millipore)
30115. Visualizing Proteins in Electron Micrographs at Nanometer Resolution
H. SEM Imaging
1. FEI Nova Nano 2. Backscattered electron detector (vCD, FEI) 3. Carbon fiber cord (#4539, EMS) 4. SEM pin stub (#16111, Ted Pella) 5. Carbon conductive tape (double coated; #16084-7, Ted Pella)
I. Image alignment
1. Photoshop (CS5, Adobe)
V. Discussion
Super-resolution fluorescence microscopy allows one to precisely pinpoint the loca-tion of a single molecule in a cell (Betzig et al., 2006; Hell & Wichmann, 1994; Hess et al., 2006; Rust et al., 2006). However, precise localization in a field of black is not useful. Where is that protein in the context of cellular structure? Where are previously described organelles in relationship to this protein? Here, we demonstrate that fluores-cently tagged proteins can be correlated with ultrastructure in electron micrographs to identify the cellular location of a protein. Five issues in particular bear discussion: fixation, plastic, imaging, alignment, and quantification.
A. Fixation
Here we use a combination of potassium permanganate and osmium tetroxide followed by en bloc uranyl acetate staining to balance the fluorescence and morphol-ogy preservation at synapses. Neuronal tissues are the most sensitive to the fixation condition (Watanabe et al., 2011), and thus the use of lipid cross-linkers, such as osmium tetroxide and potassium tetroxide, is essential. One drawback is that these cross-linkers are also oxidizing agents; consequently, fluorescent proteins may not be functional after fixation. These chemicals are less reactive at lower temperatures, so the aforementioned cryomethods are required for preserving fluorescence during sample preparation. On the other hand, fixation may not be necessary if the tissue of interest has a naturally high contrast in electron microscopy and thereby requires no additional fixation and staining with uranyl acetate. In this case, cryosectioning (Betzig et al., 2006) can be employed. However, such high-contrast tissues or sub-cellular structures are rare, and thus reaction with electron dense fixatives is required to elucidate the subcellular details in tissues. Recently, the use of uranyl acetate alone in the cryosubstitution medium has shown to enhance the contrast of mem-branes while preserving almost 100% of the fluorescence level in yeast cells and cell cultures (Kukulski et al., 2011). Therefore, fixation conditions can be altered according to need.

302 Shigeki Watanabe et al.
B. Plastic
The choice of resin media is critical for the functionality of fluorescent proteins and the quality of sectioning. Fluorescent proteins require a hydrated environment that is neutral or alkaline in pH. There are two types of resins often used in electron micros-copy: epoxy and acrylic. Epoxy-based resins have a superior sectioning quality because they can cross link with tissues; however, they are very hydrophobic, making them incompatible with fluorescent proteins. Moreover, they require a temperature of 60°C for polymerization. Fluorescent proteins are denatured at such a temperature. Acrylic resins, on the other hand, are hydrophilic, fulfilling the requirement for a hydrated envi-ronment, and can be polymerized at low temperatures by either UV light or chemicals (Newman & Hobot, 1993). However, most acrylic resins have a low pH––fluorescent proteins are quenched in such a condition. Here we chose GMA because it fulfilled the hydrated and alkaline requirements of fluorescent proteins. However, since GMA does not cross link with tissues, dropouts of tissues are often observed. Ultimately, a plastic with good features of both types of resins should be developed.
C. Super-Resolution Fluorescence Imaging
To understand the functions of proteins, the relationship of one protein to another and to subcellular structures must be revealed. Photoactivated localization microscopy can pinpoint the location of proteins at nanometer resolution, but the applications have been somewhat limited due to the lack of fluorescent proteins compatible for multicolor imaging. Here we show that fEM can provide the structural information in the PALM image. The method described here also introduces the possibility for multiple colors to be imaged by using GSDIM. Potentially, a large number of preexisting transgenic lines, expressing GFP, for example, can be imaged at the single-molecule level using GSDIM instead of requiring the construction of strains using photoactivatable tags such as Eos for PALM imaging. Although Citrine is unique, and other fluorescent proteins such as GFP are not compatible with GSDIM imaging, other super-resolution fluorescence imaging modalities, such as structured illumination microscopy, might be employed to localize fluorescence in sections before electron microscopy. Moreover, depending on the application, diffraction-limited fluorescence spots may provide enough information so that simple correlative fEM is sufficient for one’s imaging needs. For example, the subtype of neurons in a neuropil can be identified simply by overlaying the diffraction-limited fluorescence images on the electron micrographs (Micheva & Smith, 2007). Thus, the choice of fluorescent proteins should be made based on the application. One must also remember that fEM without super-resolution imaging still produces subdif-fraction fluorescence images because the axial resolution is determined by the thick-ness of the section, which is typically about 50 nm, rather than the actual point-spread function of the fluorescence, which is over 700 nm (Micheva and Smith, 2007).
D. Electron Microscopy Imaging
For fEM, we have been using a SEM extensively, but TEM can also be used. However, two factors should be considered before using TEM. First, sections must

30315. Visualizing Proteins in Electron Micrographs at Nanometer Resolution
be ultrathin for TEM imaging. Typically, 50- to 70 nm-thick sections are imaged by TEM. If specimens are very darkly stained with osmium tetroxide, contrast can still be obtained using a typical accelerating voltage of 100 keV. However, because the primary fixative used here is potassium permanganate, the tissue contrast is low with such a high accelerating voltage. A lower voltage can be used to enhance the contrast, but in this case, the sections must be even thinner, but obtaining such thin sections with GMA-embedded specimens can be challenging. Moderately high-resolution images (~5 nm resolution) can be achieved from the surface of the specimens in SEM with a low accelerating voltage (~5 keV), and thus the thickness of sections is not an issue. Second, a grid with lateral dimensions of 2 mm × 1 mm must be used for TEM imaging. Therefore, one must manipulate many ribbons of sections without losing sections or losing the order of the sections, whereas with SEM, long ribbons of sec-tions can be mounted on the coverglass. Therefore, unless resolution better than 5 nm is necessary to capture cellular details, SEM offers advantages over TEM.
E. Alignment
A fluorescence image and an electron micrograph are aligned based on gold fiducial markers, but the alignment may not be precise for two reasons. First, gold particles emit fluorescence constantly. Because each particle is not stochastically activated, the fluo-rescence signals from a few neighboring gold particles appear as one fluorescent spot due to the diffraction limit of light. On the other hand, electron microscopy depicts the actual dimensions of the particles. The disparity in the resolution results in some ambi-guity in the alignment. Second, electron beams can distort the specimen even though the sections are mounted on a solid glass surface. The distortion is usually more severe in acrylic resins such as GMA. Aligning a portion of the image or applying nonlinear transformations could help overcome this distortion problem.
F. Quantification
Counting the number of fluorescent molecules in PALM images is very tempting, but one must consider three factors that affect the number of molecules present in each spot of an image. First, fluorescence is lost during sample preparation. We reported above that most of the fluorescence is preserved when measured in our specimens at the beginning and end of the fixation and embedding procedure, but we may be overestimating fluores-cence because of mechanical damage to the fluorophores during sectioning and oxidation after sectioning has not been quantified. Second, the stochastic nature of photoactivatable fluorescent proteins affects quantification. Each molecule must be activated separately in space and time and must be permanently bleached after emitting fluorescence for calculating the precise number of molecules. However, fluorophores can be easily under-counted or overcounted. The fluorophores can emit too little light and fail to be counted. Alternatively, they may return from the triplet dark state instead of becoming bleached and be counted twice. This uncertainty is compounded in GSDIM, in which overcount-ing is routine and thus this method is not quantitative. Third, tagged proteins are typically not expressed at the endogenous level. Therefore, quantification cannot be precise.

304 Shigeki Watanabe et al.
VI. Perspective
Nano-resolution fEM (nano-fEM) using super-resolution fluorescence microscopy can reveal the precise location of proteins within a cell. Unlike immuno-EM, protein localization is limited only by the ability to tag the protein of interest with fluoro-phores. This method can thus reveal the localization of proteins more quantitatively and at very high resolution. In the future, a few improvements could greatly extend the utility of this method. These improvements include the development of hydro-philic plastics that cross link with tissues, fluorophores that are osmium resistant, photoactivatable fluorescent proteins that can be imaged simultaneously in two color spectra, and a method to combine three-dimensional PALM imaging with electron tomography.
Acknowledgments
We thank Harald Hess and Eric Betzig for access to the PALM microscope for proof-of-principle experiments; Rick Fetter for sharing fixation protocols, reagents, and encouragement; Michael Davidson, Geraldine Seydoux, Stefan Eimer, Rudolf Leube, Keith Nehrke, Christian Frøkjær-Jensen, Aude Ada-Nguema, and Marc Ham-marlund for DNA constructs; Gunther Hollopeter for generating transgenic lines used in these experiments; Jackson Richards for a critical reading of the manuscript; and Carl Zeiss Inc. for providing access to the beta version of the Elyra PALM microscope.
References
Betzig, E., Patterson, G. H., Sougrat, R., Lindwasser, O. W., Olenych, S., Bonifacino, J. S., et al. (2006). Imaging intracellular fluorescent proteins at nanometer resolution. Science, 313, 1642–1645.
Cajal, S.R.Y. (1894). Die Retina der Wirbelthiere: Untersuchungen mit der Golgi-Cajal’schen Chromsilber-methode und der Ehrlich’schen Methylenblaufärbung (Wisbaden, Bergmann).
Cajal, S.R.Y. (1899). Comparative study of the sensory areas of the human cortex. Worcester: Clark Uni-versity.
Cajal, S.R.Y. (1903). Studien über die Hirnrinde des Menschen (Johann Ambrosius Barth).Chalfie, M., Tu, Y., Euskirchen, G., Ward, W. W., & Prasher, D. C. (1994). Green fluorescent protein as a
marker for gene expression. Science, 263, 802–805.Fölling, J., Bossi, M., Bock, H., Medda, R., Wurm, C. A., Hein, B., et al. (2008). Fluorescence nanoscopy by
ground-state depletion and single-molecule return. Nature Methods, 5, 943–945.Grabenbauer, M., Geerts, W. J. C., Fernadez-Rodriguez, J., Hoenger, A., Koster, A. J., & Nilsson, T. (2005).
Correlative microscopy and electron tomography of GFP through photooxidation. Nature Methods, 2, 857–862.
Gurskaya, N. G., Verkhusha, V. V., Shcheglov, A. S., Staroverov, D. B., Chepurnykh, T. V., Fradkov, A. F., et al. (2006). Engineering of a monomeric green-to-red photoactivatable fluorescent protein induced by blue light. Nature Biotechnology, 24, 461–465.
Harke, B., Keller, J., Ullal, C. K., Westphal, V., Schönle, A., & Hell, S. W. (2008). Resolution scaling in STED microscopy. Optics Express, 16, 4154–4162.
Heikal, A. A., Hess, S. T., Baird, G. S., Tsien, R. Y., & Webb, W. W. (2000). Molecular spectroscopy and dynamics of intrinsically fluorescent proteins: coral red (dsRed) and yellow (Citrine). Proceedings of the National Academy of Sciences of the United States of America, 97, 11996–12001.

30515. Visualizing Proteins in Electron Micrographs at Nanometer Resolution
Heilemann, M., van de Linde, S., Schüttpelz, M., Kasper, R., Seefeldt, B., Mukherjee, A., et al. (2008). Subdiffraction‐resolution fluorescence imaging with conventional fluorescent probes. Angewandte Chemie International Edition, 47, 6172–6176.
Hell, S. W., & Wichmann, J. (1994). Breaking the diffraction resolution limit by stimulated emission: stim-ulated-emission-depletion fluorescence microscopy. Optics Letters, 19, 780–782.
Hell, S. W. (2007). Far-field optical nanoscopy. Science, 316, 1153–1158.Hess, S. T., Girirajan, T. P. K., & Mason, M. D. (2006). Ultra-high resolution imaging by fluorescence pho-
toactivation localization microscopy. Biophysical Journal, 91, 4258–4272.Hooke, R. (1665). Micrographia: Or some physiological descriptions of minute bodies made by magnify-
ing glasses with observations and inquiries thereupon Jo. Matryn and Ja. Allestry. London: The Royal Society.
Knoll, M., & Ruska, E. (1932). Elektronenmikroskop. Zeitschrift Physikalische, 78, 318–339.Kukulski, W., Schorb, M., Welsch, S., Picco, A., Kaksonen, M., & Briggs, J. A. G. (2011). Correlated fluo-
rescence and 3D electron microscopy with high sensitivity and spatial precision. The Journal of Cell Biology, 192, 111–119.
Lalkens, B., Testa, I., Willig, K. I., & Hell, S. W. (2012). MRT letter: nanoscopy of protein colocalization in living cells by STED and GSDIM. Microscopy Research and Technique, 75, 1–6.
Link, S., & El-Sayed, M. A. (1999). Spectral properties and relaxation dynamics of surface plasmon elec-tronic oscillations in gold and silver nanodots and nanorods. The Journal of Physical Chemistry B, 103, 8410–8426.
McCutchen, C. W. (1967). Superresolution in microscopy and the Abbe resolution limit. Journal of the Opti-cal Society of America, 57, 1190–1192.
McDonald, K. L., Morphew, M., Verkade, P., & Müller-Reichert, T. (2007). Recent advances in high-pressure freezing: equipment- and specimen-loading methods. Methods in Molecular Biology, 369, 143–173.
McDonald, K., Schwarz, H., Müller-Reichert, T., Webb, R., Buser, C., & Morphew, M. (2010). “Tips and tricks” for high-pressure freezing of model systems. Methods in Cell Biology, 96, 671–693.
McDonald, K. (2007). Cryopreparation methods for electron microscopy of selected model systems. Meth-ods in Cell Biology, 79, 23–56.
Micheva, K., & Smith, S. (2007). Array tomography: a new tool for imaging the molecular architecture and ultrastructure of neural circuits. Neuron, 55, 25–36.
Morphew, M. K. (2007). 3D immunolocalization with plastic sections. Methods in Cell Biology, 79, 493–513.Müller-Reichert, T., Srayko, M., Hyman, A., O’Toole, E. T., & McDonald, K. (2007). Correlative light and
electron microscopy of early Caenorhabditis elegans embryos in mitosis. In cellular electron microscopy. Oxford, Elsvier. pp. 101–119).
Müller-Reichert, T. (2010). (1st ed.). Electron microscopy of model systems. (Vol. 96). New York: Academic Press.
Murphy, D. B. (2001). Fundamentals of light microscopy and electronic imaging. Hoboken, NJ: John Wiley and Sons.
Newman, G. R., & Hobot, J. A. (1993). Resin microscopy and on-section immuno-cytochemistry. Berlin, Germany: Springer-Verlag.
Nixon, S. J., Webb, R. I., Floetenmeyer, M., Schieber, N., Lo, H. P., & Parton, R. G. (2009). A single method for cryofixation and correlative light, electron microscopy and tomography of zebrafish embryos. Traffic, 10, 131–136.
Oberti, D., Kirschmann, M. A., & Hahnloser, R. H.R. (2010). Correlative microscopy of densely labeled projection neurons using neural tracers. Frontiers in Neuroanatomy, 4, 24.
Patterson, G. H., & Lippincott-Schwartz, J. (2002). A photoactivatable GFP for selective photolabeling of proteins and cells. Science, 297, 1873–1877.
Payne, J. W. (1973). Polymerization of proteins with glutaraldehyde. Soluble molecular-weight markers. Journal of Biochemistry, 135, 867–873.
Polishchuk, R. S., Polishchuk, E. V., Marra, P., Alberti, S., Buccione, R., Luini, A., et al. (2000). Correlative light-electron microscopy reveals the tubular-saccular ultrastructure of carriers operating between Golgi apparatus and plasma membrane. The Journal of Cell Biology, 148, 45–58.
306 Shigeki Watanabe et al.
Rostaing, P., Weimer, R. M., Jorgensen, E. M., Triller, A., & Bessereau, J.-L. (2004). Preservation of immu-noreactivity and fine structure of adult C. elegans tissues using high-pressure freezing. The Journal of Histochemistry and Cytochemistry, 52, 1–12.
Roth, J., Bendayan, M., Carlemalm, E., Villiger, W., & Garavito, M. (1981). Enhancement of structural pres-ervation and immunocytochemical staining in low temperature embedded pancreatic tissue. The Journal of Histochemistry and Cytochemistry, 29, 663–671.
Rust, M. J., Bates, M., & Zhuang, X. (2006). Sub-diffraction-limit imaging by stochastic optical reconstruc-tion microscopy (STORM). Nature Methods, 3, 793–795.
Schikorski, T. (2010). Horseradish peroxidase as a reporter gene and as a cell-organelle-specific marker in correlative light-electron microscopy. In S. D. Schwartzbach, & T. Osafune (Eds.), Immunoelectron microscopy (pp. 315–327). Totowa, NJ:: Humana Press.
Schwarz, H., & Humbel, B. M. (2007). Correlative light and electron microscopy using immunolabeled resin sections. Methods in Molecular Biology, 369, 229–256.
Shimomura, O. (2009). Discovery of green fluorescent protein (GFP) (Nobel Lecture). Angewandte Chemie International Edition in English, 48, 5590–5602.
Shtengel, G., Galbraith, J. A., Galbraith, C. G., Lippincott-Schwartz, J., Gillette, J. M., Manley, S., et al. (2009). Interferometric fluorescent super-resolution microscopy resolves 3D cellular ultrastructure. Pro-ceedings of the National Academy of Sciences, 106, 3125–3130.
Shu, X., Lev-Ram, V., Deerinck, T. J., Qi, Y., Ramko, E. B., Davidson, M. W., et al. (2011). A genetically encoded tag for correlated light and electron microscopy of intact cells, tissues, and organisms. PLoS Biology, 9, e1001041.
Sims, P. A., & Hardin, J. D. (2007). Fluorescence-integrated transmission electron microscopy images: inte-grating fluorescence microscopy with transmission electron microscopy. Methods in Molecular Biology, 369, 291–308.
Sosinsky, G. E., Giepmans, B. N.G., Deerinck, T. J., Gaietta, G. M., & Ellisman, M. H. (2007). Markers for correlated light and electron microscopy. Methods in Cell Biology, 79, 575–591.
Tsien, R. (1998). The green fluorescent protein. Annual Review of Biochemistry, 67, 509–544.Verkade, P. (2008). Moving EM: the rapid transfer system as a new tool for correlative light and electron
microscopy and high throughput for high‐pressure freezing. Journal of Microscopy, 230, 317–328.Watanabe, S., Punge, A., Hollopeter, G., Willig, K. I., Hobson, R. J., Davis, M. W., et al. (2011). Protein
localization in electron micrographs using fluorescence nanoscopy. Nature Methods, 8, 80–84.Weibull, C., & Christiansson, A. (1986). Extraction of proteins and membrane lipids during low temperature
embedding of biological material for electron microscopy. Journal of Microscopy, 142, 79–86.Wiedenmann, J., Ivanchenko, S., Oswald, F., Schmitt, F., Röcker, C., Salih, A., et al. (2004). EosFP, a flu-
orescent marker protein with UV-inducible green-to-red fluorescence conversion. Proceedings of the National Academy of Sciences of the United States of America, 101, 15905–15910.
Zhang, J., Campbell, R. E., Ting, A. Y., & Tsien, R. Y. (2002). Creating new fluorescent probes for cell biol-ogy. Nature Reviews. Molecular Cell Biology, 3, 906–918.