Visualizing Cellular Phosphoinositide Pools with GFP …wang.eng.ucsd.edu/protocol/3. Cell Biology...
16
www.stke.org/cgi/content/full/OC_sigtrans;2002/125/pl3 Page 1 INTRODUCTION Creation of the Fusion Proteins Expression of the Fusion Proteins MATERIALS EQUIPMENT RECIPES INSTRUCTIONS Preparation of Poly-lysine-Coated Cover Slips Transfecting Cells Confirming the Integrity of the Expressed Protein Immunostaining of Cells Expressing GFP Fusion Proteins Observing the GFP Signal by Microscopy TROUBLESHOOTING No Bacterial Colonies No Green Fluorescence Weak Fluorescence Mislocalization of the Protein Construct RELATED TECHNIQUES Transfection Versus Microinjection Alternative or Supplemental Fluorescence Techniques Monitoring Phosphoinositides by Immunocytochemistry CONCLUDING REMARKS REFERENCES Visualizing Cellular Phosphoinositide Pools with GFP-Fused Protein-Modules Tamas Balla 1 * and Péter Várnai 2 (Published 26 March 2002) P ROTOCOL 1 Unit of Molecular Signal Transduction, Endocrinology and Reproduction Research Branch, National Institute of Child Health & Human Development, National Institutes of Health, Bethesda, MD 20892, USA. 2 Department of Physiology, Semmelweis University Medical School, Budapest, Hungary. *Corresponding author. National Institutes of Health, Building 49, Room 6A35, 49 Convent Drive, Bethesda, MD 20892-4510, USA.Telephone, 301-496-2136; fax, 301-480-8010; e-mail, [email protected]
Transcript of Visualizing Cellular Phosphoinositide Pools with GFP …wang.eng.ucsd.edu/protocol/3. Cell Biology...
www.stke.org/cgi/content/full/OC_sigtrans;2002/125/pl3 Page 1
INTRODUCTION
Creation of the Fusion ProteinsExpression of the Fusion Proteins
MATERIALS
EQUIPMENT
RECIPES
INSTRUCTIONS
Preparation of Poly-lysine-Coated Cover SlipsTransfecting CellsConfirming the Integrity of the Expressed ProteinImmunostaining of Cells Expressing GFP Fusion
Proteins Observing the GFP Signal by Microscopy
TROUBLESHOOTING
No Bacterial ColoniesNo Green Fluorescence Weak Fluorescence Mislocalization of the Protein Construct
RELATED TECHNIQUES
Transfection Versus MicroinjectionAlternative or Supplemental Fluorescence TechniquesMonitoring Phosphoinositides by Immunocytochemistry
CONCLUDING REMARKS
REFERENCES
Visualizing Cellular Phosphoinositide Poolswith GFP-Fused Protein-Modules
Tamas Balla1* and Péter Várnai2
(Published 26 March 2002)
P R O T O C O L
1Unit of Molecular Signal Transduction, Endocrinology and Reproduction Research Branch, National Institute of Child Health & HumanDevelopment, National Institutes of Health, Bethesda, MD 20892, USA. 2Department of Physiology, Semmelweis University Medical School,Budapest, Hungary.
*Corresponding author. National Institutes of Health, Building 49, Room 6A35, 49 Convent Drive, Bethesda, MD 20892-4510, USA. Telephone,301-496-2136; fax, 301-480-8010; e-mail, [email protected]

www.stke.org/cgi/content/full/OC_sigtrans;2002/125/pl3 Page 2
Abstract
Inositol phospholipids are well known for their pivotal role in calcium signaling as precursors of important second mes-sengers generated in response to various stimuli. However, over the last 10 years, inositides have also emerged as uni-versal signaling components present in virtually every membrane of eukaryotic cells. These lipids are locally producedand degraded by the numerous inositide kinase and phosphatase enzymes, to control the recruitment and activity ofprotein signaling complexes in specific membrane compartments. The spatial and temporal constraints imposed onchanges in cellular inositides pose new challenges in finding experimental techniques through which such changes canbe examined. Taking advantage of the protein domains selected by evolution to recognize cellular phosphoinositides,we have created fluorescent molecules by fusing these domains to the improved version of enhanced green fluorescentprotein (EGFP); the distribution of these fusion proteins can be followed within live cells, thereby reporting on changesin phosphoinositides. Although this technique is one of the few that provide information on phosphoinositide dynamicsin live cells with subcellular resolution and has rapidly gained popularity, it also has limitations that need to be taken intoaccount when interpreting the data. Here, we summarize our experience in designing and using these constructs and re-view our position concerning the interpretation of the data obtained by this technique.
Introduction
Our desire to follow inositide changes at the single-cell level stems from the difficulty detecting the small and often rapid and transientchanges in inositide levels that occur in subcellular membrane compartments during activation of any of the numerous inositide kinase en-zymes. Labeling cells with myo-[3H]inositol has been widely used to measure phosphoinositide changes [for example, see (1)], but this tech-nique has several limitations. First, millions of cells must be labeled in order to obtain a sufficient signal and, depending on the labeling timeand the metabolic turnover rate of the apparently numerous metabolically distinct inositide pools, it is not certain whether isotopic equilibri-um is reached during the labeling period. Determination of the subcellular distribution of the inositides requires even more cells and lengthy
P R O T O C O L
Fig. 1. The principle of visualization ofphosphoinositides. The lipid-binding do-main of proteins that contain a sequencemotif with high enough affinity and speci-ficity to recognize individual phospho-inositide isomers are used to create aGFP fusion protein. When the fusion pro-tein is expressed in cells, it will follow thedistribution and dynamics of the particu-lar phosphoinositide. The PH domain ofPLCδ1 recognizes PI4,5P2, which is mostabundant in the plasma membrane andis rapidly hydrolyzed by PLC enzymesafter stimulation of G protein-coupledAT1 angiotensin II (Ang II) receptors. Thisis reflected in the translocation of the flu-orescent probe from the membrane tothe cytoplasm. In contrast, the PH do-main of Btk recognizes PI3,4,5P3, a lipidthat is not present in the membranes ofquiescent cells, but is formed after stimu-lation of most receptor tyrosine kinases,such as the platelet -derived growth fac-tor (PDGF) receptor. Here, the initiallycytoplasmic probe translocates to theplasma membrane after stimulation.DAG, diacylglycerol; Btk, Bruton’s tyro-sine kinase; IP3, inositol 1,4,5-triphosphate; PIP3, phosphatidylinositol 3-kinase; SH2, Src-homology domain 2; SH3, Src-homology domain 3; PH, pleckstrin homology; EF, calcium binding motif; X, conserved catalytic region 1 of phospholipaseC enzymes; Y, conserved catalytic region 2 of phospholipase C enzymes; C2, protein kinase C homology region 2, Ca2+-dependent phospholipid binding domain; PR, proline-rich region.

www.stke.org/cgi/content/full/OC_sigtrans;2002/125/pl3 Page 3
cell fractionation procedures, and the result may not be a reflection of what had been present in the intact cell. To rule out labeling efficiencyas a variable, total cellular mass of inositides has also been measured, often in combination with quantitation of the inositide head group thatis liberated from the extracted lipid species (2). These methods are usually very cumbersome and are also unable to resolve the small changesthat occur in subcellular compartments, especially against the higher background of the unchanging inositide pools.
To measure phosphoinositide changes in single cells, we explored the possibility that protein modules with high enough affinity and speci-ficity to bind the inositide head group of specific phosphoinositides could find these lipids within the cell. By fusing the lipid-binding pro-tein module to a green fluorescent protein (GFP), the changes ininositol lipids can be visualized within a single cell (3) (Fig. 1).The initial success of these efforts has been followed by nu-merous requests for use of these plasmids and a wealth ofquestions and helpful information from their users. The fol-lowing is a summary of what we hope is a useful collectionof knowledge for those who may not have all the back-ground and expertise they need to use this approach in theirexperimental systems. This protocol is divided into sectionsthat reflect all the steps involved in this method, but we pro-vide detailed procedures in only those sections coveringspecialized or unusual techniques. We assumed that thereader is familiar with common laboratory practices orthose specific to individual needs. We would like to empha-size that these comments are intended for less experiencedusers and not for the experts of this research field.
Creation of the Fusion Proteins
Protein domains for detecting inositol lipids
Four years ago, the only protein domains that seemed tobe useful for creating inositide-binding probes were thepleckstrin homology (PH) domains (4). Today the num-ber of protein domains known to bind inositides is largerand constantly increasing. FYVE domains (based on thefirst letters of four proteins containing this motif) (5) andPX-domains (described first in NADPH oxidase sub-units) (6) bind phosphatidylinositol 3-phosphate (PI3P)and perhaps other 3-phosphorylated inositides (7-9). Theall-helix phosphatidylinositol 4,5-bisphosphate(PI4,5P2)-binding domain of the AP180 adaptor proteinis a recent addition to the inositide-binding domains forwhich structure information is available (10). Because ofthe extensive characterization of the in vitro inositide-binding specificity of a series of PH domains (11), andthe information available regarding their use for imagingpurposes, PH domains are still the favorite choice forcreating GFP fusion proteins to monitor changes in in-ositide levels (Fig. 2). Several PH (and other) domainsthat have been used to detect various inositide species inlive cells are listed in Table 1.
The protein domains shown in Table 1 are either avail-able or can be easily duplicated. The literature describ-ing their behavior can be used as a reference. Further,the increasing number of domains that bind inositidesoffers the potential to develop new fusion proteins use-ful for following changes in a wide variety of intracel-lular lipids. However, just because a domain recognizesinositides with certain specificities in vitro does notnecessarily mean that a GFP fusion protein with thatdomain will show the cellular distribution of the samelipid when expressed in cells. Within a cell, the probe’s
P R O T O C O L
Fig. 2. Cellular localization of various inositide-binding domainsfused to GFP. (A) The PH domains of both Akt and ARNO bind toPI3,4,5P3 in vitro, and AktPH recognizes PI3,4,5P3 and PI3,4P2.These domains localize to the plasma membrane in cells stimulat-ed with PDGF or other growth factors that activate PI3K. (B) ThePH domains of oxysterol binding protein (OSBP) and phosphatidyl-inositol-4-phosphate adaptor protein-1 (FAPP1) recognize PI4P inin vitro binding assays. These domains primarily localize to the Gol-gi and to some other, yet unidentified, intracellular vesicular struc-tures. (C) The PX domain of p40phox and the FYVE domain ofEEA1, which both recognize PI3P in vitro, localize to intracellularvesicular structures corresponding to early endosomes and per-haps of other vesicular pools of the endocytic pathway. Althoughlipid binding is necessary for the localization of these proteins tothese cellular structures, it is not certain that their localization issolely determined by their binding to the lipids.

www.stke.org/cgi/content/full/OC_sigtrans;2002/125/pl3 Page 4
recognition of and affinity toa particular lipid is affectedby other membrane compo-nents and proteins involvedwith the same signalingcomplex in which the partic-ipation of the inositide is be-lieved to be important. Thiscomplexity must be consid-ered when designing a newlipid probe. Although theboundaries of new proteinmodules can be easily de-fined from alignments withtheir relatives already pre-sent in the Pfam conservedstructure database [(12)(http://pfam.wustl.edu)], inmany cases, the minimal do-main sequence may not besufficient for localization incells despite their binding tolipids in vitro. Several con-structs may need to be testedbefore making conclusionsabout their lipid recognitionwithin the cell, and the potential complexity of their interactions with other players in the signaling cascade should be considered.
It is not yet clear what fraction of the inositide pools are visualized by even the well-documented constructs. This aspect of inosi-tide recognition by the domains is still being studied, and it is quite possible that each of these modules only recognizes the lipidin a very specific molecular context and, therefore, does not image all of the target inositides in every cellular compartment (3).Therefore, it is imperative that the data be interpreted as an indication of inositide changes as “seen” only by the specific domainused.
For experimental controls, we recommend proteins mutated so that they do not bind lipids (Table 1). These controls help determinewhether the observed localizations reflect lipid binding or interaction with other protein molecules. The mutant proteins also serve ascontrols for determining adequate expression levels and for monitoring toxicity and morphological changes induced by the lipid-bind-ing protein.
Choosing a GFP-encoding plasmid
To create a fusion protein with enhanced GFP (EGFP), we usually subclone the lipid-binding domain in either the pEGFP-N1 orthe pEGFP-C1 plasmids that differ only in the position of the multiple cloning site relative to the EGFP sequence. We usuallyplace the PH domain relative to EGFP to reflect the domains’ natural location within the parent molecule (that is, when the PHdomain is in the NH2 terminus of the molecule, we place it before EGFP in the pEGFP-N1 plasmid). However, our experience isthat PH domains often work in both locations. Unless a specialized application is sought, such as fluorescence resonance energytransfer (FRET) or double labeling, EGFP is the best choice for simple fluorescence microscopy or confocal imaging. In additionto the original EGFP, spectrally shifted versions (EYFP and ECFP) are now available from Clontech oriented to make eitheran NH2-terminal or a COOH-terminal fusion protein. Whereas ECFP-fused constructs show a significantly lower signal withthe conventional 488-nm laser and filter sets optimized for EGFP work, the EYFP versions are effective in most standard applications.
Double labeling with two fusion proteins can be very useful, but it is not possible with the ECFP and EYFP pairs using a basicconfocal microscope without additional laser lines and special filter sets. Although the spectral characteristics of another fluores-cent protein, dsRed2, would make it a good partner to EGFP, it can form tetramers and seems to be less inert than EGFP.
The one limitation of the Clontech pEGFP plasmids designed for mammalian expression is their lack of a T7 or T3 promoter formaking complementary RNA (cRNA) for microinjection studies in oocytes. This obstacle can be overcome either by subcloningthe entire GFP construct into another suitable plasmid or by preparing recombinant proteins for microinjection.
A few additional issues must be considered when designing the completed DNA construct. A consensus translation start se-quence with a Kozak sequence should be inserted 5′ to the lipid-binding domain when in the NH2-terminal orientation (when us-
P R O T O C O L
GFP fusion protein Mutant Lipid Citation
PLCδ1-PH-GFP R40L PI4,5P2 (23,13)
Btk-PH-GFP R28C PI3,4,5P3 (24)
GRP1-PH-GFP R284C PI3,4,5P3 (25)
ARNO-PH-GFP R279C PI3,4,5P3 (26)
Akt-PH-GFP R25C PI3,4,5P3 and/or PI3,4P2 (27,28)
OSBP-PH-GFP R108E PI4P (29)
EEA1-2x-FYVE-GFP R1375L P3P (16)
p40phoxPX-GFP R58L PI3P (30,31)
Table 1. The PH domains that have been used to create fusion proteins for trackingchanges in the concentrations of cellular phosphoinositides.

www.stke.org/cgi/content/full/OC_sigtrans;2002/125/pl3 Page 5
ing pEGFP-N1), unless the natural start sequence is part of the sequence of the lipid-binding domain portion of the construct. Ifthe lipid-binding domain is in the COOH-terminal orientation (when using the pEGFP-C1), a stop codon should be inserted be-fore the cloning site at the 3′ end. This can prevent unexpected (although unlikely) complications caused by the few uncheckedamino acids that are added to the construct before one of the vector’s stop codons is reached. All oligonucleotide amplificationsteps should be performed with a high-fidelity DNA polymerase, such as Pfu.
Expression of the Fusion Proteins
Once it is decided what lipids are to be followed and what construct is to be used, the GFP fusion protein has to be introduced tothe cell. The easiest method for delivery of the GFP-fusion protein into the cells is by transfection with a mammalian expressionplasmid encoding the desired fusion protein. Although we describe the basic process for expressing fusion proteins by standardtransfection techniques, we refer the user to the manufacturer’s instructions for details about specific transfection methods. Alter-native methods for delivering the construct are microinjection of cRNA or of bacterially expressed and purified fusion proteins.
Materials
Bovine serum albumin (BSA)
Buffers for cell incubations [Phosphate-buffered saline (PBS) or Modified Krebs-Ringer Medium (Recipe 2)]
CaCl2
Cell culture dishes, plastic, 35 mm diameter [Falcon, 35-3001,PG Science (http://www.pgcscientifics.com) # 81-6570-01]
Coverslips, 25 mm [PG Science (http://www.pgcscientifics.com) no. 60-4884-25]
Clear nail polish
Cultured cells of individual choice
Ethanol
Fetal bovine serum (FBS)
Fluorescence mounting medium [Aqua Poly/Mount, PolySciences Inc. (http://www.polysciences.de)]
Glucose
Hepes, sodium salt (Na-Hepes)
KCl
MgSO4
Na2HPO4
Paraformaldehyde, electron microscopy (EM) grade
Poly-lysine (Sigma-Aldrich, #P-8920)
Plasmid DNA [EGFP-N1 or EGFP-C1, Clontech (http://www.clontech.com)]
Saponin
Transfection reagents (individual choice depending on the cells in use)
Equipment
Heated stage (optional, but required for live-cell imaging) [Harvard Apparatus (http://www.harvardapparatus.com)]
Laser confocal microscope (or fluorescence microscope)
Metal chambers to hold 25-mm coverslips [Molecular Probes (http://www.molecularprobes.com), #A-7816]
Microinjection apparatus (optional)
Objective heater (optional, but recommended for live-cell imaging) [Bioptechs (http://www.bioptechs.com)]
P R O T O C O L

www.stke.org/cgi/content/full/OC_sigtrans;2002/125/pl3 Page 6
Perfusion system (optional)
Phosphorimager with a blue laser line [STORM, Molecular Dynamics (http://www.mdyn.com)]
Recipes
Recipe 1: Poly-lysine
Prepare a 1:50 or 1:100 dilution of poly-lysine in sterile deionized water.
Note: Two concentrations are described because some cells require the higher concentrations, but others do not tolerate itwell. Cells should be plated using coverslips coated at each concentration to see which works best.
Recipe 2: Modified Krebs-Ringer Medium
NaCl 120 mM
KCl 3.7 mM
Na2HPO4 1.2 mM
CaCl2 1.2 mM
MgSO4 0.7 mM
Glucose 10 mM
Na-Hepes 20 mM
BSA 0.1%
Prepare in distilled water and adjust the pH to 7.4 with HCl. The solution can be stored at 4°C for 4 to 6 weeks after sterile-filtration.
Note: Do not include BSA when applying reagents that bind to BSA, such as ionomycin or wortmannin.
Recipe 3: 2% Paraformaldehyde
Dissolve EM grade paraformaldehyde in PBS at a concentration of 2% (w/v).
Heat in a chemical hood to 60°C until fully dissolved; leave loosely covered to allow gas to escape.
Allow the solution to cool to 20°C and adjust the pH to 7.4 with NaOH.
Note: This solution should be prepared fresh each time.
Recipe 4: Blocking Solution
Prepare a 10% solution of FBS in PBS.
Note: This solution should be prepared fresh each time.
Recipe 5: Antibody Diluent
FBS 10%
Saponin 0.2%
Prepare in PBS.
Note: This solution should be prepared fresh each time.
P R O T O C O L

www.stke.org/cgi/content/full/OC_sigtrans;2002/125/pl3 Page 7
Instructions
The following procedures describe general methods for preparing to analyze cells expressing GFP or GFP-fusion proteins by micro-scopic techniques.
Preparation of Poly-lysine-Coated Cover Slips
Because most plasticware used for cell culture work has high autofluorescence, we recommend that the cells be cultured andtransfected on poly-lysine-coated glass cover slips so that they can be viewed in the microscope after transfection without replat-ing. For certain cell types and transfections, it is more advantageous to transfect the cells in culture dishes and re-plate the trans-fected cells on the poly-lysine-coated coverslips before microscopy.
1. Rinse 25-mm coverslips with 98% ethanol in the cell culture hood and air dry.
2. Place one coverslip in each 30-mm diameter culture dish.
3. Add 1 ml of 1:50 or 1:100 dilution of Poly-lysine (Recipe 1) to cover the entire surface and allow to stand at room tempera-ture for 1 hour.
Note: Plate cells on coverslips coated at each concentration to determine which is best for the cells being studied.
4. Gently aspirate the solution from the coverslip and air dry before plating cells.
Transfecting Cells
Transfection protocols are available for the different reagents, and for each cell type the reagent and the procedure that gives thebest result can differ considerably. Therefore, we refer the user to the manufacturer’s instructions as far as the specifics for celltransfection are concerned. The optimal level of expression has to be determined for each cell type and expression construct. It isimportant to remember that the expressed proteins often interfere with the functions of the lipids that they recognize, and in highconcentrations the lipid-binding fusion proteins are often toxic to the cells.
As an important control, we recommend that parallel cultures be transfected with a mutant version of the lipid-binding domainthat does not bind lipids. For example, many constructs localize to the nucleus, but this localization is not dependent on lipidbinding; thus, lipid-mediated localization can be confirmed by comparing the distribution of the native lipid-binding domain tothat of the nonlipid binding mutant. We also recommend transfecting cells with the GFP protein alone without the lipid-bindingdomain. These two controls help to track phenotypic changes and potential cellular toxicity associated with overexpression of thelipid-binding domain, as well as to serve as controls for monitoring localization that accurately reflects lipid binding.
1. Plate ~50,000 cells directly onto the poly-lysine-coated coverslips in 2 ml of the appropriate culture medium and grow to thedensity best suited for transfection (usually 2 days).
2. Transfect the cells with the desired plasmid DNA construct using a method that is most appropriate for the cells.
3. Grow the cells for 24 hours to allow expression of the transfected protein.
4. Incubate cells in serum-free culture medium for 6 to 10 hours to render them quiescent before microscopy.
Note: We do not recommend growing the cells longer than 34 hours total after transfection, because of the potential toxici-ty of the lipid-binding fusion protein and the ability of the expressed protein to interfere with the functions of the lipids theybind.
Confirming the Integrity of the Expressed Protein
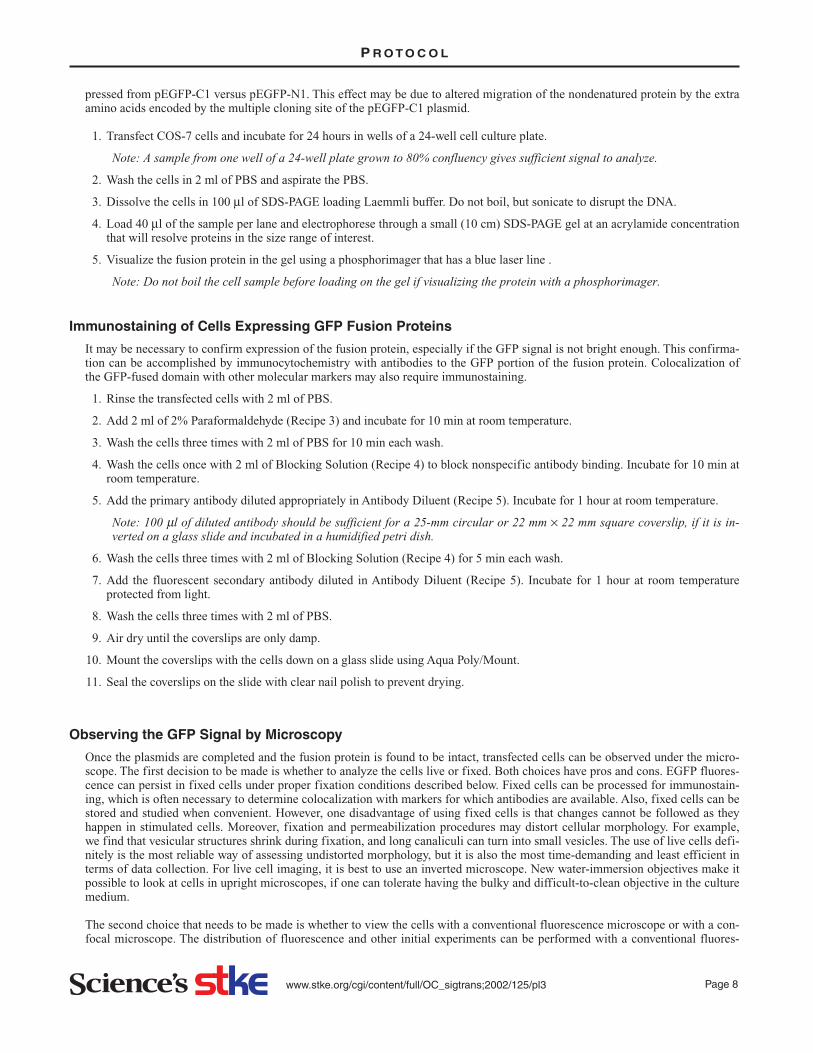
In addition to sequencing the DNA construct before performing any transfections, it is important to determine whether the fusionprotein is intact once expressed in mammalian cells. Often, the fusion protein is cleaved within the cell so that the green fluores-cence is not coming from the molecule that was designed. Our experience is that free EGFP is more often present (probably as acleavage product) when using the pEGFP-N1 plasmids than with the COOH-variant (pEGFP-C1), but in one case we found thata protein expressed in COS-7 cells was cut in half when placed COOH-terminal to EGFP. We recommend analyzing cell lysatesby sodium dodecyl sulfate polyacrylamide gel electrophoresis (SDS-PAGE) either using a phosphorimager equipped with a bluelaser line (described below) or by conventional Western blotting techniques using antibodies against the GFP portion of the fu-sion protein. We find that in many cases, samples that are boiled and analyzed by Western blotting show more degradation prod-uct than those analyzed directly from the gel. The electrophoretic mobility of the EGFP molecule is clearly different when ex-
P R O T O C O L
www.stke.org/cgi/content/full/OC_sigtrans;2002/125/pl3 Page 8
pressed from pEGFP-C1 versus pEGFP-N1. This effect may be due to altered migration of the nondenatured protein by the extraamino acids encoded by the multiple cloning site of the pEGFP-C1 plasmid.
1. Transfect COS-7 cells and incubate for 24 hours in wells of a 24-well cell culture plate.
Note: A sample from one well of a 24-well plate grown to 80% confluency gives sufficient signal to analyze.
2. Wash the cells in 2 ml of PBS and aspirate the PBS.
3. Dissolve the cells in 100 µl of SDS-PAGE loading Laemmli buffer. Do not boil, but sonicate to disrupt the DNA.
4. Load 40 µl of the sample per lane and electrophorese through a small (10 cm) SDS-PAGE gel at an acrylamide concentrationthat will resolve proteins in the size range of interest.
5. Visualize the fusion protein in the gel using a phosphorimager that has a blue laser line .
Note: Do not boil the cell sample before loading on the gel if visualizing the protein with a phosphorimager.
Immunostaining of Cells Expressing GFP Fusion Proteins
It may be necessary to confirm expression of the fusion protein, especially if the GFP signal is not bright enough. This confirma-tion can be accomplished by immunocytochemistry with antibodies to the GFP portion of the fusion protein. Colocalization ofthe GFP-fused domain with other molecular markers may also require immunostaining.
1. Rinse the transfected cells with 2 ml of PBS.
2. Add 2 ml of 2% Paraformaldehyde (Recipe 3) and incubate for 10 min at room temperature.
3. Wash the cells three times with 2 ml of PBS for 10 min each wash.
4. Wash the cells once with 2 ml of Blocking Solution (Recipe 4) to block nonspecific antibody binding. Incubate for 10 min atroom temperature.
5. Add the primary antibody diluted appropriately in Antibody Diluent (Recipe 5). Incubate for 1 hour at room temperature.
Note: 100 µl of diluted antibody should be sufficient for a 25-mm circular or 22 mm × 22 mm square coverslip, if it is in-verted on a glass slide and incubated in a humidified petri dish.
6. Wash the cells three times with 2 ml of Blocking Solution (Recipe 4) for 5 min each wash.
7. Add the fluorescent secondary antibody diluted in Antibody Diluent (Recipe 5). Incubate for 1 hour at room temperatureprotected from light.
8. Wash the cells three times with 2 ml of PBS.
9. Air dry until the coverslips are only damp.
10. Mount the coverslips with the cells down on a glass slide using Aqua Poly/Mount.
11. Seal the coverslips on the slide with clear nail polish to prevent drying.
Observing the GFP Signal by Microscopy
Once the plasmids are completed and the fusion protein is found to be intact, transfected cells can be observed under the micro-scope. The first decision to be made is whether to analyze the cells live or fixed. Both choices have pros and cons. EGFP fluores-cence can persist in fixed cells under proper fixation conditions described below. Fixed cells can be processed for immunostain-ing, which is often necessary to determine colocalization with markers for which antibodies are available. Also, fixed cells can bestored and studied when convenient. However, one disadvantage of using fixed cells is that changes cannot be followed as theyhappen in stimulated cells. Moreover, fixation and permeabilization procedures may distort cellular morphology. For example,we find that vesicular structures shrink during fixation, and long canaliculi can turn into small vesicles. The use of live cells defi-nitely is the most reliable way of assessing undistorted morphology, but it is also the most time-demanding and least efficient interms of data collection. For live cell imaging, it is best to use an inverted microscope. New water-immersion objectives make itpossible to look at cells in upright microscopes, if one can tolerate having the bulky and difficult-to-clean objective in the culturemedium.
The second choice that needs to be made is whether to view the cells with a conventional fluorescence microscope or with a con-focal microscope. The distribution of fluorescence and other initial experiments can be performed with a conventional fluores-
P R O T O C O L

www.stke.org/cgi/content/full/OC_sigtrans;2002/125/pl3 Page 9
cence microscope using filters suitable forfluorescein isothiocyanate (FITC) detection(excitation at 470 to 490 nm, emission at500 to 550 nm). It is not necessary to ex-amine the cells immediately with a confo-cal microscope. In fact, it is more difficultto get a general impression of how cells ex-pressing the construct look in a confocalmicroscope than by looking at them with afluorescence microscope. Single cells, es-pecially COS cells, show enormous vari-ability in their shape, size, and general ap-pearance, and often the level of expressionchanges their appearance. One of the great-est diff iculties is recognizing patternscaused by the expressed proteins that arenot obvious given the morphological vari-ability of the cells. Conventional fluores-cence microscopy is a significantly moreefficient way to browse through many cellsand notice trends in cellular morphology.
Moreover, many cells are flat in culture (es-pecially COS cells), so there is not muchbenefit in analyzing the cells in a confocalmicroscope. Confocal microscopy can besaved for recording cells and changes influorescence distribution once the condi-tions have been optimized with a fluores-cence microscope. An additional advantageof viewing the cells with a fluorescencemicroscope is that autofluorescence oftencan be distinguished from the GFP signalbecause its color is different from the greencolor of GFP. It is important to rememberthat confocal microscopes record light in-tensity only, not colors; the “color” given isartificial. Therefore, in each case, the aut-ofluorescence needs to be determined sothat the GFP signal can be reliably used.For this, observation of a set of untransfect-ed cells is a very useful control.
When starting to collect confocal imagedata, our experience is that people savehundreds of pictures, only to discover laterthat few of the saved data are good enoughto be used. It is very useful to documentthe various “phenotypes” of cells that maybe seen, as a function of expression levels.Often, this can be done using conventionalmicroscopy. We suggest that only picturesof high quality be saved. Also, it is not nec-essary to record images of a series of z-sec-tions through the cell, unless three-dimen-sional reconstruction is critical to demon-strate the important observations. When an-alyzing live cells, one major advantage ofconfocal microscopy is its ability to recordtime-lapsed images sequentially after astimulus is applied to the cells. In confocal
P R O T O C O L
Fig. 3. Quantitation of changing fluorescence distribution in cells expressingPH domain-GFP fusion proteins. (A) Line intensity histograms clearlydemonstrate the localization of PLCδ1PH-GFP in the plasma membrane inquiescent cells and its translocation to the cytosol after stimulation by aCa2+-mobilizing hormone. However, the line intensity histogram representsone arbitrarily chosen cross section of the image. (B) Pixel intensity his-tograms analyze a larger area of the cell and plot the distribution of pixels asa function of their intensities. The larger percentage of high-intensity pixels(reflecting the high intensity in the membrane ruffles), together with the de-crease in the medium-intensity ones (reflecting the drop in the cytosolic fluo-rescence), are an indication of translocation of the probe from the cytosol tothe membrane in stimulated cells.

www.stke.org/cgi/content/full/OC_sigtrans;2002/125/pl3 Page 10
microscopes, the speed of scanning determines how fast one can record an image, but in general, the faster the scan, the poorerthe quality of the individual pictures.
Finally, one of the greatest difficulties is keeping the cell in focus after stimulation, because of shape changes that often occur inresponse to the stimulus (HEK 293 cells are especially lively). This change in position of the originally imaged plane can makethe whole recording unsuitable. We are aware of software programs being developed to compensate for “focal-drift” due to cellmovements. These new developments may be available for some confocal imaging systems soon.
The most demanding part of the analysis of time-lapsed sequences is the quantification of data. When the fluorescence redistri-bution is obvious, it is sufficient to document this information qualitatively as a series of pictures or movies that describe what ishappening. However, when determining a dose-response relationship, comparing the relative effectiveness of two stimuli, or in-vestigating the efficacy or potency of an inhibitor, it is necessary to quantify the changes. The most common way is to create aline-intensity histogram through a selected line spanning the image. The highest intensities should not saturate, which requires afine optimization of the dynamic range before recording in 8-bit systems that only have 256 levels of intensity (Fig. 3). Satura-tion is less of a problem with the 12-bit systems that have 4096 levels of intensity. An alternative method of quantifying the re-sults is to generate a pixel-intensity histogram over the entire area, or only a selected area, of the cells (Fig. 3). Redistribution offluorescence is then reflected in the change of the distribution of pixel intensities. The variability of the cell population and therequirement for analysis of a large number of cells to obtain reliable quantitative estimates of the fluorescence changes remainthe largest obstacles to obtaining reliable, reproducible results.
Fixing EGFP-expressing cells
Note: This is the same fixation conditions that are used to prepare samples for immunofluorescent staining.
1. Rinse the transfected cells with 2 ml of PBS.
2. Add 2 ml of 2% paraformaldehyde (Recipe 3) and incubate for 10 min at room temperature.
3. Wash the cells 3 times with 2 ml of PBS for 10 min each wash.
4. Air dry until the coverslips are only damp.
5. Mount the coverslips with the cells down on a glass slide using fluorescence mounting medium.
6. Seal the coverslips on the slide with clear nail polish to prevent drying.
7. View the cells in the microscope or store at −20°C.
Choosing a cell
Looking into the fluorescence microscope, usually one can see cells with a wide range of fluorescence intensities. Depending onthe quality of the microscope and the intensity of the light source, sometimes only the cells with the highest expression levels arevisible. As a general rule, it is best to study cells in which the GFP signal is as low as possible but is still clearly distinguishablefrom the autofluorescence of untransfected control cells. It is crucial to establish the proper signal-to-noise ratio. Unfortunately,there is no general recipe to follow, because the sensitivities of confocal microscopes or of the cameras attached to conventionalfluorescence microscopes vary from one manufacturer to another. However, we can recommend the following steps.
1. Observe the transfected cells and, if necessary, the control nontransfected cells using the fluorescence setting of the confocalmicroscope fitted with filters suitable for FITC analysis (470- to 490-nm excitation and 500- to 550-nm emission).
Note: Often, a separate nontransfected cell control is not necessary, because even in the transfected samples, not all cellsexpress the fusion proteins. The nontransfected cells in the population can usually be distinguished by their autofluores-cence, allowing easy identification of transfected and nontransfected cells from the same sample when viewed using the flu-orescent setting.
2. Choose cells in which expression levels are just high enough to be resolved above the background autofluorescence, and thatare not obviously unhealthy.
Note: Analysis of cells that are unhealthy and suffering from toxicity induced by the expression of the fusion protein shouldbe avoided. For example, cells that round up and are about to detach [a common phenomenon with cells expressing veryhigh levels of a fusion protein consisting of the PH domain of phospholipase (PLC) and GFP (PLCδ1PH-GFP) (13)] arenot likely to behave normally. Another indication of toxicity in transfected cells is the appearance of large intracellularvesicles.
3. Record an image of the cell by confocal microscopy using 3% to 5% of the maximum laser power (to avoid photobleachingand damaging the cells) with a scan speed of about 1 s.
4. Save only images of high resolution and quality.
P R O T O C O L

www.stke.org/cgi/content/full/OC_sigtrans;2002/125/pl3 Page 11
Note: It is not necessary to record images of a series of z-sections through the cell, unless 3D-reconstruction is critical todemonstrate the important observations.
Time-lapse analysis of live cells
An important and often unappreciated problem in live cell imaging is the proper temperature of the cells that are being observed.In an inverted microscope, even when the medium in the observation chamber is kept at the desired temperature by a heatedstage, the objective acts as a heat sink, keeping the cells in the observation field at a temperature near that of the objective. Be-cause lasers require proper cooling and, therefore, the rooms are usually kept cool, this means that even on a heated stage therecorded cells are examined at room temperature, which significantly slows many processes. Before we learned how serious thisproblem was, we had attributed to mere bad luck the fact that very often the only cell that showed no change after stimulationwas the one we had recorded, while all others in the surroundings showed a very nice response. The best solution that we can rec-ommend is to use an objective heater available from Bioptechs (http://www.bioptechs.com). However, the heater collar does notfit all objectives, and heating may be damaging to the objective if it is warmed very fast from a cold temperature. Alternativemethods of maintaining the proper temperature include perfusing the cells with a high flow of warm medium or using a hair dry-er to keep the objective at the proper temperature during live cell imaging.
1. Transfer and secure the coverslips with the cells in the metal chamber and add 1 ml of prewarmed (37°C) Modified Krebs-Ringer Solution (Recipe 2). Ideally, include cells transfected with lipid-binding fusion protein construct, nontransfected con-trol cells, and cells transfected with a control construct that does not bind lipids.
2. Observe the cells with a confocal microscope fitted with a lens-heater collar and a heated stage, as described above. Record aset of images of the unstimulated cells.
3. Set the software to record time-lapsed images every 5 s to 20 s (depending on the speed of the response), and at a scanningspeed of 1.5 s to 2.5 s, to capture the cellular response with proper image resolution.
4. Start data acquisition and add stimuli or inhibitors after the first few images have been taken. Stimuli that activate phos-phatidylinositol 3-kinases (PI3Ks) or PLC should evoke redistribution of probes as their lipid-binding partners change be-cause of the enzyme’s action.
5. Quantify the results off line (that is, after completing an experiment) with either a line-intensity histogram through a selectedline spanning the image or with a pixel-intensity histogram over the entire area, or only a selected area, of the cells.
Troubleshooting
No Bacterial Colonies
The pEGFP plasmids have the kanamycin selection marker, so bacteria replicating the plasmids must be grown on kanamycin-containing plates and not ampicillin-containing plates. This should be the first thought when no colonies are found after transfor-mation of bacteria during the subcloning to create the transfection plasmid. Problems with subcloning, ligation reaction, or bacte-rial transformation can also result in no bacterial gowth, but discussion of these variables is beyond the scope of this article.
No Green Fluorescence
However trivial it may sound, the most common reason for not seeing fluorescence is inappropriate microscope settings. Confo-cal microscopes used for fluorescence imaging are fairly complicated and sometimes intimidating instruments for novices, andthere are several filters and light directions that must be set properly to see the fluorescent signal. Once the cells are found withtransmitted light, one has to see the blue light coming through the objective to make sure that the illumination and the light passis properly set. It is very useful to have a slide of fixed GFP-expressing cells to use as a control.
If the microscope settings are right and there are still no GFP positive cells (yet the autofluorescence is visible with a 40× or higher objec-tive), then the problem is with the transfection. Transfection problems can be caused by several factors, including inaccurate subcloning,impure plasmid for transfection, and inappropriate transfection conditions for the cells. Even transfected primary cultured cells shouldhave a few positive cells. To determine whether the transfection procedure or the DNA construct is the source of the problem, cells trans-fected with the original pEGFP plasmid should be used as transfection control. If these cells are positive for GFP fluorescence, then themost likely source of the problem is the fusion protein construct. The fusion protein-encoding DNA construct could be defective by har-boring a stop codon or a frame-shift either because of wrong design or by mutation. The fusion protein-encoding plasmids should be con-firmed by DNA sequence analysis, and the expression of the full-length protein should be confirmed by SDS-PAGE, as described above.
P R O T O C O L

www.stke.org/cgi/content/full/OC_sigtrans;2002/125/pl3 Page 12
Weak Fluorescence
If there are positive cells but their fluorescence is weak, the mi-croscope may not be set properly. Cells transfected with EGFPalone can serve as a control for this. If these EGFP-expressingcells are bright, but the fusion protein-expressing cells are weak-ly fluorescent, then there may be problems inherent to the fusionprotein. Our experience is that the larger the protein fused toGFP, the weaker its fluorescence may be. This could be relatedto difficulty in the folding of GFP as part of a larger protein.With the protein constructs listed (Table 1), low levels of fluo-rescence are usually caused by transfection problems, which arerevealed by few cells showing fluorescence rather than by manycells showing weak fluorescence.
Mislocalization of the Protein Construct
Appearance of large “aggregates” in the cytoplasm
The localization of the described lipid-binding domains (Table1) to specific inositides in various cellular compartments iswell documented. Here, we discuss localization issues that arenot related to interactions with phospholipids and are consid-ered to be technical problems rather than new scientific “dis-coveries.” High concentrations of the fusion protein are usuallyresponsible for these problems. Some constructs may have fold-ing problems, which can result in the formation of large fluo-rescent “aggregates” that are stuck in various intracellularmembranes, mostly in the Golgi. We experienced such prob-lems with the EBFP-fused PLCδ1PH and with some chimericconstructs, such as one constructed from the PH domains ofPLCδ1 and p130, which appeared to have folding problems. Afraction of the expressed protein still appeared to fold properlyand function as expected (Fig. 4). It is important to recognizethis aggregation artifact and not to mistake it for true localiza-tion. One can try to reduce this problem by expressing less ofthe fusion protein and by lowering the temperature by 5° to 7°Cduring transfection and culture. However, we did not have greatsuccess with these manipulations once the construct showedthis aggregation behavior.
No localization is observed on the membrane where thelipid is expected to be
If GFP fluorescence is observed, but is not associated with themembrane, the first test should be to confirm that the expressionconstruct contains the sequence for the lipid-binding domain.Preparations of pEGFP plasmid DNAs often contain a ~500-bpfragment that is not the result of digestion by restriction en-zymes. It is usually faint but can be mistaken for an insert whenconfirming the DNA construct by restriction enzyme digestionanalysis. This is especially problematic because many PH do-mains are encoded by DNA sequences of ~500 bp.
An alternative explanation may be poor signal-to-noise ratio re-sulting from the low concentration of the lipid produced. Theamount of lipid that is produced and is available for binding by afluorescent probe is limited. Therefore, in a cell that expresses ahigh concentration of the fusion protein, the membrane-boundfraction may not be distinguishable from the high cytosolic in-tensity of unlocalized fusion protein. This is another reason tostudy cells that express low concentrations of the fusion protein.
P R O T O C O L
Fig. 4. Heterogeneity of cells expressing PLCδ1PH-GFP,and artifacts in the localization of fluorescent protein do-mains. (A) The heterogeneous morphology of COS-7cells expressing the PLCδ1PH-GFP construct. Cells ex-pressing high concentrations of the protein detach, be-come round, and develop multiple intracellular vesicles.These cells are usually above the focal plane of the flatcells that are still attached. (B) A cell expressing a GFPfusion protein that displays a folding problem. The pro-tein is highly enriched in the Golgi, but also shows somecytoplasmic aggregates. Cells that express only GFPcan also show some membrane ruffling that can be mis-taken for membrane localization, a phenomenon calledpseudolocalization (arrows).

www.stke.org/cgi/content/full/OC_sigtrans;2002/125/pl3 Page 13
When PI4,5P2 concentrations were monitored with PLCδ1PH-GFP, we did not observe this sort of saturation, probably because ofthe compensatory increase in the amount of PI4,5P2 that is produced in cells expressing larger amounts of this lipid-binding pro-tein. Compensatory increases are less likely to occur with lipids that are only formed in response to stimulation, such as phos-phatidylinositol 3,4,5-trisphosphate (PI3,4,5P3).
Clear plasma membrane localization in cells that are very flat, such as COS cells, can also be difficult to see. For example, evenin the case of the PLCδ1PH-GFP, which undoubtedly binds to PI4,5P2 in the plasma membrane, it is not so easy in a very flatcell to recognize that the construct is membrane-bound even in a confocal microscope. Comparing the PLCδ1PH-GFP-express-ing cells with cells expressing only GFP can also help to recognize membrane localization.
A further observation of practical importance is that live cells lose localization of the PLCδ1PH-GFP (and perhaps of other do-mains of less robust localization) if they are kept at room temperature for more than 15 min to 20 min. The reason for this has notbeen explored in detail, but it may be that lipid synthesis is slowed because of either adenosine triphosphate (ATP) depletion orthe physicochemical properties of the membrane change. Importantly, warming the cells to 37°C does not correct the situationwithin 30 min. Thus, live cell imaging should be performed using a temperature-controlled microscope system.
Nuclear localization
All of the domains listed in Table 1 can penetrate the nuclear pore and enter the nucleus, although their movement in and out isclearly limited. More importantly, although many of them (Grp1-PH, ARNO-PH, Btk-PH, OSBP-PH) show very prominent nu-clear localization, this localization is also observed with mutants that do not bind the lipids and, therefore, does not reflect lipidbinding. It is very likely that the numerous basic residues characteristic of these domains are responsible for their nuclear local-ization; this is supported by the fact that algorithms based on the primary sequences of these proteins accurately predict their nu-clear localization. However, if the protein binds to a lipid that is already present and abundant during expression, such as PI4,5P2,the protein will bind the lipid and will not appear in the nucleus, provided that the amount of the expressed protein does not satu-rate the lipid available for binding. Thus, choosing cells in which the expression levels are low also can decrease localization tothe nucleus.
True localization versus “pseudolocalization”
True localization has to be confirmed by several criteria. The localization of the fusion protein should follow the lipid changesthat are evoked by physiological or pharmacological means. For example, PI3K inhibitors, such as wortmannin, prevent the for-mation of 3-phosphorylated lipid products, so treatment of the transfected cells with these inhibitors should eliminate localiza-tion of fluorescent probes that recognize 3-phosphorylated lipids.
Another important control, designed to determine whether localization of the fusion protein reflects true changes in lipid concen-tration, is a mutant version of the fusion protein in which the lipid-binding domain is disrupted. Cells transfected with these mu-tant proteins should not localize to the same compartments as the wild-type lipid-binding fusion proteins.
However, even with these criteria satisfied, a phenomenon that we call “pseudolocalization” can occur. In very flat cells thatexpress only GFP, which shows no true localization, the edge of the cell or some membrane ruffles can often appear as a high-intensity area because of the cross sections in the imaged plane. Membrane ruffling is a common response of cells to stimulithat alter inositol phospholipids and their concentrations; it is regulated through PI3K-dependent pathways and can be oftenreversed with PI3K inhibitors. These effects can give the impression that the construct localizes to membrane ruffles in stimu-lated cells even when it does not actually bind to PI3,4,5P3. Comparing the fusion protein-expressing cells with control cellsexpressing only GFP is essential to resolving true versus pseudolocalization. A useful trick is to monitor changes in cytoplas-mic intensity. In the case of true localization, cytoplasmic fluorescence decreases when the protein redistributes to the mem-brane. This decrease never happens with pseudolocalization. The decrease in the cytoplasmic fluorescence can be judged bestby observing an increase in contrast between the cytoplasm and the nucleus, which appears brighter as the cytoplasmic fluo-rescence decreases.
Translocation is caused by “displacement” rather than lipid changes
The PLCδ1PH and some other PH domains can bind the soluble inositol phosphate counterpart of the inositol lipids with compa-rable or even higher apparent affinity than the lipid itself. This can complicate interpretations, because the increase in the level ofinositol 1,4,5-trisphosphate (IP3) may be as important in “displacing” the PLCδ1PH-GFP from the membrane lipid PI4,5P2, asthe decrease in the membrane lipid after PLC activation (14). Our data suggest that although IP3 can indeed cause translocationof PLCδ1PH-GFP when present at very high concentrations, it is probably not a major component of the translocation responseunder physiological stimulatory conditions; it is the decrease of PI4,5P2 that is more important in the release of the fluorescentprotein from the membrane (15). Nevertheless, this possibility needs to be considered in the interpretation of the results obtainedby these probes.
P R O T O C O L
www.stke.org/cgi/content/full/OC_sigtrans;2002/125/pl3 Page 14
Related Techniques
Transfection Versus Microinjection
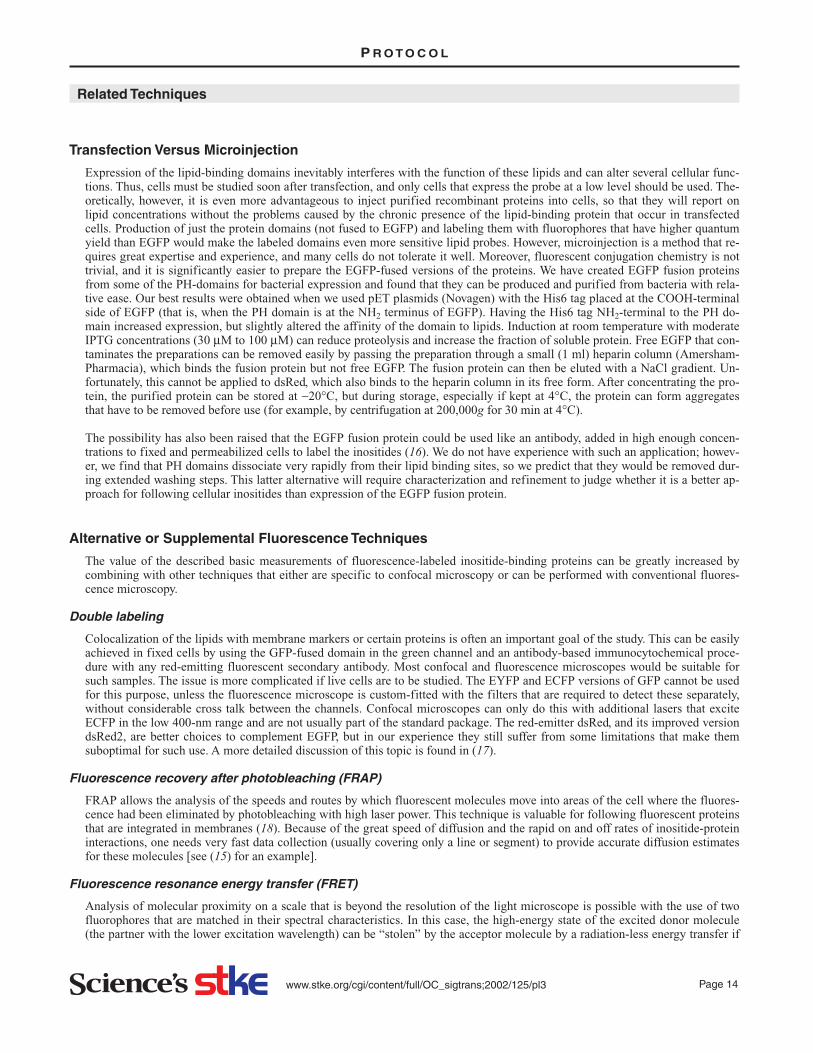
Expression of the lipid-binding domains inevitably interferes with the function of these lipids and can alter several cellular func-tions. Thus, cells must be studied soon after transfection, and only cells that express the probe at a low level should be used. The-oretically, however, it is even more advantageous to inject purified recombinant proteins into cells, so that they will report onlipid concentrations without the problems caused by the chronic presence of the lipid-binding protein that occur in transfectedcells. Production of just the protein domains (not fused to EGFP) and labeling them with fluorophores that have higher quantumyield than EGFP would make the labeled domains even more sensitive lipid probes. However, microinjection is a method that re-quires great expertise and experience, and many cells do not tolerate it well. Moreover, fluorescent conjugation chemistry is nottrivial, and it is significantly easier to prepare the EGFP-fused versions of the proteins. We have created EGFP fusion proteinsfrom some of the PH-domains for bacterial expression and found that they can be produced and purified from bacteria with rela-tive ease. Our best results were obtained when we used pET plasmids (Novagen) with the His6 tag placed at the COOH-terminalside of EGFP (that is, when the PH domain is at the NH2 terminus of EGFP). Having the His6 tag NH2-terminal to the PH do-main increased expression, but slightly altered the affinity of the domain to lipids. Induction at room temperature with moderateIPTG concentrations (30 µM to 100 µM) can reduce proteolysis and increase the fraction of soluble protein. Free EGFP that con-taminates the preparations can be removed easily by passing the preparation through a small (1 ml) heparin column (Amersham-Pharmacia), which binds the fusion protein but not free EGFP. The fusion protein can then be eluted with a NaCl gradient. Un-fortunately, this cannot be applied to dsRed, which also binds to the heparin column in its free form. After concentrating the pro-tein, the purified protein can be stored at −20°C, but during storage, especially if kept at 4°C, the protein can form aggregatesthat have to be removed before use (for example, by centrifugation at 200,000g for 30 min at 4°C).
The possibility has also been raised that the EGFP fusion protein could be used like an antibody, added in high enough concen-trations to fixed and permeabilized cells to label the inositides (16). We do not have experience with such an application; howev-er, we find that PH domains dissociate very rapidly from their lipid binding sites, so we predict that they would be removed dur-ing extended washing steps. This latter alternative will require characterization and refinement to judge whether it is a better ap-proach for following cellular inositides than expression of the EGFP fusion protein.
Alternative or Supplemental Fluorescence Techniques
The value of the described basic measurements of fluorescence-labeled inositide-binding proteins can be greatly increased bycombining with other techniques that either are specific to confocal microscopy or can be performed with conventional fluores-cence microscopy.
Double labeling
Colocalization of the lipids with membrane markers or certain proteins is often an important goal of the study. This can be easilyachieved in fixed cells by using the GFP-fused domain in the green channel and an antibody-based immunocytochemical proce-dure with any red-emitting fluorescent secondary antibody. Most confocal and fluorescence microscopes would be suitable forsuch samples. The issue is more complicated if live cells are to be studied. The EYFP and ECFP versions of GFP cannot be usedfor this purpose, unless the fluorescence microscope is custom-fitted with the filters that are required to detect these separately,without considerable cross talk between the channels. Confocal microscopes can only do this with additional lasers that exciteECFP in the low 400-nm range and are not usually part of the standard package. The red-emitter dsRed, and its improved versiondsRed2, are better choices to complement EGFP, but in our experience they still suffer from some limitations that make themsuboptimal for such use. A more detailed discussion of this topic is found in (17).
Fluorescence recovery after photobleaching (FRAP)
FRAP allows the analysis of the speeds and routes by which fluorescent molecules move into areas of the cell where the fluores-cence had been eliminated by photobleaching with high laser power. This technique is valuable for following fluorescent proteinsthat are integrated in membranes (18). Because of the great speed of diffusion and the rapid on and off rates of inositide-proteininteractions, one needs very fast data collection (usually covering only a line or segment) to provide accurate diffusion estimatesfor these molecules [see (15) for an example].
Fluorescence resonance energy transfer (FRET)
Analysis of molecular proximity on a scale that is beyond the resolution of the light microscope is possible with the use of twofluorophores that are matched in their spectral characteristics. In this case, the high-energy state of the excited donor molecule(the partner with the lower excitation wavelength) can be “stolen” by the acceptor molecule by a radiation-less energy transfer if
P R O T O C O L

www.stke.org/cgi/content/full/OC_sigtrans;2002/125/pl3 Page 15
the two molecules are within a certain distance (~10 nm). In practical terms, fluorophores can yield information about their prox-imity if the researcher uses excitation with a wavelength that excites only the donor molecules (not the acceptors), and monitorsthe emission of the donor as well as the acceptor. When the two molecules are within “FRET-distance,” an increase in the intensi-ty at the emission wavelength that is characteristic of the acceptor, and a decrease in the intensity at the emission wavelength ofthe donor, can be observed. Analysis of this energy transfer requires a specialized microscope with the proper excitation capabili-ties and detectors that analyze the two emission wavelengths simultaneously. However, this application is common (19), althoughit is not without certain caveats (20). An example of using FRET to monitor PLC activity using the PH domain of PLCδ1PH waspublished recently (15). An alternative and perhaps more reliable way of analyzing FRET is based on fluorescence lifetime imag-ing (FLIM). Because in reality it is not possible to excite only the donor fluorophore during excitation, it is more difficult to esti-mate FRET just by analyzing emission intensities. FLIM takes advantage of the fact that the lifetime of combined fluorescenceincreases when there is energy transfer between the donor and acceptor fluorophores. Therefore, microscopes that are able to ana-lyze FLIM have been also introduced for the analysis FRET (21).
Monitoring Phosphoinositides by Immunocytochemistry
An alternative method for visualizing phosphoinositides in single cells is by conventional immunocytochemistry using antibodiesto the individual phosphoinositide species. Such antibodies have been developed in several laboratories and some are commer-cially available. Although we have not used these antibodies to immunolabel inositides, many investigators communicated to ustheir difficulties in obtaining clear results with them. In addition, the usual specificity issue must be considered; fixation and per-meabilization procedures appear to be critical in preserving the lipids yet allowing their accessibility to the antibodies. A nice ex-ample comparing pictures obtained by PLCδ1PH-GFP and an antibody to PI4,5P2 is provided in (22).
Concluding Remarks
Monitoring phosphoinositides with GFP-lipid binding domain fusion proteins allows analysis of the true dynamics of cellular phos-phoinositides with subcellular resolution. Although this approach is an important step toward understanding inositide-based regula-tory processes, it has limitations that should be always kept in mind. Like many similar techniques, this one introduces distortionsbecause binding of the probe impairs the ability of the lipids to perform their normal regulatory functions, and it also may sequesterlipids into certain compartments. On the other hand, because it relies on the same interactions that govern how inositides affect theirmolecular targets, understanding not only the values but the limitations of these measurements will certainly enrich our knowledgeabout the molecular details of inositol lipid-protein interactions.
References1. S. B. Shears, in Signalling by Inositides: A Practical Approach, S. B. Shears, Ed. (Oxford University Press, New York, 1997), pp. 33-53.2. R. A. J. Challiss, in Signalling by Inositides: A Practical Approach, S. B. Shears, Ed. (Oxford University Press, New York, 1997), pp. 151-165.3. T. Balla, T. Bondeva, P. Várnai, How accurately can we image inositol lipids in live cells? Trends Pharmacol. Sci. 21, 238-241 (2000).4. M. A. Lemmon, M. Falasca, K. M. Ferguson, J. Schlessinger, Regulatory recruitment of signalling molecules to the cell membrane by plekstrin-homology
domains. Trends Cell Biol. 7, 237-242 (1997).5. H. Stenmark, R. Aasland, B. H. Toh, A. D’Arrigo, Endosomal localization of the autoantigen EEA1 is mediated by a zinc-binding FYVE finger. J. Biol. Chem. 271,
24048-24054 (1996).6. C. P. Ponting, Novel domains in NADPH oxidase subunits, sorting nexins, and PtdIns 3-kinases: binding partners of SH3 domains? Protein Sci. 5, 2353-2357
(1996).7. S. Misra, J. H. Hurley, Crystal structure of a phosphatidylinositol 3-phosphate-specific membrane-targeting motif, the FYVE domain of Vps27p. Cell 97, 657-666
(1999).8. T. G. Kutateladze, K. D. Ogburn, W. T. Watson, T. deBeer, S. D. Emr, C. G. Burd, M. Overduin, Phosphatidylinositol 3-phosphate recognition by the FYVE domain.
Mol. Cell 3, 805-811 (1999).9. T. K. Sato, M. Overduin, S. D. Emr, Location, location, location: membrane targeting directed by PX domains. Science 294, 1881-1885 (2001).
10. Y. Mao, J. Chen, J. A. Maynard, B. Zhang, F. A. Quiocho, A novel all helix fold of the AP180 amino-terminal domain for phosphoinositide binding and clathrin as-sembly in synaptic vesicle endocytosis. Cell 104, 433-440 (2001).
11. S. Dowler, R. A. Currie, D. G. Campbell, M. Deak, G. Kular, C. P. Downes, D. R. Alessi, Identification of pleckstrin-homology-domain-containing proteins with nov-el phosphoinositide-binding specificities. Biochem. J. 351, 19-31 (2000).
12. A. Bateman, E. Birney, R. Durbin, S. R. Eddy, K. L. Howe, E. L. Sonnhammer, The Pfam protein families database. Nucleic Acids Res. 28, 263-266 (2000).13. P. Várnai, T. Balla, Visualization of phosphoinositides that bind pleckstrin homology domains: calcium- and agonist-induced dynamic changes and relationship
to myo-[3H]inositol-labeled phosphoinositide pools. J. Cell Biol. 143, 501-510 (1998).14. K. Hirose, S. Kadowaki, M. Tanabe, H. Takeshima, M. Iino, Spatiotemporal dynamics of inositol 1,4,5-trisphosphate that underlies complex Ca2+ mobilization
patterns. Science 284, 1527-1530 (1999).15. J. van Der Wal, R. Habets, P. Várnai, T. Balla, K. Jalink, Monitoring agonist-induced phospholipase C activation in live cells by fluorescence resonance energy
transfer. J. Biol. Chem. 276, 15337-15344 (2001).16. D. J. Gillooly, I. C. Morrow, M. Lindsay, R. Gould, N. J. Bryant, J.-M. Gaullier, R. G. Parton, H. Stenmark, Localization of phosphatidylinositol 3-phosphate in yeast
and mammalian cells. EMBO J. 19, 4577-4588 (2000).17. J. Ellenberg, J. Lippincott-Schwartz, J. F. Presley, Dual-colour imaging with GFP variants. Trends Cell Biol. 9, 52-56 (1999).18. J. Lippincott-Schwartz, J. F. Presley, K. J. Zaal, K. Hirschberg, C. D. Miller, J. Ellenberg, Monitoring the dynamics and mobility of membrane proteins tagged with
green fluorescent protein. Methods Cell Biol. 58, 261-281 (1999).19. R. M. Siegel, F. K. Chan, D. A. Zacharias, R. Swofford, K. L. Holmes, R. Y. Tsien, M. J. Lenardo, Measurement of molecular interactions in living cells by fluores-
cence resonance energy transfer between variants of the green fluorescent protein. Science’s STKE (2000), http://stke.sciencemag.org/cgi/content/full/OC_sig-trans;2000/38/pl1
20. D. A. Zacharias, Sticky caveats in an otherwise glowing report: oligomerizing fluorescent proteins and their use in cell biology. Science’s STKE (2002),in press.
21. A. G. Harpur, F. S. Wouters, P. I. Bastiaens, Imaging FRET between spectrally similar GFP molecules in single cells. Nature Biotechnol. 19, 167-169 (2001).22. M. Matsuda, H. F. Paterson, R. Rodriguez, A. C. Fensome, M. V. Ellis, K. Swann, M. Katan, Real time fluorescence imaging of PLCγ translocation and its interac-
P R O T O C O L

www.stke.org/cgi/content/full/OC_sigtrans;2002/125/pl3 Page 16
tion with the epidermal growth factor receptor. J. Cell Biol. 153, 599-612 (2001).23. T. P. Stauffer, S. Ahn, T. Meyer, Receptor-induced transient reduction in plasma membrane PtdIns(4,5)P2 concentration monitored in living cells. Curr. Biol. 8,
343-346 (1998).24. P. Varnai, K. I. Rother, T. Balla, Phosphatidylinositol 3-kinase-dependent membrane association of the Bruton’s tyrosine kinase pleckstrin homology domain vi-
sualized in single living cells. J. Biol. Chem. 274, 10983-10989 (1999).25. K. Venkateswarlu, F. Gunn-Moore, J. M. Tavare, P. J. Cullen, EGF-and NGF-stimulated translocation of cytohesin-1 to the plasma membrane of PC12 cells re-
quires PI 3-kinase activation and a functional cytohesin-1 PH domain. J. Cell. Sci. 112, 1957-1965 (1999).26. K. Venkateswarlu, P. B. Oatey, J. M. Tavare, P. J. Cullen, Insulin-dependent translocation of ARNO to the plasma membrane of adipocytes requires phos-
phatidylinositol 3-kinase. Curr. Biol. 8, 463-466 (1998).27. G. Servant, O. D. Weiner, P. Herzmark, T. Balla, J. W. Sedat, H. R. Bourne, Polarization of chemoattractant receptor signaling during neutrophil chemotaxis.
Science 287, 1037-1040 (2000).28. J. Watton, J. Downward, Akt/PKB localisation and 3’ phosphoinositide generation at sites of epithelial cell-matrix and cell-cell interaction. Curr. Biol. 9, 433-436
(1999).29. T. P. Levine, S. Munro, The pleckstrin-homology domain of oxysterol-binding protein recognizes a determinant specific to Golgi membranes. Curr. Biol. 8,
729-739 (1998).30. F. Kanai, H. Liu, S. J. Field, H. Akbary, T. Matsuo, G. E. Brown, L. C. Cantley, M. B. Yaffe, The PX domains of p47phox and p40phox bind to lipid products of
PI(3)K. Nature Cell Biol. 3, 675-678 (2001).31. C. D. Ellson, S. Gobert-Gosse, K. E. Anderson, K. Davidson, H. Erdjument-Bromage, P. Tempst, J. W. Thuring, M. A. Cooper, Z-Y. Lim, A. B. Holmes, P. R. J.
Gaffney, J. Coadwell, E. R. Chilvers, P. T. Hawkins, L. R. Stephens, PtdIns(3)P regulates the neutrophil oxidase complex by binding to the PX domain of p40phox.Nature Cell Biol. 3, 679-682 (2001).
P R O T O C O L