Visualize Your Smart City: Build a Real-Time Smart City Dashboard for SensorThings API
39
#2: Visualize Your Smart City - Build a Real-Time Smart City Dashboard for SensorThings API Dr. Steve Liang, Ph.D., P.Eng. Founder and CEO, SensorUp Inc. Associate Professor, University of Calgary Click here for webinar recording Click here for source codes
Transcript of Visualize Your Smart City: Build a Real-Time Smart City Dashboard for SensorThings API
#2: Visualize Your Smart City - Build a Real-Time Smart City Dashboard for SensorThings API
Dr. Steve Liang, Ph.D., P.Eng. Founder and CEO, SensorUp Inc. Associate Professor, University of Calgary
Click here for webinar recording Click here for source codes

About Dr. Steve Liang๏Associate Professor, Geomatics Engineering, Uni. Calgary
๏AITF-Microsoft Industry Research Chair on Open Sensor Web (2011~2014)
๏Chair OGC SensorThings API Standard Working Group
๏Rapporteur, ITU-T SG12/11 on Internet of Things Test Specifications
๏Founder and CEO, SensorUp Inc

About SensorUp๏We are a leader in Sensor Web
and IoT Platforms.
๏We offer innovative and comprehensive SensorThings solutions.
๏We are proud member of Eclipse and Open Geospatial Consortium

News - SensorThings API Press Release

News - We are setting up a SensorThings for Taiwan’s LASS, a very large air quality monitoring network.
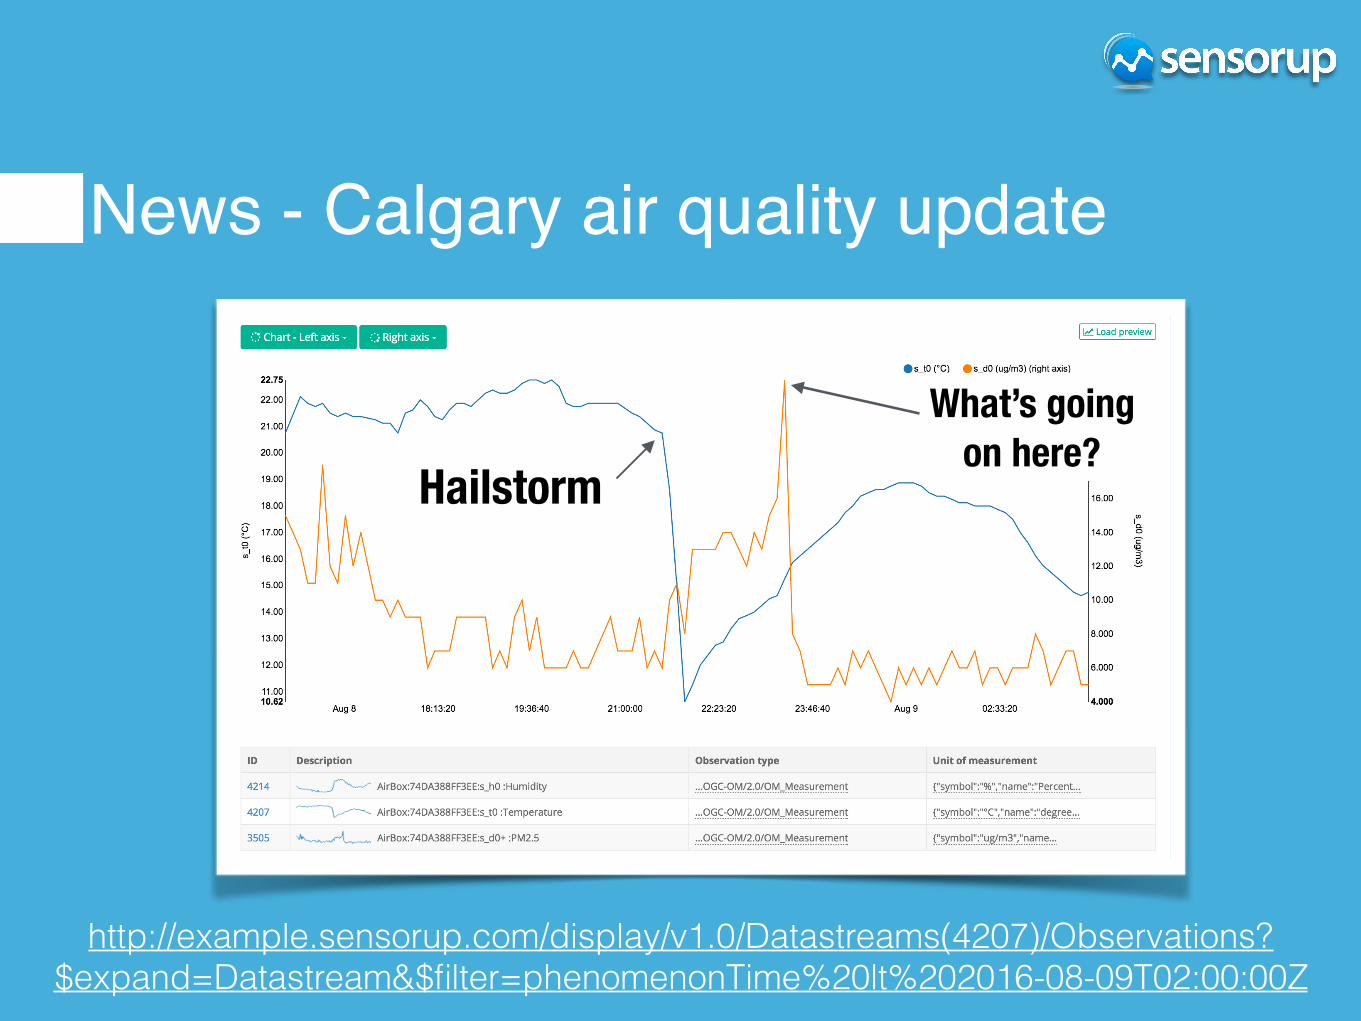
News - Calgary air quality update
http://example.sensorup.com/display/v1.0/Datastreams(4207)/Observations?$expand=Datastream&$filter=phenomenonTime%20lt%202016-08-09T02:00:00Z
HailstormWhat’s going
on here?
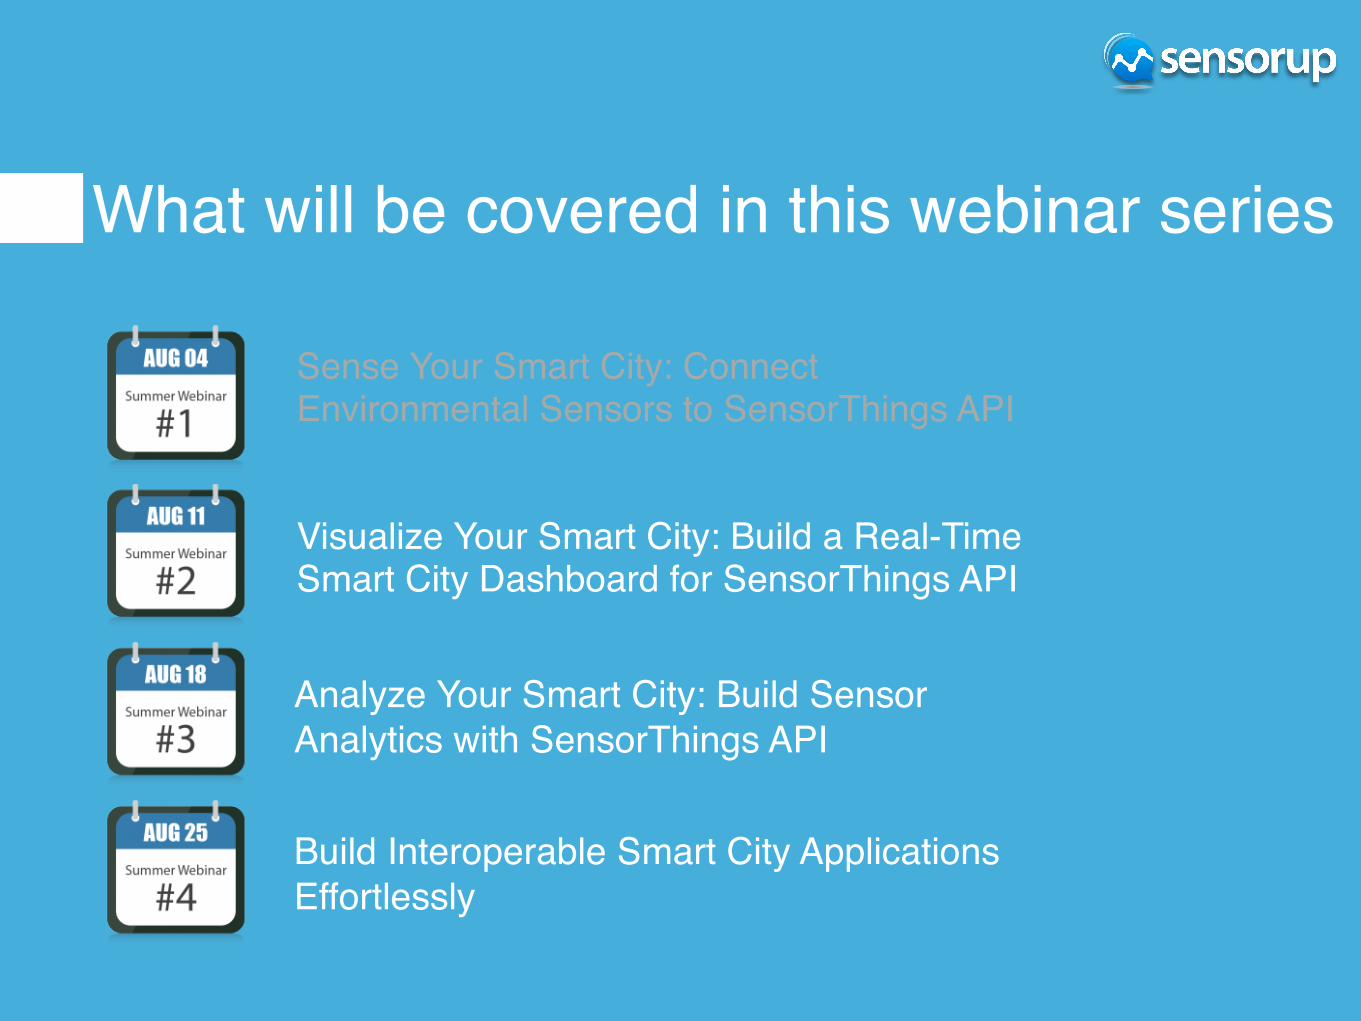
What will be covered in this webinar series
Sense Your Smart City: Connect Environmental Sensors to SensorThings API
Visualize Your Smart City: Build a Real-Time Smart City Dashboard for SensorThings API
Analyze Your Smart City: Build Sensor Analytics with SensorThings API
Build Interoperable Smart City Applications Effortlessly

Today’s learning outcomes๏Review of SensorThings entities (ISO 19156 O&M)
๏Creating a Chart for a Datastream with multiple requests
๏Creating a Chart for a Datastream with a single request
๏Create a Map showing the Location of the Thing/Datastream
๏Create a simple dashboard
๏Putting them all together into a single page

Why build your IoT application with open standards?
IoT System #1
IoT System #2
IoT System #3
IoT System #N…
Write N times different but similar codes!!
Wait.. how about version updates?
Write N x M times, where M is the average
number of updatesWrite an application for proprietary IoT APIs

Why build your IoT application with open standards?
IoT System #1
IoT System #2
IoT System #3
IoT System #N…
Write 1 time and use N times.
Wait.. how about version updates?
OGC standards are stable and future proof.Write an application for
open standard IoT API

Today we will use SensorUp’s air quality monitoring system in Calgary as an example.
http://example.sensorup.com/v1.0

What do you need?
Any text editor
A modern browser (Chrome in this webinar)
A JSON viewer plugin (JSONView in this webinar)
IMPORTANT
We are using Highstock.js today. Highstock/Highchart is open source and free for non-commercial uses. But it is NOT free for commercial uses.

Acknowledgement
Thanks to James Badger for preparing today’s tutorials’ source codes.
James and I are writing a book on SensorThings API and IoT/Smart Cities. Please stay tuned!

The data model
AirBox
The Air in My Backyard
• Plant Tower G3 • DHT22
• Particulate Matter 2.5 • Relative Humidity • Air Temperature
My Backyard

#1 Create a Chart for a Datastream
๏What information do we need to create a chart?
time series (observations)
chart title
y-axis label
tooltip

#1 Create a Chart for a Datastream๏What do we need from SensorThings?
๏Chart title
๏ Datastream’s description
๏ Time series
๏ Observations’ result and phenomenonTime
๏Y-axis label
๏ unitOfMeasurement - symbol and name
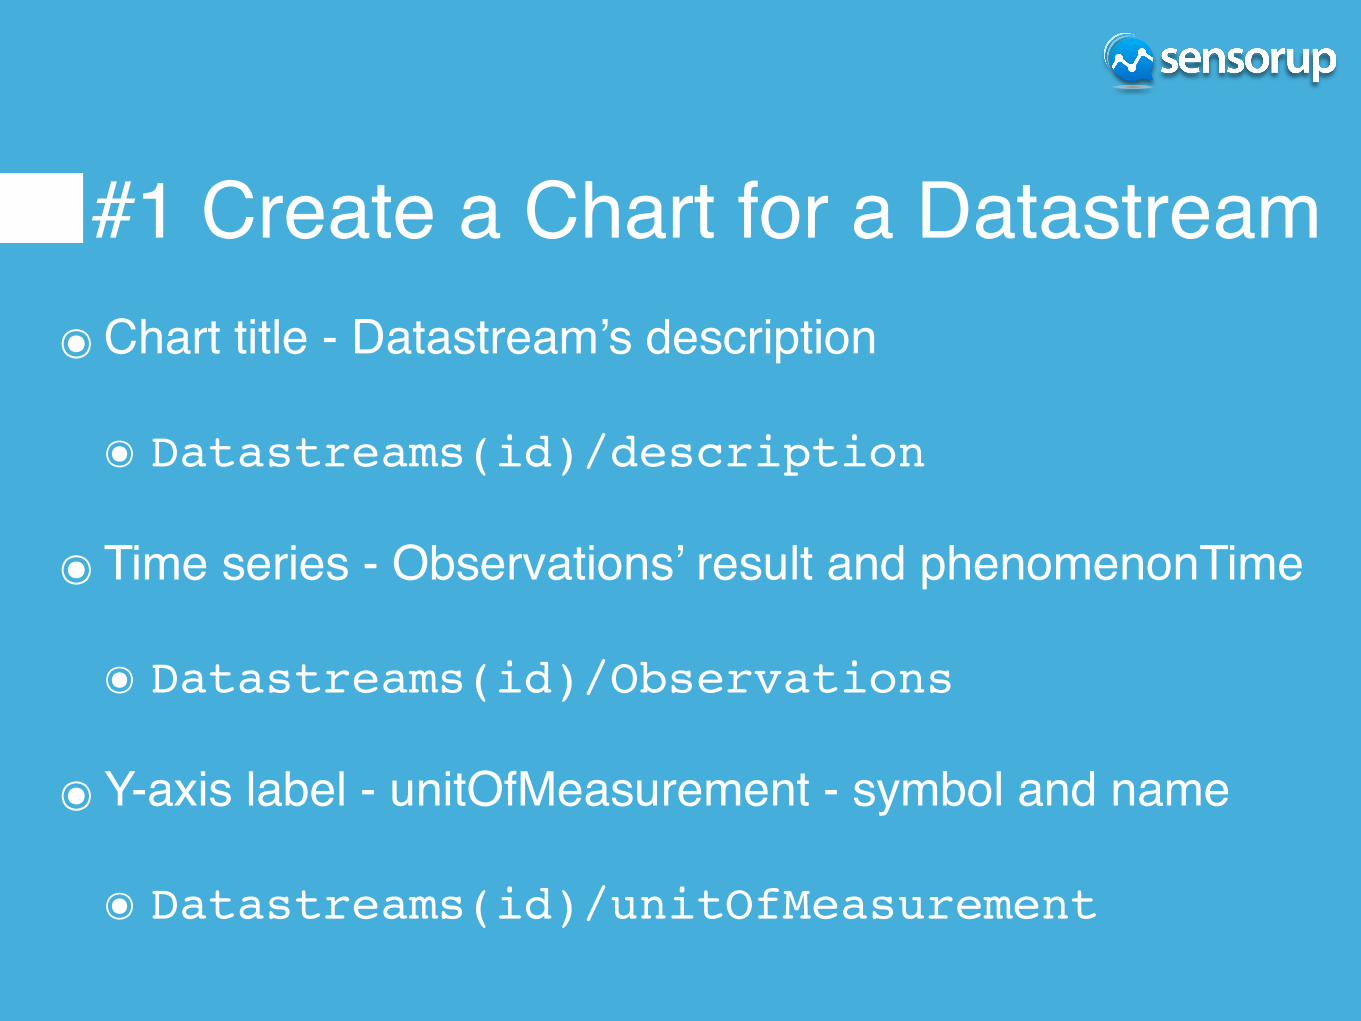
#1 Create a Chart for a Datastream๏Chart title - Datastream’s description
๏ Datastreams(id)/description
๏Time series - Observations’ result and phenomenonTime
๏ Datastreams(id)/Observations
๏Y-axis label - unitOfMeasurement - symbol and name
๏ Datastreams(id)/unitOfMeasurement

#1 Create a Chart for a Datastream
๏Send the first request for Datastream
๏ Datastreams(id)/description

#1 Create a Chart for a Datastream๏Send the second request for the time series -
Observations’ result and phenomenonTime
๏ Datastreams(id)/Observations
๏ $orderby and $top
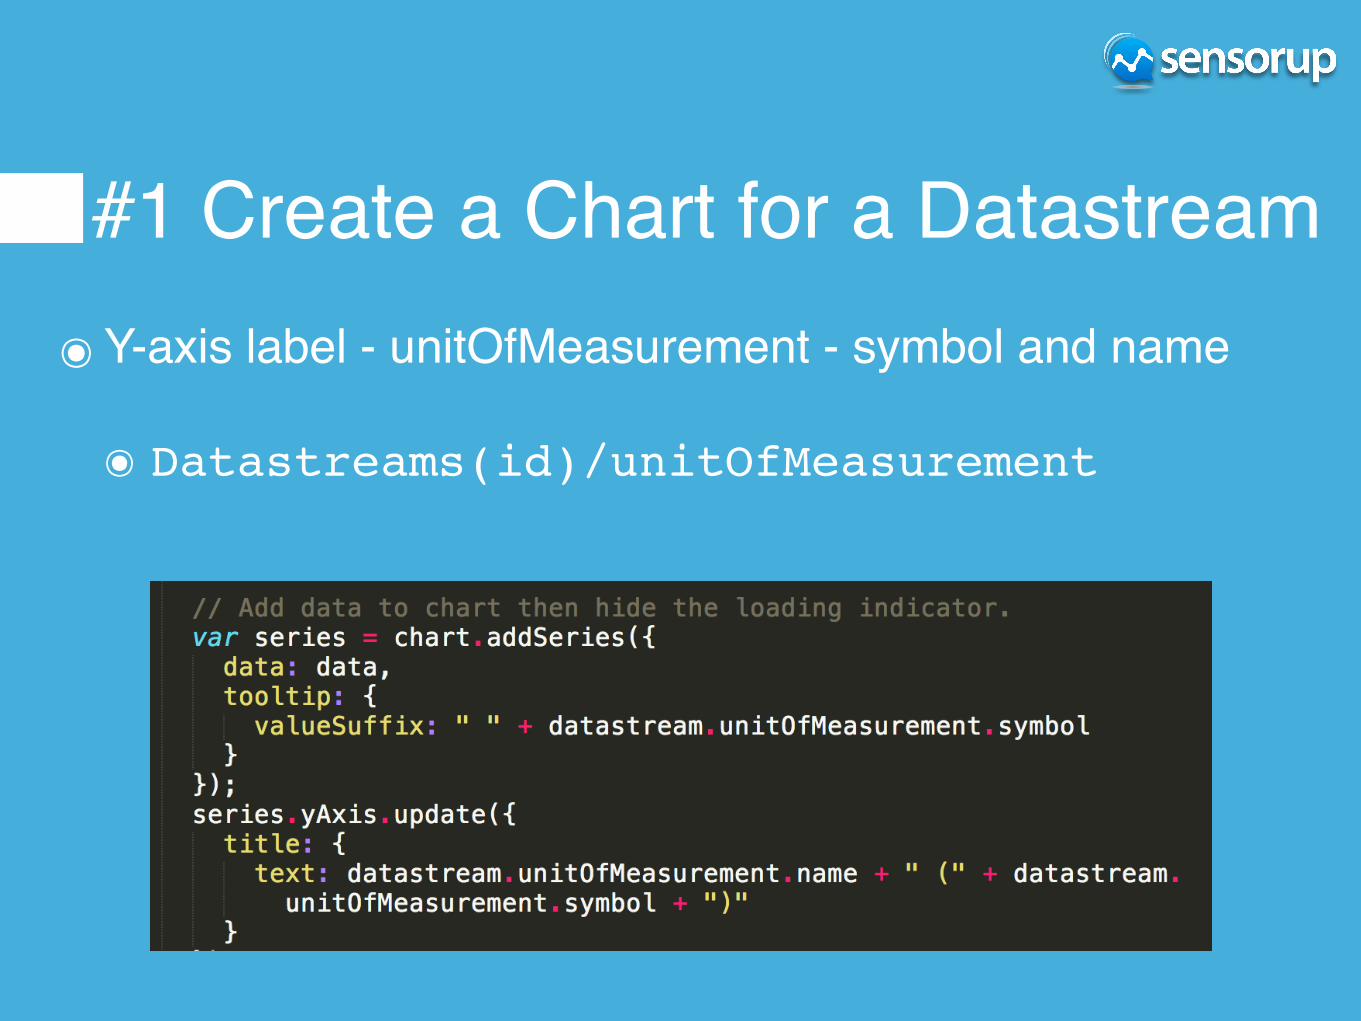
#1 Create a Chart for a Datastream๏Y-axis label - unitOfMeasurement - symbol and name
๏ Datastreams(id)/unitOfMeasurement

#2 Create a Chart for a Datastream with a single request
๏Get all the required information with a single request
๏ Datastreams(id)?$expand=Observations

#3 Create a map showing the Thing/Location
๏Get a Datastream’s Thing’s Location
๏ Datastreams(id)?$expand=Thing/Locations
๏Oh, we also need the Observations
๏ Datastreams(id)?$expand=Observations,Thing/Locations

#3 Create a map showing the Thing/Location
Prepare the map

#3 Create a map showing the Thing/Location
๏ Datastreams(id)?$expand=Observations,Thing/Locations

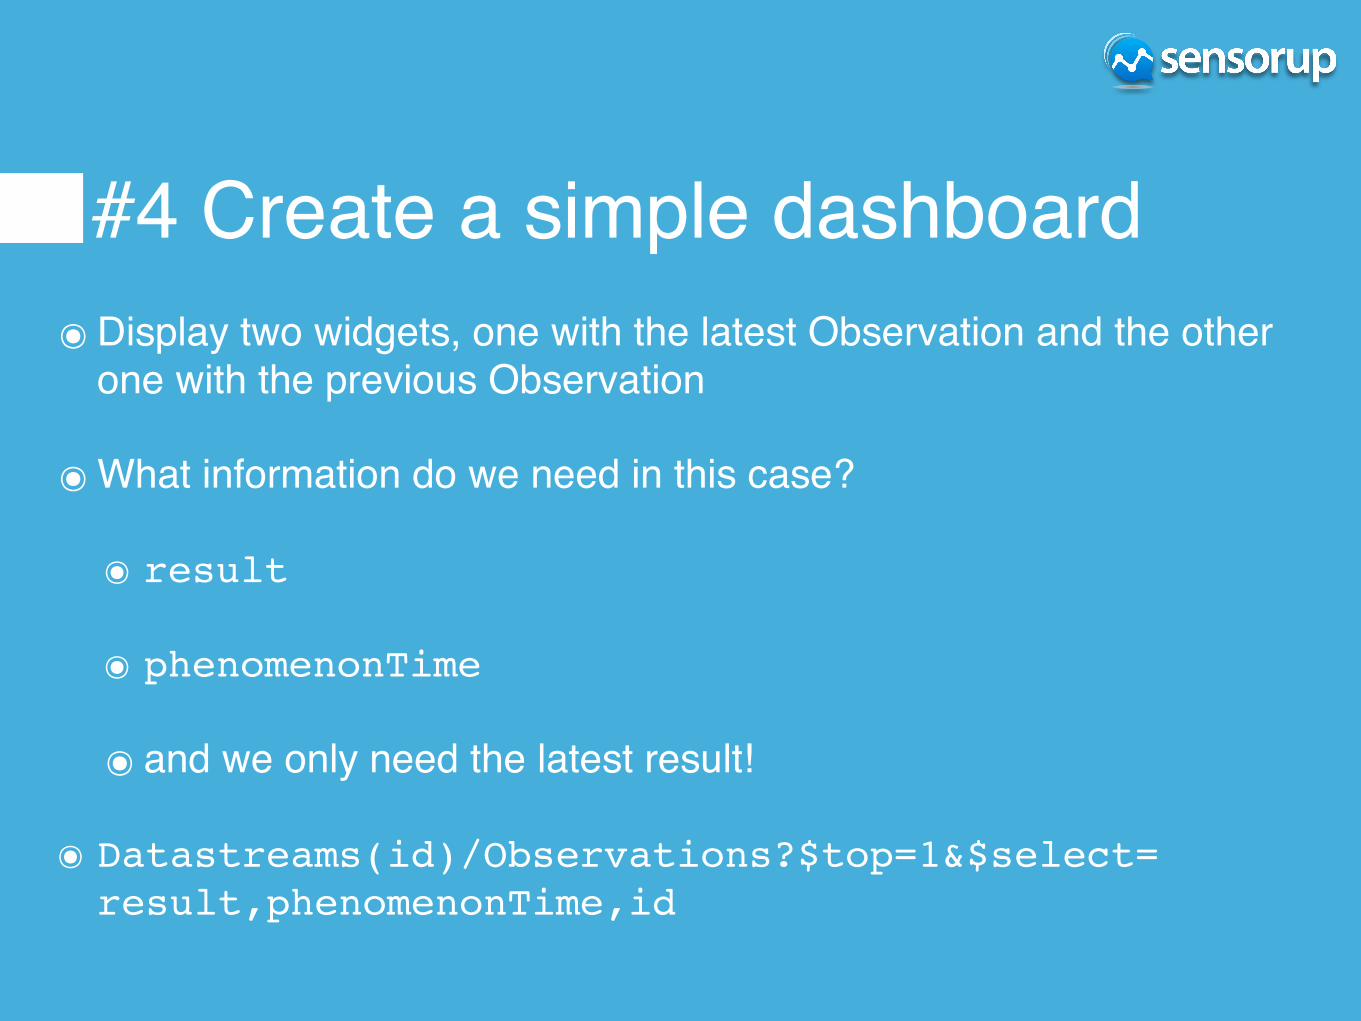
#4 Create a simple dashboard๏Display two widgets, one with the latest Observation and
the other one with the previous Observation
#4 Create a simple dashboard๏Display two widgets, one with the latest Observation and the other
one with the previous Observation
๏What information do we need in this case?
๏ result
๏ phenomenonTime
๏ and we only need the latest result!
๏ Datastreams(id)/Observations?$top=1&$select= result,phenomenonTime,id

#4 Create a simple dashboard
๏Display two widgets, one with the latest Observation and the other one with the previous Observation
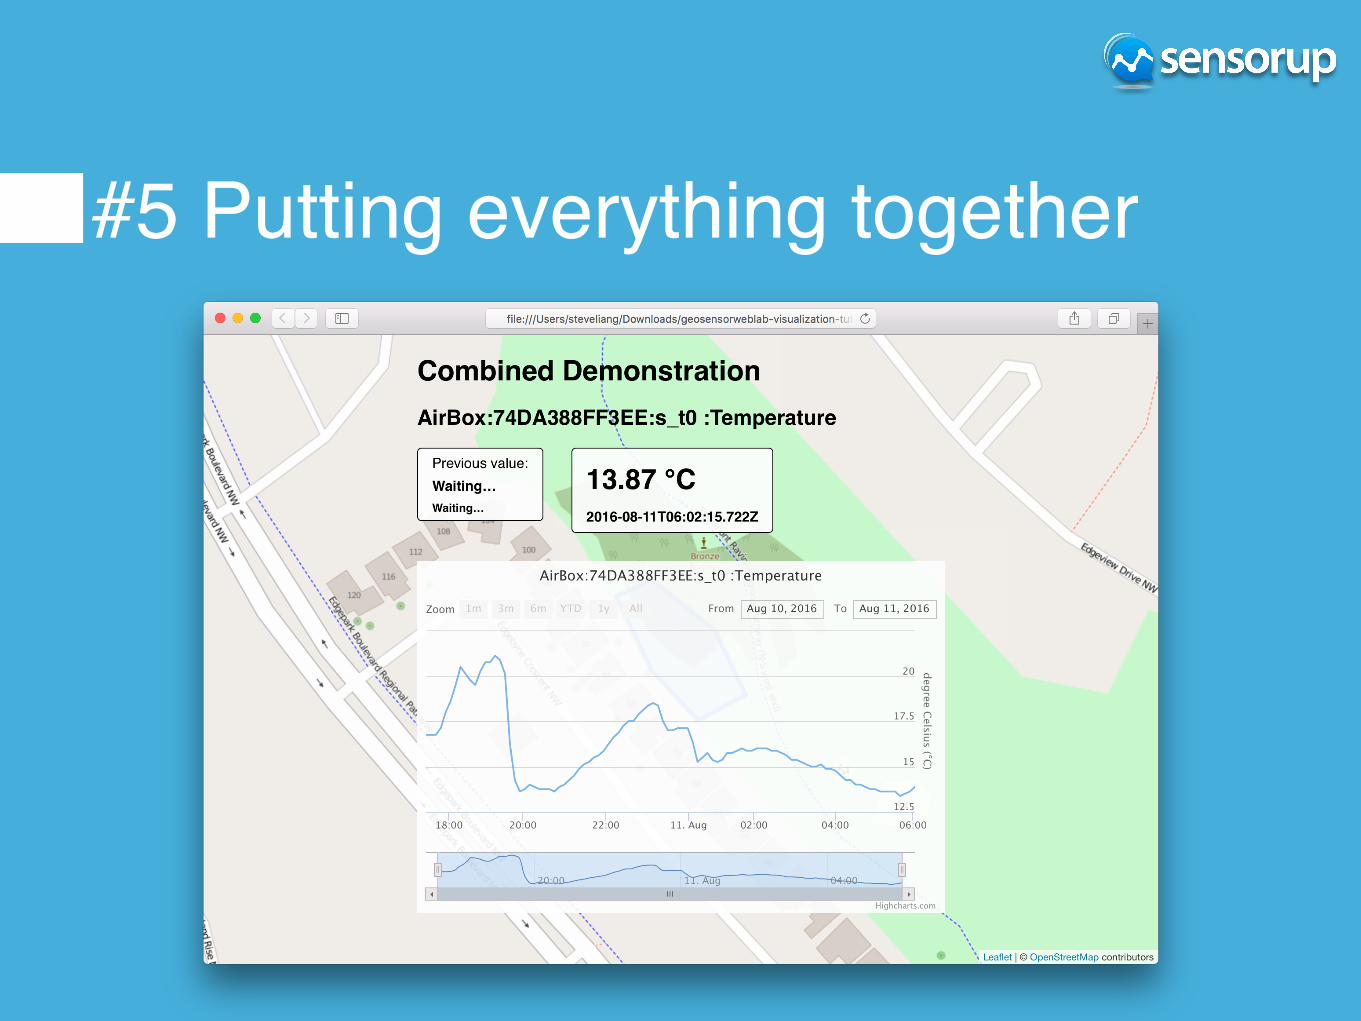
#5 Putting everything together


Many of you just want a Charting API that works….
Available here, Free for non-commercial uses

Display a Thing’s Datastreams

Which dashboard widget you like?One line of code to switch between chart, table, gauge , speedometer, and NVD3 chart.

Data Table for SensorThings

Display a Datastream from t1 to t2

SensorThings HCDT๏ Available before August 18th 2016.
๏ Library/SDK
๏ Developer Documentation
๏ Interactive Tutorials
๏ Examples

If you think it’s good….
We have something even better!! To Be Announced soon!

GIST
https://github.com/SensorUp/Webinars/tree/master/2016-08-11-Visualize-Your-
Smart-Cities

Next Week
Analyze Your Smart City: Build Sensor Analytics with SensorThings API