Visualization of myocardial cellular architecture using...
7
Visualization of myocardial cellular architecture using acoustic microscopy P. A. N. Chandraratna, MD, MRCP, Satish Choudhary, MD, Joie P. Jones, PhD, Parakrama Chandrasoma, MD, Amar Kapoor, MD, and Jacqueline Gallet, BS Irvine and Los Angeles, Calif. The resolution of an ultrasound transducer depends on its frequency. The higher the frequency, the shorter the wavelength of sound, with a resultant improvement in the resolution. At a frequency of a 1000 MHz, the wavelength of ultrasound is similar to that of light and the resolution approaches 1 pm. Lemons and Quatel used high-frequency ultrasound to design the scanning acoustic microscope in 1973. The scanning acoustic microscope has a resolving power that is several hundred times that of ultrasonic diagnostic systems. This instrument permits the vi- sualization of tissues on a microscopic scale similar to that provided by light microscopy. However, unlike light microscopy, this technique does not require staining of the specimen. Acoustic microscopy is at present mainly used in industry to detect faults in microprocessor chips. Biomedical applications of acoustic microscopy were first described by Lemons and Quate. The detection of myocardial pathology by acoustic microscopy has not been previously de- scribed. We describe the use of acoustic microscopy in the evaluation of cellular detail of the myocardium. METHODOLOGY Myocardial biopsy specimens from 10 patients were sectioned at 5 pm, deparaffinized, and placed on a slide. The unstained slide was placed on the stage of an Olympus UH3 scanning acoustic microscope (Olympus Corp., Lake Success, N.Y.), the specimen was covered with deionized water, and imaging was performed. To compare acoustic microscopy with From the Division of Cardiology, USC School of Medicine, Department of Radiological Sciences, University of California, Irvine; and the Department of Pathology, LAC & USC Medical Center, USC School of Medicine, Los Angeles. Received for publication March 13, 1992; accepted May 1. 1992. Reprint requests: P. A. N. Chandraratna, MD, USC School of Medicine, 2025 Tonal Ave., Los Angeles. CA 90033. 4~ll4045S mechanism t’ tf ’ 1 Specimen * 1 Fig. 1. Diagram of the acoustic microscope. A transmitter generates a RF signal that activates a piezoelectric trans- ducer, resulting in an acoustic wave. The acoustic wave is focused by a sapphire lens and it passes through the spec- imen and is reflected off the slide on which the specimen is placed. light microscopy, the section used for acoustic mi- croscopy was subsequently stained with hematoxylin and eosin for light microscopy. A serial section from the paraffin block was stained with phosphotungstic acid hematoxylin (PTAH) stain. Olympus UH3 scanning acoustic microscope. A sche- matic of the acoustic microscope is shown in Fig. 1. A radiofrequency signal stimulates a piezoelectric crystal, which emits ultrasound waves that are fo- cused by a sapphire crystal. The ultrasound wave traverses the specimen of myocardial tissue on the slide and is then reflected from the slide and, on re- turning to the piezoelectric crystal, a radiofrequency (RF) signal is emitted and collected by a receiver. The acoustic signal’s intensity is converted to bright- ness for display as a point of light on a cathode ray tube. The specimen is scanned in the horizontal plane in a raster fashion allowing point-by-point analysis of 1358
Transcript of Visualization of myocardial cellular architecture using...

Visualization of myocardial cellular architecture using acoustic microscopy
P. A. N. Chandraratna, MD, MRCP, Satish Choudhary, MD, Joie P. Jones, PhD, Parakrama Chandrasoma, MD, Amar Kapoor, MD, and Jacqueline Gallet, BS
Irvine and Los Angeles, Calif.
The resolution of an ultrasound transducer depends on its frequency. The higher the frequency, the shorter the wavelength of sound, with a resultant improvement in the resolution. At a frequency of a 1000 MHz, the wavelength of ultrasound is similar to that of light and the resolution approaches 1 pm. Lemons and Quatel used high-frequency ultrasound to design the scanning acoustic microscope in 1973. The scanning acoustic microscope has a resolving power that is several hundred times that of ultrasonic diagnostic systems. This instrument permits the vi- sualization of tissues on a microscopic scale similar to that provided by light microscopy. However, unlike light microscopy, this technique does not require staining of the specimen. Acoustic microscopy is at present mainly used in industry to detect faults in microprocessor chips. Biomedical applications of acoustic microscopy were first described by Lemons and Quate. The detection of myocardial pathology by acoustic microscopy has not been previously de- scribed. We describe the use of acoustic microscopy in the evaluation of cellular detail of the myocardium.
METHODOLOGY
Myocardial biopsy specimens from 10 patients were sectioned at 5 pm, deparaffinized, and placed on a slide. The unstained slide was placed on the stage of an Olympus UH3 scanning acoustic microscope (Olympus Corp., Lake Success, N.Y.), the specimen was covered with deionized water, and imaging was performed. To compare acoustic microscopy with
From the Division of Cardiology, USC School of Medicine, Department of Radiological Sciences, University of California, Irvine; and the Department of Pathology, LAC & USC Medical Center, USC School of Medicine, Los Angeles.
Received for publication March 13, 1992; accepted May 1. 1992.
Reprint requests: P. A. N. Chandraratna, MD, USC School of Medicine, 2025 Tonal Ave., Los Angeles. CA 90033.
4~ll4045S
mechanism
t’ tf ’ 1 Specimen * 1
Fig. 1. Diagram of the acoustic microscope. A transmitter generates a RF signal that activates a piezoelectric trans- ducer, resulting in an acoustic wave. The acoustic wave is focused by a sapphire lens and it passes through the spec- imen and is reflected off the slide on which the specimen is placed.
light microscopy, the section used for acoustic mi- croscopy was subsequently stained with hematoxylin and eosin for light microscopy. A serial section from the paraffin block was stained with phosphotungstic acid hematoxylin (PTAH) stain.
Olympus UH3 scanning acoustic microscope. A sche- matic of the acoustic microscope is shown in Fig. 1. A radiofrequency signal stimulates a piezoelectric crystal, which emits ultrasound waves that are fo- cused by a sapphire crystal. The ultrasound wave traverses the specimen of myocardial tissue on the slide and is then reflected from the slide and, on re- turning to the piezoelectric crystal, a radiofrequency (RF) signal is emitted and collected by a receiver. The acoustic signal’s intensity is converted to bright- ness for display as a point of light on a cathode ray tube. The specimen is scanned in the horizontal plane in a raster fashion allowing point-by-point analysis of
1358

Volwne 124 Number 5 Acoustic microscopy of myocardium 1359
Fig. 2. Acoustic microscopy of the myocardium illustrating myocardial cells of various sizes. The cell membrane CM) and myofibrils (horizontal arrow) are seen.
the elastic properties of a cross section of tissue. A 600 or a 1000 MHz t,ransducer is used for this study. The acoustic image is displayed on a screen.
Generation of images- The source of contrast for the ultrasound images is differing attenuation between various components of myocardial tissue.2 Structures with the greatest attenuation appear black, while those components of tissue with the least attenuation appear white. When the section contains significant amounts of structural protein, particularly collagen, both attenuation and impedance play a role in the generation of the image.2 The instrument is also sen- sitive to changes in viscosity. No staining was re- quired to generate the images. The acoustic micro- scopic images and the light microscopic images were evaluated by two observers who were blinded to the results obtained by the alternative technique.
OBSERVATIONS
Cardiac myocytes, interstitial tissue, intramural blood vessels, myocyte fallout, myocardial fibrosis, and lymphocytic infiltration were clearly identified by acoustic microscopy. An acoustic microscopic im- age depicting myocytes of various sizes is illustrated in Fig. 2. Myocytes have been cut in cross section, and cell membranes and myofibrils are seen. The outer cell membrane is visible as a thin line that demar- cates the cytoplasm sharply from the interstitium. The cytoplasm is dominated by fibrils that appear as
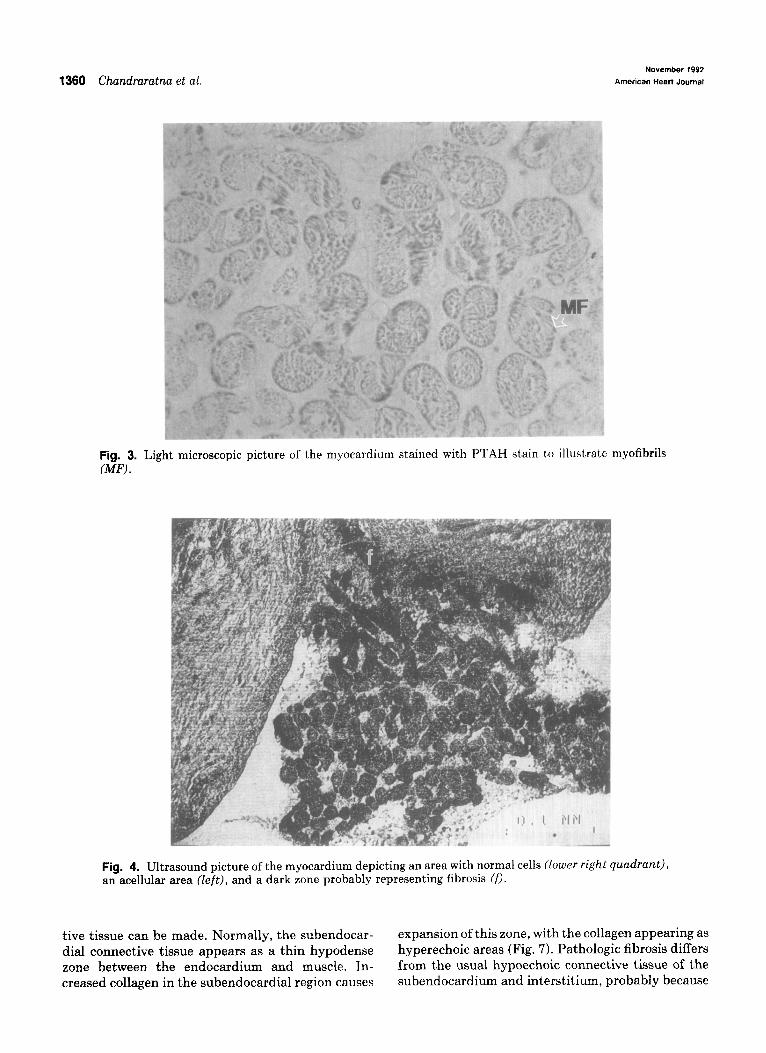
dark lines alternating with hypoechoic lines that represent the cytoplasm intervening between the myofilaments. The fibrils are generally parallel, though they change direction in many cells. The nu- cleus is difficult to see except in rare cells where it can be seen as a faint round outline among the fibrils. To confirm that the dark intracellular strands seen on the ultrasound image are myofibrils, sections for op- tical microscopy were stained with PTAH stain. PTAH specifically stains myofibrils. When optical microscopic sections were stained with hematoxylin and eosin, nuclei were clearly visible, mainly because they were not masked by the myofibrils, which stained with eosin but remained in the background. PTAH-stained sections (Fig. 3) were dominated by myofibrils with an appearance very similar to that seen on acoustic microscopy.
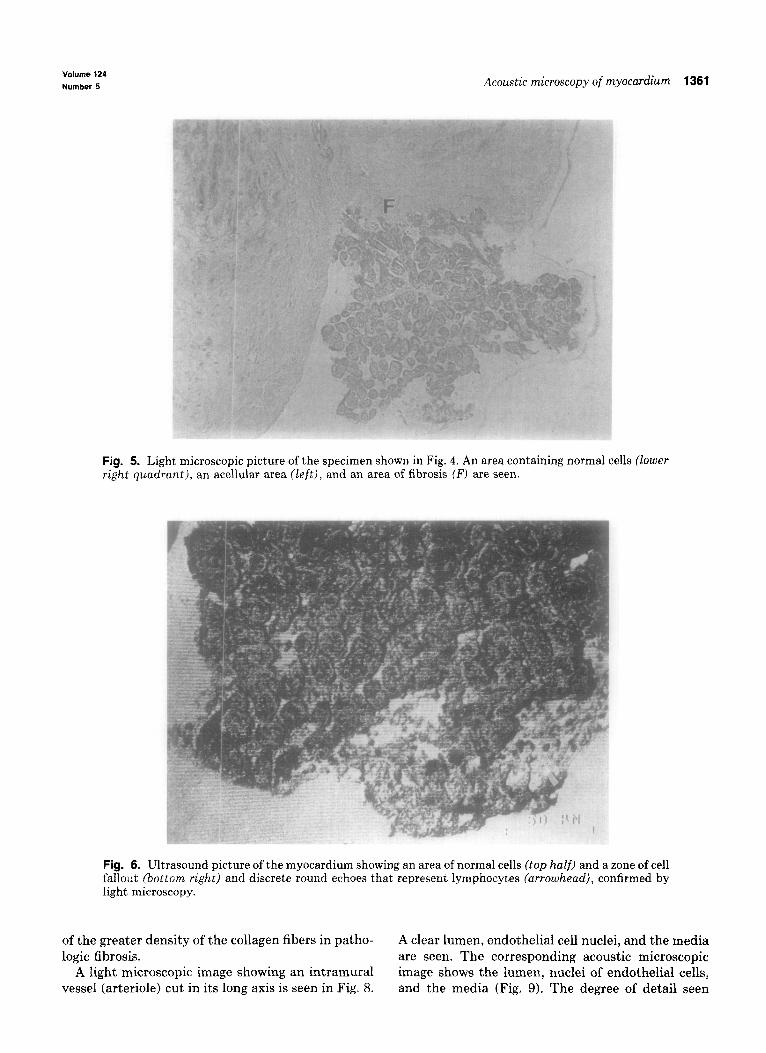
A group of normal cells and an area of fibrosis with very little cellular detail is depicted in the ultrasound image shown in Fig. 4, and light microscopy shows the same abnormalities (Fig. 5). The upper part of Fig. 6 shows normal cellular architecture imaged by ultra- sound, while in the bottom right corner, cell fallout and discrete rounded dark echoes that represent lymphocytes (comirmed by light microscopy) are seen.
The normal endocardium can be seen as a sharp line in some tissue fragments. When seen, an evalu- ation of the thickness of the subendocardial connec-
1360 Chmdraratna et al. November 1992
American Heart Journal
tive tissue can be made. Normally, the subendocar- dial connective tissue appears as a thin hypodense zon6 ? between the endocardium and muscle. In- crea sed collagen in the subendocardial region causes
Fig. 3. Light microscopic picture of the myocardium stained with PTAH stain t,o illustrate myofibrils GW .
Fig. 4. Ultrasound picture of the myocardium depicting an area with normal cells (lower right quadrant), an acellular area (Zeft), and a dark zone probably representing fibrosis Cf).
expansion of this zone, with the collagen appearing as hyperechoic areas (Fig. 7). Pathologic fibrosis differs from the usual hypoechoic connective tissue of the subendocardium and interstitium, probably because
Volume 124 Number 5 Acoustic microscopy of myocardium 1361
of thj e greater density of the collagen fibers in patho- logic fibrosis.
Al ight microscopic image showing an intramural vesse 81 (arteriole) cut in its long axis is seen in Fig. 8.
Fig. 5. Light microscopic picture of the specimen shown in Fig. 4. An area containing normal cells (lower right quadrant), an acellular area (left), and an area of fibrosis (F) are seen.
Fig. 6. Ultrasound picture of the myocardium showing an area of normal cells (top half) and a zone of cell fallout {bottom right) and discrete round echoes that represent lymphocytes (arrowhead), confirmed by light microscopy.
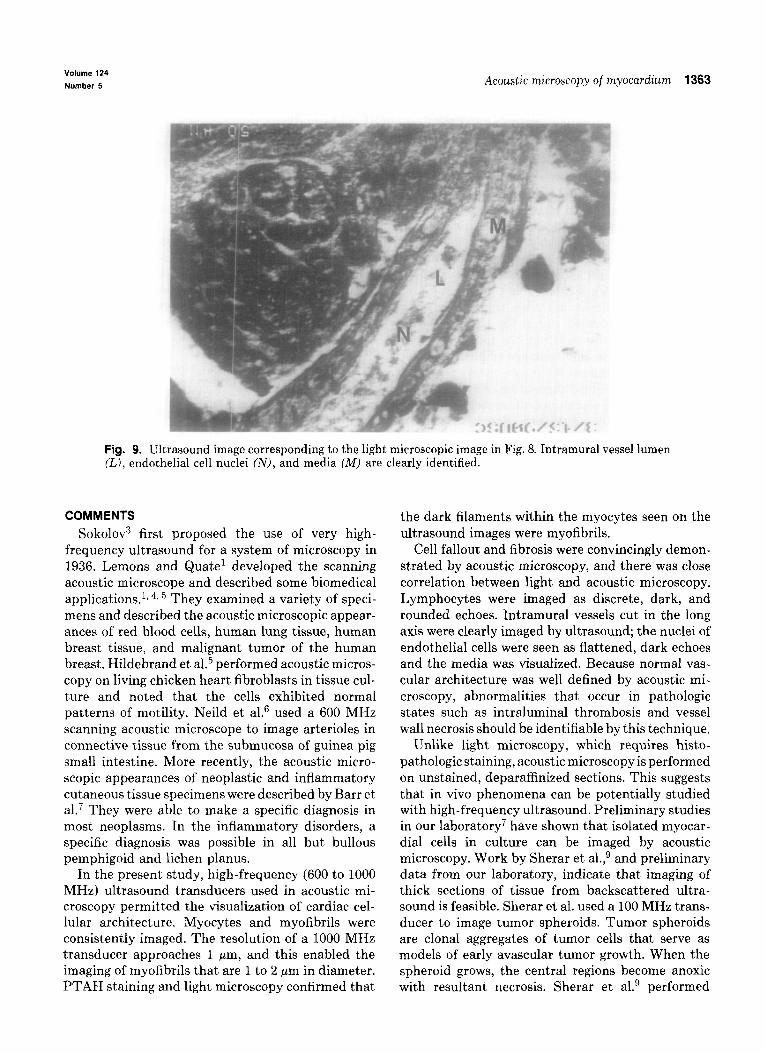
A clear lumen, endothelial cell nuclei, and the r nedia are seen. The corresponding acoustic micros icopic image shows the lumen, nuclei of endothelial cells, and the media (Fig. 9). The degree of detail seen

1362 Chundraratnu et al. November 1992
American Heart Journal
Fig. 7. Ultrasound picture showing expansion of the subendocardial region with dense echoes represent. ing fibrosis (f).
--
Fig. 8. Light microscopic image showing an intramural vessel (arteriole) cut in its long axis. A clear lumen (I,), endothelial cell nuclei (N), and media are seen.
makes us confident that we will be able to identify lymphocytic infihxation-assessed by acoustic mi- changes in wall thickness, the presence of thrombi, croscopy and light microscopy, were identica1. In one intimal thickening, and the presence of vasculitis. patient, acoustic microscopy failed to identify a focus
In 9 out of 10 patients, normal and abnormal his- of lymphocytic infiltration (seen on light microscopy) tologic features-that is, cell dropout, fibrosis, and because the area of interest was not imaged.
Volume 124 Number 5 Aco~~stic microscopy of rnyocar&m 1363
Fig. 9. Ultrasound image corresponding to the light microscopic image in Fig. 8. Intramural vessel lumen (LJ, endothelial cell nuclei CN), and media CM) are clearly identified.
COMMENTS Sokolov3 first proposed the use of very high-
frequency ultrasound for a system of microscopy in 1936. Lemons and Quate’ developed the scanning acoustic microscope and described some biomedical applications.l, 4, 5 They examined a variety of speci- mens and described the acoustic microscopic appear- ances of red blood cells, human lung tissue, human breast tissue, and malignant tumor of the human breast. Hildebrand et al.5 performed acoustic micros- copy on living chicken heart fibroblasts in tissue cul- ture and noted that the cells exhibited normal patterns of motility. Neild et aL6 used a 600 MHz scanning acoustic microscope to image arterioles in connective tissue from the submucosa of guinea pig small intestine. More recently, the acoustic micro- scopic appearances of neoplastic and inflammatory cutaneous tissue specimens were described by Barr et al.7 They were able to make a specific diagnosis in most neoplasms. In the inflammatory disorders, a specific diagnosis was possible in all but bullous pemphigoid and lichen planus.
In the present study, high-frequency (600 to 1000 MHz) ultrasound transducers used in acoustic mi- croscopy permitted the visualization of cardiac cel- lular architecture. Myocytes and myofibrils were consistently imaged. The resolution of a 1000 MHz transducer approaches 1 pm, and this enabled the imaging of myofibrils that are 1 to 2 pm in diameter. PTAH staining and light microscopy confirmed that
the dark filaments within the myocytes seen on the ultrasound images were myofibrils.
Cell fallout and fibrosis were convincingly demon- strated by acoustic microscopy, and there was close correlation between light and acoustic microscopy. Lymphocytes were imaged as discrete, dark, and rounded echoes. Intramural vessels cut in the long axis were clearly imaged by ultrasound; the nuclei of endothelial cells were seen as flattened, dark echoes and the media was visualized. Because normal vas- cular architecture was well defined by acoustic mi- croscopy, abnormalities that occur in pathologic states such as intraluminal thrombosis and vessel wall necrosis should be identifiable by this technique.
Unlike light microscopy, which requires histo- pathologic staining, acoustic microscopy is performed on unstained, deparaffinized sections. This suggests that in vivo phenomena can be potentially studied with high-frequency ultrasound. Preliminary studies in our laboratory7 have shown that isolated myocar- dial cells in culture can be imaged by acoustic microscopy. Work by Sherar et al.,g and preliminary data from our laboratory, indicate that imaging of thick sections of tissue from backscattered ultra- sound is feasible. Sherar et al. used a 100 MHz trans- ducer to image tumor spheroids. Tumor spheroids are clonal aggregates of tumor cells that serve as models of early avascular tumor growth. When the spheroid grows, the central regions become anoxic with resultant necrosis. Sherar et al.g performed

1364 Chmdraratna et al.
acoustic microscopy at cross-sectional planes of 300 pm depth intervals in a 1.5 mm diameter spheroid and compared these images with light microscopic pictures. The ultrasound image of the central plane showed three regions, including a rim, an intermedi- ate region, and a central region. The optical micro- scopic image also showed three regions. It should be emphasized that these investigators were not able to image cells because of the limited resolution of the 100 MHz transducer. We have performed acoustic microscopy on thick sections of left ventricular my- ocardium.l” An ultrasound beam from a 200 MHz transducer was focused within the tissue and the backscattered ultrasound from the focal plane was analyzed. We were able to image cellular detail in thick sections, although the image quality was infe- rior to that observed in thin sections. We believe that the application of signal processing techniques will enhance the quality of the image. Based on these ob- servations, further development of this technique for in vivo imaging appears warranted.
SUMMARY
The resolution of an ultrasound transducer de- pends on its frequency. The resolution improves when higher frequency transducers are used. A 1000 MHz transducer has a resolution of approximately 1 pm. Acoustic microscopy utilizes very high-frequency ultrasound (600 to 1000 MHz) to visualize structures on a microscopic level. Unstained, deparaffinized, 5 pm sections of myocardial biopsy specimens from 10 patients were placed on a slide and imaged using an Olympus UH3 scanning acoustic microscope. To compare with light microscopy, the section used for acoustic microscopy was subsequently stained with hematoxylin and eosin and a serial section from the
November 1992 American Heart Journal
paraffin block was stained with PTAH stain. My(~)- cytes, myofibrils, and interstitial tissue were accu- rately imaged. Pathologic phenomena such as cell fallout, interstitial fibrosis, and lymphocytic infiltra- tion were identified by acoustic microscopy. Intra- mural vessels, nuclei of endothelial cells, and the media were clearly identified by this technique. There was close correlation between findings hy acoustic microscopy and light microscopy. Acoustic microscopy permitted the visuahzation of cardiac cellular detail with a resolution similar to that of light microscopy. Unlike light microscopy, acoustic mi- croscopy requires no staining of the specimen.
REFERENCES
Lemons RA, Quate CF. Acoustic microscope-scanning ver- sion. Appl Phys Lett 1974;24:163-5. Daft CMV, Briggs GAD. The elastic microstructure of various tissues. J Acoust Sot Am 1989;85:416-22.
5.
6.
7.
8.
Sokolov SY. USSR patent no. 49, Aug. 31.1936; British patent, no. 477 139, 1937; and U.S. patent no. 21 64 125, 1939. Johnston RN, Atalar A, Heiserman J, Jipson V, Quate CI. Acoustic microscopy: resolution of subcellular detail. Proc Nat1 Acad Sci USA 1979;76:3325-9. Hildebrand JA, Rugar D, ,Johnston RN, Quate CL Acoustic microscopy of living cells. Proc Nat1 Acad Sci USA 1981: 781656-60. Neild TO, Attal J, Saurel JM. Images of arterioles in unfixed tissue obtained by acoustic microscopy. J Microsc 1985;139:19- 25. Barr RJ, White GM, Jones JP, Shaw LB, Ross PA. Scanning acoustic microscopy of neoplastic and inflammatory cutane- ous tissue specimens, J Invest Dermatol 1991;96:38-41. Chandraratna PAN, Choudhary S, Jones JP. Visualization of isolated myocardial cells by acoustic microscopy [Abstract]. Circulation 1990;82:111-69,
9. Sherar MD, Noss MB, Foster FS. Ultrasound backscatter mi- croscopy in internal structure of living tumor snheroids. Na- ture 1987;330:493-5.
10. Chandraratna PAN, Chandrasoma P, Jones JP, Rahimtoola SH, Gallet J. Demonstration of cellular architecture in thick myocardial sections by high frequency ultrasound [Abstract]. +J Am Co11 Cardiol 1992;19:114A.


![Angina Pectoris Obstruction Decrease of blood irrigation Acute Myocardial Infarction (almost) Total occlusion Cellular necrosis [1] [1] Thygesen K, Alpert.](https://static.fdocuments.us/doc/165x107/56649e7e5503460f94b8103d/angina-pectoris-obstruction-decrease-of-blood-irrigation-acute-myocardial-infarction.jpg)