Visualization of Fields and Applications in Engineering · Visualization of Fields and Applications...
15
Visualization of Fields and Applications in Engineering STEPHEN TOU
Transcript of Visualization of Fields and Applications in Engineering · Visualization of Fields and Applications...

Visualization of Fields and
Applications in Engineering
STEPHEN TOU
RED BOX RULES ARE FOR PROOF STAGE ONLY. DELETE BEFORE FINAL PRINTING.
TOU
Visualization
of Fields and A
pplications in Engineering
Driven by advances in computer technology, engineering analysis has developed rapidly and extensively in recent times; Visualization of Fields and Applications in Engineering presents the basic techniques for tensor � eld visualization and mapping of engineering data. Focusing on the fundamental aspects of post processing databases and applications outputs, the author explores existing theories and their integration in tensor � eld visualization and analysis. � e subject covers fundamental theories through to integrated, multi-disciplinary technologies with practical applications in engineering and computer/ general sciences.
Visualization of Fields and Applications in Engineering is suitable for academic use and to serve as a source of reference. It will appeal to those who work in the engineering and science professions or in pursuit of academic training and research.
• Off ers a unique engineering approach to basic techniques for tensor � eld visualization and mapping
• Collates together material currently disseminated throughout the literature into one accessible point of reference
• Presents examples with applications beyond and across many disciplines
Visualization of Fields and Applications in EngineeringSTEPHEN TOU

P1: OTE/OTE/SPH P2: OTEfm JWST036-Tou March 11, 2011 8:55 Printer Name: Yet to Come

P1: OTE/OTE/SPH P2: OTEfm JWST036-Tou March 11, 2011 8:55 Printer Name: Yet to Come
Visualization of Fieldsand Applicationsin Engineering

P1: OTE/OTE/SPH P2: OTEfm JWST036-Tou March 11, 2011 8:55 Printer Name: Yet to Come

P1: OTE/OTE/SPH P2: OTEfm JWST036-Tou March 11, 2011 8:55 Printer Name: Yet to Come
Visualization of Fieldsand Applicationsin Engineering
Stephen Tou
A John Wiley and Sons, Ltd., Publication

P1: OTE/OTE/SPH P2: OTEfm JWST036-Tou March 11, 2011 8:55 Printer Name: Yet to Come
This edition first published 2011C© 2011 John Wiley & Sons Ltd.
Registered officeJohn Wiley & Sons Ltd, The Atrium, Southern Gate, Chichester, West Sussex, PO19 8SQ,United Kingdom
For details of our global editorial offices, for customer services and for information about howto apply for permission to reuse the copyright material in this book please see our website atwww.wiley.com.
The right of the author to be identified as the author of this work has been asserted inaccordance with the Copyright, Designs and Patents Act 1988.
All rights reserved. No part of this publication may be reproduced, stored in a retrievalsystem, or transmitted, in any form or by any means, electronic, mechanical, photocopying,recording or otherwise, except as permitted by the UK Copyright, Designs and Patents Act1988, without the prior permission of the publisher.
Wiley also publishes its books in a variety of electronic formats. Some content that appears inprint may not be available in electronic books.
Designations used by companies to distinguish their products are often claimed astrademarks. All brand names and product names used in this book are trade names, servicemarks, trademarks or registered trademarks of their respective owners. The publisher is notassociated with any product or vendor mentioned in this book. This publication is designed toprovide accurate and authoritative information in regard to the subject matter covered. It issold on the understanding that the publisher is not engaged in rendering professional services.If professional advice or other expert assistance is required, the services of a competentprofessional should be sought.
Library of Congress Cataloging-in-Publication Data
Tou, Stephen.Visualization of fields and applications in engineering / Stephen Tou.
p. cm.Includes bibliographical references and index.ISBN 978-0-470-97397-4 (hardback)1. Engineering mathematics. 2. Fluid dynamics–Mathematics. 3. Electromagnetic
fields–Mathematical models.4. Gravitational waves–Mathematical models. 5. Information visualization. I. Title.
TA330.T68 2011620.001′51–dc22
2010039468
A catalogue record for this book is available from the British Library.
Print ISBN: 978-0-470-97397-4ePDF ISBN: 978-0-470-97826-9oBook ISBN: 978-0-470-97825-2ePub ISBN: 978-0-470-97846-7
Set in 10/12pt Palatino by Aptara Inc., New Delhi, India.

P1: OTE/OTE/SPH P2: OTEfm JWST036-Tou March 11, 2011 8:55 Printer Name: Yet to Come
Contents
Preface ix
1 Introduction 11.1 A General View 11.2 Historical Development and Progress in Visual Science 31.3 Scientific Visualization Philosophy, Techniques and
Challenges 7
2 Field Descriptions and Kinematics 112.1 Lagrangian/Eulerian Description and Transformation 112.2 Curvilinear Coordinates 15
2.2.1 Polar Coordinate 242.2.2 Streamline (Flux Line) Coordinates 292.2.3 Potential-Stream Function Coordinates 43
2.3 Field Kinematics and Visual Attributes 492.3.1 Field Line Trajectory 492.3.2 Field Line Integral Curves 502.3.3 Field Lines, Material Lines and Path Lines 542.3.4 Streamlines (Flux Lines) 56
3 Field Model, Representation and Visualization 633.1 Field Models and Concepts 633.2 Scalar Fields and Representation 653.3 Vector Fields and Representation 683.4 Vector Icons and Classifications 69
3.4.1 Classification Based on Domain Configurations 703.4.2 Classification Based on Information Levels 703.4.3 Classification Based on Topological Skeleton 71
3.5 Scalar Potential 713.6 Vector Potential 74
P1: OTE/OTE/SPH P2: OTEfm JWST036-Tou March 11, 2011 8:55 Printer Name: Yet to Come
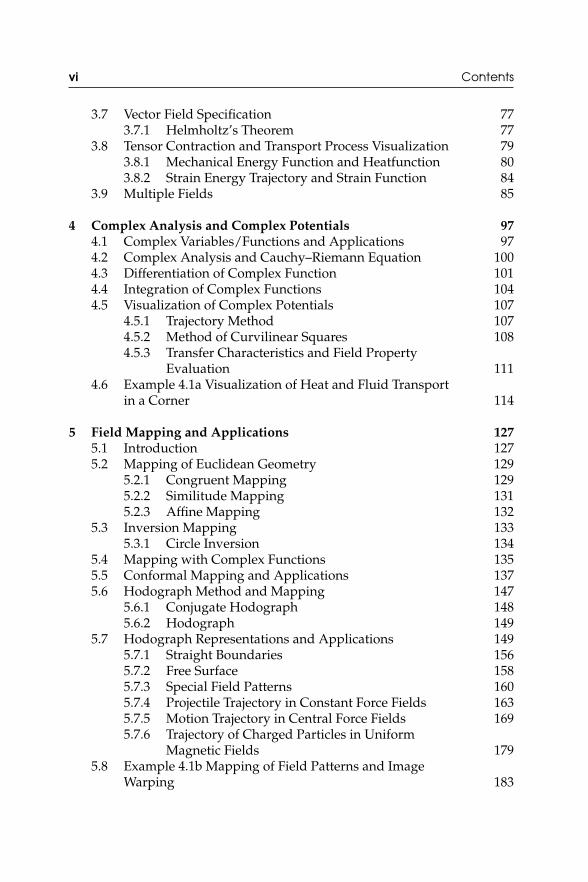
vi Contents
3.7 Vector Field Specification 773.7.1 Helmholtz’s Theorem 77
3.8 Tensor Contraction and Transport Process Visualization 793.8.1 Mechanical Energy Function and Heatfunction 803.8.2 Strain Energy Trajectory and Strain Function 84
3.9 Multiple Fields 85
4 Complex Analysis and Complex Potentials 974.1 Complex Variables/Functions and Applications 974.2 Complex Analysis and Cauchy–Riemann Equation 1004.3 Differentiation of Complex Function 1014.4 Integration of Complex Functions 1044.5 Visualization of Complex Potentials 107
4.5.1 Trajectory Method 1074.5.2 Method of Curvilinear Squares 1084.5.3 Transfer Characteristics and Field Property
Evaluation 1114.6 Example 4.1a Visualization of Heat and Fluid Transport
in a Corner 114
5 Field Mapping and Applications 1275.1 Introduction 1275.2 Mapping of Euclidean Geometry 129
5.2.1 Congruent Mapping 1295.2.2 Similitude Mapping 1315.2.3 Affine Mapping 132
5.3 Inversion Mapping 1335.3.1 Circle Inversion 134
5.4 Mapping with Complex Functions 1355.5 Conformal Mapping and Applications 1375.6 Hodograph Method and Mapping 147
5.6.1 Conjugate Hodograph 1485.6.2 Hodograph 149
5.7 Hodograph Representations and Applications 1495.7.1 Straight Boundaries 1565.7.2 Free Surface 1585.7.3 Special Field Patterns 1605.7.4 Projectile Trajectory in Constant Force Fields 1635.7.5 Motion Trajectory in Central Force Fields 1695.7.6 Trajectory of Charged Particles in Uniform
Magnetic Fields 1795.8 Example 4.1b Mapping of Field Patterns and Image
Warping 183

P1: OTE/OTE/SPH P2: OTEfm JWST036-Tou March 11, 2011 8:55 Printer Name: Yet to Come
Contents vii
6 Tensor Representation, Contraction and Visualization 1996.1 Introduction 1996.2 Development of Tensor Visualization Techniques 200
6.2.1 Mohr’s Circle 2006.2.2 Tensor Field Line Trajectories (Lines of Principal
Stress) 2006.2.3 Isochromatics 2016.2.4 Isoclines 2016.2.5 Stress Trajectories 2016.2.6 Slip Lines 2016.2.7 Isopachs 201
6.3 Tensor Description and Representation 2016.3.1 Tensor Icons and Classification 204
6.4 Tensor Decomposition and Tensor Rank Reduction 2046.4.1 Strain Tensor and Stress Tensor 2066.4.2 Rotation Tensor 2076.4.3 Rate of Strain Tensor and Viscous Stress Tensor 2086.4.4 Vorticity Tensor 2106.4.5 Tensor Contractions: Tensor Vector on a
Reference Plane 2136.4.6 Tensor Contractions: Tensor Vector at a Point 214
6.5 Visualization of Symmetric Tensors 2146.5.1 Tensor Invariants 2146.5.2 Tensor Transformation 2176.5.3 Principal States and Eigenanalysis 2176.5.4 Hybrid Method of Tensor Visualization 227
6.6 Visualization of Antisymmetric Tensors 2286.6.1 Vorticity Concepts and Dynamics 2286.6.2 Forced Vortex 2326.6.3 Free Vortex 2376.6.4 Vortices Transport and Vorticity Function 240
6.7 Example: 4.1c Convective Momentum Flux TensorVisualization 242
7 Critical Point Topology, Classification and Visualization 2497.1 Introduction 2497.2 Complex Analysis of Critical Point 2517.3 Critical Point Theory and Classification 257
7.3.1 Symmetric Tensor: [∇V] = [∇V]T ;Im1 = Im2 = 0 261
7.3.2 Antisymmetric Tensor: τii = 0, i = j ;τij = −τji, i �= j 262
7.3.3 Asymmetric Tensor 262

P1: OTE/OTE/SPH P2: OTEfm JWST036-Tou March 11, 2011 8:55 Printer Name: Yet to Come
viii Contents
7.4 Example 4.1d Critical Point Topology 2637.5 Singular Point Visualization and Mapping 2657.6 Example 7.1 Mapping of a Point Source 266
8 Engineering Application Examples 2738.1 Example 8.1: Torsion of a Square Beam 2738.2 Example 8.2: Bending of a Cantilever Beam Subject to a
Point Load 3028.3 Example 8.3: Squeezing Flow and Vorticity Transport 3238.4 Example 8.4: Groundwater Flows in an Anisotropic
Porous Medium 345
References 365
Index 369

P1: OTE/OTE/SPH P2: OTEfm JWST036-Tou March 11, 2011 8:55 Printer Name: Yet to Come
Preface
Visual representation is an art in science to deliver the beauty of patterns andgraphs otherwise difficult to convey in words, if not impossible. The purposeof this manuscript is to present the basic techniques for tensor field visual-ization and mapping from an engineering approach. A tremendous amountof research and development has been devoted to the scientific visualizationof field data in computer science, engineering and data/image processingtechnology. The manuscript focuses on the fundamental aspects of post pro-cessing digital database and applications. An attempt is made to exploreexisting theories and their integration in tensor field visualization, transfor-mation and analysis. Examples cover a variety of engineering problems withapplications beyond and across disciplines.
Evolution and development of visual science driven by computer technol-ogy have been so rapid and extensive in arts and physical sciences that itis timely to introduce the subject from an applied approach. The materialsare suitable for academic use. The manuscript is also intended to serve as asource of references for those who work in data representation, transforma-tion/analysis or in scientific visualization and applications.
The acknowledgement due on completion of this manuscript is far beyondwords. The author would like to dedicate this work to those who made itpossible and to express his gratitude for the understanding and support fromhis family. The author thanks them all from the bottom of his heart.
S.K.W. Tou2010

P1: OTE/OTE/SPH P2: OTEfm JWST036-Tou March 11, 2011 8:55 Printer Name: Yet to Come

P1: OTA/XYZ P2: ABCc01 JWST036-Tou February 16, 2011 9:31 Printer Name: Yet to Come
1Introduction
1.1 A General View
Newton’s law of universal gravitation describes the interaction between dis-crete point masses at distances apart. The nature of gravitational forces andthe idea of an object interacting on a distant object of finite sizes are easier tovisualize when a model of force fields is employed. This idea of a field modelcame about because of the conceptual problems inherent in Newton’s lawof universal gravitation interpreted as action at a distance. The idea lendsitself to pictorial description and explains how one object knows the exis-tence of another object in a field model. With the introduction of conceptof force transmission and concepts of fields and potentials, we think of thespace surrounding the earth as permeated by a gravitational field of forcecreated by the earth. Any mass placed in the field experiences a force dueto this field. Gravitational field is one of the physical fields in nature thatexerts a force at a mass center point in space with a specific magnitude anddirection towards the earth center, giving rise to a field line (line of force).Gravitational fields are represented by vector diagrams using a system of lineof forces radiating from the earth center like a pencil of rays. It is then saidthere exists a first order tensor field. Tensors are multivariate data embeddedwith complex information in time and space. A vivid pictorial representationof tensor field by field line distributions is essential for an understandingand perception of field characteristics and behaviors. It adds significantlyto our ability to interpret physical phenomena. An accurate graphical rep-resentation of a first order tensor field must convey both magnitudes anddirections of the fields in space. In addition, the point or line of action isalso essential. Several graphical display methods are in common use. In a
Visualization of Fields and Applications in Engineering, First Edition. Stephen Tou.C© 2011 John Wiley & Sons, Ltd. Published 2011 by John Wiley & Sons, Ltd.
1

P1: OTA/XYZ P2: ABCc01 JWST036-Tou February 16, 2011 9:31 Printer Name: Yet to Come
2 Visualization of Fields and Applications in Engineering
vector diagram, the length or thickness of each vector line segment at se-lected points is drawn proportional to its magnitude with arrows pointingin the field directions. These discrete geometric vectors making up a fieldof arrows are regarded as position vectors emanating from the points of in-terest. They generally cause cluster. In this respect, field line trajectories arecommonly used to compliment a vector diagram with continuity. A tangentalong a field line trajectory defines the direction of vector fields at a point.Field line trajectories are a graphical representation of lines of action contin-uously throughout the field domains. They are a system of non-intersectingcurves in space except at a singular/critical point. This field trajectory methodis generally applicable to any vector fields regardless of their nature, sourceor domain dimension.
The other method employs a family of flux lines (streamlines) generatedfrom the corresponding vector potential (stream function) when vector fieldsare steady, two dimensional and solenoidal. Similarly, tangents along a fluxline trajectory define the vector field directions. Flux line trajectories arespaced in such a way that the number of lines crossing a unit area placedperpendicular to the field at some points is proportional to the magnitude ofthe field at that point. When flux lines are displayed at equal contour intervalsin a physical plane, the resulting flux density is a measure of field strengthsince flux bounded between flux lines is invariant in solenoidal fields. Fluxlines are crowded closely where the field is strong or conversely. They obviatethe cumbersome use of arrow segments having various length or thickness.Flux line trajectories are a contour representation of stream function, whichassumes a constant different from one streamline to another. The engagementwith stream function gives flux line trajectories the advantage over fieldline trajectories. Stream function ensures equation of continuity is satisfiedeverywhere. It is able to determine vector field directions, magnitudes andproperty transport quantitatively.
In irrotational fields, another set of lines referred to as equipotentialsis produced to provide another means of vector field visualization. Theyare derived from the corresponding scalar potential (or potential function)which describes field transport capability quantitatively in terms of poten-tial levels with respect to a reference datum. Potential gradients indicatevector field magnitudes and directions, which correspond to the tangentsalong flux lines. Along these directions maximum spatial rate of potentialchange occurs. In two-dimensional fields, equipotentials are also spaced atconstant contour intervals such that equipotential density is a measure of fieldstrength. Equipotential contours are crowded closely where the field is strongor conversely.
For harmonic fields, both equipotentials and streamlines exist and aremapped together to produce a field map in a physical plane as shown inFigure 1.1. These two sets of curves cross each other orthogonally forming a

P1: OTA/XYZ P2: ABCc01 JWST036-Tou February 16, 2011 9:31 Printer Name: Yet to Come
Introduction 3
kV ˆ×= ∇= ∇ ψφψ∇
2Cstreamline =ψ
1Cequipotential =φ
x
y
Figure 1.1 Field map.
network of curvilinear squares. In particular, when field maps are producedwith a constant ratio of contour intervals equal to curvilinear square aspectratio of unity, they are an effective means for graphical representation of vec-tor fields. Thus, scalar potentials and vector potentials play a central role informing the platform for vector field visualization and analysis. In the presentstudy, they are also employed to construct complex potentials paving the wayfor mapping fields between complex planes.
Graphical representations of second order tensors remain challenging. Tra-ditionally they are visualized through their principal states. In the presentstudy, the tensor rank reduction method is applied to extract tensor vectorson a reference plane or at a point by contraction. The method is extended toinclude the use of tensor invariants. Last but not least, the hybrid methodof displaying evolving tensor ellipse icons along principal axes trajectories iseffective for second order tensor field visualization.
1.2 Historical Development and Progress inVisual Science
Graphical representation and visualization of fields and transport phenom-ena go back centuries. Ancient Babylonians/Egyptians and historians ofarchitecture/artists developed the concept of measurement and descriptivegeometry to describe patterns and beauty of shapes. Leonardo da Vinci, agreat scientist and artist in the Renaissance period described movement ofwater, vortices and floating objects and presented sketches of botany andstreamline/shapes. Regular polygons/polyhedra were subjects of specialstudy by ancient Greeks. They led to visual conceptual graphics in the fieldof astronomy reflected in the work of Kepler. In his scientific exploration ofthe universe, Kepler succeeded in describing the planet systems and orbitsby arranging a set of regular polyhedral in three-dimensions. As the arts of