Visualising a comparison of simulated urban heat islands ... · Visualising a comparison of...
8
Visualising a comparison of simulated urban heat islands: a case study of two Slovakian cities Ján Feranec a, *, Juraj Holec b , Pavel Šťastný b , Daniel Szatmári a , Monika Kopecká a a Institute of Geography, Slovak Academy of Sciences, Stefanikova 49, 814 73 Bratislava, Slovak Republic, [email protected], [email protected], [email protected] b Slovak Hydrometeorological Institute, Jeseniova 17, 833 15 Bratislava, Slovak Republic, [email protected], [email protected] * Corresponding author Abstract: Temperature increases in cities affects inhabitants’ quality of life, justifying the extent of research focusing on identifying, analysing, and assessing the relationship between the density of urban fabric represented by land cover/land use (LC/LU) classes and manifestation of the urban heat island (UHI) phenomenon. This paper delimits LC/LU classes for the urban Bratislava (2,117 ha of class 12110 dominated in 2016) and Trnava (598 ha of class 12120 dominated in 2016). The greatest median air temperature over 33 °C (at 18:00) was derived with the MUKLIMO model for the class Continuous urban fabric with the sealing degree > 80% in Bratislava. The graphic outputs improve our perception and evaluation of the LC/LU and UHI relationship. The information potential of the graphical outputs may increase through use of computer animations to represent the temperature changes during day or the temperature changes among years. Keywords: urban landscape, urban heat island (UHI), model MUKLIMO, Urban Atlas data, Slovakia 1. Introduction Big cities are, and will continue to be, ever more exposed to the risk of increasing surface and air temperatures resulting from the replacement of natural landscapes with artificial construction materials, namely concrete and asphalt (Feranec et al., 2019). The physical properties of construction materials (greater solar radiation accumulation than the reflection, greater heat capacity and conductivity) and population growth are directly associated with increasing city temperatures. At present, 75% of Europeans live in cities and the proportion will increase to 80% before 2020. It is projected that in 2050 almost 70% (about 6.3 billion) of Earth’s population will live in cities (Lauriola, 2016). Temperature changes in a densely built-up urban environment are associated with the urban heat island (UHI) phenomenon that occurs in urban areas and is generally distinguished by both higher surface and air temperatures (Yow, 2007) compared to the surrounding rural landscape (Oke, 1995; Weng, 2011; Lauriola, 2016). Tracking and assessing increased city temperatures has become the subject of numerous scientific activities. Solving the UHI problem may contribute to improved quality of life in cities, but also to energy saving (air conditioning and other cooling systems improving the living comfort) (Feranec et al., in print). The aim of this paper is to demonstrate some of the results obtained through the Effect of impermeable soil cover on urban climate in the context of climate change (an example of two Slovak cities Bratislava and Trnava) project supported by the Slovak Research and Development Agency (SRDA) that emphasized: Identification and delimitation of land cover/land use (LC/LU) classes in urban Bratislava and in Trnava; Application of the micro-scale urban climate model (Mikroskaliges Urbanes KLIma Model – MUKLIMO), which makes it possible to simulate and forecast heat characteristics of an UHI and other climate characteristics; Assessment and comparison of temperatures for a model day (i.e., July 30, 2018) for both cities; Graphic visualisation of urban areas characteristics in Bratislava and Trnava and the corresponding simulated heat characteristics from the MUKLIMO model, and possible input into the visualisation by means of computer animation. The main challenge of this study was to evaluate the spatiotemporal pattern of UHI – not only the change in space between various LC/LU classes within the studied cities, but also in time – and how LC/LU changes affected the intensity of UHI. 2. Methodology and case study 2.1 Studied cities Bratislava and Trnava are the capitals of two of the eight autonomous administrative regions of Slovakia, Self- Governing Regions – NUTS 2 (Figure 1). The urban areas of the cities have significantly increased in the last twenty years due to the construction of new automobile plants (Volkswagen in Bratislava and Peugeot-Citroen in Advances in Cartography and GIScience of the International Cartographic Association, 1, 2019. 29th International Cartographic Conference (ICC 2019), 15–20 July 2019, Tokyo, Japan. This contribution underwent single-blind peer review based on the full paper. https://doi.org/10.5194/ica-adv-1-6-2019 | © Authors 2019. CC BY 4.0 License.
Transcript of Visualising a comparison of simulated urban heat islands ... · Visualising a comparison of...

Visualising a comparison of simulated urban heat islands: a case study of two Slovakian cities
Ján Feranec a, *, Juraj Holec b, Pavel Šťastný b, Daniel Szatmári a, Monika Kopecká a a Institute of Geography, Slovak Academy of Sciences, Stefanikova 49, 814 73 Bratislava, Slovak Republic, [email protected], [email protected], [email protected] b Slovak Hydrometeorological Institute, Jeseniova 17, 833 15 Bratislava, Slovak Republic, [email protected], [email protected]
* Corresponding author
Abstract: Temperature increases in cities affects inhabitants’ quality of life, justifying the extent of research focusing on identifying, analysing, and assessing the relationship between the density of urban fabric represented by land cover/land use (LC/LU) classes and manifestation of the urban heat island (UHI) phenomenon. This paper delimits LC/LU classes for the urban Bratislava (2,117 ha of class 12110 dominated in 2016) and Trnava (598 ha of class 12120 dominated in 2016). The greatest median air temperature over 33 °C (at 18:00) was derived with the MUKLIMO model for the class Continuous urban fabric with the sealing degree > 80% in Bratislava. The graphic outputs improve our perception and evaluation of the LC/LU and UHI relationship. The information potential of the graphical outputs may increase through use of computer animations to represent the temperature changes during day or the temperature changes among years. Keywords: urban landscape, urban heat island (UHI), model MUKLIMO, Urban Atlas data, Slovakia
1. Introduction Big cities are, and will continue to be, ever more exposed to the risk of increasing surface and air temperatures resulting from the replacement of natural landscapes with artificial construction materials, namely concrete and asphalt (Feranec et al., 2019). The physical properties of construction materials (greater solar radiation accumulation than the reflection, greater heat capacity and conductivity) and population growth are directly associated with increasing city temperatures. At present, 75% of Europeans live in cities and the proportion will increase to 80% before 2020. It is projected that in 2050 almost 70% (about 6.3 billion) of Earth’s population will live in cities (Lauriola, 2016). Temperature changes in a densely built-up urban environment are associated with the urban heat island (UHI) phenomenon that occurs in urban areas and is generally distinguished by both higher surface and air temperatures (Yow, 2007) compared to the surrounding rural landscape (Oke, 1995; Weng, 2011; Lauriola, 2016). Tracking and assessing increased city temperatures has become the subject of numerous scientific activities. Solving the UHI problem may contribute to improved quality of life in cities, but also to energy saving (air conditioning and other cooling systems improving the living comfort) (Feranec et al., in print). The aim of this paper is to demonstrate some of the results obtained through the Effect of impermeable soil cover on urban climate in the context of climate change (an example of two Slovak cities Bratislava and Trnava)
project supported by the Slovak Research and Development Agency (SRDA) that emphasized:
Identification and delimitation of land cover/land use (LC/LU) classes in urban Bratislava and in Trnava;
Application of the micro-scale urban climate model (Mikroskaliges Urbanes KLIma Model – MUKLIMO), which makes it possible to simulate and forecast heat characteristics of an UHI and other climate characteristics;
Assessment and comparison of temperatures for a model day (i.e., July 30, 2018) for both cities;
Graphic visualisation of urban areas characteristics in Bratislava and Trnava and the corresponding simulated heat characteristics from the MUKLIMO model, and possible input into the visualisation by means of computer animation.
The main challenge of this study was to evaluate the spatiotemporal pattern of UHI – not only the change in space between various LC/LU classes within the studied cities, but also in time – and how LC/LU changes affected the intensity of UHI.
2. Methodology and case study
2.1 Studied cities
Bratislava and Trnava are the capitals of two of the eight autonomous administrative regions of Slovakia, Self-Governing Regions – NUTS 2 (Figure 1). The urban areas of the cities have significantly increased in the last twenty years due to the construction of new automobile plants (Volkswagen in Bratislava and Peugeot-Citroen in
Advances in Cartography and GIScience of the International Cartographic Association, 1, 2019. 29th International Cartographic Conference (ICC 2019), 15–20 July 2019, Tokyo, Japan. This contribution underwent single-blind peer review based on the full paper. https://doi.org/10.5194/ica-adv-1-6-2019 | © Authors 2019. CC BY 4.0 License.

Trnava) and large shopping centres in suburban areas. Anthropogenic landscape modification and a relatively rapid increase in impermeable surfaces represent critical forces driving increased UHI effects. The Bratislava study area (a part of functional urban area – FUA, see Part 2.2) is located in the southwest of Slovakia, bordering Austria to the west and Hungary to the south. Bratislava is the capital of Slovakia, the country’s largest city, and its political, cultural, and economic centre. This study area lies on both banks of the Danube River, which crosses the city from the west to the southeast. The population of Bratislava was 429,564 in December 2017 (7.78% of Slovakia’s population). Trnava is a city in western Slovakia located in the Danubian Lowland in the central part of the Trnava Plain (it is also a part of FUA Trnava, see Part 2.2). The population of Trnava was 65,382 in December 2017.
Figure 1. Location of the study areas (marked by red squares) Bratislava and Trnava in Slovakia.
2.2 Model MUKLIMO
MUKLIMO_3 was used in this study for the purposes of UHI modelling because its development and application suits Central European conditions. This three-dimensional model was developed for micro-scale applications aimed at issues of urban climate, primarily urban heat island mapping (Sievers and Zdunkowski, 1985; Sievers, 2012, 2016). The model includes predictive equations for air temperature and humidity, a parameterization for undetermined buildings, short and long-wave radiation, soil temperature and moisture balance, as well as a vegetation model. It also uses categorisations of proportions of surfaces of varied kinds using an established scale: built-up, impermeable, and permeable surface parts such as vegetation cover and soil (Sievers et al., 1983). The model has been used for UHI studies in various cities, for example, Vienna (Žuvela et al., 2014), Brno (Geletič et al., 2016, 2018), Bratislava (Holec and Šťastný, 2017), Szeged (Gál and Skarbit, 2017) or comparison of five central European cities (Bokwa et al., 2015; Bokwa et al., in print). Several model inputs are necessary, including layers of a digital elevation model, a LC/LU map, parameters of LC/LU classes, and meteorological inputs.
2.3 Model inputs
A pixel size of 100 meters was used. A digital elevation model was obtained by resampling the 90 meter SRTM model (Jarvis et al., 2008) into a 100 meter pixel size.
Figure 2. The MUKLIMO_3 model structure. Referential data from the 2012 Urban Atlas (UA) database were used to delimit LC/LU for 1998, 2007, and 2016. The UA provides characteristics about occurrence and area of LC/LU classes in 695 urban areas in Europe (i.e., Functional Urban Areas, FUAs) with population over 50,000 (Urban Atlas, 2012). The minimum LC/LU area identifiable is 1 ha with a minimum width of 20 m. Borders of the UA classes were adjusted according to SPOT-4/1998, SPOT-5/2007, Sentinel-2/2016 satellite images with computer assisted photointerpretation (CAPI; Feranec et al., 2016). LC/LU classes were further specified by complementing with ZBGIS® data (building heights and parking areas) and data about urban greenery (woody vegetation prevails outside the sealed area, grass vegetation prevails outside the sealed area, mixed vegetation (trees and grass) prevails outside the sealed area) obtained by supervised classification of the satellite images. In this way, 53 classes of prevailingly urban landscape (according to the intensity of impermeable surfaces), farming landscape, semi-natural landscape, forest landscape, waterlogged areas, and waters were derived (see Table 1). The areal extent of these classes identified for the years 1998, 2007, and 2016 were the input data for the MUKLIMO model.
2.4 Meteorological situation of studied day
Since the application of MUKLIMO_3 model is limited to warm days with clear sky and without atmospheric precipitation or sudden weather changes, July 30, 2018 was selected for simulating the UHI in Bratislava and Trnava. This day met the requirements and limitations of the model. During this day, an insignificant pressure field with warm and humid air prevailed over Slovakia. Despite the predicted possibility of a thunderstorm, there was no precipitation observed in the studied cities. Air temperature varied from 19.8 to 33.6 °C at Bratislava-airport station (B2) and from 19.5 to 34.2 °C at Jaslovské Bohunice station which was approximately 14 km from Trnava. Cloudiness varied from 10 to 40% at both stations on this day. Average wind speed at 02:00 was 1.2 m s-1 at the Bratislava-airport station and 3.6 m s-1 at the Jaslovské Bohunice station.
2 of 8
Advances in Cartography and GIScience of the International Cartographic Association, 1, 2019. 29th International Cartographic Conference (ICC 2019), 15–20 July 2019, Tokyo, Japan. This contribution underwent single-blind peer review based on the full paper. https://doi.org/10.5194/ica-adv-1-6-2019 | © Authors 2019. CC BY 4.0 License.

1. Artificial surfaces 1.1 Urban fabric 1.1.1 Continuous urban fabric – soil sealing degree ˃ 80% 1.1.1.1.0* Building height ≤ 5 m 1.1.1.2.0* Building height 5.1–10 m 1.1.1.3.0* Building height 10.1–15 m 1.1.1.4.0* Building height 15.1–20 m 1.1.1.5.0* Building height > 20 m 1.1.1.6.0* Mixed building heights 1.1.2 Discontinuous urban fabric – soil sealing degree ≤ 80% 1.1.2.1 Discontinuous dense urban fabric – soil sealing degree = 51-80% 1.1.2.1.1* Building height ≤ 5 m 1.1.2.1.2* Building height 5.1–10 m 1.1.2.1.3* Building height 10.1–15 m 1.1.2.1.4* Building height 15.1–20 m 1.1.2.1.5* Building height > 20 m 1.1.2.1.6* Mixed building heights 1.1.2.2 Discontinuous medium density urban fabric – soil sealing degree = 31-50% 1.1.2.2.1* Building height ≤ 5 m 1.1.2.2.2* Building height 5.1–10 m 1.1.2.2.3* Building height 10.1–15 m 1.1.2.2.4* Building height 15.1–20 m 1.1.2.2.5* Building height > 20 m 1.1.2.2.6* Mixed building heights 1.1.2.3 Discontinuous low density urban fabric – soil sealing degree = 11-30% 1.1.2.3.1* Building height ≤ 5 m 1.1.2.3.2* Building height 5.1–10 m 1.1.2.3.3* Building height 10.1–15 m 1.1.2.3.4* Building height 15.1–20 m 1.1.2.3.5* Building height > 20 m 1.1.2.3.6* Mixed building heights 1.1.2.4 Discontinuous very low density urban fabric – soil sealing degree ≤ 10% 1.1.2.4.1* Building height ≤ 5 m 1.1.2.4.2* Building height 5.1–10 m 1.1.2.4.3* Building height 10.1–15 m 1.1.2.4.4* Building height 15.1–20 m 1.1.2.4.5* Building height > 20 m 1.1.2.4.6* Mixed building heights 1.1.3.0.0* Isolated structures 1.2 Industrial, commercial, and transportation units 1.2.1 Industrial, commercial, public, military, private areas 1.2.1.1.0* Schools, hospitals, shopping areas, and administrative facilities 1.2.1.2.0* Production and warehouse areas 1.2.2 Road and railway networks and associated land 1.2.2.1.0* Fast transit roads and associated land 1.2.2.2.0* Other roads and associated land 1.2.2.3.0* Railways and associated land 1.2.3.0.0* Port areas 1.2.4.0.0* Airports 1.3 Mine, dump, and construction sites 1.3.1.0.0* Mineral extraction and dump sites 1.3.3.0.0* Construction sites 1.3.4.0.0* Land without current use 1.4 Artificial non-agricultural vegetated areas 1.4.1.0.0* Green urban areas 1.4.2.0.0* Sport and leisure facilities 2. Agricultural areas 2.1.0.0.0.0 Arable land – annual crops 2.2.0.0.0.0 Permanent crops 2.3.0.0.0.0 Pastures 2.4.0.0.0.0 Complex and mixed cultivation patterns 2.5.0.0.0.0 Orchards 3. Forest (natural and plantation) + Semi-natural areas 3.1.0.0.0.0 Forests 3.2.0.0.0.0 Herbaceous vegetation association 3.3.0.0.0.0 Open space with little or no vegetation 4.0.0.0.0.0 Wetlands 5.0.0.0.0.0 Water
Table 1. LC/LU nomenclature (extended from the 2012 Urban Atlas nomenclature; Meirich, 2008). The minimum mapping unit is 1 ha and minimum width of a linear polygon (e.g., roads, railways, rivers) is 20 m. * indicates that the class includes one of three types of vegetation: class code+1 – woody vegetation prevails outside sealed area, class code+2 – grass vegetation prevails outside sealed area; class code+3 – mixed vegetation (trees and grass) prevails outside sealed area; class code+0 – class with no vegetation
3 of 8
Advances in Cartography and GIScience of the International Cartographic Association, 1, 2019. 29th International Cartographic Conference (ICC 2019), 15–20 July 2019, Tokyo, Japan. This contribution underwent single-blind peer review based on the full paper. https://doi.org/10.5194/ica-adv-1-6-2019 | © Authors 2019. CC BY 4.0 License.

3. Results
3.1 LC/LU classes of the Bratislava and Trnava FUAs
LC/LU data are important inputs for the MUKLIMO model. Figure 3 shows their spatial distribution within the Bratislava and Trnava FUAs.
Figure 3. Spatial distribution of 45 LC/LU classes (from the 53 in the whole nomenclature) in the FUAs of Bratislava (a) and Trnava (b) for the year 2016. The five-digit nomenclature codes are provided in Table 1.
There were 301 individual areas of class 12110 with an overall 2,117 ha area (in 2016), thus dominating the urban landscape of FUA Bratislava (Figure 3a). Class 12110 was followed by classes 12120, 14100, and 11232. The greatest median air temperature was found in class 11160 (sealing degree > 80%, see Figure 4a, Bratislava), which reached a 33 °C simulated temperature (at 18:00).
Figure 4. Median air temperatures in selected LC/LU classes in Bratislava (a) and Trnava (b). The five-digit nomenclature codes are provided in Table 1.
Model outputs at 06:00 and 18:00 for Bratislava and Trnava are presented in Figure 5. At 06:00 in Bratislava, modelled temperature ranged up to 10 °C across the city. However, this did not primarily reflect the UHI, the temperature range primarily reflects altitude and slope
orientation with the highest temperatures on south-eastern slopes irradiated by sun. The city centre was warmer than its surrounding and this was reflective of the UHI effect. On the contrary, the lowest temperature was modelled in cold basins – valleys and concave forms in the city. At 18:00, an UHI pattern was clearly observed with the temperature range up to 7 °C. The model found the highest temperatures in the broader city centre with extensions to the southern part occupied by the biggest housing estate, Petržalka, and the eastern part occupied by housing estates and heavy industry. The UHI was not as apparent in the western part of the city where a larger portion of the area was forested (LC/LU class 14100; 31000) with more scattered built-up areas. The coldest areas were occupied by forests in the Malé Karpaty Mts. (LC/LU class 31000) in the north of the city and along the Danube River area (LC/LU class 50000) with alluvial forests (LC/LU class 31000). There were 25 individual areas of class 12120 with an overall 598 ha area that dominated the urban landscape of FUA Trnava (Figure 3b). Class 12120 was followed by classes 11222, 12110, and 14100. The greatest median air temperature was simulated (at 18:00) for classes 11215, 12110, and 12120 with large proportions of impermeable surfaces temperature, which reached more than 33 °C (Figure 4b). In comparison with Bratislava, Trnava is smaller with a much less diverse land surface. The model showed temperature differences around 1.2 °C at 06:00 as well as at 18:00 (Figure 6). The urban heat island pattern was less distinct with the warmest areas approximating the built-up area of the town, whilst the coldest ones corresponded to surrounding arable land (LC/LU class 21000). The largest LC/LU changes were in benefit of artificial surfaces in both FUAs as demonstrated in Figure 6.
3.2 Comparison of simulated temperatures
Maps of temperature differences were created in order to evaluate the effect of changes in LC/LU classes between 1998 and 2016 on urban climate. Differences at 12:00 and 18:00 are presented (Figure 6). Bratislava The temperature increase was clearly seen from the model approximately copying areas that changed into artificial areas. In contrast, temperature decreases were usually modelled when the change was into areas without use, that is, pastures and green areas. The range of temperature difference was from -1.39 °C to +1.67 °C at 12:00 and from -2.2 °C to +1.48 °C at 18:00. A general increase in the area of Bratislava was present since the change into artificial areas prevailed over the change into areas without use. Trnava Unlike Bratislava, there are no clear differences between temperatures in Trnava. One possible explanation for this deviation is presented in the discussion.
4 of 8
Advances in Cartography and GIScience of the International Cartographic Association, 1, 2019. 29th International Cartographic Conference (ICC 2019), 15–20 July 2019, Tokyo, Japan. This contribution underwent single-blind peer review based on the full paper. https://doi.org/10.5194/ica-adv-1-6-2019 | © Authors 2019. CC BY 4.0 License.
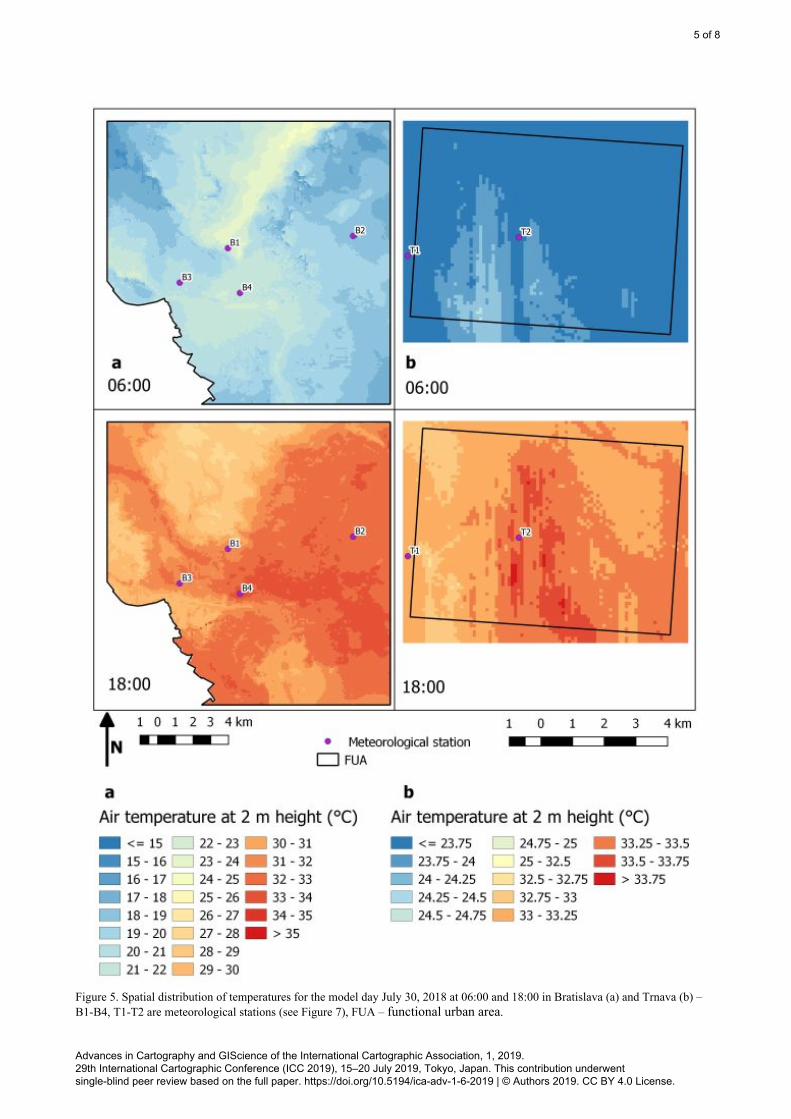
Figure 5. Spatial distribution of temperatures for the model day July 30, 2018 at 06:00 and 18:00 in Bratislava (a) and Trnava (b) – B1-B4, T1-T2 are meteorological stations (see Figure 7), FUA – functional urban area.
5 of 8
Advances in Cartography and GIScience of the International Cartographic Association, 1, 2019. 29th International Cartographic Conference (ICC 2019), 15–20 July 2019, Tokyo, Japan. This contribution underwent single-blind peer review based on the full paper. https://doi.org/10.5194/ica-adv-1-6-2019 | © Authors 2019. CC BY 4.0 License.

Figure 6. Changes in LC/LU classes and air temperature difference at 2 m height (°C) at 12:00 and 18:00 in Bratislava (a) and Trnava (b) – B1-B4, T1-T2 are meteorological stations (see Figure 7), FUA – functional urban area.
6 of 8
Advances in Cartography and GIScience of the International Cartographic Association, 1, 2019. 29th International Cartographic Conference (ICC 2019), 15–20 July 2019, Tokyo, Japan. This contribution underwent single-blind peer review based on the full paper. https://doi.org/10.5194/ica-adv-1-6-2019 | © Authors 2019. CC BY 4.0 License.

Figure 7. Measured and modelled temperatures at six meteorological stations for the model day July 30, 2018.
4. Conclusions and discussion A common feature for both cities was the model overestimation of afternoon and nocturnal temperatures. This overestimation was clear in comparisons of model and measurements temperatures (Figure 7). This model attribute was reported previously by Geletič et al. (2016). The only station with good nocturnal fitting was B4. There was a significant difference between UHI patterns and UHI changes in Bratislava and Trnava. In Bratislava, a relatively large temperatures range was observed in the model (Figure 5) and in the measurements (Figure 7). The UHI was influenced by the city’s complex land surface where the altitude range in modelled area was from 128 to 450 m a.s.l. UHI phenomena are documented in cities smaller than Trnava (e.g., Oke, 1973; Torok et al., 2001). However, in this study the MUKLIMO model underestimated the UHI intensity (i.e., temperature differences between urban and
rural areas) in Trnava. Modelled temperatures over rural land (mainly LC/LU classes 21000) were very similar to the modelled temperatures over the urban landscape despite the temperature difference between the T1 and T2 stations during the afternoon and night hours. The temperature measurements at T1 (rural) and T2 (town centre) stations were lower during afternoon and night than the MUKLIMO modelled temperatures (Figure 7). The stronger wind speed modelled in Trnava, relative to Bratislava, may have caused the model underestimation since UHI intensity depends on wind speed. The UHI is most distinct when the air is calm (Morris et al., 2001). The limitations of the MUKLIMO model include lower accuracy during night hours (Geletič et al., 2016). The combined effects of these factors probably caused the indistinctive patterns in temperature differential maps of Trnava (Figure 6). An important result of this paper is the graphic output, which improves the perception of the
7 of 8
Advances in Cartography and GIScience of the International Cartographic Association, 1, 2019. 29th International Cartographic Conference (ICC 2019), 15–20 July 2019, Tokyo, Japan. This contribution underwent single-blind peer review based on the full paper. https://doi.org/10.5194/ica-adv-1-6-2019 | © Authors 2019. CC BY 4.0 License.

relationship between LC/LU classes and the UHI. The information potential of these 2D-outputs is increased by means of computer animations that represent temperature oscillations during the day or temperature changes attributable to changing LC/LU classes.
4.1 Acknowledgements
This paper is one output of the project APVV-15-0136: Effect of impermeable soil cover on urban climate in the context of climate change (supported by the Slovak Research and Development Agency – SRDA). Thanks to H. Contrerasova for the paper translation. The paper was proofread by Proof-Reading-Service.com, Ltd.
5. References Bokwa, A., Dobrovolný, P., Gál, T., Geletič, J., Gulyás,
A., Hajto, M.J., Hollósi, B., Kielar, R., Lehnert, M., Skarbit, N., Šťastný, P., Švec, M., Unger, J., Vysoudil, M., Walawender, J.P. and Žuvela-Aloise, M. (2015). Modelling the impact of climate change on heat load increase in Central European cities. In International Conference on Urban Climate (ICUC 9). Available at www.meteo.fr/icuc9/LongAbstracts/ccma2-5-3151332_a.pdf
Bokwa, A., Geletič, J., Lehnert, M., Žuvela-Aloise, M., Hollósi, B., Gál, T., Skarbit, N., Dobrovolný, P., Hajto, M. J., Kielar, R., Walawender, J.P., Šťastný, P., Holec, J., Ostapowicz, K., Burianová, J. and Garaj, M. (in print). Heat load assessment in Central European cities using an urban climate model and observational monitoring data. Energ. Buildings.
Feranec, J., Hazeu, G. and Soukup, T. (2016). Interpretation of satelite images. In Feranec, J., Soukup, T., Hazeu, G. and Jaffrain, G. (Eds.), European Landscape dynamics: CORINE land cover data (pp. 33-40). Boca Raton: CRC Press, Taylor & Francis Group.
Feranec, J., Kopecká, M., Szatmári, D., Holec, J., Šťastný, P., Pazúr, R. and Bobáľová, H. (2019). A review of studies involving the effect of land cover and land use on the urban heat island phenomenon, assessed by means of the MUKLIMO model. Geografie 124, 83-101.
Gál, T. and Skarbit, N. (2017). Applying local climate zones as land use classes in MUKLIMO_3 for modelling urban heat load in the case of Szeged, Hungary. In Buchholz, S., Noppel, H., Žuvela-Aloise, M. and Hollósi, B. (Eds), 1st MUKLIMO_3 Users Workshop Programme and Book of abstracts, 30 p.
Geletič, J., Lehnert, M. and Dobrovolný, P. (2016). Modelled spatio-temporal variability of air temperature in an urban climate and its validation: a case study of Brno, Czech Republic. Hungarian Geographical Bulletin, 65(2), 169-180.
Geletič, J., Lehnert, M., Savić, S. and Milošević, D. (2018). Modelled spatiotemporal variability of outdoor thermal comfort in local climate zones of the city of Brno, Czech Republic. Science of the Total Environment, 624, 385-395.
Holec, J. and Šťastný, P. (2017). Modelovanie mestského ostrova tepla v Bratislave pomocou modelu MUKLIMO. Meteorologický časopis, 20, 65-72.
Jarvis, A., Reuter, H. I., Nelson, A. and Guevara, E. (2008). Holle-filled seamless SRTM data V4. International Centre for Tropical Agriculture (CIAT). Available at http://srtm.csi.cgiar.org
Lauriola, P. (2016). Introduction. In Musco, F. (Ed.): Counteracting Urban Heat Island Effects in a Global Climate Change Scenario (pp. eBook xlvii–liii). Switzerland: Springer.
Meirich, S. (2008). Mapping guide for a European Urban Atlas. GSE Land Consortium. Report ITD-0421-GSELand-TN-01. Available at http://www.eea.europa.eu/data-and-maps/data/urban-atlas/mapping-guide
Morris, C.J.G., Simmonds, I. and Plummer, N. (2001). Quantification of the Influences of Wind and Cloud on the Nocturnal Urban Heat Island of a Large City. Journal of Applied Meteorology 40, 169-182.
Oke, T.R. (1973). City size and the urban heat island. Atmospheric Environment 7, 769-779.
Oke, T.R. (1995). The heat island characteristics of the urban boundry layer. Characteristics, causes and effects. In Cermak, J.E., Davenport, A.G., Plate, E.J. and Viegas, D.X. (Eds.), Wind Climate in Cities (pp. 81-107). Waldbronn, Germany: Kluwer Academic.
Sievers, U., Forkel, R. and Zdunkowski, W. (1983). Transport equations for heat and moisture in the soil and their application to boundary layer problems. Beiträge Physik der Atmosphäre 56, 58-83.
Sievers, U. and Zdunkowski, W. (1985). A numerical simulation scheme for the albedo of city street canyons. Boundary-Layer Meteorology 33, 245-257.
Sievers, U. (2012). Das kleinskalige Strömungsmodell MUKLIMO_3. Teil 1: Theoretische Grundlagen, PC Basisversion, Validierung. In: Berichte des Deutschen Wetterdienstes, Band 240. Deutscher Wetterdienst: Offenbach am Main.
Sievers, U. (2016). Das kleinskalige Strömungsmodell MUKLIMO_3. Teil 2: Thermodynamische Erweiterun- gen. In: Berichte des Deutschen Wetterdienstes, Band 248. Selbstverlag des Deutschen Wetterdienstes, Offenbach am Main.
Torok, S.J. and Morris, C.J.G. (2001). Urban heat island features of southeast Australian towns. Australian Meteorological Magazine 50, 1-13.
Urban Atlas (2012). Available at https://land.copernicus.eu/local/urban-atlas
Weng, Q. (2011). Remote sensing of urban biophysical environment. In Weng, Q. (Ed.), Advances in environmental remote sensing: sensors, algorithms and application (pp. 513-533). Boca Raton, USA: CRC Press.
Yow, D.M. (2007). Urban heat islands: observations, impacts, and adaptation. Geography Compass 1, 6, 1227-1251.
Žuvela-Aloise, M., Koch, R., Neureiter, A., Böhm, R. and Buchholz, S. (2014). Reconstructing urban climate of Vienna based on historical maps dating to the early instrumental period. Urban Climate 10, 490-508.
8 of 8
Advances in Cartography and GIScience of the International Cartographic Association, 1, 2019. 29th International Cartographic Conference (ICC 2019), 15–20 July 2019, Tokyo, Japan. This contribution underwent single-blind peer review based on the full paper. https://doi.org/10.5194/ica-adv-1-6-2019 | © Authors 2019. CC BY 4.0 License.