Visualisation of a Three-Dimensional (3D) Objects … Adamu A., et. all.: Visualisation of a...
12
Appl. Math. Inf. Sci. 7, No. ?, 1-12 (2013) 1 Applied Mathematics & Information Sciences An International Journal http://dx.doi.org/10.12785/amis/v3d amis Visualisation of a Three-Dimensional (3D) Objects Optimal Reality in a 3D Map on a Mobile Device Adamu Abubakar 1 , Akram M. Zeki 1 , Sanah Abdullahi Muaz 2 , Haruna Chiroma 2 and Tutut Herawan 2 1 Department of Information Systems, International Islamic University Malaysia, Kuala Lumpur, Malaysia 2 Faculty of Computer Science and Information Technology, University of Malaya, Kuala Lumpur, Malaysia Received: ..., Revised: ..., Accepted: ... Published online: ... Abstract: Prior research on the subject of visualisation of three-dimensional (3D) objects by coordinate systems has proved that all objects are translated so that the eye is at the origin (eye space). The multiplication of a point in eye space leads to perspective space, and dividing perspective space leads to screen space. This paper utilised these findings and investigated the key factor(s) in the visualisation of 3D objects within 3D maps on mobile devices. The motivation of the study comes from the fact that there is a disparity between 3D objects within a 3D map on a mobile device and those on other devices; this difference might undermine the capabilities of a 3D map view on a mobile device. This concern arises while interacting with a 3D map view on a mobile device. It is unclear whether an increasing number of users will be able to identify the real world as the 3D map view on a mobile device becomes more realistic. We used regression analysis intended to rigorously explain the participants responses and the Decision Making Trial and Evaluation Laboratory method (DEMATEL) to select the key factor(s) that caused or were affected by 3D object views. The results of regression analyses revealed that eye space, perspective space and screen space were associated with 3D viewing of 3D objects in 3D maps on mobile devices and that eye space had the strongest impact. The results of DEMATEL using its original and revised version steps showed that the prolonged viewing of 3D objects in a 3D map on mobile devices was the most important factor for eye space and a long viewing distance was the most significant factor for perspective space, while large screen size was the most important factor for screen space. In conclusion, a 3D map view on a mobile device allows for the visualisation of a more realistic environment. Keywords: 3D-Map, Eye-space, Perspective space, Screen-space 1 Introduction The introduction of Global Positioning System (GPS) technology for navigational assistance has had a profound effect on the ability to find physical locations with ease, transforming the social dynamics involved in traveling on the road [1]. However, people still become lost or are unable to follow directions to reach a specific destination. In certain unfortunate situations, a wrong turn can mean the difference between life and death [2]. A three-dimensional (3D) map is a 2D or 3D visualisation of a 3D representation of a physical environment, which emphasises the 3D characteristics of the environment that are intended for navigational purposes [3]. Technically, the role of 3D maps is to provide more detailed information than is available from conventional 2D maps. Although 2D maps can represent any real or imagined space without regard to context or scale, they have the following limitations [4]: (1) The representation of landmarks entails symbols, legends and contour lines, which requires map-reading awareness; (2) The representation of route or road networks typically lacks orientation; (3) Such maps do not represent a realistic view (reality as it exists), requiring the translation of added legends that may require a certain level of expertise on the part of the user. The key benefit of a 3D representation is that it has a higher potential for accuracy in presenting spatial data. Additionally, it offers a better platform for multiple cues and small-scale features, which are better suited for locating and identifying unknown places. Creating a navigation tool on mobile devices with the help of a 3D model is undoubtedly a complex task but is certainly worth the investment [5]. It is tempting to also believe that moving from 2D to 3D visualisation will enhance user performance through natural support for spatial memory [6]. c ⃝ 2013 NSP Natural Sciences Publishing Cor.
Transcript of Visualisation of a Three-Dimensional (3D) Objects … Adamu A., et. all.: Visualisation of a...

Appl. Math. Inf. Sci. 7, No. ?, 1-12 (2013) 1
Applied Mathematics & Information SciencesAn International Journal
http://dx.doi.org/10.12785/amis/v3d amis
Visualisation of a Three-Dimensional (3D) ObjectsOptimal Reality in a 3D Map on a Mobile Device
Adamu Abubakar1, Akram M. Zeki1, Sanah Abdullahi Muaz2, Haruna Chiroma2 and Tutut Herawan2
1Department of Information Systems, International Islamic University Malaysia, Kuala Lumpur, Malaysia2Faculty of Computer Science and Information Technology, University of Malaya, Kuala Lumpur, Malaysia
Received: ..., Revised: ..., Accepted: ...Published online: ...
Abstract: Prior research on the subject of visualisation of three-dimensional (3D) objects by coordinate systems has proved that allobjects are translated so that the eye is at the origin (eye space). The multiplication of a point in eye space leads to perspective space, anddividing perspective space leads to screen space. This paper utilised these findings and investigated the key factor(s) in the visualisationof 3D objects within 3D maps on mobile devices. The motivation of the study comes from the fact that there is a disparity between3D objects within a 3D map on a mobile device and those on other devices; this difference might undermine the capabilities of a 3Dmap view on a mobile device. This concern arises while interacting with a 3D map view on a mobile device. It is unclear whetheran increasing number of users will be able to identify the real world as the 3D map view on a mobile device becomes more realistic.We used regression analysis intended to rigorously explain the participants responses and the Decision Making Trial and EvaluationLaboratory method (DEMATEL) to select the key factor(s) that caused or were affected by 3D object views. The results of regressionanalyses revealed that eye space, perspective space and screen space were associated with 3D viewing of 3D objects in 3D maps onmobile devices and that eye space had the strongest impact. The results of DEMATEL using its original and revised version stepsshowed that the prolonged viewing of 3D objects in a 3D map on mobile devices was the most important factor for eye space and along viewing distance was the most significant factor for perspective space, while large screen size was the most important factor forscreen space. In conclusion, a 3D map view on a mobile device allows for the visualisation of a more realistic environment.
Keywords: 3D-Map, Eye-space, Perspective space, Screen-space
1 Introduction
The introduction of Global Positioning System (GPS)technology for navigational assistance has had a profoundeffect on the ability to find physical locations with ease,transforming the social dynamics involved in traveling onthe road [1]. However, people still become lost or areunable to follow directions to reach a specific destination.In certain unfortunate situations, a wrong turn can meanthe difference between life and death [2]. Athree-dimensional (3D) map is a 2D or 3D visualisationof a 3D representation of a physical environment, whichemphasises the 3D characteristics of the environment thatare intended for navigational purposes [3]. Technically,the role of 3D maps is to provide more detailedinformation than is available from conventional 2D maps.Although 2D maps can represent any real or imaginedspace without regard to context or scale, they have the
following limitations [4]: (1) The representation oflandmarks entails symbols, legends and contour lines,which requires map-reading awareness; (2) Therepresentation of route or road networks typically lacksorientation; (3) Such maps do not represent a realisticview (reality as it exists), requiring the translation ofadded legends that may require a certain level of expertiseon the part of the user. The key benefit of a 3Drepresentation is that it has a higher potential for accuracyin presenting spatial data. Additionally, it offers a betterplatform for multiple cues and small-scale features, whichare better suited for locating and identifying unknownplaces. Creating a navigation tool on mobile devices withthe help of a 3D model is undoubtedly a complex task butis certainly worth the investment [5]. It is tempting to alsobelieve that moving from 2D to 3D visualisation willenhance user performance through natural support forspatial memory [6].
c⃝ 2013 NSPNatural Sciences Publishing Cor.

2 Adamu A., et. all.: Visualisation of a Three-Dimensional (3D) Objects Optimal Reality
It has become possible to render large detailed 3Dmaps onto mobile devices at interactive rates. To date,however, only a few studies have investigated how 3Dmaps as part of mobile device applications can contributeto the knowledge of human spatial behaviour. Theconcept of a “3D map view”, which is a tool that allowsusers to monitor their position (viewed from a “satellite”position) on a small virtual screen embedded in the 3Dworld, was presented in [7]. This view has drawnattention to the level of detail required for 3D maps;however, until recently, when the graphics capabilities ofmobile devices increased, 3D map visualisation on suchsmall-screen tools was limited because very few mobiledevices targeted graphical applications. Currently,though, mobile devices can render 3D at interactive rates[4]. Thus, to accelerate the rendering of a 3D map modelon a mobile device, Jiang et al. [8] proposed to breakdown the model file into separate segments that wouldconvert the 3D model into a data structure, such that thedata would be organised and compressed, to enhance therendering efficiency. One study has also suggested thatusers may prefer to combine augmented reality (AR) with3D mapping as a navigational aid rather than using theAR view alone [9]. These findings clearly indicate thatAR presents weaknesses with regard to navigation. Thus,a research question arises when considering how peoplewill interact with digital 3D maps on a mobile device. “Towhat extent is a 3D map on a small-screen mobile devicesuitable for normal viewing?” To answer this question,this study incorporated a quantitative survey withmulti-criterion decision analysis on the factor(s) thatinfluence the use of a 3D map view on a mobile device.
Subsequent to this section, the remainder of the paperis organised as follows. Section two discusses theconceptualisation of the work, and section three providesthe research methodology and results. Section fourpresents a discussion. Section five provides theconclusions of this work.
2 Conceptualisation of a 3D map view onmobile devices
As stated by [10], visualisation amplifies cognition. Ourvisual systems are designed to perceive 3D surfaces andthe shapes of the environment in which humans operate[11]. In addition to the common 3D transformationsperformed on vertices, such as translation, scaling, androtation using coordinate systems, much informationregarding 3D space coordinate conception, whichincludes eye space, perspective space and screen space, isperceived by the inward or outward turning or movementof one or both of the eyes at a different distance, resultingin vergence and accommodation. These phenomena giverise to depth perception of the real 3D space within eyespace [12,13,14]. Blinn [15] showed that the eye cannever have too much visualisation from screen space
componen X̃L and Z̃L yield a straight line when onehyperbola is plotted against the other in the expression
X̃L =A+BαE +Fα
, Z̃L =C+DαE +Fα
(1)
where A,B,C,D,E and F are 3D vector identities. Becauseeyes see shapes as parametric curves with two coordinatesgenerated by hyperbolic functions of α for both X̃L and Z̃L,it is important to note that both X̃L and Z̃L have the samedenominator in equation 1, which causes the asymptotesof X̃L and Z̃L to coincide because
α =−EF
(2)
When both asymptotes move to the origin when theparameterisation is altered by replacement, it becomes
α ′ = E +Fα (3)
This is then represented by the following straight lineexpression:
X̃L =A+B
(α ′−E
F
)α ′ =
(BF
)+
1α ′
(AF −BE
F
)(4)
Z̃L =C+D
(α ′−E
F
)α ′ =
(DF
)+
1α ′
(CF −DE
F
)(5)
The proposition then results in the parametricequation of a straight line segment. Therefore, therepresentation conforms to equally spaced points in eyespace that are equal in steps with α , and α ′, and these aretransformed to non-equally spaced points in screen space[15]. Prolonged viewing of mobile devices and otherstereo 3D devices leads to visual discomfort, aided bydiffering vergence and eye focal stimuli [16]. Humans areaccustomed to the potential of momentarily seeing thingswith a single punctate eye to indicate a natural perspective[17]. Personal awareness, however, shows that the eye isnot in the space, and imaginary spaces are subjectiverelative to the present in personal awareness [17]. For thisreason, the subjective assessment of a 3D presentationwithin any medium is necessarily based on personalawareness.
The provision of 3D maps on mobile devices willimprove users interactions with them and, thus, providelocation information more accurately. However, thisapproach might not have an effect on the users visualperception. The users might not only need location-awaremobile guides in a 3D model, but may also occasionallyneed to have an idea of what an unfamiliar place lookslike even before visiting it; the proposed services could beextremely useful on these occasions [18]. Because ourhuman perception system perceives reality scenes from a3D perspective, even when the scene is depicted on 2Dmedia, 3D maps should be considered map-related
c⃝ 2013 NSPNatural Sciences Publishing Cor.

Appl. Math. Inf. Sci. 7, No. ?, 1-12 (2013) / www.naturalspublishing.com/Journals.asp 3
representations and not maps in the classic sense. Mobiledevice screen sizes fall into three categories: large,medium, and small [19]. The corresponding sizes rangefrom 4.5 to 6.5 inches, 3.0 to 4.4 inches, and less than 3.0inches, respectively (see Figure 1).
Fig. 1: Visual display parts of the screen sizes of different mobiledevices
With respect to recognition, 3D maps are recognisedmore readily from some viewpoints than from others;however, 3D map views are identified more easily than2D map views, with a response time that decreasesmonotonically with increasing subjective quality.Nevertheless, how an individual perceives the true 3Dpresentation of reality on a mobile device might relate tothe type of representation that is used. In the presentstudy, three types of presentations were considered:pictorial realism vs. abstract views (Figure 2), 3D mapprojections vs. 2D map projections (Figure 3), and fixedviewpoints vs. manipulable viewpoints (Figure 4). At theheart of this classification lies the fact that 3D and 2Dcartographic representations are inevitably selective andincomplete. Paper maps use symbolic conventions thattend to call attention to street names, landmarks, andcrossings. However, there are no such conventions for 3Dmaps. For our study, we adopted a practical approach andcollected some samples of 3D maps that fell within theabove-mentioned categories, focusing on 3D systems thatwork on mobile devices based only on the fact that such3D maps should follow an egocentric orientation towardsreality [20]. In other words, information and the quality ofits depiction on mobile devices must be adequate and ableto display visual similarity to reality. For this reason, thefollowing hypotheses were formulated:
Fig. 2: 3D map view on mobile devices: pictorial realism vs.abstract views
Fig. 3: 3D map view on mobile devices: 3D map projection vs.2D map projection
Hypothesis 1 (H1): Eye space is associated with 3Dviewing on mobile devices as a navigational aid.Hypothesis 2 (H2): Screen space is associated with 3Dmap viewing on mobile devices for navigational aid.Hypothesis 3 (H3): Perspective space is associated with3D viewing on mobile devices as a navigational aid.
c⃝ 2013 NSPNatural Sciences Publishing Cor.

4 Adamu A., et. all.: Visualisation of a Three-Dimensional (3D) Objects Optimal Reality
Fig. 4: 3D map view on mobile devices: fixed viewpoint vs.manipulable viewpoint
It has been proven that coordinates make it possible toaddress 3D space. This study will test the hypothesesformulated above to subjectively investigate the impact of3D viewing of 3D maps on mobile devices and examinethe most influential factors that facilitate the use of 3Dmaps on mobile devices to assist in navigation.
3 Methodology
Both a quantitative survey and DEMATEL analysis wereconducted to understand the factor(s) that influence theuse of a 3D map view on mobile devices for navigationalassistance. The representational differences in 3D mapviews were considered. However, AR was not examinedbecause a considerable body of literature has alreadyinvestigated the interrelationships between AR on mobiledevices and mobile maps [9]. Thus, the focus of this studywas to investigate the factor(s) that influence the use of3D maps on mobile devices for navigational aid. Thequantitative survey evaluation was designed to generatestatistically valid quantitative results. It is ahypothesis-testing evaluation that aims to generaliseoutcomes regarding peoples navigational strategies to thegeneral population while interacting with 3Drepresentations on mobile devices. The utilisation ofDEMATEL will help to identify the most influentialfactors from the results of the quantitative survey.
A quantitative survey relies mainly on a hypothesisdeduced from a theory [21]. It uses standardisedinstruments to collect data on narrowly defined variables[22]. The reason for adopting a quantitative survey as partof this methodology was based on the nature of theresearch problem, which was confirmatory rather than
exploratory; therefore, a deductive method was usedprimarily for description, explanation, and prediction ofthe research variables [23]. An additional justification foradopting a quantitative survey was that the outcome of theresearch entails theory testing by means of a conceptualmodel. This involves developing theoretically basedhypotheses and collecting established data to test theirviability [24].
DEMATEL extracts its dataset from the multiplechoices ranking of factors observed by experts. Hence,the extracted factors must be mapped out to identify therelationship between them and determine the basis andsignificance of the evaluation criteria. The purpose ofDEMATEL is to develop and highlight theinterrelationships among evaluation criteria to determinecause and effect [25]. This technique establishedinteractions among criteria based on the type and severityof ranked interactions, where the highest-ranked criteriahad higher probabilities of being the cause criterion,whereas the criteria that were ranked lower were mostsignificantly influenced by other criteria and, thus, wereassumed to be the affected criteria [25,26,27]. Thistechnique has been used in many areas to model thevarious influences of system components and developdecision-making competencies [28]. For this study, weused both its original and revised steps within thefollowing procedure:
Step 1. The first step involves gathering expertsopinions on the bases of multiple choice questionsintended to indicate the degree to which factor i affectsfactor j. Each experts responses, Xn, are obtained, wheren = 1,2, . . . ,n. An n × n non-negative initial directrelation matrix is then constructed such that
Xn =[xn
i j]
n×n (6)
where xi j is the initial relation matrix; i and j are thecause and effect factors, respectively; and n is the numberof responses for which 1 ≤ n ≤ q. q is a matrix generatedby X1,X2, . . . ,Xq, where q is the number of experts. Thismeans that for each experts responses, a matrix isconstructed such that the diagonal elements of the matrixare set to zero because an element cannot influence itself.Therefore, an average matrix Z is generated by
Z =1q
q
∑n=1
Xn (7)
Step 2: In this step, the matrix generated in theprevious step is normalised using equation 8 to form anew matrix D, so that the sum of any row and the sum ofany column in matrix D is within the range of [0,1]
D = Max
[argmax
1≤i≤n
n
∑j=1
xi j, argmax1≤i≤n
n
∑j=1
xi j
](8)
Step 3: The total relation matrix T is constructedfrom matrix D generated in the previous step. The total
c⃝ 2013 NSPNatural Sciences Publishing Cor.

Appl. Math. Inf. Sci. 7, No. ?, 1-12 (2013) / www.naturalspublishing.com/Journals.asp 5
relationship is then established if limm→∞ Dm = [0]n×n,where m is the indirect influence Dm. This means that thesums of each row and column of the matrix are between 0and 1. Then, the total relation, which is the sum ofD + D1 + D2, . . . ,D∞, converges to zero matrix, whereT = D+D1 +D2, . . . ,D∞
T = limm→∞
(D+D2 +D3 · · ·+Dm)= D(I −D)1 (9)
and where I is an n×n identity matrix. Unfortunately,limm→∞ Dm ̸= [0]n×n may not always converge to the nullmatrix [0]n×n [28]. As a result, the total relation matrix willnot converge to the null matrix, at which time DEMATELbecomes infeasible. At this time, a revised DEMATEL tomatrix z, which uses ε (where ε is any small added valueto the maximum value of the sum of the row or columnof matrix z), is employed [28]. This measure ensures thatfor all cases, limm→∞ Dm will converge to the null matrix[0]n×n. The sum of rows (r) and columns (c) of the totalrelation matrix was then calculated in equations 10 and 11.
r = [ri]n×1 =
[n
∑j=1
xi j
]n×1
i = 1,2, . . . ,n (10)
c = [c j]1×n =
[n
∑j=1
xi j
]1×n
j = 1,2, . . . ,n (11)
where ri and c j represent the effects of criterion i onj, and if j = i, then the sum (r + c) reveals the totaleffects given and received by criterion i, whereas thedifference (r − c) shows the net effect that criterion icontributed to the system. However, when it is positive,criterion i is a net cause, but when negative, criterion i is anet receiver. Finally, the threshold value (α) is calculatedbased on the experts opinions. Thus, in this study,equation 12 is proposed in a manner similar to the studyperformed by [26]; hence, an interaction diagram wasconstructed based on the (α) value,
α =1N
n
∑i=1
n
∑j=1
xi j (12)
where N is the number of elements in the matrixcomputed by the average of the elements in matrix T toextract some minor effects were necessary. This meansthat effects below the threshold value were not selectedfor presentation of the impact relationships [27].
Step 4: The relationship diagram for the cause andeffect was constructed in this step. Cause and effect aremapped out to indicate the interactions among thesub-construct, revealing the most important factors andhow they influence others [26].
3.1 Population, Sampling, and Data CollectionTechniques
The sample used for the quantitative survey andDEMATEL was drawn from metropolitan Kuala Lumpur
and some parts of northern and southern Malaysia.Multiple methods exist for generating the correctsampling technique. Leedy and Ormrod [29], for instance,stated that identifying good samples for research dependson the research question itself. However, these chosensamples are also based on whether the research approachis quantitative, qualitative, or both. Analysis of pilot datacontributed to the sampling criteria of this study. Wechose simple random sampling because it is anappropriate technique in which meaningful in-depth datafrom the population are acquired [30]. Individuals areselected randomly, and their responses are collected andfiltered based on experience to yield the most informationabout the topic under investigation. Conveniencesampling was used for DEMATEL because this type ofstudy recognises that some informants are more usefulthan others, and those individuals are more likely toprovide insight and understanding [31]. In essence, theinformation required for this type of approach targetedexperts who could provide a complete understanding ofthe research needs [30].
The sample size for the quantitative survey was basedon the available individuals who had experience withnavigation-aiding devices in general and/or navigationdevices with 3D viewing on mobile devices specifically.Therefore, an estimated number of 350-450 subjects wasanticipated for the quantitative survey, whereas 11 expertson 3D visualisation were selected for the DEMATELanalysis. The primary data collection technique for both aquantitative survey and a DEMATEL analysis within thestated population and sample frame entails the use ofquestionnaires. Indeed, there are advantages to usingquestionnaires as a means of data collection over the useof an interview, internet, mail, or telephone collectionmethods. Questionnaires, for example, are less expensiveand easier to administer than personal interviews andallow confidentiality to be assured [29]. The questionnaireitems were designed based on answers to the researchquestions, which were produced via some modificationsto the previous closely related items from closely relatedresearch to be suitable for the present study. The outlinesof the questionnaire included Likert -type answers with arange of seven responses for the quantitative survey andLikert -type answers with a range of five responses for theDEMATEL analysis. The participants in the quantitativesurvey were asked to rate the extent to which they agreedwith given statements as follows: (1) strongly disagree,(2) disagree, (3) somewhat disagree, (4) neither agree nordisagree, (5) somewhat agree, (6) agree, and (7) stronglyagree, whilst the experts for the DEMATEL analysis wereasked to rate their agreement along a range from 0 to 4,representing “no influence”, “little influence”, “mediuminfluence”, “strong influence”, and “very stronginfluence”, respectively. The seven-level Likert scale inthe quantitative survey was used because of its widerscope and range of participants responses, whichsignificantly affected the data analysis [31], while the
c⃝ 2013 NSPNatural Sciences Publishing Cor.

6 Adamu A., et. all.: Visualisation of a Three-Dimensional (3D) Objects Optimal Reality
five-level Likert scale measure is the standard scorecriteria for DEMATEL analysis.
The questionnaires for both the quantitative surveyand the DEMATEL analysis were validated through apre-test survey, which evaluated the questionnaires bytesting them on a small sample of participants to identifyand eliminate potential problems that might arise or toaddress an unforeseen fault that could potentially impactthe results. This procedure allowed us to identifyambiguity in the wording of the items and to identify newitems that needed to be included. Thus, the feedbackobtained at this stage was included in the revised finalquestionnaire under the scale items as follows:1. Eyse spaceBy subjective analysis, “eye space” refers to the positionwithin the visual field relative to the eye and the viewingarea, and it pertains to eye direction and pupil diameter aswell [32]. Respondents views on the four scaled itemswithin the eye space construct are considered to expressthe perceived adaptation to environmental demands for3D objects on a 3D map. This effect is crucial,considering that eye space diminishes reality by way ofappearance and 3D geometry [33]. Therefore, theresponses regarding the extent to which respondents werecomfortable with 3D objects that were occluded by otherobjects on the 3D map in the mobile device will assistknowledge discovery about what factors influence the eyespace effects of visualisations of a 3D object on a 3Dmap, as will responses on whether the view was realisticto the viewer, was presented such that it enhanced visualcognition upon either prolonged viewing or at a glance, orled to visual discomfort. Considering this information, thefollowing scaled items were used:
–I can see 3D objects that are occluded by other objectson a 3D map of my mobile device
–3D objects of a 3D map on a mobile device are realisticto my eye
–3D objects of a 3D map on a mobile device enhancemy visual cognition
–Prolonged viewing of 3D objects or a 3D map on mymobile devices leads to visual discomfort
2. Perspective spaceA 3D object within a 3D map on a mobile device used asa navigation aid indicates a realistic scene as people movethrough an environment. Users will change both theirheading and their location relative to the surroundings[34]. During such changes, the 3D objects will updatetheir changing orientations with respect to the physicalscene. Perspective space, as a construct for this study,entails the appearance of the present scene to the eye,which then aims to create an illusion of reality [34,35,36]. Subjective evaluations, in contrast to objectiveassessments of the perspective space, are crucial inunderstanding and associating navigational aid with the3D map on different mobile devices. To extract howpeople perceive 3D objects based on the relative distances
of objects conveyed on their mobile devices, thefollowing scaled items were used:
–I am satisfied with the size of 3D objects on a small-screen mobile device.
–I am satisfied with the size of 3D objects on a medium-screen mobile device.
–I am satisfied with the size of 3D objects on a large-screen mobile device.
3. Screen spaceThe screen space on mobile devices remains a drawbackfor mobile content delivery for use in a more realisticsituation whilst walking outside [37]. This situation isclosely tied to navigation because the mobile device isused as a navigational aid. An objective approach formaximising the efficiency of a small screen space hasbeen proposed by [38]. However, there may be hugediscrepancies between what people perceive in 3D mapson mobile devices and other presentational views. Todetermine the extent to which people can perceive 3Dobjects within the screen space on a mobile device, thefollowing scaled items were used:
–3D objects visible in a 3D map on a mobile device inan unobstructed range.
–The viewing distance from my eyes to 3D objectsappearing on a mobile devices screen
–Zooming from small-scale and large-scalepresentations of 3D objects on a mobile device
The scaled items are questionnaire items that were usedfor both the MCDA and the quantitative survey, with afew modifications. The modifications were necessarybecause for the MCDA, the aim was to extract the keyitem within a construct that exerted the highest positiveinfluence on that construct. Unlike a regression analysis,in which the relationships of all of the items to the entireconstruct are examined, MCDA identifies a key item thatimpacts all of the other items within the entire construct .Thus, the scale items and their corresponding codingschemes used for MCDA were as follows:1. Eyse space
–How do you rate the influence of 3D objects that areoccluded by other objects in a mobile devices 3D mapon eye space? –[Visual density: (E1)]
–How do you rate the influence of eye space on therealism of 3D objects viewed in a 3D map on a mobiledevice? –[Visual realism: (E2)]
–How do you rate the influence of eye space on thevisual cognition of 3D objects viewed in a 3D map ona mobile device? –[Visual appearance: (E3)]
–How do you rate the influence of the prolongedviewing of 3D objects in a 3D map on a mobile deviceon visual discomfort –[Visual time: (E4)]
2. Perspective space
–How do you rate the influence of 3D objects in a 3Dmap on a mobile device when viewed from a shortdistance –[Short viewing distance: (P1)]
c⃝ 2013 NSPNatural Sciences Publishing Cor.
Appl. Math. Inf. Sci. 7, No. ?, 1-12 (2013) / www.naturalspublishing.com/Journals.asp 7
–How do you rate the influence of 3D objects in a 3Dmap on a mobile device when viewed from a medium-range distance –[Medium viewing distance: (P2)]
–How do you rate the influence of 3D objects in a 3Dmap on a mobile device when viewed from along-range distance –[Long viewing distance: (P3)]
3. Screen space
–How do you rate the influence of 3D objects in a 3Dmap on a small-screen mobile device –[Small screen:(S1)]
–How do you rate the influence of 3D objects in a 3Dmap on a medium-screen mobile device –[Mediumscreen: (S2)]
–How do you rate the influence of 3D objects in a 3Dmap on a large-screen mobile device –[Large screen:(S3)]
Each scale item under the main factor represents a sub-construct, which made it easier for the experts to rank eachquestion by understanding the researchers intended scope.This was better than providing many questions for a sub-construct to be used as the main construct.
Approximately 570 survey questionnaires weredistributed for the quantitative survey to collect datathrough self-administered research assistance and webtechniques. This number was double the expected numberof responses because we anticipated a response rate of atleast 50%, as noted in [30]. Finally, the data collected aspart of the quantitative survey were analysed using bothdescriptive and inferential statistics implemented withSPSS. DEMATEL analysis was incorporated in the otherpart of the evaluation.
3.2 Response Rates and RespondentCharacteristics
The estimated number of individuals intended for thequantitative survey ranged from 350 to 500, takenrandomly in and around metropolitan Kuala Lumpur, aswell as northern and southern Malaysia. This range wasconsidered because the survey was focused on randomlyobtaining experienced groups in related study areas.Ultimately, 570 questionnaires were distributed; of these,a total of 293 participants returned their completedquestionnaires within five months. A substantial numberof those who did not return their questionnaires did notprovide any reason during the follow-up collections. Ofthe 293 returned questionnaires, usable responses wereobtained from 167. This decrease was the result ofdouble-ticking a single question, failing to answer morethan 60% of the questions, or answering only a singleoption throughout the questionnaire. The 167 participantswere all relatively low- to high-experienced individuals intheir related areas according to their responses.Approximately 42% of the 167 were female.
Approximately 75% of the participants considered 3Dmaps to be their favourite type of map for navigationalassistance. In terms of age, approximately 69% of theparticipants ranged in age from 15 to 39 years, while theremaining 31% were 40 years old or above. Regardingeducational background, only 9% of the participants had ahigh-school diploma, whereas approximately 47% hadBachelors degrees and approximately 25% had Mastersdegrees, with the remaining 18% having PhD degrees. Allparticipants worked in the related administrative (21%),educational (27%), business (24%), or technical (26%)field. However, their frequent primary mobility type,mobile device type, level of awareness of mobileapplications, and level of awareness of 3D maps onmobile devices for navigation were sufficient to indicatethat they were familiar with navigation and pedestriannavigation. Four of the eleven experts for the MCDA hadMasters degrees, while the remainder were PhD degreeholders. Three of the experts were female, and the restwere male. All participants in the MCDA were experts,with many publications in areas related to 3Dvisualisation for mobile devices.
3.3 Results of the Quantitative Survey
Both correlation and regression analyses were performed.The total number of survey items measuring the threevariables of interest was 10. To measure relationshipsamong the variables, the averages of the items for eachvariable were computed. Thus, these were the same itemsthat were used during data screening to ensure thesuitability of measuring those variables based on thetreatment of missing data, assessment of outliers,assessment of normality, factor analysis, and reliabilitytest.
Pearsons correlation coefficient (r) ranged fromr = .504 to .872. The highest correlation coefficient wasobtained from the relationship between eye space andscreen space, in which there was a significant and strongpositive relationship between the two variables. However,there was also a strong relationship between screen spaceand perspective space. A relatively moderate relationshipwas observed between eye space and perspective. Toobtain an in-depth analysis, standard multiple regressionanalysis was conducted to evaluate how well a set ofpredictors predicted the use of the 3D map view onmobile devices for navigational assistance. The results arepresented in Table 1.
The predictors were screen space, perspective space,and eye space, whereas the criterion variable was the 3Dmap view on mobile devices. The linear combination ofscreen space, perspective space, and eye space wassignificantly related to the 3D map view on mobiledevices for navigational assistance, F(3,163) = 124.962,p = .000 at the 0.05 alpha level.
The multiple correlation coefficient for the samplewas .771, indicating that approximately 59% of the
c⃝ 2013 NSPNatural Sciences Publishing Cor.

8 Adamu A., et. all.: Visualisation of a Three-Dimensional (3D) Objects Optimal Reality
Table 1: Multiple Regression AnalysisModel 1 B Beta t Sig(Constant) 1.724 5.186 .000screen space .551 .612 6.945 .000perspective space .566 .495 11.682 .000eye space .617 .653 2.436 .016
R2 .594Ad justedR2 .572F 124.964Sig .000
variance in the 3D map views on mobile devices for couldbe explained by the set of predictors (screen space,perspective space, and eye space). Based on thesecoefficient results, the independent variables statisticallyand significantly contributed to the prediction of the 3Dmap view on mobile devices for navigation assistance.Eye space (beta = .65, p = .01 at the .05 alpha level) madethe strongest contribution to the 3D view. The next wasscreen space (beta = .61, p = .00 at the .05 alpha level),followed by perspective (beta = .50, p = .00 at the .05alpha level). The tolerance is the percentage of thevariance in a given predictor that cannot be explained bythe other predictors. Thus, the small tolerances indicatedthat 70-90% of the variance in a given predictor could beexplained by the other predictors. When the toleranceswere close to zero, there was high multicollinearity, andthe standard error of the regression coefficients wasinflated. A variance inflation factor greater than two istypically considered problematic; thus, the largesttolerance in this case is was .18 whereas the smallest VIFwas 1.7. Thus, the results of the analysis support thefollowing hypothesised relationships:H1: Eye space is associated with 3D viewing on mobiledevices as a navigational aid.H2: Screen space is associated with 3D map viewing onmobile devices for navigational aid.H3: Perspective space is associated with 3D viewing onmobile devices as a navigational aid
3.4 Analysis and Presentation of DEMATELResults
Step 1: The 11 experts responses were gathered based onthe multiple choice questions described in section 3.Responses were used to construct non-negative initialdirect relation matrices using equation 6. The matricesgenerated included matrices E1 to E11 for Eye space, P1 toP11 for Perspective space, and S1 to S11 for Screen space.
E1 =
0 1 2 32 0 3 44 1 0 21 2 4 0
E2 =
0 2 4 32 0 2 31 1 0 24 3 3 0
E3 =
0 3 0 32 0 3 31 1 0 24 2 4 0
E4 =
0 2 3 22 0 4 31 1 0 21 2 3 0
E5 =
0 2 3 32 0 4 21 1 0 40 3 4 0
E6 =
0 2 1 32 0 3 34 3 0 41 2 3 0
E7 =
0 2 3 14 0 4 31 1 0 21 3 4 0
E8 =
0 3 4 32 0 3 31 1 0 40 3 1 0
E9 =
0 1 4 42 0 3 31 1 0 24 2 3 0
E10 =
0 2 3 42 0 3 34 3 0 41 2 3 0
E11 =
0 4 3 12 0 3 31 3 0 44 2 3 0
P1 =
0 1 43 0 22 1 0
P2 =
0 3 22 0 10 1 0
P3 =
0 3 42 0 10 1 0
P4 =
0 1 43 0 20 1 0
P5 =
0 1 43 0 22 1 0
P6 =
0 4 22 0 10 1 0
P7 =
0 3 44 0 22 1 0
P8 =
0 4 22 0 10 3 0
P9 =
0 3 42 0 10 1 0
P10 =
0 3 43 0 21 1 0
P11 =
0 3 43 0 21 1 0
S1 =
0 2 32 0 14 1 0
S2 =
0 4 33 0 22 1 0
S3 =
0 2 43 0 11 0 0
S4 =
0 2 32 0 10 4 0
S5 =
0 3 43 0 20 1 0
S6 =
0 3 33 0 22 1 0
S7 =
0 3 33 0 22 1 0
S8 =
0 3 42 0 10 1 0
S9 =
0 0 42 0 12 1 0
S10 =
0 3 43 0 21 1 0
S11 =
0 3 42 0 22 1 0
The average matrixes, Ze for Eye space, Zp for
Perspective space, and Zs for Screen space, werecalculated using equation 7. These represent the initialdirect relation matrices, which are the averages of the 11experts responses on Eye space, Perspective space andScreen space, respectively.
Ze =
0 2.1818 2.7273 2.72732.1818 0 3.1818 31.8182 1.5455 0 2.90911.9091 2.3636 3.1818 0
Zp =
0 2.6364 3.45452.6364 0 1.54550.7273 1.1828 0
Zs =
0 2.5455 3.54552.5455 0 1.54551.4545 1.1818 0
Step 2: In this step, the normalised initial direct-relationmatrices De, Dp, and Ds for Eye space, Perspective spaceand Screen space, respectively were calculated usingequation 8. We applied a revised DEMATEL to matrices
c⃝ 2013 NSPNatural Sciences Publishing Cor.

Appl. Math. Inf. Sci. 7, No. ?, 1-12 (2013) / www.naturalspublishing.com/Journals.asp 9
Ze, Zp and Zs to calculate matrices De, Dp, and Ds,respectively, where we introduced ε as 0.00001 in eachcase and added it to the sum of the third column formatrix Ze (9.09090), which had the highest value,resulting in 9.09091 [41], while the sum of first row inmatrix Zp had the highest value, 6.0909. When added to εto obtain 6.09091, the highest value obtained for Zs wasin the first row, 6.091. The ε was then added, yielding6.09101. Hence, we normalised matrices Ze, Zp and Zs byusing equation 8 and obtained the normalised initialdirect-relation matrices De, Dp, and Ds;
De =
0 0.24 0.3 0.30.24 0 0.35 0.330.2 0.17 0 0.320.21 0.26 0.35 0
Dp =
0 0.4328 0.56720.4328 0 0.25370.1194 0.194 0
Ds =
0 0.4179 0.58210.4179 0 0.25370.2388 0.194 0
Step 3: In this step, we calculated the total relationmatrices Te, Tp, and Ts using equation 9. These matricesmodel the total cause-and-effect relationships among thesub-constructs.
Te =
0.7672 0.9803 1.3198 1.2761.0162 0.8433 1.4298 1.13510.8215 0.8206 0.9309 1.13510.9228 0.9723 1.3247 1.0216
Tp =
0.4974 0.855 0.56720.7294 0.4683 0.25370.3203 0.387 0.2799
Ts =
0.684 0.9402 1.21870.8475 0.525 0.88020.5666 0.5204 0.4618
Experts suggested that we should use the threshold
equation established in equation 12 because there is nostandard consensus for calculating threshold, althoughmany approaches are available. The standard is decidedby expert opinions based on the nature of theinterrelationships to avoid excessively complexrelationships. Thus, the threshold values obtained for Eyespace, Perspective space and Screen space using equation12 were 1.0596, 0.5989 and 0.7383, respectively.Therefore, only those values above the threshold wereconsidered when assessing the impact of theinterrelationships (see Tables 2 through 4). Furthermore,the effects of one sub-construct are revealed from thevalues of (r+c) and (r−c) represented in Tables 2, 3 and4, respectively.
The total impact of the observed relationships basedon the threshold values indicated that visual time [E4] wasthe only sub-construct among all of them that impacteditself; at an impact level of 1.0216, it was the mostimportant sub-construct of eye space because it had thehighest (r + c) value. Based on (r − c), it affected the
sub-construct of eye space because it had a negativevalue. Furthermore, it was observed that only [E4]impacted all of the eye space sub-constructs. The list ofsub-constructs in order of importance based on (r + c)values for eye space was E4 > E3 > E2 > E1, while forPerspective space, the order of sub-constructs wasP3 > P1 > P2, and the order for Screen space wasS3 > S1 > S2. The entire impact of the interrelationshipswith cause and effect of each relation on Eye space,Perspective space, and Screen space sub-constructs arepresented in Tables 2, 3 and 4, respectively.
Table 2: Eye space - total impact of interrelationships with causeand effect
E1 E2 E3 E4 r c r+ c r− c ImpactE1 0.7672 0.9803 1.3198 1.276 4.3433 3.5277 7.871 0.8156 CauseE2 1.0162 0.8433 1.4298 1.3707 4.66 3.5277 8.1877 1.1323 CauseE3 0.8215 0.8206 0.9309 1.1351 3.7081 7.0554 10.7635 -3.3473 AffectedE4 0.9228 0.9723 1.3247 1.0216 4.2414 14.1108 18.3522 -9.8694 Affected
Table 3: Perspective space - total impact of interrelationshipswith cause and effect
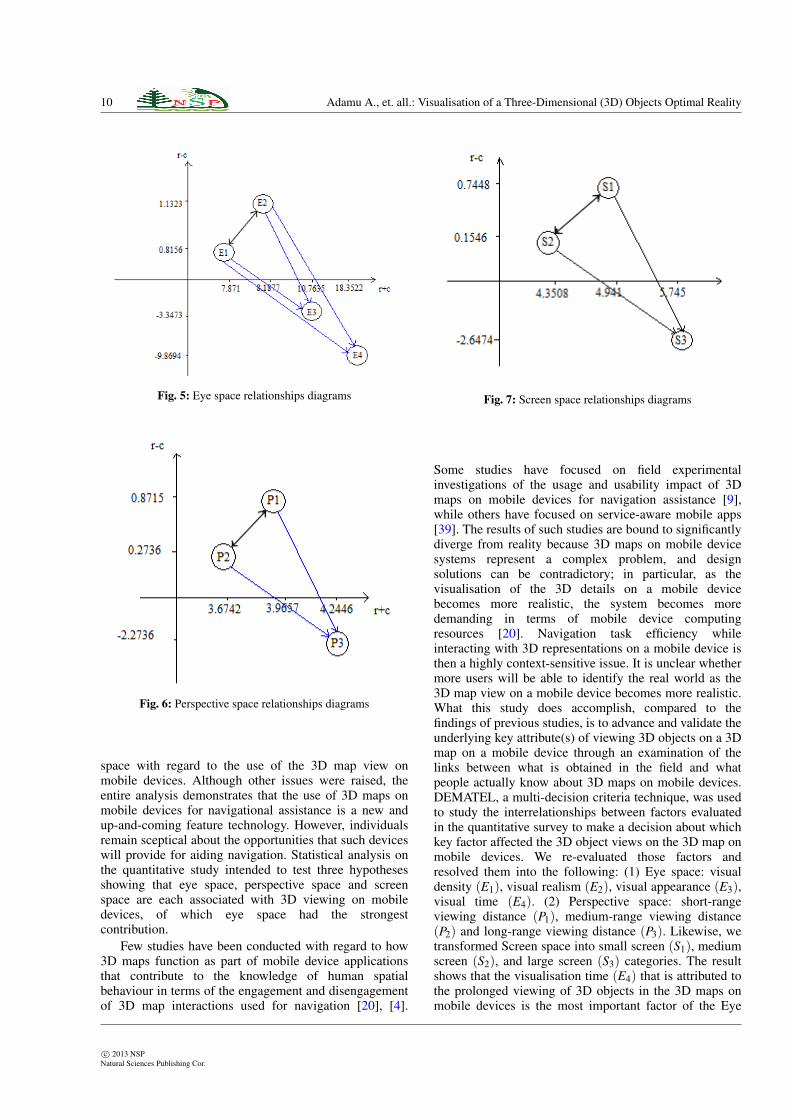
P1 P2 P3 r c r+ c r− c ImpactP1 0.4974 0.855 1.0662 2.4186 1.5471 3.9657 0.8715 CauseP2 0.7294 0.4683 0.7862 1.9839 1.7103 3.6942 0.2736 CauseP3 0.3203 0.387 0.2799 0.9872 3.2574 4.2446 -2.2702 Affected
Table 4: Screen space - total impact of interrelationships withcause and effect
S1 S2 S3 r c r+ c r− c ImpactS1 0.684 0.9402 1.2187 2.8429 2.0981 4.941 0.7448 CauseS2 0.8475 0.525 0.8802 2.2527 2.0981 4.3508 0.1546 CauseS3 0.5666 0.5204 0.4618 1.5488 4.1962 5.745 -2.6474 Affected
Step 4. The relationship diagrams are drawn to indicatecause and effect diagrammatically by mapping out theinteractions among them. Figures 5, 6, and 7 show theimpact relationship maps for the Eye space, Perspectivespace, and Screen space sub-constructs, respectively. InFigure 5, E3 and E4 were affected by E1 and E2, while P3was affected by P1 and P2 in Figure 6, and S3 was affectedby S1 and S2 in Figure 7.
4 Discussion
This study utilised two approaches to evaluate the keycriteria for visualising 3D objects seen in 3D maps onmobile devices used for navigational aid. The firstapproach entailed a quantitative survey intended torigorously explain participants responses. The analysis ofthose responses identified three important issues in theuse of 3D map views on mobile devices. The subjectspertained to eye space, perspective space, and screen
c⃝ 2013 NSPNatural Sciences Publishing Cor.
10 Adamu A., et. all.: Visualisation of a Three-Dimensional (3D) Objects Optimal Reality
Fig. 5: Eye space relationships diagrams
Fig. 6: Perspective space relationships diagrams
space with regard to the use of the 3D map view onmobile devices. Although other issues were raised, theentire analysis demonstrates that the use of 3D maps onmobile devices for navigational assistance is a new andup-and-coming feature technology. However, individualsremain sceptical about the opportunities that such deviceswill provide for aiding navigation. Statistical analysis onthe quantitative study intended to test three hypothesesshowing that eye space, perspective space and screenspace are each associated with 3D viewing on mobiledevices, of which eye space had the strongestcontribution.
Few studies have been conducted with regard to how3D maps function as part of mobile device applicationsthat contribute to the knowledge of human spatialbehaviour in terms of the engagement and disengagementof 3D map interactions used for navigation [20], [4].
Fig. 7: Screen space relationships diagrams
Some studies have focused on field experimentalinvestigations of the usage and usability impact of 3Dmaps on mobile devices for navigation assistance [9],while others have focused on service-aware mobile apps[39]. The results of such studies are bound to significantlydiverge from reality because 3D maps on mobile devicesystems represent a complex problem, and designsolutions can be contradictory; in particular, as thevisualisation of the 3D details on a mobile devicebecomes more realistic, the system becomes moredemanding in terms of mobile device computingresources [20]. Navigation task efficiency whileinteracting with 3D representations on a mobile device isthen a highly context-sensitive issue. It is unclear whethermore users will be able to identify the real world as the3D map view on a mobile device becomes more realistic.What this study does accomplish, compared to thefindings of previous studies, is to advance and validate theunderlying key attribute(s) of viewing 3D objects on a 3Dmap on a mobile device through an examination of thelinks between what is obtained in the field and whatpeople actually know about 3D maps on mobile devices.DEMATEL, a multi-decision criteria technique, was usedto study the interrelationships between factors evaluatedin the quantitative survey to make a decision about whichkey factor affected the 3D object views on the 3D map onmobile devices. We re-evaluated those factors andresolved them into the following: (1) Eye space: visualdensity (E1), visual realism (E2), visual appearance (E3),visual time (E4). (2) Perspective space: short-rangeviewing distance (P1), medium-range viewing distance(P2) and long-range viewing distance (P3). Likewise, wetransformed Screen space into small screen (S1), mediumscreen (S2), and large screen (S3) categories. The resultshows that the visualisation time (E4) that is attributed tothe prolonged viewing of 3D objects in the 3D maps onmobile devices is the most important factor of the Eye
c⃝ 2013 NSPNatural Sciences Publishing Cor.

Appl. Math. Inf. Sci. 7, No. ?, 1-12 (2013) / www.naturalspublishing.com/Journals.asp 11
space sub-construct, whereas the long viewing distance(P3) of 3D objects on a 3D map on mobile device are themost important sub constructs of perspective space. Thelarge-screen (S3) sub-construct of screen space was themost important, which pertains to the visual appearanceof 3D objects in 3D maps on large screen size mobiledevices. The results of DEMATEL analysis also showedthat visualisation time (E4), long viewing distance (P3),and large screen (S3) are the most affected sub-constructsamong all of those considered.
In general, the approach of this study was morecomprehensive, analysing the visualisation of a 3Dobjects optimal reality in a 3D map on a mobile device.The 3D implementation was in the context of utilising amobile navigational system. Different usersunderstandings could yield new knowledge about thefactors influencing the use of 3D maps on mobile devices.The results of this study can help to define guidelines forassociating mobile devices with navigation applications toensure that the content reaches the appropriate andtargeted users. For that reason, we utilised the theorystating that visualisation amplifies cognition [11] andincorporated a subjective research approach throughdescriptive and inferential statistics and MCDA withDEMATEL. The results produced by these twotechniques confirmed our hypotheses and identified thekey criteria that may have the most significant impact onthe visualisation of 3D maps on mobile devices. Crucialto obtaining these results were the statistics andDEMATEL techniques used. The statistics included bothcorrelation and regression analyses for hypothesis testing.These analyses were used to determine critical ratios,representing the indirect effects of screen space,perspective space, and eye space on 3D objects viewed onmobile devices. If one or more of these relationships wasnon-significant, researchers usually concluded that screenspace, perspective space and eye space effects were notpossible on the 3D views of the objects. Having obtainedsignificant relationships by correlation analysis, as well asstrong contributions from the entire constructs asindicated in section 3.2, suggests that our results yieldednew and useful knowledge. Thus, statistical analysesyielded factors that influenced the use of 3D objects in 3Dmaps viewed on mobile devices for navigational aid.Furthermore, the DEMATEL results as explained insection 3.3 contributed to the extraction of the keycriterion among “screen space”, “perspective space” and“eye space” that most impacted the visualisation of 3Dobjects. The combination of both statistical andDEMATEL analyses contribute to the guidelines forcombining mobile devices with navigation applications toensure that the applicable content reaches the appropriateand targeted users.
5 ConclusionsThis paper presents an empirical investigation into the useof 3D maps on mobile devices to determine the factorsthat influence their usage via a quantitative survey andDEMATEL analysis. This approach was chosen touncover users perceptions of the 3D map view on mobiledevices. We utilised the proven theory regarding thevisualisation of 3D objects by coordinate systems. Eyespace, perspective space, and screen space were used asthe key variables for the empirical investigation. Theywere further subdivided to find the key factor(s) ofvisualising 3D objects in 3D maps on mobile devices. Aquantitative survey and DEMATEL were used. Theresults of the quantitative study showed that eye space,perspective space and screen space were associated with3D viewing on mobile devices and that eye space had thestrongest impact. Whereas results from DEMATELshowed that the prolonged viewing of 3D objects onmobile devices was the most important factor related toeye space and the long viewing distance of 3D objectswas the most important factor related to perspective spacewhile large screen size was the most important for screenspace. Finally, a 3D map view on a mobile device allowsfor the visualisation of a more realistic environment.These findings indicate that ones view of a 3D map onmobile devices is mainly influenced by perception.However, the 3D map will be perceived as a more usefulnavigational tool when it looks more realistic. Indeed, the3D map view on a mobile device facilitates a morerealistic visualisation of the environment.
AcknowledgementThis research is supported by High Impact ResearchGrant, University of Malaya Vote noUM.C/628/HIR/MOHE/SC/13/2 from Ministry of HigherEducation Malaysia.
References[1] Leshed, G., Velden, T., Rieger, O., Kot, B., & Sengers, P., In-
car GPS Navigation: Engagement with and Disengagementfrom the Environment, Proceedings of the Twenty-sixthAnnual Sigchi Conference on Human Factors in ComputingSystems, 1675-1684, (2008).
[2] Ellard, C., Where am I? Why we can Find our Way to theMoon but get Lost in the Mall. Published by Harper CollinsPublishers Ltd. London. 336 (2009).
[3] Nurminen, A., m-loma - A Mobile 3D City Map, Proceedingsof the Eleventh International Conference on 3D WebTechnology, 718, (2006).
[4] Nurminen, A., Mobile 3D City Maps, IEEE ComputerGraphics and Applications, 28(4), 2031, (2008).
[5] Oulasvirta, A., Nivala, A., Tikka, V., Liikkanen, l., &Nurminen, A., Understanding Users Strategies with MobileMaps. Interactivity and Usability of Map-based MobileServices, a Workshop. Mobile HCI, (2005).
c⃝ 2013 NSPNatural Sciences Publishing Cor.

12 Adamu A., et. all.: Visualisation of a Three-Dimensional (3D) Objects Optimal Reality
[6] Cockburn, A.. Revisiting 2D vs 3D Implications on SpatialMemory, Proceedings of the Fifth Australasian User InterfaceConference (AUIC2004). Dunedin, New Zealand, 25-32,(2004).
[7] Edwards, J.D.M. & Hand, C. Maps: movement and PlanningSupport for Navigation in An Immersive VRML browser.In R. Carey and P. Strauss, editors, VRML 97: SecondSymposium on the Virtual Reality Modeling Language, ACMpress. (1997).
[8] Jiang, W., Yuguo, W., & Fan, W., An Approach forNavigation in 3D Models on Mobile Devices. In Stilla,U.Rottensteiner, F., Paparoditis, N. (EDS) CMRT09. IAPRS,XXXVIII, PART 3/W4. 8, (2009).
[9] Dunser, A., Billinghurst M., Wena, J., Lehtinen, V.,Nurminen, A., Exploring the Use of Handheld AR forOutdoor Navigation. Computers & Graphics 36 : 10841095,(2012).
[10] Ware, C., Information Visualization: Perception for Design.Morgan Kaufmann. San Diego, CA. 268 (2004).
[11] Berg Insight AB, Mobile Maps and Navigation (MarketResearch Report), (2007).
[12] Angelaki, D.E., Hess, B.J., Self-Motion-Induced EyeMovements: Effects on Visual Acuity and Navigation, NatureReviews Neuroscience, 6: 966976, (2005).
[13] Howard, I.P., & Rogers, B.J., Seeing in Depth, OxfordUniversity Press, (2008).
[14] Schor, C., Robertson, K.M. Wesson, M., Disparity VergenceDynamics and Fixation Disparity, American Journal ofoptometry and Physiological Optics 63: 611618, (1986).
[15] Blinn, J.F. W Pleasure, W Fun [3D Graphics], IEEEComputer Graphics and Applications, 18(3): 78 - 82, (1998).
[16] Shibata T., Kim, J., & David M., Hoffman, Martin S. Banks.The Zone of Comfort: Predicting Visual Discomfort withStereo Displays, Journal of Vision, 11(8):11, 129, (2011).
[17] Koenderink, J.J., Geometry of Imaginary Spaces, Journal ofPhysiology - Paris 106: 173182, (2012).
[18] Kaasinen, E., User Acceptance of Mobile ServicesValue,Ease of Use, Trust and Ease of Adoption. Doctoraldissertation, VTT Publications 566, Finland, (2005)
[19] Weiss, Handheld usability. ACM Press, New York, 2002.[20] Oulasvirta, A., Estlander, S., & Nurminen, A., Embodied
interaction with a 3D versus 2D mobile map. Journal Personaland Ubiquitous Computing. 13(4), 303320, (2008).
[21] Johnson, B., & Christensen, L.B., Educational Research:Quantitative, Qualitative, and Mixed Approaches (4TH ED.).Thousand OAKS, Calif.: Sage Publications, (2010).
[22] Biddle, B.J. & Anderson, D.S. Theory, Methods,Knowledge, and Research on Teaching. In M. C. Wittrock(ED.), Handbook of Research on Teaching (3RD ED.) (PP.230252). New York: Macmillan, (1986).
[23] Gill, J., Johnson, P., & Clark, M.. Research Methods forManagers (4th ED.). London: Sage Publications, (2010).
[24] Benz, C.R., & Newman, I.. Mixed Methods ResearchExploring the Interactive Continuum. Carbondale: SouthernIllinois University Press, (2008).
[25] Zhou Q, Huang WL, & Zhang Y., Identifying CriticalSuccess Factors in Emergency Management using A FuzzyDEMATEL Method. Safety Sci 49: 243252, (2011).
[26] Hung Y.H, Chou S.C.T, Tzeng G.H., KnowledgeManagement Adoption and Assessment for SMES byA Novel MCDM Approach. Decision Support Systems 51:270291, (2011).
[27] Wu H.H., Chen H.K., & Shieh J.I., Evaluating PerformanceCriteria of Employment Service Outreach Program Personnelby DEMATEL Method, Expert Systems with Applications37: 52195223, (2010).
[28] Lee H., Tzeng G., Yeih W., Wang Y., & Yang S., RevisedDEMATEL: Resolving the Infeasibility of DEMATEL.Applied Mathematical Modeling 37: 67466757, (2013).
[29] Leedy, P.D. & Ormrod, J.E., Practical Research Planningand Design. Person Education Upper Saddle River, NewJersey. 336, (2010).
[30] Creswell, J.W., Research Design: Qualitative, Quantitative,and Mixed Methods Approach. Sage Publications Inc,California, (2009).
[31] Marshall, M.N., Sampling for Qualitative Research, OxfordJournal of Family Practice. 13(6), 522-526, (1996).
[32] Merchant, John, Richard Morrissette, and James L.Porterfield. ”Remote measurement of eye direction allowingsubject motion over one cubic foot of space.” BiomedicalEngineering, IEEE Transactions on 4 : 309-317, (1974)
[33] Li, Zhuwen, Yuxi Wang, Jiaming Guo, Loong-Fah Cheong,and Steven ZhiYing Zhou. “Diminished reality usingappearance and 3D geometry of internet photo collections.”In Mixed and Augmented Reality (ISMAR), 2013 IEEEInternational Symposium on, pp. 11-19. IEEE, 2013.
[34] Presson, Clark C., and Daniel R. Montello. “Updating afterrotational and translational body movements: Coordinatestructure of perspective space.” PERCEPTION-LONDON-23: 1447-1447, (1994).
[35] Stamminger, Marc, and George Drettakis. “Perspectiveshadow maps.” ACM Transactions on Graphics (TOG). Vol.21. No. 3. ACM, 2002.
[36] Grau, Oliver. Virtual Art: from illusion to immersion. MITpress, 2003.
[37] [37] Brewster, Stephen. “Overcoming the lack of screenspace on mobile computers.” Personal and UbiquitousComputing 6.3 : 188-205, (2002).
[38] Kamba, Tomonari, et al. “Using small screen space moreefficiently.” Proceedings of the SIGCHI Conference onHuman Factors in Computing Systems. ACM, 1996.
[39] De-Gan Zhang, Xiao-Dan Zhang, A New Service-aware Computing Approach for Mobile Application withUncertainty, Applied Mathematics & Information Sciences,6(1): 9-21, (2012).
c⃝ 2013 NSPNatural Sciences Publishing Cor.