Visual Field Representation in Striate and Prestriate …...Visual Field Representation in Striate...
25
Visual Field Representation in Striate and Prestriate Cortices of a Prosimian Primate ( Galago garnetti ) MARCELLO G. P. ROSA, 1 VIVIEN A. CASAGRANDE, 2 TODD PREUSS, 3,4 AND JON H. KAAS 3 1 Vision, Touch and Hearing Research Centre, Department of Physiology and Pharmacology, The University of Queensland, QLD 4072, Australia; 2 Department of Cell Biology and 3 Department of Psychology, Vanderbilt University, Nashville, Tennessee 37240; and 4 Division of Behavioral Biology, University of Southwestern Louisiana—New Iberia Research Center, New Iberia, Louisiana 70560 Rosa, Marcello G. P., Vivien A. Casagrande, Todd Preuss, and INTRODUCTION Jon H. Kaas. Visual field representation in striate and prestriate As a part of ongoing projects aimed at defining the visual cortices of a prosimian primate ( Galago garnetti ). J. Neurophys- iol. 77: 3193 – 3217, 1997. Microelectrode mapping techniques areas of primates, we report on the visuotopic organization were used to study the visuotopic organization of the first and of the primary visual cortex (area 17, or V1) and adjacent second visual areas (V1 and V2, respectively) in anesthetized Ga- prestriate cortex in a prosimian primate, the small-eared lago garnetti, a lorisiform prosimian primate. 1 ) V1 occupies Ç200 greater galago ( Galago garnetti ). Although most of the re- mm 2 of cortex, and is pear shaped, rather than elliptical as in search on the organization of primate visual cortex has con- simian primates. Neurons in V1 form a continuous (1st-order) centrated on the simian (i.e., anthropoid) primates (New representation of the visual field, with the vertical meridian forming World monkeys, Old World monkeys, apes, and humans) most of its perimeter. The representation of the horizontal meridian (Hoffstetter 1982; Martin 1990), the study of cortical orga- divides V1 into nearly equal sectors representing the upper quad- nization in prosimian primates is important for several rea- rant ventrally, and the lower quadrant dorsally. 2 ) The emphasis sons. The brains of prosimians are smaller relative to body on representation of central vision is less marked in Galago than in simian primates, both diurnal and nocturnal. The decay of cortical size than those of monkeys (Jerison 1979; Preuss and Gold- magnification factor with increasing eccentricity is almost exactly man-Rakic 1991a,b; Stephan and Andy 1969; Stephan et al. counterbalanced by an increase in average receptive field size, 1981 ) , and it is possible that the number and the complexity such that a point anywhere in the visual field is represented by a of cortical visual areas are reduced in comparison with those compartment of similar diameter in V1. 3 ) Although most of the of simian primates. This simpler pattern of organization may cortex surrounding V1 corresponds to V2, one-quarter of the perim- be easier to unravel. Moreover, by drawing attention to those eter of V1 is formed by agranular cortex within the rostral calcarine features of the organization of cortical visual areas shared sulcus, including area prostriata. Although under our recording by different primate groups, a comparative analysis can help conditions virtually every recording site in V2 yielded visually understanding of the organization in primates in general, and responsive cells, only a minority of those in area prostriata revealed also clarify which changes occurred in the cortex after the such responses. 4 ) V2 forms a cortical belt of variable width, being narrowest ( Ç1 mm) in the representation of the area centralis and separation of the Order Primates from the lineages leading widest (2.5–3 mm) in the representation of the midperiphery to related mammals, such as megachiropteran bats, dermop- ( ú207 eccentricity) of the visual field. V2 forms a second-order terans, and tree shrews (see Preuss and Goldman-Rakic representation of the visual field, with the area centralis being 1991a; Rosa et al. 1996 for summaries of the phylogenetic represented laterally and the visual field periphery medially, near relationships between galagos and other primates ) . the calcarine sulcus. Unlike in simians, the line of field discontinu- The galago is a good choice for study of the organization ity in Galago V2 does not exactly coincide with the horizontal of striate and extrastriate visual areas because much work meridian: a portion of the lower quadrant immediately adjacent to has been done to characterize the anatomy and physiology the horizontal meridian is represented at the rostral border of ven- of other portions of its visual system. For example, it has tral V2, instead of in dorsal V2. Despite the absence of cytochrome been demonstrated that the parallel ( magnocellular, parvo- oxidase stripes, the visual field map in Galago V2 resembles the ones described in simians in that the magnification factor is aniso- cellular, and koniocellular) pathways from the retina to V1 tropic. 5 ) Receptive field progressions in cortex rostral to dorsal are distinct and well developed in this genus (Casagrande V2 suggest the presence of a homologue of the dorsomedial area, and Norton 1991; Florence and Casagrande 1987; Florence including representations of both quadrants of the visual field. et al. 1983); in addition, it is one of only three primate These results indicate that many aspects of organization of V1 and species in which the receptive field structures of cells in both V2 in simian primates are shared with lorisiform prosimians, and the lateral geniculate nucleus and V1 have been compared are therefore likely to have been present in the last common ances- (DeBruyn et al. 1993; Irvin et al. 1993; Norton and Casa- tor of living primates. However, some aspects of organization of grande 1982; Norton et al. 1988). There is also detailed the caudal visual areas in Galago are intermediate between nonpri- information on the connectional anatomy of all levels of the mates and simian primates, reflecting either an intermediate stage visual system in this prosimian ( Cusick et al. 1984; Krubitzer of differentiation or adaptations to a nocturnal niche. These include the shape and the small size of V1 and V2, the modest degree of and Kaas 1990, 1993; Symonds and Kaas 1978; Tigges and emphasis on central visual field representation, and the relatively Tigges 1970; Tigges et al. 1973; Wall et al. 1982; Weller and large area prostriata. Kaas 1982). Finally, and perhaps most importantly, visual resolution and sensitivity have been determined both behav- 3193 0022-3077/97 $5.00 Copyright q 1997 The American Physiological Society J761-6 / 9k13$$ju39 06-05-97 13:33:43 neupal LP-Neurophys
Transcript of Visual Field Representation in Striate and Prestriate …...Visual Field Representation in Striate...

Visual Field Representation in Striate and Prestriate Corticesof a Prosimian Primate (Galago garnetti)
MARCELLO G. P. ROSA,1 VIVIEN A. CASAGRANDE,2 TODD PREUSS,3,4 AND JON H. KAAS3
1Vision, Touch and Hearing Research Centre, Department of Physiology and Pharmacology, The University ofQueensland, QLD 4072, Australia; 2Department of Cell Biology and 3Department of Psychology, Vanderbilt University,Nashville, Tennessee 37240; and 4Division of Behavioral Biology, University of Southwestern Louisiana—New IberiaResearch Center, New Iberia, Louisiana 70560
Rosa, Marcello G. P., Vivien A. Casagrande, Todd Preuss, and I N T R O D U C T I O NJon H. Kaas. Visual field representation in striate and prestriate
As a part of ongoing projects aimed at defining the visualcortices of a prosimian primate (Galago garnetti) . J. Neurophys-iol. 77: 3193–3217, 1997. Microelectrode mapping techniques areas of primates, we report on the visuotopic organizationwere used to study the visuotopic organization of the first and of the primary visual cortex (area 17, or V1) and adjacentsecond visual areas (V1 and V2, respectively) in anesthetized Ga- prestriate cortex in a prosimian primate, the small-earedlago garnetti, a lorisiform prosimian primate. 1) V1 occupiesÇ200 greater galago (Galago garnetti) . Although most of the re-mm2 of cortex, and is pear shaped, rather than elliptical as in search on the organization of primate visual cortex has con-simian primates. Neurons in V1 form a continuous (1st-order) centrated on the simian (i.e., anthropoid) primates (Newrepresentation of the visual field, with the vertical meridian forming
World monkeys, Old World monkeys, apes, and humans)most of its perimeter. The representation of the horizontal meridian(Hoffstetter 1982; Martin 1990), the study of cortical orga-divides V1 into nearly equal sectors representing the upper quad-nization in prosimian primates is important for several rea-rant ventrally, and the lower quadrant dorsally. 2) The emphasissons. The brains of prosimians are smaller relative to bodyon representation of central vision is less marked in Galago than in
simian primates, both diurnal and nocturnal. The decay of cortical size than those of monkeys (Jerison 1979; Preuss and Gold-magnification factor with increasing eccentricity is almost exactly man-Rakic 1991a,b; Stephan and Andy 1969; Stephan et al.counterbalanced by an increase in average receptive field size, 1981), and it is possible that the number and the complexitysuch that a point anywhere in the visual field is represented by a of cortical visual areas are reduced in comparison with thosecompartment of similar diameter in V1. 3) Although most of the of simian primates. This simpler pattern of organization maycortex surrounding V1 corresponds to V2, one-quarter of the perim- be easier to unravel. Moreover, by drawing attention to thoseeter of V1 is formed by agranular cortex within the rostral calcarine
features of the organization of cortical visual areas sharedsulcus, including area prostriata. Although under our recordingby different primate groups, a comparative analysis can helpconditions virtually every recording site in V2 yielded visuallyunderstanding of the organization in primates in general, andresponsive cells, only a minority of those in area prostriata revealedalso clarify which changes occurred in the cortex after thesuch responses. 4) V2 forms a cortical belt of variable width, being
narrowest (Ç1 mm) in the representation of the area centralis and separation of the Order Primates from the lineages leadingwidest (2.5–3 mm) in the representation of the midperiphery to related mammals, such as megachiropteran bats, dermop-(ú207 eccentricity) of the visual field. V2 forms a second-order terans, and tree shrews (see Preuss and Goldman-Rakicrepresentation of the visual field, with the area centralis being 1991a; Rosa et al. 1996 for summaries of the phylogeneticrepresented laterally and the visual field periphery medially, near relationships between galagos and other primates) .the calcarine sulcus. Unlike in simians, the line of field discontinu- The galago is a good choice for study of the organizationity in Galago V2 does not exactly coincide with the horizontal
of striate and extrastriate visual areas because much workmeridian: a portion of the lower quadrant immediately adjacent tohas been done to characterize the anatomy and physiologythe horizontal meridian is represented at the rostral border of ven-of other portions of its visual system. For example, it hastral V2, instead of in dorsal V2. Despite the absence of cytochromebeen demonstrated that the parallel (magnocellular, parvo-oxidase stripes, the visual field map in Galago V2 resembles the
ones described in simians in that the magnification factor is aniso- cellular, and koniocellular) pathways from the retina to V1tropic. 5) Receptive field progressions in cortex rostral to dorsal are distinct and well developed in this genus (CasagrandeV2 suggest the presence of a homologue of the dorsomedial area, and Norton 1991; Florence and Casagrande 1987; Florenceincluding representations of both quadrants of the visual field. et al. 1983); in addition, it is one of only three primateThese results indicate that many aspects of organization of V1 and species in which the receptive field structures of cells in bothV2 in simian primates are shared with lorisiform prosimians, and the lateral geniculate nucleus and V1 have been comparedare therefore likely to have been present in the last common ances-
(DeBruyn et al. 1993; Irvin et al. 1993; Norton and Casa-tor of living primates. However, some aspects of organization ofgrande 1982; Norton et al. 1988). There is also detailedthe caudal visual areas in Galago are intermediate between nonpri-information on the connectional anatomy of all levels of themates and simian primates, reflecting either an intermediate stagevisual system in this prosimian (Cusick et al. 1984; Krubitzerof differentiation or adaptations to a nocturnal niche. These include
the shape and the small size of V1 and V2, the modest degree of and Kaas 1990, 1993; Symonds and Kaas 1978; Tigges andemphasis on central visual field representation, and the relatively Tigges 1970; Tigges et al. 1973; Wall et al. 1982; Weller andlarge area prostriata. Kaas 1982). Finally, and perhaps most importantly, visual
resolution and sensitivity have been determined both behav-
31930022-3077/97 $5.00 Copyright q 1997 The American Physiological Society
J761-6/ 9k13$$ju39 06-05-97 13:33:43 neupal LP-Neurophys

M.G.P. ROSA, V. A. CASAGRANDE, T. PREUSS, AND J. H. KAAS3194
retinas (DeBruyn et al. 1980). The VM was then defined as perpen-iorally and physiologically in this species (Bonds et al. 1987;dicular to the HM through the center of the area centralis. AsLangston et al. 1986).shown in Fig. 3C, these estimates of the axes of coordinates ofThe primary objective of this study was to describe thevisual field result in a distribution of receptive fields near the V1/representation of the visual field in striate cortex and imme-V2 border that resembles the pattern observed in other speciesdiately adjacent extrastriate cortex in Galago. This type of with developed vision, including cat, flying fox, and New World
information is likely to be valuable for the interpretation of monkey (for reviews, see Fritsches and Rosa 1996; Payne 1990);anatomic and physiological studies of cortical organization the receptive fields near the V1 border invade the ipsilateral hemi-in this genus. In the process of recording from V1 and the field to a small extent, and the amount of invasion is similar in thesecond visual area (V2), we also obtained many recordings upper and lower quadrants of the visual field.
Parylene-coated tungsten microelectrodes (with an exposed tipfrom neurons located in the adjacent visually responsiveof 10 mm) were inserted in parasagittal rows of penetrations. Elec-cortex. Although not sufficient to yield a full picture of thetrode penetrations were usually separated by 500–1,000 mm alongorganization of extrastriate cortex in Galago, these explor-the anteroposterior dimension, and were marked with electrolyticatory recordings directly address important aspects of thelesions. The response fields of single units and small unit clustersorganization of the dorsomedial visual cortex rostral to V2were mapped by correlating the stimulation of specific portions ofin prosimians. the visual field with increments of the neural activity. Visual stimulicomprised luminous white spots and bars of variable size andilluminance, moved or flashed on the surface of the screen byM E T H O D Smeans of a hand-held projector. Receptive fields were drawn asrectangles parallel to the axis of best orientation, or as ovals if thisFour adult galagos (G. garnetti) were submitted to single re-axis could not be determined. Receptive field size was calculatedcording sessions. Although most of the data on V1 and V2 wereas the square root of the receptive field area.collected in two experiments, the results from all four cases were
At the end of the experiment, the animals were administered ain close agreement. Anesthesia was induced with halothane (4%)lethal dose of pentobarbitone sodium (100 mg) and transcardiallyand maintained during surgery with multiple intravenous doses ofperfused with 0.9% saline, followed by 10% Formalin in saline.brevital (methohexital sodium, 10 mg/kg). Once anesthetized, theThe brain was removed from the skull, blocked in stereotaxic coor-animals also received intramuscular injections of atropine (0.15dinates, allowed to sink in fixative containing increasing concentra-mg/kg) and dexamethasone (0.4 mg/kg). A tracheotomy was per-tions of sucrose (up to 30%), and frozen-sectioned at 50 mm informed, and the trachea was cannulated to allow for artificial venti-the parasagittal plane. Every section was saved, and every secondlation. The skull was fitted with a stainless steel bolt and an acrylicsection was stained for cell bodies with cresyl violet for reconstruc-well centered on the midline. An extensive craniotomy was madetion of the electrode tracks. Of the alternating series, one sectionexposing the occipital lobe as well as adjacent parts of the temporalin every four was stained for myelin (Gallyas 1979) and the re-and parietal lobes, and the dura mater was resected. Once thesemaining sections were stained for cytochrome oxidase (Wong-procedures were completed the well was filled with silicone oil,Riley 1979). The positions of the recording sites were recon-and a photograph of the cortical surface was taken to be used asstructed on the basis of the histologically determined electrolyticreference for the placement of electrode penetrations.lesions, the gliosis caused by the penetration of the electrode, andDuring the recordings, muscular paralysis was induced by thetransitions between gray and white matter. Bidimensional recon-intravenous infusion of pancuronium bromide (Pavulon, 2 mg/kg,structions of cortical layer 4 were obtained following a modificationfollowed by 2 mgrkg01
rh01) in lactated Ringer solution with 5%of the method of Van Essen and Maunsell (1980), as describeddextrose. For anesthesia, the intravenous injection also includedpreviously (Rosa et al. 1993a). All measurements presented herethe opioid sufentanil citrate (average dose 12 mgrkg01
rh01) . Ininclude correction for shrinkage during histological processing,one of the animals, this was supplemented with small intravenouswhich was estimated by comparing the microdrive readings withdoses of brevital (2 mg/kg) on the 3rd day of the experiment, tothe electrode tracks reconstructed in histological sections.suppress episodes of cyclical cortical spontaneous activity. The
galagos were also maintained under artificial ventilation with agaseous mixture of 75% nitrous oxide-23.5% oxygen-1.5% carbon R E S U L T Sdioxide, which potentiates the effects of the intravenous anesthe-tics. The respiratory volume and rate were adjusted to keep the In the first part of this section we summarize the corticalpercentage of CO2 in the expired air between 4.0 and 4.5%. architecture of areas V1, V2, and prostriata as revealed by
Mydriasis and cycloplegia were induced by the topical applica- both cytochrome-oxidase- and myelin-stained material. Wetion of atropine (1%) eye drops. Appropriate focus was achieved then describe the extent and general topography of the visualby means of hard contact lenses, which brought into focus the
field representation in V1 of Galago and demonstrate thesurface of a 57-cm-diam translucent hemispheric screen centereddetailed visuotopy of this area in both serial sections andon the eye contralateral to the cerebral hemisphere to be studied.‘‘unfolded’’ bidimensional reconstructions. We also presentThe positions of the area centralis, main blood vessels, and blinda quantitative analysis of the variation of receptive field sizespot were projected onto the screen by means of a fiberoptic lightand magnification factor in different parts of V1, and usesource (Pettigrew et al. 1979) and checked every 2–3 h during
the experiment. The position of the horizontal meridian (HM) and these data to calculate the point image size in striate cortex.the vertical meridian (VM) of the visual field were defined ac- Finally, we describe some aspects of the organization ofcording to the relationship between retinal landmarks such as the cortex surrounding V1, including the visuotopic organizationblind spot and the ganglion cell distribution (DeBruyn et al. 1980). of V2 and cortex rostral to dorsomedial V2.First, the HM was defined as a line passing through the area cen-tralis and parallel to the ‘‘visual streak.’’ Because the visual streak
Histological characteristics of areas V1, V2, andin Galago cannot be visualized directly, the estimate was a lineconnecting the center of the area centralis (which was directly prostriatavisualized) to a point 57 below the blind spot, corresponding to
The extent of V1 in galagos was defined both histologi-the average distance between the center of this retinal landmarkand the axis of maximal ganglion cell distribution in flat-mounted cally and physiologically, and was consistent between ani-
J761-6/ 9k13$$ju39 06-05-97 13:33:43 neupal LP-Neurophys

PROSIMIAN VISUAL CORTEX 3195
V1. In V2, the supragranular and granular layers togetherstain rather homogeneously, and more intensely than theinfragranular layers. An infragranular band of slightly in-creased cytochrome oxidase reactivity is also apparent inV2, due to the presence of intensely stained cells in layer 5(Fig. 1A) . The rostral border of V2 is not clearly definedin cytochrome-oxidase-stained parasagittal sections. Areaprostriata presents an overall light staining, being also no-ticeably thinner than either V1 or V2 (Fig. 1B) .
In myelin-stained tissue, V1 is characterized by clearlyseparated inner and outer bands of Baillarger (Fig. 2A) . Incontrast, in V2 a dense plexus of coarse bundles of radialfibers runs without interruption between layers 3 and 6, ob-scuring the cleft between the bands of Baillarger. This char-acteristic is a reliable criterion for separation of this areafrom V1 (Fig. 2B) . In addition, it allows a distinction be-tween V2 and the visual areas rostral to it in ventral, lateral,and dorsolateral extrastriate cortices. Although the areas ros-tral to V2 vary in terms of density of myelination (Krubitzerand Kaas 1990, 1993), they can all be distinguished fromV2 by the presence of a less myelinated band inserted be-tween the inner and outer bands of Baillarger (Fig. 2C) .
Location and overall organization of V1
V1 occupies the caudal pole of the dorsolateral surfaceof occipital cortex, the underlying ventral surface adjacentto the tentorium, portions of the caudal cortex along themidline fissure, and both banks of the calcarine sulcus (Fig.3, A and B) . Within this area there is a single, continuousrepresentation of the entire contralateral hemifield, up toeccentricities of 50–607 along the VM and 1007 along theHM (Fig. 3C) . The representation of the area centralis occu-pies the lateral edge of the portion of V1 exposed on thedorsolateral cortex (Fig. 3A) . The representation of the vi-sual field around the VM forms most of the border of V1(Fig. 3, squares) , and the representation of the HM (Fig. 3,circles) bisects V1 in such a way that the representation ofthe lower quadrant is dorsal to the representation of the upperquadrant. Most of the cortex exposed on the surface of theoccipital lobe corresponds to the representation of the lowervisual quadrant, up to eccentricities of 15–207. Althoughparts of the representation of the upper quadrant near the
FIG. 1. Cytochrome oxidase patterns of the 1st and 2nd visual areas HM are also accessible on the caudal pole of the occipital(V1 and V2, respectively) and prostriata, illustrated in parasagittal sections
lobe, our results indicate that most of the paracentral (5–observed through a Zeiss Axiophot microscope equipped with a digital207 eccentricity) upper quadrant representation is located onvideo capture system (Seescan LC100M). Caudal is left, dorsal is up. A :
border between V1 and V2 in dorsolateral cortex. Downward arrows atop the tentorial surface of the brain (Fig. 3B) . The part ofsection: cytochrome oxidase ‘‘blobs’’ in V1. Rightward arrow within sec- V1 located along the walls of the interhemispheric fissuretion: row of densely stained cells in layer 5, which characterizes certain represents parts of the periphery of the lower quadrant, nearregions of V2. Border between V1 and V2 coincides with tip of this arrow.
the VM, up to Ç407. All of the remaining portions of theB : border between V1 and area prostriata (pro) in dorsal bank of calcarinesulcus (at a level approximately corresponding to section in Fig. 4C) . visual field periphery are represented along the banks of theArrows: cytochrome oxidase blobs of V1. Scale bar in A : 0.5 mm. calcarine sulcus. Although the ventral bank of this sulcus is
entirely dedicated to the representation of parts of the uppervisual field periphery, the dorsal bank represents portions ofmals. V1 can be easily distinguished from adjacent areas inboth the upper and lower visual quadrants (Fig. 3B) . Theparasagittal sections. Although the transitions are also clearmost rostral part of V1, in the calcarine sulcus, represents thein Nissl-stained sections (e.g., Diamond et al. 1985), theperimeter of the contralateral visual field (Fig. 3, triangles) .most precise determination of the boundaries of V1 is af-
forded by the cytochrome oxidase and myelin stains. In cyto-chrome-oxidase-stained sections, V1 can be distinguished Visuotopic organization of V1from both V2 (Fig. 1A) and area prostriata (Fig. 1B) byvirtue of the presence of a darkly stained, broad layer 4, and Figure 4 illustrates results obtained in one animal in which
recordings covered most of the cortex within V1. Figure 4,cytochrome oxidase ‘‘blobs’’ in the supragranular layers of
J761-6/ 9k13$$ju39 06-05-97 13:33:43 neupal LP-Neurophys

M.G.P. ROSA, V. A. CASAGRANDE, T. PREUSS, AND J. H. KAAS3196
A–F, shows the correlation between the positions of re-cording sites in parasagittal sections (A being the most lat-eral, F the most medial) and the visual field coordinates(azimuths and elevations) of the corresponding receptivefields. Given that the electrode penetrations were many milli-meters long, they rarely could be reconstructed within asingle 50-mm section; each of the parasagittal sections illus-trated in Fig. 4 is, therefore, a composite view of severaladjacent sections.
Considering first the cortex exposed on the dorsolateraland tentorial surfaces of the brain, the analysis of parasagittalsections reveals a clear mediolateral gradient in the represen-tation: the most lateral sites (Fig. 4, A1–A4) correspond tothe most central receptive fields, and eccentricity graduallyincreases as the electrode is moved medially (Fig. 4, B1–B21, C1–C16, and D1–D18) . The most peripheral re-ceptive fields of neurons on the dorsolateral and tentorialsurfaces (Fig. 4, E1 and D19, respectively) represent eccen-tricities of Ç207. At the same time, for each mediolaterallevel, the receptive fields gradually move from the lower tothe upper visual field as the electrode tip is moved ventrally(e.g., Fig. 4, B1–B21) .
Comparison of receptive fields recorded in electrode pene-trations close to the midline (Fig. 4F) reveals a gradualdisplacement toward the periphery of the lower quadrant asthe electrode is moved rostrally. A similar centroperipheraltrend characterizes the recording sites located in the calcarinesulcus: at each mediolateral level, the most caudal sites rep-resent the midperiphery of the visual field (30–457, e.g.,Fig. 4, B39, C29, and D35) , and the most rostral sites alwayscorrespond to the representation of the temporal crescent ofthe visual field (Fig. 4, B55–B59, C40, and D47–D48) .The regions of the visual field represented on the banks ofthe calcarine sulcus include the entire periphery of the upperquadrant ( lateral and ventrally in the sulcus, e.g., Fig. 4, A, B,and C17–C27) as well as the portions of the lower quadrantperiphery away from the VM (medial and dorsally in thesulcus, e.g., Fig. 4, C28–C40, D36–D48, E14–E18, andE31–E33) .
These trends can be more readily visualized in graphicallyunfolded views of V1 generated from the contours of indi-vidual parasagittal sections. Three steps in the generation ofa visuotopic map are illustrated in Fig. 5 (corresponding tothe data shown in Fig. 4) . In Fig. 5A, the contours of individ-ual parasagittal sections are aligned and properly spaced,to reconstruct the approximate shape of V1. As an aid toorientation, different regions of V1 are indicated by differentshading. Note that the anteroposterior axis of the cortexwithin the calcarine sulcus is inverted relative to Fig. 4, asa consequence of the process of ‘‘opening’’ the banks ofthis sulcus (the rostral tip of the calcarine sulcus now occu-pies the far right of the drawings) . As shown in Fig. 5A,
FIG . 2. Digital video frames illustrating myelin patterns and transi- V1 in Galago is pear shaped, and not as elongated as intions between V1, V2, and visually responsive ventral cortex rostral to simian primates (e.g., Fritsches and Rosa 1996). The recon-V2 (V?) . Caudal is right, dorsal is up. A : myelin pattern of V1. Parts structed surface area of V1 was 205 mm2 in this animal andof infragranular layers are sectioned tangentially in ventral part. B :
218 mm2 in the other animal with extensive recordings inoblique section through border between V1 and V2 ( at a level similarV1 (these estimates are correct only within 20–30% becauseto that of section in Fig. 4 D ) , illustrating disappearance of less myelin-
ated ‘‘cleft’’ between inner and outer bands of Baillarger, moving from of the error inherent in the graphic unfolding method) (Gat-V1 to V2. C : crossing rostral border of V2, supragranular layers become tass et al. 1987; Van Essen and Maunsell 1980). The portionrelatively broader, and ‘‘matted’’ appearance of V2 in myelin stains
of V1 that is directly accessible on the dorsolateral and cau-gives way to areas where bands of Baillarger are well separated.dal surfaces of the occipital lobe only corresponds to Ç20%Arrows: approximate location of borders of V2. Scale bar in A : 0.5
mm. of this area. In Fig. 5, B and C, the recording sites are
J761-6/ 9k13$$ju39 06-05-97 13:33:43 neupal LP-Neurophys

PROSIMIAN VISUAL CORTEX 3197
FIG. 3. Summary of visuotopic organi-zation and extent of V1 in Galago garnetti.A and B : dorsolateral and medial views of aleft hemisphere in which banks of calcarinesulcus have been separated. Extent of V1is indicated in white. Visuotopy of this areais illustrated according to following sym-bols (see inset) : black squares, representa-tion of vertical meridian (VM); white cir-cles, representation of horizontal meridian(HM); thin continuous lines, isoeccentric-ity contours (5, 10, 20, 40, 60, and 807) ;dashed lines, 2 additional isopolar contours(045 and / 457) . C : projection of all re-ceptive fields recorded in V1 of 4 animalsonto an equatorial-azimuthal chart, illus-trating extent of visual field represented inV1 on 1 side of brain. Each division ofchart corresponds to a 107 interval of azi-muths and elevations. Black circle: locationof blind spot.
J761-6/ 9k13$$ju39 06-05-97 13:33:43 neupal LP-Neurophys

M.G.P. ROSA, V. A. CASAGRANDE, T. PREUSS, AND J. H. KAAS3198
FIG. 4. A–F : relationship between receptive fields and recording sites at 6 parasagittal levels (A is most lateral, F ismost medial) in V1 of 1 animal (‘‘Piglet’’) . A–F each consist of a parasagittal section where recording sites are indicated( left) , a diagram of central portion of visual field illustrating receptive fields of neurons located on superficial cortex (middle) ,and a chart of entire hemifield illustrating receptive fields of neurons recorded on banks of calcarine sulcus (right) . Portionof visual field magnified in middle is indicated by gray box on right. Arrows and dashed lines on sections: borders of V1.CiS, cingulate sulcus; IpS, intraparietal sulcus; LaS, lateral sulcus; P, prostriata.
J761-6/ 9k13$$ju39 06-05-97 13:33:43 neupal LP-Neurophys

PROSIMIAN VISUAL CORTEX 3199
FIG. 4. (continued)
indicated according to the symbols used in Fig. 4, together tricity (Fig. 5B) and isopolar (Fig. 5C) lines are drawn,summarizing the visuotopy of V1.with the observed value of the receptive field center eccen-
tricity (Fig. 5B) and polar angle (Fig. 5C) . On the basis of In the map of eccentricities (Fig. 5B) it can be observedthat there is an emphasis on the representation of centraltheir position in the bidimensional reconstruction, isoeccen-
J761-6/ 9k13$$ju39 06-05-97 13:33:43 neupal LP-Neurophys

M.G.P. ROSA, V. A. CASAGRANDE, T. PREUSS, AND J. H. KAAS3200
FIG. 5. Reconstruction of visuotopy of V1 in ‘‘flat’’ rep-resentations of cortical surface. A : bidimensional reconstruc-tion of shape of V1, based on alignment of contours of layer4 from a series of parasagittal sections (Van Essen andMaunsell 1980). To aid in localization, different regions ofV1 are shaded in different tones of gray. B : map of eccentric-ity representation. Value of receptive field center eccentricitycorresponding to each recording site illustrated in Fig. 4 isindicated (different symbols indicate different parasagittallevels illustrated in Fig. 4) . On the basis of these values,isoeccentricity lines (5, 10, 20, 40, 60, and 807, left to right)were interpolated by eye to fit individual observations. C :map of polar angle representation, illustrating 5 interpolatedisopolar lines (0607,0307, HM,/307 and/ 607, from dorsalto ventral in cortex) .
/ 9k13$$ju39 06-05-97 13:33:43 neupal LP-Neurophys

PROSIMIAN VISUAL CORTEX 3201
FIG. 6. Receptive field size (square root of receptivefield area) of V1 neurons as a function of eccentricity in 1animal (Piglet) . Thick continuous line: best-fitting powerfunction calculated on basis of a principal axis regression.
vision, with approximately half of the surface of V1 being provides a reasonable description of the relationship betweeneccentricity and receptive field size in V1dedicated to the representation of the central 307 of the visual
field. The map of V1 in Galago seems to depart significantlyRF size (degrees) Å 0.57 1 eccentricity0.69 (1)
from that expected on the basis of a logarithmic-conformalmap (Schwartz 1977) in that a geometric progression of It is noteworthy that the receptive field sizes that we findisoeccentricity contours does not result in lines that are sepa- here are comparable to those found in a single-unit recordingrated by roughly equal distances in the cortex. For example, study (DeBruyn et al. 1993).the distance between the 107 and 207 isoeccentricity lines is CORTICAL MAGNIFICATION FACTOR. The linear cortical mag-smaller than that between the 207 and 407 lines, and the nification factor (CMF) was calculated as the ratio of thedistance between the 207 and 407 isoeccentricity lines is distance between two points in the cortex (in mm) and thesmaller than that between the 407 and 807 lines. The map of angular distance between the centers of the correspondingpolar angles (Fig. 5C) suggests that for a given eccentricity receptive fields (in deg) (Daniel and Whitteridge 1961).there is relatively more magnification of those parts of the We concentrated our analysis on the case that yielded thevisual field near the HM than those close to the VM (see most complete sample of V1 (Fig. 7) . Distances betweenalso Fig. 8) . In addition, the region of V1 dedicated to the recording sites were measured in unfolded reconstructions.representation of the periphery of the upper quadrant is larger Only pairs of recording sites separated by ú1 mm and õ3than that representing the periphery of the lower quadrant. mm were used in the analysis. As implied by the surfaceVery similar results were obtained in the other animals, reconstructions, statistical analysis reveals a clear relation-which had less complete sampling of the visual field repre- ship between eccentricity and CMF in V1 (rÅ 0.88). Unlikesentation (a summary map of another case is illustrated in in monkeys (Gattass et al. 1987; Van Essen et al. 1984),Fig. 8, bottom) . no difference was found between the CMF measured along
different axes of V1 of Galago (e.g., parallel vs. perpendicu-lar to the VM representation). Equation 2 describes theQuantitative analysespower function that best fits the data, calculated with theuse of a principal axis regression techniqueRECEPTIVE FIELD SIZE. It is clear from Fig. 4 that there is a
marked increase of multiunit receptive field size from the CMF (mm/deg) Å 2.36 1 eccentricity00.80 (2)central to the peripheral representation in V1 of Galago. Forexample, the sizes of receptive fields within the central 57 A power function, although providing a reasonable de-
scription of the variation of CMF in the paracentral andranged from 0.87 to 2.77, whereas in the far periphery (ú607eccentricity) they ranged from 47 to 207. This trend is quanti- peripheral representations, cannot adequately account for the
variation of CMF within the central visual field (a mapfied in Fig. 6, which illustrates the receptive field size (squareroot of receptive field area) as a function of eccentricity for generated on the basis of such a function would have an
infinitely large central representation). One proposed strat-one animal. A power function (described by Eq. 1) , calcu-lated on the basis of a model II (principal axis) regression, egy to deal with this problem is to add a constant to the
J761-6/ 9k13$$ju39 06-05-97 13:33:43 neupal LP-Neurophys

M.G.P. ROSA, V. A. CASAGRANDE, T. PREUSS, AND J. H. KAAS3202
FIG. 7. Cortical magnification factor(CMF), calculated between pairs of re-cording sites in V1, as a function of meaneccentricity of centers of receptive fieldsrecorded at these sites in 1 animal (Piglet) .Thick continuous line: best-fitting powerfunction calculated on basis of a principalaxis regression. Coarse dashed line at left :estimate of magnification factor in centralrepresentation (õ57) , which includes acorrection factor based on size of represen-tation of area centralis in V1 cortex (seeEq. 3) .
eccentricity term (Gattass et al. 1987; Tootell et al. 1982; Visuotopic organization of V2Van Essen et al. 1984) so that the area predicted by integra-
The visuotopy of the cortex immediately rostral to V1tion of the CMF function matches the observed area of thedemonstrated a homologue of V2 similar to that describedrepresentation of the area centralis. This modified functionin other primates (Allman and Kaas 1974; Gattass et al.(Eq. 3) , shown by the dashed line in Fig. 7, predicts with1981; Rosa et al. 1988b). Although corresponding in generalreasonable accuracy the sizes and shapes of the compart-with the visuotopic organization of V2 described in simians,ments of V1 dedicated to the representation of different por-the organization of this area in galagos (summarized in Fig.tions of the visual field (Fig. 8, top)10) does have some distinctive features. First, V2 is rela-tively small and narrow. In the two animals with extensiveCMF (mm/deg) Å 2.36 1 (eccentricity / 0.73)00.80 (3)recordings, the surface area of V2 was 63 and 68 mm2 (in
POINT IMAGE SIZE. The point image size, i.e., the linear di- both cases corresponding to 31% of the surface area of V1),mension of the cortical locus of all neurons representing a with a maximum width of Ç3 mm. Second, although inpoint of the visual field, measured parallel to the cortical simians V2 has been described as wrapping around V1 al-layers (McIlwain 1976), was estimated as the product of most completely (Allman and Kaas 1971; Rosa et al.the average receptive field size and magnification factor for 1988b), in Galago a relatively large portion of the perimetera given eccentricity (Gattass et al. 1987; Van Essen et al. of V1 in the calcarine sulcus is formed by less myelinated1984). Although this calculation only provides a minimum cortex (including area prostriata; Allman and Kaas 1971;estimate of point image size for a given eccentricity (by Gattass et al. 1987; Sanides 1972). Third, the data suggestvirtue of not taking into consideration the receptive field that the line of ‘‘field discontinuity’’ in the visual field repre-scatter and the sizes of the largest receptive fields) , the sentation in V2 is tilted relative to the HM. Whereas theresulting function nonetheless accurately reflects the varia- dorsal portion of V2 represents most of the lower visualtion of point image size in different portions of a visual area field, the ventral portion represents the entire upper quadrant(Fiorani et al. 1989; Rosa and Schmid 1995a). As shown plus a portion of the lower quadrant adjacent to the HM.in Fig. 9, the point image size in V1 of Galago varies little The lower quadrant representation in dorsal V2 forms awith eccentricity, from Ç1 mm (in the representation of the mediolaterally elongated strip, extending from immediatelycentral 107) to 0.8 mm (in the representation of the far rostral to the representation of the area centralis in V1 to
the banks of the interhemispheric fissure, only invading theperiphery of the visual field) .
J761-6/ 9k13$$ju39 06-05-97 13:33:43 neupal LP-Neurophys

PROSIMIAN VISUAL CORTEX 3203
dorsal bank of the calcarine sulcus to a small extent (Figs.10 and 11), in close agreement with the architectonic de-limitation of dorsal V2 by Preuss and Goldman-Rakic(1991a). There is a clear mediolateral gradient of eccentric-ity representations, from lateral (central representation) tomedial (peripheral representation), and nearly half of thesurface area is dedicated to the central 207 of the visual field.The border between V2 and V1 is formed by the representa-tion of the VM (e.g., Fig. 11, fields 6, 14, 21, and 28–30).In general, the recorded receptive fields move away fromthis meridian as the electrode is moved rostrally. However,the receptive field sequences are rather irregular, and caudal-to-rostral sequences of recording sites often reveal partialreversals near the HM representation (e.g., Fig. 11, fields16–20 and 24–27). These partial reversals, as well aschanges in receptive field size and architectonic pattern, sug-gest that a large portion of the rostral boundary of V2 withanother visually responsive area in dorsal cortex correspondsto a representation of the lower visual field near the HM,rather than corresponding exactly to the representation ofthe HM as in simians. For example, in Fig. 12 we illustrateresults obtained in rows of penetrations that crossed the bor-der between V2 and the presumptive dorsomedial visual area(DM) (Krubitzer and Kaas 1990) (also referred to as thedorsal visual area by Allman et al. 1979) at different medio-lateral levels. In each case, the receptive fields of neuronsrecorded at the most rostral sites within V2 are centeredbelow the HM, rather than coinciding with this meridian(Fig. 12, A8, B5, and C7) .
Our observations of ventral extrastriate areas are also con-sistent with the presence of V2, similar to what has beenobserved in simians (Fig. 13). The results demonstrate asystematic representation of the entire upper quadrant, ex-tending across the tentorial surface and invading the lowerbank of the calcarine sulcus to a small extent. In addition,rows of penetrations crossing from V2 into adjacent areasdemonstrate that the rostral border of ventral V2 correspondsto a representation of a portion of the lower quadrant nearthe HM rather than to the HM itself (e.g., Fig. 13, fields18–20, 31–32, and 41). The sizes of the receptive fieldsof neurons located in this narrow strip of lower quadrantrepresentation are similar to those recorded in more caudalportions of dorsal and ventral V2 (Fig. 14). These observa-tions lend support to the suggestion that the line of fielddiscontinuity in the visuotopic map of Galago V2 is tiltedrelative to the HM. As shown in Figs. 10 and 13, V2 isnarrowest ( just under 1 mm) at the representation of thecenter of gaze. However, sequences of recording sites cross-ing dorsoventrally at this point yield no evidence for a dis-continuity between the dorsal and ventral parts of V2 (Fig.13, fields 1–7, 8–16, and 21). These data suggest that thefield discontinuity in V2 corresponds to an eccentricity ofõ57 (Fig. 10).
In simian primates, the representation of visual field inV2 is anisotropic: a similar distance in the visual field (indeg) is represented by a distance twice as long in the cortexFIG. 8. Summary visuotopic maps of V1 in Galago. Top : diagrammaticparallel to the V1/V2 border as perpendicular to this bordermap based on power function describing relationship between cortical mag-
nification factor and eccentricity (Fig. 7) . Middle and bottom : summaries (Rosa et al. 1988b). This ‘‘stretching’’ of the visual fieldof data in 2 animals. Animal ‘‘Linda’’ (bottom) lacked recording sites near map has been correlated with the presence of functionallyoccipital pole, and therefore there is a gap in representation where visuotopic
distinct stripes in V2, first revealed by cytochrome oxidasecoordinates could not be estimated. Symbols used in representation of visuo-histochemistry, that run perpendicular to the V1/V2 bordertopic coordinates are similar to those employed in Fig. 3, and are indicated
in inset. (Roe and T’so 1995; Tootell et al. 1983). Because cyto-
J761-6/ 9k13$$ju39 06-05-97 13:33:43 neupal LP-Neurophys

M.G.P. ROSA, V. A. CASAGRANDE, T. PREUSS, AND J. H. KAAS3204
FIG. 9. Estimate of point image size as a function ofeccentricity in V1.
chrome oxidase stripes are not present in Galago V2 (Condo presumptive boundaries of DM illustrated in Figs. 12 and16, which are based on the physiological criterion, are inand Casagrande 1990), we were interested in determining
whether the representation in V2 of this species would also good agreement with histological estimates in other animals(Preuss and Goldman-Rakic 1991a). Neurons in the pre-be anisotropic. Therefore the CMF of V2 was calculated for
two animals on the basis of interpolated visuotopic maps of sumptive DM have receptive fields that are on average largerthan those for neurons in V2, although there was a consider-both dorsal and ventral V2 (Fig. 15). Different power func-
tions were fitted to data measured between sites located able overlap between the samples obtained in these areas.Laterally in DM, neurons have receptive fields that includealong imaginary lines parallel to the V1/V2 border (CMFpl ;
Eq. 4) and perpendicular to this border (CMFpd; Eq. 5) the center of gaze and the central lower quadrant, sometimesinvading the ipsilateral hemifield (Fig. 12A) . More centrallyCMFpl (mm/deg) Å 2.05 1 eccentricity00.80 (4)in this region, receptive fields cover paracentral portions of
CMFpd (mm/deg) Å 0.83 1 eccentricity00.80 (5) the lower quadrant, near the border with V2, and of theupper quadrant rostrally (Fig. 12B) . Near the midline, theThis analysis reveals that, despite the absence of cyto-receptive fields extend to ¢607 from the center of gaze,chrome oxidase stripes, there is an anisotropic representationincluding portions of both quadrants (Fig. 12C) . Thus theof the visual field in Galago V2, which is as marked as thatcortex within our current estimate of the border of DM en-observed in simians. At all eccentricities, the magnificationcompasses a representation of the entire upper quadrant, plusfactor parallel to the V1/V2 border is over twice that perpen-the lower quadrant near the HM.dicular to this border. It should also be noted that the expo-
We have naturally wondered whether DM is an area withnents of Eq. 4 and 5 are identical to that of the CMF functionincomplete representation of the visual field, or whether theof V1 (Eq. 2) . Thus, at least to a first approximation, the‘‘missing’’ portion of the lower quadrant representation (in-emphasis on central vision is similar in areas V1 and V2.cluding the periphery near the VM) is located outside thecurrent estimated boundaries. The data clearly indicate thatEvidence for DMthe lower quadrant periphery is not represented medial to
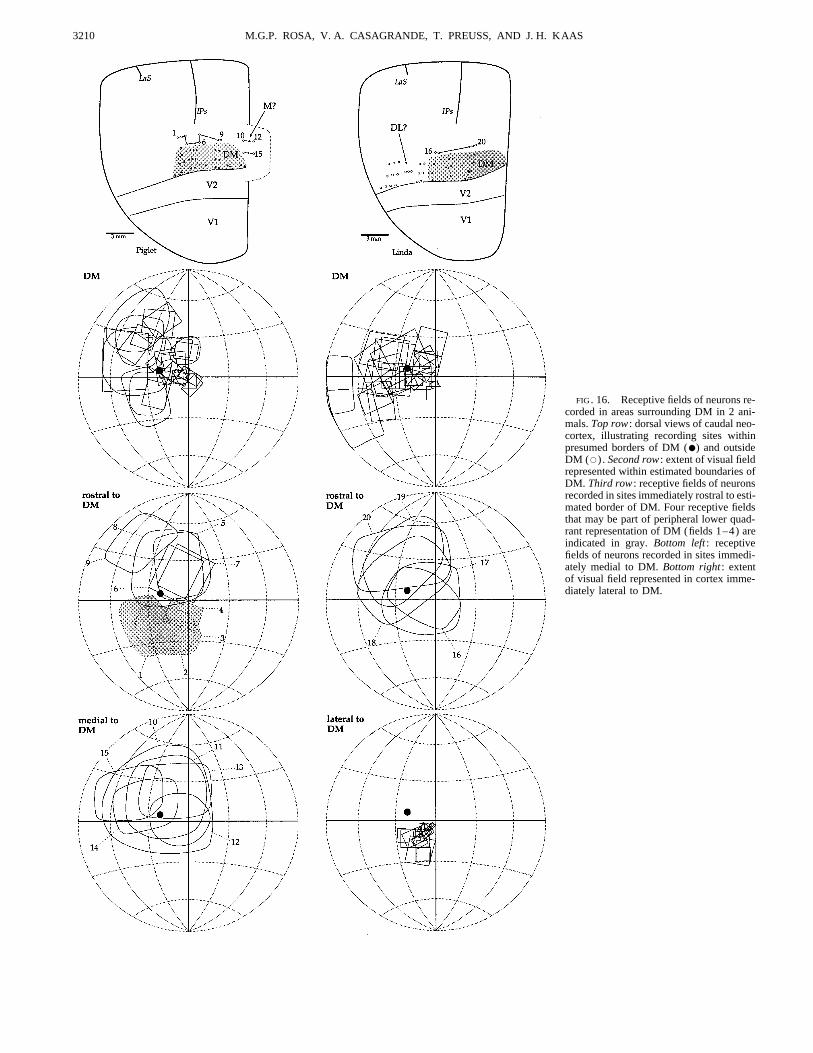
Recordings in dorsomedial cortex immediately rostral to the estimated boundary. Instead, the cortex medial to DMV2 resulted in rows of recording sites corresponding to sys- along the midline re-represents the upper quadrant, withtematic shifts in receptive field positions (Fig. 12) in the large receptive fields (Fig. 16, fields 10–15). In addition,location of the architectonically defined DM (Allman and the cortex immediately lateral to the presumptive DM, dorso-Kaas 1975; Krubitzer and Kaas 1990). Because of histologi- laterally, has neurons with smaller receptive fields, whichcal artifacts related to the large number of long electrode systematically represent the central lower quadrant (Fig. 16,penetrations in this region, we were unable to reconstruct bottom right) , confirming the results of Allman et al. (1979)the myeloarchitectonic borders of DM in the same animals. in the lesser galago (Galago senegalensis) . Finally, as men-Nonetheless, the rostral border of DM is well defined physio- tioned above, most of the cortex along the rostral border oflogically in the anesthetized galago as a transition between DM has neurons with very different response properties inneurons with vigorous visual responses and sharply defined comparison with DM neurons (including large receptivereceptive fields (in DM) and neurons that are harder to drive fields, Fig. 16, fields 5–9 and 16–20). The exception, illus-
trated in Fig. 16 (fields 1–4), is a small region of cortexand that tend to have larger receptive fields (Fig. 16). The
J761-6/ 9k13$$ju39 06-05-97 13:33:43 neupal LP-Neurophys

PROSIMIAN VISUAL CORTEX 3205
FIG. 10. Location and visuotopy of V2.Top : dorsolateral ( left) and medial (right)views of left cerebral hemisphere of a ga-lago, indicating location of V1, V2, andmiddle temporal area (MT). Bottom : re-gion enclosed by box, shown magnified,illustrating visuotopic organization of V2(present results) and MT (on the basis ofarchitectonical results of Preuss and Gold-man-Rakic 1991a and physiological re-cording data of Allman et al. 1973). Visuo-topy of V2 is indicated according to sym-bols shown in inset (bottom) . Arrows:continuity of V2 belt from lateral to medialviews of cortex.
located rostrolateral to the presumptive DM border. This we were able to evoke visual responses from some neuronsin this area (3 of 12 recording sites) . Although the sampleregion, which was observed in one animal, includes a com-
pressed representation of the lower quadrant periphery that was too small to allow any conclusions regarding visuotopy,we found that the receptive fields of neurons in this areanearly exactly complements the visual field representation
in DM, with receptive fields of appropriate size for DM. include both the central and the peripheral visual field andare large (4–6 times the diameter) in comparison with thoseThus, although this result demands confirmation with addi-
tional experiments, it is possible that DM in galagos forms at a comparable eccentricity in V1.a second-order representation of the entire visual field, witha field discontinuity running ventral to the HM.
D I S C U S S I O N
Our main finding is that the visuotopic organization ofArea prostriataV1 and V2 in the prosimian galago shares many of thefeatures described for simian primates, suggesting that theseAs mentioned above, a relatively large proportion of the
perimeter of V1 (25% and 27%, in the two most extensively characteristics existed in the last common ancestor of allprimates. Both V1 and V2 are continuous areas, each con-studied animals; see Figs. 11 and 13) was formed by agranu-
lar, poorly myelinated cortex. In terms of both location and taining a single representation of the entire visual field, withthe VM at their common border. As in other primates, V1architectonic appearance, this cortex resembles area prostri-
ata (Allman and Kaas 1971; Sanides 1972) and the splenial forms a continuous (1st-order) representation with an ex-panded representation of central vision, whereas V2 containsvisual area of cats (Kalia and Whitteridge 1973). Similar
to the findings of MacLean (1966) in the squirrel monkey, a split (2nd-order) representation of the visual field. The
J761-6/ 9k13$$ju39 06-05-97 13:33:43 neupal LP-Neurophys

M.G.P. ROSA, V. A. CASAGRANDE, T. PREUSS, AND J. H. KAAS3206
FIG
.11.
Cor
rela
tion
betw
een
posi
tion
sof
reco
rdin
gsi
tes
and
rece
ptiv
efi
elds
indo
rsal
V2.
Top
left
:bi
dim
ensi
onal
reco
nstr
ucti
onof
caud
alco
rtex
in1
anim
al,
illu
stra
ting
exte
ntof
V2,
MT
,an
dar
eapr
ostr
iata
(est
imat
edbo
rder
sar
ein
dica
ted
ingr
ay).
Bot
tom
left
:re
gion
encl
osed
bybo
x,sh
own
mag
nifi
ed,
plot
slo
cati
onof
39re
cord
ing
site
sin
dors
alpa
rtof
V2.
To
faci
lita
tepr
esen
tati
on,
thes
esi
tes
wer
eco
nnec
ted
tofo
rm7
arbi
trar
yse
quen
ces,
from
late
ral
(1–
5)
tom
edia
l(3
7–
39)
inco
rtex
.O
ther
plot
s:lo
cati
onof
rece
ptiv
efi
elds
reco
rded
from
neur
ons
atea
chof
thes
esi
tes,
indi
agra
ms
ofce
ntra
l(t
opro
w)
and
peri
pher
al(r
ight
;bo
ttom
row
)vi
sual
fiel
d.S
TS
:su
peri
orte
mpo
ral
sulc
us.
J761-6/ 9k13$$ju39 06-05-97 13:33:43 neupal LP-Neurophys

PROSIMIAN VISUAL CORTEX 3207
FIG. 12. A–C : sequences of receptive fields and recording sites crossing border between V2 and presumptive dorsomedialvisual area (DM) at different mediolateral levels. A–C each illustrate a dorsal view of brain ( left) indicating recording sitesand estimates of borders of V1, V2, and DM. Corresponding receptive fields in V2 (middle) and DM (right) are illustratedrelative to HM and VM (thick lines) and blind spot (gray).
J761-6/ 9k13$$ju39 06-05-97 13:33:43 neupal LP-Neurophys

M.G.P. ROSA, V. A. CASAGRANDE, T. PREUSS, AND J. H. KAAS3208
FIG. 13. Correlation between positions of recording sites and receptive fields in ventral V2. Left : bidimensional reconstruc-tion of caudal cortex in 1 animal, illustrating extent of V2 and area prostriata (estimated borders indicated in gray). Middle :region enclosed by box, shown magnified, plots location of recording sites in ventral part of V2 and in other areas. Tofacilitate presentation, recording sites within V2 were connected to form 6 arbitrary sequences, from dorsolateral (1–7) toventromedial (48–51) in cortex. Thick dashed line: HM representation in ventral V2. Plus and minus signs indicate whetherreceptive fields recorded in area rostral to V2 had centers in upper and lower quadrants, respectively. Right : location ofreceptive field centers recorded from neurons at each V2 site, in a diagram of contralateral visual field. Region of visualfield encompassed by borders of all V2 receptive fields is indicated in light gray. Receptive fields recorded from neurons at3 sites rostral to V2 (a–c) are also illustrated to give an indication of their size.
results also provide evidence for a homologue of area DM many others have concluded that there is a preferential repre-sentation of the fovea (or area centralis) in V1, such thatlocated anterior to V2. In addition to these findings, our datathe number of V1 cells representing the central visual fieldreveal some differences in the organization of V1 and V2is much larger than that expected on the basis of the distribu-of galagos in comparison with simian primates. The signifi-tion of ganglion cells (Myerson et al. 1977; Perry and Coweycance of these similarities and differences in visual field1985, 1988; Rosa and Schmid 1995a; Silveira et al. 1989,representation between galagos and simians is considered in1993). The difficulty in answering this question is com-more detail below.pounded by two main factors: the presence of a populationof displaced amacrine cells in the ganglion cell layer, whoseV1: quantitative analysesdensity varies less steeply with eccentricity than that of the
One of the main discussions in the current literature re- ganglion cells, and the displacement of ganglion cells towardgarding the visuotopy of V1 refers to whether or not the the foveal rim, with the consequent difficulty in determiningextent of the representation of different sectors of the visual the numbers of ganglion cells that are connected to fovealfield in this area is directly proportional to the ganglion cell photoreceptors (Silveira et al. 1993; Wassle et al. 1989;density in different parts of the retina. Although several Wilder et al. 1996). As pointed out previously (Silveira etstudies have proposed that such a direct relationship exists al. 1993), nocturnal primates may be good animal models
in which to study this question, given that the absence, or(e.g., Schein and De Monasterio 1987; Wassle et al. 1989),
J761-6/ 9k13$$ju39 06-05-97 13:33:43 neupal LP-Neurophys

PROSIMIAN VISUAL CORTEX 3209
FIG. 14. Receptive field size of V2 neurons (pooleddata from 2 animals) . Gray squares: data obtained fromrecording sites in dorsal V2. White squares: data obtainedfrom recording sites in ventral V2 that yielded receptivefields centered in upper quadrant or HM. Black triangles:data obtained from recording sites in ventral V2 thatyielded receptive fields centered in lower quadrant. Powerfunction that best fits data (thick continuous line): re-ceptive field size (deg) Å 0.76 1 eccentricity0.87 .
rudimentary nature, of the fovea in these species greatly ies. Such a large discrepancy between the two gradients isdifficult to reconcile with the view of a proportional visuo-facilitates the quantification of ganglion cell densities in the
central visual field. A previous study in G. garnetti (De- topic relationship along the retinogeniculocortical pathway.The presence of displaced amacrine cells was not recognizedBruyn et al. 1980) (note that in that study this species was
referred to as Galago crassicaudatus) has demonstrated that at the time of the study of DeBruyn et al. (1980), and, asdemonstrated by others (Silveira et al. 1993; Wassle et al.the peak density of neurons in the ganglion cell layer is
Ç11,200 cells per mm2, and that there are õ500 cells per 1989; Wilder et al. 1996), the density profile of such cellsmay be very different from that of ganglion cells. Nonethe-mm2 in the nasal periphery of the retina (90–1007 eccentric-
ity) . These estimates yield a centroperipheral gradient of less, even allowing for a hypothetical increase in the propor-tion of amacrine cells from center to periphery, it is unlikely22.4:1, which contrasts sharply with a gradient of 250:1
for the areal CMF (estimated as the square of the linear that the visuotopy of Galago V1 will directly reflect theretinal ganglion cell distribution. For example, assuming thatmagnification factor) in V1 in the same range of eccentricit-
FIG. 15. Cortical magnification factors in V2, measuredbetween points in cortex located along imaginary lines parallel(n; thick continuous line) and perpendicular (h; thick dashedline) to V1/V2 border.
J761-6/ 9k13$$ju39 06-05-97 13:33:43 neupal LP-Neurophys
M.G.P. ROSA, V. A. CASAGRANDE, T. PREUSS, AND J. H. KAAS3210
FIG. 16. Receptive fields of neurons re-corded in areas surrounding DM in 2 ani-mals. Top row : dorsal views of caudal neo-cortex, illustrating recording sites withinpresumed borders of DM (●) and outsideDM (s) . Second row : extent of visual fieldrepresented within estimated boundaries ofDM. Third row : receptive fields of neuronsrecorded in sites immediately rostral to esti-mated border of DM. Four receptive fieldsthat may be part of peripheral lower quad-rant representation of DM (fields 1–4) areindicated in gray. Bottom left : receptivefields of neurons recorded in sites immedi-ately medial to DM. Bottom right : extentof visual field represented in cortex imme-diately lateral to DM.
J761-6/ 9k13$$ju39 06-05-97 13:33:43 neupal LP-Neurophys
PROSIMIAN VISUAL CORTEX 3211
in the area centralis displaced amacrine cells form Ç5% of remembering that the first evidence of simians of modernaspect has only been recovered from Eocene formationsthe neuronal population of the ganglion cell layer (as in both
diurnal and nocturnal simians) (Silveira et al. 1993; Wassle (Ç40 million years ago) (Beard et al. 1994; Godinot andMahboubi 1992; Simons 1995). Yet, despite their remoteet al. 1989; Wilder et al. 1996), then they would need to
form ú90% of the cell population in peripheral retina to common ancestry, previous studies have demonstrated thatseveral aspects of the organization of V1 in galagos areyield a direct proportional relationship between retina and
cortex. Thus our data suggest that galagos resemble simian similar to those observed in simians, including the patternof termination of geniculocortical afferents relative to theprimates in having a preferential representation of the area
centralis in V1, in agreement with Azzopardi and Cowey’s cortical layers (Diamond et al. 1985; Florence and Casa-grande 1987; Florence et al. 1983; Lachica and Casagrande(1993) anatomic demonstration based on transneuronal
transport of retrograde tracers from the cortex to the retina. 1992; Lachica et al. 1993), the architectonic distribution ofcytochrome oxidase and calcium-binding proteins (CondoIt does remain possible, however, that the visuotopy of V1
will reflect the density of a particular type of ganglion cell and Casagrande 1990; Johnson and Casagrande 1995), neu-ronal response properties (DeBruyn et al. 1993), and the(Malpeli et al. 1996; Schein and de Monasterio 1987).
The analysis of the cortical point image size (Fig. 9) reveals pattern of projections to extrastriate cortex (Krubitzer andKaas 1990, 1993; Symonds and Kaas 1978; Tigges et al.that the steep decrease of CMF with increasing eccentricity is
almost exactly counterbalanced by an increase in the average 1973). These data converge to suggest that the features ofV1 organization common to lorisiform prosimians and simi-receptive field size. Thus in Galago, as in the flying fox (Rosa
et al. 1993a), a nearly constant number of V1 neurons is used ans were established early during primate evolution. Thepresent study demonstrates that the visuotopy of Galago V1to process stimuli located anywhere in the visual field. One
interpretation of these data is that V1 is formed by physiologi- is consistent with that observed in other mammals as far asthe relative locations of central /peripheral and upper/ lowercal modules of similar size throughout the visuotopic map;
these are likely to include columns responsive to both eyes visual field representations are concerned. Nonetheless, thedata also demonstrate some characteristics that are interme-and at least a full cycle of orientation columns (Hubel and
Wiesel 1974). The actual point image size curve obtained for diate between those of nonprimate mammals on one handand simian primates on the other. These include the size ofone individual with extensive mapping of V1 suggests a slight
decrease (from 1.0 to 0.8 mm) of the point image size between V1 relative to body size, the degree of emphasis on represen-tation of central vision, and the topographic relationship be-the central and peripheral representations. It is interesting to
observe that this is paralleled by changes in the distribution tween areas V1, V2, and prostriata.Many authors have suggested that primates as a group,of cytochrome oxidase blobs in the upper layers. In Galago,
as in most other primates (see Preuss and Kaas 1996 for and simians in particular, are highly dependent on vision fortelereception. Attempts to define primates as a natural groupreview), V1 is characterized by a histologically defined regu-
lar modular organization, evidenced by the cytochrome oxi- distinct from other mammals commonly mention that ‘‘thevisual sense is greatly emphasised’’ (Martin 1990; see alsodase blobs of the upper cortical layers (Fig. 1). There are
more blobs per mm2 within the calcarine sulcus than on the Polyak 1957) and contain references to an ‘‘elaboration andperfection of the visual apparatus’’ (Le Gros Clark 1959).dorsolateral surface (2.9 vs. 2.6 blobs/mm2) (Condo and Ca-
sagrande 1990), and this may indicate that the histologically In agreement with this notion, a previous study (Rosa et al.1993a) has demonstrated that the surface area of V1 of bothdefined modules are slightly smaller in the peripheral repre-
sentation in comparison with the central representation. Thus simian and prosimian primates is significantly larger thanthat of nonprimates of similar body mass. The present datathe physiological and histological data converge to support
the notion of a slight decrease in module size from central to indicate that the surface area of V1 in G. garnetti (Ç200mm2) is 2–3 times as large as would be expected in compari-peripheral V1. The slight variation of module size in Galago
V1 is reminiscent of the organization demonstrated in New son with nocturnal nonprimates of similar body size, suchas ferrets (Law et al. 1988) and hedgehogs (Kaas et al.World primates such as the Cebus monkey and squirrel mon-
key (Horton and Hocking 1996; Rosa et al. 1991). In the 1970). Yet, despite the similarities in functional architecture,it is also apparent that V1 in the galago is relatively smallmacaque, early reports have suggested a marked variation
of module size with eccentricity on the basis of both blob in comparison with that of simians.To what extent is the ‘‘intermediate’’ condition of V1 indistribution and ocular dominance hypercolumn width (Le
Vay et al. 1985; Livingstone and Hubel 1984). However, galagos a reflection of adaptations to a nocturnal niche? Arelevant comparison can be drawn with the nocturnal owlthese findings have been challenged (Florence and Kaas 1992;
Gattass et al. 1995), and it is presently unclear to what extent monkey, which is similar to G. garnetti in terms of bodymass and density of retinal ganglion cells (DeBruyn et al.the macaque departs from the pattern observed in other pri-
mates. 1980). As in Galago, the striate cortex of owl monkeysdiffers from that of diurnal simians in a number of aspects,including a relatively small surface area (286–400 mm2)V1: comparative analysis(Myerson et al. 1977; Tootell et al. 1985), which corre-sponds to about half of that in the similarly sized but diurnalOn the basis of both paleontological data and studies of
molecular evolution, primatologists have suggested that the squirrel monkey (Cowey 1964). Thus it is likely that adapta-tions to nocturnal lifestyles are a major factor determininglineages leading to present-day lorisiform prosimians (which
include Galago) and simians have been separated at least the relative size of visual areas. For example, the size ofV1 might be correlated with the number of ganglion cellssince the Palaeocene epoch (55–66 million years ago) (Mar-
tin 1990). To put these estimates in context, it is worth projecting centrally and with the convergence ratio along
J761-6/ 9k13$$ju39 06-05-97 13:33:43 neupal LP-Neurophys

M.G.P. ROSA, V. A. CASAGRANDE, T. PREUSS, AND J. H. KAAS3212
the visual pathway, factors that may differ in nocturnal ver- an ‘‘apex’’ that corresponds to the representation of the fo-vea or area centralis (e.g., Dow et al. 1985; Tootell et al.sus diurnal species. As demonstrated by studies comparing
the retina and lateral geniculate nucleus of feral and domestic 1988). Although similar to other primates, the present datasuggest that these characteristics are less marked in Galagoanimals of the same genus, these characteristics can be regu-
lated by developmental processes in such a way that vast than in simians, both diurnal and nocturnal (Fig. 17). Inmarked contrast, in most ( if not all) nonprimates the longerquantitative changes can occur in a relatively small number
of generations (Peichl 1992; Williams et al. 1993). axis of V1 is parallel to the VM, and the representation ofthe area centralis does not protrude toward V2 (ChoudhuryGiven the possibility that the volume of visual areas is a
labile character, in evolutionary terms, is there any reason 1978; Hughes 1971; Kaas et al. 1970, 1972a,b, 1989; Lawet al. 1988; Lowel 1987; Picanco-Diniz et al. 1991; Rosa etto suspect that the relatively small size of V1 (and other
areas) in Galago reflects a lesser degree of differentiation al. 1993a; Sousa et al. 1978; Tusa et al. 1978; Wagor et al.1980). Several authors have correlated the overall shape ofin comparison with simians? Although nocturnality is clearly
an important element, the fact remains that presently pub- V1 with the functional architecture for ocular dominance,suggesting that the map tends to be elongated perpendicularlished figures suggest that the surface area of V1 in the owl
monkey is still ¢40% larger than that in the galago. Both to the preferred orientation of ocular dominance stripes (e.g.,Anderson et al. 1988; Lowel et al. 1988; Rosa et al. 1988a,the owl monkey and the galago are present-day representa-
tives of what seem to be long-standing but independent lin- 1992; Tootell et al. 1982, 1988). Information on the layoutof ocular dominance columns in galagos is still sketchyeages of nocturnal primates that can be traced back at least 15
million years (McCrossin 1992; Setoguchi and Rosenberger (Glendenning et al. 1976). However, given the shape ofstriate cortex and the isotropic CMF we observed in this1987). In view of the relative rapidity with which quantita-
tive changes in the visual pathway can occur, it is unlikely area, one expects that a more complete study of these animalswill reveal a system of bands less regularly oriented thanthat the differences between the owl monkey and the galago
could be solely attributed to the fact that the owl monkey that observed in simian primates.The border relationship of V1 with V2 and area prostriataprobably descended from diurnal ancestors (e.g., Hoffstetter
1982). In theory, it is possible that in the course of the also differs markedly between simian primates and nonpri-mates (Fig. 17) . In both nocturnal and diurnal simians, V2evolutionary process leading to present-day simians further
quantitative changes in the retinogeniculostriate pathway oc- wraps around V1 almost completely, with a relatively smallarea prostriata, located at the rostral end of the calcarinecurred, possibly related to the reduction in the olfactory
apparatus and increasing reliance on vision among simians sulcus, forming onlyÇ10% of the perimeter of V1 (Allmanand Kaas 1971; Gattass et al. 1981, 1987; MacLean 1966;(Cave 1973; Le Gros Clark 1959; see Martin 1990 for a
review), or that new neuronal circuits were added to simian Rosa et al. 1988b; Van Essen et al. 1984) . In contrast, innonprimates, visually responsive ‘‘limbic’’ agranular cor-striate cortex after the divergence from the prosimian lin-
eages. Alternatively, given that the brains of simians tend tex located medial to V1 may form over half of the perime-ter (e.g., Kaas et al. 1989; Kalia and Whitteridge 1973;to be larger overall than those of size-matched prosimians,
the larger surface of visual areas may be pleiotropic, being McConnell and LeVay 1986; Rosa et al. 1995) . Here again,the pattern revealed by our experiments suggests an inter-the result of a developmental regulatory process affecting
the entire brain rather than targeting the visual apparatus in mediate condition in Galago : V2 forms about three-quar-ters of the perimeter of V1, with the remaining quarterparticular. Morphometric studies of the retina and other vi-
sual structures in diurnal prosimians could help clarify these being formed by area prostriata. Studies of interhemi-spheric connections in galagos reveal that projecting cellsquestions.
Analysis of the data also demonstrates that the emphasis are distributed well within V1, much as in nonprimates,rather than being restricted to the immediate vicinity of theon central vision representation in V1 of Galago is less
marked than that observed in simians. One simple index for border of this area, as in simians (Beck and Kaas 1994;Cusick et al. 1984; Kennedy et al. 1986) . This anatomiccomparing this across different species is the proportion of
the surface area of V1 dedicated to the representation of the organization may be reflected in the presence of a represen-tation of the ipsilateral hemifield near the VM, as revealedcentral 107 of the visual field. Whereas in diurnal simians
ranging from marmosets to humans this portion of the visual by our experiments (Fig. 3C ) .field occupies 50–60% of the surface area of V1 (Fritschesand Rosa 1996), in G. garnetti it corresponds to only 20– Organization of V222% of the total V1 surface (Fig. 8) . The proportion ob-served in Galago is even smaller than that reported in the We propose that the visuotopic map in Galago V2 is a
second-order representation of the visual field, featuring anocturnal owl monkey (30%) (Allman and Kaas 1971), butapproaches that found in nonprimates with well-developed field discontinuity that does not exactly correspond to the
HM. Given the existence of other plausible interpretationsvision such as cats (20%) (Tusa et al. 1978). It is interestingto observe that the peak resolution of the visual system of of the data, we acknowledge that the issue of the exact
location of the field discontinuity and anterior border of V2galagos is very similar to the cat’s, and about half of thatin the owl monkey (Bonds et al. 1987; Langston et al. 1986). should be considered a hypothesis to be tested by further
studies. One reasonable alternative is that, as in simiansIn primates (including galagos) the unfolded surface ofV1 forms an ellipse with the major axis parallel to the repre- (e.g., Allman and Kaas 1974; Gattass et al. 1981), the rostral
border of V2 in galagos is coincident with the representationsentation of the HM (e.g., Daniel and Whitteridge 1961; seeFritsches and Rosa 1996 for a review). In these species, the of the HM. Purely on the basis of the progression of the
receptive field centers (Figs. 11–13), one might argue thatrepresentation of the VM in V1 bows out markedly, forming
J761-6/ 9k13$$ju39 06-05-97 13:33:43 neupal LP-Neurophys

PROSIMIAN VISUAL CORTEX 3213
FIG. 17. Topographic relationships of V1, V2, and prostriata in a hypothetical nonprimate, Galago, and a hypotheticalsimian primate.
the border of dorsal V2 could be placed more rostrally (e.g., Another possibility is that the impression of a tilted fielddiscontinuity at the rostral border of V2 is due to error inaround Fig. 12, A10, B8, and C10) , leaving V2 directly
abutting the upper quadrant representation in DM, and that measurement, specifically, in our estimates of the locationof the area centralis and the HM. For example, the eyes ofthe border of ventral V2 could be placed more caudally,
therefore excluding the sector of lower quadrant representa- cats rotate during paralysis, and a correction is necessarywhen measuring the polar angles of receptive fields relativetion. Although the myeloarchitecture of ventral cortex sug-
gests that the sector of lower quadrant representation near to the screen (Cooper and Pettigrew 1979). Fortunately,there are good reasons to believe that this was not a seriousthe rostral border of V2 is part of V2, this is a narrow strip
of cortex, and there is a degree of uncertainty in determining factor in our experiments. Although there is some degree oferror in interpolating the HM on the basis of the positionsthe border. Thus the histological evidence alone is not defin-
itive. However, the sizes of the receptive fields of neurons of the area centralis and optic disk, any error would besimilar for all visual areas. Yet the receptive fields recordedrecorded in this transitional region of lower quadrant repre-
sentation are well within the range of those found in other in V1 (often in the same penetrations) result in a visuotopicmap in which 1) the center of the visual field coincides wellparts of V2 (Fig. 14), and they are much smaller than the
ones recorded in the more rostrally located area (which may with the apex of the curvature of the border of V1 in lateralcortex and 2) there is no evidence of a large asymmetrybe a homologue of the ventral posterior area) . Furthermore,
sequences of recording sites extending rostral to this transi- between the representations of the upper and lower quad-rants. If anything, the mild asymmetry we observed in V1tional region reverted to re-represent the upper quadrant,
rather than advancing further into the lower quadrant. Ex- (the periphery of the upper quadrant being more magnifiedthan that of the lower quadrant; Figs. 5 and 8), which maycluding the lower quadrant transitional region from ventral
V2 would therefore leave us with a narrow area that only be due to rotation of the stimulated eye, would point to anerror in the opposite direction. Furthermore, given the extentrepresented a sector of the lower visual field near the HM.
In view of these arguments, we believe that the balance of of the receptive fields recorded in V1 (Fig. 3C) , a rotationof our frame of coordinates to bring the HM into alignmentevidence in ventral cortex favors the interpretation that there
is some lower quadrant representation forming the rostral with the most ventral receptive fields recorded in ventral V2(Fig. 13, fields 20, 31, and 41) would result in a largeborder of ventral V2. This, combined with the (admittedly
subtle) transitions in receptive field size between dorsal V2 invasion of the ipsilateral hemifield in the upper quadrantrepresentation and a lack of representation of the VM in theand DM tending to occur below the HM, and the evidence
on the organization of DM itself (see below), suggest the lower quadrant.It is interesting to note that a field discontinuity obliquemodel of organization of V2 summarized in Fig. 10. The
‘‘split representation’’ tilted relative to the HM is reminis- relative to the HM was also demonstrated in V2 of megachir-opteran bats (Rosa et al. 1994), animals that are consideredcent of the proposal of Gattass et al. (1988) for macaque
V4. One feasible experiment to test these hypotheses would by many authors to be members of one of the possible sistergroups of Order Primates (Pettigrew et al. 1989; Rosa andbe to combine, in the same animals, electrophysiological
recordings across the rostral border of V2 and examination Schmid 1994; see also Fig. 1 of Preuss and Kaas 1996). Asimilar visuotopic pattern, with ventral V2 representing theof transitions in the laminar patterns of connections after
tracer injections in other visual areas. If the hypothesis de- entire upper quadrant plus parts of the lower quadrant, mayalso exist in other nonprimates, such as tree shrews andpicted in Fig. 10 is correct, one would expect that the sector
of lower field representation that we propose to be part of squirrels (for discussion, see Rosa et al. 1994). Thus thepattern whereby the upper and lower quadrants are almostventral V2 will show the same laminar patterns of labeled
cells and terminals as other parts of V2, and that the connec- perfectly segregated into ventral and dorsal V2, respectively,may be unique to simian primates (Allman and Kaas 1974;tional boundary between V2 and DM will correspond to the
representation of a point below the HM. Cowey 1964; Gattass et al. 1981; Rosa et al. 1988b). The
J761-6/ 9k13$$ju39 06-05-97 13:33:43 neupal LP-Neurophys

M.G.P. ROSA, V. A. CASAGRANDE, T. PREUSS, AND J. H. KAAS3214
data in galagos also suggest a partial overlap between the lensis (Allman et al. 1979) has proposed the existence of adorsal visual area (area D) in the approximate location ofsectors of the visual field represented in dorsal and ventral
V2, as demonstrated for capuchin and marmoset monkeys DM. In agreement with this report, we found that the dor-somedial cortex includes representations of both the upper(Rosa and Schmid 1995b; Rosa et al. 1988b).
Our results suggest that V2 in galagos is formed by a and lower contralateral quadrants (Fig. 12), and that therostral border of this area is formed by a representation ofcontinuous belt of variable width, as in other primates. These
electrophysiological data are consistent with previous archi- the VM. However, in contrast with these previous results,our data suggest that much of the lower quadrant representa-tectonic studies in this and other prosimians (Krubitzer and
Kaas 1990; Preuss and Goldman-Rakic 1991a; Preuss et al. tion is located caudal to the upper quadrant representation,rather than being entirely lateral to it. Another difference is1993), but do not support the view of Sereno and Allman
(1991), who proposed that V2 in Galago is formed by two that the cortex along the banks of the interhemispheric fissurewas included in the dorsal area of G. senegalensis, whereasislands of cortex separated by another area that represents
both the upper and lower visual quadrants. Although the our data indicate that this region forms a representation ofthe upper quadrant that is distinct from that of DM. At leastbrief nature of the latter report makes a comparison of data
difficult, we can propose at least two reasons why the impres- in part, these discrepancies could be related to the differentspecies used (note, for example, that G. senegalensis is 3–sion of a physically segregated V2 may arise. First, V2 in
Galago is very narrow at the representation of the area cen- 4 times smaller, in terms of body mass, than G. garnetti) .On the basis of the fact that their recordings suggested antralis ( just 1 mm wide, or slightly less) , and it is difficult
to obtain a number of recording sites from this region unless area where the lower quadrant representation was lateralto the upper quadrant representation, Allman et al. (1979)long penetrations tangential to the lateral cortex are used (as
in Fig. 13). This introduces an element of uncertainty in the suggested that area D might be homologous to the medialvisual area (area M) of owl monkeys. Given that subsequentinterpretation of the data. Second, because of the fact that
the field discontinuity in Galago V2 may be tilted relative research has demonstrated that there are significant interspe-cies differences in the visuotopic organization of DM (Rosato the HM, recordings from neurons in ventrolateral cortex,
just over 1 mm from the V1 border, show evidence of re- and Schmid 1995b; see Rosa 1997 for a review), the now-extensive anatomic evidence for a homologous DM in manyceptive fields with centers below the HM. It would be natural
to interpret these recordings as evidence of an additional primate species (see above), and the fact that we foundanother visually responsive area medial to the presumptivevisual area in ventrolateral cortex, except for the fact, as
argued above, that this strip of cortex only represents a small DM, it seems more likely that both DM and area M arepresent in galagos. If so, the argument is strengthened thatpart of the lower quadrant adjacent to the HM.
Analysis of CMF in Galago V2 revealed an anisotropy DM is a visual area that emerged early in primate evolutionand has been retained in most primates, including humans.similar to that described in simian primates (Roe and T’so
1995; Rosa et al. 1988b). An elongation of the visuotopic We also found that recording sites rostral to V2 in lateralcortex yield neurons with receptive fields centered in themap parallel to the V1/V2 border has also been demon-
strated in other species lacking cytochrome oxidase stripes, lower quadrant, and that neurons at recording sites rostralto V2 in ventral cortex yield receptive fields centered in thesuch as the cat and flying fox, and therefore this seems to
be a general feature of mammalian V2 (see Rosa et al. upper quadrant (Figs. 13 and 16). Although it is clear thatmore data are needed, these results are compatible with the1994 for review). It is possible that the anisotropy in V2 of
nonsimian species is due to the presence of regular stripelike previous suggestion, made on the basis of anatomic connec-tions, that there is a homologue of the dorsolateral area infunctional modules that are not revealed by the cytochrome
oxidase stain. For example, in the cat, transneuronal trans- lorisiform prosimians (Krubitzer and Kaas 1990; Preuss etal. 1993).port of anterograde tracers injected in the eye reveals a pat-
tern of appropriately oriented stripes in V2 (Anderson et al.1988). Area prostriata
The term ‘‘prostriata’’ was originally used by SanidesHomologue of DM?(1972) to describe a part of the cortex bordering V1 that isless granular and less myelinated than area 18. The markedDM is a subdivision of extrastriate cortex first described
in owl monkeys (Allman and Kaas 1975). Microelectrode difference in appearance of the two fields (Allman and Kaas1971; Gattass et al. 1987) helped dispel the idea that V2recordings allowed a systematic map of the contralateral
hemifield to be related to a strip of relatively heavy myelina- completely surrounds V1. Area prostriata of primates haslong been thought to have visual functions (e.g., MacLeantion located rostral to dorsomedial V2. More recently, the
visual topography of DM has been demonstrated in a diurnal 1966; Sanides 1972), but compelling evidence has beendifficult to obtain. Recent anatomic tracing experiments haveNew World monkey, the marmoset (Rosa and Schmid
1995b), and anatomic criteria such as cortical architecture demonstrated that prostriata projects to visual areas, includ-ing V1 and the medial superior temporal area (Rosa et al.and the pattern of connections with V1 and the middle tem-
poral area (Krubitzer and Kaas 1990, 1993; Vogt-Weisen- 1993b; Sousa et al. 1991). Present results add to this storyin that neurons in only a few sites in area prostriata respondhorn et al. 1995; Wagor et al. 1975; Weller et al. 1991) have
been used to support the hypothesis that DM is present in to visual stimuli. Yet, visual responses were obtained, andthe receptive fields did not correspond to the visuotopy ofOld World monkeys and prosimians as well (Stepniewska
and Kaas 1996). V2. In particular, neurons had receptive fields that includedcentral vision, a feature incompatible with the visuotopy ofA previous study of the cortex rostral to V2 in G. senega-
J761-6/ 9k13$$ju39 06-05-97 13:33:43 neupal LP-Neurophys

PROSIMIAN VISUAL CORTEX 3215
staining in the visual cortex of nocturnal primates (Galago crassicaudatusthe ends of the V2 belt. In nonprimate mammals, cortexand Galago senegalensis) . J. Comp. Neurol. 293: 632–645, 1990.medial to V1, which is topologically equivalent to prostriata,
COOPER, M. L. AND PETTIGREW, J. D. The decussation of the retinothalamicreceives inputs from V1 and is visually responsive (Choud- pathway in the cat, with a note on the major meridians of the cat’s eye.hury 1978; Drager 1974; Kaas et al. 1989; Kalia and Whitte- J. Comp. Neurol. 187: 285–312, 1979.
COWEY, A. Projection of the retina on to striate and prestriate cortex in theridge 1973; Law et al. 1988; Malach 1989; McConnell andsquirrel monkey, Saimiri sciureus. J. Neurophysiol. 27: 366–393, 1964.LeVay 1986; Montero 1993; Olavarria and Montero 1984,
CUSICK, C. G., GOULD, H.J.I., AND KAAS, J. H. Interhemispheric connec-1990; Rosa et al. 1995; Sanderson et al. 1991; Sesma et al.tions of visual cortex of owl monkeys (Aotus trivirgatus) , marmosets
1984; Tiao and Blakemore 1976; Wagor et al. 1980). As (Callithrix jacchus) , and galagos (Galago crassicaudatus) . J. Comp.noted above, this splenial visual region, which possibly con- Neurol. 230: 311–336, 1984.
DANIEL, P. M. AND WHITTERIDGE, D. The representation of the visual fieldtains the homologue of prostriata, is more expansive in non-on the cerebral cortex in monkeys. J. Physiol. Lond. 159: 203–221,primates than in primates. However, prostriata is relatively1961.larger in galagos than in simian primates, possibly reflecting
DEBRUYN, E. J., CASGRANDE, A., BECK, P. D., AND BONDS, A. B. Visuala more primitive condition. Area prostriata seems to be part resolution and sensitivity of single cells in the primary visual cortex (V1)of the medial limbic system, and as such would be expected of a nocturnal primate (bush baby): correlations with cortical layers and
cytochrome oxidase patterns. J. Neurophysiol. 69: 3–18, 1993.to have quite different functions from the visual areas ofDEBRUYN, E. J., WISE, V. L., AND CASAGRANDE, V. A. The size and topo-the occipital, parietal, and lateral temporal lobes related to
graphic arrangement of retinal ganglion cells in the galago. Vision Res.perception (MacLean 1966).20: 315–327, 1980.
DIAMOND, I. T., CONLEY, M., ITOH, K., AND FITZPATRICK, D. Laminar orga-nization of geniculocortical projections in Galago senegalensis and AotusThe authors thank Dr. A. B. Bonds for making laboratory facilities avail-trivirgatus. J. Comp. Neurol. 242: 584–610, 1985.able to us, Dr. David Pow for allowing access to a microscope and video
DOW, B. M., VAUTIN, R. G., AND BAUER, R. The mapping of visual spacecapture system, R. Tweedale for comments on many versions of this manu-onto foveal striate cortex in the macaque monkey. J. Neurosci. 5: 890–script, and Prof. J. D. Pettigrew for making this collaborative project possi-902, 1985.ble.
DRAGER, U. C. Receptive fields of single cells and topography in mouseThis work was supported by Australian National Health and Medicalvisual cortex. J. Comp. Neurol. 160: 269–290, 1974.Research Council Grants 910423 and 961144 and National Eye Institute
FIORANI, M., GATTASS, R., ROSA, M.G.P., AND SOUSA, A.P.B. Visual areaGrants EY-01778 and EY-02686.MT in the Cebus monkey: location, visuotopic organization, and variabil-Address for reprint requests: M. Rosa, Vision, Touch and Hearing Re-ity. J. Comp. Neurol. 287: 98–118, 1989.search Centre, Department of Physiology and Pharmacology, The University
FLORENCE, S. L. AND CASAGRANDE, V. A. Organization of individual affer-of Queensland, QLD 4072, Australia.ent axons in layer IV of striate cortex in a primate. J. Neurosci. 7: 3850–
Received 23 September 1996; accepted in final form 25 February 1997. 3868, 1987.FLORENCE, S. L. AND KAAS, J. H. Ocular dominance columns in area 17 of
Old World macaque and talapoin monkeys: complete reconstructions andREFERENCES quantitative analyses. Visual Neurosci. 8: 449–462, 1992.
FLORENCE, S. L., SESMA, M. A., AND CASAGRANDE, V. A. Morphology ofALLMAN, J., CAMPBELL, C.B.G., AND MCGUINNESS, E. The dorsal third tier geniculo-striate afferents in a prosimian primate. Brain Res. 270: 127–
area in Galago senegalensis. Brain Res. 179: 355–361, 1979. 130, 1983.ALLMAN, J. M. AND KAAS, J. H. Representation of the visual field in striate FRITSCHES, K. A. AND ROSA, M.G.P. Visuotopic organisation of striate cor-
and adjoining cortex of the owl monkey (Aotus trivirgatus) . Brain Res. tex in the marmoset monkey (Callithrix jacchus) . J. Comp. Neurol. 372:35: 89–106, 1971. 264–282, 1996.
ALLMAN, J. M. AND KAAS, J. H. The organization of the second visual area GALLYAS, F. Silver staining of myelin by means of physical development.(V II) in the owl monkey: a second order transformation of the visual Neurol. Res. 1: 203–209, 1979.hemifield. Brain Res. 76: 247–265, 1974. GATTASS, R., FARIAS, M. F., PINON, M. C., AND UNGERLEIDER, L. G. Distri-
ALLMAN, J. M. AND KAAS, J. H. The dorsomedial cortical visual area: a bution of cytochrome-oxidase-rich patches in the primary visual cortexthird tier area in the occipital lobe of the owl monkey (Aotus trivirgatus) . of macaque monkeys. Soc. Neurosci. Abstr. 21: 395, 1995.Brain Res. 100: 473–487, 1975. GATTASS, R., GROSS, C. G., AND SANDELL, J. H. Visual topography of V2
ALLMAN, J. M., KAAS, J. H., AND LANE, R. H. The middle temporal area in the macaque. J. Comp. Neurol. 201: 519–539, 1981.(MT) in the bushbaby, Galago senegalensis. Brain Res. 57: 197–202, GATTASS, R., SOUSA, A.P.B., AND GROSS, C. G. Visuotopic organization1973. and extent of V3 and V4 of the macaque. J. Neurosci. 8: 1831–1845,
ANDERSON, P. A., OLAVARRIA, J., AND VAN SLUYTERS, R. C. The overall 1988.pattern of ocular dominance bands in cat visual cortex. J. Neurosci. 8: GATTASS, R., SOUSA, A.P.B., AND ROSA, M.G.P. Visual topography of V12183–2200, 1988.
in the Cebus monkey. J. Comp. Neurol. 259: 529–548, 1987.AZZOPARDI, P. AND COWEY, A. Preferential representation of the fovea inGLENDENNING, K. K., KOFRON, E. A., AND DIAMOND, I. T. Laminar organi-the primary visual cortex. Nature Lond. 361: 719–721, 1993.
zation of projections of the lateral geniculate nucleus to the striate cortexBEARD, K. C., QI, T., DAWSON, M. R., WANG, B., AND LI, C. A diversein Galago. Brain Res. 105: 538–546, 1976.new primate fauna from the middle Eocene fissure-fillings in southeastern
GODINOT, M. AND MAHBOUBI, M. Earliest known simian primate found inChina. Nature Lond. 368: 586–587, 1994.Algeria. Nature Lond. 357: 324–326, 1992.BECK, P. D. AND KAAS, J. H. Interhemispheric connections of neonatal owl
HOFFSTETTER, R. Les primates Simiiformes (Anthropoidea) . Comprehen-monkeys (Aotus trivirgatus) and galagos (Galago crassicaudatus) .sion, phylogenie, histoire biogeographique. Ann. Paleontol. 68: 241–290,Brain Res. 651: 57–75, 1994.1982.BONDS, A. B., CASAGRANDE, V. A., NORTON, T. T., AND DEBRUYN, E. J.
HORTON, J. C. AND HOCKING, D. R. Anatomical demonstration of ocularVisual resolution and sensitivity in a nocturnal primate (galago) mea-dominance columns in striate cortex of the squirrel monkey. J. Neurosci.sured with visual evoked potentials. Vision Res. 27: 845–857, 1987.16: 5510–5522, 1996.CASAGRANDE, V. A. AND NORTON, T. T. Lateral geniculate nucleus: a re-
HUBEL, D. H. AND WIESEL, T. N. Uniformity of monkey striate cortex: aview of its physiology and function. In: Vision and Visual Dysfunction:parallel relationship between field size, scatter, and magnification factor.The Neural Basis of Visual Function, edited by A. Leventhal. London:J. Comp. Neurol. 158: 295–306, 1974.Macmillan, 1991, vol. 4, p. 41–84.
HUGHES, A. Topographical relationships between the anatomy and physiol-CAVE, A.J.E. The primate nasal fossa. Biol. J. Linn. Soc. 5: 377–387, 1973.ogy of the rabbit visual system. Doc. Ophthalmol. 30: 33–159, 1971.CHOUDHURY, B. P. Retinotopic organization of the guinea pig’s visual cor-
IRVIN, G. E., CASAGRANDE, V. A., AND NORTON, T. T. Center/surroundtex. Brain Res. 144: 19–29, 1978.CONDO, G. J. AND CASAGRANDE, V. A. Organization of cytochrome oxidase relationships of magnocellular, parvocellular, and koniocellular relay
J761-6/ 9k13$$ju39 06-05-97 13:33:43 neupal LP-Neurophys

M.G.P. ROSA, V. A. CASAGRANDE, T. PREUSS, AND J. H. KAAS3216
cells in primate lateral geniculate nucleus. Visual Neurosci. 10: 363– cortex and extrastriate visual areas in the rat. Exp. Brain Res. 94: 1–15,1993.373, 1993.
JERISON, H. J. Brain, body and encephalization in early primates. J. Hum. MYERSON, J., MANIS, P. B., MIEZIN, F. M., AND ALLMAN, J. M. Magnifica-tion in striate cortex and retinal ganglion cell layer of owl monkey: aEvol. 8: 615–635, 1979.quantitative comparison. Science Wash. DC 198: 855–857, 1977.JOHNSON, J. K. AND CASAGRANDE, V. A. Distribution of calcium-binding
proteins within the parallel visual pathways of a primate (Galago crassi- NORTON, T. T. AND CASAGRANDE, V. A. Laminar organization of receptive-field properties in lateral geniculate nucleus of bush baby (Galago crassi-caudatus) . J. Comp. Neurol. 356: 238–260, 1995.caudatus) . J. Neurophysiol. 47: 715–741, 1982.KAAS, J., HALL, W. C., AND DIAMOND, I. T. Cortical visual areas I and
II in the hedgehog: the relation between evoked potential maps and NORTON, T. T., CASAGRANDE, V. A., IRVIN, G. E., SESMA, M. A., AND PE-
TRY, H. M. Contrast-sensitivity functions of W-, X-, and Y-like relayarchitectonic subdivisions. J. Neurophysiol. 33: 595–615, 1970.cells in the lateral geniculate nucleus of the bush baby, Galago crassicau-KAAS, J. H., HALL, W. C., AND DIAMOND, I. T. Visual cortex of the grey
squirrel (Sciurus carolinensis) : architectonic subdivisions and connec- datus. J. Neurophysiol. 59: 1639–1656, 1988.tions from the visual thalamus. J. Comp. Neurol. 145: 273–305, 1972a. OLAVARRIA, J. AND MONTERO, V. M. Relation of callosal and striate-extra-
KAAS, J. H., HALL, W. C., KILLACKEY, H., AND DIAMOND, I. T. Visual striate cortical connections in the rat: morphological definition of extra-cortex of the tree shrew (Tupaia glis) : architectonic subdivisions and striate visual areas. Exp. Brain Res. 54: 240–252, 1984.representation of the visual field. Brain Res. 42: 491–496, 1972b. OLAVARRIA, J. AND MONTERO, V. M. Elaborate organization of visual cortex
KAAS, J. H., KRUBITZER, L. A., AND JOHANSON, K. L. Cortical connections in the hamster. Neurosci. Res. 8: 40–47, 1990.of areas 17 (V-I) and 18 (V-II) of squirrels. J. Comp. Neurol. 281: 426– PAYNE, B. R. Representation of the ipsilateral visual field in the transition446, 1989. zone between areas 17 and 18 of the cat’s cerebral cortex. Visual Neu-
KALIA, M. AND WHITTERIDGE, D. The visual areas in the splenial sulcus of rosci. 4: 445–474, 1990.the cat. J. Physiol. Lond. 232: 275–283, 1973. PEICHL, L. Topography of ganglion cells in the dog and wolf retina. J.
KENNEDY, H., DEHAY, C., AND BULLIER, J. Organization of the callosal Comp. Neurol. 324: 603–620, 1992.connections of visual areas V1 and V2 in the macaque monkey. J. Comp. PERRY, V. H. AND COWEY, A. The ganglion cell and cone distributions inNeurol. 247: 398–415, 1986. the monkey’s retina: implications for central magnification factor. Vision
KRUBITZER, L. A. AND KAAS, J. H. Cortical connections of MT in four Res. 25: 1795–1810, 1985.species of primates: areal, modular, and retinotopic patterns. Visual Neu- PERRY, V. H. AND COWEY, A. The lengths of the fibres of Henle in therosci. 5: 165–204, 1990. retina of macaque monkeys: implications for vision. Neuroscience 25:
KRUBITZER, L. A. AND KAAS, J. H. The dorsomedial visual area of owl 225–236, 1988.monkeys: connections, myeloarchitecture, and homologies in other pri- PETTIGREW, J. D., COOPER, M. L., AND BLASDEL, G. G. Improved use ofmates. J. Comp. Neurol. 334: 497–528, 1993. tapetal reflection for eye-position monitoring. Invest. Ophthalmol. Visual
LACHICA, E. A., BECK, P. D., AND CASAGRANDE, V. A. Intrinsic connections Sci. 18: 490–495, 1979.of layer III of striate cortex in squirrel monkey and bush baby: correlation PETTIGREW, J. D., JAMIESON, B.G.M., ROBSON, S. K., HALL, L. S.,with patterns of cytochrome oxidase. J. Comp. Neurol. 329: 163–187, MCANALLY, K. I., AND COOPER, H. M. Phylogenetic relations between1993. microbats, megabats and primates (Mammalia: Chiroptera and Primates) .
LACHICA, E. A. AND CASAGRANDE, V. A. Direct W-like geniculate projec- Philos. Trans. R. Soc. Lond. B Biol. Sci. 325: 489–559, 1989.tions to the cytochrome oxidase (CO) blobs in primate visual cortex. J. PICANCO-DINIZ, C. W., SILVEIRA, L.C.L., DE CARVALHO, M.S.P., AND OS-
Comp. Neurol. 319: 141–158, 1992. WALDO-CRUZ, E. Contralateral visual field representation in area 17 ofLANGSTON, A., CASAGRANDE, V. A., AND FOX, R. Spatial resolution of the the cerebral cortex of the agouti: a comparison between the cortical
Galago. Vision Res. 26: 791–796, 1986. magnification factor and the retinal ganglion cell distribution. Neurosci-LAW, M. I., ZAHS, K. R., AND STRYKER, M. P. Organization of primary ence 44: 325–333, 1991.
visual cortex (area 17) in the ferret. J. Comp. Neurol. 278: 157–180, POLYAK, S. The Vertebrate Visual System. Chicago, IL: Univ. of Chicago1988. Press, 1957.
LE GROS CLARK, W. E. The Antecedents of Man. Edinburgh: Edinburgh PREUSS, T. M., BECK, P. D., AND KAAS, J. H. Areal, modular, and connec-Univ. Press, 1959. tional organization of visual cortex in a prosimian primate, the slow loris
LEVAY, S., CONNOLY, M., HOUDE, J., AND VAN ESSEN, D. C. The complete (Nycticebus coucang) . Brain Behav. Evol. 42: 321–335, 1993.pattern of ocular dominance stripes in the striate cortex and visual field PREUSS, T. M. AND GOLDMAN-RAKIC, P. S. Architectonics of the parietalof the macaque monkey. J. Neurosci. 5: 486–501, 1985. and temporal association cortex in the strepsirhine primate Galago com-
LIVINGSTONE, M. S. AND HUBEL, D. H. Anatomy and physiology of a color pared to the anthropoid Macaca. J. Comp. Neurol. 310: 475–506, 1991a.system in the primate visual cortex. J. Neurosci. 4: 309–356, 1984. PREUSS, T. M. AND GOLDMAN-RAKIC, P. S. Ipsilateral cortical connections
LO WEL, S. The pattern of ocular dominance columns in flat-mounts of the of granular frontal cortex in the strepsirhine primate Galago, with com-cat visual cortex. Exp. Brain Res. 68: 661–666, 1987. parative comments on anthropoid primates. J. Comp. Neurol. 310: 507–
549, 1991b.LO WEL, S., BISCHOF, H. J., LEUTENECKER, B., AND SINGER, W. Topographicrelations between ocular dominance and orientation columns in the cat PREUSS, T. M. AND KAAS, J. H. Cytochrome oxidase ‘‘blobs’’ and otherstriate cortex. Exp. Brain Res. 71: 33–46, 1988. characteristics of primary visual cortex in a lemuroid primate, Cheiroga-
leus medius. Brain Behav. Evol. 47: 103–112, 1996.MACLEAN, P. D. The limbic and visual cortex in phylogeny: further insightsfrom anatomic and microelectrode studies. In: Evolution of the Forebrain, ROE, A. AND TS’O, D. Y. Visual topography in primate V2: multiple repre-edited by R. Hassler and H. Stephan. Stuttgart, Germany: Thieme, 1966, sentation across functional stripes. J. Neurosci. 15: 3689–3715, 1995.p. 443–453. ROSA, M.G.P. Visuotopic organization of primate extrastriate cortex. In:
MALACH, R. Patterns of connections in rat visual cortex. J. Neurosci. 9: Cerebral Cortex: Extrastriate Cortex in Primates, edited by J. H. Kaas,3741–3752, 1989. K. Rockland, and A. Peters. New York: Plenum, in press, vol. 12.
MALPELI, J. G., LEE, D., AND BAKER, F. H. Laminar and retinotopic organi- ROSA, M.G.P., GATTASS, R., AND FIORANI, M. Complete pattern of ocularzation of the macaque lateral geniculate nucleus: magnocellular and par- dominance stripes in V1 of a New World monkey, Cebus apella. Exp.vocellular magnification functions. J. Comp. Neurol. 375: 363–377, Brain Res. 72: 645–648, 1988a.1996. ROSA, M.G.P., GATTASS, R., FIORANI, M., AND SOARES, J.G.M. Laminar,
MARTIN, R. D. Primate Origins and Evolution. London: Chapman & Hall, columnar and topographic aspects of ocular dominance in the primary1990. visual cortex of Cebus monkeys. Exp. Brain Res. 88: 249–264, 1992.
MCCONNELL, S. K. AND LEVAY, S. Anatomical organization of the visual ROSA, M.G.P., GATTASS, R., AND SOARES, J. G. M. A quantitative analysissystem of the mink, Mustela vison. J. Comp. Neurol. 250: 109–132, of cytochrome oxidase-rich patches in the primary visual cortex of Cebus1986. monkeys: topographic distribution and effects of late monocular enucle-
ation. Exp. Brain Res. 84: 195–209, 1991.MCCROSSIN, M. L. New species of bushbaby from the middle Miocene ofMaboko Island, Kenya. Am. J. Phys. Anthropol. 89: 215–233, 1992. ROSA, M.G.P., PETTIGREW, J. D., AND COOPER, H. M. Unusual pattern of
retinogeniculate projections in the controversial primate Tarsius. BrainMCILWAIN, J. T. Large receptive fields and spatial transformations in thevisual system. Int. Rev. Physiol. 10: 223–248, 1976. Behav. Evol. 48: 121–129, 1996.
ROSA, M.G.P. AND SCHMID, L. M. Topography and extent of visual-fieldMONTERO, V. M. Retinotopy of cortical connections between the striate
J761-6/ 9k13$$ju39 06-05-97 13:33:43 neupal LP-Neurophys

PROSIMIAN VISUAL CORTEX 3217
representation in the superior colliculus of the megachiropteran Pteropus. of brain structures in insectivores and primates. Folia primatol. 35: 1–29, 1981.Visual Neurosci. 11: 1037–1057, 1994.
STEPNIEWSKA, I. AND KAAS, J. H. Topographic patterns of V2 cortical con-ROSA, M.G.P. AND SCHMID, L. M. Magnification factors, receptive fieldnections in macaque monkeys. J. Comp. Neurol. 371: 129–152, 1996.images and point-image size in the superior colliculus of flying foxes:
SYMONDS, L. L. AND KAAS, J. H. Connections of striate cortex in the prosim-comparison with the primary visual cortex. Exp. Brain Res. 102: 551–ian, Galago senegalensis. J. Comp. Neurol. 181: 477–512, 1978.556, 1995a.
TIAO, Y. C. AND BLAKEMORE, C. Functional organization in the visualROSA, M.G.P. AND SCHMID, L. M. Visual areas in the dorsal and medialcortex of the golden hamster. J. Comp. Neurol. 168: 459–481, 1976.extrastriate cortices of the marmoset. J. Comp. Neurol. 359: 272–299,
TIGGES, M. AND TIGGES, J. The retinofugal fibers and their terminal nuclei1995b.in Galago crassicaudatus (Primates) . J. Comp. Neurol. 138: 87–101,ROSA, M.G.P., SCHMID, L. M., AND CALFORD, M. B. Responsiveness of cat1970.area 17 after monocular inactivation: limitation of topographic plasticity
TIGGES, J., TIGGES, M., AND KALAHA, C. S. Efferent connections of areain adult cortex. J. Physiol. Lond. 482: 589–608, 1995.17 in Galago. Am. J. Phys. Anthropol. 38: 393–397, 1973.ROSA, M.G.P., SCHMID, L. M., KRUBITZER, L. A., AND PETTIGREW, J. D.
TOOTELL, R.B.H., HAMILTON, S. L., AND SILVERMAN, M. S. Topography ofRetinotopic organization of the primary visual cortex of flying foxescytochrome oxidase activity in the owl monkey cortex. J. Neurosci. 5:(Pteropus poliocephalus and Pteropus scapulatus) . J. Comp. Neurol.2786–2800, 1985.335: 55–72, 1993a.
TOOTELL, R.B.H., SILVERMAN, M. S., DE VALOIS, R. L., AND JACOBS, G. H.ROSA, M.G.P., SCHMID, L. M., AND PETTIGREW, J. D. Organization of theFunctional organization of the second cortical visual area of primates.second visual area in the megachiropteran bat Pteropus. Cereb. CortexScience Wash. DC 220: 737–739, 1983.4: 52–68, 1994.
TOOTELL, R.B.H., SILVERMAN, M. S., SWITKES, E., AND DEVALOIS, R. L.ROSA, M.G.P., SOARES, J.G.M., FIORANI, M., AND GATTASS, R. Cortical Deoxyglucose analysis of retinotopic organization in primate striate cor-afferents of visual area MT in the Cebus monkey: possible homologies tex. Science Wash. DC 218: 902–904, 1982.between New and Old World monkeys. Visual Neurosci. 10: 827–855, TOOTELL, R.B.H., SWITKES, E., SILVERMAN, M. S., AND HAMILTON, S. L.1993b. Functional anatomy of macaque striate cortex. II. Retinotopic organiza-
ROSA, M.G.P., SOUSA, A.P.B., AND GATTASS, R. Representation of the tion. J. Neurosci. 8: 1531–1568, 1988.visual field in the second visual area in the Cebus monkey. J. Comp. TUSA, R. J., PALMER, L. A., AND ROSENQUIST, A. C. The retinotopic organi-Neurol. 275: 326–345, 1988b. zation of area 17 (striate cortex) in the cat. J. Comp. Neurol. 177: 213–
SANDERSON, K. J., DREHER, B., AND GAYER, N. Prosencephalic connections 236, 1978.of striate and extrastriate areas of rat visual cortex. Exp. Brain Res. 85: VAN ESSEN, D. C. AND MAUNSELL, J.H.R. Two-dimensional maps of the324–334, 1991. cerebral cortex. J. Comp. Neurol. 191: 255–281, 1980.
SANIDES, F. Representation in the cerebral cortex and its areal lamination VAN ESSEN, D. C., NEWSOME, W. T., AND MAUNSELL, J.H.R. The visual fieldpatterns. In: Structure and Function of the Nervous System, edited by representation in striate cortex of the macaque monkey: asymmetries, anisot-G. H. Boune. New York: Academic, 1972, p. 329–453. ropies and individual variability. Vision Res. 24: 429–448, 1984.
SCHEIN, S. J. AND DE MONASTERIO, F. M. Mapping of retinal and geniculate VOGT-WEISENHORN, D. M., ILLING, R.-B., AND SPATZ, W. B. Morphologyneurons onto striate cortex of the macaque. J. Neurosci. 7: 996–1009, and connections of neurons in area 17 projecting to the extrastriate areas1987. MT and 19DM and to the superior colliculus in the monkey Callithrix
SCHWARTZ, E. L. Spatial mapping in the primate sensory projection: analytic jacchus. J. Comp. Neurol. 362: 233–255, 1995.structure and relevance to perception. Biol. Cybern. 25: 181–194, 1977. WAGOR, E., LIN, C. S., AND KAAS, J. H. Some cortical projections of the
SERENO, M. I. AND ALLMAN, J. M. Cortical visual areas in mammals. In: dorsomedial visual area (DM) of association cortex in owl monkey,Aotus trivirgatus. J. Comp. Neurol. 163: 227–250, 1975.Vision and Visual Dysfunction: The Neural Basis of Visual Function,
WAGOR, E., MANGINI, N. J., AND PEARLMAN, A. L. Retinotopic organizationedited by A. G. Leventhal. London: Macmillan, 1991, vol. 4, p. 160–of striate and extrastriate visual cortex in the mouse. J. Comp. Neurol.172.193: 187–202, 1980.SESMA, M. A., CASAGRANDE, V. A., AND KAAS, J. H. Cortical connections
WALL, J. T., SYMONDS, L. L., AND KAAS, J. H. Cortical and subcorticalof area 17 in tree shrews. J. Comp. Neurol. 230: 337–351, 1984.projections of the middle temporal area (MT) and adjacent cortex inSETOGUCHI, T. AND ROSENBERGER, A. L. A fossil owl monkey from Lagalagos. J. Comp. Neurol. 211: 193–214, 1982.Venta, Colombia. Nature Lond. 326: 692–694, 1987.
WASSLE, H., GRUNERT, U., RO HRENBECK, J., AND BOYCOTT, B. B. CorticalSILVEIRA, L.C.L., PERRY, V. H., AND YAMADA, E. S. The retinal ganglionmagnification factor and the ganglion cell density of the primate retina.cell distribution and the representation of the visual field in area 17 ofNature Lond. 341: 643–645, 1989.the owl monkey, Aotus trivirgatus. Visual Neurosci. 10: 887–897, 1993.
WELLER, R. E. AND KAAS, J. H. The organization of the visual system inSILVEIRA, L.C.L., PICANCO-DINIZ, C. W., SAMPAIO, L.F.S., AND OSWALDO-Galago : comparisons with monkeys. In: The Lesser Bushbaby (Galago)CRUZ, E. Retinal ganglion cell distribution in the Cebus monkey: a com-as an Animal Model: Selected Topics, edited by D. E. Haines. Bocaparison with the cortical magnification factors. Vision Res. 29: 1471–Raton, FL: CRC, 1982, p. 107–134.1483, 1989. WELLER, R. E., STEELE, G. E., AND CUSICK, C. G. Cortical connections of
SIMONS, E. L. Skulls and anterior teeth of Catopithecus (Primates: Anthro- dorsal cortex rostral to V II in squirrel monkeys. J. Comp. Neurol. 306:poidea) from the Eocene and Anthropoid origins. Science Wash. DC 268: 521–537, 1991.1885–1888, 1995. WILDER, H. D., GRUNERT, U., LEE, B. B., AND MARTIN, P. R. Topography
SOUSA, A.P.B., GATTASS, R., AND OSWALDO-CRUZ, E. The projection of of ganglion cells and photoreceptors in the retina of the New Worldthe opossum’s visual field on the cerebral cortex. J. Comp. Neurol. 177: marmoset monkey Callithrix jacchus. Visual Neurosci. 13: 335–352,569–588, 1978. 1996.
SOUSA, A.P.B., PINON, M.C.G.P., GATTASS, R., AND ROSA, M.G.P. Topo- WILLIAMS, R. W., CAVADA, C., AND REINOSO-SUAREZ, F. Rapid evolutiongraphic organization of cortical input to striate cortex in the Cebus mon- of the visual system: a cellular assay of the retina and dorsal lateralkey: a fluorescent tracer study. J. Comp. Neurol. 308: 665–682, 1991. geniculate nucleus of the Spanish wildcat and the domestic cat. J. Neu-
STEPHAN, H. AND ANDY, O. J. Quantitative comparative neuroanatomy of rosci. 13: 208–228, 1993.primates: an attempt at a phylogenetic interpretation. Ann. NY Acad. Sci. WONG-RILEY, M. Changes in the visual system of monocularly sutured or167: 370–387, 1969. enucleated cats demonstrable with cytochrome oxidase histochemistry.
Brain Res. 171: 11–28, 1979.STEPHAN, H., FRAHM, H., AND BARON, G. New and revised data on volume
J761-6/ 9k13$$ju39 06-05-97 13:33:43 neupal LP-Neurophys