
Visual Anomaly Detection in Event Sequence Data
10
Visual Anomaly Detection in Event Sequence Data Shunan Guo, Zhuochen Jin, Qing Chen, David Gotz, Hongyuan Zha, Nan Cao Fig. 1. The anomaly detection result of the Agavue dataset using ET 3 system. Two anomalous pattern were identified: (1) tool-tips failing to show when users interact with toolbars; (2) users encountering an error after requesting data binding. Abstract— Anomaly detection is a common analytical task that aims to identify rare cases that differ from the typical cases that make up the majority of a dataset. Anomaly detection takes many forms, but is frequently applied to the analysis of event sequence data in addressing real-world problems such as error diagnosis, fraud detection, and vital sign monitoring. With general event sequence data, however, the task of anomaly detection can be complex because the sequential and temporal nature of such data results in diverse definitions and flexible forms of anomalies: a specific event type, a sub-sequence or the entire sequence. This, in turn, increases the difficulty in interpreting detected anomalies, a critical element in raising human confidence with the analysis results. Most prior work in event sequence anomaly detection focuses on detecting only one type of anomaly with a specific application domain. Such approaches do not provide flexible ways of identifying diverse types of anomalies, and provide only limited support for result interpretation. In this paper, we propose an unsupervised anomaly detection algorithm based on Variational AutoEncoders (VAE). The model learns latent representations for all sequences in the dataset and detects anomalies that deviate from the overall distribution. Moreover, the model can estimate an underlying normal progression for each given sequence represented as occurrence probabilities of events along the sequence progression. Events in violation of their occurrence probability (i.e., event occurrences with small occurrence probability, and absent events with large occurrence probability) are identified as abnormal. We also introduce a visualization system, EventThread3, to support interactive exploration of the analysis result. The system facilitates interpretations of anomalies within the context of normal sequence progressions in the dataset through comprehensive one-to-many sequence comparison. Finally, we quantitatively evaluate the performance of our anomaly detection algorithm and demonstrate the effectiveness of our system through case studies in three different application domains and report feedback collected from study participants and expert users. Index Terms—Illustrative Visualization, Time Series Data, Visual Knowledge Discovery, Visual Knowledge Representation 1 I NTRODUCTION Anomaly detection is a common task for event sequence data analy- sis as it often contributes to the discovery of critical and actionable information [12]. Effective use of event sequence data can require identifying sequences that deviate from the typically occurring behav- ior [37]. For example, a doctor may be interested in finding patients whose postoperative response is different from other patients who have had the same surgery, so that the doctors can provide personalized care plans for similar patients in the future. A variety of work has been developed for detecting anomalies in a wide range of areas, such as medical diagnosis [24], fraud detec- tion [42], and application log surveillance [40]. Especially for event sequence data, traditional statistical models [38, 46], supervised or • Shunan Guo and Hongyuan Zha are with East China Normal University. E-mail: [email protected], [email protected] • Zhuochen Jin is with iDVX lab at Tongji University.E-mail: [email protected] • Qing Chen is with Aviz at Inria. Email: [email protected] • David Gotz is with University of North Carolina at Chapel Hill. Email: [email protected] • Nan Cao is with iDVX lab at Tongji University and is the corresponding author. Email: [email protected] semi-supervised approaches [33], and unsupervised methods [35] have been applied. Nevertheless, there are three major challenges we face for anomaly detection in event sequence data. The first critical challenge is the development of an unsupervised anomaly detection method that can efficiently handle the complex temporal structure of event sequences. Regarding the performance of anomaly detection methods, traditional statistical models are sub- optimal for event sequence data because they fail to capture complex structures in the data and require fine tuning of parameters for differ- ent training sets [18]. To circumvent the issue of algorithm tuning, supervised and semi-supervised approaches have become increasingly popular and applied to diverse areas of anomaly detection [8,16]. How- ever, since anomalies are rare and real-world event sequence datasets are often huge in scale, it can be difficult, if not impossible, to obtain the required labels for these approaches. The second challenge is that anomalies themselves are hard to pre- cisely define. Since the nature of anomalies can differ fundamentally across domains, anomaly detection techniques are often tailored to specific application domains such as computer system diagnosis [26], medical treatment examination [3], and financial fraud detection [5]. Furthermore, even within a given domain, there is often no clear defini- tion or criteria to distinguish between normal and abnormal cases. Beyond these two challenges for general anomaly detection–the lack 1 arXiv:1906.10896v1 [cs.HC] 26 Jun 2019
Transcript of Visual Anomaly Detection in Event Sequence Data

Visual Anomaly Detection in Event Sequence Data
Shunan Guo, Zhuochen Jin, Qing Chen, David Gotz, Hongyuan Zha, Nan Cao
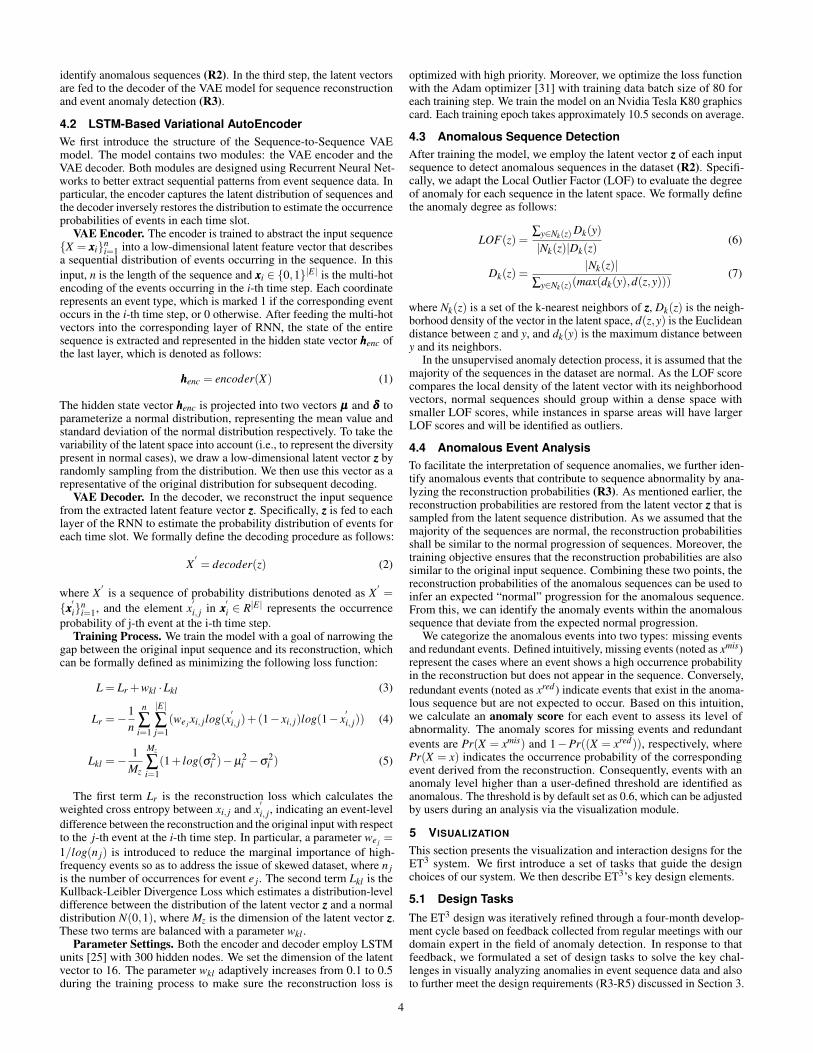
Fig. 1. The anomaly detection result of the Agavue dataset using ET3 system. Two anomalous pattern were identified: (1) tool-tipsfailing to show when users interact with toolbars; (2) users encountering an error after requesting data binding.
Abstract— Anomaly detection is a common analytical task that aims to identify rare cases that differ from the typical cases that makeup the majority of a dataset. Anomaly detection takes many forms, but is frequently applied to the analysis of event sequence data inaddressing real-world problems such as error diagnosis, fraud detection, and vital sign monitoring. With general event sequence data,however, the task of anomaly detection can be complex because the sequential and temporal nature of such data results in diversedefinitions and flexible forms of anomalies: a specific event type, a sub-sequence or the entire sequence. This, in turn, increases thedifficulty in interpreting detected anomalies, a critical element in raising human confidence with the analysis results. Most prior work inevent sequence anomaly detection focuses on detecting only one type of anomaly with a specific application domain. Such approachesdo not provide flexible ways of identifying diverse types of anomalies, and provide only limited support for result interpretation. In thispaper, we propose an unsupervised anomaly detection algorithm based on Variational AutoEncoders (VAE). The model learns latentrepresentations for all sequences in the dataset and detects anomalies that deviate from the overall distribution. Moreover, the modelcan estimate an underlying normal progression for each given sequence represented as occurrence probabilities of events along thesequence progression. Events in violation of their occurrence probability (i.e., event occurrences with small occurrence probability, andabsent events with large occurrence probability) are identified as abnormal. We also introduce a visualization system, EventThread3,to support interactive exploration of the analysis result. The system facilitates interpretations of anomalies within the context of normalsequence progressions in the dataset through comprehensive one-to-many sequence comparison. Finally, we quantitatively evaluatethe performance of our anomaly detection algorithm and demonstrate the effectiveness of our system through case studies in threedifferent application domains and report feedback collected from study participants and expert users.
Index Terms—Illustrative Visualization, Time Series Data, Visual Knowledge Discovery, Visual Knowledge Representation
1 INTRODUCTION
Anomaly detection is a common task for event sequence data analy-sis as it often contributes to the discovery of critical and actionableinformation [12]. Effective use of event sequence data can requireidentifying sequences that deviate from the typically occurring behav-ior [37]. For example, a doctor may be interested in finding patientswhose postoperative response is different from other patients who havehad the same surgery, so that the doctors can provide personalized careplans for similar patients in the future.
A variety of work has been developed for detecting anomalies ina wide range of areas, such as medical diagnosis [24], fraud detec-tion [42], and application log surveillance [40]. Especially for eventsequence data, traditional statistical models [38, 46], supervised or
• Shunan Guo and Hongyuan Zha are with East China Normal University.E-mail: [email protected], [email protected]
• Zhuochen Jin is with iDVX lab at Tongji University.E-mail:[email protected]
• Qing Chen is with Aviz at Inria. Email: [email protected]• David Gotz is with University of North Carolina at Chapel Hill. Email:
[email protected]• Nan Cao is with iDVX lab at Tongji University and is the corresponding
author. Email: [email protected]
semi-supervised approaches [33], and unsupervised methods [35] havebeen applied. Nevertheless, there are three major challenges we facefor anomaly detection in event sequence data.
The first critical challenge is the development of an unsupervisedanomaly detection method that can efficiently handle the complextemporal structure of event sequences. Regarding the performanceof anomaly detection methods, traditional statistical models are sub-optimal for event sequence data because they fail to capture complexstructures in the data and require fine tuning of parameters for differ-ent training sets [18]. To circumvent the issue of algorithm tuning,supervised and semi-supervised approaches have become increasinglypopular and applied to diverse areas of anomaly detection [8,16]. How-ever, since anomalies are rare and real-world event sequence datasetsare often huge in scale, it can be difficult, if not impossible, to obtainthe required labels for these approaches.
The second challenge is that anomalies themselves are hard to pre-cisely define. Since the nature of anomalies can differ fundamentallyacross domains, anomaly detection techniques are often tailored tospecific application domains such as computer system diagnosis [26],medical treatment examination [3], and financial fraud detection [5].Furthermore, even within a given domain, there is often no clear defini-tion or criteria to distinguish between normal and abnormal cases.
Beyond these two challenges for general anomaly detection–the lack
1
arX
iv:1
906.
1089
6v1
[cs
.HC
] 2
6 Ju
n 20
19
of labeled data, and the fuzzy boundary between abnormal and normalcases–the third key challenge lies in providing interpretable informationabout anomalies that supports understanding of the analyzed result. Dueto the temporal characteristics of event sequence data and the black-box nature of machine learning models, it is especially challenging tointerpret anomalous sequences once identified. For analysts to deriveactionable insights, they must be able to understand how anomaliesare different from “normal” sequences, which event or series of eventscharacterize the anomaly, and which events suggest actions that couldhelp avoid such cases in the future.
To tackle the three challenges, we propose an unsupervised anomalydetection model for event sequence data that builds upon LSTM-basedVariational AutoEncoders (VAE) [36]. A recent advance over tradi-tional autoencoder-based anomaly detection techniques, VAE use aprobabilistic encoder for modeling the distribution of the latent vari-ables [2]. Such probabilities give more principled criteria for identify-ing anomalies and do not require model-specific thresholds. As a result,VAE better facilitate objective judgments for deciding the boundaryof anomalous sequences compared to other unsupervised algorithms.Moreover, to account for the temporal dependencies of event sequencedata into a VAE, we replace feed-forward networks with LSTM neuralnetworks to incorporate the sequential nature of event sequence data.The model is trained to learn a latent representation for each eventsequence and identify anomalous sequences based on their deviationfrom the overall distribution. A mean sequence is computed from thereconstruction probabilities for each sequence detected as an anomaly,which shows the occurrence probabilities of events in normal circum-stances, representing a corresponding “normal” sequence progressionfor the anomaly. For example, a patient having internal bleeding shouldnormally be sent to emergency for surgery, thus the reconstructionprobabilities shall identify surgical events with high probabilities af-ter hospital admission. To facilitate anomaly interpretation, we alsocompare the anomaly sequence with a collection of sequences havingsimilar progression but identified as “normal” so as to uncover theircritical differences.
The system was iteratively developed and guided by feedback fromdomain experts. To incorporate experts’ domain knowledge within theanomaly detection and interpretation process, we present an interactivegraphical interface which allows one-to-many comparisons between aselected anomalous sequence and a set of normal sequences at multi-ple levels of granularity. The interface design includes a comparisonglyph to highlight suspicious events and incorporates rich interactionsto enable dynamic tweaking of the analysis result. Interactions also sup-port the interpretability of the anomalies through additional contextualinformation. The main contributions are as follows:
• Anomaly Detection Algorithm. We introduce a VAE-basedanomaly detection algorithm for detecting anomalous sequenceswithin a collection of temporal event sequences. The algorithm in-fers a normal progression of events for each anomalous sequenceand identifies anomalous events that deviate from the normalprogression in an interpretable manner.
• System for Interactive Anomaly Analysis. We present an inter-active visual analysis system for dynamic exploration and inter-pretation of the anomaly detection result. The system allows usersto investigate the anomalous sequence in the context of normal se-quences through one-to-many sequence comparisons at differentlevels of granularity. A comparison glyph is designed to highlightdifferences and facilitate visual comparison. Rich interactionsare provided to allow flexible exploration and incorporate humanknowledge during the analysis.
• Evaluation. We evaluate our proposed method both quantita-tively and qualitatively through (1) a performance evaluation ofour VAE-based anomaly detection algorithm by comparing withtwo baseline methods, (2) three case studies conducted with real-world datasets in different application domains. We also reportthe comments collected from study participants.
2 RELATED WORK
In this section, we provide an overview of the analytical and visualiza-tion techniques that are most related to our work, including (1) anomalydetection algorithms, (2) visualization for anomaly detection, and (3)visual comparison techniques.
2.1 Anomaly Detection AlgorithmsAnomaly detection has been extensively studied over the past years [12].Methods for anomaly detection can be broadly categorized into tensor-based algorithms [13], statistics-based algorithms [41], classification-based algorithms [33], and neighbor-based or distance-based algo-rithms [6]. Although these methods are effective in identifying anoma-lies with numeric results, they are not capable of considering the se-quential structure when detecting anomalies for event sequences.
Meanwhile, as the data volume grows, it becomes increasingly dif-ficult to apply traditional anomaly detection algorithms. More recentwork with deep learning-based anomaly detection (DAD) algorithmshas been developed to meet this challenge. They have been applied toa variety of anomaly detection applications including fraud detection,cyber-intrusion detection, medical anomaly detection, sensor networks,video surveillance, internet-of-things, log analysis, and industrial dam-age detection [10]. Types of DAD models include unsupervised (e.g.,autoencoder, generative adversarial, variational), semi-supervised (e.g.,reinforcement learning), hybrid (e.g., feature extractor+traditional algo-rithms) [15], and one-class neural networks [11].
In this work, we leverage a variant of Variational AutoEncoders(VAE) which can both deal with large volumes of unlabeled data, andidentify anomalous patterns with probability measures [2]. Further-more, given the temporal information inherent to event sequence data,our approach replaces the feed-forward networks with LSTM neural net-works. This generates a output close to the original input and provideslatent feature vectors for each event sequence in the dataset. However,the boundary between normal and anomalous behavior is often notprecisely defined. This lack of a well-defined boundary poses chal-lenges for traditional and deep learning-based algorithms alike. For thisreason, incorporating human domain knowledge through interactioncan benefit the anomaly detection process.
2.2 Visual Anomaly DetectionTo facilitate anomaly detection and reasoning over the results, re-searchers have developed many visual anomaly detection tools [8, 43].As previously mentioned, two major challenges in anomaly detectionare (1) the fuzzy boundary between normality and abnormality, and (2)the absence of high quality labeled data. Visual anomaly detection toolsthat allow domain experts to leverage their knowledge and experiencecan help overcome these challenges. For these tools, effectiveness andintuitiveness are both key design priorities, and a number of alternativevisual analysis approaches have been proposed. This includes methodsfor the detection of anomalous user behaviors from sequence data [4].Chae et al. [9] applied traditional control chart methods together withseasonal trend decomposition to extract outliers. Thom et al. [43] in-troduced a visual analysis system to monitor for anomalous bursts ofkeywords. More recently, FluxFlow [48] was developed to reveal andanalyze anomalous information processes in social media.
Although systems mentioned above are often designed to help detectanomalous points, few approaches focus on identifying anomaloussequences or on the comparison between the detected outliers and “nor-mal” sequences. To enhance the interpretability of the analyzed results,our system supports one-to-many sequence comparison at multiplegranularities. We also design comparison glyphs to help with discoveryand support rich interactions to facilitate result interpretation.
2.3 Visual ComparisonVisual comparison is a common task when investigating data similar-ities and differences [29]. In the information visualization domain,Gleicher et al. [20] classify visual comparison techniques into threecategories: juxtaposition by comparing objects side-by-side, superpo-sition by overlaying data with a shared reference in the same space(e.g., [44]), and explicit encoding by directly computing and presenting
2

the differences or correlations (e.g., [21]). Each approach has its advan-tage, and multiple methods can be employed in combination to make acomparison. Within the three major categories, a variety of alternativeshave been developed for specific tasks. For example, Kehrer et al. [30]proposed a formal model for hierarchically-partitioned category com-parison with small-multiple displays. This approach was inspired bythe ineffectiveness of juxtaposition when dealing with a large numberof categories. Their work supports superposition and explicit encodingof differences for semantically meaningful comparisons.
Visual comparisons have also been studied in the context of eventsequence analysis. MatrixWave [49] applied superposition with anexplicit encoding of sequence differences when comparing two eventsequences. EventAction [14] used a calendar view to show severaltemporal event sequences and placed them in a ranked list to comparedifferent sequences via juxtaposition. Most of the previous work fo-cuses on the visual comparison of single sequences (one-to-one), orof event sequence groups (many-to-many). However, for anomaly de-tection, the one-to-many comparison is crucial. In ET3, we provide aninteractive comparison between the anomalous sequence and normalprogressions (one-to-many) at three levels of granularity.
3 SYSTEM OVERVIEW
Our system is designed to support interactive exploration and interpre-tation of anomalies in event sequence data. The designs were iterativelyimproved over four months through regular discussions with a domainexpert in the anomaly detection field. We identified the following de-sign requirements (R1-R4) for detecting anomalies in event sequences.These requirements were distilled from (1) feedback from the domainexpert, (2) the authors’ experiences with event sequence analysis, and(3) a thorough review on existing techniques and their limitations.
R1 Remove noise from the data and extract key features foranomaly detection. Real-world event sequence datasets often in-clude a large amount of noise as reflected by highly heterogeneousevent types and uncertain event ordering. The system should beable to filter out unimportant variation to allow for higher qualitysubsequent analysis.
R2 Detect anomalous instances within unlabeled datasets. Real-world event sequence datasets are often large and rare containlabels. It can be enormously time-consuming to manually findand label rarely occurring anomalous instances. Users, therefore,often wish to focus their inspection on detected outliers ratherthan conduct a comprehensive search of the entire dataset. Thus,the system should incorporate an unsupervised anomaly detectionmechanism that can narrow the scope of analysis.
R3 Localize anomalous events within abnormal sequences. Theinterpretation of the detected anomalous sequences relies on theanalysis of low-level events. For example, in medical healthrecord analysis, the clinical path of a patient may be detectedas an anomaly due to a misused medicine. However, real-worldevent sequences can be long in length and heterogeneous in types,which makes it difficult to identify anomalous events. Therefore,the system should be able to highlight anomalous events withinthe abnormal sequence to facilitate reasoning and interpretation.
R4 Analyze anomalous sequences within the context of normalprogressions. Instead of focusing on a single anomalous event,analyzing anomalies within the context of normal progressionscan provide insights for interpretation. For example, a medicalexpert may inspect how well treatment plans are followed undernormal circumstances to understand how an anomalous treatmentevent deviates from the typical population. Moreover, compar-ing normal and abnormal sequences can help reveal higher-levelanomalous patterns (e.g., anomalous sub-sequences, anomalousevent ordering) beyond low-level anomalous events. Thus, thesystem should allow users to view anomalous sequences withinthe context of normal progressions to help interpret the anomalies.
R5 Support interactive sequence analysis and exploration at dif-ferent levels of granularity. Sequences of events may vary sig-nificantly in both events observed and the speed of progression.
Fig. 2. The ET3 system integrates three major modules to supportinteractive visual anomaly detection of event sequence data, including apreprocessing module, an analysis module and a visualization module.
Different levels of sequence aggregation may yield different in-sights during the comparison. The system should, therefore,provide users with an interactive environment to enable flexiblecomparisons under various levels of aggregation, from detailedlow-level events to aggregated high-level progressions.
Motivated by these requirements, we developed ET3, an interactivevisualization system for detecting and visualizing anomalies in tem-poral event sequences. As illustrated in Fig. 2, the system includesthree major modules: (1) a data preprocessing module, (2) an anomalydetection module, and (3) a visualization module.
The data preprocessing module focuses on reducing noise to preparehigh-quality event sequence data for subsequent training of the anomalydetection model (R1). In particular, we measure the importance of eachevent using Term Frequency-Inverse Document Frequency (TF-IDF)scores to remove noisy events and exclude extremely short sequences(i.e., sequence length < 2) [23]. In the analysis module, we identifyanomalous sequences (R2) and uncover event occurrence probabili-ties of normal progressions from a trained Variational AutoEncoders(VAE) model with the Long Short Term Memory networks (LSTMs).We further localize anomalous events within the detected outliers byreferring to the occurrence probabilities of each event in normal pro-gressions (R3). The analysis results are then sent to the visualizationmodule for interactive visual analysis of the anomalous sequences viamulti-granular sequence exploration and data comparison (R4, R5).
4 VAE-BASED ANOMALY DETECTION
In this section, we formalize the analytical tasks of event sequenceanomaly detection and introduce the unsupervised VAE-based anomalydetection model we propose to solve this problem.
4.1 Algorithm OverviewDetecting anomalies in event sequences is analytically challenging forthree reasons. First, the sequential and temporal nature of event se-quences results in complex anomaly structures, which makes it difficultto determine the abnormality of the entire corresponding sequences.Second, event sequence datasets are typically diverse with differentlengths and progression patterns, resulting in high variability withinthe training data. Third, given the characteristics above, it is difficult tocharacterize abnormalities for interpretation, which makes it difficultto understand the reasons for the model’s decisions.
To address these challenges, we adapted a Sequence-to-SequenceVariational AutoEncoder (VAE) to interpretably detect anomalies inevent sequences. In particular, we leverage the merits of deep neuralnetworks in learning complex sequential patterns to address the firstchallenge and the probabilistic foundation of VAE in capturing datavariability to solve the second. Finally, we employ the reconstructionprobabilities output from the VAE to facilitate the interpretation of theanomalous sequences. As shown in Fig. 3, the algorithm consists ofthree major steps: (1) latent feature extraction using an LSTM-basedVAE, (2) anomalous sequence detection, and (3) anomalous eventanalysis. In the first step, we train the VAE-based model to extractlow-dimensional feature representations (i.e. the latent vector zzz) tocharacterize the progression of each input sequence. The second stepemploys the latent vectors to measure the outlierness for each sequencebased on their Local Outlier Factor (LOF), which is then to used to
3
identify anomalous sequences (R2). In the third step, the latent vectorsare fed to the decoder of the VAE model for sequence reconstructionand event anomaly detection (R3).
4.2 LSTM-Based Variational AutoEncoderWe first introduce the structure of the Sequence-to-Sequence VAEmodel. The model contains two modules: the VAE encoder and theVAE decoder. Both modules are designed using Recurrent Neural Net-works to better extract sequential patterns from event sequence data. Inparticular, the encoder captures the latent distribution of sequences andthe decoder inversely restores the distribution to estimate the occurrenceprobabilities of events in each time slot.
VAE Encoder. The encoder is trained to abstract the input sequence{X = xxxi}n
i=1 into a low-dimensional latent feature vector that describesa sequential distribution of events occurring in the sequence. In thisinput, n is the length of the sequence and xxxi ∈ {0,1}|E| is the multi-hotencoding of the events occurring in the i-th time step. Each coordinaterepresents an event type, which is marked 1 if the corresponding eventoccurs in the i-th time step, or 0 otherwise. After feeding the multi-hotvectors into the corresponding layer of RNN, the state of the entiresequence is extracted and represented in the hidden state vector hhhenc ofthe last layer, which is denoted as follows:
hhhenc = encoder(X) (1)
The hidden state vector hhhenc is projected into two vectors µµµ and δδδ toparameterize a normal distribution, representing the mean value andstandard deviation of the normal distribution respectively. To take thevariability of the latent space into account (i.e., to represent the diversitypresent in normal cases), we draw a low-dimensional latent vector zzz byrandomly sampling from the distribution. We then use this vector as arepresentative of the original distribution for subsequent decoding.
VAE Decoder. In the decoder, we reconstruct the input sequencefrom the extracted latent feature vector zzz. Specifically, zzz is fed to eachlayer of the RNN to estimate the probability distribution of events foreach time slot. We formally define the decoding procedure as follows:
X′= decoder(z) (2)
where X′
is a sequence of probability distributions denoted as X′=
{xxx′i}ni=1, and the element x
′i, j in xxx
′i ∈ R|E| represents the occurrence
probability of j-th event at the i-th time step.Training Process. We train the model with a goal of narrowing the
gap between the original input sequence and its reconstruction, whichcan be formally defined as minimizing the following loss function:
L = Lr +wkl ·Lkl (3)
Lr =−1n
n
∑i=1
|E|
∑j=1
(we j xi, jlog(x′i, j)+(1− xi, j)log(1− x
′i, j)) (4)
Lkl =−1
Mz
Mz
∑i=1
(1+ log(σ2i )−µ
2i −σ
2i ) (5)
The first term Lr is the reconstruction loss which calculates theweighted cross entropy between xi, j and x
′i, j, indicating an event-level
difference between the reconstruction and the original input with respectto the j-th event at the i-th time step. In particular, a parameter we j =1/log(n j) is introduced to reduce the marginal importance of high-frequency events so as to address the issue of skewed dataset, where n jis the number of occurrences for event e j. The second term Lkl is theKullback-Leibler Divergence Loss which estimates a distribution-leveldifference between the distribution of the latent vector zzz and a normaldistribution N(0,1), where Mz is the dimension of the latent vector zzz.These two terms are balanced with a parameter wkl .
Parameter Settings. Both the encoder and decoder employ LSTMunits [25] with 300 hidden nodes. We set the dimension of the latentvector to 16. The parameter wkl adaptively increases from 0.1 to 0.5during the training process to make sure the reconstruction loss is
optimized with high priority. Moreover, we optimize the loss functionwith the Adam optimizer [31] with training data batch size of 80 foreach training step. We train the model on an Nvidia Tesla K80 graphicscard. Each training epoch takes approximately 10.5 seconds on average.
4.3 Anomalous Sequence DetectionAfter training the model, we employ the latent vector zzz of each inputsequence to detect anomalous sequences in the dataset (R2). Specifi-cally, we adapt the Local Outlier Factor (LOF) to evaluate the degreeof anomaly for each sequence in the latent space. We formally definethe anomaly degree as follows:
LOF(z) =∑y∈Nk(z) Dk(y)
|Nk(z)|Dk(z)(6)
Dk(z) =|Nk(z)|
∑y∈Nk(z)(max(dk(y),d(z,y)))(7)
where Nk(z) is a set of the k-nearest neighbors of zzz, Dk(z) is the neigh-borhood density of the vector in the latent space, d(z,y) is the Euclideandistance between z and y, and dk(y) is the maximum distance betweeny and its neighbors.
In the unsupervised anomaly detection process, it is assumed that themajority of the sequences in the dataset are normal. As the LOF scorecompares the local density of the latent vector with its neighborhoodvectors, normal sequences should group within a dense space withsmaller LOF scores, while instances in sparse areas will have largerLOF scores and will be identified as outliers.
4.4 Anomalous Event AnalysisTo facilitate the interpretation of sequence anomalies, we further iden-tify anomalous events that contribute to sequence abnormality by ana-lyzing the reconstruction probabilities (R3). As mentioned earlier, thereconstruction probabilities are restored from the latent vector zzz that issampled from the latent sequence distribution. As we assumed that themajority of the sequences are normal, the reconstruction probabilitiesshall be similar to the normal progression of sequences. Moreover, thetraining objective ensures that the reconstruction probabilities are alsosimilar to the original input sequence. Combining these two points, thereconstruction probabilities of the anomalous sequences can be used toinfer an expected “normal” progression for the anomalous sequence.From this, we can identify the anomaly events within the anomaloussequence that deviate from the expected normal progression.
We categorize the anomalous events into two types: missing eventsand redundant events. Defined intuitively, missing events (noted as xmis)represent the cases where an event shows a high occurrence probabilityin the reconstruction but does not appear in the sequence. Conversely,redundant events (noted as xred) indicate events that exist in the anoma-lous sequence but are not expected to occur. Based on this intuition,we calculate an anomaly score for each event to assess its level ofabnormality. The anomaly scores for missing events and redundantevents are Pr(X = xmis) and 1−Pr((X = xred)), respectively, wherePr(X = x) indicates the occurrence probability of the correspondingevent derived from the reconstruction. Consequently, events with ananomaly level higher than a user-defined threshold are identified asanomalous. The threshold is by default set as 0.6, which can be adjustedby users during an analysis via the visualization module.
5 VISUALIZATION
This section presents the visualization and interaction designs for theET3 system. We first introduce a set of tasks that guide the designchoices of our system. We then describe ET3’s key design elements.
5.1 Design Tasks
The ET3 design was iteratively refined through a four-month develop-ment cycle based on feedback collected from regular meetings with ourdomain expert in the field of anomaly detection. In response to thatfeedback, we formulated a set of design tasks to solve the key chal-lenges in visually analyzing anomalies in event sequence data and alsoto further meet the design requirements (R3-R5) discussed in Section 3.
4

Fig. 3. Schematic diagrams of the model, (1) the VAE model to obtainthe latent vector of the input sequence, (2) anomaly detection of theoverall sequence, and (3) anomalous event detection based on thereconstruction of the input sequence.
T1 Provide an overview of the analysis scope. The analyzed eventsequence dataset may contain many anomalous event sequenceswith different levels of abnormality. To help users find anomaloussequences of interest for subsequent analysis, the system shouldprovide an overview of all sequences detected as anomalies in thedataset and illustrate their level of abnormality.
T2 Emphasize anomalous events within the sequence. To helpquickly explore complex event sequences and uncover the reasonbehind an abnormality, the visualization should be designed tohighlight key events that are suspicious of being anomalous.
T3 Facilitate result interpretation in context. Interpretinganomaly detection models is critical for establishing users’ trustin the analysis result. It is also challenging because the behaviorof deep neural networks is difficult to explain. The designedvisualization should help users effectively analyze the detectedanomalies within the context of the entire training set, to uncoverthe difference between abnormal and normal sequence progres-sions and facilitate reasoning about the analyzed result.
T4 Support sequence exploration at multiple levels of granular-ity. Applying different levels of aggregation for a group of se-quences can result in distinct interpretations of the result. Forexample, the anomalous events detected by comparing an anoma-lous sequence with an individual normal sequence may be differ-ent from the result when comparing with a subgroup. To supportmore accurate findings, the system should support the explorationof normal sequences at different levels of granularity.
T5 Easy access to raw data and auxiliary context. While aggre-gating event sequences and extracting high-level patterns areessential for easy exploration, access to raw data is also importantin raising users’ confidence in assessments of data anomalies.Thus, the system should enable users to easily access low-leveldetails on demand.
T6 Incorporate human judgement in the analysis loop. Anomalydetection is prone to error due to its subjective nature. The defini-tion of the anomaly may also vary in different applications. Thesystem should provide rich interactions to help users refine theanalysis results according to their domain knowledge.
5.2 User InterfaceGuided by the tasks above, ET3 incorporates seven key views to visuallyanalyze the anomalous sequences (Fig. 4). A user starts with theanomaly overview (Fig. 4(1)), which provides an MDS projection ofthe latent vectors for all anomalous sequences in the dataset and allowsusers to select an anomalous sequence for subsequent analysis (T1).The similarity view (Fig. 4(2)) displays the distribution of all normalsequences, and their similarities to both the mean sequence and selectedanomalous sequence (T1). From this view, users can select a group ofrecords for review in the main panel.
The main panel supports visual anomaly detection via compari-son and is composed of two major parts. First, a reconstruction view(Fig. 4(3)) shows the occurrence probabilities of the events in each timeslot. Second, two coordinated views (Fig. 4(4-5)) support comparisonof a selected anomaly with normal progressions in different modes.
Specifically, the flow overview (Fig. 4(4)) aggregates the flow of normalsequences into a Sankey-like format with the evolution of the selectedanomaly overlaid at the top to show differences. The comparison view(Fig. 4(5)) separates the flow of the anomalous sequence from the nor-mal sequences with comparison glyphs (Fig. 4(a)). These glyphs aredesigned to facilitate visual comparison and highlight suspicious events.The normal sequences are visualized with three different variants tosupport analysis at various levels (T4). The three variants—sequencecomparison view(Fig. 4(5a)), flow comparison view(Fig. 4(5b)), andsummarization view(Fig. 4(5c))—display individual sequences, pro-gression patterns, and event distributions, respectively.
Access to raw sequence data is provided via two panels (T5). Detailsabout the selected anomaly are displayed in the anomalous record view(Fig. 4(6)) while data for similar normal sequences are displayed in thesimilar record list (Fig. 4(7)).
Usage scenario. To understand how these different views worktogether to identify and interpret event sequence anomalies, let usconsider a use case of a drug regulator, Jim, who is responsible for ana-lyzing the medication records for 5,000 patients to investigate misuse ofprescription drugs. Taking the records of all patients as the training set,the model outputs 50 patients who exhibit anomalous medication usage.Jim needs to further exploration to determine the true misuses. He firstselects a sequence with high LOF score from the overview. In response,the mean sequence of the selected anomaly is displayed in the meansequence view. Jim switches to the statistics view and selects a group ofnormal sequences that are most similar to the mean sequence. The flowoverview presents the evolution pathways for all the selected sequences,from which Jim notices that most patients following a common treat-ment plan. However, the flow of the anomalous patient contains anumber of medicines that deviate from the common pattern. Jim splitsthe flow of the anomalous sequence from the normal sequences for aclearer illustration of their differences. He explores the progression ofnormal patients to select different subgroups for comparison and checksthe comparison glyphs to find unexpected medications identified by thesystem. Jim notices medicine A is highlighted in several comparisonglyphs. However, Jim also knows that A should not be taken simul-taneously with medicine B. Jim selects a subgroup of patients takingmedicine B for further comparison, and realizes none of the normalpatients took medicine A. The sequence view and summarization viewfurther confirm his finding.
5.3 Interactive Anomalous Event AnalysisTo help interpret a selected anomaly in the context of the progressionof normal sequences (T3), our system is designed to support interactiveone-to-many visual comparison. The comparison view in Fig. 4(b) isvertically divided into three regions: an anomalous sequence at the top,a group of comparison glyphs in the middle, and a summarization ofnormal sequences at the bottom.
5.3.1 Anomalous SequenceThe selected anomalous sequence is displayed using a line of rectan-gular nodes ordered by time of occurrence. To deal with the issue ofevent co-occurrence and avoid event overlap, we display the sequencewith a visual technique introduced in [27]. Specifically, concurrentevents are grouped into treemaps at each time slot, and all event nodesare color-coded according to the type of anomaly. To make full use ofthe horizontal space, event nodes are spaced with equal distance andconnected with duration bars to reveal the span of time. The time spanbetween events is proportional to the duration bar.
5.3.2 One-to-Many Sequence ComparisonOur system incorporates a one-to-many sequence comparison mech-anism, which allows users to validate the anomalies detected by themodel by comparing the anomalous sequence with a collection of simi-lar sequences from the normal group. This aims to help users establishconfidence in the analysis result based on evidence in the dataset.
The comparative analysis consists of two steps: sequence alignmentand support rate calculation. In the first step, we employ a sequencealignment technique introduced in [22] to semantically map each nor-mal sequence to the focal anomaly based on Dynamic Time Warping
5

Fig. 4. The user interface of ET3 consists of seven key views to support comparison-based visual anomaly detection, which includes a (1) anomalyoverview, a (2) similarity view, a (3) reconstruction view, a (4) flow overview, a (5) comparison view with three variants (5a-5c), an (6) anomalousrecord view and a (7) similar record list. The comparison glyphs (a) are designed to intuitively highlight anomalous events in the sequences so as tofacilitate visual comparison.
(DTW) [34]. The intention is to address the issues of variable sequencelength and progression rate, so as to support a more precise comparisonof events. After sequence alignment, we compare events occurring ineach time slot to calculate a support rate for each anomalous eventidentified in Sec. 4.4. Intuitively, the support rate represents the propor-tion of normal sequences that “support” the corresponding event to beabnormal. More specifically, the support rate of a missing event xmis
is the proportions of sequences that include xmis in the correspondingtime slot, while the support rate for xred is the contrary.
5.3.3 Comparison GlyphTo facilitate visual comparison, we design a comparison glyph(Fig. 4(a)) that highlights the anomalous events in each time slot. Weencode four critical variables to help quickly identify problematic timeslots and events that need further inspection: the overall abnormalityof the time slot, the abnormality of each event, the type of anomaly,and the support rate for each anomalous event. Specifically, each circleinside the glyph represents an anomalous event. The size of each inter-nal circle(Fig. 4(a1)) indicates the anomaly score of the correspondingevent derived from Sec. 4.4, and the size of outer circle (Fig. 4(a2)) rep-resents the overall abnormality at the corresponding time slot. The typeof abnormality (e.g., missing event or redundant event) is distinguishedwith different colors, consistent with other views. The support rate ofeach anomalous event (Sec. 5.3.2) is encoded with color saturation.
Updating with user feedback. To leverage analyst domain knowl-edge, the system allows users to interactively tweak the anomalousevents displayed in the comparison glyphs. As shown in Fig. 4(b),users can tune the thresholds for the anomaly score and support ratethat determine the conditions at which an event is identified as anoma-lous. Moreover, when users select a subgroup of normal sequencesduring the analysis, the comparison glyphs will also be updated simul-taneously to reflect the support rate within the subgroup (Fig. 1(1)).
5.3.4 Multi-granular Sequence AggregationTo support more comprehensive one-to-many sequence comparisons,the design provides three coordinated comparison views (Fig. 4(5a-c)).The views support comparison at different levels of aggregation (T4),and transitions allow users to move smoothly from one view to another.
Sequence Comparison View. The sequence comparison view dis-plays the sequences of normal records individually, which aims tosupport sequence-to-sequence level comparison and efficient access tothe raw data. For example, to avoid introducing noisy events, a doctormay be interested in comparing the anomaly only with the most similar“normal” patients. As shown in Fig. 4(5a), the normal sequences are
displayed in a scrollable list, ranked from top to bottom accordingto the degree of similarity. As described in Sec. 5.3.2, each normalsequence is temporally warped and aligned to the anomalous sequencefor comparison. We then apply this alignment to each normal sequenceto map events into corresponding time slots. To allow an intuitivesequence-to-sequence comparison, the encoding schema of each indi-vidual sequence is kept consistent with the anomalous sequence. Userscan select any individual sequence to update the comparison glyphswith their differences during the analysis.
Flow Comparison View. The flow comparison view (Fig. 4(5b))provides a progression-level summarization on all normal sequencesby aggregating them into a flow-based visualization. This view aims toincorporate confidence of abnormality for anomalous events by com-paring the anomalous sequence with subgroups of sequences havingparticular progression patterns. Specifically, identical events in eachtime slot are grouped into nodes, and the transition paths among eventsin adjacent time slots are merged into links. Note that when multipleevents co-occur at the same time slot, an individual will be equallydivided by the number of event types to ensure the total populationremains consistent throughout the sequence progression. The height ofeach node represents the population (weighted by event co-occurrence)having the event at the corresponding time slot, with the exact numberdisplayed in a label to the left side of each node. Event nodes are con-nected with links to represent a sequence path from one event to another.To incorporate time information into the flow diagram, we employ aspecially designed link introduced in [27]. Specifically, each link isconsist of two key components: a duration bar and a connection line.The height of the duration bar shows the proportion of the populationcorresponding to the link, while the width indicates the average timegap between events. The connection line links the end of the durationbar to the destined event and reveals patterns of sequence progression.
Summarization View. In the summarization view (Fig. 4(5c)),nodes in each time slot are further aggregated into a more compact form,illustrating the highest-level summarization of the distribution of events.This view aims to support a comparison of the anomalous sequenceagainst the overall progression of the entire set of similar records. Tofacilitate the comparison, we encode the summarized sequences in away similar to the anomalous sequence, with the only difference thatthe size of each inner rectangle represents the size of the population.
5.4 Other Views
The system also includes a number of contextual views to displayauxiliary information and provide access to raw data (T5). These viewsare coordinated with the selections and filters made in other views to
6

support the interpretation of anomalies.Anomaly Overview. The anomaly overview (Fig. 4(1)) is designed
to help analysts choose sequences of high anomaly degree for subse-quent analysis. It shows the distribution of all anomalous sequencesbased on multidimensional scaling (MDS) projection of the latent vec-tor z. Each anomalous sequence is represented as a circle with thesize indicating the LOF score, and the color saturation indicating thesequence length. The distance between two circles reflects their simi-larity, and we further incorporate a colored contour map to illustratethe local density of circles. Intuitively, circles with larger size and inlow-density areas are the most likely anomalies.
Similarity Distribution View. The similarity distribution view(Fig. 4(2)) displays the distribution of all normal sequences in thedataset based on their similarity to the progression of the selectedanomaly. This view aims to help users select a proper group of nor-mal sequences to support comparative analysis. We measure sequencesimilarity in two ways: their distance to the mean sequence, and theirdistance to the selected anomaly. The distances are calculated by align-ing each normal sequences to the mean sequence and the anomaloussequence, respectively. Intuitively, sequences similar to the mean se-quence would include the events with high occurrence probability ateach time slot, though not necessarily with the same progression. Se-quences similar to the anomalous sequence, meanwhile, tend to haveevents and progression patterns that exactly match the anomalous se-quence. The system allows users to switch between the two types ofmeasurement according to their preference.
Reconstruction View. The reconstruction probabilities (given byEquation 2) of the selected anomaly are shown in the reconstructionview (Fig. 4(3)) with the intent of providing an overview of the occur-rence probabilities of events for each time slot. The reconstructionprobabilities are shown as a line of circle packings arranged in time or-der. The size of each circle shows the value of probability, and the colorindicates different anomaly types (with colors consistent with otherviews). Circles close to the center generally have larger occurrenceprobability compared to those towards the border, providing users withan overview on the probability distribution of the anomalous events.
Flow Overview. The flow overview presents progression-level dif-ferences between normal sequences and the abnormal sequence usinga flow-based visualization. As shown in Fig. 4(4), the flow of normalsequences are colored in light grey as background, with the flow of theabnormal sequence overlaid on the top. This view serves as a quickoverview at the beginning of sequence comparison to illustrate how theprogression of the anomalous record deviates from the normal group.
Anomalous Record View and Similar Record List. The anoma-lous record view (Fig. 4(6)) and the similar record list (Fig. 4(7))provide access to raw event sequence data for the anomalous sequenceand similar sequences, respectively. These low-level details providedetailed evidence to support interpretation (T4).
5.5 Interactions
The ET3 system includes several user interactions (T6) to supportexploratory analysis.
Stage Merging. We leverage a recently proposed progression anal-ysis technique [22] to segment the anomalous sequence into differentstages. As illustrated in Fig. 4(c), stages are marked with line segmentsunder the identifier of the time slots. Users can click on a stage identifierto merge or expand all visual elements in the main panel that align tothe corresponding time slots. This interaction aims to reduce the lengthof sequences for a more efficient exploration while also providing ahigh-level summarization of an anomaly’s progression stages.
Selecting and Filtering. Our system allows users to navigate thevisualization and make more focused inspection through flexible dataselection and filtering. For example, the system allows users to makeselections of both individual sequences of interest or subgroups ofsequences following particular progression patterns in the sequencecomparison and flow comparison views, respectively. After a selection,the system reruns the comparison between the anomalous sequence andthe selected normal sequences to update the comparison glyphs basedon the analysis result.
Fig. 5. Performance evaluation results of our VAE-based algorithm (VA)in comparison with two baseline methods (kNN, HMM). The (a) ROCcurves and (b) precision-recall curves indicate that our approach (VA)effectively detects anomalies and outperforms the baseline methods.
The system incorporates three types of filters for users to tune thevisualization result. This includes a probability filter and a support ratefilter for supporting dynamic adjustment of the detection boundaries(as introduced in Sec. 5.3.3). In addition, a node filter allows controltune the flow overview and the flow comparison view. To prevent eventanomalies in small populations from being filtered out, nodes in theflow diagram that are identified as abnormal are preserved regardless ofthe current filter threshold. Moreover, the system allows users to brushthe reconstruction view to zoom in to a specific range of time slots tonarrow the analysis scope (Fig. 4(e)).
Highlights and Tooltips. The system is equipped with linked-highlighting, which helps users to track the occurrence of event typesacross different views. Specifically, when users hover their mouse overan event, all visual elements representing the same event type will be si-multaneously highlighted in all views. Moreover, when users select anindividual sequence in the sequence comparison view, or a progressionpath in the flow comparison view or flow overview, all correspondingvisual elements will be highlighted to mark the users’ selection. Finally,descriptive tooltips (Fig. 4(f)) are triggered when hovering over anyvisual elements throughout the system.
Details-on-Demand. The system also supports a details-on-demandmodel of exploration. Apart from providing informative tooltips duringthe analysis, the low-level details displayed in the similar record listand the sequence comparison view are updated in response to changesin the users’ selection in other views.
6 EVALUATION
The ET3 system provides a unique solution for detecting anomaloussequences within general event sequence datasets. The visualization isdesigned to support the interpretation of detected anomalies with visualcomparisons. We assess the effectiveness of ET3’s analytical modeland visualization design through a quantitative evaluation, three casestudies, and qualitative feedback from domain experts.
6.1 Quantitative EvaluationWe compare the performance of our VAE-based anomaly detectionalgorithm (denoted as VA) with two baseline methods using an intrusiondetection dataset, snd-cert [19]. The dataset consists of sequences ofoperating system calls that are labeled in terms of the system state (i.e.,normal or hacked) when running these operations.
Baseline Methods and Evaluation Metrics. We select two rep-resentative baseline methods under the categories of kernel-basedand Markovian anomaly detection techniques: Nearest Neighbor(kNN) [32] and Hidden Markov Model (HMM) [45]. Both methodshave been shown efficient for detecting anomalies in event sequencedata in previous research [7,39,47]. More specifically, the longest com-mon subsequence (LCS) was used as the distance metric in kNN. Weuse standard information retrieval metrics (precision, recall, and ROC)to evaluate the performance of our approach and these two baselinemethods. Because the number of positive and negative instances areimbalanced in the dataset, we use the precision-recall curves and ROCcurves to comprehensively illustrate the performance of the algorithms.
Evaluation Results. Our algorithm outperforms the baseline meth-ods as shown in Fig 5. The ROC plot (Fig 5(a)) illustrates that VAachieves higher true positive rates when the false positive rates remain
7

low (below 0.25) compared to the other two baseline methods. Theprecision-recall plot (Fig 5(b)) shows that VA had overall higher preci-sion than the baseline methods. The results indicate that our approachcan produce a higher quality set of suspicious sequences when com-pared to the baseline algorithms. Using the designed visualization, thesystem can further support the interpretation of detected anomalies.
6.2 Case StudiesIn this section, we report the results of three real-world cases to demon-strate the capabilities of ET3 in finding interpretable anomalies ingeneral event sequence datasets.
6.2.1 Misuse of Prescription Drugs
We applied ET3 to MIMIC [28], a publicly accessible critical caredatabase with de-identified electronic health records for 46,520 patientswith 12,487 event types in total. Due to the diversity of sequence pro-gression for patients with different diseases, training with the entiredatabase could introduce noise and produce inaccurate anomaly re-sults. With this consideration, we selected a subgroup of 7,537 patientswho were diagnosed with cardiovascular diseases to produce a morehomogeneous set of sequence progressions for the training set.
Four cardiologists (E1–E4, 5–8 years of domain experience each)were invited to participate in our study. Prior to the study, the doctorswere asked about expected patterns of anomaly and they expressedinterests in exploring anomalous medical usage within the follow-uplab test results, based on which we extracted 87 event types under thecategory of prescriptions and lab events. The sequences were sent tothe analysis module for training the model. 404 anomalous sequenceswere detected for subsequent analysis. The study session lasted approx-imately 1 hour, starting with a 10-minute introduction to the datasetand the system design, followed by a 5-minute demonstration of anexample use case. After some practice, the doctors were asked to ex-plore the analysis results with our system, demonstrate domain-relevantinsights, and provide feedback on the system’s usability. The systemwas projected to a large screen for all experts to inspect simultaneously,and one of the experts (E1) was responsible for operating the system.The experts were asked to think out loud and make comments at anytime during the session. The entire study procedure was recorded andtheir comments are discussed in Section 6.3.
After a brief inspection of the overview, the experts chose a patientwho was far away from the main cluster with a relatively high anomalyscore (as shown in Fig. 4(1)), and then retrieved 105 similar patientswith the distance to the mean sequence under 0.2 for subsequent anal-ysis (as shown in Fig. 4(2)). After the flow overview was loaded, theexperts quickly scrolled the view back and forth to get a big pictureview of the major sequence progression paths. They found that thetreatment plans for the patients were very similar, and speculated thatall of these patients were suffering from epilepsy and diabetes as therewas regular use of Phenytoin and Insulin along the clinical paths (asshown in Fig. 6(a)). They then took a careful look at the flow of theanomalous patient, and noticed that most events were in agreementwith the major trend. However, the patient showed several exceptionalevents in the second and the third time slots (Fig. 4(g)). They decided tofocus their analysis around these time slots. By splitting the sequenceof the anomalous patient from others, the comparison glyphs uncoveredsuspicious events at each time slot. The experts briefly browsed theevents displayed in the glyphs and noticed an abnormal lab event witha 0.59 anomaly score and 100% support rate, CK-MB (Fig. 6(i)). “Thisis a critical indicator for myocardial infarction”, E1 said. The expertsalso found an event that was continuously missing in several time slotsthroughout the entire progression, Hydralazine (Fig. 4(b)). “This drugis mainly applied to patients with chronic heart failure” explained E2.“This may imply different causes of epilepsy. Both heart diseases canpotentially cause epileptic seizure.” The experts then decided to ex-plore the redundant medicines highlighted in the comparison glyphsto investigate the differences in the treatment plan. Apart from sev-eral anesthetics used for pain relief, the doctors surprisingly found nomedicines aimed directly at curing myocardial infarction. “This is un-usual,” E1 said, “It seems the patient was treated as a regular epilepticpatient.” They also found a type of medicine, Pheonobarbital(Fig. 6(ii)),
Fig. 6. The anomaly detection result of MIMIC dataset. The system iden-tified major progression paths (a-b), from which the sequence anomalydeviates in (i) an anomalous lab test result and the (ii) misuse of aprescription drug.
having an anomaly score of 0.61 and 100% support rate, used only bythe anomalous patient. “To my knowledge, Pheonobarbital is mainlyused for neonatal and childhood seizures according to guidelines,” saidE3. “It is rare to see this drug prescribed for a 69-year-old man.” E4found this finding especially useful, as he commented: “It is a potentialdrug of abuse. Long-time usage can result in physical dependence, thusshould be strictly controlled...I feel this system has great potential to beapplied to monitor drug misuse.”
6.2.2 Application Log Diagnosis
In our second case study, we applied ET3 to a public application logdata, Agavue [17]. It traces the application function calls invoked byuser interactions in a suite of visualization tools embedded in Excel.The dataset contains 2,212 user sessions with 34 unique event types.The model detected 143 anomalous sequences in total. A software de-veloper (E5) familiar with graphing in Excel was invited to participatein this study. We observed her actions and took notes on her commentsand findings. A document illustrating the meaning of each event inthe dataset was provided before the study to help the participant betterunderstand her observations during the analysis.
After loading the dataset, the participant observed the overview andselected a sequence with a high anomaly score for subsequent analy-sis. She then brushed session sequences with a distance to the meansequence under 0.2 to retrieve a group of 103 similar sequences andstarted the comparative analysis. By switching to the flow comparisonview, the system revealed anomalous events in the comparison glyphsin time steps 3–5 and 9 (Fig. 1). The participant started the explorationfrom the highlighted anomalies in time steps 3–5. She decided toneglect the redundant resize (Fig. 1(a)) event as it is a common useraction and has low support rate. She turned instead to time steps 4 and5, which both showed redundant events for toolBarToogle (Fig. 1(b)).This indicates a user action of showing or hiding the toolbar. As shehovered on the event, a path in the flow of the similar records washighlighted, suggesting another sequence also had the toolBarToogleevent at step 4 and 5 but was identified as normal. She thus decided tocompare this sequence and the anomalous sequence. The participantclicked on the toolBarToogle event in the comparison view to selectthe normal sequence having this event (Fig. 1(1)), and the comparisonglyphs alerted the participant to missing toolTip events (Fig. 1(c)). Byobserving the highlighted flow underneath, she realized that toolTipco-occurred with toolBarToogle in the normal sequence. Thus, shesurmised that a tooltip should normally appear when a user hovers theirmouse on toolbars. However, this did not show up in the sequenceof the anomalous user. She then switched to the sequence compari-son view to inspect the normal sequences individually and treemapscompounding the toolBarToogle and toolTip confirm her speculation.
The participant then focused on the missing events time steps 3–5,which were a series of error events (Fig. 1(d)). She noticed that errormessages were frequently encountered in sequences of “normal” usersbut not the anomalous user. To find reasons, she clicked on the errorevent to narrow the comparison scope. As shown in Fig. 1(2), two
8
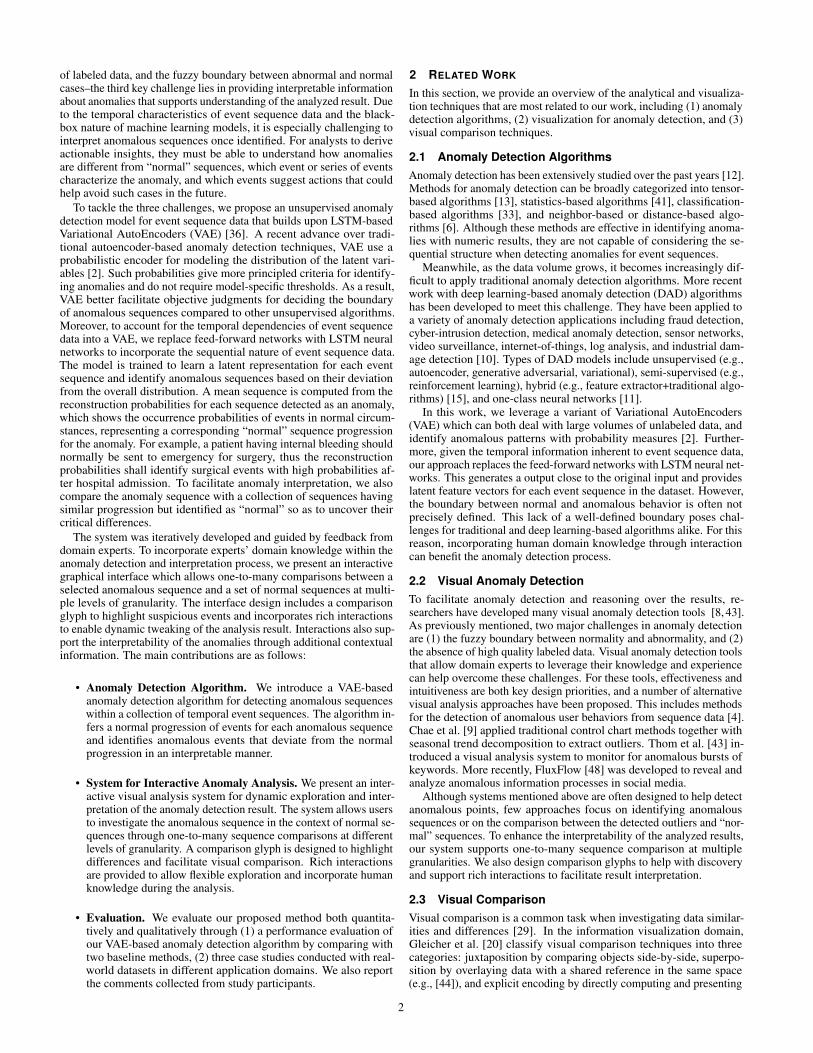
Fig. 7. Anomalies detected when analyzing the career paths of a groupof scholars. ET3 identified two anomalous patterns, which includes (a) adistinctive order of acquiring PhD degree and Assistant Professor, and(b) a slower promotion progress than usual.
missing events, btnSetData (Fig. 1(e)) and bindFromPrompt (Fig. 1(f))simultaneously appear in the first stage and the following time steps,indicating that the lack of the two events prevented the anomaloussequence from having errors. The participant looked up these events inthe documentation and found that they represent continuous applicationcalls in response to the user requesting a customized data binding bypressing the set data button. She suspected that users might haveattempted to bind data with an inappropriate format, which would leadto an unsuccessful graph. This also explained the redundant event,readBoundData, in the last time slot, indicating the anomalous usereventually bound data successfully. In general, this finding suggestedthat Agavue should provide more guidance when users try to arbitrarilybind data to visualizations.
6.2.3 Rare Career Path Detection
We also tested the capability of ET3 in identifying anomalies withina small event sequence collection using a career path dataset [1]. Thedataset contains 10 types of milestone events of 40 university professors,such as receiving degrees, publishing papers, and changing academicpositions. We trained the anomaly detection model and received twoanomalous career paths. A graduate student (E6) was invited to analyzethe anomalous sequences and provide feedback. The participant se-lected one anomaly and a group of similar scholars identified as normalto start the comparison. He first looked into the stage analysis resultsusing the reconstruction view. In combination with the flow overview,he identified the first stage from time step 0 to 5 as the degree obtain-ment period through a signature PhD event. Time steps afterward weredesignated as stage two, representing the career path after graduation.He then split the anomalous sequence from the flow. As shown inFig. 7(a), the comparison glyphs from 4–5 highlighted two redundantevents before the scholar’s career path stage began. He inspected onthe anomalous events at time step 4 and 5, which were obtaining PhDdegree and acquiring assistant professor. Surprisingly, he found theanomalous scholar experienced these two events in an unexpected orderwhich suggested the scholar became an assistant professor before ob-taining a PhD degree. In contrast, the major flow in normal sequencesgoes from the PhD to assistant professor. Moreover, no link was foundfrom assistant professor to PhD in the flow of normal sequences.
The participant then merged stage one and turned to analyze thecareer path in stage two. He showed great interest in the promotionof the assistant professor. He switched to the summarization view tocompare the promotion time of the focal scholar with the rest of thescholars. As shown in Fig. 7(b), the associate professor events wereall aligned at time step 9 and the professor event at time step 12. Theparticipant noticed that the career path of the focal scholar was not assmooth as expected, as it took longer for the scholar to get grantedassociate professorship (3,854 days compared to 2,360 days on average)and get promoted from associate professor to professor (2,051 dayscompared to 1,200 days on average).
6.3 Feedback
This section reports subjective feedback collected from post-studyinterviews. We summarize the participants’ comments around threethemes: usefulness, system usability, and visualization design.
Usefulness. All participants respond positively when asked if theanomaly detection technique in ET3 was useful for the analytical tasksin their area of expertise. The medical experts believed that ET3 helpsdetect unusual treatment plans. E1 also mentioned that “we typicallycheck if the clinical decisions are in accordance with guidelines with sta-tistical methods, which is adequate in identifying numerical anomaliessuch as overdose of antibiotics or anesthetic, however, fail to discovercomplex anomalies.” E4 added: “anomalies in medical data can bea single event or a combination of events.” He felt involving sequen-tial context in the anomaly analysis can help doctors “discover morecomplex anomalous patterns and find the reasons for the anomalies.”E2 expressed a desire for this system to support predictive analysis:“if the system can detect anomalous trends ahead, we can take actionsto put the anomalous patient back on track.” E3 found comparing theanomaly with similar patients especially useful as a way to “provideevidence for the detection results derived from the machine.” E5 feltthat “diagnose errors with context makes the result easier to understand,”and suggested that we extend the system’s capability to support analysisof streaming data for tasks such as “network behavior monitoring”.
System Usability. According to the participants’ feedback, ET3 isgenerally easy to use. All three experts (E1,5,6) that navigated thesystem expressed their appreciation for the system’s workflow and feltit “easy to follow.” E5 said: “Following the workflow, we can have theoverview first and drill down to specific anomalous events step by step.”E6 also commented on the comprehensiveness of the system: “thesystem covers information from various aspects. Each view displaysthe data from a different angle, but altogether they manage to integratenicely.” The medical expert (E1) felt that the flow comparison viewwas most informative, as “it gives a clear summarization on patients’clinical pathways.” He felt the sequence comparison view less usefulbecause the raw medical records are generally complex and hard toexplore. However, he agreed that “it could help validate findingswhen the exploration space is narrowed to a small sub-population afterselection.” E2 also commented that “..when dealing with a large groupof sequences, analyzing anomalous sequences one after another maybe time-consuming.” This suggests a future direction of supporting theanalysis of multiple anomalous sequences simultaneously.
Visualization and Interaction Design. All participants agreed thatall visualization in ET3 were easy to understand. Specifically, E3 feltthe design of the comparison glyph made sense: “It covers two criticalpoints of how anomalous the event is, and if the analysis result is con-fident.” He also suggested that “a measure can be defined to combinethese two attributes as they seem correlated”. E2 also mentioned thatthe dynamic selection of subgroups is useful, as he explained: “Theanalysis result of anomaly can be different in different sub-populations.This interaction can help us explore the reasons and the effect of anoma-lies among subgroups of patients efficiently.”
7 CONCLUSION
We have presented ET3, a visual analysis technique designed to supportvisual anomaly detection in event sequence data. ET3 incorporates anunsupervised VAE-based anomaly detection model to identify anoma-lous sequences and events in an interpretable manner. Based on theanomaly detection result, a visualization system with multiple coordi-nated views and rich interactions is provided to facilitate interpretationvia one-to-many sequence comparison. We evaluate the effectivenessand usefulness of ET3 through a quantitative comparison of the perfor-mance of our proposed algorithm, three case studies with real-worlddatasets, and domain expert interviews. The study results illustratethe strengths of ET3 and shed light on several directions for futurework. These include enabling predictive anomaly analysis, integratingan associative measurement for event abnormality that considers bothanomaly score and support rate, and supporting the analysis of multipleanomalous sequences simultaneously.
9

REFERENCES
[1] Professors dataset, 2016. Human-Computer Interaction Lab, University ofMaryland. Retrieved from https://eventevent.github.io/.
[2] J. An and S. Cho. Variational autoencoder based anomaly detection usingreconstruction probability. Special Lecture on IE, 2:1–18, 2015.
[3] D. Antonelli, G. Bruno, and S. Chiusano. Anomaly detection in medicaltreatment to discover unusual patient management. IIE Transactions onHealthcare Systems Engineering, 3(2):69–77, 2013.
[4] A. Bock, A. Pembroke, M. L. Mays, L. Rastaetter, T. Ropinski, andA. Ynnerman. Visual verification of space weather ensemble simulations.In IEEE Scientific Visualization Conference, pp. 17–24. IEEE, 2015.
[5] R. J. Bolton, D. J. Hand, et al. Unsupervised profiling methods for frauddetection. Credit Scoring and Credit Control VII, pp. 235–255, 2001.
[6] M. M. Breunig, H.-P. Kriegel, R. T. Ng, and J. Sander. Lof: Identifyingdensity-based local outliers. In ACM SIGMOD Record, vol. 29, pp. 93–104.ACM, 2000.
[7] S. Budalakoti, A. N. Srivastava, R. Akella, and E. Turkov. Anomalydetection in large sets of high-dimensional symbol sequences. 2006.
[8] N. Cao, C. Lin, Q. Zhu, Y.-R. Lin, X. Teng, and X. Wen. Voila: Visualanomaly detection and monitoring with streaming spatiotemporal data.IEEE Transactions on Visualization and Computer Graphics, 24(1):23–33,2018.
[9] J. Chae, D. Thom, H. Bosch, Y. Jang, R. Maciejewski, D. S. Ebert, andT. Ertl. Spatiotemporal social media analytics for abnormal event detectionand examination using seasonal-trend decomposition. In IEEE VisualAnalytics Science and Technology, pp. 143–152. IEEE, 2012.
[10] R. Chalapathy and S. Chawla. Deep learning for anomaly detection: Asurvey. arXiv preprint arXiv:1901.03407, 2019.
[11] R. Chalapathy, A. K. Menon, and S. Chawla. Anomaly detection usingone-class neural networks. arXiv preprint arXiv:1802.06360, 2018.
[12] V. Chandola, A. Banerjee, and V. Kumar. Anomaly detection: A survey.ACM Computing surveys, 41(3):15, 2009.
[13] H. Chen, S. Zhang, W. Chen, H. Mei, J. Zhang, A. Mercer, R. Liang,and H. Qu. Uncertainty-aware multidimensional ensemble data visualiza-tion and exploration. IEEE Transactions on Visualization and ComputerGraphics, 21(9):1072–1086, 2015.
[14] F. Du, C. Plaisant, N. Spring, and B. Shneiderman. Eventaction: Visualanalytics for temporal event sequence recommendation. Proceedings ofthe IEEE Visual Analytics Science and Technology, 2016.
[15] S. M. Erfani, S. Rajasegarar, S. Karunasekera, and C. Leckie. High-dimensional and large-scale anomaly detection using a linear one-classsvm with deep learning. Pattern Recognition, 58:121–134, 2016.
[16] H. Fanaee-T and J. Gama. Tensor-based anomaly detection: An interdisci-plinary survey. Knowledge-Based Systems, 98:130–147, 2016.
[17] D. Fisher. Agavue event data sample, 2016. Version of August 10, 2016,Microsoft Research. Retrieved from https://eventevent.github.io/.
[18] R. Fontugne, P. Borgnat, P. Abry, and K. Fukuda. Mawilab: combiningdiverse anomaly detectors for automated anomaly labeling and perfor-mance benchmarking. In Proceedings of the International Conference,p. 8. ACM, 2010.
[19] S. Forrest, S. A. Hofmeyr, A. Somayaji, and T. A. Longstaff. A senseof self for unix processes. In Proceedings of the IEEE Symposium onSecurity and Privacy, pp. 120–128. IEEE, 1996.
[20] M. Gleicher, D. Albers, R. Walker, I. Jusufi, C. D. Hansen, and J. C.Roberts. Visual comparison for information visualization. InformationVisualization, 10(4):289–309, 2011.
[21] J. Guerra-Gomez, M. L. Pack, C. Plaisant, and B. Shneiderman. Visual-izing change over time using dynamic hierarchies: Treeversity2 and thestemview. IEEE Transactions on Visualization and Computer Graphics,19(12):2566–2575, 2013.
[22] S. Guo, Z. Jin, D. Gotz, F. Du, H. Zha, and N. Cao. Visual progressionanalysis of event sequence data. IEEE Transactions on Visualization andComputer Graphics, 25(1):417–426, 2019.
[23] S. Guo, K. Xu, R. Zhao, D. Gotz, H. Zha, and N. Cao. Eventthread:Visual summarization and stage analysis of event sequence data. IEEETransactions on Visualization and Computer Graphics, 24(1):56–65, 2018.
[24] M. Hauskrecht, I. Batal, M. Valko, S. Visweswaran, G. F. Cooper, andG. Clermont. Outlier detection for patient monitoring and alerting. Journalof Biomedical Informatics, 46(1):47–55, 2013.
[25] S. Hochreiter and J. Schmidhuber. Long short-term memory. NeuralComputation, 9(8):1735–1780, 1997.
[26] T. Ide and H. Kashima. Eigenspace-based anomaly detection in computer
systems. In Proceedings of the ACM SIGKDD International Conferenceon Knowledge Discovery and Data Mining, pp. 440–449. ACM, 2004.
[27] Z. Jin, J. Yang, S. Cui, D. Gotz, J. Sun, and N. Cao. Carepre: An intelligentclinical decision assistance system. arXiv preprint arXiv:1811.02218,2018.
[28] A. E. Johnson, T. J. Pollard, L. Shen, H. L. Li-wei, M. Feng, M. Ghassemi,B. Moody, P. Szolovits, L. A. Celi, and R. G. Mark. Mimic-iii, a freelyaccessible critical care database. Scientific Data, 3:160035, 2016.
[29] J. Kehrer and H. Hauser. Visualization and visual analysis of multifacetedscientific data: A survey. IEEE Transactions on Visualization and Com-puter Graphics, 19(3):495–513, 2013.
[30] J. Kehrer, H. Piringer, W. Berger, and M. E. Groller. A model for structure-based comparison of many categories in small-multiple displays. IEEETransactions on Visualization and Computer Graphics, 19(12):2287–2296,2013.
[31] D. P. Kingma and J. Ba. Adam: A method for stochastic optimization.arXiv preprint arXiv:1412.6980, 2014.
[32] Y. Liao and V. R. Vemuri. Use of k-nearest neighbor classifier for intrusiondetection. Computers & Security, 21(5):439–448, 2002.
[33] F. T. Liu, K. M. Ting, and Z.-H. Zhou. Isolation forest. In IEEE Interna-tional Conference on Data Mining, pp. 413–422. IEEE, 2008.
[34] M. Muller. Dynamic time warping. Information Retrieval for Music andMotion, pp. 69–84, 2007.
[35] G. Munz, S. Li, and G. Carle. Traffic anomaly detection using k-meansclustering. In GI/ITG Workshop MMBnet, pp. 13–14, 2007.
[36] D. Park, Y. Hoshi, and C. C. Kemp. A multimodal anomaly detector forrobot-assisted feeding using an lstm-based variational autoencoder. IEEERobotics and Automation Letters, 3(3):1544–1551, 2018.
[37] A. Patcha and J.-M. Park. An overview of anomaly detection techniques:Existing solutions and latest technological trends. Computer Networks,51(12):3448–3470, 2007.
[38] A. Qayyum, M. Islam, and M. Jamil. Taxonomy of statistical basedanomaly detection techniques for intrusion detection. In Proceedingsof the IEEE Symposium on Emerging Technologies, pp. 270–276. IEEE,2005.
[39] Y. Qiao, X. Xin, Y. Bin, and S. Ge. Anomaly intrusion detection methodbased on hmm. Electronics Letters, 38(13):663–664, 2002.
[40] L. Ravindranath, J. Padhye, S. Agarwal, R. Mahajan, I. Obermiller, andS. Shayandeh. Appinsight: mobile app performance monitoring in thewild. In Presented as part of the 10th {USENIX} Symposium on OperatingSystems Design and Implementation ({OSDI} 12), pp. 107–120, 2012.
[41] P. J. Rousseeuw and A. M. Leroy. Robust regression and outlier detection,vol. 589. John wiley & sons, 2005.
[42] S. J. Stolfo, W. Fan, W. Lee, A. Prodromidis, and P. K. Chan. Cost-based modeling for fraud and intrusion detection: Results from the jamproject. In Proceedings DARPA Information Survivability Conference andExposition. DISCEX’00, vol. 2, pp. 130–144. IEEE, 2000.
[43] D. Thom, H. Bosch, S. Koch, M. Worner, and T. Ertl. Spatiotemporalanomaly detection through visual analysis of geolocated twitter messages.In IEEE Pacific Visualization Symposium, pp. 41–48. IEEE, 2012.
[44] Y. Tu and H.-W. Shen. Visualizing changes of hierarchical data usingtreemaps. IEEE Transactions on Visualization and Computer Graphics,13(6):1286–1293, 2007.
[45] Y. Xie and S.-Z. Yu. A large-scale hidden semi-markov model for anomalydetection on user browsing behaviors. IEEE/ACM Transactions on Net-working, 17(1):54–65, 2009.
[46] G. Xiong, J. Cheng, X. Wu, Y.-L. Chen, Y. Ou, and Y. Xu. An energymodel approach to people counting for abnormal crowd behavior detection.Neurocomputing, 83:121–135, 2012.
[47] X. Zhang, P. Fan, and Z. Zhu. A new anomaly detection method basedon hierarchical hmm. In Proceedings of the International Conference onParallel and Distributed Computing, Applications and Technologies, pp.249–252. IEEE, 2003.
[48] J. Zhao, N. Cao, Z. Wen, Y. Song, Y.-R. Lin, and C. Collins. # fluxflow:Visual analysis of anomalous information spreading on social media. IEEETransactions on Visualization and Computer Graphics, 20(12):1773–1782,2014.
[49] J. Zhao, Z. Liu, M. Dontcheva, A. Hertzmann, and A. Wilson. Matrixwave:Visual comparison of event sequence data. In Proceedings of the ACMConference on Human Factors in Computing Systems, pp. 259–268. ACM,2015.
10


![Comparison of Unsupervised Anomaly Detection Techniques · a RapidMiner [10] Extension Anomaly Detection was developed that contains several unsupervised anomaly detection techniques.](https://static.fdocuments.us/doc/165x107/5b014b8c7f8b9a952f8e25e8/comparison-of-unsupervised-anomaly-detection-rapidminer-10-extension-anomaly-detection.jpg)